glenwood preserve monitoring report - the Elkhorn Slough Coastal ...
glenwood preserve monitoring report - the Elkhorn Slough Coastal ...
glenwood preserve monitoring report - the Elkhorn Slough Coastal ...
- No tags were found...

You also want an ePaper? Increase the reach of your titles
YUMPU automatically turns print PDFs into web optimized ePapers that Google loves.
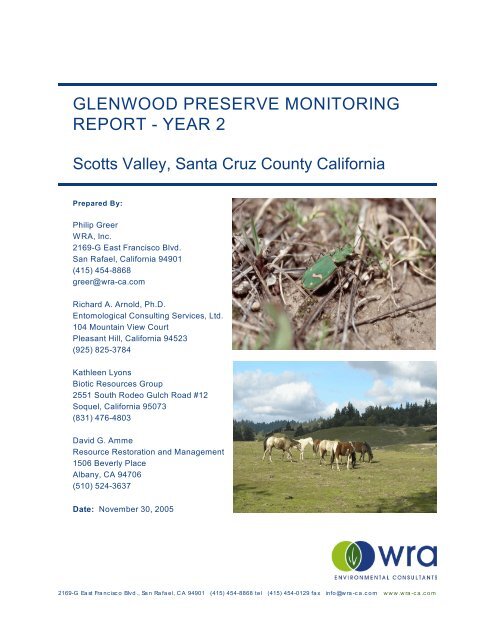
GLENWOOD PRESERVE MONITORINGREPORT - YEAR 2Scotts Valley, Santa Cruz County CaliforniaPrepared By:Philip GreerWRA, Inc.2169-G East Francisco Blvd.San Rafael, California 94901(415) 454-8868greer@wra-ca.comRichard A. Arnold, Ph.D.Entomological Consulting Services, Ltd.104 Mountain View CourtPleasant Hill, California 94523(925) 825-3784Kathleen LyonsBiotic Resources Group2551 South Rodeo Gulch Road #12Soquel, California 95073(831) 476-4803David G. AmmeResource Restoration and Management1506 Beverly PlaceAlbany, CA 94706(510) 524-3637Date: November 30, 20052169-G Ea st Fra nc isc o Blvd ., Sa n Ra fa e l, C A 94901 (415) 454-8868 te l (415) 454-0129 fa x info @w ra -c a .c o m www.wra-ca.com
EXECUTIVE SUMMARYThis Year 2 Annual Monitoring Report describes <strong>the</strong> management and <strong>monitoring</strong>activities conducted on <strong>the</strong> Glenwood Preserve (“Preserve”). Monitoring is conductedaccording to <strong>the</strong> guidelines set forth in <strong>the</strong> final Open Space Management Plan(“OSMP”) for <strong>the</strong> Preserve (WRA 2003).Monitoring of <strong>the</strong> federally endangered Ohlone tiger beetle (Cicindela ohlone, OTB)occurred on <strong>the</strong> Preserve between January and October of 2005. A total of 79 adultobservations occurred throughout 2005, compared to 239 during 2003. During <strong>the</strong> July2005 <strong>monitoring</strong> of larval burrows, 167 active larvae were inventoried in <strong>the</strong> GlenwoodPreserve. A total of 347 active larval burrows were observed during <strong>the</strong> June 2004 visitand 556 in 2003. The observed decline in <strong>the</strong> number of larval burrows and occupiedarea between 2003 and 2005 may be due to insufficient grazing in <strong>the</strong> OTB habitat.Extraordinarily high rainfalls in <strong>the</strong> winter and spring of 2004-2005 also likely contributedto larval beetle mortality due to excess soil saturation. This above-average rainfall alsoallowed <strong>the</strong> growth of significantly more vegetation which reduces <strong>the</strong> amount of suitableadult beetle habitat. Since suitable soil conditions for <strong>the</strong> OTB appear to be limited to ara<strong>the</strong>r small portion of <strong>the</strong> Preserve, it is important to continue <strong>the</strong> grazing <strong>the</strong>re tomaintain bare and sparsely-vegetated areas of ground for <strong>the</strong> OTB to use. OTB<strong>monitoring</strong> in future years once <strong>the</strong> Preserve’s grazing program is established willdemonstrate whe<strong>the</strong>r <strong>the</strong> grazed habitat allows <strong>the</strong> OTB to extend its distribution within<strong>the</strong> Preserve.Point counts of adult Opler’s longhorn moth (Adela oplerella, OLM), a Federal Species ofConcern, continued in 2005 at <strong>the</strong> seven patches of its larval food plant, Platystemoncalifornicus, which had been previously identified within <strong>the</strong> Preserve. These countswere performed on <strong>the</strong> same dates as <strong>the</strong> transect counts for <strong>the</strong> OTB. A total of 37adults of <strong>the</strong> OLM were observed in 2005, down from 48 individuals observed in 2004.All observations were made at <strong>the</strong> same patch of its food plant as in 2004, while noOLMs were observed at any of <strong>the</strong> o<strong>the</strong>r six patches. Manual introduction of <strong>the</strong> mothsto o<strong>the</strong>r patches of its food plant may be warranted if <strong>the</strong>y do not naturally colonize <strong>the</strong>seo<strong>the</strong>r areas on <strong>the</strong>ir own.Population <strong>monitoring</strong> of <strong>the</strong> federally endangered Scotts Valley spineflower(Chorizan<strong>the</strong> robusta var. hartwegii) occurred on <strong>the</strong> Preserve in June 2005. A total of28,118 individuals were counted at nine sites. The majority of sites had similar or slightlyhigher counts in 2005 than in 2004. Five of <strong>the</strong>se occur in a narrow panhandle offTabor Drive which was previously disturbed by <strong>the</strong> adjacent housing development andhad been fenced from grazing for several years. No adverse environmental siteconditions were noted during <strong>the</strong> spring 2005 field surveys, and <strong>the</strong>re was no evidenceof erosion, over-grazing or trampling in <strong>the</strong> majority of spineflower habitat. One exoticspecies, narrow-leaved clover (Trifolium angustifolium) increased in cover by over 25percent in 2005 from 2004 in spineflower populations C-74 and C-77. It isrecommended that grazing continue to occur in <strong>the</strong> spineflower habitat, particularly atthose sites where no spineflower was observed in 2004 or 2005.The Preserve grazing program implemented in 2004 to monitor <strong>the</strong> horses’ grazingpatterns and coordinate <strong>the</strong> horse grazing rotation plan was continued in 2005. Finalmodifications to pasture infrastructure, including repair and replacement of perimeterfencing, shifting of cross fencing, and installing locks on water troughs, were completedi
TABLE OF CONTENTSEXECUTIVE SUMMARY ................................................................................................... i1.0 INTRODUCTION ........................................................................................................ 11.1 Preserve Description...............................................................................................11.2 Background .............................................................................................................12.0 OHLONE TIGER BEETLE ......................................................................................... 32.1 Methods ................................................................................................................32.1.1 Adult OTB Counts ............................................................................................32.1.2 OTB Larval Burrows.........................................................................................52.2 Results ....................................................................................................................52.2.1 Adult OTB Counts ............................................................................................52.2.2 OTB Larval Burrows.........................................................................................72.3 Conclusions and Recommendations.......................................................................83.0 OPLER’S LONGHORN MOTH................................................................................. 113.1 Methods ................................................................................................................113.2 Results ..................................................................................................................113.3 Conclusions and Recommendations.....................................................................114.0 SCOTTS VALLEY SPINEFLOWER........................................................................ 124.1 Methods ...............................................................................................................124.1.1 Quantitative Sampling of Vegetation within Spineflower Habitat Areas ........124.1.2 Spineflower Population Counts .....................................................................124.1.3 Monitoring of Management Activities Implemented in 2004 ...........................124.2 Results .................................................................................................................134.2.1 Vegetation within Spineflower Habitat Areas ................................................134.2.2 Population Counts.........................................................................................144.2.3 Monitoring of Management Activities Implemented in 2004...........................184.3 Conclusions an d Recommendations...................................................................185.0 GRAZING MANAGEMENT ...................................................................................... 205.1 Methods ...............................................................................................................205.2 Results .................................................................................................................205.2.1 Pasture Infrastructure.....................................................................................205.2.2 Horse Management/Rotation .........................................................................215.2.3 Pasture Utilization and Residual Dry Matter (RDM) Measurements ..............225.2.4 Panhandle Spineflower Habitat......................................................................315.3 Discussion .......................................................................................................325.4 Grazing Recommendation for 2005-06 Grazing Season ................................326.0 VEGETATION MONITORING IN SENSITIVE HABITATS....................................... 346.1 Methods ...............................................................................................................346.2 Results ..................................................................................................................347.0 OTHER SPECIAL STATUS PLANTS ..................................................................... 387.1 Methods ...............................................................................................................387.2 Results .................................................................................................................387.2.1 Mt. Diablo cottonweed....................................................................................387.2.2 Gray’s clover ..................................................................................................387.2.3 Choris’s popcorn flower..................................................................................387.2.4 Scotts Valley polygonum................................................................................397.2.5 O<strong>the</strong>r rare plant species.................................................................................398.0 EXOTIC PEST PLANTS.......................................................................................... 409.0 REFERENCES ......................................................................................................... 41iii
APPENDICESAppendix A: Preserve MapAppendix B: Area Rainfall Data for 2003-2005 Growing SeasonsAppendix C: Data from Vegetation Transect MonitoringAppendix D: Vegetation Transect PhotosList of FiguresAppendix B: Area Rainfall Data for 2003-2005 Growing Seasons................................... ivFigure 2-a. Location of OTB transect route and intervals, 2005. .....................................4Figure 2-b. Areas of OTB adult and larval observations in 2005. ....................................6Figure 2-c. Comparison of 2003, 2004 and 2005 OTB surveys.....................................10Figure 4-a. Relative cover by species in spineflower transect T6. .................................15Figure 4-b. Relative cover by species in spineflower transect T14. ...............................15Figure 4-c. Relative cover by species in spineflower transect T15. ...............................16Figure 5-a. Locations of RDM plots and heavily grazed areas at <strong>the</strong> Glenwood Preservein 2005. ...................................................................................................................24Figure 5-b. Canham moderately grazed grassland Plot #1 (1,878 lbs/acre)..................27Figure 5-c. Canham closely grazed grassland Plot #5 (844 lbs/acre)............................28Figure 5-d. Canham wetland Plot # 7 (9,256 lbs/acre)...................................................28Figure 5-e. Tabor wetland Plot # 18 (6,806 lbs/acre).2.2.4............................................29Figure 5-f. Close up of Beetle habitat in March 2005.....................................................29Figure 5-g. Flaming application plot three weeks after treatment. Photo taken April 13.................................................................................................................................30Figure 5-h. Photo of beetle area on April 13, 2005. Note hoof print in lower left. .........30Figure 5-i. Opler’s longhorn moth habitat near Pond (April 13, 2005)............................31Figure 6-a. Relative percent cover of vegetation and bare ground calculated fromtransects placed in different habitat types in <strong>the</strong> Glenwood Preserve, 2005...........36Figure 6-b. Relative percent cover of native and non-native species calculated fromtransects placed in different habitat types at <strong>the</strong> Glenwood Preserve, 2005. .........36Figure 6-c. Relative percent cover of grasses, sedges, and rushes compared to forbscalculated from transects in different habitat types on <strong>the</strong> Glenwood Preserve,2005. .......................................................................................................................37Figure 6-d. Species composition of transects placed in different habitat types at <strong>the</strong>Glenwood Preserve, 2005.......................................................................................37List of TablesTable 2-a. Summary of Adult OTBs Observed in 2005 at Glenwood................................7Table 2-b. Comparison of Numbers of OTB Burrows by Larval Instar in 2003 and 2004at Glenwood. .............................................................................................................8Table 4-a. Census of Scotts Valley Spineflower at Glenwood Preserve, 1992, 2004 and2005 ........................................................................................................................17Table 5-a. Actual grazing of <strong>the</strong> Glenwood Open Space in 2004-05 grazing season....22Table 5-b. 2004 Average Residual Dry Matter (Pastures A, B, C, and D) .....................23Table 5-c. Residual Dry Matter Summaries (Pastures A, B, C, and D)..........................25Table 5-d. Scheduled Pasture Rotation Program for Glenwood Preserve for <strong>the</strong> 2005-06grazing season (November to October). .................................................................33iv
1.0 INTRODUCTIONThis document presents results and recommendations of <strong>the</strong> second year of <strong>monitoring</strong>activities conducted on <strong>the</strong> Glenwood Open Space Preserve (“Preserve”) in ScottsValley, Santa Cruz County, California. The 160-acre Preserve was dedicated in 2003 to<strong>the</strong> City of Scotts Valley by American Dream / Glenwood, L.P. as a condition of approvalfor development of forty-four single-family residences on <strong>the</strong> remainder of <strong>the</strong> 195-acreGlenwood property.1.1 PRESERVE DESCRIPTIONThe Preserve is located on ei<strong>the</strong>r side of Glenwood Drive, north and east of ScottsValley High School in <strong>the</strong> City of Scotts Valley, Santa Cruz County. The Preserve isincluded in <strong>the</strong> Felton and Laurel Quadrangles (USGS 7.5 minute series topographicmaps). Adjacent land uses are rural-density residences to <strong>the</strong> north, Scotts Valley HighSchool and undeveloped parcels to <strong>the</strong> west, medium-density residential housing to <strong>the</strong>east, and Vine Hill School and existing homes and Siltanen Park to <strong>the</strong> south.Approximately 60 percent of <strong>the</strong> Preserve is non-native annual grassland with <strong>the</strong>remainder consisting of wetlands, willow riparian, native grassland, coyote bush scrub,and oak and redwood forest. Soils in <strong>the</strong> valleys are primarily of Danville loams, whichare deep, well-drained soils with slow permeability found on alluvial fans and valleybottoms (USDA 1980). Slopes are moderate with elevations of 750 to 860 feet. Soil on<strong>the</strong> slopes and ridges is Bonnydoon loam, which is a shallow, somewhat excessivelydrained soil with moderate permeability.Two federally listed species occur in <strong>the</strong> Preserve. The sou<strong>the</strong>ast corner of <strong>the</strong>Preserve is one of fifteen currently known locations of <strong>the</strong> endangered Ohlone tigerbeetle (Cicindela ohlone, sometimes referred to as OTB) (USFWS 2001, DFG 2002).Portions of grassland in <strong>the</strong> Preserve also support <strong>the</strong> endangered Scotts Valleyspineflower (Chorizan<strong>the</strong> robusta var. hartwegii, sometimes referred to as SVSF), and<strong>the</strong> Preserve is part of designated critical habitat for <strong>the</strong> species (USFWS 2002).Several additional special status species are known to occur within <strong>the</strong> Preserve. TheOpler’s longhorn moth (Adela oplerella, sometimes referred to as OLM), a FederalSpecies of Concern, has been observed in <strong>the</strong> sou<strong>the</strong>astern portion of <strong>the</strong> Preserve.Mount Diablo cottonweed (Micropus amphibolus), included on <strong>the</strong> California Native PlantSociety’s (“CNPS”) List 3, has been observed in grassland throughout <strong>the</strong> Preserve.1.2 BACKGROUNDPrior to 2004, sensitive species or habitats were not managed or monitored on <strong>the</strong>Glenwood property. The property east of Glenwood Drive was fenced as a singlepasture and grazed by horses at above its calculated carrying capacity. Horses hadyear round access to sensitive habitats, including Ohlone tiger beetle habitat, andconcentrated in sensitive native grasslands, wetlands, and riparian areas in <strong>the</strong> dryseason. In contrast, <strong>the</strong> property west of Glenwood Drive had not been grazed for manyyears. In <strong>the</strong> absence of grazing, growth of non-native annual grasses is dense andnative shrubs have become established. The conditions within those portions of <strong>the</strong> site1
containing native grassland, Scotts Valley spineflower and o<strong>the</strong>r sensitive plant specieshabitat have not been monitored.The City of Scotts Valley, in approving <strong>the</strong> Environmental Impact Report, Mitigation andMonitoring Reporting Program (MMRP) for <strong>the</strong> Glenwood Project, required <strong>the</strong>preparation of an Open Space Management Plan (“OSMP” or “Plan”) (WRA 2003). ThePlan was developed after several public hearings and input from resource agencies,environmental groups and <strong>the</strong> public. The OSMP provides guidance on how to maintain<strong>the</strong> existing condition of <strong>the</strong> sensitive habitats (wetland, riparian, and native grassland)and of <strong>the</strong> grassland habitat that is home to <strong>the</strong> rare insect and plant species.Restoration and enhancement of sensitive habitats are not required by <strong>the</strong> projectconditions and <strong>the</strong> MMRP. The U.S. Fish and Wildlife Service and <strong>the</strong> CaliforniaDepartment of Fish and Game reviewed and approved <strong>the</strong> vegetation managementpractices recommended in <strong>the</strong> Plan.The primary goals of <strong>the</strong> Open Space Management Plan are to:1) Maintain, at a minimum, <strong>the</strong> existing habitat conditions in order to <strong>preserve</strong> <strong>the</strong>suitability of <strong>the</strong> grassland habitats of sensitive species, including: <strong>the</strong> Ohlonetiger beetle, Scott’s Valley spineflower, Opler’s longhorn moth, and Mount Diablocottonweed;2) Preserve and maintain <strong>the</strong> existing condition of sensitive habitats includingwetland, riparian, and native grassland.The Plan provides specific management objectives for each of <strong>the</strong> sensitive species andhabitats and includes a <strong>monitoring</strong> program. The Plan objectives are based onqualitative knowledge of existing habitat conditions and site history and <strong>the</strong> currentknowledge of <strong>the</strong> life histories and habitat requirements for each of <strong>the</strong> sensitive species.Thus far, <strong>the</strong>re have been few quantitative surveys of <strong>the</strong> sensitive species on <strong>the</strong>Preserve, and no quantitative data exists on characteristics of <strong>the</strong> grassland habitat of<strong>the</strong> sensitive species. Therefore, it is stated in <strong>the</strong> Plan that initial data from <strong>the</strong><strong>monitoring</strong> program is to be used as baseline data, and baseline data will need tocontinue to be developed as <strong>the</strong> Plan is implemented.This <strong>monitoring</strong> <strong>report</strong> presents results of <strong>the</strong> second year of baseline data collection.Baseline data may require several years of <strong>monitoring</strong> to allow differentiation betweennormal fluctuations in population numbers and habitat from responses to managementactions as well as variations in climatic and o<strong>the</strong>r natural conditions (floods, fires,drought, etc.). Once sufficient baseline data on distribution and populations aredeveloped, thresholds can be established which alert <strong>the</strong> <strong>preserve</strong> manager whenpopulation or habitat changes occur that are outside <strong>the</strong> natural variability expected.The manager will consider short and long term habitat and population data, as well as<strong>the</strong> influence of climatic conditions in making adjustments to baselines, thresholds andmanagement activities. This adaptive management approach will allow <strong>the</strong> Plan toevolve as habitat or regulatory conditions change, and as more information is gainedabout <strong>the</strong> site and <strong>the</strong> species through annual <strong>monitoring</strong>. Future annual <strong>monitoring</strong><strong>report</strong>s will recommend appropriate changes in habitat management practices based on<strong>the</strong> <strong>monitoring</strong> results, revision of preliminary baselines, and refinement of thresholds.2
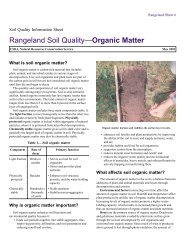
2.0 OHLONE TIGER BEETLEPrepared by: Richard A. Arnold, Ph.D., Entomological Consulting Services, Ltd. This<strong>report</strong> summarizes <strong>the</strong> findings of <strong>the</strong> 2005 <strong>monitoring</strong> activities on <strong>the</strong> endangeredOhlone Tiger Beetle (OTB). Comparisons to findings from 2003 and 2004 surveys arealso provided.2.1 METHODSSurveys were conducted during 2005 to monitor adult and larval life stages of <strong>the</strong> OTB.This section describes <strong>the</strong> <strong>monitoring</strong> methods and data analysis methods used tomonitor <strong>the</strong> life stages of this insect.2.1.1 Adult OTB CountsAdults of <strong>the</strong> OTB can be active from mid-January to mid-May, although annual variationoccurs in <strong>the</strong> duration of adult activity period, as well as starting and ending dates. In2004, a transect route was established along existing trails in <strong>the</strong> sou<strong>the</strong>astern portion of<strong>the</strong> Glenwood study site to monitor adult OTBs. The transect route was divided into sixsegments or intervals (A-F in Figure 4-a) based on landmarks or prominent vegetation in<strong>the</strong> field. Total length of <strong>the</strong> transect route is 1,105 feet, with interval A measuring 254feet, B 156 feet, C 101 feet, D 360 feet, E 61 feet, and F 173 feet.The entire transect route was walked once daily on each of 16 survey dates, whichspanned from <strong>the</strong> beginning to <strong>the</strong> end of <strong>the</strong> 2005 adult season. As OTB adults wereobserved within 15 feet on ei<strong>the</strong>r side of <strong>the</strong> centerline of <strong>the</strong> trail (i.e., a 30 ft. wide belttransect), <strong>the</strong> location of each individual was obtained using a hand held globalpositioning system (GPS), and information about each individual’s sex and observedbehavior was recorded on a data sheet. The tally of all observed adults along <strong>the</strong>transect route on a particular survey date comprised <strong>the</strong> daily transect count.The transect counts along this route establish <strong>the</strong> starting and ending dates of <strong>the</strong> OTB’sadult season, plus <strong>the</strong> magnitude and shape of <strong>the</strong> seasonal population curve for <strong>the</strong>transect route. When <strong>the</strong> counts are plotted against <strong>the</strong> day number of <strong>the</strong> adult activityseason, <strong>the</strong> seasonal population curve of OTB numbers is illustrated. This seasonalpopulation curve can be described ma<strong>the</strong>matically by fitting a curve to <strong>the</strong> count data.My colleague, Dr. Tyson Holmes (Stanford University School of Medicine, Dept. ofHealth Research & Policy, Division of Biostatistics) and I have developed a deterministictransition model for estimating a seasonal population size and death rate for a closedpopulation from transect counts. The observed counts are fitted to a ma<strong>the</strong>maticalfunction via non-linear mixed effect modeling methods (NLME), which provides <strong>the</strong>estimates of <strong>the</strong>se population parameters. A complete explanation of <strong>the</strong> model will bepublished elsewhere (Holmes and Arnold, in prep.). The code to perform <strong>the</strong>secalculations was programmed in <strong>the</strong> commercially-available statistical package, S-Plus(Insightful Corporation, v. 7).3
2005 Ohlone Tiger Beetle StudyScotts Valley - Glenwood SiteAdult transect route and intervals (A - F) and location of larval burrowsArea Where Tiger Beetles Observed in 2005Adult Transect RouteInterval AInterval BInterval CInterval DInterval EInterval FAFCEDB0 75 150 300FeetPrepared September 7, 2005by Entomological Consulting Services, Ltd.
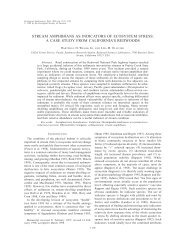
2.1.2 OTB Larval BurrowsThe same trails that were used for <strong>the</strong> adult surveys were checked for egg, larval, andadult emergence burrows throughout <strong>the</strong> 2005 survey period. In addition, surveys ofbarren or sparsely vegetated areas within <strong>the</strong> adjacent grasslands were also checked forburrows. All burrows observed during 2005 were located within <strong>the</strong> trails or immediatelyadjacent to <strong>the</strong>m.In prior <strong>monitoring</strong> at Glenwood I have marked egg and larval burrows with prenumbered,aluminum tree tags by nailing <strong>the</strong>m to <strong>the</strong> ground near <strong>the</strong> burrow. Becausevandals have removed my tags during each of <strong>the</strong> past two years, I did not attempt tomark any burrows in 2005. Instead <strong>the</strong> position of every active larval burrow wasmapped in July 2005 using a mapping grade GPS manufactured by Trimble.Coordinates for all burrows were differentially corrected to improve <strong>the</strong>ir positionalprecision. The diameter of <strong>the</strong> mouth of every larval burrow was also measured todetermine <strong>the</strong> instar of any larvae associated with each burrow.2.2 RESULTS2.2.1 Adult OTB CountsIn 2005, <strong>the</strong> first adult OTBs were observed on January 30 th at Glenwood, or about 12days earlier than when <strong>the</strong> first adult beetles were observed in 2004. Adult counts wereperformed while walking along <strong>the</strong> transect route, as illustrated in Figure 4-a, on 16 daysbetween January 21 st and April 25 th . The transect route was <strong>the</strong> same as was used in2004 to facilitate comparison of seasonal adult counts. No adults were observed on <strong>the</strong>first or last three survey dates. The additional 14 survey dates in 2005 included January30 th , February 5 th , 11 th , 18 th and 26 th , March 6 th , 8 th , 13 th , 20 th , and 27 th , plus April 3 rd , 10 th ,15 th , and 19 th . These dates were selected because wea<strong>the</strong>r conditions were suitable foradult OTBs to be active, i.e., sunny and temperatures >62 o F.Figure 4-b illustrates <strong>the</strong> portions of <strong>the</strong> transect route where adults and/or larvae wereobserved in 2005. Table 4-a summarizes <strong>the</strong> numbers of adult OTBs that wereobserved on each survey date throughout 2005 by transect interval. Areas where adultsor larvae were not observed have generally become overgrown by herbaceousvegetation.A total of 79 adult observations occurred throughout 2005, compared to 239 adults in2004 and 372 adults during 2003. Average numbers of OTB adults observed per sitevisit was only 5.1/survey date in 2005, compared to 19.9 in 2004 and 24.8 in 2003. Thenumbers of OTB adults observed in 2005 represents nearly an 80% decline from <strong>the</strong>numbers observed in 2003.The duration of <strong>the</strong> adult activity period was about 71 days in 2005, compared to 60days in 2004 and about 70 days in 2003. The population peak occurred on day 38(March 8 th ) compared to day 27 (March 7 th ) in 2004 and day 37 (March 5 th ) in 2003.5
2005 Ohlone Tiger Beetle StudyScotts Valley - Glenwood SiteArea of Study Site Where Burrows Were IdentifiedArea where tiger beetles observed in 2005Condition of TrailCovered with grassOpen0 80 160 320FeetPrepared September 7, 2005by Entomological Consulting Services, Ltd.
Table 2-a. Summary of Adult OTBs Observed in 2005 at GlenwoodTransectSurveyOTB Numbers by Transect Interval(A-F, see Figure 1)DailyTransectDate A B C D E F Totals21 Jan.. 0 0 0 0 0 0 030 Jan 0 0 0 0 0 2 25 Feb. 0 0 0 0 0 4 411 Feb. 0 0 1 0 1 3 518 Feb. 0 0 0 1 1 3 526 Feb. 0 0 0 1 1 5 76 March 0 1 1 1 2 5 108 March 0 2 2 1 2 8 1513 March 0 2 0 1 3 6 1220 March 0 0 1 1 1 5 827 March 0 0 0 0 2 3 53 April 0 0 0 0 0 3 310 April 0 0 0 0 1 2 315 April 0 0 0 0 0 0 019 April 0 0 0 0 0 0 025 April 0 0 0 0 0 0 0Seasonal Totals 0 5 5 6 14 49 79Throughout <strong>the</strong> 2005 adult season, approximately 62% of <strong>the</strong> beetle observations werealong transect interval F. In contrast, no adults were observed along interval A.Observations along <strong>the</strong> o<strong>the</strong>r four transect intervals ranged from about 6% to 17% of <strong>the</strong>total observed number of adults. The disproportionate number of OTB adults alongtransect interval F suggests that management to open up more areas of bare orsparsely-vegetation ground along <strong>the</strong> o<strong>the</strong>r transect intervals would be beneficial for <strong>the</strong>OTB.The NLME model estimated a seasonal population size of 30 to 50 OTB adults in 2005.These estimated OTB numbers are only 10-17% of <strong>the</strong> 2005 seasonal populationestimate of 300 adults. Observed behaviors of OTB adults included basking (n = 51),foraging (n = 2), running (n = 1), flying (n = 14), mating (n = 10), and ovipositing (n = 1).A total of 50 males and 29 females were observed. The difference between <strong>the</strong>estimated numbers of OTB adults for <strong>the</strong> entire season of 30-50 individuals versus <strong>the</strong>79 observations may be due to multiple observations of <strong>the</strong> same individual beetle.Since beetles were not marked, captured, or o<strong>the</strong>rwise handled to permit individualrecognition, it is possible some individuals were observed more than once on a particularsurvey date or on different survey dates during <strong>the</strong> 2005 adult season.2.2.2 OTB Larval BurrowsA total of 167 active larval burrows were observed during my July 2005 mapping of <strong>the</strong>burrows. As detailed in Table 4-b, most of <strong>the</strong>se burrows (n = 142) supported mature,third instar larvae of <strong>the</strong> OTB, with burrow diameters ranging in size from 3.6 to 6.0 mm.Most of <strong>the</strong>se larvae remained active through <strong>the</strong> September and October site visits.However, showers and rains in November caused any remaining larvae to plug <strong>the</strong>ir7
urrows. The remaining 25 larvae in burrows were first (n = 2) or second instars (n =23), measuring
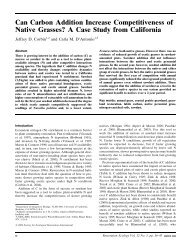
Based on <strong>the</strong> aforementioned observations, at Glenwood we need to create substantiallymore bare ground and sparsely-vegetated ground, especially in <strong>the</strong> beetle pasture toprovide more suitable areas of habitat to support greater numbers of OTBs. Adult andlarval beetle observations for <strong>the</strong> 3-year period of 2003 through 2005 illustrate that notonly numbers of <strong>the</strong>se life stages have declined dramatically, but also <strong>the</strong> area ofoccupied habitat at Glenwood (Figure 3) has similarly declined. Habitat areas that wereformerly characterized by bare ground and used to be occupied were covered with lowgrowingherbaceous vegetation during <strong>the</strong> adult activity period in 2005. Even <strong>the</strong>formerly barren trails that beetles used to occupy have been colonized by vegetation andovergrown.These formerly occupied areas of habitat need to be re-opened to allow <strong>the</strong> beetlepopulation to expand its area of occupation and increase its population numbers.Grazing in 2005, particularly in <strong>the</strong> summer, reduced <strong>the</strong> thatch throughout <strong>the</strong> beetlepasture and opened up some small areas of bare or sparsely vegetated ground. Thehorses have opened up a barren trail segment to <strong>the</strong> new water trough. Digging byground squirrels also opened up a few small areas. However, <strong>the</strong> amount of bareground needs to be greatly expanded throughout <strong>the</strong> pasture and maintained as bareground throughout <strong>the</strong> adult activity period. During <strong>the</strong> past two years, low growingherbaceous vegetation has colonized most portions of <strong>the</strong> former trails and barrenareas. It may even be necessary to graze for short periods of dry wea<strong>the</strong>r during <strong>the</strong>spring to maintain <strong>the</strong> bare ground to benefit <strong>the</strong> OTB. If <strong>the</strong> horse grazing by itself isnot successful at opening up and maintaining areas of bare or sparsely-vegetatedground, <strong>the</strong>n we need to consider creating small patches of bare ground by scraping,flaming, temporary use of goats, or o<strong>the</strong>r alternative vegetation management methods.A trial in late spring of 2005 of <strong>the</strong> flaming technique offers some promise, but should berepeated earlier in <strong>the</strong> growing season to achieve <strong>the</strong> best results. Ideally, I’d like to see<strong>the</strong> beetle pasture include a series of trails that are characterized by barren or sparselyvegetated ground, with numerous table-top size patches of bare/sparsely vegetatedground scattered throughout <strong>the</strong> remainder of <strong>the</strong> grassland.9
2005 Ohlone Tiger Beetle StudyScotts Valley - Glenwood SiteComparison of Burrow Locations 2003, 2004 & 2005Areas of tiger beetle burrrow observations in each yearTrailArea, Year and (Acres) of beetle observations2003 (.21)2004 (.12)2005 (.07)Burrows, Year and (Number) Observed2003 (556)2004 (364)2005 (167)Location of tiger beetle burrrows identified in each year0 37.5 75 150FeetPrepared September 7, 2005by Entomological Consulting Services, Ltd.
3.0 OPLER’S LONGHORN MOTHPrepared by: Richard A. Arnold, Ph.D., Entomological Consulting Services, Ltd. This<strong>report</strong> summarizes <strong>the</strong> findings of <strong>the</strong> 2005 <strong>monitoring</strong> activities on <strong>the</strong> rare Opler’sLonghorn Moth (OPM).3.1 METHODSPoint counts of <strong>the</strong> numbers of observed OLM adults were performed at <strong>the</strong> sevenpatches of its larval food plant, cream cups (Platystemon californicus) which grow at <strong>the</strong>Glenwood study site. These counts were performed on <strong>the</strong> same dates as <strong>the</strong> transectcounts for <strong>the</strong> OTB. Point counts were used because <strong>the</strong> seven patches of <strong>the</strong> foodplant are very small in size and area.3.2 RESULTSAdults of <strong>the</strong> OLM were observed at only one (OLM #1, as described in Arnold, R.A.2000, Ohlone Tiger Beetle Report prepared for American Dream/Glenwood LimitedPartners, 8 pp.) of <strong>the</strong> seven patches of its food plant, on a slope next to <strong>the</strong> man-madereservoir. A total of 37 adults were active between March 6 th and April 3 rd , with <strong>the</strong> peakflight occurring between March 13 th and 20 th . No OLMs were observed at any of <strong>the</strong>o<strong>the</strong>r six patches of its food plant (OLM #2 -#7 of prior <strong>report</strong>s). Observations of <strong>the</strong>OLM declined from 48 in 2004 to 37 in 2005.3.3 CONCLUSIONS AND RECOMMENDATIONSImplementation of <strong>the</strong> grazing program will hopefully increase <strong>the</strong> abundance of <strong>the</strong>OLM’s larval food plant, which in turn should increase <strong>the</strong> population size of <strong>the</strong> moth.Once this occurs, we may want to consider introducing <strong>the</strong> moth to o<strong>the</strong>r patches of <strong>the</strong>food plant at <strong>the</strong> Glenwood site if natural colonization does not occur.11
4.0 SCOTTS VALLEY SPINEFLOWERKathy Lyons of Biotic Resources Group implemented <strong>the</strong> <strong>monitoring</strong> of <strong>the</strong> Scotts Valleyspineflower in 2005 (Year 2).4.1 METHODS4.1.1 Quantitative Sampling of Vegetation within Spineflower Habitat AreasThe occupied and suitable spineflower habitat areas were quantitatively sampled onJune 24, 2005 by Kathleen Lyons and a field assistant to document baseline conditionsof plant species composition and plant cover. Three transects (T6, T14 and T15, seemap in Appendix A), that were established in Year 1 (2004) were re-sampled todocument percent vegetative cover and plant species composition. The transects arelocated in and adjacent to occupied and suitable habitat areas. Within <strong>the</strong> threetransects, a total of forty-one quadrats were sampled (20 quadrats in T6, 8 quadrats inT14 and 13 quadrats in T15).Data from <strong>the</strong> quadrats were analyzed to determine absolute plant cover, relative plantcover and <strong>the</strong> percentage of native species, non-native species, grass species and forbs(i.e., non-grass herbaceous species). Photography was utilized to document <strong>the</strong>spineflower habitat in June 2005. Permanent photo stations that were established ateach transect in 2004, were re-shot to depict 2005 conditions; random photos were alsotaken of o<strong>the</strong>r occupied areas and suitable habitat areas.4.1.2 Spineflower Population CountsOn May 6, 2005, at <strong>the</strong> height of plant growth and flowering of <strong>the</strong> Scotts Valleyspineflower, a census was conducted. Kathleen Lyons and a field assistant counted <strong>the</strong>number of individual plants within each occupied site (locations of spineflower coloniesare shown on <strong>the</strong> map in Appendix A). For colonies supporting less than 100 individuals,accuracy is to one individual. Colonies supporting between 100 and 1,000 individualswere counted to <strong>the</strong> nearest ten individuals. For colonies supporting greater than 1,000individuals, accuracy is estimated to plus/minus 50 individuals. These data werecompared to <strong>the</strong> population data from 1992 and 2004.Additionally, two reconnaissance surveys were conducted within <strong>the</strong> known and potentialspineflower habitat areas on March 17 th and May 20 th 2005. During each site visit, <strong>the</strong>occupied and suitable habitat areas were visually assessed for plant species compositionand general site conditions.4.1.3 Monitoring of Management Activities Implemented in 2004While conducting <strong>the</strong> vegetation surveys related to <strong>monitoring</strong> spineflower and itshabitat, observations were made on <strong>the</strong> effects of <strong>the</strong> grazing program on <strong>the</strong>spineflower habitat. These include species composition changes, mechanical effects ofhorses on <strong>the</strong> environment (e.g. trampling and erosion), and effects of grazing onspineflower population numbers.12
4.2 RESULTS4.2.1 Vegetation within Spineflower Habitat AreasData from <strong>the</strong> three transects (T6, T14, and T15, see Appendix C for data) revealed that55% of <strong>the</strong> plant species within <strong>the</strong> occupied and suitable spineflower habitat areas arenon-native. This is ten percent less than was recorded in 2004 wherein 65% of plantspecies were non-native. The percentage of non-natives ranged from a high of 75% inT15 (an increase from 60% in 2004) to a low of 23% in T6 (a decrease from 63% in2004). T14 had 66% by non-natives in 2005 (a decrease from 72% in 2004). In T14 andT15 <strong>the</strong> cover provided by narrow-leaved clover (Trifolium angustifolium) was higherthan recorded in 2004, at 27.8% and 32.6%, respectively. Cover by rattail fescue (Vulpiamyuros), however, declined significantly in T14 from 63% in 2004 to 7.7% in 2005. InT15, cover by rattail fescue decreased 45% in 2004 to 12.1% in 2005. Windmill pink(Silene gallica) provided 8% cover in T6. O<strong>the</strong>r non-native plant species providingrelative cover values greater than 5% were filaree (Erodium botrys), wild oat (Avena sp.),and soft chess (Bromus hordeaceus). Photographs of <strong>the</strong> transects are in Appendix D.Data from <strong>the</strong> three transects revealed that 45% of <strong>the</strong> plant species within <strong>the</strong> occupiedand suitable spineflower habitat areas are native; this is an increase from 35% cover in2004. The percentage of native plant species in <strong>the</strong> transects ranged from a low of33.7% in T14 (an increase from 27% in 2004) to a high of 78% in T6 (an increase from37% in 2004). T15 displayed 25% cover by native plant species (a decrease from 40% in2004). O<strong>the</strong>r native plant species that provided greater than 5% relative cover in <strong>the</strong>setransects, are woolly blue curls (Trichostema lanceolatum) and Spanish clover (Lotuspurshianus).In 2005 <strong>the</strong> cover provided by Scotts Valley spineflower increased in both T14 and T6;T15 showed a decline in spineflower cover. Spineflower cover was 23.4% in T14(compared to 14% in 2004) and 2% in T15 (compared to 4.4% in 2004). T6 showed anincrease of over 20% in spineflower cover in 2005, when compared to 2004. In thistransect, Scotts Valley spineflower provided 61% cover, which is an increase from 40%in 2004. These data are portrayed on Figures 6-a (T6), 6-b (T14) and 6-c (T15).The transect data and <strong>the</strong> seasonal reconnaissance surveys from <strong>the</strong> occupied andsuitable Scotts Valley habitat areas documented <strong>the</strong> presence of several o<strong>the</strong>r nativeplant species growing amid <strong>the</strong> rocky outcrops. These species include small-headedclover (Trifolium macrocephalum), sand pygmy weed (Crassula erecta), common beachaster (Lessingia filaginifolia), owl’s clover (Castilleja exserta), sky lupine (Lupinusnanus), skunkweed (Navarretia squarrosa), golden aster (Chrysopsis villosa var. villosa),coast tarweed (Madia sativa), California poppy (Eschscholtzia californica), Californiaplantain (Plantago erecta), blue-eyed grass (Sisyrinchium bellum), pale sack clover(Trifolium depauperatum), soap plant (Chlorogalum pomeridianum), mariposa lily(Calochortus luteus), false lupine (Thermopsis macrophyla), checkerbloom (Sidalceamalvaeflora), and purple needlegrass (Nassella pulchra).O<strong>the</strong>r non-native grasses and forbs were observed growing in and around <strong>the</strong> outcropareas, including rattlesnake grass (Briza maxima), Italian ryegrass (Lolium multiflorum),nit grass (Gastridium ventricosum), European hairgrass (Aira caryophyllea), rose clover(Trifolium hirtum), white clover (Trifolium repens), and sheep sorrel (Rumex acetosella).13
No invasive, non-native plant species were observed within <strong>the</strong> occupied and suitablehabitat areas during <strong>the</strong> spring 2005 surveys.4.2.2 Population CountsThe census of <strong>the</strong> Scotts Valley spineflower was conducted during a year with aboveaverage rainfall, as portrayed in <strong>the</strong> rainfall summary table. A total of approximately28,118 individuals were counted at nine sites. This compares to approximately 25,237individuals counted at ten sites in 2004. One site (C-124) that supported 28 individuals in2004 did not support any plants in 2005. As depicted on Table 6-a, most of <strong>the</strong> occupiedsites, however, displayed similar or slightly higher plant numbers that recorded in 2004.Within <strong>the</strong> occupied sites, plant counts per site ranged from a low of one individual (siteC-74) to a high of 11,010 individuals (C-128), as depicted on Table 6-a. Eight sites thatcontained plants in 1992 had no aboveground spineflower plants in May 2005. Based on<strong>the</strong> comparison of <strong>the</strong>se three years of data, <strong>the</strong> number of occupied sites continues todecline from a high of 17 occupied sites in 1992 to nine occupied sites in 2005. None of<strong>the</strong> previously mapped uninhabited, yet suitable, habitat areas were found to support <strong>the</strong>spineflower in 2005.The occupied sites west of Glenwood Drive (sites C-129, C-128, C-127, C-126, C-125,C-123, and C-122) support <strong>the</strong> majority of <strong>the</strong> site’s population (26,609 individuals or95% of <strong>the</strong> population). The spineflower inhabits <strong>the</strong> rocky outcrop along <strong>the</strong> lower edgeof Teacup Hill. Native and non-native plant species intermix with <strong>the</strong> spineflower in<strong>the</strong>se areas; however, <strong>the</strong> spineflower grows very densely in some areas. Individuals ofdudleya (Dudleya ceaspitosa), California fuchsia (Epilobium canum), California phacelia(Phacelia egena), sticky monkey flower (Mimulus aurantiacus) were observed within<strong>the</strong>se sites, in addition to <strong>the</strong> herbaceous species documented in <strong>the</strong> transects. Thisarea appears to have received less unauthorized activity that observed in 2004. Onlyminor human disturbances were observed in and around <strong>the</strong>se sites (some vegetationtrampling and debris was observed between Teacup Hill and <strong>the</strong> high school property).The sites east of Glenwood Drive collectively support 4,209 individuals, or 15%, of <strong>the</strong>population. Despite horse grazing within <strong>the</strong> panhandle area in 2004/05, no spineflowerplants were observed in this area in May 2005 (previously occupied sites C-160, C-159,C-158, C-155, and C-156). During <strong>the</strong> June 2005 field survey, annual, non-nativegrasses and forbs continue to dominate <strong>the</strong> area, although <strong>the</strong> persistence of somenative species was observed (i.e., individuals of dwarf brodiaea [Brodiaea terrestris]).Horses grazed <strong>the</strong> area in summer 2004, reducing <strong>the</strong> cover of <strong>the</strong> non-native grasses.14
Figure 4-a. Relative cover by species in spineflower transect T6.70.0%60.0%50.0%Relative Cover (%)40.0%30.0%20.0%Relative Cover10.0%0.0%Avena sp.Briza maximaBromus diandrusBromus hordeaceusChorizan<strong>the</strong> robusta hartwegiiChrysopsis villosa villosaEremocarpus setigerusErodium botrysFilago gallicaGastridiumHypochaeris glabraLessingia sp.Lolium multiflorumSpeciesLotus purshianusLupinus sp.Silene gallicaTrichostema lanceolatumTrifolium macrocephalumVicia sp.Vulpia sp.Bare groundFigure 4-b. Relative cover by species in spineflower transect T14.3025Relative Cover (%)201510Relative Cover50Conyza canadensisAvena sp.Chorizan<strong>the</strong> robustaEpilobium sp.Erodium botyrsFilago gallicaHypochaeris glabraLinum sp.Lotus purshianusMimulus aurantiacusSilene gallicaTrichostema lanceolatumTrifolium angustifoliumTrifolium campestreTrifolium microcephalumVulpia sp.Bare groundSpecies15
Figure 4-c. Relative cover by species in spineflower transect T15.3530Relative Cover (%)25201510Relative Cover50Anagallis arvensisAvena sp.Bromus diandrusBromus hordeaceusChorizan<strong>the</strong> robusta hartwegiiConyza canadensisErodium botyrsFilago gallicaHypochaeris glabraLotus purshianusNassella pulchraSilene gallicaTrichostema lanceolatumTrifolium angustifoliumTrifolium macrocephalumVicia sp.Vulpia sp.Bare groundSpecies16
PopulationTable 4-a. Census of Scotts Valley Spineflower at Glenwood Preserve, 1992, 2004 and2005Site PopulationPopulation Location1992 1 20042005Number Estimate Census, May CensusC-64 1-10 0 0 E of GlenwoodDrive, SE sectionC-74 10-50 55 1 E of GlenwoodDrive, centralsectionC-77 1,000-5,000 1,204 1,018 E of GlenwoodDrive, centralsectionC-122 5,000-10,000 5,050 3,190 W of GlenwoodDrive, Teacup HillC-123 1,000-5,000 370 363 W of GlenwoodDrive, Teacup HillC-124 1-10 28 0 W of GlenwoodDrive, Teacup HillC-125 1,000-5,000 1,490 1,760 W of GlenwoodDrive, Teacup HillC-126 500-1,000 200 850 W of GlenwoodDrive, Teacup HillC-127 5,000-10,000 5,390 6,933 W of GlenwoodDrive, Teacup HillC-128 5,000-10,000 6,170 11,010 W of GlenwoodDrive, Teacup HillC-129 5,000-10,000 5,280 2,993 W of GlenwoodDrive, Teacup HillC-147 100-500 0 0 W of GlenwoodDrive, grasslandsiteC-155 50-100 0 0 E of GlenwoodDrive, panhandleareaC-156 50-100 0 0 E of GlenwoodDrive, panhandleareaC-158 500-1,000 0 0 E of GlenwoodDrive, panhandleareaC-159 50-100 0 0 E of GlenwoodDrive, panhandleareaC-160 50-100 0 0 E of GlenwoodDrive, panhandleTotal 28,500-55,000 25,237 28,1181 – Source: 1992 Survey Data, Habitat Restoration Grouparea17
The two o<strong>the</strong>r occupied sites east of Glenwood Drive are located north of <strong>the</strong> pond. Asdepicted in Table 4-a, site C-74 only supported one spineflower plant in 2005. This plantwas observed down slope of <strong>the</strong> informal trail that traverses <strong>the</strong> hillside. This sitesupported 55 plants in 2004. Site C-77 supported approximately 1, 018 plants, which isa decrease from approximately 1, 204 plants in 2004.4.2.3 Monitoring of Management Activities Implemented in 2004The goal for <strong>the</strong> population of extant Scotts Valley spineflower is to maintain, onaverage, all extant colonies and a total population that meets or exceeds <strong>the</strong> populationdata collected in 1992, although it is acknowledged that <strong>the</strong> population will vary fromyear to year based on environmental conditions.The grassland management program (i.e., horse grazing) was implemented in spring2004. Horses grazed sites east of Glenwood Drive in 2005. No obvious adverseenvironmental site conditions (e.g., erosion, over-grazing or trampling) were notedduring <strong>the</strong> spring 2005 field surveys within <strong>the</strong> occupied spineflower areas. During 2005,<strong>the</strong> spineflower areas within <strong>the</strong> Preserve were subject to minor human disturbances.Pedestrians, many with unleashed dogs, traversed through <strong>the</strong> grassland on both sidesof Glenwood Drive. To date, however, no significant impacts to <strong>the</strong> Scotts Valleyspineflower were noted from this activity.The spineflower areas both east and west of Glenwood Drive supported a dense growthof narrow-leaved clover in 2005; this species was only marginally present in 2004. It isnot known if <strong>the</strong> abundant growth of this non-native forb affected <strong>the</strong> germination orgrowth of Scotts valley spineflower since spineflower numbers were higher in C-128(near transect T15, yet lower in C-77 (T6). The spineflower population within <strong>the</strong> grazedareas (C-77 and C-74) declined in 2005, however, <strong>the</strong> abundant growth of o<strong>the</strong>r plantspecies within <strong>the</strong>se areas does not suggest that <strong>the</strong> area was overgrazed.4.3 CONCLUSIONS AN D RECOMMENDATIONSWith <strong>the</strong> exception of <strong>the</strong> spineflower sites in <strong>the</strong> panhandle near Tabor Drive, nonnativegrasses and forbs continue to grow on and around <strong>the</strong> occupied sites, but not atlevels that adversely affect <strong>the</strong> growth of <strong>the</strong> spineflower. In order to ensure <strong>the</strong>continuing presence of spineflower on <strong>the</strong> Preserve, <strong>the</strong> following recommendations areoffered:1. The Management Plan recommends as increase in <strong>the</strong> intensity of grazing ifany known areas occupied by Scotts Valley spineflower east of GlenwoodDrive become colonized by invasive species or coverage by non-nativeannual grasses increases by more than 25%. At sites C-77 and C-74spineflower numbers declined in 2005 and <strong>the</strong> cover by narrow-leaved clover(a non-native short-lived perennial species) increased by more than over25%. Assuming that <strong>the</strong> narrow-leaved clover is functioning like that of acompeting annual grass species, it is recommended that <strong>the</strong> grassland in andaround sites C-77 and C-74 continue to be grazed intensively, particularly inabove-normal rainfall years, to inhibit <strong>the</strong> growth of narrow-leaved clover ando<strong>the</strong>r non-native grasses and forbs. Continued intensive grazing in this area(as was conducted in 2005) is expected to maintain existing open area and18
create additional areas that would be suitable for <strong>the</strong> spineflower. TheManagement Plan recommends that spineflower areas maintain a highproportion of un-vegetated wea<strong>the</strong>red sandstone or bare ground andadditional grazing is expected to create such conditions.2. Continue to graze <strong>the</strong> panhandle and monitor whe<strong>the</strong>r any spineflower plantsoccupy <strong>the</strong> area in spring 2006 (sites C-155, C-156, C-158, C-159 and C-160) and at spineflower site C-64, where no spineflower plants wereobserved in 2004 or 2005.3. The Scotts Valley spineflower population should be monitored in spring 2006,with data compared to previous year’s observations.4. Although no evidence of impacts to spineflower was observed, human accesswithin <strong>the</strong> Preserve should be monitored. As recommended in <strong>the</strong> Year 1<strong>report</strong>, fencing should be maintained on <strong>the</strong> portion of <strong>the</strong> Preserve west ofGlenwood Drive to discourage unauthorized human access to <strong>the</strong> hillsidearea.19
5.0 GRAZING MANAGEMENTPrepared by David Amme, Resource Restoration and Management.The 2005 grazing management program goals included 1.) building up <strong>the</strong> horsenumbers, 2) repairing and rebuilding <strong>the</strong> fence and water infrastructure, 3) <strong>monitoring</strong><strong>the</strong> horses’ grazing patterns, 4) coordinating <strong>the</strong> horse grazing rotation plan in order toencourage more even forage utilization, and 5) maintain <strong>the</strong> locally open ground that is acritical environmental element for <strong>the</strong> Ohlone beetle habitat.5.1 METHODSTo accomplish <strong>the</strong>se goals reconnaissance surveys, photo documentation, and fallresidual dry matter (RDM) surveys were conducted. Reconnaissance surveys wereconducted February 7, March 1 and 13, April 13 and 26, May 30, June 26, July 7, 13 and30, August 5, September 3 and 30, October 8, and November 5. The end of <strong>the</strong> grazingseason reconnaissance surveys took place on September 30, October 8 and November5. Prior to <strong>the</strong> completion of this <strong>report</strong> a reconnaissance survey was conducted onDecember 10. The RDM values were measured on October 8. A portion of <strong>the</strong> timeduring several of <strong>the</strong>se visits was also devoted to managing <strong>the</strong> replacing of <strong>the</strong> easternboundary fence, installing <strong>the</strong> new creek gate, activating water troughs, and meeting andcorresponding with <strong>the</strong> horse owners.5.2 RESULTS5.2.1 Pasture InfrastructureImplementation of <strong>the</strong> grazing program outlined in <strong>the</strong> Glenwood Open SpaceManagement Plan (OSMP) was initiated in 2004 with <strong>the</strong> creation of four pastures on <strong>the</strong>Preserve east of Glenwood Drive: Pastures A (Canham pasture), B (Pond pasture), C(Tabor pasture) and D (Beetle pasture). The Beetle pasture encompasses <strong>the</strong> Ohlonetiger beetle habitat. A significant factor in <strong>the</strong> management of <strong>the</strong> horses was <strong>the</strong> loss ofa functioning gate early in 2004 at <strong>the</strong> creek between <strong>the</strong> Canham pasture and <strong>the</strong> threeeastern pastures. In addition, <strong>the</strong> horses still had a preference for staying in <strong>the</strong>Canham pasture. Prior to <strong>the</strong> creation of <strong>the</strong> Preserve and <strong>the</strong> four separate pastures,<strong>the</strong> north gate on Canham Road was <strong>the</strong> preferred gate used by owners to access <strong>the</strong>irhorses. The Canham pasture is a moist and productive pasture with abundant perennialgrasses and clover. Horses returned <strong>the</strong>re regularly and owners were accustomed tofinding and caring for <strong>the</strong>m in this area. In 2005 <strong>the</strong> Tabor pasture fence line alongTabor Drive was also in poor repair and <strong>the</strong> horses could potentially escape or be injuredon Tabor Drive. The creek gate was not repaired until early August when <strong>the</strong> easternperimeter Tabor Drive fence line was rebuilt. Horses could be moved into to <strong>the</strong> Taborpasture by closing <strong>the</strong> Tabor gate. The water troughs in both <strong>the</strong> Tabor and Beetlepastures were functioning well.With <strong>the</strong> final installation of <strong>the</strong> creek gate and <strong>the</strong> eastern boundary perimeter fence inAugust 2005, <strong>the</strong> horses are finally able to be rotated and graze each of <strong>the</strong> fourpastures. Access for horse owners to <strong>the</strong> Pond and Tabor pastures was improved with20
<strong>the</strong> installation of a metal corral near <strong>the</strong> entrance of <strong>the</strong> water company gate. Thehorse owners are now able to access <strong>the</strong>ir horses, feed and groom <strong>the</strong>m separately, andhold <strong>the</strong>m until <strong>the</strong>y can be moved into a trailer at this location. Access by <strong>the</strong> horseowners to <strong>the</strong>ir horses when <strong>the</strong>y are in <strong>the</strong> Beetle pasture (Pasture D) is from a gate on<strong>the</strong> access road behind Vine Hill Elementary School along <strong>the</strong> south boundary of <strong>the</strong>Preserve.5.2.2 Horse Management/RotationDuring <strong>the</strong> 2004-5 grazing season 3 to 5 older horses or horses in danger of founderingwere removed by <strong>the</strong> owners to stables or o<strong>the</strong>r pastures during <strong>the</strong> winter and returnedin <strong>the</strong> spring or summer. During 2005 <strong>the</strong> herd was increased to a maximum 22 horsesand presently has 21 horses. Currently 2 horses have left <strong>the</strong> Glenwood pasture tostables leaving 19 horses in <strong>the</strong> pasture. The horses are moved by horse owners RenieGallagher and Katie Harper with periodic help from <strong>the</strong> o<strong>the</strong>r horse owners.Table 2-a shows <strong>the</strong> utilization of each pasture in terms of Animal Unit Months (AUMs)on a monthly basis in <strong>the</strong> 2004-05 grazing season (October 2004 to December 2005).The dashed line between <strong>the</strong> pastures means <strong>the</strong> gate is open between those pastures.At <strong>the</strong> beginning of <strong>the</strong> 2005 season, five new horses were moved into <strong>the</strong> Beetlepasture for two months between November to January and joined <strong>the</strong> rest of <strong>the</strong> herd in<strong>the</strong> Canham pasture in mid January 2005. During <strong>the</strong> fall and early winter <strong>the</strong> horsesstayed in <strong>the</strong> Canham pasture even though <strong>the</strong> creek gate was open and <strong>the</strong> horsescould access <strong>the</strong> Pond and Tabor pastures. During this time 2 horses were moved offpermanently and 2 horses were moved to winter stables keeping <strong>the</strong> herd number at 16.In February <strong>the</strong> horses began to move into <strong>the</strong> Pond and Tabor pastures. The Februarynumbers reflect <strong>the</strong> estimated use of <strong>the</strong> horses based on observation and is shown byan arrow.In March <strong>the</strong> horses were moved out of <strong>the</strong> Canham pasture to <strong>the</strong> Tabor pasture with<strong>the</strong> gates to <strong>the</strong> Beetle pasture left open. Reconnaissance surveys by Dr. Arnold andDavid Amme at this time indicated <strong>the</strong> horses were not sufficiently utilizing <strong>the</strong> Beetlepasture. This corresponds to <strong>the</strong> time when Dr. Arnold recorded <strong>the</strong> Ohlone tiger beetlepopulation peak at Glenwood (March 8). Because <strong>the</strong>re was a lull in <strong>the</strong> rain and <strong>the</strong> soilwas not saturated, Dr. Arnold recommended that horses be confined in <strong>the</strong> Beetlepasture for a short period of time. Twelve of <strong>the</strong> horses were locked in <strong>the</strong> Beetlepasture for 16 days (6 AUMs) starting on March 14 th while 5 horses remained in <strong>the</strong>Tabor Pasture. The twelve horses were moved back into <strong>the</strong> Tabor pasture on March30. In mid April <strong>the</strong> horses were moved into Canham and Pond pastures spendingequal amounts of time in each pasture. During this time four horses were added to <strong>the</strong>herd and two horses returned bringing <strong>the</strong> number to 22 horses. In July and Augusttwenty horses were moved to <strong>the</strong> Tabor pasture where <strong>the</strong>y took advantage of <strong>the</strong>forage in <strong>the</strong> large wet area of Danville Loam and <strong>the</strong> higher surrounding ground nearTabor Drive. During this time nine of <strong>the</strong> horses were confined in <strong>the</strong> Beetle pasture tograze down <strong>the</strong> remaining feed and open up more bare areas for Ohlone tiger beetlehabitat in late July and August (as per Dr. Arnold’s recommendation). A substantialamount of new bare ground was created to prepare <strong>the</strong> site for <strong>the</strong> next Ohlone tigerbeetle breeding season. Even though <strong>the</strong> Beetle pasture was impacted by 30 AUMs in2005 grazing season because of <strong>the</strong> extra rainfall most of <strong>the</strong> pasture was moderatelygrazed. As soon as <strong>the</strong> creek gate was fixed all <strong>the</strong> horses were rotated to <strong>the</strong> Pondpasture in September and <strong>the</strong>n allowed to roam into <strong>the</strong> Canham pasture in October.21
Despite <strong>the</strong> heavy use of <strong>the</strong> Canham pasture during <strong>the</strong> 2004-05 grazing season (~94AUMs), <strong>the</strong> abundant rainfall coupled with a 2-3 month period of regrowth in <strong>the</strong> springand summer when <strong>the</strong> horses were moved to <strong>the</strong> eastern pastures enabled <strong>the</strong> Canhampasture to regrow and remain in good condition with reserve forage for <strong>the</strong> horses in <strong>the</strong>fall and early winter (Nov-Dec).Table 5-a. Actual grazing of <strong>the</strong> Glenwood Open Space in 2004-05 grazing seasonGrazing season November to OctoberEstimatedGrazing Capacity: 275 AUMs. 2005 Actual: 231.5 AUMs AUMs perPasture*Pasture N D J F M A M J J A S OCanham 15 15 162 2~94 AUMs*(75 AUM)7 4 10 1211Pond~61 AUMs*(88 AUM) 5 4 10 10 21 11Tabor8 11 11 ~45 AUMs*(93 AUM) 4 8.52.5Beetle 2.5 5 6 9 9 ~31.5 AUMs(19 AUM)Adult Beetle **************estimatesActive *****************************based onLarvaeobservedBelow *********movementsGroundSpineflower *********************TotalAUM’s17.52016 16 17 16 20 22 22 22 21 22 23l.5 AUMsAll but <strong>the</strong> Beetle pasture gates were opened in October. The horses began to migrateon <strong>the</strong>ir own into <strong>the</strong> Pond pasture and <strong>the</strong>n <strong>the</strong> Tabor pasture in November searchingfor fresh forage. The Beetle pasture gates were opened in November and <strong>the</strong> horsesbegan to congregate in <strong>the</strong> Beetle pasture for portions of each day and walking <strong>the</strong>paths and bare areas that support <strong>the</strong> Ohlone tiger beetle. In November <strong>the</strong> horseswere spending much of <strong>the</strong>ir time in <strong>the</strong> Pond pasture ranging as far as <strong>the</strong> Beetlepasture. In December <strong>the</strong> horses are grazing <strong>the</strong> Tabor pasture a little more than <strong>the</strong>Pond and still ranging into <strong>the</strong> Beetle pasture.5.2.3 Pasture Utilization and Residual Dry Matter (RDM) MeasurementsThe main purpose of <strong>the</strong> RDM measurements is to determine <strong>the</strong> grazing utilization of<strong>the</strong> Glenwood pasture. Figure 5-a shows <strong>the</strong> heavily utilized areas and <strong>the</strong> locations of<strong>the</strong> sample RDM plots. In general <strong>the</strong> target RDM average is 1000 to 1200 lbs/acre toassure enough cover and forage for <strong>the</strong> horses in <strong>the</strong> fall and early winter months.Table 5-b summarizes <strong>the</strong> average RDM from <strong>the</strong> nine areas sampled in 2004. The22
values of <strong>the</strong>se clipped RDM plots indicated very light grazing and many of <strong>the</strong> plotswere de facto ungrazed (primary production) samples. This information is presented asa comparison for <strong>the</strong> 2005 grazing season utilization. On September 30 and October 8,2005, a utilization survey was conducted. The 2005 RDM clipped plots were located insites that represent typical areas of varying uniform utilization and identified andsampled <strong>the</strong> areas of light, moderate, and heavy grazing. Table 5-c gives <strong>the</strong> RDMvalues for <strong>the</strong> 21 sample plots for 2005. Nine of <strong>the</strong> sites correspond to <strong>the</strong> establishedvegetation transects (Transects 1, 2, 3, 4, 5, 7, 10, 11, & 12) including seven of <strong>the</strong>transects with RDM measurements in 2004 (Transects 1, 2, 3, 4, 5, 7, & 10). Comparingsimilarly grazed areas between <strong>the</strong> 2003-04 and 2004-05 grazing seasons indicates that<strong>the</strong> 2004-05 season produced 2000 to 3000 lbs/acre more forage while grazingutilization increased.Table 5-b. 2004 Average Residual Dry Matter (Pastures A, B, C, and D)RDM lbs/acreCanham Annual Grass Transect 1. Evidence of moderate6,316grazing/trampling.Canham Wetland Transect 2. Evidence of moderate grazing and7,296trampling.Pond Cream Cups/Opler’s Moth Transect 4. No evidence of grazing. 3,321Pond Cream Cups/Opler’s Moth Transect 7. Moderate grazing. 3,103Pond South Facing Slope. (3:1 slope). No evidence of grazing. 4,301Pond South Facing Slope Below Transect 3. (2:1 slope). No grazing. 4,682Tabor Annual Grass Transect 5. Evidence light grazing and6,443disturbance.Tabor Wetland Transect 10. No evidence of grazing. Lodged mulch 7” 11,888high.Beetle (Transect 12). Mostly ungrazed 6,53323
Plot 12Plot 20 Plot 21Plot 13Plot 19Plot 14Plot 11Plot 1Plot 10Plot 9Plot 17Plot 15Plot 2Plot 3WPlot 4Plot 8WWPlot 18Plot 16WPlot 5Plot 6Plot 7
Table 5-c. Residual Dry Matter Summaries (Pastures A, B, C, and D).Canham Pasture (A). Danville loam. Normal year forage production 4000 lbs per acre (SCS).Plot 1 Near redwood grove, nor<strong>the</strong>ast corner. Moderately grazed, few weeds, 1-3” height.Flat surface, no gopher signs.1,878 lbs/acrePlot 2 Southwest of Plot 1 between ground squirrel area and heavily used flat. Moderatelygrazed. 3” laying down. Flat surface, no gopher signs.3,267 lbs/acrePlot 3 West of Plot 2 between two heavily used area. Lightly grazed. 7-10” upright. Flatsurface.5,173 lbs/acrePlot 4 North end of south field (south of willow island). Lightly grazed, heavy RDM. 4-5” layingdown. Scattered tar weed. Irregular surface. No signs of gophers.Near Transect 15,989 lbs/acrePlot 5 Sample of heavily grazed clover flat west of Plot 4 (Typical). Flat surface, no gophers.844 lbs/acrePlot 6 West side of south field. Lightly grazed, heavy RDM. Laying down. 6-7”. Signs ofgophers.6,969 lbs/acrePlot 7 Wetland plot, southwest end of field in grassy only area. Lightly to moderately grazed.Irregular surface, no signs of gophers.Near Transect 29,256 lbs/acrePond Pasture (B). Bonnydoon loam. Normal year forage production 3200 lbs per acre (SCS).Plot 8 Cream cups/Opler’s moth site. No signs of grazing, some trailing.4-5” standing and laying down. Irregular surface, signs of gophers.(Represents possible primary production)Near Transect 46,806 lbs/acrePlot 9 Cream cups/Opler’s moth site. Moderately grazed, trailing. 4-6”laying down. Irregular surface, signs of gophers.Near Transect 72,423 lbs/acrePlot 10 Grassy area nor<strong>the</strong>ast of pond. Horses beginning to graze areawhen measured. 3-6” laying down. Irregular surface, signs of gophers.2,804 lbs/acrePlot 11 South facing slope. No evidence of grazing. 6” laying down.Irregular surface, signs of gophers. (Represents possible primaryproduction)Below Transect 35,009 lbs/acrePlot 12 Nor<strong>the</strong>ast corner of pasture near top of hill. Horse trail througharea. 4” laying down. Irregular surface, signs of gophers.3,049 lbs/acrePlot 13 Westside near top of ridge. Moderately grazed. 4” laying down.Flat surface, no signs of gophers.2,314 lbs/acre25
Plot 19 North side of fence line at top of hill. Lightly or not grazed. Greymatter in sample. 4” laying down. Irregular surface, signs of gophers.(Represents possible primary production)Near North Transect 55,989 lbs/acreTabor Pasture (C). Hillsides dominated by Bonnydoon loam, normal year forage production3200 lbs per acre. Wetland flat, Danville loam, normal year forage production 4000 lbs peracre (SCS).Plot 17 Wetland sample in center of pasture. Moderately grazed 6-8”standing and laying. No signs of gophers.Near Transect 104,356 lbs/acrePlot 18 Wetland southwest corner of pasture. Lightly grazed. 8-10”standing and laying down. No signs of gophers.6,806 lbs/acrePlot 20 South of fence on top of hill opposite Plot 19. Moderately grazedarea near heavily grazed area. 4” laying down. Irregular surface, signs ofgopher activity.Near South Transect 51,797 lbs/acrePlot 21 Sou<strong>the</strong>ast end of pasture on side of hill near Gray’s clover sites.Moderately grazed. 4” laying down. Irregular surface, signs of gopheractivity.3131 lbs/acreBeetle Pasture (D). Bonnydoon loam. Normal year forage production 3200 lbs per acre(SCS).Plot 14 Moderately grazed. Irregular surface. No gophers.Near Transect 112,396 lbs/acrePlot 15 Heaviest RDM in central beetle area. Moderately grazed.Irregular surface. No signs of gophers. Ground squirrels active near by.Near Transect 122,722 lbs/acrePlot 16 North of water trough, west end of pasture. Lightly grazed.Irregular surface. No sign of gophers.4,900 lbs/acreLate spring rainfall in <strong>the</strong> 03-04 season was below average totaling only 2” after March1 st . For <strong>the</strong> same period <strong>the</strong> rainfall for <strong>the</strong> 04-05 season was above average totaling17” of rain after March 1 st (Appendix B). In <strong>the</strong> 2004-05 grazing season areas thatshowed signs of light or no grazing consistently had RDM values above 5,000 lbs/acre.Moderately grazed areas had RDM values between 2,000 and 3,000 lbs/acre. Theareas of heaviest grazing had very little RDM (trace to 250 lbs/acre). These areas werepreferred by <strong>the</strong> horses and grazed <strong>the</strong> closest, reflecting moist subsoil and <strong>the</strong>presence of <strong>the</strong> prostrate perennial rose clover (Trifolium hirtum). Plot 5 represents <strong>the</strong>upper end of a heavily grazed/preferred site at 844 lbs/acre. Based on ocular estimates,<strong>the</strong> average heavily grazed areas had RDM amounts between 250 to 800 lbs/acre). Thewetland sites (Danville loam) in <strong>the</strong> Tabor pasture were much more evenly grazed than<strong>the</strong> previous year providing an estimated 3-4,000 lbs/acre of consumed forage.26
In <strong>the</strong> Beetle pasture <strong>the</strong> recommended July and August grazing greatly expanded <strong>the</strong>open ground around <strong>the</strong> main horse trails and loafing areas of <strong>the</strong> Ohlone tiger beetlehabitat (with little or no RDM) while maintaining moderate RDM values in between(2,300-2,700 lbs/acre). Figures 5-b – 5-e show aspect of grassland and wetland RDMplots.Figure 5-b. Canham moderately grazed grassland Plot #1 (1,878 lbs/acre).27
Figure 5-c. Canham closely grazed grassland Plot #5 (844 lbs/acre).Figure 5-d. Canham wetland Plot # 7 (9,256 lbs/acre).28
Figure 5-e. Tabor wetland Plot # 18 (6,806 lbs/acre).2.2.4Figure 5-f. Close up of Beetle habitat in March 2005.29
Figure 5-g shows an overview of one of <strong>the</strong> propane torch treated plots after threeweeks of regrowth. The flowering herbs were killed but <strong>the</strong> filaree and annual grassessurvived. One of <strong>the</strong> beetle paths can be seen in <strong>the</strong> top of this photograph.Figure 5-g. Flaming application plot three weeks after treatment. Photo taken April 13.Figure 5-h shows <strong>the</strong> aspect of <strong>the</strong> larger beetle “barren” after <strong>the</strong> horses were movedout of <strong>the</strong> Beetle pasture. Native wildflowers normally cover this area in April butcompletely dry out and disappear in <strong>the</strong> summer. With <strong>the</strong> extra spring rain <strong>the</strong> drying ofthis area may have been delayed.Figure 5-h. Photo of beetle area on April 13, 2005. Note hoof print in lower left.30
The two primary Opler’s longhorn moth habitats were monitored in <strong>the</strong> spring and RDMplots were measured in October. There was little sign of grazing in <strong>the</strong> vicinity of RDMPlot 8. The RDM value of plot 8 was 6,800 lbs/acre. The RDM value for this plot in2004 was 3,300 lbs/acre reflecting <strong>the</strong> different conditions between years and <strong>the</strong> muchgreater production in 2005. Despite <strong>the</strong> heavy grass cover <strong>the</strong>re were scattered creamcups (Platystemon californicus) at this site in both years. The cream cups were morenumerous on <strong>the</strong> north-facing slope next to <strong>the</strong> pond that was moderately grazed in2005. The RDM value for <strong>the</strong> pond slope area (Plot 9) was 2,400 lbs/acre (See Figure2-i). In 2004 <strong>the</strong> RDM value in this area averaged 3,100 lbs/acre.5.2.4 Panhandle Spineflower HabitatIn 1992 a scattered population of <strong>the</strong> Scotts Valley spineflower was found growing on aweeping or moist interface just above <strong>the</strong> east entrance to Siltanen Park. At <strong>the</strong> timethis site was surveyed it was unfenced and open to horses grazing. Subsequent homeconstruction created a narrow strip or panhandle of grassland within <strong>the</strong> GlenwoodPreserve along <strong>the</strong> entrance road. At <strong>the</strong> time <strong>the</strong> houses were built this panhandle wasfenced off from grazing. This area has remained ungrazed for 10 years until <strong>the</strong>construction of <strong>the</strong> new perimeter fence that included this area in <strong>the</strong> Beetle pasture in2004. Presently <strong>the</strong> horses graze this area lightly. To encourage spineflower habitat inthis area it is possible that <strong>the</strong> area could be fenced off and grazed by 4-6 horses forshort periods if a water trough could be filled during <strong>the</strong>se periods.Figure 5-i. Opler’s longhorn moth habitat near Pond (April 13, 2005).31
5.3 DISCUSSIONThe Glenwood carrying capacity as determined in <strong>the</strong> 2003-04 <strong>monitoring</strong> <strong>report</strong> is 23horses (275 AUMs). It is clear from total Animal Unit Months given in Table 2-a and <strong>the</strong>high RDM values in Table 2-c that <strong>the</strong> horse numbers need to be raised by 2 horses (36-40 AUMs). Given <strong>the</strong> absence of horses in <strong>the</strong> winter this number could be increased byano<strong>the</strong>r horse (24 AUM’s). Utilization has improved as <strong>the</strong> Glenwood horse herd isadapting to <strong>the</strong> new conditions of <strong>the</strong> pasture and seem to be more comfortable crossing<strong>the</strong> creek to <strong>the</strong> east side of <strong>the</strong> pasture and moving throughout <strong>the</strong> different pastureswhen <strong>the</strong> gates are open.Almost 36 inches of rain had fallen on <strong>the</strong> Glenwood pasture in <strong>the</strong> previous year by <strong>the</strong>end of February 2004. Similarly, forage production was high in <strong>the</strong> first part of 2005aided by <strong>the</strong> forty inches of rainfall that had soaked <strong>the</strong> Glenwood pasture by <strong>the</strong> end ofFebruary 2005 and above normal rainfall (17 inches) in April, May and June. Except forclover, horses generally do not eat flowering forbs and cannot be forced to eat <strong>the</strong>wildflowers and forbs when surrounded by productive grassland. The open bare groundalong narrow paths and in larger connected patches is more a result of horse traffic thanhorse grazing. While <strong>the</strong> soil in <strong>the</strong> beetle area is barren it is not hard and rocky. It maybe that <strong>the</strong> physical presence of horses walking into and loafing in <strong>the</strong> Ohlone tigerbeetle area is what maintains <strong>the</strong> tiger beetle habitat. It may be critical to have horseswalking in and out of this area throughout <strong>the</strong> spring growing season (March to June). Itmay be that <strong>the</strong> scientifically obtained grazing capacity of 19 AUM for <strong>the</strong> Beetle pasturemay not be enough impact to maintain <strong>the</strong> Ohlone tiger beetle habitat and, in fact, mayhave been heavily utilized prior to <strong>the</strong> building of <strong>the</strong> housing development.5.4 GRAZING RECOMMENDATION FOR 2005-06 GRAZING SEASONTwenty-one horses currently comprise <strong>the</strong> horse herd. Presently nineteen horses aregrazing <strong>the</strong> pasture in <strong>the</strong> winter with two horses off for <strong>the</strong> winter. In <strong>the</strong> next grazingseason it will be a priority to increase <strong>the</strong> herd by 2 horses to stock <strong>the</strong> pasture at <strong>the</strong>proper stocking rate (i.e., 23 horses). The larger <strong>the</strong> herd <strong>the</strong> more interaction <strong>the</strong>re isbetween <strong>the</strong> horses and <strong>the</strong> more likely <strong>the</strong>y are to begin to move around or even breakup into two subgroups. Notwithstanding <strong>the</strong> increase in horse numbers, <strong>the</strong> grazingstrategy for 2005-06 will be to utilize <strong>the</strong> four pasture system to encourage <strong>the</strong> horses tomove to <strong>the</strong> east side of <strong>the</strong> pasture towards <strong>the</strong> Beetle pasture and give <strong>the</strong> horsesincreased opportunity to walk onto and through <strong>the</strong> Beetle pasture. Table 5-d sketches<strong>the</strong> proposed pasture rotation program for <strong>the</strong> 2005-06 grazing season and includes anincrease to 23 horses in <strong>the</strong> spring. The key to this grazing strategy is to allow <strong>the</strong>horses access to <strong>the</strong> Beetle pasture at least every two months but not to concentrate<strong>the</strong>m in <strong>the</strong> pasture where <strong>the</strong>y may possibly negatively impact <strong>the</strong> beetle habitat during<strong>the</strong> larvae and adult stages. If <strong>the</strong> higher horse numbers are not attained <strong>the</strong>n a littlemore concentrated grazing of <strong>the</strong> Beetle pasture can be encouraged with <strong>the</strong> rotation.To address <strong>the</strong> Scott Valley spineflower in <strong>the</strong> Beetle pasture panhandle, a temporaryfence and a temporary water trough should be installed to allow three or four horses toclean up <strong>the</strong> excess forage and expose <strong>the</strong> soil to encourage spineflower habitat. Thetrough in <strong>the</strong> panhandle can be filled during <strong>the</strong> short concentrated grazing period from ahose bib at Vine Hill School. It may be necessary to introduce spineflower seed to thisarea in <strong>the</strong> future if <strong>the</strong> seed bank is exhausted.32
Infrastructure improvements needed in 2006 include: installing pressure reducers for <strong>the</strong>water troughs, installing special ramps in <strong>the</strong> water troughs to enable bird and mammalsto escape, and rebuilding <strong>the</strong> Canham corral.Table 5-d. Scheduled Pasture Rotation Program for Glenwood Preserve for <strong>the</strong> 2005-06grazing season (November to October).2005-06 Grazing Season Grazing Capacity: 275AUMsGoal: Add 2 horses to <strong>the</strong> herd.EstimatedAUMs perPasturePasture N D J F M A M J J A S OCanham8 5 1 21 8 ~68 AUMs(75 AUM)0 34Pond)7 8 11 29 8 ~88 AUMs(88 AUM94 3Tabor4 6 1 5 5 2 1 7 ~73 AUMs(93 AUM)03 3Beetle~27 AUMs(19 AUM) 9 4 4 10Adult Beetle/Egg Laying ***********Egg Hatching/Active *************************Larvae StagesBelow Ground Pupae ********StageScottsValley ***************spineflowerTotal AUM’s 191919191923232323232323256 AUMs33
6.0 VEGETATION MONITORING IN SENSITIVE HABITATSPrepared by Philip Greer, Geoff Smick, WRA, Inc.6.1 METHODSQuantitative sampling of vegetation transects allows tracking of changes in plant coverand species composition. This information can be used in determining <strong>the</strong> effectivenessof <strong>the</strong> grazing and o<strong>the</strong>r management tools in maintaining habitat for sensitive species.The fifteen permanent transects established throughout <strong>the</strong> Preserve in different habitattypes were monitored again in 2005. Locations of <strong>the</strong>se transects are shown on <strong>the</strong>Preserve Map (Appendix A). Within <strong>the</strong> Ohlone tiger beetle and Scotts Valleyspineflower habitats, three transects each were used to measure <strong>the</strong> vegetationcharacteristics. Three transects were established in wetlands, three in nativegrasslands, two in annual grasslands, and two in grasslands with <strong>the</strong> larval food plant(Platystemon californicus) for <strong>the</strong> Opler’s longhorn moth.Sampling was conducted along each transect using 0.1 meter-square quadrats, placed 1meter apart, perpendicular to and on alternating sides of <strong>the</strong> meter tape. Speciescomposition and percent cover were measured within each quadrat. Plant cover wasestimated using Braun-Blaquet cover classes. Special attention was focused on <strong>the</strong>presence, estimated number, and/or percent cover of native perennial bunchgrasses,sensitive plant species, and invasive species.Photographs were taken at each transect. Photographs will be used to monitor longtermchanges in <strong>the</strong> site and its plant communities. Photographs can also be used todetermine if localized areas are receiving ei<strong>the</strong>r light or heavy grazing, are subject toerosion, or are being adversely affected by invasive species.Vegetation surveys were conducted in March, April, and June in 2005, depending on <strong>the</strong>maturity of <strong>the</strong> flora in each habitat. Exact surveying dates for specific transects can befound on <strong>the</strong> 2005 data sheets included in Appendix C (2004 data is also included forcomparison).6.2 RESULTSData collected during transect <strong>monitoring</strong> in 2005 is presented in Appendix C. Examplesof photographs taken at transects are presented in Appendix D. Figures 6-a - 6-dcompare vegetation composition and cover across <strong>the</strong> transects.Figure 6-a shows <strong>the</strong> relative cover of bare ground compared to vegetation in <strong>the</strong> 15transects. The average area with vegetation along <strong>the</strong> transects increased almost 10percent from 2004 (x = 82.6%) to 2005 (x = 90.6%). This is likely due to <strong>the</strong> aboveaverage late season rainfall that occurred in <strong>the</strong> spring of 2005 (Appendix B). All butone of <strong>the</strong> 15 transects had over 80 percent relative cover of vegetation in 2005compared to only 9 transects in 2004. Transects with <strong>the</strong> highest proportion of bareground were <strong>the</strong> OTB transects (11, 12 and 13), and transects 14 and 15 in SVSFhabitat.34
The relative percent cover of <strong>the</strong> vegetation in <strong>the</strong> transects is presented in Figures 6-band 6-c. Relative cover of native vs. non-native species is graphed in Figure 6-b.Average relative percent cover of native species throughout <strong>the</strong> transects increased over10 percent between 2004 (x = 13.1%) and 2005 (x = 25.4%). Relative cover by nativesincreased in 10 transects from 2004 to 2005. Transects 7 and 11 (OLM and OTBhabitats, respectively) had over 50 percent relative cover by native plants in 2005, whilein 2004 <strong>the</strong> highest levels of relative cover were around 30 percent. Transect 4 (nativegrassland/OLM habitats) had no native plants in 2005, down from 12 percent nativecover in 2004.Relative cover of forbs vs. grasses, sedges, and rushes is graphed in Figure 6-c.Average cover on all transects by grasses, sedges, and rushes dropped 34 percentbetween 2004 (x = 75%) and 2005 (x = 37%). Data from 2004 indicates that only twotransects had a greater percentage of cover by forbs than non-forbs (transects 6 and15). In 2005 12 transects had a higher percentage of cover by forbs than non-forbs.This increase may be related to increased grazing and differences in rainfall between <strong>the</strong>two years that favored <strong>the</strong> growth of forbs in 2005. Above normal late spring rains couldincrease forb cover by prolonging <strong>the</strong> growth period before low soil moisture inducedsenescence.The number and type of species occurring in <strong>the</strong> transects are presented in Figure 6-d.The average number of species across all transects rose by 2.7 species between 2004(x = 14.6 species) and 2005 (x = 17.3 species). Only three transects had a total of 20 ormore species in 2005: transects 3, 6, and 7, down slightly from 2004 when four transectshad a total of 20 or more species (transects 4, 7, 13, and 15). In 2004 transects 1, 2, 5,and 12 had ten or fewer species, but no transects had less than 10 species in 2005.The transects with <strong>the</strong> lowest numbers of species in 2005 were 1 and 2 which had 11and 12 species per transect respectively.35
Relative percent cover120.0100.080.060.040.020.00.0100.097.2 97.1 95.189.0Relative percent coverVegetated Bare ground90.087.7 89.0 87.8 85.281.376.894.8 98.8 89.423.218.71011 12.3 14.8 11 12.210.62.8 2.94.95.201.21 5 3 9 4 7 11 12 13 6 14 15 2 8 10annualgrasslandnativegrasslandOLM OTB SVSF wetlandHabitat type and transect numberFigure 6-a. Relative percent cover of vegetation and bare ground calculated from transectsplaced in different habitat types in <strong>the</strong> Glenwood Preserve, 2005.Relative percent cover120.0native speciesnon-native speciesRelative percent cover100.080.060.040.020.00.093.07.012.787.432.268.221.778.50.0100.077.622.650.649.233.766.41 5 3 9 4 7 11 12 13 6 14 15 2 8 102.897.126.373.133.766.412.387.631.568.513.586.424.875.4annualgrasslandnativegrasslandOLM OTB SVSF wetlandHabitat type and transect numberFigure 6-b. Relative percent cover of native and non-native species calculated from transects placedin different habitat types at <strong>the</strong> Glenwood Preserve, 2005.
Relative percent cover100.090.080.070.060.050.040.030.020.010.00.0Relative percent cover94.2 Grasses, sedges, and rushes88.784.273.675.477.363.369.767.361.165.853.046.8Forbs88.878.774.436.839.134.130.732.625.224.425.622.821.515.811.411.16.01 5 3 9 4 7 11 12 13 6 14 15 2 8 10annual grasslandnativegrasslandOLM OTB SVSF wetlandHabitat type and transect numberFigure 6-c. Relative percent cover of grasses, sedges, and rushes compared to forbs calculated fromtransects placed in different habitat types on <strong>the</strong> Glenwood Preserve, 2005.Number of species302520151050Nuber of speciesNon-native grasses, sedges, and rushesNon-native forbsNative grasses, sedges, and rushes5Native forbs57675 372 420674415458736 480401490811014771081971456161011231201 5 3 9 4 7 11 12 13 6 14 15 2 8 10annual grasslandnativegrasslandOLM OTB SVSF wetlandHabitat type and transect numberFigure 6-d. Species composition of transects placed in different habitat types at <strong>the</strong> GlenwoodPreserve, 2005.
7.0 OTHER SPECIAL STATUS PLANTS7.1 METHODSSurveys were conducted by WRA, Inc. in April, May and June to monitor <strong>the</strong> distributionof several special status species historically <strong>report</strong>ed to occur in <strong>the</strong> Preserve. Locationswere mapped using GPS/GIS. These species included linanthus (Linanthusparviflorus/androsaceus complex), white-tipped clover (Trifolium aff. polyodon), Gray’sclover (Trifolium barbigerum var. andrewsii, formerly T. grayi), and grasslandstebbinsoseris (Stebbinsoseris heterocarpa), all species of CNPS local concern, inaddition to Choris’s popcorn flower (Plagiobothrys chorisianus var. chorisianus, CNPSList 1B) and Mt. Diablo cottonweed (Micropus amphibolus, CNPS List 3).The Glenwood Preserve is included in designated critical habitat for <strong>the</strong> federallyendangered Scotts Valley polygonum (Polygonum hickmanii) (USFWS, FederalRegister, Vol. 68, No. 67, April 8, 2003). Habitat for this species is very similar to that of<strong>the</strong> Scotts Valley spineflower. Biotic Resources Group conducted <strong>the</strong> survey for thisspecies in May 2005.7.2 RESULTS7.2.1 Mt. Diablo cottonweedLocations of Mt. Diablo cottonweed are shown on <strong>the</strong> Preserve Map (Appendix A).Vegetation transects 6 and 9 were located near patches of Mt. Diablo cottonweed sothat future cottonweed population trends can be examined in relation to trends ingrassland plant composition.If structural characteristics (e.g. percent vegetative cover, cover of non-native vs. nativespecies, etc.) of <strong>the</strong> grassland habitat preferred by <strong>the</strong> Mt. Diablo cottonweed change ina way that is judged to be negatively impacting <strong>the</strong> species, management activities suchas changes to <strong>the</strong> grazing regime will occur.7.2.2 Gray’s cloverIndividuals of Gray’s clover were observed at two locations in <strong>the</strong> Preserve in 2003, but<strong>the</strong>y were not observed during area-wide surveys for <strong>the</strong> taxon in mid-April of 2004. Ingeneral, clovers bloomed earlier than expected in 2004, so it is possible that 2004surveys were too late to locate <strong>the</strong> species. This taxon was observed at four locations inPasture C during spring surveys in 2005 and <strong>the</strong> populations were mapped using GPSand are shown on <strong>the</strong> Preserve Map in Appendix A. It should be noted that at <strong>the</strong> statelevel CNPS rejected Trifolium grayi for listing, considering it a synonym of Trifoliumbarbigerum var. andrewsii, a common taxon.7.2.3 Choris’s popcorn flowerChoris’s popcorn flower was located in a wetland in <strong>the</strong> sou<strong>the</strong>rn part of Pasture C (seeAppendix A, Preserve Map). Approximately 10 plants were observed in two locations in38
2003. Transect 10 was located in <strong>the</strong> portion of <strong>the</strong> wetland where Choris’s popcornflower occurs so that future popcorn flower population trends can be examined inrelation to trends in wetland vegetation composition. Surveys conducted in May of 2005turned up approximately 15 indivuduals of this species located in two adjacent patchesnear transect 10.7.2.4 Scotts Valley polygonumOn May 6, 2005, during <strong>the</strong> growth and flowering period of <strong>the</strong> Scotts Valley polygonum,a census was conducted by Biotic Resources Group. As <strong>the</strong> Scotts Valley polygonumhas not been previously recorded from <strong>the</strong> Glenwood Open Space Preserve, a nearbylocality (Polo Ranch) was field checked to ensure that <strong>the</strong> field surveys were conductedat <strong>the</strong> appropriate time. Kathleen Lyons and a field assistant, Garv Hoefler, conducted<strong>the</strong> census within <strong>the</strong> known and suitable Scotts Valley spineflower habitat areas. Noindividuals of Scotts Valley polygonum were observed within <strong>the</strong> open space <strong>preserve</strong>.7.2.5 O<strong>the</strong>r rare plant speciesThe rare linanthus complex, white-tipped clover, and grassland stebbinsoseris were notobserved on <strong>the</strong> Preserve in 2003, 2004, and 2005. Care will be taken to look for <strong>the</strong>sespecies during Preserve reconnaissance surveys and surveys for Mount Diablocottonweed in future years.39
8.0 EXOTIC PEST PLANTSReconnaissance-level surveys were conducted by WRA, Inc. to monitor stands of exoticpest plants (species listed on <strong>the</strong> Cal-IPC List A or B) that may threaten sensitivehabitats and to monitor effectiveness of control activities. Although no new stands ofinvasive exotics were located during <strong>the</strong> 2005 surveys, previously known occurrencesstill exist onsite.Stands of exotic plants on Cal-IPC’s List A or B monitored on <strong>the</strong> Preserve in 2005include:• Pennyroyal (Mentha pulegium, List A-2) in <strong>the</strong> wetland swale near <strong>the</strong> south endof Pasture A.• French broom (Genista monspessulana, List A-1) located in a few locations in<strong>the</strong> Preserve: east of <strong>the</strong> wetland in Pasture C, in <strong>the</strong> middle of Pasture A, and at<strong>the</strong> east end of Pasture D. Only a few plants were present at each location.• Blackwood acacia (Acacia melanoxylon, ‘Need More Information’ List) waslocated in a few locations near <strong>the</strong> West Branch of Carbonera Creek and near<strong>the</strong> Water District Road.• Italian thistle (Carduus pycnocephalus, List B) and bull thistle (Cirsium vulgare,List B) were found in scattered locations throughout <strong>the</strong> Preserve includingacross from <strong>the</strong> corral west of <strong>the</strong> borrow area and along <strong>the</strong> Preserve fencelinenorthwest of transect five.The acacia along <strong>the</strong> water district road was cut in <strong>the</strong> summer of 2005. A landscapecontractor will remove <strong>the</strong> remaining populations of acacia and broom during <strong>the</strong> winterof 2005-2006. Thistle will continue to be monitored and efforts will be made to remove it.Percent relative cover of pennyroyal was nearly identical in 2005 (34.5%) to <strong>the</strong> percentrelative cover in 2004 (32.8%) along transect two in <strong>the</strong> wetland in Pasture A. Grazingrotation is expected to help control pennyroyal by providing periods of rest from grazingallowing increased growth of native rushes and forbs which should out compete <strong>the</strong>pennyroyal over time. If 2006 <strong>monitoring</strong> shows that grazing management is insufficientto control it, additional control measures will be implemented.40
9.0 REFERENCESArnold, R.A. 2000. Ohlone Tiger Beetle Report prepared for AmericanDream/Glenwood Limited Partners, 8 pp.California Department of Fish and Game (CDFG). 2002. Special-status wildlife andplants from <strong>the</strong> project vicinity. California Natural Diversity Database (CNDDB).California Invasive Plant Council (Cal-IPC, formerly Cal-EPPC). 1999. List of ExoticPest Plants of Greatest Ecological Concern in California.Holmes, T. and D. Arnold. A deterministic transition model for estimating a seasonalpopulation size and death rate for a closed population from transect counts. Inpreparation.U.S. Fish & Wildlife Service (USFWS). 2001. Endangered and threatened wildlife andplants; endangered status for <strong>the</strong> Ohlone tiger beetle (Cicindela ohlone). 50 DFR Part17, Federal Register 66 (192): 50340-50350.U.S. Fish and Wildlife Service (USFWS). 2002. Critical habitat designation forChorizan<strong>the</strong> robusta var. hartwegii (Scotts Valley Spineflower). 50 DFR Part 17, FederalRegister. 67(103): 37336-37353.Wetlands Research Associates, Inc. (WRA). 2003. Glenwood Open SpaceManagement Plan. Prepared for <strong>the</strong> City of Scotts Valley. June 4, 2003.41
APPENDICES42
Appendix A: Preserve Map43
Appendix B: Area Rainfall Data for 2003-2005 Growing Seasons44
Appendix B. Area rainfall data for 2003-2005 growing season.02-03 growing season 03-04 growing season 04-05 growing seasonSVWD 1 Ben Lomand 2 SVWD 1 Ben Lomand 2 SVWD 1 Ben Lomand 2Sep 0 0 0 0 0.11 0.2Oct 0 0 0.19 - 7.24 8.7Nov 5.8 7.43 3.93 4.49 3.25 4.24Dec 21.4 24.77 17.55 19.39 14.39 15.49Jan 2.77 2.52 4.44 6.14 8.3 11.83Feb 2.95 3.15 9.69 11.33 7.2 8.05Mar 2.54 2.44 1.19 1.65 10.01 10.36Apr 5.75 7.52 0.65 0.8 3.79 4.35May 1.08 1.1 0.07 0.05 2.13 2.47Jun 0.16 0.08 0 0 0.94 1.26Jul 0 0 0.06 0.01 0.02 0Aug 0 0 0 0 0 0TOTAL 42.45 49.01 37.77 43.86 57.38 66.95green values indicate above normal rainfall 3red values indicate below normal rainfall 3no color indicates value is within "normal" range 3"-" indicates no data for given period1Data obtained from Scotts Valley Water District.2Data obtained from NOAA/NCDC. Station ID: Ben Lomand No. 4.3Data compared to USDA/NRCS WETS table for Ben Lomand station.
Appendix C: Data from Vegetation Transect Monitoring45
Glenwood Preserve vegetation transects 2005Date: 6/13/05Monitor(s):Transect:GAS/SW1original transect # A2pastureAhabitatannual grasslandCoverclassr+12345Range Mean
Glenwood Preserve vegetation transects 2005Date: 6/13/05Monitor(s):GAS/SWTransect: 2original transect # A1 WetlandpastureAhabitatwetlandCover classr+12345Range Mean
Glenwood Preserve vegetation transects 2005Date: 4/7/05Monitor(s):AF and GSTransect: 3original transect # B3pastureBhabitatnative grasslandCover classr+12345Range
Glenwood Preserve vegetation transects 2005Date: 4/7/05Monitor(s):AF, GSTransect: 4original transect # B1pastureBhabitatOLM, native grasslandCover classr+12345RangeMean
Glenwood Preserve vegetation transects 2005Cover classDate: 4/21/05rMonitor(s):Transect:AF and GS5+1original transect #pasturehabitattop b/cB (11-20), C (1-10)annual grassland2345Range
Glenwood Preserve vegetation transects 2005Cover classDate: 6/24/05rMonitor(s):Transect:K. LyonsT6+1original transect #pasturehabitatCHRO-1CSVSF2345Range Mean
Glenwood Preserve vegetation transects 2005Date: 4/21/05Monitor(s):AF and GSTransect: 7original transect # OPLER 1pastureBhabitatOLMCover classr+12345Range
Glenwood Preserve vegetation transects 2005Date: 6/13/05Monitor(s):GAS/SWTransect: 8original transect # C-5pastureChabitatwetlandCover classr+12345Range Mean
Glenwood Preserve vegetation transects 2005Date: 4/7/05Monitor(s):AF and GSTransect: 9original transect # C-3pastureChabitatnative grasslandCover classr+12345Range
Glenwood Preserve vegetation transects 2005Date: 6/13/05Monitor(s):GAS/SWTransect: 10original transect # C-4pastureChabitatwetlandCoverclassr+12345Range Mean
Glenwood Preserve vegetation transects 2005Date: 3/31/05Monitor(s):AF and GSTransect: 11original transect # OTB 3pastureDhabitatOTBCover classr+12345Range
Glenwood Preserve vegetation transects 2005Date: 3/31/05Monitor(s):AF and GSTransect: 12original transect # OTB 2pastureDhabitatOTBCover classr+12345Range Mean
Glenwood Preserve vegetation transects 2005Date: 4/7/05Monitor(s):AF and GSTransect: 13original transect # OTB 1pastureDhabitatOTBCover class Ranger+12345
Glenwood Preserve vegetation transects 2005Date: 6/24/05Monitor(s):K. LyonsTransect: 14original transect # CHORO-2pastureEhabitatSVSFCoverclassr+12345Range Mean
Glenwood Preserve vegetation transects 2005Date: 6/24/05Monitor(s):K. LyonsTransect: 15original transect # CHORO-3pastureEhabitatSVSFCover classr+12345Range
Appendix D: Vegetation Transect Photos46
Left: Transect 11Photograph taken at Glenwood Preserve, 2005Right: Transect 13Photograph taken at Glenwood Preserve, 2005
Left: Transect 12Photograph taken at Glenwood Preserve, 2005Right: Transect 7Photograph taken at Glenwood Preserve, 2005
Left: Transect 1Photograph taken at Glenwood Preserve, 2005Right: Transect 8Photograph taken at Glenwood Preserve, 2005
Transect T-6, June 2005Transect T-14, June 2005
Transect T-15, June 2005
Transect T-6, June 2005Transect T-14, June 2005
Transect T-15, June 2005