FEDERATION OF EURO-ASIAN STOCK EXCHANGES SEMI ANNUAL REPORT OCTOBER 2008FEDERATION OF EURO-ASIAN STOCK EXCHANGES<strong>FEAS</strong> MEETINGSWORKING COMMITTEE MEETING –14-15 MAY 2008 – BAKU AZERBAIJANThe first working committee meeting of 2008was held in Baku, Azerbaijan on the 14-15thMay, 2008 at the invitation of the Baku StockExchange. The Working Committee focused onissues mandated by the General Assembly in2007 and The Secretariat prepared a report forparticipants to discuss.<strong>FEAS</strong> & MONTENEGRO STOCK EXCHANGECONFERENCE, A STEP FORWARD JUNE21-23, 2008 BUDVA, MONTENEGROThe Second International Conference of theMontenegro Stock Exchange (MNSE) was heldin Budva, Montenegro during 5-7 June 2008,where issues like ‘Globalization of CapitalMarkets’, ‘Main Components of Capital Marketin Europe and How to Make The South EasternCapital Markets More Competitive’, “CorporateGovernance” Banks, Insurance and The CapitalMarket – Partners and Competitors’ and‘Trading System – Resource or Capital MarketsImprovement Tool’ were discussed.MEDIA RELATIONS WORKSHOP –7-8TH JULY 2008 – ISTANBUL, TURKEY<strong>FEAS</strong> established a <strong>FEAS</strong> Training Center inIstanbul at the Istanbul SE <strong>FEAS</strong> Headquartersfacilities, to provide members with educationalopportunities and training programs. The firstactivity was held in July 7-8, 2008 as the <strong>FEAS</strong>Media Relations Workshop for <strong>FEAS</strong> memberswhere they have discussed ‘’How to interactwith Media during times of crises’’ whereseveral members and speakers from Turkishand Egyptian Media talked about the currentglobal crisis and its possible effects.The future objectives of the Media Task Forcewere described as;1. Organizing Workshops with member StockExchanges, where their Media RelationsPersonnel may discuss the Media relationsexperiences.2. Providing training to journalism students,Media Personnel and the Stock ExchangePersonnel.3. Producing an informative film on <strong>FEAS</strong>members and the <strong>FEAS</strong> Region. (Tehran StockExchange has been provided with the photos)4. Organizing an exhibition where <strong>FEAS</strong>Member Stock Exchanges will be able toprovide interesting information, have face toface meetings with the local and invited media14th General Assembly Meeting –November 9-12, 2008 – Abu Dhabi, UAEThe 14th Annual General Assembly of <strong>FEAS</strong> willbe held in Abu Dhabi, UAE on November 12thhosted by the Abu Dhabi Securities Exchange.The Affiliate Task Force Meeting, the 17thExecutive Committee meeting and a WorkingCommittee meeting will also be held prior to theGeneral Assembly.Main topics that will be discussed and decidedupon at the 14th GA are;• Adoption of the proposed 2009 mandates forthe Working committee;• The form of Publication and Distribution ofSeptember/October issue of SAR• Organizing a conference with Issuers, Brokers& Mutual Fund Managers in conjunction withthe launching of the <strong>FEAS</strong> Index• Completion of the Revenue Expense Analysisfrom 2007-2008.• Continuation of the Serial Seminars formembers of the media• Extension of the <strong>FEAS</strong> bilateral exchangeprogram between members;• Adoption of the 2009 budget, auditedstatements and the 2008 year-end forecast;• Review of the 2008 activities the status ofspecial projects with the members• Adoption of the dues schedule for 2009.The objectives for the next 5 years of <strong>FEAS</strong>activities will be taken up at the next President’sMeeting in spring of 2009. Collaborationamong <strong>FEAS</strong> members will continue until the<strong>FEAS</strong> Region gets the full recognition itdeserves as the most dynamic in developmentand the most profitable in investments. Thedual targets of creation of a common indexesfor trading of products of joint nature andfacilitation of cross border operations ofRegional Intermediaries will be the focus of<strong>FEAS</strong> pursuit.PUBLICATIONS & INFORMATION<strong>FEAS</strong> Library:The Library can be accessed through thePublications drop down menu on the mainpage at www.feas.org or through this linkhttp://www.feas.org/Library.cfm. The <strong>FEAS</strong>Library is open to experts and organizationswith financial market related material. If youwould like to make a submission to the <strong>FEAS</strong>Library, please send your electronic files andlinks to the <strong>FEAS</strong> secretariat atsecretariat@feas.org.<strong>FEAS</strong> Semi Annual Report:This publication of semi-annual activities of theFederation and its members began in 1997 andis now available electronically on the website:http://www.feas.org/Publications.cfm?Get=Yearbook&Top=Pubs.<strong>FEAS</strong> Website:The new <strong>FEAS</strong> website was launched on 31 July2002 and can be found at www.feas.org. Thenew site now contains a more concentratedemphasis on <strong>FEAS</strong> member data with profilepages (including statistics, holidays, marketpolicies and practices and direct links to theirsites), Excel downloads for all statistical dataand cross member comparisons on policies,practices and statistical data, and a NewsCenter with headlines from member markets.Newsletter:A monthly publication which includes generalsecretariat news, statistical stock, bond andother volume comparisons on monthly, year-todateand prior period bases, in addition tomarket cap, currency, number of companiestraded and index statistics. Quarterlysupplemental publications include quarterlystatistical analysis, press releases of <strong>FEAS</strong>members and headlines of <strong>FEAS</strong> activities.Archived copies of the newsletter can be foundon our websitehttp://www.feas.org/Publications.cfm?Get=Newsletter&Top=Pubs.SUBSCRIBETo subscribe for the electronic version of <strong>FEAS</strong>publications, please go to www.feas.org andclick on subscribe. Subscriptions includemonthly notifications of statistics and newsletterupdates, as well as advance notice of <strong>FEAS</strong>events and activities.PAGE 6
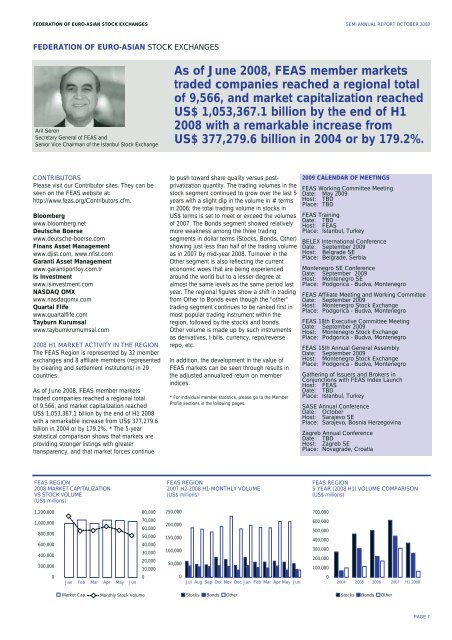
FEDERATION OF EURO-ASIAN STOCK EXCHANGES SEMI ANNUAL REPORT OCTOBER 2008FEDERATION OF EURO-ASIAN STOCK EXCHANGESAril SerenSecretary General of <strong>FEAS</strong> andSenior Vice Chairman of the Istanbul Stock ExchangeAs of June 2008, <strong>FEAS</strong> member marketstraded companies reached a regional totalof 9,566, and market capitalization reachedUS$ 1,053,367.1 billion by the end of H12008 with a remarkable increase fromUS$ 377,279.6 billion in 2004 or by 179.2%.CONTRIBUTORSPlease visit our Contributor sites. They can beseen on the <strong>FEAS</strong> website at:http://www.feas.org/Contributors.cfm.Bloombergwww.bloomberg.netDeutsche Boersewww.deutsche-boerse.comFinans Asset Managementwww.djist.com, www.nfist.comGaranti Asset Managementwww.garantiportfoy.com.trIs Investmentwww.isinvestment.comNASDAQ OMXwww.nasdaqomx.comQuartal Flifewww.quartalflife.comTayburn Kurumsalwww.tayburnkrumumsal.com2008 H1 MARKET ACTIVITY IN THE REGIONThe <strong>FEAS</strong> Region is represented by 32 memberexchanges and 8 affiliate members (representedby clearing and settlement institutions) in 29countries.As of June 2008, <strong>FEAS</strong> member marketstraded companies reached a regional totalof 9,566, and market capitalization reachedUS$ 1,053,367.1 billion by the end of H1 2008with a remarkable increase from US$ 377,279.6billion in 2004 or by 179.2%. * The 5-yearstatistical comparison shows that markets areproviding stronger listings with greatertransparency, and that market forces continueto push toward share quality versus postprivatizationquantity. The trading volumes in thestock segment continued to grow over the last 5years with a slight dip in the volume in # termsin 2006; the total trading volume in stocks inUS$ terms is set to meet or exceed the volumesof 2007. The Bonds segment showed relativelymore weakness among the three tradingsegments in dollar terms (Stocks, Bonds, Other)showing just less than half of the trading volumeas in 2007 by mid-year 2008. Turnover in theOther segment is also reflecting the currenteconomic woes that are being experiencedaround the world but to a lesser degree atalmost the same levels as the same period lastyear. The regional figures show a shift in tradingfrom Other to Bonds even though the “other”trading segment continues to be ranked first inmost popular trading instrument within theregion, followed by the stocks and bonds.Other volume is made up by such instrumentsas derivatives, t-bills, currency, repo/reverserepo, etc.In addition, the development in the value of<strong>FEAS</strong> markets can be seen through results inthe adjusted annualized return on memberindices.* For individual member statistics, please go to the MemberProfile sections in the following pages.2009 CALENDAR OF MEETINGS<strong>FEAS</strong> Working Committee MeetingDate: May 2009Host: TBDPlace: TBD<strong>FEAS</strong> TrainingDate: TBDHost: <strong>FEAS</strong>Place: Istanbul, TurkeyBELEX International ConferenceDate: September 2009Host: Belgrade SEPlace: Belgrade, SerbiaMontenegro SE ConferenceDate: September 2009Host: Montenegro SEPlace: Podgorica - Budva, Montenegro<strong>FEAS</strong> Affiliate Meeting and Working CommitteeDate: September 2009Host: Montenegro Stock ExchangePlace: Podgorica - Budva, Montenegro<strong>FEAS</strong> 18th Executive Committee MeetingDate: September 2009Host: Montenegro Stock ExchangePlace: Podgorica - Budva, Montenegro<strong>FEAS</strong> 15th Annual General AssemblyDate: September 2009Host: Montenegro Stock ExchangePlace: Podgorica - Budva, MontenegroGathering of Issuers and Brokers inConjunctions with <strong>FEAS</strong> Index LaunchHost: <strong>FEAS</strong>Date: TBDPlace: Istanbul, TurkeySASE Annual ConferenceDate: OctoberHost: Sarajevo SEPlace: Sarajevo, Bosnia HerzegovinaZagreb Annual ConferenceDate: TBDHost: Zagreb SEPlace: Novagrade, Croatia<strong>FEAS</strong> REGION2008-MARKET CAPITALIZATIONVS STOCK VOLUME(US$ millions)<strong>FEAS</strong> REGION2007 H2-2008 H1-MONTHLY VOLUME(US$ millions)<strong>FEAS</strong> REGION5-YEAR (2008 H1) VOLUME COMPARISON(US$ millions)1,200,00080,000250,000700,0001,000,000800,000600,000400,000200,0000Jan Feb Mar Apr May Jun70,00060,00050,00040,00030,00020,00010,0000200,000150,000100,00050,0000600,000500,000400,000300,000200,000100,0000Jul Aug Sep Oct Nov Dec Jan Feb Mar Apr May Jun2004 2005 2006 2007 H1 2008Market Cap.Monthly Stock VolumeStocksBondsOtherStocksBondsOtherPAGE 7


