Greengates - The Diocese of Bradford
Greengates - The Diocese of Bradford
Greengates - The Diocese of Bradford

You also want an ePaper? Increase the reach of your titles
YUMPU automatically turns print PDFs into web optimized ePapers that Google loves.
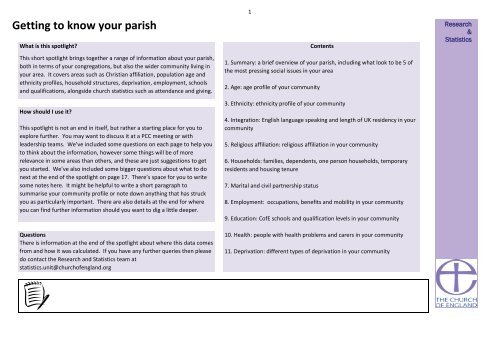
Getting to know your parishWhat is this spotlight?1ContentsResearch&StatisticsThis short spotlight brings together a range <strong>of</strong> information about your parish,both in terms <strong>of</strong> your congregations, but also the wider community living inyour area. It covers areas such as Christian affiliation, population age andethnicity pr<strong>of</strong>iles, household structures, deprivation, employment, schoolsand qualifications, alongside church statistics such as attendance and giving.How should I use it?This spotlight is not an end in itself, but rather a starting place for you toexplore further. You may want to discuss it at a PCC meeting or withleadership teams. We’ve included some questions on each page to help youto think about the information, however some things will be <strong>of</strong> morerelevance in some areas than others, and these are just suggestions to getyou started. We’ve also included some bigger questions about what to donext at the end <strong>of</strong> the spotlight on page 17. <strong>The</strong>re’s space for you to writesome notes here. It might be helpful to write a short paragraph tosummarise your community pr<strong>of</strong>ile or note down anything that has struckyou as particularly important. <strong>The</strong>re are also details at the end for whereyou can find further information should you want to dig a little deeper.Questions<strong>The</strong>re is information at the end <strong>of</strong> the spotlight about where this data comesfrom and how it was calculated. If you have any further queries then pleasedo contact the Research and Statistics team atstatistics.unit@church<strong>of</strong>england.org1. Summary: a brief overview <strong>of</strong> your parish, including what look to be 5 <strong>of</strong>the most pressing social issues in your area2. Age: age pr<strong>of</strong>ile <strong>of</strong> your community3. Ethnicity: ethnicity pr<strong>of</strong>ile <strong>of</strong> your community4. Integration: English language speaking and length <strong>of</strong> UK residency in yourcommunity5. Religious affiliation: religious affiliation in your community6. Households: families, dependents, one person households, temporaryresidents and housing tenure7. Marital and civil partnership status8. Employment: occupations, benefits and mobility in your community9. Education: C<strong>of</strong>E schools and qualification levels in your community10. Health: people with health problems and carers in your community11. Deprivation: different types <strong>of</strong> deprivation in your community
Parish <strong>of</strong>: <strong>Greengates</strong>: St John the EvangelistParish Code: 540053PARISH OVERVIEWDeaneryCALVERLEYArchdeaconry BRADFORD<strong>Diocese</strong><strong>Bradford</strong>Included Churches604053 <strong>Greengates</strong>: St John the Evangelist2Research&StatisticsFresh ExpressionsSorry, no Fresh Expressions listed for this parish.Parishioners at glancePopulation2001 3 5,0002011 2 5,500Proportion Christian2001 3 73%2011 2 58%Age Pr<strong>of</strong>ile (2011 2 )Parish0-4 7%5-15 13%16-64 67%65 + 14%Age GroupIssues to look out for in your parishAnnual Parochial ReturnsOctober WeeklyAttendance 13002502001501005002011 Tax Efficient PlannedGiving/person/week 1£62007 2008 2009 2010 20112011 ElectoralRoll 1342011 ParishShare Paid 1£4,800HighestweekAverageLowestWeekElderly DeprivationPensioner PovertyEducationLow/No QualificationsEnvironment
Demographics: AGE PROFILE AND ATTENDANCE AT SERVICES90 & over85 - 8975 - 8465 - 7460 - 6445 - 5930 - 4425 - 2920 - 2418 - 1916 - 171510 - 148 - 95 - 70 - 4Age pr<strong>of</strong>ile <strong>of</strong> parish populations 2001 3 & 2011 230% 20% 10% 0% 10% 20% 30%3Parish2011Parish2001Research&Statistics90 & over75 - 8960 - 7445 - 5930 - 4490 & over75 - 8960 - 7445 - 5930 - 4490 & over75 - 8960 - 7445 - 5930 - 4415 - 2915 - 2915 - 290 - 140 - 140 - 140% 5% 10% 15% 20% 25%0% 10% 20% 30%0% 5% 10% 15% 20% 25%Parish 2011 2 Deanery 2011 2 <strong>Diocese</strong> 2011 2Does the age pr<strong>of</strong>ile <strong>of</strong> your congregation match that <strong>of</strong> your parish? Are you engaging with theparish's largest demographic: those aged 30 - 44?
4Demographics: AGE PROFILE AND ATTENDANCE AT SERVICESComparable Age pr<strong>of</strong>ile <strong>of</strong> Adults18 - 44 45 - 64Diocesan Congregation 4 (2007)12% 33%Diocesan Population 2 (2011) 36% 24%65 +55%15%Age0 - 45 - 1516 - 6465 +Parish Population 2 (2011)(nearest 50)3507003,650750Highest WeeksAttendance 2011 1 4348Infant Baptisms2011 1 7Research&StatisticsDiocesan Core Congregation Age Pr<strong>of</strong>ile 4 (2007)55%19%14%6%6%0% 10% 20% 30% 40% 50% 60%Does the age pr<strong>of</strong>ile <strong>of</strong> your congregation match that <strong>of</strong> your parish?
HOUSEHOLDS, LIFESTYLE AND THE COMMUNITY IHousehold Spaces 2 2011With at least one usual resident i.e. not vacant 98%Caravan or other mobile or temporary structure0%8Research&StatisticsTenure 2 Social rented as a percentage <strong>of</strong> all households 2 20%1500 400 500Owner occupied households(including shared ownership)Private Rented households(including those living rent free)Social Rented householdsWho lives in your parish? Are there issues with access to housing? How permenant are yourparishioners?
9HOUSEHOLDS, LIFESTYLE AND THE COMMUNITY IIHousehold composition in your parish 2 Allpercentages are <strong>of</strong> the total number <strong>of</strong>households with residents. <strong>The</strong> smaller piecharts show the breakdown <strong>of</strong> a section <strong>of</strong>the larger ones. You can use the colours tomatch.Nondependentchildren 3%Other 4%All aged 65and over
Marital and civil partnership statusNot living in a couple: Widowed or surviving partner from a same-sex civilpartnership10322001 2011Research&StatisticsNot living in a couple: Divorced or formerly in a same-sex civil partnership which isnow legally dissolvedNot living in a couple: Separated (but still legally married or still legally in a same-sexcivil partnership)Not living in a couple: Married or in a registered same-sex civil partnershipNot living in a couple: Single (never married or never registered a same-sex civilpartnership)Living in a couple: CohabitingLiving in a couple: Married or in a registered same-sex civil partnership60% 50% 40% 30% 20% 10% 0% 10% 20% 30% 40% 50%Your Parish Churches held 14 Weddings & No Blessings in 20106 Weddings & No Blessings in 2011Do you hold many weddings in your parish? How is your parish supporting those in the abovecategories?
EMPLOYMENT AND SOCIAL GRADE, LIFESTYLE11Research&StatisticsNS-SeC <strong>of</strong> Household Reference Person 2 £19,747Not classified (Full-time students or not classifiable for other reasons)Never worked and long-term unemployedRoutine occupationsSemi-routine occupationsLower supervisory and technical occupationsSmall employers and own account workersIntermediate occupationsLower managerial, administrative and pr<strong>of</strong>essional occupationsHigher managerial, administrative and pr<strong>of</strong>essional occupations0% 5% 10% 15% 20% 25%Parish Income 1 £17,525Finance Returns 2011 2010Tax Efficient Planned Giving (TEPG) 1£2,953 £4,729TEPG/PERSON/WEEK 1Other planned giving 1Other/person/week 1Parish Expenditure 1Parish Share Assessed 1Parish Share Paid 1 £6£2,257£4£14,764£7,940£4,800£9£2,487£3£23,207£9,127£4,800<strong>The</strong> National Statistics Socio-economic Classification (NS-SeC) is an occupationallybased classification but has rules to provide coverage <strong>of</strong> the whole adult population.<strong>The</strong> NS-SeC provides an indication <strong>of</strong> socio-economic position based on occupation.It is an Office for National Statistics standard classification. To assign a person aged16 to 74 to an NS-SeC category their occupation title is combined with informationabout their employment status, whether they are employed or self-employed andwhether or not they supervise other employees. Full-time students are recorded inthe' full-time students' category regardless <strong>of</strong> whether they are economically activeor not.How are your parish finances? How does this compare to your community pr<strong>of</strong>ile?
12EMPLOYMENT AND SOCIAL GRADE, LIFESTYLEFull-time: 49 ormore hoursworked12%Hours Worked 2Part-time: 15hours or lessworked7%Proportion <strong>of</strong> population aged 60+ who are inreceipt <strong>of</strong> the Guaranteed part <strong>of</strong> PensionCredit 5 29%Research&StatisticsPart-time: 16 to 30hours worked20%Proportion <strong>of</strong> working age persons (16-74) withno qualifications 2 29%Proportion <strong>of</strong> working age population who arein receipt <strong>of</strong> a key out-<strong>of</strong>-work benefit 511%Full-time: 31 to 48hours worked62%Part-time: 15 hours or less workedFull-time: 31 to 48 hours workedPart-time: 16 to 30 hours workedFull-time: 49 or more hours workedHousehold Mobility 2No access to a car or vanAccess to at least 1 car or vanHouseholds24%76%How much free time do residents <strong>of</strong> your parish have? How accessible are your churches to thosewith/without cars?
EDUCATION AND SCHOOLSChurch Schools in the parish13Research&StatisticsSorry, we do not currently haveany Church Schools listed for thisparish.Parish 2 2011 (proportion <strong>of</strong> 16+ population)National 2 2011 (proportion <strong>of</strong> 16+ population)3%6%No qualifications (No formal qualifications)25%27%27%22%Level 1 qualifications (1-4 GCSEs or equivalent)Level 2 qualifications (5 GCSEs or equivalent)Apprenticeships12%4%15%13%12%4%15%13%Level 3 qualifications (2 or more A-levels orequivalent )Level 4 qualifications and above (Bachelorsdegree or equivalent, and higher qualifications)Other qualifications (including foreignqualifications)How qualified are residents <strong>of</strong> your parish? What Church <strong>of</strong> England schools are available?
HEALTH14Research&Statistics01 - 19Hours per week <strong>of</strong> provision <strong>of</strong> unpaid care 2 1% 3%20 - 4950 +90% 6%General health 21%5% 13% 35% 46%Very bad health Bad health Fair healthGood healthVery good healthLong-term health problem or disability 29% 9% 82%Day-to-day activities limited a lot Day-to-day activities limited a little Day-to-day activities not limitedAre there people in your parish with health problems? Is there anything you can do to assist withday-to-day activities <strong>of</strong> those who have health problems?
DEPRIVATION AND KEY ISSUES AFFECTING PARISHIONERSYou parish can be categorised as in the most or least deprived 10% or 50% <strong>of</strong> all parishes within the diocese and <strong>of</strong> all parishes nationallyDeprivation Indicator Score Diocesan Position National PositionLife Expectancy at birth (boys) 6 (1999-2003)7650% least deprived 50% most deprivedLife expectancy at birth (girls) 6 (1999-2003)8050% most deprived 50% most deprivedLife expectancy at birth can give an idea <strong>of</strong> overall quality <strong>of</strong> life. Life expectancy is an average. Women tend to have greater life expectancy. Life expectany can be affected by family history, marital status, economic status,physique, exercise, diet, drug use including smoking and alcohol consumption, disposition, education, environment, sleep, climate, and health care.15Research&StatisticsProportion <strong>of</strong> the population aged 60+ who are in receipt <strong>of</strong>the Guaranteed part <strong>of</strong> Pension Credit 5 (2012)29% 50% most deprived 10% most deprivedPension Credit is an income related benefit made up <strong>of</strong> 2 parts - Guarantee Credit and Savings Credit. <strong>The</strong> guaranteed part tops up weekly income if it’s below £142.70 (single people) or £217.90 (couples) so those whoreceive this are on a low income. This statistic only covers people living in private households, and not residential institutions (such as nursing homes).Percentage <strong>of</strong> working age persons (16-74) with noqualifications 2 (2011)Percentage <strong>of</strong> Children under 16 in Poverty 7 (2010)Index <strong>of</strong> Multiple Deprivation (IMD) 8 (2010)Proportion <strong>of</strong> the working age population who are in receipt<strong>of</strong> a key out-<strong>of</strong>-work benefit 5 (2012)Social rented as a percentage <strong>of</strong> all households 2 (2011)Lone Parent Households as a percentage <strong>of</strong> all householdswith children 2 (2011)29% 50% most deprived22%28.920%50% most deprived50% most deprivedA low-level <strong>of</strong> skill or educational attainment is one indicator <strong>of</strong> social disadvantage. Qualifications may make it easier to find employment. Learning also helps promote active citizenship and combat social exclusion.50% most deprived<strong>The</strong> proportion <strong>of</strong> children in families in receipr <strong>of</strong> either out <strong>of</strong> work benefits or tax credits where their reported income is less than 60% median income. Poor children may be excluded from participating in society. <strong>The</strong>y may be unable to afford schooltrips and activities; school uniforms or warm winter clothes, be unable to go swimming, have friends round for tea or celebrate their birthdays. Many will never have a holiday. Children who grow up poor are more likely to leave school withoutqualifications, have lower employment chances, thus restricting their ability to get a good job and financially contribute to society.Deprivation is considered to be a multi-dimensional problem, encompassing a range <strong>of</strong> domains such as financial, health, education, services or crime. continuous measure <strong>of</strong> relative deprivation therefore there is no definitive point on the scale belowwhich areas are considered to be deprived and above which they are not.While being in the most deprived 10% may indicate financial disadvantage, it could equally be due to isolated living.11%Number <strong>of</strong> people aged 16 to State Pension age claiming: Jobseeker’s Allowance (JSA), Employment and Support Allowance (ESA), Incapacity Benefit (IB), Income Support (IS) (as a lone parent or in the “other” category),Other income related benefits.Social housing is housing that is let at low rents and on a secure basis to people in housing need. It is generally provided by councils and not-for-pr<strong>of</strong>it organisations such as housing associations. Vulnerable groups are <strong>of</strong>tenconcentrated in the social housing sector, with low rates <strong>of</strong> employment and low income levelsChildren in single parent families have a much higher risk <strong>of</strong> living in poverty than children in couple families. Single parents may rely on informal childcare.29%50% most deprived50% most deprived10% most deprived10% most deprived50% most deprived50% most deprived50% most deprived50% most deprivedWhat are the particular issues that affect your parish? Are you doing anything to address these?
DEPRIVATION AND KEY ISSUES AFFECTING PARISHIONERSIt is important to note that these statistics are a measure <strong>of</strong> deprivation, not affluence, and to recognise that not every person in a highly deprived area will themselves bedeprived. Equally, there will be some deprived people living in the least deprived areas.Deprivation covers a broad range <strong>of</strong> issues and refers to unmet needs caused by a lack <strong>of</strong> resources <strong>of</strong> all kinds, not just financial. <strong>The</strong> English Indices <strong>of</strong> Deprivationattempt to measure a broader concept <strong>of</strong> multiple deprivation, made up <strong>of</strong> several distinct dimensions, or domains, <strong>of</strong> deprivation. Seven domains <strong>of</strong> deprivation arecombined to produce the overall Index <strong>of</strong> Multiple Deprivation. Each domain contains a number <strong>of</strong> component indicators. <strong>The</strong> English Indices <strong>of</strong> Deprivation are acontinuous measure <strong>of</strong> relative deprivation therefore there is no definitive point on the scale below which areas are considered to be deprived and above which they arenot. Deprived areas have been defined in this release as those containing LSOAs that are amongst the 10 per cent most deprived in England according to the overall Index<strong>of</strong> Multiple Deprivation.AverageNumber <strong>of</strong> LSOAs amongst Number <strong>of</strong> LSOAs amongstIMD Subdomains 8 (2010) Score for Diocesan position National position most deprived*least deprived*parish1% 5% 10% 1% 5% 10%Overall IMD 28.9 50% most deprived 50% most deprived 0 1 0 0 0 0INCOME0.2 50% most deprived 50% most deprived 0 0 1 0 0 0EMPLOYMENT0.1 50% most deprived 50% most deprived 0 1 0 0 0 0HEALTH DEPRIVATION ANDDISABILITY0.5 50% most deprived 50% most deprived 0 0 2 0 0 0EDUCATION SKILLS AND TRAINING 38.2 50% most deprived 10% most deprived 1 1 1 0 0 016Research&StatisticsBARRIERS TO HOUSING AND SERVICESCRIME AND DISORDERLIVING ENVIRONMENTIndoors Sub-domainOutdoors Sub-domainGeographical Barriers Sub-domainWider Barriers Sub-domain12.50.437.039.931.39.715.310% least deprived50% most deprived50% most deprived50% most deprived50% most deprived50% least deprived50% most deprived10% least deprived50% most deprived50% most deprived50% most deprived50% most deprived50% least deprived50% most deprived0000000020200000210000 00 00 00 00 00 00 00000000Children/Young People Sub-domain42.3 50% most deprived 10% most deprived 1 1 2Skills Sub-domain 34.2 50% most deprived 10% most deprived 0 1 1Income Deprivation AffectingChildren Index0.2 50% most deprived 50% most deprived 0 0 1Income Deprivation Affecting OlderPeople Index0.3 50% most deprived 10% most deprived 0 1 2*<strong>The</strong>re are 6 full or partial LSOAs included in this parish0 0 00 0 00 0 10 0 0What are the particular issues that affect your parish? Are you doing anything to address these?
WHAT TO DO NEXTWhat to do next?This spotlight has given you some information about your parish both in terms <strong>of</strong> your own church congregations and your local community. This is not anend in itself, but rather a starting place for you to explore further. Questions to consider might include:• What does our congregation look like?• How does it compare to the local population?• What other churches are there in the area? What parts <strong>of</strong> the community do they reach? Which parts <strong>of</strong> the community are being missed?• What other local organisations or centres are there, that might bring people into our parish? Examples might be Hospitals or health centres, prisons, jobcentres, homeless shelters, schools, charities, mother and toddler groups, uniformed organisations, community centres, libraries, shops, <strong>of</strong>fices, stations?How can we interact with these people?• What areas <strong>of</strong> our parish do we know well or less well?• How does the local community change between weekdays and weekends? How do our services and events fit with the shifting local population?• Is our website/'A Church Near You' pr<strong>of</strong>ile up to date?• Are our records up to date?****************************************************************************************************************************17Research&StatisticsYour notes
Sources <strong>of</strong> further informationResearch & Statistics GIShttp://www.church<strong>of</strong>england.org/about-us/facts-stats/research-statistics/census-2011.aspxChurch Urban Fundwww.cuf.org.ukA Church Near Youwww.achurchnearyou.comPolice.uk - Local crime and policing information for England and Waleshttp://www.police.uk/ONS - Neighbourhood Statisticshttp://neighbourhood.statistics.gov.uk/Hint: Use the summary boxUpMyStreet - UK house prices, property, crime, local neighbourhood & schoolshttp://www.upmystreet.com/Hint: Use the "My Neighbourhood" tab<strong>The</strong> network <strong>of</strong> Public Health Observatories - Health Pr<strong>of</strong>ileshttp://www.apho.org.uk/default.aspx?QN=HP_FINDSEARCH2011Public Health Observatories - APHO JSNA Datasets (<strong>The</strong> datasets are intended to cover arange <strong>of</strong> issues, focused on underlying determinants <strong>of</strong> health and conditions which accountfor substantial numbers <strong>of</strong> preventable diseases and deaths.)18Research&Statisticswww.apho.org.uk/resource/view.aspx?RID=91736<strong>The</strong> Poverty Site - Geographic Analysiswww.poverty.org.uk/summary/regional.shtmlAboutMyArea - <strong>The</strong> local interactive site - news, reviews, what's on, events, businesseshttp://www.aboutmyarea.co.uk/Homeless Pages - Information, Research and Publications on homelessnesshttp://www.homelesspages.org.uk/MurderMap - London Homicide Reported Direct from <strong>The</strong> Old Baileyhttp://www.murdermap.co.uk/London Street Gangs - Territory maps and background informationhttp://www.londonstreetgangs.com/Hint: Scroll to the bottom <strong>of</strong> the "Gang Maps" page to see boundaries.
ABOUT THIS DATA1 Annual parochial returns<strong>The</strong>se have been collected annually between 2007 and 2011 by the Research and Statistics team, Archbishops’ Council2 ONS Census data 2011Estimated using OA level data sourced from ONS Census Data 2011, ONS3 ONS Census data 2001Estimated using OA level data sourced from ONS Census Data 2001, ONS4 2007 Church Diversity Surveyhttp://www.church<strong>of</strong>england.org/about-us/facts-stats/research-statistics/clergydiversityaudit2005linkpage.aspx5 DWPProportion <strong>of</strong> the population aged 60+ who are in receipt <strong>of</strong> the Guaranteed part <strong>of</strong> Pension Credit (August 2012)Estimated using LSOA level data sourced from http://83.244.183.180/NESS/BEN/iben.htmProportion <strong>of</strong> the working age population who are in receipt <strong>of</strong> a key out-<strong>of</strong>-work benefit (Q3 2012)Estimated using OA level data from DWP Information, Governance and Security Directorate fromhttp://statistics.dwp.gov.uk/asd/asd1/tabtools/census_output_area_data/index.php?page=census_output_area_data6 ONSLife Expectancy at birth (boys) (1999-2003)Estimated using ward level data from ONS.Life expectancy at birth (girls) (1999-2003)Estimated using ward level data from ONS.7 HMRCPercentage <strong>of</strong> Children under 16 in Poverty (2009)Estimated using LSOA level data from http://www.hmrc.gov.uk/statistics/child-poverty-stats.htm8 Department for Communities and Local GovernmentIMD (2010)Estimated using LSOA level data from Communities and Local Government, 2010.https://www.gov.uk/government/uploads/system/uploads/attachment_data/file/6320/1870718.pdfWhen analysing data, it is important to consider that some parishes are very small and proportions may be very large even where very few cases meet the criteria.When quoting figures derived from this data, care should be taken with the level <strong>of</strong> accuracy quoted.Methodology: Government data is published on government boundaries that do not match ecclesiastical boundaries. In order to produce parish population and demographicestimates we have worked with the ONS to use a best fit modelling process. As such, these statistics can only be considered estimates and, particularly in very diverse areas, arebest used in the context <strong>of</strong> local knowledge. Where parish populations are sparse the figures for government areas overlapping the parish are used.Parish estimates from the census have been calculated using the census output area data published by the ONS. <strong>The</strong>se are provisional estimates, and when more granular data atpostcode level is available, will be revised. Estimates have been modelled by allocating the population weighted centroid <strong>of</strong> each output area to the parish within which it falls.This means that some parishes have not been allocated population, however proportions for demographic variables have been calculated based on the output areas overlayingthe parish.For further information about this process, please contact statistics.unit@church<strong>of</strong>england.org.19Research&StatisticsContains public sector information licensed under the Open Government Licence v1.0 http://www.nationalarchives.gov.uk/doc/open-government-licence/