office market munich - BNP PARIBAS Real Estate Deutschland
office market munich - BNP PARIBAS Real Estate Deutschland
office market munich - BNP PARIBAS Real Estate Deutschland

Create successful ePaper yourself
Turn your PDF publications into a flip-book with our unique Google optimized e-Paper software.
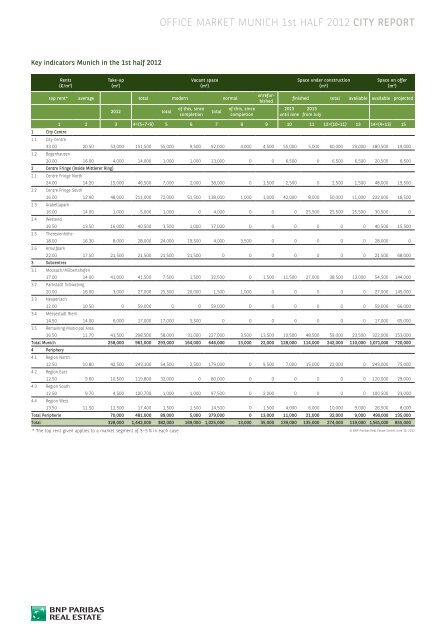
Key indicators Munich in the 1st half 2012<br />
Rents<br />
(€/m²)<br />
1 City Centre<br />
1.1 City Centre<br />
Take-up<br />
(m²)<br />
Vacant space<br />
(m²)<br />
top rent* average total modern normal<br />
2012 total<br />
of this, since<br />
completion<br />
total<br />
of this, since<br />
completion<br />
unrefurbished<br />
2013<br />
until June<br />
Space under construction<br />
(m²)<br />
Space on offer<br />
(m²)<br />
finished total available available projected<br />
2013<br />
from July<br />
1 2 3 4=(5+7+9) 5 6 7 8 9 10 11 12=(10+11) 13 14=(4+13) 15<br />
33.00 20.50 53,000 151,500 55,000 9,500 92,000 4,000 4,500 55,000 5,000 60,000 29,000 180,500 19,000<br />
1.2 Bogenhausen<br />
20.00 16.00 4,000 14,000 1,000 1,000 13,000 0 0 6,500 0 6,500 6,500 20,500 6,500<br />
2 Centre Fringe (inside Mittlerer Ring)<br />
2.1 Centre Fringe North<br />
24.00 14.20 15,000 46,500 7,000 2,000 38,000 0 1,500 2,500 0 2,500 1,500 48,000 19,500<br />
2.2 Centre Fringe South<br />
16.00 12.90 48,000 211,000 72,000 51,500 138,000 1,000 1,000 42,000 8,000 50,000 11,000 222,000 18,500<br />
2.3 Arabellapark<br />
16.00 14.00 1,000 5,000 1,000 0 4,000 0 0 0 25,500 25,500 25,500 30,500 0<br />
2.4 Westend<br />
16.50 13.50 16,000 40,500 3,500 1,000 37,000 0 0 0 0 0 0 40,500 15,500<br />
2.5 Theresienhöhe<br />
18.00 16.30 8,000 28,000 24,000 19,500 4,000 3,500 0 0 0 0 0 28,000 0<br />
2.6 Arnulfpark<br />
22.00 17.50 21,500 21,500 21,500 21,500 0 0 0 0 0 0 0 21,500 68,000<br />
3 Subcentres<br />
3.1 Moosach/Milbertshofen<br />
17.00 14.00 41,000 41,500 7,500 1,500 32,500 0 1,500 11,500 27,000 38,500 13,000 54,500 144,000<br />
3.2 Parkstadt Schwabing<br />
20.00 16.00 3,000 27,000 25,500 20,000 1,500 1,000 0 0 0 0 0 27,000 145,000<br />
3.3 Neuperlach<br />
12.00 10.50 0 59,000 0 0 59,000 0 0 0 0 0 0 59,000 66,000<br />
3.4 Messestadt Riem<br />
14.50 14.00 6,000 17,000 17,000 5,500 0 0 0 0 0 0 0 17,000 65,000<br />
3.5 Remaining Municipal Area<br />
16.50 11.70 41,500 298,500 58,000 31,000 227,000 3,500 13,500 10,500 48,500 59,000 23,500 322,000 153,000<br />
Total Munich 258,000 961,000 293,000 164,000 646,000 13,000 22,000 128,000 114,000 242,000 110,000 1,071,000 720,000<br />
4 Periphery<br />
4.1 Region North<br />
12.50 10.80 42,500 243,100 54,500 2,500 179,000 0 9,500 7,000 15,000 22,000 0 243,000 75,000<br />
4.2 Region East<br />
12.50 9.60 10,500 119,800 32,000 0 80,000 0 0 0 0 0 0 120,000 29,000<br />
4.3 Region South<br />
12.50 9.70 4,500 100,700 1,000 1,000 97,500 0 2,000 0 0 0 0 100,500 23,000<br />
4.4 Region West<br />
13.50 11.50 12,500 17,400 1,500 1,500 14,500 0 1,500 4,000 6,000 10,000 9,000 26,500 8,000<br />
Total Peripherie 70,000 481,000 89,000 5,000 379,000 0 13,000 11,000 21,000 32,000 9,000 490,000 135,000<br />
Total 328,000 1,442,000 382,000 169,000 1,025,000 13,000 35,000 139,000 135,000 274,000 119,000 1,561,000 855,000<br />
* The top rent given applies to a <strong>market</strong> segment of 3–5 % in each case.<br />
OFFICE MARKET MUNICH 1st HALF 2012 CITY REPORT<br />
© <strong>BNP</strong> Paribas <strong>Real</strong> <strong>Estate</strong> GmbH, June 30, 2012