Annual Report 2011 - Colombo Stock Exchange
Annual Report 2011 - Colombo Stock Exchange
Annual Report 2011 - Colombo Stock Exchange
- No tags were found...
You also want an ePaper? Increase the reach of your titles
YUMPU automatically turns print PDFs into web optimized ePapers that Google loves.
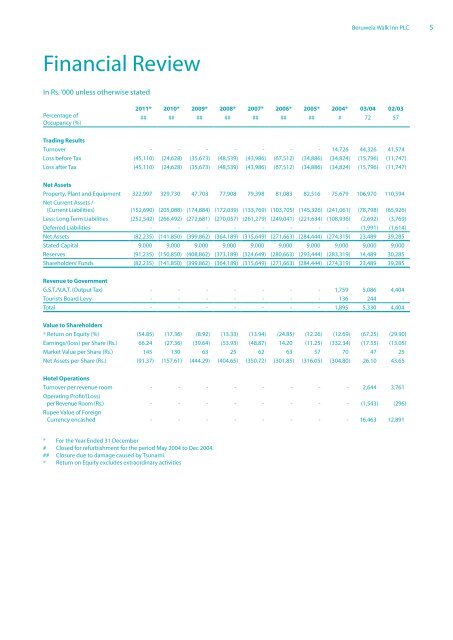
Beruwela Walk Inn PLC 5Financial ReviewIn Rs. ‘000 unless otherwise statedPercentage ofOccupancy (%)<strong>2011</strong>* 2010* 2009* 2008* 2007* 2006* 2005* 2004* 03/04 02/03## ## ## ## ## ## ## # 72 57Trading ResultsTurnover - - - - - - - 14,726 44,326 41,574Loss before Tax (45,110) (24,628) (35,673) (48,539) (43,986) (67,512) (34,886) (34,824) (15,796) (11,747)Loss after Tax (45,110) (24,628) (35,673) (48,539) (43,986) (67,512) (34,886) (34,824) (15,796) (11,747)Net AssetsProperty, Plant and Equipment 322,997 329,730 47,703 77,908 79,398 81,083 82,516 75,679 106,970 110,594Net Current Assets /(Current Liabilities) (152,690) (205,088) (174,884) (172,039) (133,769) (103,705) (145,326) (241,061) (78,798) (65,926)Less: Long Term Liabilities (252,542) (266,492) (272,681) (270,057) (261,279) (249,041) (221,634) (108,936) (2,692) (3,769)Deferred Liabilities - - - - - - - - (1,991) (1,614)Net Assets (82,235) (141,850) (399,862) (364,189) (315,649) (271,663) (284,444) (274,319) 23,489 39,285Stated Capital 9,000 9,000 9,000 9,000 9,000 9,000 9,000 9,000 9,000 9,000Reserves (91,235) (150,850) (408,862) (373,189) (324,649) (280,663) (293,444) (283,319) 14,489 30,285Shareholders’ Funds (82,235) (141,850) (399,862) (364,189) (315,649) (271,663) (284,444) (274,319) 23,489 39,285Revenue to GovernmentG.S.T./V.A.T. (Output Tax) - - - - - - - 1,759 5,086 4,404Tourists Board Levy - - - - - - - 136 244 -Total - - - - - - - 1,895 5,330 4,404Value to Shareholders@Return on Equity (%) (54.85) (17.36) (8.92) (13.33) (13.94) (24.85) (12.26) (12.69) (67.25) (29.90)Earnings/(loss) per Share (Rs.) 66.24 (27.36) (39.64) (53.93) (48.87) 14.20 (11.25) (332.34) (17.55) (13.05)Market Value per Share (Rs.) 145 130 63 25 62 63 57 70 47 25Net Assets per Share (Rs.) (91.37) (157.61) (444.29) (404.65) (350.72) (301.85) (316.05) (304.80) 26.10 43.65Hotel OperationsTurnover per revenue room - - - - - - - - 2,644 3,761Operating Profit/(Loss)per Revenue Room (Rs.) - - - - - - - - (1,543) (296)Rupee Value of ForeignCurrency encashed - - - - - - - - 16,463 12,891* For the Year Ended 31 December# Closed for refurbishment for the period May 2004 to Dec 2004.## Closure due to damage caused by Tsunami.@Return on Equity excludes extraordinary activities


