An Introduction to The CBOE S&P 500 PutWrite Index - CBOE.com
An Introduction to The CBOE S&P 500 PutWrite Index - CBOE.com
An Introduction to The CBOE S&P 500 PutWrite Index - CBOE.com
- No tags were found...

You also want an ePaper? Increase the reach of your titles
YUMPU automatically turns print PDFs into web optimized ePapers that Google loves.
<strong>An</strong> <strong>Introduction</strong> <strong>to</strong><strong>The</strong> <strong>CBOE</strong> S&P <strong>500</strong><strong>PutWrite</strong> <strong>Index</strong>Confidential – Do Not Copy or Distribute<strong>An</strong>sbacher Investment Management, Inc. 515 Madison Avenue , 29th Floor, New York, N.Y. 10022 (212) 308-2929
Topics for Discussion• What Is <strong>An</strong> S&P <strong>500</strong> <strong>Index</strong> PutOption?• What Determines the Price of <strong>An</strong><strong>Index</strong> Option?• Writing <strong>Index</strong> Put Options• Why <strong>Index</strong> Put Options HaveHis<strong>to</strong>rically Been Overpriced• <strong>The</strong> <strong>Index</strong> Option Put Skew• Option Strategy Benchmarks• <strong>The</strong> PUT <strong>Index</strong>• <strong>The</strong> Mechanics of the PUT <strong>Index</strong>• Collateralized Short Put OneMonth P/L• PUT <strong>Index</strong> vs. S&P <strong>500</strong> TR• Differential Return By Year• PUT <strong>Index</strong> vs. Major TotalReturn <strong>Index</strong>es• Differential Return By Year• PUT <strong>Index</strong> vs. BXM <strong>Index</strong>• <strong>An</strong>sbacher Real TimeTrading Results• Exchange Traded Notes• XPT: <strong>The</strong> PUT <strong>Index</strong> Linked ETN• <strong>An</strong>sbacher Investment Management1
Why <strong>Index</strong> Put Options Have His<strong>to</strong>rically Been Overpriced• S&P <strong>500</strong> <strong>Index</strong> put option writers assume the full downside risk ofthe underlying index in return for a fixed amount.• <strong>The</strong>refore, as with anybody who provides insurance, the put writercan demand a premium for offering this protection.• <strong>The</strong> huge demand for portfolio protection by those who are long theS&P <strong>500</strong> represents an almost unlimited market for the far smallernumber of natural put sellers.• <strong>Index</strong> put buyers are insuring their portfolios against an unlikelyevent, not hoping <strong>to</strong> turn a profit on the trade.• This is why index options have his<strong>to</strong>rically been overpriced relative<strong>to</strong> the realized movements of the underlying index.2
<strong>The</strong> <strong>Index</strong> Option Put Skew• Portfolio insurance buyers often utilize out-of-the-money, rather than atthe-moneyS&P <strong>500</strong> <strong>Index</strong> puts.• <strong>The</strong> distance between the strike price of the put and the current indexvalue can be <strong>com</strong>pared <strong>to</strong> a deductible in an insurance policy.• <strong>The</strong> higher the deductible, i.e. the farther OTM the put, the lower thepremium.• Institutional inves<strong>to</strong>rs’ voracious appetite for index protection causesOTM S&P <strong>500</strong> <strong>Index</strong> puts <strong>to</strong> be valued significantly higher than<strong>com</strong>parably OTM calls. This causes a Skew in option pricing.• <strong>The</strong> overpricing is carried up through the entire option chain, causing allS&P <strong>500</strong> <strong>Index</strong> options <strong>to</strong> be overpriced relative <strong>to</strong> the realizedmovements of the underlying index.3
Option Strategy Benchmarks• <strong>The</strong> Chicago Board Option Exchange® (<strong>CBOE</strong>®) publishes severalbenchmarks for option based strategies.• All of these strategies are designed <strong>to</strong> capture the Alpha that consistentlyselling overpriced index options has proven <strong>to</strong> generate.• Among these, the well known <strong>CBOE</strong> S&P <strong>500</strong> BuyWrite <strong>Index</strong>(BXM SM ) <strong>Index</strong> tracks the results of a passive ATM covered callstrategy, executed on the S&P <strong>500</strong> <strong>Index</strong>.• Since June 1988, the BXM <strong>Index</strong> has offered long-term <strong>to</strong>tal returns<strong>com</strong>parable <strong>to</strong> those of the S&P <strong>500</strong> with almost one third less volatilityand significant bear market outperformance.• <strong>The</strong> <strong>CBOE</strong> S&P <strong>500</strong> <strong>PutWrite</strong> <strong>Index</strong> (PUT) tracks the results of apassive program that sells near-term, at-the-money S&P <strong>500</strong> <strong>Index</strong> puts.4
<strong>The</strong> PUT <strong>Index</strong>• <strong>The</strong> PUT <strong>Index</strong> employs a similar strategy <strong>to</strong> the one employed by the BXM<strong>Index</strong>. In fact, collateralized put writing has the same risk/reward profile ascovered call writing.• <strong>The</strong>refore, even though it may seem counterintuitive, a consistent index putwriting strategy offers the same advantages as a consistent index coveredcall strategy.• <strong>The</strong> PUT <strong>Index</strong> offers a way <strong>to</strong> gain exposure <strong>to</strong> the S&P <strong>500</strong> that hashis<strong>to</strong>rically offered higher long-term <strong>to</strong>tal returns with significantly lessvolatility and bear market outperformance.• <strong>The</strong> premium collected by the consistent sale of the ATM puts has more than<strong>com</strong>pensated for the loss of upside exposure <strong>to</strong> the S&P <strong>500</strong>.• <strong>The</strong> PUT <strong>Index</strong> takes advantage of the fact that put buyers are willing <strong>to</strong>overpay for portfolio protection.5
<strong>The</strong> Mechanics of the PUT <strong>Index</strong>• <strong>The</strong> PUT <strong>Index</strong> consistently sells near-term, ATM puts and holds them<strong>to</strong> expiration, when new ATM puts are sold.• <strong>The</strong> only other <strong>com</strong>ponent of the strategy is collateral equal <strong>to</strong> the <strong>to</strong>talnotional S&P <strong>500</strong> exposure of the short put position.• This collateral is invested at the prevailing “risk-free rate”.• <strong>The</strong>refore, just as in an S&P <strong>500</strong> <strong>Index</strong> covered call program, thedownside exposure is the same as a long position in the S&P <strong>500</strong> less thepremium received from the sale of the index option, and the upsidepotential is limited <strong>to</strong> the premium received.• <strong>The</strong> PUT <strong>Index</strong> strategy offers a way for inves<strong>to</strong>rs <strong>to</strong> transfer the Alphagenerated by the excess risk premium imbedded in index options on<strong>to</strong> anasset class where they already assume downside risk: equities.6
Collateralized Short Put One Month P/LP/LS&P Value at 1-Month Option ExpirationA: Possible Month-End P/L for the Collateralized Put PositionB: Possible Month-End P/L for the Long S&P <strong>500</strong> PositionC: Amount of Premium Received for the Sale of the Put Option7
PUT <strong>Index</strong> vs. S&P <strong>500</strong> TRJune 1988 – January 2008$11,000$9,563$8,140PUT <strong>Index</strong>8Jun-88Jun-89Jun-90Jun-91Jun-92Jun-93Jun-94Jun-95Jun-96Jun-97Jun-98Jun-99Jun-00Jun-01Jun-02Jun-03Jun-04Jun-05Jun-06Jun-07$9,000$7,000$5,000$3,000Growth of $1,000$1,000S&P <strong>500</strong> TR
PUT <strong>Index</strong> vs. S&P <strong>500</strong> TRRolling 5-Year <strong>An</strong>nualized Returns930%20%10%0%-10%PUT <strong>Index</strong>S&P <strong>500</strong> TRMay-93May-94May-95May-96May-97May-98May-99May-00May-01May-02May-03May-04May-05May-06May-07
PUT <strong>Index</strong> vs. S&P <strong>500</strong> TRRolling 5-Year <strong>An</strong>nualized Standard Deviation20%PUT <strong>Index</strong>1017%15%12%10%7%5%2%S&P <strong>500</strong> TRMay-93May-94May-95May-96May-97May-98May-99May-00May-01May-02May-03May-04May-05May-06May-07
PUT <strong>Index</strong> vs. S&P <strong>500</strong> TRLong Term Relative Performance (June 1988 – January 2008)<strong>An</strong>nualized Standard Correlation Tracking Active Info.Statistical <strong>An</strong>alysis ROR Deviation Sharpe Alpha Beta R R 2 Error Premium RatioPUT <strong>Index</strong> 12.17% 8.30% 0.84 6.40% 0.49 0.80 0.64 8.59% 0.91% 0.11S&P <strong>500</strong> TR 11.25% 13.65% 0.49Bull Market Relative Performance (July 1994 – March 2000)<strong>An</strong>nualized Standard Correlation Tracking Active Info.Statistical <strong>An</strong>alysis ROR Deviation Sharpe Alpha Beta R R 2 Error Premium RatioPUT <strong>Index</strong> 19.66% 7.93% 1.70 8.00% 0.44 0.79 0.62 9.50% (6.28)% (0.66)S&P <strong>500</strong> TR 25.94% 14.20% 1.37Bear Market Relative Performance (April 2000 – February 2003)<strong>An</strong>nualized Standard Correlation Tracking Active Info.Statistical <strong>An</strong>alysis ROR Deviation Sharpe Alpha Beta R R 2 Error Premium RatioPUT <strong>Index</strong> (4.30)% 13.73% (0.61) 7.21% 0.62 0.81 0.66 11.17% 12.49 1.12S&P <strong>500</strong> TR (16.79)% 17.80% (1.21)11
Differential Return by Year(June 1988 – January 2008)2008 2007 2006 2005 2004 2003 2002 2001 2000PUT <strong>Index</strong> (5.37)%9.50% 15.16% 6.71% 9.48% 21.77% (8.58)% (10.63)% 13.06%S&P <strong>500</strong> TR (6.00)% 5.49% 15.79% 4.91% 10.88% 28.68% (22.10)% (11.88)% (9.11)%+/- 0.63% 4.01% (0.64)% 1.80% (1.40)% (6.91)% 13.52% 1.25% 22.17%1999 1998 1997 1996 1995 1994 1993 1992 1991 199021.01% 18.54% 27.68% 16.40% 16.88% 7.10% 14.14% 13.80% 21.32% 8.88%21.04% 28.58% 33.36% 22.96% 37.58% 1.32% 10.08% 7.62% 30.47% (3.11)%(0.03)% (10.03)% (5.68)% (6.55)% (20.70)% 5.78% 4.06% 6.18% (9.15)% 11.99%12
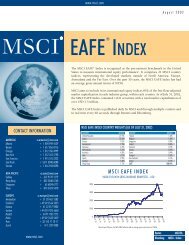
PUT <strong>Index</strong> vs. Major Total Return <strong>Index</strong>esJune 1988 – January 2008$11,000PUT, $9,563B XM, $ 8,022Russell 2000, $6,741LB Aggregate, $4,262MS CI EAFE, $ 3,5933 Mnth Libor, $2,59413Jun-88Jun-89Jun-90Jun-91Jun-92Jun-93Jun-94Jun-95Jun-96Jun-97Jun-98Jun-99Jun-00Jun-01Jun-02Jun-03Jun-04Jun-05Jun-06Jun-07$9,000$7,000$5,000$3,000Growth of $1,000$1,000
PUT <strong>Index</strong> vs. BXM <strong>Index</strong>Long Term Relative Performance (June 1988 – January 2008)<strong>An</strong>nualized Standard Correlation Tracking Active Info.Statistical <strong>An</strong>alysis ROR Deviation Sharpe Alpha Beta R R 2 Error Premium RatioPUT <strong>Index</strong> 12.17% 8.30% 0.84 2.26% 0.87 0.96 0.93 2.53% 1.00% 0.39BXM <strong>Index</strong> 11.17% 9.17% 0.67Differential Return Performance (June 1988 – January 2008)2008 2007 2006 2005 2004 2003 2002 2001 2000PUT <strong>Index</strong> (5.37)%9.50% 15.16% 6.71% 9.48% 21.77% (8.58)% (10.63)% 13.06%BXM <strong>Index</strong> (5.92)% 6.58% 13.34% 4.23% 8.29% 19.38% (7.64)% (10.94)% 7.38%+/- 0.55% 2.92% 1.82% 2.49% 1.19% 2.40% (0.93)% 0.31% 5.68%1999 1998 1997 1996 1995 1994 1993 1992 1991 199021.01% 18.54% 27.68% 16.40% 16.88% 7.10% 14.14% 13.80% 21.32% 8.88%21.17% 18.96% 26.64% 15.51% 20.97% 4.51% 14.09% 11.52% 24.39% 3.99%(0.15)% (0.41)% 1.04% 0.90% (4.09)% 2.59% 0.04% 2.27% (3.07)% 4.89%14
<strong>An</strong>sbacher Real Time Trading Results(May 2007 – January 2008)<strong>An</strong>nualized Standard Correlation Tracking Active Info.Statistical <strong>An</strong>alysis ROR Deviation Sharpe Alpha Beta R R 2 Error Premium RatioReal Time Trading 2.61% 8.45% (0.23) 0.77% 0.96 1.00 1.00 0.55% 0.72% 1.31PUT <strong>Index</strong> 1.89% 8.78% (0.30)15
Exchange Traded Notes• Exchange Traded Notes (ETNs) are exchange traded securitieswhose performance is linked <strong>to</strong> the return of a benchmark index.• ETNs are senior, unsecured, unsubordinated debt securities issuedby a bank. As such, they are debt instruments, subject <strong>to</strong> thecredit rating of the issuer.• ETNs are designed <strong>to</strong> provide inves<strong>to</strong>rs a return that is linked <strong>to</strong>the performance of a market index, minus inves<strong>to</strong>r fees.• Unlike Closed End Funds, ETNs should not trade at a significantdiscount or premium <strong>to</strong> their NAV.16
<strong>An</strong>sbacher Investment Management• Founded in 1995 by Max <strong>An</strong>sbacher, who wrote the first book onexchange-traded options.• With $120 million under management, one of the largest firms in theU.S. exclusively devoted <strong>to</strong> managing index option strategies.• Two full-time portfolio managers with more than 50 years of<strong>com</strong>bined option management experience.• <strong>An</strong>sbacher’s flagship fund, Elizaville Partners LP, has ranked amongthe Top-10 large U.S. CTAs for risk-adjusted return in the last one-,three-, five- and ten-year periods (MARHedge Magazine).• <strong>An</strong>sbacher Investment Management was the first firm <strong>to</strong> receive alicense <strong>to</strong> offer investment products based on the PUT <strong>Index</strong>.17
Key Points• <strong>The</strong> voracious demand for portfolio protection has caused S&P <strong>500</strong><strong>Index</strong> options <strong>to</strong> be overpriced relative <strong>to</strong> the actual movements of theindex.• <strong>The</strong> <strong>CBOE</strong> tracks several strategies that have outperformed a longposition in the S&P <strong>500</strong> by consistently collecting index optionpremium.• Since 1988, the <strong>CBOE</strong> S&P <strong>500</strong> <strong>PutWrite</strong> <strong>Index</strong> has offered greaterreturn, significant volatility reduction and bear market outperformance.• <strong>The</strong> PUT <strong>Index</strong> won the award for Most Innovative New Benchmark<strong>Index</strong> at the 2007 Super Bowl of <strong>Index</strong>ing.• <strong>The</strong> PUT strategy is available as an ETN and can also be used as abenchmark for active management.18
<strong>An</strong>sbacher Investment Management<strong>The</strong> Management TeamMax G. <strong>An</strong>sbacher, President, founded the firm in 1995after 20 years with Bear Stearns, where he managed optionaccounts on a discretionary basis. He is frequently quoted inthe media, including <strong>The</strong> Wall Street Journal, and has been afrequent guest <strong>com</strong>menta<strong>to</strong>r on the Bloomberg TelevisionNetwork, as well as the Fox News Channel and CNBC. He isthe author of three books on investing, including <strong>The</strong> NewOptions Market, Fourth Edition, which was the first book everpublished on exchange-traded options, and has be<strong>com</strong>e one ofthe all-time best-selling books on the subject. He was featuredin Forbes magazine, Oc<strong>to</strong>ber 18, 2004. Mr. <strong>An</strong>sbacher is agraduate of the University of Vermont and Yale Law School.Laurence E. Goellner, Vice President, Operations, has beenwith AIM for nine years. He is a registered broker, qualified<strong>to</strong> trade s<strong>to</strong>cks and options with experience in a wide varietyof asset management areas including <strong>com</strong>pliance, riskmanagement, and reporting. He is responsible for daily<strong>com</strong>munications with AIM’s brokers on the floor of the CME,order allocation, and client liaison.Jason Ungar, Direc<strong>to</strong>r, specializes in the development andimplementation of short volatility strategies designed <strong>to</strong> meetthe needs of institutional clients. For three years prior <strong>to</strong> hisjoining AIM, he was a Partner at Apogee Capital, LLC, andprior <strong>to</strong> that, he was a Financial Advisor with RBC DainRauscher. Mr. Ungar’s opinions on option strategies haveappeared in numerous publications including: Pensions &Investments, Investment News, and <strong>The</strong>street.<strong>com</strong>. He isSeries 7, 66, and 3 licensed. Mr. Ungar is a graduate of St.John’s College, <strong>An</strong>napolis.Herbert Moore, Vice President, Mr. Moore assists in thedevelopment and implementation of volatility strategies.Before joining AIM, he was a Portfolio Manager at Ezra ZaskAdvisors, where he was responsible for constructing cus<strong>to</strong>mhedge fund portfolios for inves<strong>to</strong>rs and quantifying portfoliorisk. Prior <strong>to</strong> that, he was an Associate at Azimuth Trust, afund of funds, where he moni<strong>to</strong>red Fixed In<strong>com</strong>e and GlobalMacro hedge fund managers. Mr. Moore holds a BA inEconomics from <strong>The</strong> George Washing<strong>to</strong>n University.Rosemary Zraly, Direc<strong>to</strong>r of Administration, hasresponsibility for office management and all written<strong>com</strong>munications with clients and prospects, email processingand maintaining records. Before joining AIM, she was thePresident of her own firm, which marketed various brands ofFrench Champagne in the United States.19
<strong>An</strong>sbacher General Information<strong>An</strong>sbacher Investment Management, Inc.515 Madison Avenue, 29th Floor, New York, NY 10021Phone: 212 308-2929Fax: 212 308-0777e-Mail:Website:ju@ansbacherUSA.<strong>com</strong><strong>An</strong>sbacherUSA.<strong>com</strong>Legal & Compliance:U.S. Fund Audi<strong>to</strong>rs:U.S. Fund Accountants:Fund Broker:U.S. Fund:Offshore Fund:Sidley Austin LLP, Stark & Stark LLPGoldstein Golub Kessler LLPMichael J. Liccar & Co.Bear Stearns Inc.Elizaville Partners LP,a New York State Limited PartnershipElizaville (BVI) Fund Ltd.,an International Limited Partnership formed in the British Virgin Islands20
DisclosuresExchange-traded notes based on the PUT <strong>Index</strong> ( " Securities " ) are not sponsored, endorsed, sold or promoted byStandard & Poor's ("S&P") or Chicago Board Options Exchange, Incorporated ("<strong>CBOE</strong>") and S&P and <strong>CBOE</strong>make no representation regarding the advisability of investing in the Securities.Options involve risk and are not suitable for all inves<strong>to</strong>rs. Prior <strong>to</strong> buying or selling an option, a person must receivea copy of Characteristics and Risks of Standardized Options (the " ODD " ). <strong>The</strong> ODD and supportingdocumentation for any claims, <strong>com</strong>parisons, re<strong>com</strong>mendations, statistics or other technical data in these materialsare is available by calling 1-888-OPTIONS, or contacting <strong>CBOE</strong> at www.cboe.<strong>com</strong>/Contact. <strong>The</strong> PUT logo is aservice mark of <strong>CBOE</strong>. <strong>The</strong> methodology of the <strong>CBOE</strong> S&P <strong>500</strong> <strong>PutWrite</strong> <strong>Index</strong> is owned by <strong>CBOE</strong> and may becovered by one or more patents or pending patent applications. <strong>The</strong> <strong>CBOE</strong> S&P <strong>500</strong> <strong>PutWrite</strong> <strong>Index</strong> is designed <strong>to</strong>represent a proposed hypothetical short put strategy. Like many passive indexes, the PUT <strong>Index</strong> does not take in<strong>to</strong>account significant fac<strong>to</strong>rs such as transaction costs and taxes and, because of fac<strong>to</strong>rs such as these, many or mostinves<strong>to</strong>rs should be expected <strong>to</strong> underperform passive indexes. In the construction of the hypothetical PUT index,the SPX puts are assumed <strong>to</strong> be written at a certain price on the third Friday of the month. However, there is noguarantee that all inves<strong>to</strong>rs will be able <strong>to</strong> sell at this price, and inves<strong>to</strong>rs attempting <strong>to</strong> replicate the PUT <strong>Index</strong>should discuss with their brokers possible timing and liquidity issues. Transaction costs for a put writing strategysuch as the PUT could be significantly higher than transaction costs for a passive strategy of investing in TreasuryBills. Past performance does not guarantee future results. This website presentation contains <strong>com</strong>parisons,assertions, and conclusions regarding the performance of an index based on backtesting, i.e., calculations of how theindex might have performed in the past if it had existed. Backtested performance information is purely hypotheticaland is provided in this website presentation solely for informational purposes. Backtested performance does notrepresent actual performance, and should not be interpreted as an indication of actual performance. His<strong>to</strong>rical PUTdaily data is provided for reference purposes only. Supporting documentation for claims, <strong>com</strong>parisons,re<strong>com</strong>mendations, statistics or other technical data is available by calling 1-888-OPTIONS, sending an e-mail <strong>to</strong>help@cboe.<strong>com</strong>, or by visiting www.cboe.<strong>com</strong>/put. <strong>CBOE</strong>® and Chicago Board Options Exchange> ® areregistered trademarks of <strong>CBOE</strong> and BXM, BXD, BXN the PUT logo and BXY SPX are servicemarks of <strong>CBOE</strong>.Standard & Poor's, S&P and S&P <strong>500</strong> are registered trademarks of the McGraw-Hill Companies, Inc. and arelicensed for use by <strong>CBOE</strong>. Copyright © 2008 Chicago Board Options Exchange, Incorporated. All RightsReserved.21