Return on Investment White Paper - Cadgroup
Return on Investment White Paper - Cadgroup
Return on Investment White Paper - Cadgroup
- No tags were found...

Create successful ePaper yourself
Turn your PDF publications into a flip-book with our unique Google optimized e-Paper software.
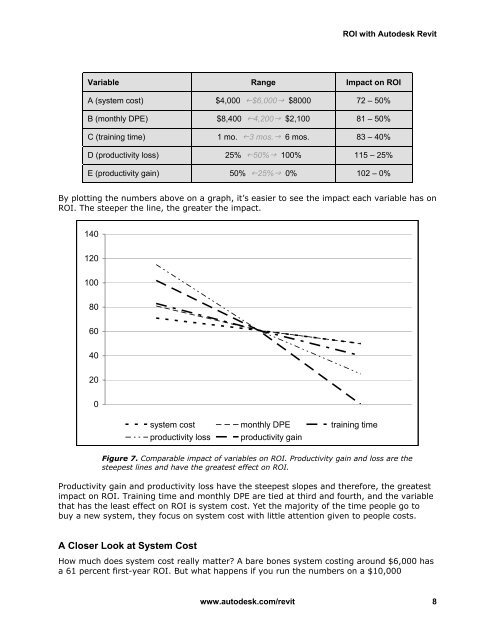
ROI with Autodesk RevitVariable Range Impact <strong>on</strong> ROIA (system cost) $4,000 $6,000 $8000 72 – 50%B (m<strong>on</strong>thly DPE) $8,400 4,200 $2,100 81 – 50%C (training time) 1 mo. 3 mos. 6 mos. 83 – 40%D (productivity loss) 25% 50% 100% 115 – 25%E (productivity gain) 50% 25% 0% 102 – 0%By plotting the numbers above <strong>on</strong> a graph, it’s easier to see the impact each variable has <strong>on</strong>ROI. The steeper the line, the greater the impact.140120100806040200system cost m<strong>on</strong>thly DPE training timeproductivity loss productivity gainFigure 7. Comparable impact of variables <strong>on</strong> ROI. Productivity gain and loss are thesteepest lines and have the greatest effect <strong>on</strong> ROI.Productivity gain and productivity loss have the steepest slopes and therefore, the greatestimpact <strong>on</strong> ROI. Training time and m<strong>on</strong>thly DPE are tied at third and fourth, and the variablethat has the least effect <strong>on</strong> ROI is system cost. Yet the majority of the time people go tobuy a new system, they focus <strong>on</strong> system cost with little attenti<strong>on</strong> given to people costs.A Closer Look at System CostHow much does system cost really matter? A bare b<strong>on</strong>es system costing around $6,000 hasa 61 percent first-year ROI. But what happens if you run the numbers <strong>on</strong> a $10,000www.autodesk.com/revit 8