Return on Investment White Paper - Cadgroup
Return on Investment White Paper - Cadgroup
Return on Investment White Paper - Cadgroup
- No tags were found...
You also want an ePaper? Increase the reach of your titles
YUMPU automatically turns print PDFs into web optimized ePapers that Google loves.
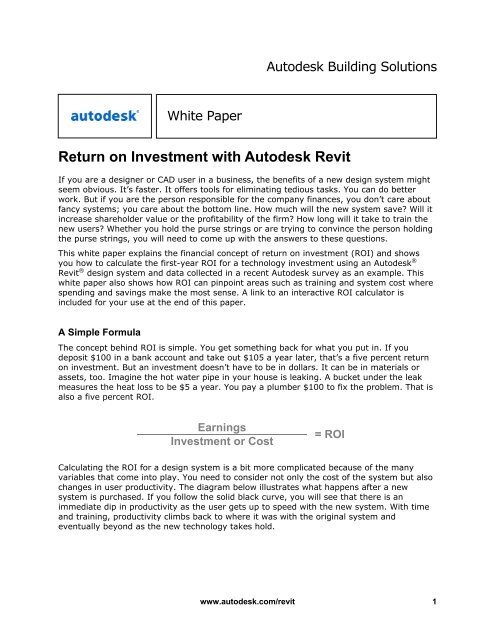
Autodesk Building Soluti<strong>on</strong>s<strong>White</strong> <strong>Paper</strong><str<strong>on</strong>g>Return</str<strong>on</strong>g> <strong>on</strong> <strong>Investment</strong> with Autodesk RevitIf you are a designer or CAD user in a business, the benefits of a new design system mightseem obvious. It’s faster. It offers tools for eliminating tedious tasks. You can do betterwork. But if you are the pers<strong>on</strong> resp<strong>on</strong>sible for the company finances, you d<strong>on</strong>’t care aboutfancy systems; you care about the bottom line. How much will the new system save? Will itincrease shareholder value or the profitability of the firm? How l<strong>on</strong>g will it take to train thenew users? Whether you hold the purse strings or are trying to c<strong>on</strong>vince the pers<strong>on</strong> holdingthe purse strings, you will need to come up with the answers to these questi<strong>on</strong>s.This white paper explains the financial c<strong>on</strong>cept of return <strong>on</strong> investment (ROI) and showsyou how to calculate the first-year ROI for a technology investment using an Autodesk ®Revit ® design system and data collected in a recent Autodesk survey as an example. Thiswhite paper also shows how ROI can pinpoint areas such as training and system cost wherespending and savings make the most sense. A link to an interactive ROI calculator isincluded for your use at the end of this paper.A Simple FormulaThe c<strong>on</strong>cept behind ROI is simple. You get something back for what you put in. If youdeposit $100 in a bank account and take out $105 a year later, that’s a five percent return<strong>on</strong> investment. But an investment doesn’t have to be in dollars. It can be in materials orassets, too. Imagine the hot water pipe in your house is leaking. A bucket under the leakmeasures the heat loss to be $5 a year. You pay a plumber $100 to fix the problem. That isalso a five percent ROI.Earnings<strong>Investment</strong> or Cost= ROICalculating the ROI for a design system is a bit more complicated because of the manyvariables that come into play. You need to c<strong>on</strong>sider not <strong>on</strong>ly the cost of the system but alsochanges in user productivity. The diagram below illustrates what happens after a newsystem is purchased. If you follow the solid black curve, you will see that there is animmediate dip in productivity as the user gets up to speed with the new system. With timeand training, productivity climbs back to where it was with the original system andeventually bey<strong>on</strong>d as the new technology takes hold.www.autodesk.com/revit 1
ROI with Autodesk RevitDesignProductivityHigherCurrent SystemOr Process$ invested innew systemor processProductivityGainProductivityLossLowerTimeFigure 1. Design investment and productivity curve. The dark bold lineshows changes in productivity after the purchase of a new system. “Trainingtime” is the time it takes a user to become as productive <strong>on</strong> the new systemas <strong>on</strong> the old, shown here where the curve crosses the horiz<strong>on</strong>tal axis.System cost, labor, training, and productivity changes are all accounted for in this formulafor calculating the first-year ROI for an informati<strong>on</strong> technology investment:( B – (B) ) x ( 12 - C )1 + EA + ( B x C x D )= First Year ROIThe formula has five variables:A = cost of hardware and software (dollars)B = m<strong>on</strong>thly labor cost (dollars)C = training time (m<strong>on</strong>ths)D = productivity lost during training (percentage)E = productivity gain after training (percentage)www.autodesk.com/revit 2
ROI with Autodesk RevitThe denominator, which is the “investment” or “cost” part of the equati<strong>on</strong>, includes the costof the system (A) and the cost of the productivity lost, in terms of labor cost, as the userlearns how to use the system. This sec<strong>on</strong>d term is the product of the m<strong>on</strong>thly labor cost (B)multiplied by m<strong>on</strong>ths in training time (C) multiplied by productivity lost in training (D),therefore B x C x D. Throughout this paper “training time” refers not to the length of atraining course, but to the time it takes a user to reach the same level of productivityexperienced <strong>on</strong> the original system.The numerator represents the “earnings” part of the equati<strong>on</strong> and those earnings comefrom an increase in human productivity. The increase in average m<strong>on</strong>thly productivity isrepresented in the left bracket ((B - (B / 1 + E). The right bracket (12 – C) is the number ofm<strong>on</strong>ths in a year (12) minus m<strong>on</strong>ths in training (C). If the user needs three m<strong>on</strong>ths tobecome as productive <strong>on</strong> the new system as <strong>on</strong> the old, then there are nine m<strong>on</strong>ths left inthe year to benefit from the productivity gains.As an example of how productivity affects ROI, imagine the user is not more productiveafter training than before (E = 0). E equals zero. The entire left bracket would then be zeroedout, resulting in a first year ROI of zero. On the other hand, if the user doubles hisproductivity after training (E = 1), than labor cost is cut in half ((B – B/2), and the ROIwould be 100 percent. Productivity has a profound effect <strong>on</strong> ROI.Some Real NumbersFormulas are impressive but make more sense with real numbers. The numbers below willbe used for the purposes of this white paper, but you can substitute your own in the ROIcalculator provided at the end.A = cost of hardware and software $6,000B = m<strong>on</strong>thly labor cost $4,200C = training time3 m<strong>on</strong>thsD = productivity loss during training 50%E = productivity gain after training 25%Following is an explanati<strong>on</strong> of how each of the numbers was derived. Several came fromdata collected in a December 2003 Autodesk survey of Revit users (approximately 100 usersprovided resp<strong>on</strong>ses to a survey invitati<strong>on</strong> posted <strong>on</strong>line).Cost of hardware and software (A) — A Revit system (hardware and software) sells foraround $6,000. This cost does not include training or support. It is simply a base system forthe purposes of working the ROI formula.M<strong>on</strong>thly labor cost (B) — In the design world there are several terms to describe laborcosts. Direct Labor Cost is the hourly wage of an employee. Direct Pers<strong>on</strong>nel Expense (DPE)is the hourly wage plus another 30-40 percent to account for benefits and other employeespecificoverhead. The billing rate is the Direct Labor Cost or the DPE marked up by a factor(often between two and three) to cover a company’s overhead and profit margin. Becausemost project managers focus <strong>on</strong> DPE in their budgets as the managed cost, it makes senseto use this term for the ROI formula.www.autodesk.com/revit 3
ROI with Autodesk RevitNow to figure out the m<strong>on</strong>thly DPE for <strong>on</strong>e pers<strong>on</strong>. A typical designer works an average of147 billable hours per m<strong>on</strong>th, but not all that time is spent using Revit. As part of the 2003survey, Revit users resp<strong>on</strong>ded that <strong>on</strong> average they spent 35 percent of their time <strong>on</strong>design (Figure 2), 46 percent <strong>on</strong> documentati<strong>on</strong> (Figure 3), 15 percent project <strong>on</strong> projectmanagement, and 3 percent <strong>on</strong> other tasks. In total, a typical Revit user spends 82 percentof his or her time, or 120 hours a m<strong>on</strong>th, <strong>on</strong> design and documentati<strong>on</strong>, the two taskswhere Revit is useful. At a reas<strong>on</strong>able DPE estimate of $35 an hour, that represents am<strong>on</strong>thly labor cost of $4,200.30%25%26%20%15%20%18%16%10%5%0%4%0 - 10% 11 -20%21 -30%31 -40%41 -50%7%51 -60%4% 4% 2%61 -70%71 -80%81 -90%91 -100%Figure 2. Answers to the 2003 Revit survey questi<strong>on</strong> “What percentage of your timedo you spend <strong>on</strong> c<strong>on</strong>cept and design development?” Answers averaged 35%.25%20%20%20% 20%15%10%15%13%5%0%0%4%0 - 10% 11 -20%21 -30%31 -40%41 -50%51 -60%61 -70%4%71 -80%81 -90%2%91 -100%Figure 3. Answers to the 2003 Revit survey questi<strong>on</strong> “What percentage of your timeis typically spent <strong>on</strong> documentati<strong>on</strong>?”www.autodesk.com/revit 4
ROI with Autodesk RevitHours perm<strong>on</strong>thTimeDPE rateper hourM<strong>on</strong>thlyDPE costDesign 52 35% $35 $1,820Documentati<strong>on</strong> 68 46% $35 $2,380Project management 22 15% $35 $770All other tasks 5 3% $35 $175Total 147 100% $5,145Total for design anddocumentati<strong>on</strong>120 82% $4,200Training time (C) — According to the 2003 survey, Revit users reported that <strong>on</strong> average, ittook them anywhere from <strong>on</strong>e to six m<strong>on</strong>ths to achieve the same productivity levels <strong>on</strong>Revit as with their old systems (Figure 4). A very c<strong>on</strong>servative estimate is three m<strong>on</strong>ths.35%30%25%30%20%23%23%15%10%12%5%0%< 1 M<strong>on</strong>th 1 - 2M<strong>on</strong>ths3 - 4M<strong>on</strong>ths5 - 6M<strong>on</strong>ths4% 2% 4%7 - 9M<strong>on</strong>ths10 - 12M<strong>on</strong>ths> 1 YearFigure 4. Answers to the 2003 Revit survey questi<strong>on</strong> “How much time did it takeyou to get back to the same productivity you had with your previous software?” Thisis referred to as the “training time” or “training period.”Productivity loss (D) — Users generally experience a dip in productivity as they get used toa new system. In the 2003 survey, Revit users reported that <strong>on</strong> average they experienced a50 percent loss in productivity during their training time (Figure 5).www.autodesk.com/revit 5
ROI with Autodesk Revit30%25%20%22%24%15%10%5%0%14%9% 9%3%No change 1 - 9% 10 - 24% 25 - 49% 50 - 74% 75 - 100%Figure 5. Answers to the 2003 Revit survey questi<strong>on</strong> “During your initial trainingperiod <strong>on</strong> Autodesk Revit, what was your estimated productivity loss?”Productivity gain (E) — Once the training period was complete and designers had gotten thehang of their new Revit systems, they generally reported that they were 25 to 100 percentmore productive than they were <strong>on</strong> the old system (Figure 6) We will use 25 percent as avery c<strong>on</strong>servative estimate for our example.25%20%21%23%15%18%10%11%13%5%0%2%2%No Change 1 - 9% 10 - 24% 25 - 49% 50 - 74% 75 - 100% >100%Figure 6. Answers to the 2003 Revit survey questi<strong>on</strong> “What change in productivitywould you estimate you have now achieved by migrating to Autodesk Revit fromyour previous design software?”Now it’s time to run the numbers. With the real numbers in place, the formula indicates thatin its first year, a Revit design system offers a 61 percent return <strong>on</strong> investment. Here arethe numbers again:www.autodesk.com/revit 6
ROI with Autodesk RevitA = cost of hardware and software $6,000B = m<strong>on</strong>thly labor cost $4,200C = training time3 m<strong>on</strong>thsD = productivity loss during training 50%E = productivity gain after training 25%And here are the numbers in the formula:4,200( 4,200 – ( ) ) x ( 12 - 3 )1 + 256,000 + ( 4,200 x 3 x 50 )= 61%Now imagine that the CFO of your company has five or ten milli<strong>on</strong> dollars of working capitalsitting in a bank making <strong>on</strong>ly 3 percent interest, the equivalent of a 3 percent annual ROI. Itis the CFO’s job to find opportunities to grow the shareholder return, so with a 61 percentROI, a new Revit design system is certainly worthy of c<strong>on</strong>siderati<strong>on</strong>.But not <strong>on</strong>ly large companies benefit from this formula. Small companies, like the manyarchitectural firms that use Revit, can use it to dem<strong>on</strong>strate how they plan to repay a bankloan. Even if your company is not borrowing m<strong>on</strong>ey for such an investment, sound financialplanning involves answering the same kinds of questi<strong>on</strong>s a bank officer would ask. This iswhere the power of this ROI formula, supported by data, comes in.Some Variables Weigh MoreOn of the questi<strong>on</strong>s you may be asked is, how does each variable affect ROI? In order toexamine the variables independently, it’s important to run a sensitivity test. By varying therange of each variable and plugging the numbers <strong>on</strong> the l<strong>on</strong>g and short end of the rangeback into the formula, you can measure that variable’s effect <strong>on</strong> ROI. In looking at theresults below, remember that the ROI was originally 61 percent.www.autodesk.com/revit 7
ROI with Autodesk RevitVariable Range Impact <strong>on</strong> ROIA (system cost) $4,000 $6,000 $8000 72 – 50%B (m<strong>on</strong>thly DPE) $8,400 4,200 $2,100 81 – 50%C (training time) 1 mo. 3 mos. 6 mos. 83 – 40%D (productivity loss) 25% 50% 100% 115 – 25%E (productivity gain) 50% 25% 0% 102 – 0%By plotting the numbers above <strong>on</strong> a graph, it’s easier to see the impact each variable has <strong>on</strong>ROI. The steeper the line, the greater the impact.140120100806040200system cost m<strong>on</strong>thly DPE training timeproductivity loss productivity gainFigure 7. Comparable impact of variables <strong>on</strong> ROI. Productivity gain and loss are thesteepest lines and have the greatest effect <strong>on</strong> ROI.Productivity gain and productivity loss have the steepest slopes and therefore, the greatestimpact <strong>on</strong> ROI. Training time and m<strong>on</strong>thly DPE are tied at third and fourth, and the variablethat has the least effect <strong>on</strong> ROI is system cost. Yet the majority of the time people go tobuy a new system, they focus <strong>on</strong> system cost with little attenti<strong>on</strong> given to people costs.A Closer Look at System CostHow much does system cost really matter? A bare b<strong>on</strong>es system costing around $6,000 hasa 61 percent first-year ROI. But what happens if you run the numbers <strong>on</strong> a $10,000www.autodesk.com/revit 8
ROI with Autodesk Revitsystem? This top-of-the-line system comes with all the amenities. An Autodesk resellerinstalls it, sets up an efficient subdirectory structure, customizes office templates, andc<strong>on</strong>figures work sets for that important first project. It also includes a <strong>on</strong>e week trainingcourse and full-service maintenance with ph<strong>on</strong>e and <strong>on</strong>-site support to keep you up andrunning.These added benefits affect other variables. Training time drops from three to two m<strong>on</strong>ths,and productivity loss drops from 50 to 25 percent. As a result, the first-year ROI is 116percent, a figure that could easily justify the additi<strong>on</strong>al $4,000.Minimum costsystemMaximum productivitysystemBasic Hardware $1,000 $1,000Hardware upgrades 0 1,000Revit software 5,000 5,000Third party software 0 0Installati<strong>on</strong> & c<strong>on</strong>figurati<strong>on</strong> 0 200Training 0 2,000Ph<strong>on</strong>e support 0 300On-site support 0 500Total system cost $6,000 $10,000Training time 3 m<strong>on</strong>ths 2 m<strong>on</strong>thsProductivity loss 50% 25%Productivity gain 25% 50%M<strong>on</strong>thly DPE $4,200 $4,2001st year ROI 61% 116%Early Training CountsIt should be clear by now that productivity counts big. And <strong>on</strong>e tool for increasingproductivity is training. Data collected from a 1993 Autodesk ® survey of AutoCAD ® usersindicates that the earlier you start training, the better, and that the productivity benefits ofearly training are both immediate and l<strong>on</strong>g term. The results of that survey can easily beextended to users of any design software, including Revit.Here are the details: The 1993 survey grouped AutoCAD users into those who receivedtraining and those who did not. Both groups experienced an immediate drop in productivitywhen they switched to AutoCAD, but the similarities stop there. Untrained userswww.autodesk.com/revit 9
ROI with Autodesk Revitexperienced a 40 percent drop in productivity and it took them 11 l<strong>on</strong>g m<strong>on</strong>ths to crawlback to parity. In c<strong>on</strong>trast, trained users experienced a 55 percent drop in productivity(they were off-site during training) but climbed back to parity in <strong>on</strong>ly four m<strong>on</strong>ths. What’smore, two years later, while the untrained users were <strong>on</strong>ly 125 percent more productive <strong>on</strong>AutoCAD than they had been <strong>on</strong> their old systems, the trained users were a whopping 177percent more productive (Figure 8).Productivity200%Could not use system before trainingCould use system but received training181%165%150%125%100%Manual Productivity50%60%40%Could use system but untrained0%0 2 4 6 8 10 12 14 16 18 20 22 24No. of M<strong>on</strong>ths After System PurchasedSource: UK AutoCAD User Survey, 1993Figure 8. Productivity analysis, trained vs. untrained users (solid and shortdashedlines). Also including data from originally untrained but experiencedusers (middle, l<strong>on</strong>g-dashed line) who received update training. Those trained <strong>on</strong>the system immediately are more productive <strong>on</strong> the system indefinitely. Selftaughtusers are never as productive, even after receiving training.The data indicates that not <strong>on</strong>ly is there an initial difference between trained and untrainedusers, but that that difference actually increases over time. What’s more, untrained usersnever actually catch up in terms of the productivity of the trained user. Trained usersremain 50 percent more productive than untrained users. Imagine trying to compete with acompany that is 50 percent more productive than you?The survey also broke the users down by: how many were not able to use the systembefore training, how many could use the system but still received training, and how manycould use the system but remained untrained (Figure 8). The results showed that the mostproductive users were the <strong>on</strong>es who were trained from the get-go (top, solid line) even ifthey didn’t know how to use the system beforehand. The <strong>on</strong>es who got training at somepoint after their initial purchase (bottom, short-dashed line) did well but never quite caughtwww.autodesk.com/revit 10
ROI with Autodesk Revitup to the others. And the people who got no professi<strong>on</strong>al training (middle, l<strong>on</strong>g-dashed line)were less productive than either of the other two groups.The data also indicated that the critical period for training was <strong>on</strong>e or two m<strong>on</strong>ths afterintroducti<strong>on</strong> to the package. If you wait l<strong>on</strong>ger than two m<strong>on</strong>ths and try to learn <strong>on</strong> yourown, bad habits become too ingrained and can result in l<strong>on</strong>g-term handicaps.Another way to measure the benefits of training is with the ROI formula. Simply substitutesystem cost (A) for the cost of a <strong>on</strong>e-week training course ($2,000 for training, travel, andlodging). Of course, some of the other variables need adjustment as well. Productivity loss(D) during training is 100 percent due to time away from the office. And productivity gain(E) after training is a very c<strong>on</strong>servative 10 percent. With these numbers, the ROI comes to147 percent, dramatic enough to c<strong>on</strong>vince any<strong>on</strong>e of the importance of training.A = cost of training class $2,000B = m<strong>on</strong>thly DPE 4,200C = training time0.25 m<strong>on</strong>thsD = productivity loss (during training) 100%E = productivity gain (after training) 10%ROI for Revit training class: 147%C<strong>on</strong>clusi<strong>on</strong>You now understand the financial c<strong>on</strong>cept of return <strong>on</strong> investment and have learned how tocalculate the first-year ROI for a technology investment. You have also seen how investingin higher quality hardware and training can improve your ROI.The ROI formula is a powerful tool for analyzing an Autodesk Revit or any design systeminvestment. It allows you to resolve budget issues faster and clearly dem<strong>on</strong>strates that therichest investments are in the tools that enable people to do their best work.To find out more about the Autodesk Revit building design and documentati<strong>on</strong> system, visitus <strong>on</strong> the web at http://www.autodesk.com/revit. There, you will find an interactive ROIcalculator worksheet with this white paper under Features & Specificati<strong>on</strong>s > <strong>White</strong><strong>Paper</strong>s, if it did not download automatically with this paper.Autodesk, Inc.111 McInnis ParkwaySan Rafael, CA 94903USAAutodesk, AutoCAD, and Revit are registered trademarks of Autodesk, Inc., in the USA and other countries. All other brand names, productnames, or trademarks bel<strong>on</strong>g to their respective holders.© 2004 Autodesk, Inc. All rights reserved.www.autodesk.com/revit 11


