Solution manual for exercises - MAELabs UCSD
Solution manual for exercises - MAELabs UCSD
Solution manual for exercises - MAELabs UCSD

Create successful ePaper yourself
Turn your PDF publications into a flip-book with our unique Google optimized e-Paper software.
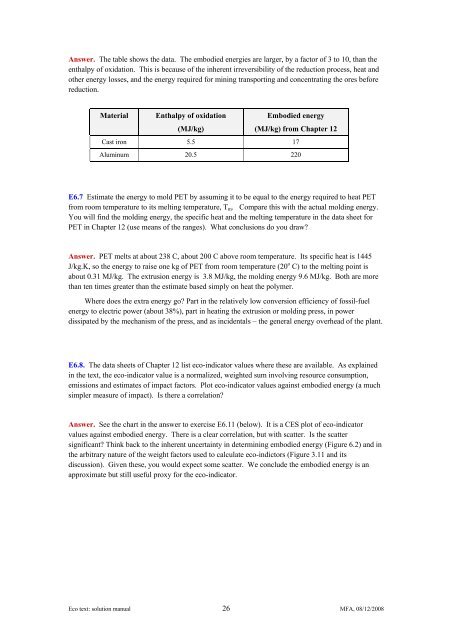
Answer. The table shows the data. The embodied energies are larger, by a factor of 3 to 10, than the<br />
enthalpy of oxidation. This is because of the inherent irreversibility of the reduction process, heat and<br />
other energy losses, and the energy required <strong>for</strong> mining transporting and concentrating the ores be<strong>for</strong>e<br />
reduction.<br />
Material Enthalpy of oxidation<br />
Embodied energy<br />
(MJ/kg)<br />
(MJ/kg) from Chapter 12<br />
Cast iron 5.5 17<br />
Aluminum 20.5 220<br />
E6.7 Estimate the energy to mold PET by assuming it to be equal to the energy required to heat PET<br />
from room temperature to its melting temperature, Tm. Compare this with the actual molding energy.<br />
You will find the molding energy, the specific heat and the melting temperature in the data sheet <strong>for</strong><br />
PET in Chapter 12 (use means of the ranges). What conclusions do you draw?<br />
Answer. PET melts at about 238 C, about 200 C above room temperature. Its specific heat is 1445<br />
J/kg.K, so the energy to raise one kg of PET from room temperature (20 o C) to the melting point is<br />
about 0.31 MJ/kg. The extrusion energy is 3.8 MJ/kg, the molding energy 9.6 MJ/kg. Both are more<br />
than ten times greater than the estimate based simply on heat the polymer.<br />
Where does the extra energy go? Part in the relatively low conversion efficiency of fossil-fuel<br />
energy to electric power (about 38%), part in heating the extrusion or molding press, in power<br />
dissipated by the mechanism of the press, and as incidentals – the general energy overhead of the plant.<br />
E6.8. The data sheets of Chapter 12 list eco-indicator values where these are available. As explained<br />
in the text, the eco-indicator value is a normalized, weighted sum involving resource consumption,<br />
emissions and estimates of impact factors. Plot eco-indicator values against embodied energy (a much<br />
simpler measure of impact). Is there a correlation?<br />
Answer. See the chart in the answer to exercise E6.11 (below). It is a CES plot of eco-indicator<br />
values against embodied energy. There is a clear correlation, but with scatter. Is the scatter<br />
significant? Think back to the inherent uncertainty in determining embodied energy (Figure 6.2) and in<br />
the arbitrary nature of the weight factors used to calculate eco-indictors (Figure 3.11 and its<br />
discussion). Given these, you would expect some scatter. We conclude the embodied energy is an<br />
approximate but still useful proxy <strong>for</strong> the eco-indicator.<br />
Eco text: solution <strong>manual</strong> 26 MFA, 08/12/2008