Nanoscale IR Spectroscopy - LAO
Nanoscale IR Spectroscopy - LAO
Nanoscale IR Spectroscopy - LAO
- No tags were found...
You also want an ePaper? Increase the reach of your titles
YUMPU automatically turns print PDFs into web optimized ePapers that Google loves.
<strong>Nanoscale</strong> <strong>IR</strong> <strong>Spectroscopy</strong>
Where<strong>IR</strong> <strong>Spectroscopy</strong>Meets AFMThe nano<strong>IR</strong> platform from Anasys Instruments is aprobe-based measurement tool that reveals the chemicalcomposition of samples at the nanoscale. This laboratorysolution combines key elements of both infrared spectroscopyand atomic force microscopy (AFM) to enable the acquisitionof infrared spectra at spatial resolutions well beyond theoptical diffraction limit.In addition to revealing chemical composition, the nano<strong>IR</strong>system provides high-resolution characterization of localtopographic, mechanical, and thermal properties. Potentialapplication areas span the realms of polymer science,materials science, and life science, including detailed studiesof structure-property correlations.Wavenumber (cm -1 )NH peakPosition (µm)High-resolution line spectral map across the boundary betweenethylene acrylic acid copolymer (EAA) and nylon layers in amultilayer film. The transition between the CH and NH absorptionpeaks across this boundary is resolved far below the diffraction limitof conventional <strong>IR</strong> spectroscopy.0<strong>Nanoscale</strong> Spatial Resolution+ Chemical <strong>Spectroscopy</strong>The atomic force microscope has been an enormously successful tool foranswering critical questions in science and industry. It is unable, however,to chemically characterize local regions of a sample. Conversely, traditionalinfrared spectroscopy, a benchmark tool for characterizing and identifyingchemical species, typically offers only 5–10μm spatial resolution.Leveraging the advantages of both AFM and <strong>IR</strong> spectroscopy, the nano<strong>IR</strong>system provides nanoscale spatial resolution in combination with chemicalspectroscopy. This unprecedented capability is achieved by measuring anAFM probe’s resonant response to infrared light pulses absorbed by thesample (see sidebar).Users of nano<strong>IR</strong> technology can quickly survey regions of a sample via AFMand then rapidly acquire high-resolution chemical spectra at selected regionson the sample. Mechanical and thermal properties may also be mapped withnanoscale resolution.32003100300029002800Wavenumber (cm-1)246810Position (μm)Rich, Interpretable <strong>IR</strong> SpectraThe nano<strong>IR</strong> system enables researchers to harness the full power of mid-<strong>IR</strong>spectroscopy. The system’s <strong>IR</strong> source, designed using proprietary technology,is continuously tunable from 3600 to 1200 cm -1 . This range covers a majorportion of the mid-<strong>IR</strong>, including important CH, NH, and CO bands, as wellas carbonyl and amide I/II bands. Polymer spectra acquired with the nano<strong>IR</strong>system have demonstrated good correlation with bulk FT<strong>IR</strong> spectra. Thenano<strong>IR</strong> software also allows researchers to export nanoscale <strong>IR</strong> absorptionspectra to standard analysis packages (e.g., Bio-Rad’s KnowItAll ® ) to rapidlyanalyze samples and identify chemical components.[Top] Line spectral map of blend of polycarbonate (PC) andacrylonitrile butadiene styrene (ABS). Note the shift in theposition of the highest CH peak from ~2920 to ~2970 cm -1as the AFM tip moves from regions of ABS to regions of PC,respectively. [Bottom] AFM image of the polymer blend showing PCand ABS domains.www.anasysinstruments.com | info@anasysinstruments.com
The Science Behindthe SolutionDeflection laserPhotodiode(cm -1 ) (cm -1 )The nano<strong>IR</strong> system provides spectra ofnanoscale regions that are rich, interpretable,and demonstrate good correlation with FT<strong>IR</strong>measurements on bulk samples. These plotscompare nano<strong>IR</strong> spectra of polystyrene,nylon, and ethylene acrylic acid copolymer toreference spectra measured by FT<strong>IR</strong>.CantileverPrismSamplePulsed, tunable <strong>IR</strong> source(cm -1 )Multifunctional Measurements: IntegratedThermal and Mechanical Property MappingIn addition to its ability to provide high-resolution infrared spectra, the nano<strong>IR</strong>system provides direct information on thermal and mechanical properties.Mechanical properties of a sample can be collected using a contact resonancemethod to map stiffness variations simultaneously with the topography.The nano<strong>IR</strong> platform can also perform nanoscale thermal analysis, enablingresearchers to move beyond bulk thermal analysis and providing informationnot obtainable with any other technique. Developed by Anasys Instruments,this award-winning technology uses Anasys ThermaLever probes to locallyramp the sample’s temperature to measure and map thermal transitions andother thermal properties.Wavenumber (cm -1 )<strong>IR</strong> absorption 2900-2950 cm-1Cantilever deflection (arb)12010080604020-4-4.5-5-5.5-6-6.5-716015515014501400 5 10 15 20Distance (µm)NylonCH absorptionContact resonanceEAATmTm30 50 70 90 110 130 150 170Contact resonance (kHz)At the heart of the nano<strong>IR</strong> platform is patentpendingtechnology based on photothermal inducedresonance (PT<strong>IR</strong>), a technique pioneered byaward-winning researcher Dr. Alexandre Dazzi. 1-3The nano<strong>IR</strong> system uses a pulsed, tunable <strong>IR</strong>source to excite molecular absorption in a samplethat has been mounted on a ZnSe prism. The<strong>IR</strong> beam illuminates the sample by total internalreflection similar to conventional ATR spectroscopy.As the sample absorbs radiation, it heats up,leading to rapid thermal expansion that excitesresonant oscillations of the cantilever. The inducedoscillations decay in a characteristic ringdown (asshown above).The ringdown can be analyzed via Fouriertechniques to extract the amplitudes andfrequencies of the oscillations. Measuring theamplitudes of the cantilever oscillation as afunction of the source wavelength creates localabsorption spectra; the oscillation frequencies ofthe ringdown are related to the mechanical stiffnessof the sample. The <strong>IR</strong> source can also be tunedto a single wavelength to simultaneously mapsurface topography, mechanical properties, and <strong>IR</strong>absorption in selected absorption bands.Temperature (ºC)The nano<strong>IR</strong> system can provide integrated measurements of topographic, chemical, mechanical,and thermal properties on the same sample. (A) AFM image of a laminated polymer multilayercomprising EAA and nylon layers. (B) Line spectral map across the interfaces. (C) Simultaneouschemical and mechanical characterization. The green curve shows the strength of the CH absorptionbetween 2900 and 2950 cm -1 , while the blue curve shows the relative mechanical stiffness acrossthe interfaces. (D) Nanothermal analysis measurements performed on nylon and EAA.www.anasysinstruments.com | info@anasysinstruments.com
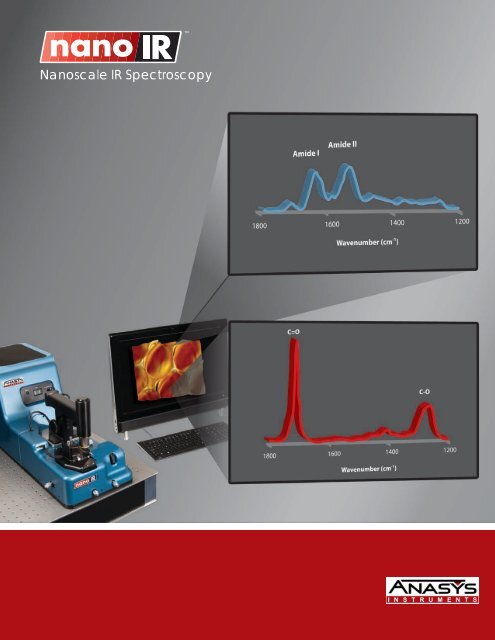
Potential nano<strong>IR</strong> Application AreasThe nano<strong>IR</strong> system has been designed to facilitate advanced research in the polymerscience, materials science, and life science arenas.Potential nano<strong>IR</strong> application areas include:• Polymer blends• Multilayer films/laminates• Organic defect analysis• Tissue morphology/histology• Subcellular spectroscopy• Organic photovoltaicsPlease contact Anasys Instruments to discuss your specific application or to learn moreabout the capabilities of nano<strong>IR</strong> technology.Close-up view of the AFM measurement module.The nano<strong>IR</strong> system showing tunable <strong>IR</strong> source and AFM measurement module.About Anasys InstrumentsAnasys Instruments Corporation was founded in 2005 by an experienced team of AFMindustry pioneers and scientists with the goal of creating innovative analytic tools thatenable a better understanding of structure, property, and function at the nanoscale.The Santa Barbara, California-based company has already developed and introducedtwo major award-winning technologies: nanoscale thermal analysis (nano-TA) andtransition temperature microscopy (TTM).Front cover: The nano<strong>IR</strong> system combines the high-resolution imaging power of AFM with the rich chemicalcharacterization of <strong>IR</strong> spectroscopy. The AFM image shows PET fibers in a polyamide matrix. Infrared spectrafrom selected regions of the AFM image can be used to identify specific chemical structures at those locations.1. R. P. A. Dazzi, F. Glotin, and J. M. Ortega, Infrared Physicsand Technology 49 (September 2006), 113-121 (2006).2. R. P. A. Dazzi, F. Glotin, and J. M. Ortega, Opt. Lett. 30,2388-2390 (2005).3. A. Dazzi, in Biomedical Vibrational <strong>Spectroscopy</strong>, edited byJ. Kneipp and P. Lasch (Wiley, Hoboken, NJ, USA, 2008),pp. 291-312.Representative: Your local representative: LOT-Oriel EuropeLOT-Oriel EuropeIm Tiefen See 58, 64293 Darmstadt, Germanywww.lot-oriel.dewww.lot-oriel.com info@lot-oriel.de© 2010 Anasys Instruments Corporation. All rights reserved.www.anasysinstruments.com | info@anasysinstruments.com


