Investment Newsletter - Max Life Insurance
Investment Newsletter - Max Life Insurance
Investment Newsletter - Max Life Insurance
- No tags were found...

You also want an ePaper? Increase the reach of your titles
YUMPU automatically turns print PDFs into web optimized ePapers that Google loves.
TraditionalFunds`Growth FundSuper Fund<strong>Newsletter</strong>VOLUME 8BalancedFund
CIO’s VIEWSDear Policyholder,This is the eighth issue of the “<strong>Max</strong> <strong>Life</strong> Invest Track “is a good forum toreach out to all of you and give you a perspective on what the <strong>Max</strong> <strong>Life</strong><strong>Investment</strong> Team is thinking and doing with your funds.The last few months have seen very high volatile movements in equity,bond and even currency markets that drew parallels with the year 2008.In the month of June, US Fed Chairman, Ben Bernanke, hinted that QE-3could be tapered down if the US economy showed signs of growth. Thistriggered a lot of panic selling across both Emerging Market equities andfixed income assets. Emerging market currencies too suffered forcingCentral banks to either pause or tighten monetary policy to prevent further weakness in currencies.India too unfortunately is one of Emerging markets impacted by the global events arising out of theUS. The Reserve Bank of India has tried to bring about some stability to the Rupee. TheGovernment too is trying to step up reforms and boost productivity of existing investments tocreate a favourable investment climate.These last few months have been challenging and difficult to maneuver with currency volatilityapplying severe pressure on markets. The fall in global commodities has been neutralized bycurrency depreciation, and this could even have a detrimental impact on our FY 14 subsidy bill.RBI is wary of these developments and our burgeoning CAD and its funding dependency onexternal flows could pause loosening in monetary policy for at-least sometime. The favourablemonsoon this year should ensure that food price inflation is under control for FY14. We believe thata stable rupee and clarity in US data will be crucial determinants of the direction asset markets takein the short term. Our fund managers have tried to tactically adjust asset allocations and durationto put our view and outlook into practice.In this issue of quarterly newsletter, we have included an article oncurrency depreciation, which tries to make the point that all is not lostas the rupee has depreciated. It should be seen as a correctivemechanism with certain positives as well. The positives, however,may take some time to materialize. Financial goals andinvestments should remain on track during such volatile times.Regards,Prashant SharmaCIO, <strong>Max</strong> <strong>Life</strong> <strong>Insurance</strong>.
`FUND FACT SHEETSVOLUME 8(All funds as on 30 th June 2013, are being featured in thisnewsletter).
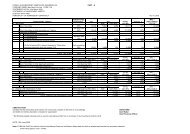
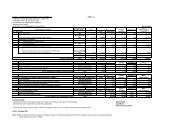
Traditional FundsAUM (Rs in crores) 10,003 As on: 30‐Jun‐13Fund's Objective :The investment philosophy of the fund is to buy and hold in‐line with liability profile and cash flows. The focus is on safety and security ofinvestments, which is ensured by investing primarily in Govt. Securities and high quality corporate bonds.Company Exposure ‐ Top 10Issuer/CompaniesAs % of fund59%4%4%3%3%2%2%2%1%Asset Allocation ‐ Traditional Fund2%Central & State Government34%Power Finance Corporation LimitedG‐sec5%Rural Electrification Corporation LimitedCorporate BondsPower Grid Corporation of india LimitedShort Term investmentLIC Housing Finance Limited Equity58%Housing Development Finance Corp.LimitedIndian Railway Finance CorporationNational Bank for Agriculture & Rural DevelopmentSteel Authority of India LimitedExport Import Bank of India Limited1% Rating bucket% Maturity bucket%AAA/AAA+(‐)/P1+/A1+ 98% Less than 1year3%Other Portfolio Parameters AA/AA+(‐) 2% 1 year to 3 years6%Average maturity in years (Fixed income) 15.5 A/ A+(‐) 0% 3 years to 7 years17%M ‐ Duration (Fixed Income)6.6 Over 7 years74%Total100% Total100%(of rated fixed income )(of fixed income portfolio)
`FUND FACT SHEETSVOLUME 8FactsheetsUnit Linked <strong>Life</strong> Funds
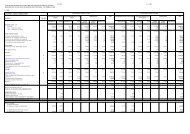
<strong>Life</strong> Growth Super FundInception dateAUM (Rs in crores)NAV (p.u.)As on :Approved Asset AllocationShort Term <strong>Investment</strong> 0‐30%Equity70‐100%G‐sec0‐20%Corporate Bonds0‐20%NAV (Rs per unit) Chart‐ Since Inception2015105‐21‐May‐07ULIF01108/02/07LIFEGRWSUP104‐Growth Super2,548Fund's objective :The investment objective of the equity fund is to provide potentially higher returns to17.1173 Unit‐holders by investing predominantly in Equities (to target growth in capital value of assets); however, the fund may also invest in Government securities, corporate bonds and money market30‐Jun‐13 instruments.Benchmark Composition: NSE Nifty(100%),I Sec Gilt Index (0%),Crisil Bond Index (0%), Crisil Liquid Index (0%)Distribution of Monthly Returns (Since Inception)G‐secCorporate BondsShort Term investmentEquity96%1% 3%0%No.of Mon nths105010Rating bucket % Maturity bucket %Industry Exposure ‐ Top 10 Products Applicable of <strong>Max</strong> <strong>Life</strong> <strong>Insurance</strong> Co. Ltd.AAA & equivalent100% Less than 1year 90% Financial And <strong>Insurance</strong> Activities** 26% Mfr Motor Ve Trailer & Semi‐Trailer7% <strong>Max</strong> <strong>Life</strong> Shiksha Plus II‐ 104L062V01AA & equivalent0% 1 year to 3 years 0% Computer Prog Consul & Related Act 12% Civil Engineering5% <strong>Max</strong> <strong>Life</strong> Flexi Fortune‐ 104L064V01A & equivalent0% 3 years to 7 years 10% Mfr of Coke & Ref. Petro Prod. 9% Extraction Crud Petro & Natural Gas3% <strong>Max</strong> <strong>Life</strong> Fortune Builder ‐ 104L058V01Total100% Over 7 years 0% Mfr of Tobacco Products 8% Ele Gas Steam & Air Condition Suply3% <strong>Max</strong> <strong>Life</strong> Shiksha Plus ‐ 104L059V01of rated fixed incomeTotal 100% Mfr of Pharma Medi & Botanical Prod 7% Telecommunications3% <strong>Max</strong> <strong>Life</strong> Unit Builder Plus‐ 104L057V01(of fixed income investments)of total fund size<strong>Max</strong> <strong>Life</strong> Amsure Magic Builder‐ 104L055V01<strong>Max</strong> <strong>Life</strong> SMART Xpress‐ 104L051V01<strong>Max</strong> <strong>Life</strong> Fast Track‐ 104L067V01<strong>Max</strong> <strong>Life</strong> Shubh Invest‐ 104L061V01Annualized Returns* Fund Benchmark Risk Attributes Fund Benchmark Fixed Income Company Exposure ‐ Top 10Since inception9.2% 5.2% Beta 0.8 1.0 Average Maturity in years 0.9 Issuer/CompaniesTwo Year Rolling Return (%)0.7% 1.7% Standard Deviation 25.0% 30.3% M‐ Duration 0.7 Reliance Industries Limited8%One Year Rolling Return (%)9.8% 10.7% Sharpe ratio 0.1 (0.1) Indian Tobacco Co.Limited8%YTD (Financial Year)2.9% 2.8% Treynor ratio 0.0 (0.0) Infosys Technologies Limited8%Last Quarter29% 2.9% 28% 2.8% Risk Free Rate assumed 7% Housing Development Finance Corp.Limited7%Avg monthly return1.0% 0.7% ICICI Bank Limited7%Best Monthly return26.9% 28.1% Housing Development Finance Corp.Bank6%Worst Monthly return‐19.5% ‐26.4% Larsen & Turbo Limited5%**Including CD & FD investments Oil & Natural Gas Corporation Limited3%* Returns less than one year are absolute returns. Bharti Airtel LimitedTata Consultancy Services Limited3%3%
<strong>Life</strong> High Growth FundInception dateAUM (Rs in crores)NAV (p.u.)As on :Approved Asset AllocationShort Term <strong>Investment</strong>EquityG‐secCorporate BondsNAV (Rs per unit) Chart‐ Since Inception15105‐26‐Feb‐08ULIF01311/02/08LIFEHIGHGR104‐High Growth40Fund's objective :The investment objective of the High Growth Fund is to provide potentially higher returns to policyholders in the long term. The Fund will invest predominantly in equities of13.9759 companies with high growth potential in the long term (to target growth in capital value of assets); however, the fund will also invest in government securities, corporate bonds and money market30‐Jun‐13 instruments, hence the risk involved is relatively higher.Benchmark Composition: NSE Nifty(100%),I Sec Gilt Index (0%),Crisil Bond Index (0%), Crisil Liquid Index (0%)Distribution of Monthly Returns (Since Inception)0‐30%2% 5%70‐100%150‐30% G‐sec100‐30%Corporate Bonds5Short Term investmentEquity93%No.of Mon nths010Rating bucket % Maturity bucket %Industry Exposure ‐ Top 10 Products Applicable of <strong>Max</strong> <strong>Life</strong> <strong>Insurance</strong> Co. Ltd.AAA & equivalent86% Less than 1year 90% Financial And <strong>Insurance</strong> Activities** 24% Mfr Motor Ve Trailer & Semi‐Trailer7% <strong>Max</strong> <strong>Life</strong> Fortune Builder ‐ 104L058V01AA & equivalent14% 1 year to 3 years 5% Computer Prog Consul & Related Act 11% Mfr Other Non‐Metallic Mineral Prod5% <strong>Max</strong> <strong>Life</strong> Shiksha Plus ‐ 104L059V01A & equivalent0% 3 years to 7 years 5% Mfr of Tobacco Products 8% Extraction Crud Petro & Natural Gas4% <strong>Max</strong> <strong>Life</strong> Unit Builder Plus‐ 104L057V01Total100% Over 7 years 0% Mfr of Coke & Ref. Petro Prod. 8% Civil Engineering4% <strong>Max</strong> <strong>Life</strong> Amsure Magic Builder‐ 104L055V01of rated fixed incomeTotal 100% Mfr of Pharma Medi & Botanical Prod 8% Mfr of Chemicals & Chemical Product4% <strong>Max</strong> <strong>Life</strong> SMART Xpress‐ 104L051V01(of fixed income investments)of total fund sizeAnnualized Returns* Fund Benchmark Risk Attributes Fund Benchmark Fixed IncomeCompany Exposure ‐ Top 10Since inception6.5% 1.9% Beta 0.7 1.0 Average Maturity in years 0.5 Issuer/CompaniesTwo Year Rolling Return (%)4.5% 1.7% Standard Deviation 22.6% 29.1% M‐ Duration 0.4 Indian Tobacco Co.Limited8%One Year Rolling Return (%)13.9% 10.7% Sharpe ratio (0.0) (0.2) Reliance Industries Limited8%YTD (Financial Year)4.0% 2.8% Treynor ratio (0.0) (0.1) Infosys Technologies Limited8%Last Quarter40% 4.0% 28% 2.8% Risk Free Rate assumed 7% Housing Development Finance Corp.Limited7%Avg monthly return0.7% 0.5% ICICI Bank Limited6%Best Monthly return22.1% 28.1% Housing Development Finance Corp.Bank5%Worst Monthly return‐21.4% ‐26.4% Larsen & Turbo Limited4%**Including CD & FD investments Oil & Natural Gas Corporation Limited4%* Returns less than one year are absolute returns. Tata Consultancy Services LimitedBharti Airtel Limited3%3%
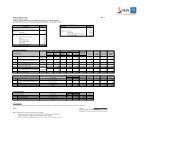
<strong>Life</strong> Growth FundInception dateAUM (Rs in crores)NAV (p.u.)As on :Approved Asset AllocationShort Term <strong>Investment</strong>EquityG‐secCorporate BondsNAV (Rs per unit) Chart‐ Since Inception3530252015105‐30‐Sep‐04Fund ID: ULIF00125/06/04LIFEGROWTH104‐Growth5,174Fund's objective :The investment objective of the fund is to provide potentially higher returns to unit holders by investing primarily in Equities (to target growth in capital value of assets); however,33.0992 the fund will also invest in Government securities, corporate bonds and money market instruments.30‐Jun‐13Benchmark Composition: NSE Nifty(60%),I Sec Gilt Index (15%),Crisil Bond Index (15%), Crisil Liquid Index (10%)Distribution of Monthly Returns (Since Inception)0‐40%7%1520‐70%55%0‐30%0‐30% G‐sec 27%10Corporate BondsShort Term investmentEquity11%No.of Mon nths5010Rating bucket % Maturity bucket %Industry Exposure ‐ Top 10 Products Applicable of <strong>Max</strong> <strong>Life</strong> <strong>Insurance</strong> Co. Ltd.AAA & equivalent85% Less than 1year 18% Financial And <strong>Insurance</strong> Activities** 38% Mfr of Tobacco Products4% <strong>Max</strong> <strong>Life</strong> Fast Track‐ 104L067V01AA & equivalent15% 1 year to 3 years 10% Central & State Government 7% Mfr of Pharma Medi & Botanical Prod4% <strong>Max</strong> <strong>Life</strong> Flexi Fortune‐ 104L064V01A & equivalent0% 3 years to 7 years 28% Mfr of Coke & Ref. Petro Prod. 6% Mfr Motor Ve Trailer & Semi‐Trailer4% <strong>Max</strong> <strong>Life</strong> MAXIS‐ 104L071V01Total100% Over 7 years 44% Computer Prog Consul & Related Act 6% Mfr of Basic Metals4% <strong>Max</strong> <strong>Life</strong> Shiksha Plus II‐ 104L062V01of rated fixed incomeTotal 100% Liquid Mutual Fund 5% Ele Gas Steam & Air Condition Suply3% <strong>Max</strong> <strong>Life</strong> SMART Xpress‐ 104L051V01(of fixed income investments)of total fund sizeAnnualized Returns* Fund Benchmark Risk Attributes Fund Benchmark Fixed Income Company Exposure ‐ Top 10Since inception14.6% 12.4% Beta 0.8 1.0 Average Maturity in years 7.1 Issuer/CompaniesTwo Year Rolling Return (%)4.0% 5.2% Standard Deviation 15.3% 17.7% M‐ Duration 4.1 Central & State Government7%One Year Rolling Return (%)10.1% 10.6% Sharpe ratio 0.5 0.3 Power Finance Corporation Limited7%YTD3.2% 3.0% Treynor ratio 0.1 0.1 Housing Development Finance Corp.Limited6%Last Quarter32% 3.2% 30% 3.0% Risk Free Rate assumed 7% Reliance Industries Limited6%Avg monthly return1.2% 1.1% Infosys Technologies Limited5%Best Monthly return14.9% 16.2% Indian Tobacco Co.Limited4%Worst Monthly return‐12.1% ‐15.5% ICICI Bank Limited4%**Including CD & FD investments Housing Development Finance Corp.Bank3%* Returns less than one year are absolute returns. Larsen & Turbo LimitedOil & Natural Gas Corporation Limited3%2%
<strong>Life</strong> Balanced FundInception dateAUM (Rs in crores)NAV (p.u.)As on :Approved Asset AllocationShort Term <strong>Investment</strong>EquityG‐SecCorporate BondsNAV (Rs per unit) Chart‐ Since Inception30252015105‐20‐Sep‐04699ULIF00225/06/04LIFEBALANC104‐BalancedFund's objective :The investment objective of the Balanced Fund is to provide balanced returns from investing in both fixed income securities (to target stability of returns) as well as in equities26.0911 (to target growth in capital value of assets).30‐Jun‐13Benchmark Composition: NSE Nifty(30%),I Sec Gilt Index (30%),Crisil Bond Index (30%), Crisil Liquid Index (10%)Distribution of Monthly Returns (Since Inception)0‐40%10‐40%29%25%2520‐50%2020‐40%G‐sec 15Corporate BondsShort Term investmentEquity9%37%No.of Mon nths105010Rating bucket % Maturity bucket %Industry Exposure ‐ Top 10Products Applicable of <strong>Max</strong> <strong>Life</strong> <strong>Insurance</strong> Co. Ltd.AAA & equivalent90% Less than 1year 10% Financial And <strong>Insurance</strong> Activities** 38% Mfr of Coke & Ref. Petro Prod.3% <strong>Max</strong> <strong>Life</strong> Fast Track‐ 104L067V01AA & equivalent10% 1 year to 3 years 15% Central & State Government 26% Ele Gas Steam & Air Condition Suply3% <strong>Max</strong> <strong>Life</strong> Flexi Fortune‐ 104L064V01A & equivalent0% 3 years to 7 years 29% Liquid Mutual Fund 5% Mfr of Pharma Medi & Botanical Prod3% <strong>Max</strong> <strong>Life</strong> MAXIS‐ 104L071V01Total100% Over 7 years 46% Computer Prog Consul & Related Act 4% Mfr Motor Ve Trailer & Semi‐Trailer2% <strong>Max</strong> <strong>Life</strong> Shiksha Plus II‐ 104L062V01of rated fixed incomeTotal 100% Mfr of Basic Metals 3% Mfr of Tobacco Products2% <strong>Max</strong> <strong>Life</strong> SMART Xpress‐ 104L051V01(of fixed income investments)of total fund sizeAnnualized Returns* Fund Benchmark Risk Attributes Fund Benchmark Fixed Income Company Exposure ‐ Top 10Since inception11.6% 9.9% Beta 0.9 1.0 Average Maturity in years 7.0 Issuer/CompaniesTwo Year Rolling Return (%)7.8% 7.6% Standard Deviation 8.3% 9.0% M‐ Duration 4.3 Central & State Government26%One Year Rolling Return (%)11.8% 10.6% Sharpe ratio 0.5 0.3 Power Finance Corporation Limited8%YTD (Financial Year)3.3% 3.1% Treynor ratio 0.1 0.0 Housing Development Finance Corp.Limited7%Last Quarter33% 3.3% 31% 3.1% Risk Free Rate assumed 7% Tata Mutual Fund5%Avg monthly return0.9% 0.8% LIC Housing Finance Limited3%Best Monthly return7.3% 7.5% Reliance Industries Limited3%Worst Monthly return‐6.9% ‐6.7% Infrastructure Development Finance Co.Limited3%**Including CD & FD investments Infosys Technologies Limited2%* Returns less than one year are absolute returns. Hindalco Industries LimitedIndian Tobacco Co.Limited2%2%
<strong>Life</strong> Conservative FundInception dateAUM (Rs in crores)NAV (p.u.)As on :Approved Asset AllocationShort Term <strong>Investment</strong>EquityG‐secCorporate BondsNAV (Rs per unit) Chart‐ Since Inception252015105‐20‐Sep‐0463ULIF00325/06/04LIFECONSER104‐ConservativeFund's objective :The investment objective of this fund is to provide stable return by investing in assets of relatively low to moderate level of risk. The fund will invest primarily in fixed interest23.2055 securities such as Government Securities, Corporate bonds etc.30‐Jun‐13Benchmark Composition: NSE Nifty (10%),I Sec Gilt Index (60%),Crisil Bond Index (22.5%), Crisil Liquid Index (7.5%)Distribution of Monthly Returns (Since Inception)0‐40%0‐15%7% 9%2550‐80%200‐50%G‐sec 15Corporate BondsShort Term investmentEquity32%52%No.of Mon nths105010Rating bucket % Maturity bucket %Industry Exposure ‐ Top 10Products Applicable of <strong>Max</strong> <strong>Life</strong> <strong>Insurance</strong> Co. Ltd.AAA & equivalent95% Less than 1year 8% Central & State Government 56% Mfr of Coke & Ref. Petro Prod.1% <strong>Max</strong> <strong>Life</strong> Fast Track‐ 104L067V01AA & equivalent5% 1 year to 3 years 4% Financial And <strong>Insurance</strong> Activities** 26% Mfr of Pharma Medi & Botanical Prod1% <strong>Max</strong> <strong>Life</strong> Flexi Fortune‐ 104L064V01A & equivalent0% 3 years to 7 years 56% Ele Gas Steam & Air Condition Suply 6% Mfr of Tobacco Products1% <strong>Max</strong> <strong>Life</strong> MAXIS‐ 104L071V01Total100% Over 7 years 32% Civil Engineering 2% Mfr Motor Ve Trailer & Semi‐Trailer1% <strong>Max</strong> <strong>Life</strong> Shiksha Plus II‐ 104L062V01of rated fixed incomeTotal 100% Computer Prog Consul & Related Act 1% Telecommunications0% <strong>Max</strong> <strong>Life</strong> SMART Xpress‐ 104L051V01(of fixed income investments)of total fund sizeAnnualized Returns* Fund Benchmark Risk Attributes Fund Benchmark Fixed Income Company Exposure ‐ Top 10Since inception10.1% 8.0% Beta 0.8 1.0 Average Maturity in years 7.6 Issuer/CompaniesTwo Year Rolling Return (%)10.4% 9.3% Standard Deviation 4.1% 4.1% M‐ Duration 4.4 Central & State Government56%One Year Rolling Return (%)12.9% 10.4% Sharpe ratio 0.7 0.3 Power Grid Corporation of india Limited5%YTD (Financial Year)4.0% 3.1% Treynor ratio 0.0 0.0 Housing Development Finance Corp.Limited5%Last Quarter40% 4.0% 31% 3.1% Risk Free Rate assumed 7% LIC Housing Finance Limited4%Avg monthly return0.8% 0.6% India Infrastructure Finance Company Limited3%Best Monthly return6.8% 7.5% Infrastructure Leasing & Finance Services Limited3%Worst Monthly return‐3.3% ‐3.0% Housing Development Finance Corp.Bank2%**Including CD & FD investments Oriental Bank of Commerce2%* Returns less than one year are absolute returns. Sundaram Finance LimitedLarsen & Turbo Limited2%2%
<strong>Life</strong> Secured FundInception date20‐Sep‐04AUM (Rs in crores)200ULIF00425/06/04LIFESECURE104‐SecuredFund's objective :The investment objective of this fund is to provide stable return by investing relatively low risk assets. The fund will invest exclusively in fixed interest securities such asNAV (p.u.)19.6784 Government Securities, Corporate bonds etc.As on :30‐Jun‐13Benchmark Composition: NSE Nifty(0%),I Sec Gilt Index (70%),Crisil Bond Index (25%), Crisil Liquid Index (5%)Approved Asset AllocationDistribution of Monthly Returns (Since Inception)Short Term <strong>Investment</strong> 0‐40%Equity0‐0%0% 14%25G‐sec50‐100%20Corporate Bonds 0‐50%G‐sec 52%15Corporate Bonds34%105NAV (Rs per unit) Chart‐ Since Inception252015105‐Short Term investmentEquityNo.of Mon nths010Rating bucket % Maturity bucket %Industry Exposure ‐ Top 10 Products Applicable of <strong>Max</strong> <strong>Life</strong> <strong>Insurance</strong> Co. Ltd.AAA & equivalent96% Less than 1year 7% Central & State Government 58% Mfr of Pharma Medi & Botanical Prod0% <strong>Max</strong> <strong>Life</strong> Fast Track‐ 104L067V01AA & equivalent4% 1 year to 3 years 11% Financial And <strong>Insurance</strong> Activities** 28% Mfr of Chemicals & Chemical Product0% <strong>Max</strong> <strong>Life</strong> Flexi Fortune‐ 104L064V01A & equivalent0% 3 years to 7 years 38% Ele Gas Steam & Air Condition Suply 6% <strong>Max</strong> <strong>Life</strong> MAXIS‐ 104L071V01Total100% Over 7 years 44% Liquid Mutual Fund 5% <strong>Max</strong> <strong>Life</strong> Shiksha Plus II‐ 104L062V01of rated fixed incomeTotal 100% Mfr of Basic Metals 0% <strong>Max</strong> <strong>Life</strong> SMART Xpress‐ 104L051V01(of fixed income investments)of total fund sizeAnnualized Returns* Fund Benchmark Risk Attributes Fund Benchmark Fixed IncomeCompany Exposure ‐ Top 10Since inception8.0% 7.0% Beta 0.5 1.0 Average Maturity in years 8.2 Issuer/CompaniesTwo Year Rolling Return (%)11.8% 10.1% Standard Deviation 2.8% 3.1% M‐ Duration 4.3 Central & State Government58%One Year Rolling Return (%)13.6% 10.4% Sharpe ratio 0.4 (0.0) Power Finance Corporation Limited7%YTD (Financial Year)4.8% 3.1% Treynor ratio 0.0 (0.0) LIC Housing Finance Limited6%Last Quarter48% 4.8% 31% 3.1% Risk Free Rate assumed 7% Housing Development Finance Corp.Limited5%Avg monthly return0.6% 0.6% ICICI Mutual Fund5%Best Monthly return9.7% 7.8% Power Grid Corporation of india Limited4%Worst Monthly return‐2.8% ‐2.0% Nuclear Power Corporation2%**Including CD & FD investments Housing Development Finance Corp.Bank2%* Returns less than one year are absolute returns. ICICI Bank LimitedInfrastructure Leasing & Finance Services Limited2%1%
<strong>Life</strong> Dynamic Opportunity fundInception dateAUM (Rs in crores)NAV (p.u.)As on :Approved Asset AllocationShort Term <strong>Investment</strong>EquityG‐secCorporate BondsNAV (Rs per unit) Chart‐ Since Inception2015105‐2‐May‐08ULIF01425/03/08LIFEDYNOPP104‐Dynamic Opportunities705Fund's Objective :The investment objective of this fund is to provide potentially higher returns to the policyholder by dynamically investing in Equities, Debt or cash instruments to capitalize on14.9073 changing market conditions. The funds will have flexibility to increase or decrease the debt‐equity ratio of the fund basis the opportunities available in the market.30‐Jun‐13Benchmark Composition: NSE Nifty(50%), I Sec Gilt Index (20%),Crisil Bond Index (20%),Crisil Liquid Index (10%)Distribution of Monthly Returns (Since Inception)0‐40%2%0‐100%1527%0‐100%63%0‐100% G‐sec 10Corporate BondsShort Term investmentEquity8%No.of Mon nths5010Rating bucket % Maturity bucket %Industry Exposure ‐ Top 10 Products Applicable of <strong>Max</strong> <strong>Life</strong> <strong>Insurance</strong> Co. Ltd.AAA & equivalent92% Less than 1year 15% Financial And <strong>Insurance</strong> Activities** 43% Mfr of Coke & Ref. Petro Prod.4% <strong>Max</strong> <strong>Life</strong> SMART Xpress‐ 104L051V01AA & equivalent8% 1 year to 3 years 26% Mfr of Pharma Medi & Botanical Prod 9% Ele Gas Steam & Air Condition Suply4%A & equivalent0% 3 years to 7 years 30% Computer Prog Consul & Related Act 6% Mfr of Tobacco Products4%Total100% Over 7 years 30% Liquid Mutual Fund 5% Mfr of Chemicals & Chemical Product3%of rated fixed incomeTotal 100% Mfr Motor Ve Trailer & Semi‐Trailer 5% Mfr Other Non‐Metallic Mineral Prod2%(of fixed income investments)of total fund sizeAnnualized Returns* Fund Benchmark Risk Attributes Fund Benchmark Fixed Income Company Exposure ‐ Top 10Since inception8.0% 5.8% Beta 1.0 1.0 Average Maturity in years 5.0 Issuer/CompaniesTwo Year Rolling Return (%)3.9% 6.0% Standard Deviation 14.6% 14.5% M‐ Duration 3.4 Power Finance Corporation Limited9%One Year Rolling Return (%)9.6% 10.6% Sharpe ratio 0.1 (0.1) Housing Development Finance Corp.Limited7%YTD (Financial Year)2.8% 3.0% Treynor ratio 0.0 (0.0) ICICI Mutual Fund5%Last Quarter28% 2.8% 30% 3.0% Risk Free Rate assumed 7% Reliance Industries Limited4%Avg monthly return0.7% 0.5% Infosys Technologies Limited4%Best Monthly return14.2% 13.3% Rural Electrification Corporation Limited4%Worst Monthly return‐11.4% ‐12.6% Indian Tobacco Co.Limited4%**Including CD & FD investments Infrastructure Development Finance Co.Limited3%* Returns less than one year are absolute returns. Jammu & Kashmir Bank LimitedHousing Development Finance Corp.Bank3%3%
<strong>Life</strong> Money Market FundInception dateAUM (Rs in crores)NAV (p.u.)As on :Approved Asset AllocationShort Term <strong>Investment</strong>EquityG‐secCorporate BondsNAV (Rs per unit) Chart‐ Since Inception15105‐11‐May‐0937ULIF01528/04/09LIFEMONEYM104‐Money MarketFund's Objective :The investment objective of the fund is to provide low risk returns primarily through a portfolio of treasury bills of duration ranging from 91 days to 180 days and cash. The goal12.3775 of this fund is to preserve principal while yielding a modest return.30‐Jun‐13Benchmark Composition: NSE Nifty(0%), I Sec Gilt Index (0%),Crisil Bond Index (0%),Crisil Liquid Index (100%)Distribution of Monthly Returns (Since Inception)10‐0%150‐0%0‐0%0% G‐sec 10Corporate BondsShort Term investmentEquity100%No.of Mon nths5010Rating bucket % Maturity bucket %Industry Exposure ‐ Top 10Products Applicable of <strong>Max</strong> <strong>Life</strong> <strong>Insurance</strong> Co. Ltd.AAA & equivalent100% Less than 1year 100% Central & State Government 100% <strong>Max</strong> <strong>Life</strong> Fast Track‐ 104L067V01AA & equivalent0% 1 year to 3 years 0% <strong>Max</strong> <strong>Life</strong> Flexi Fortune‐ 104L064V01A & equivalent0% 3 years to 7 years 0% <strong>Max</strong> <strong>Life</strong> MAXIS‐ 104L071V01Total100% Over 7 years 0% <strong>Max</strong> <strong>Life</strong> Shiksha Plus II‐ 104L062V01of rated fixed incomeTotal 100%(of fixed income investments)of total fund sizeAnnualized Returns* Fund Benchmark Risk Attributes Fund Benchmark Fixed Income Company Exposure ‐ Top 10Since inception5.3% 6.7% Beta 0.7 1.0 Average Maturity in years 0.2 Issuer/CompaniesTwo Year Rolling Return (%)7.1% 8.4% Standard Deviation 0.1% 0.1% M‐ Duration 0.2 Central & State Government100%One Year Rolling Return (%)7.0% 8.1% Sharpe ratio (16.9) (2.5)YTD1.7% 2.1% Treynor ratio (0.0) (0.0)Last Quarter17% 1.7% 21% 2.1% Risk Free Rate assumed 7%Avg monthly return0.4% 0.5%Best Monthly return0.6% 0.8%Worst Monthly return0.0% 0.2%**Including CD & FD investments* Returns less than one year are absolute returns.
<strong>Life</strong> Secure Plus FundInception dateAUM (Rs in crores)NAV (p.u.)As on :Approved Asset AllocationShort Term <strong>Investment</strong>EquityG‐secCorporate BondsNAV (Rs per unit) Chart‐ Since Inception15105‐3‐Aug‐0932ULIF01628/04/09LIFESECPLS104‐Secure PlusFund's Objective :The investment objective of the fund is to provide higher security of investment by way of higher proportion of investment in sovereign paper that carries an implicit guarantee13.7517 for repayment of principal and interest from the government of India.30‐Jun‐13Benchmark Composition: NSE Nifty(0%), I Sec Gilt Index (75%),Crisil Bond Index (20%),Crisil Liquid Index (5%)Distribution of Monthly Returns (Since Inception)0‐40%0‐0%7%1560‐100%0‐60% G‐sec 1031%Corporate Bonds5Short Term investmentEquity62%No.of Mon nths010Rating bucket % Maturity bucket %Industry Exposure ‐ Top 10AAA & equivalent97% Less than 1year 5% Central & State Government 67%AA & equivalent3% 1 year to 3 years 6% Financial And <strong>Insurance</strong> Activities** 21%A & equivalent0% 3 years to 7 years 52% Ele Gas Steam & Air Condition Suply 8%Total100% Over 7 years 37% Mfr of Basic Metals 1%of rated fixed incomeTotal 100% Mfr of Pharma Medi & Botanical Prod 0%(of fixed income investments)of total fund sizeProducts Applicable of <strong>Max</strong> <strong>Life</strong> <strong>Insurance</strong> Co. Ltd.Annualized Returns* Fund Benchmark Risk Attributes Fund Benchmark Fixed Income Company Exposure ‐ Top 10Since inception8.0% 6.9% Beta 0.6 1.0 Average Maturity in years 7.3 Issuer/CompaniesTwo Year Rolling Return (%)11.5% 10.1% Standard Deviation 2.0% 1.9% M‐ Duration 4.1 Central & State Government67%One Year Rolling Return (%)13.4% 10.4% Sharpe ratio 0.5 (0.0) Power Grid Corporation of india Limited8%YTD (Financial Year)4.3% 3.1% Treynor ratio 0.0 (0.0) Housing Development Finance Corp.Limited7%Last Quarter43% 4.3% 31% 3.1% Risk Free Rate assumed 7% LIC Housing Finance Limited7%Avg monthly return0.6% 0.6% Infrastructure Leasing & Finance Services Limited2%Best Monthly return3.0% 2.1% ICICI Bank Limited2%Worst Monthly return‐1.1% ‐1.1% Oriental Bank of Commerce1%**Including CD & FD investments Tata Sons1%* Returns less than one year are absolute returns. Sundaram Finance LimitedNuclear Power Corporation1%1%
<strong>Life</strong> Guaranteed Fund‐ DynamicInception dateAUM (Rs in crores)NAV (p.u.)As on :Approved Asset AllocationShort Term <strong>Investment</strong>EquityG‐secCorporate BondsNAV (Rs per unit) Chart‐ Since Inception2015105‐10‐Nov‐064ULIF01004/10/06AMSRGUADYN104‐Guaranteed DynamicFund's Objective :The investment objective of this fund is to provide stable return by investing in assets of relatively low to moderate level of risk. The fund will invest primarily in fixed interest15.7282 securities such as Government Securities, Corporate bonds etc. However the fund will also invest in equities.30‐Jun‐13Benchmark Composition: NSE Nifty(15%), I Sec Gilt Index (50%),Crisil Bond Index (25%),Crisil Liquid Index (10%)Distribution of Monthly Returns (Since Inception)0‐40%0‐30%13%2550‐80%200‐50%G‐sec 14%15Corporate BondsShort Term investmentEquity21%52%No.of Mon nths105010Rating bucket % Maturity bucket %Industry Exposure ‐ Top 10 Products Applicable of <strong>Max</strong> <strong>Life</strong> <strong>Insurance</strong> Co. Ltd.AAA & equivalent99% Less than 1year 19% Central & State Government 63% Computer Prog Consul & Related Act1% <strong>Max</strong> <strong>Life</strong> Amsure Secure Returns Builder‐ 104L032V01AA & equivalent1% 1 year to 3 years 3% Financial And <strong>Insurance</strong> Activities** 20% Mfr of Pharma Medi & Botanical Prod1%A & equivalent0% 3 years to 7 years 27% Ele Gas Steam & Air Condition Suply 5% Mfr of Tobacco Products1%Total100% Over 7 years 50% Mfr of Coke & Ref. Petro Prod. 2% Civil Engineering1%of rated fixed incomeTotal 100% Mfr of Chemicals & Chemical Product 1% Mfr Motor Ve Trailer & Semi‐Trailer1%(of fixed income investments)of total fund sizeAnnualized Returns* Fund Benchmark Risk Attributes Fund Benchmark Fixed Income Company Exposure ‐ Top 10Since inception7.1% 8.0% Beta 0.8 1.0 Average Maturity in years 6.9 Issuer/CompaniesTwo Year Rolling Return (%)8.3% 8.9% Standard Deviation 5.3% 5.3% M‐ Duration 4.3 Central & State Government63%One Year Rolling Return (%)11.9% 10.4% Sharpe ratio 0.0 0.2 LIC Housing Finance Limited5%YTD4.2% 3.1% Treynor ratio 0.0 0.0 Nuclear Power Corporation5%Last Quarter42% 4.2% 31% 3.1% Risk Free Rate assumed 7% India Infrastructure Finance Company Limited3%Avg monthly return0.6% 0.7% National Bank for Agriculture & Rural Development2%Best Monthly return5.6% 7.2% Power Finance Corporation Limited2%Worst Monthly return‐3.9% ‐3.8% Infrastructure Leasing & Finance Services Limited2%**Including CD & FD investments State Bank of India2%* Returns less than one year are absolute returns. Reliance Industries LimitedHindustan Unilever Limited2%1%
<strong>Life</strong> Guaranteed Fund‐ IncomeInception dateAUM (Rs in crores)NAV (p.u.)As on :10‐Nov‐06ULIF00904/10/06AMSRGUAINC104‐Guaranteed Income1Fund's Objective :The investment objective of this fund is to provide stable return by investing in relatively low risk assets. The fund will invest primarily in fixed interest securities such as15.2558 Government Securities, Corporate bonds etc. However the fund will also invest in equities.30‐Jun‐13Benchmark Composition: NSE Nifty(5%), I Sec Gilt Index (75%),Crisil Bond Index (10%),Crisil Liquid Index (10%)Distribution of Monthly Returns (Since Inception)Approved Asset AllocationShort Term <strong>Investment</strong> 0‐40%Equity0‐15%304%G‐sec 50‐100%22%250‐50% G‐sec 20Corporate Bonds15NAV (Rs per unit) Chart‐ Since Inception2015105‐Corporate BondsShort Term investmentEquity15%59%No.of Mon nths105010Rating bucket % Maturity bucket %Industry Exposure ‐ Top 10 Products Applicable of <strong>Max</strong> <strong>Life</strong> <strong>Insurance</strong> Co. Ltd.AAA & equivalent100% Less than 1year 22% Central & State Government 76% Mfr of Pharma Medi & Botanical Prod0% <strong>Max</strong> <strong>Life</strong> Amsure Secure Returns Builder‐ 104L032V01AA & equivalent0% 1 year to 3 years 0% Financial And <strong>Insurance</strong> Activities** 18% Mfr of Tobacco Products0%A & equivalent0% 3 years to 7 years 43% Computer Prog Consul & Related Act 1% Mfr Motor Ve Trailer & Semi‐Trailer0%Total100% Over 7 years 35% Extraction Crud Petro & Natural Gas 1% Civil Engineering0%of rated fixed incomeTotal 100% Mfr of Coke & Ref. Petro Prod. 0% Mfr of Chemicals & Chemical Product0%(of fixed income investments)of total fund sizeAnnualized Returns* Fund Benchmark Risk Attributes Fund Benchmark Fixed Income Company Exposure ‐ Top 10Since inception6.6% 7.9% Beta 0.5 1.0 Average Maturity in years 5.3 Issuer/CompaniesTwo Year Rolling Return (%)9.4% 9.7% Standard Deviation 3.1% 3.7% M‐ Duration 3.7 Central & State Government76%One Year Rolling Return (%)12.0% 10.3% Sharpe ratio (0.1) 0.3 National Bank for Agriculture & Rural Development6%YTD4.4% 3.0% Treynor ratio (0.0) 0.0 Infrastructure Leasing & Finance Services Limited5%Last Quarter44% 4.4% 30% 3.0% Risk Free Rate assumed 7% State Bank of India4%Avg monthly return0.5% 0.6% State Bank of Hyderabad2%Best Monthly return4.0% 7.7% Oil & Natural Gas Corporation Limited1%Worst Monthly return‐2.2% ‐2.1% Reliance Industries Limited0%**Including CD & FD investments Infosys Technologies Limited0%* Returns less than one year are absolute returns. Indian Tobacco Co.LimitedAxis Bank Limited0%0%
`FUND FACT SHEETSVOLUME 8FactsheetsUnit Linked Pension Funds
Pension Growth Super FundInception dateAUM (Rs in crores)NAV (p.u.)As on :Approved Asset AllocationShort Term <strong>Investment</strong> 0‐30%Equity70‐100%G‐sec0‐20%Corporate Bonds0‐20%NAV (Rs per unit) Chart‐ Since Inception15105‐16‐Nov‐07ULIF01213/08/07PENSGRWSUP104‐Pension Growth Super326Fund's objective :The investment objective of the equity fund is to provide potentially higher returns to10.6729 Unit‐holders by investing predominantly in Equities (to target growth in capital value of assets); however, the fund may also invest in Government securities, corporate bonds and money market30‐Jun‐13 instruments.Benchmark Composition: NSE Nifty(100%),I Sec Gilt Index (0%),Crisil Bond Index (0%), Crisil Liquid Index (0%)Distribution of Monthly Returns (Since Inception)G‐secCorporate BondsShort Term investmentEquity95%5%No.of Mon nths105010Rating bucket % Maturity bucket %Industry Exposure ‐ Top 10 Products Applicable of <strong>Max</strong> <strong>Life</strong> <strong>Insurance</strong> Co. Ltd.AAA & equivalent100% Less than 1year 100% Financial And <strong>Insurance</strong> Activities** 28% Mfr Motor Ve Trailer & Semi‐Trailer7% <strong>Max</strong> <strong>Life</strong> SMART Invest Pension‐ 104L040V01AA & equivalent0% 1 year to 3 years 0% Computer Prog Consul & Related Act 13% Civil Engineering4% <strong>Max</strong> <strong>Life</strong> Smart Invest Pension Plus‐ 104L053V01A & equivalent0% 3 years to 7 years 0% Mfr of Coke & Ref. Petro Prod. 9% Telecommunications4% <strong>Max</strong> <strong>Life</strong> Smart Invest Pension Super‐ 104L056V01Total100% Over 7 years 0% Mfr of Tobacco Products 7% Mfr of Chemicals & Chemical Product3%of rated fixed incomeTotal 100% Mfr of Pharma Medi & Botanical Prod 7% Extraction Crud Petro & Natural Gas3%(of fixed income investments)of total fund sizeAnnualized Returns* Fund Benchmark Risk Attributes Fund Benchmark Fixed Income Company Exposure ‐ Top 10Since inception1.2% ‐0.2% Beta 0.7 1.0 Average Maturity in years 0.4 Issuer/CompaniesTwo Year Rolling Return (%)1.9% 1.7% Standard Deviation 24.5% 30.2% M‐ Duration 0.4 Reliance Industries Limited8%One Year Rolling Return (%)10.5% 10.7% Sharpe ratio (0.2) (0.2) Indian Tobacco Co.Limited7%YTD2.9% 2.8% Treynor ratio (0.1) (0.1) Housing Development Finance Corp.Limited7%Last Quarter29% 2.9% 28% 2.8% Risk Free Rate assumed 7% Infosys Technologies Limited7%Avg monthly return0.3% 0.3% Housing Development Finance Corp.Bank7%Best Monthly return22.1% 28.1% ICICI Bank Limited5%Worst Monthly return‐19.7% ‐26.4% Larsen & Turbo Limited4%**Including CD & FD investments Bharti Airtel Limited4%* Returns less than one year are absolute returns. Tata Consultancy Services LimitedState Bank of India3%3%
Pension Growth FundInception dateAUM (Rs in crores)NAV (p.u.)As on :Approved Asset AllocationShort Term <strong>Investment</strong>EquityG‐secCorporate BondsNAV (Rs per unit) Chart‐ Since Inception252015105‐3‐Feb‐06ULIF00525/11/05PENSGROWTH104‐Pension Growth489Fund's objective :The investment objective of the Growth Fund is to provide potentially higher returns to unit holders by investing primarily in Equities (to target growth in capital value of assets);19.7105 however, the fund will also invest in Government securities, corporate bonds and money market instruments.30‐Jun‐13Benchmark Composition: NSE Nifty(60%),I Sec Gilt Index (15%),Crisil Bond Index (15%), Crisil Liquid Index (10%)Distribution of Monthly Returns (Since Inception)0‐40%13%20‐70%150‐30%56%0‐30% G‐sec 10Corporate BondsShort Term investmentEquity7%24%No.of Mon nths5010Rating bucket % Maturity bucket %Industry Exposure ‐ Top 10 Products Applicable of <strong>Max</strong> <strong>Life</strong> <strong>Insurance</strong> Co. Ltd.AAA & equivalent93% Less than 1year 9% Financial And <strong>Insurance</strong> Activities** 36% Mfr of Tobacco Products4% <strong>Max</strong> <strong>Life</strong> <strong>Life</strong> Maker Pension Plan‐ 104L026V01AA & equivalent7% 1 year to 3 years 23% Central & State Government 13% Liquid Mutual Fund4% <strong>Max</strong> <strong>Life</strong> SMART Invest Pension‐ 104L040V01A & equivalent0% 3 years to 7 years 28% Computer Prog Consul & Related Act 8% Mfr Motor Ve Trailer & Semi‐Trailer4% <strong>Max</strong> <strong>Life</strong> Smart Invest Pension Plus‐ 104L053V01Total100% Over 7 years 40% Mfr of Coke & Ref. Petro Prod. 6% Ele Gas Steam & Air Condition Suply3% <strong>Max</strong> <strong>Life</strong> Smart Invest Pension Super‐ 104L056V01of rated fixed incomeTotal 100% Mfr of Pharma Medi & Botanical Prod 5% Civil Engineering3%(of fixed income investments)of total fund sizeAnnualized Returns* Fund Benchmark Risk Attributes Fund Benchmark Fixed Income Company Exposure ‐ Top 10Since inception9.6% 9.6% Beta 0.8 1.0 Average Maturity in years 6.5 Issuer/CompaniesTwo Year Rolling Return (%)4.9% 5.2% Standard Deviation 15.3% 18.4% M‐ Duration 4.3 Central & State Government13%One Year Rolling Return (%)10.7% 10.6% Sharpe ratio 0.2 0.1 Power Finance Corporation Limited8%YTD3.2% 3.0% Treynor ratio 0.0 0.0 Housing Development Finance Corp.Limited7%Last Quarter32% 3.2% 30% 3.0% Risk Free Rate assumed 7% Reliance Industries Limited5%Avg monthly return0.9% 0.9% Infosys Technologies Limited5%Best Monthly return13.3% 16.2% Indian Tobacco Co.Limited4%Worst Monthly return‐12.2% ‐15.5% Infrastructure Development Finance Co.Limited4%**Including CD & FD investments Housing Development Finance Corp.Bank4%* Returns less than one year are absolute returns. ICICI Bank LimitedLarsen & Turbo Limited4%3%
Pension Balanced FundInception dateAUM (Rs in crores)NAV (p.u.)As on :3‐Feb‐06137ULIF00625/11/05PENSBALANC104‐Pension BalancedFund's Objective :The investment objective of this fund is to provide balanced returns from investing in both fixed income securities (to target stability of returns) as well as in equities (to target18.2189 growth in capital value of assets).30‐Jun‐13Benchmark Composition: NSE Nifty(30%), I Sec Gilt Index (30%),Crisil Bond Index (30%),Crisil Liquid Index (10%)Distribution of Monthly Returns (Since Inception)0‐40%10‐40%26%2520‐50%2020‐40%G‐sec 15Approved Asset AllocationShort Term <strong>Investment</strong>Equity 30%G‐secCorporate BondsNAV (Rs per unit) Chart‐ Since Inception2015105‐Corporate BondsShort Term investmentEquity11%33%No.of Mon nths105010Rating bucket % Maturity bucket %Industry Exposure ‐ Top 10 Products Applicable of <strong>Max</strong> <strong>Life</strong> <strong>Insurance</strong> Co. Ltd.AAA & equivalent94% Less than 1year 7% Financial And <strong>Insurance</strong> Activities** 36% Mfr of Coke & Ref. Petro Prod.3% <strong>Max</strong> <strong>Life</strong> <strong>Life</strong> Maker Pension Plan‐ 104L026V01AA & equivalent6% 1 year to 3 years 11% Central & State Government 31% Mfr of Tobacco Products2% <strong>Max</strong> <strong>Life</strong> SMART Invest Pension‐ 104L040V01A & equivalent0% 3 years to 7 years 33% Liquid Mutual Fund 4% Mfr of Pharma Medi & Botanical Prod2% <strong>Max</strong> <strong>Life</strong> Smart Invest Pension Plus‐ 104L053V01Total100% Over 7 years 49% Computer Prog Consul & Related Act 3% Mfr Motor Ve Trailer & Semi‐Trailer2% <strong>Max</strong> <strong>Life</strong> Smart Invest Pension Super‐ 104L056V01of rated fixed incomeTotal 100% Ele Gas Steam & Air Condition Suply 3% Civil Engineering2%(of fixed income investments)of total fund sizeAnnualized Returns* Fund Benchmark Risk Attributes Fund Benchmark Fixed Income Company Exposure ‐ Top 10Since inception8.4% 8.8% Beta 0.7 1.0 Average Maturity in years 7.0 Issuer/CompaniesTwo Year Rolling Return (%)8.3% 7.6% Standard Deviation 7.7% 9.4% M‐ Duration 4.6 Central & State Government31%One Year Rolling Return (%)12.0% 10.6% Sharpe ratio 0.2 0.2 Power Finance Corporation Limited8%YTD3.7% 3.1% Treynor ratio 0.0 0.0 Housing Development Finance Corp.Limited6%Last Quarter37% 3.7% 31% 3.1% Risk Free Rate assumed 7% Tata Mutual Fund4%Avg monthly return0.7% 0.7% Infrastructure Development Finance Co.Limited4%Best Monthly return6.8% ` 7.5% Housing Development Finance Corp.Bank4%Worst Monthly return‐6.1% ‐6.7% LIC Housing Finance Limited4%**Including CD & FD investments Rural Electrification Corporation Limited3%* Returns less than one year are absolute returns. Power Grid Corporation of india LimitedIndian Tobacco Co.Limited3%2%
Pension Conservative FundInception dateAUM (Rs in crores)NAV (p.u.)As on :Approved Asset AllocationShort Term <strong>Investment</strong>EquityG‐sec3‐Feb‐0620ULIF00725/11/05PENSCONSER104‐Pension ConservativeFund's Objective :The investment objective of this fund is to provide stable return by investing in assets of relatively low to moderate level of risk. The fund will invest primarily in fixed interest18.0129 securities such as Government Securities, Corporate bonds etc.30‐Jun‐13Benchmark Composition: NSE Nifty(10%), I Sec Gilt Index (60%),Crisil Bond Index (22.5%),Crisil Liquid Index (7.5%)Distribution of Monthly Returns (Since Inception)0‐40%0‐15%10% 7%2550‐80%200‐50%G‐sec 52%15Corporate Bonds 52%NAV (Rs per unit) Chart‐ Since Inception2015105‐Corporate BondsShort Term investmentEquity31%No.of Mon nths105010Rating bucket % Maturity bucket %Industry Exposure ‐ Top 10 Products Applicable of <strong>Max</strong> <strong>Life</strong> <strong>Insurance</strong> Co. Ltd.AAA & equivalent96% Less than 1year 8% Central & State Government 58% Computer Prog Consul & Related Act1% <strong>Max</strong> <strong>Life</strong> <strong>Life</strong> Maker Pension Plan‐ 104L026V01AA & equivalent4% 1 year to 3 years 5% Financial And <strong>Insurance</strong> Activities** 27% Mfr Motor Ve Trailer & Semi‐Trailer1% <strong>Max</strong> <strong>Life</strong> SMART Invest Pension‐ 104L040V01A & equivalent0% 3 years to 7 years 44% Ele Gas Steam & Air Condition Suply 6% Mfr of Pharma Medi & Botanical Prod0% <strong>Max</strong> <strong>Life</strong> Smart Invest Pension Plus‐ 104L053V01Total100% Over 7 years 42% Mfr of Coke & Ref. Petro Prod. 1% Civil Engineering0% <strong>Max</strong> <strong>Life</strong> Smart Invest Pension Super‐ 104L056V01of rated fixed incomeTotal 100% Mfr of Tobacco Products 1% Mfr of Chemicals & Chemical Product0%(of fixed income investments)of total fund sizeAnnualized Returns* Fund Benchmark Risk Attributes Fund Benchmark Fixed IncomeCompany Exposure ‐ Top 10Since inception8.3% 8.0% Beta 0.6 1.0 Average Maturity in years 7.6 Issuer/CompaniesTwo Year Rolling Return (%)10.4% 9.3% Standard Deviation 3.6% 4.2% M‐ Duration 4.5 Central & State Government58%One Year Rolling Return (%)13.5% 10.4% Sharpe ratio 0.4 0.2 India Infrastructure Finance Company Limited6%YTD4.4% 3.1% Treynor ratio 0.0 0.0 Housing Development Finance Corp.Limited5%Last Quarter44% 4.4% 31% 3.1% Risk Free Rate assumed 7% Power Grid Corporation of india Limited5%Avg monthly return0.7% 0.6% LIC Housing Finance Limited4%Best Monthly return4.0% 7.5% Power Finance Corporation Limited3%Worst Monthly return‐3.4% ‐3.0% Oriental Bank of Commerce2%**Including CD & FD investments Sundaram Finance Limited2%* Returns less than one year are absolute returns. Rural Electrification Corporation LimitedInfrastructure Leasing & Finance Services Limited2%1%
Pension Secured FundInception dateAUM (Rs in crores)NAV (p.u.)As on :Approved Asset AllocationShort Term <strong>Investment</strong>EquityG‐secCorporate BondsNAV (Rs per unit) Chart‐ Since Inception2015105‐3‐Feb‐0661ULIF00825/11/05PENSSECURE104‐Pension SecuredFund's strategy: The investment objective of this fund is to provide stable return by investing relatively low risk assets. The fund will invest exclusively in fixed interest securities such as17.4078 Government Securities, Corporate bonds etc.30‐Jun‐13Benchmark Composition:I Sec Gilt Index (70%),Crisil Bond Index (25%),Crisil Liquid Index (5%)Distribution of Monthly Returns (Since Inception)0‐40%011%2550‐100%200‐50%G‐sec 15Corporate BondsShort Term investmentEquity37%52%No.of Mon nths105010Rating bucket % Maturity bucket %Industry Exposure ‐ Top 10 Products Applicable of <strong>Max</strong> <strong>Life</strong> <strong>Insurance</strong> Co. Ltd.AAA & equivalent95% Less than 1year 3% Central & State Government 54% Mfr of Basic Metals0% <strong>Max</strong> <strong>Life</strong> <strong>Life</strong> Maker Pension Plan‐ 104L026V01AA & equivalent5% 1 year to 3 years 8% Financial And <strong>Insurance</strong> Activities** 27% Water Transport0% <strong>Max</strong> <strong>Life</strong> SMART Invest Pension‐ 104L040V01A & equivalent0% 3 years to 7 years 46% Ele Gas Steam & Air Condition Suply 9% Mfr of Chemicals & Chemical Product0% <strong>Max</strong> <strong>Life</strong> Smart Invest Pension Plus‐ 104L053V01Total100% Over 7 years 43% Liquid Mutual Fund 5% <strong>Max</strong> <strong>Life</strong> Smart Invest Pension Super‐ 104L056V01of rated fixed incomeTotal 100% Mfr of Pharma Medi & Botanical Prod 1%(of fixed income investments)of total fund sizeAnnualized Returns* Fund Benchmark Risk Attributes Fund Benchmark Fixed Income Company Exposure ‐ Top 10Since inception7.8% 7.4% Beta 0.4 1.0 Average Maturity in years 9.4 Issuer/CompaniesTwo Year Rolling Return (%)11.8% 10.1% Standard Deviation 2.5% 3.2% M‐ Duration 4.8 Central & State Government54%One Year Rolling Return (%)13.6% 10.4% Sharpe ratio 0.3 0.1 Power Grid Corporation of india Limited8%YTD4.6% 3.1% Treynor ratio 0.0 0.0 LIC Housing Finance Limited8%Last Quarter46% 4.6% 31% 3.1% Risk Free Rate assumed 7% Housing Development Finance Corp.Limited6%Avg monthly return0.6% 0.6% Tata Mutual Fund5%Best Monthly return6.5% 7.8% Power Finance Corporation Limited3%Worst Monthly return‐2.8% ‐2.0% Infrastructure Leasing & Finance Services Limited2%**Including CD & FD investments India Infrastructure Finance Company Limited2%* Returns less than one year are absolute returns. Housing Development Finance Corp.BankICICI Bank Limited1%1%
`FUND FACT SHEETSVOLUME 8FactsheetsUnit Linked Group Funds
Group Gratuity Growth FundInception dateAUM (Rs in crores)NAV (p.u.)As on :Approved Asset AllocationShort Term <strong>Investment</strong>EquityG‐secCorporate BondsNAV (Rs per unit) Chart‐ Since Inception2015105‐28‐Aug‐0614ULGF00117/04/06GRATGROWTH104‐Group Gratuity GrowthFund's Objective :The investment objective of the Growth Fund is to provide potentially higher returns to unit holders by investing primarily in Equities (to target growth in capital value of assets);17.1401 however, the fund will also invest in Government securities, corporate bonds and money market instruments.30‐Jun‐13Benchmark Composition: NSE Nifty (50%), I Sec Gilt Index (20%),Crisil Bond Index (20%),Crisil Liquid Index (10%)Distribution of Monthly Returns (Since Inception)0‐20%20‐60%34%26%250‐30%200‐30%G‐sec 15Corporate BondsShort Term investmentEquity16%24%No.of Mon nths105010Rating bucket % Maturity bucket %Industry Exposure ‐ Top 10 Products Applicable of <strong>Max</strong> <strong>Life</strong> <strong>Insurance</strong> Co. Ltd.AAA & equivalent95% Less than 1year 21% Central & State Government 33% Liquid Mutual Fund4% <strong>Max</strong> <strong>Life</strong> Unit Linked Group Gratuity Plan‐ 104L030V01AA & equivalent5% 1 year to 3 years 10% Financial And <strong>Insurance</strong> Activities** 32% Mfr of Coke & Ref. Petro Prod.4%A & equivalent0% 3 years to 7 years 35% Mfr of Pharma Medi & Botanical Prod 5% Civil Engineering2%Total100% Over 7 years 33% Mfr of Tobacco Products 4% Mfr Motor Ve Trailer & Semi‐Trailer2%of rated fixed incomeTotal 100% Computer Prog Consul & Related Act 4% Ele Gas Steam & Air Condition Suply2%(of fixed income investments)of total fund sizeAnnualized Returns* Fund Benchmark Risk Attributes Fund Benchmark Fixed Income Company Exposure ‐ Top 10Since inception8.2% 8.8% Beta 0.7 1.0 Average Maturity in years 6.3 Issuer/CompaniesTwo Year Rolling Return (%)6.3% 6.0% Standard Deviation 12.2% 15.0% M‐ Duration 3.9 Central & State Government33%One Year Rolling Return (%)11.8% 10.6% Sharpe ratio 0.1 0.1 Housing Development Finance Corp.Limited7%YTD3.9% 3.0% Treynor ratio 0.0 0.0 Housing Development Finance Corp.Bank5%Last Quarter39% 3.9% 30% 3.0% Risk Free Rate assumed 7% Power Finance Corporation Limited4%Avg monthly return0.7% 0.8% Indian Tobacco Co.Limited4%Best Monthly return9.9% 13.3% Tata Mutual Fund4%Worst Monthly return‐10.9% ‐12.6% State Bank of Patiala Limited4%**Including CD & FD investments Reliance Industries Limited3%* Returns less than one year are absolute returns. Rural Electrification Corporation LimitedDr.Reddy's Labortaries Limited3%3%
Group Gratuity Balanced FundInception dateAUM (Rs in crores)NAV (p.u.)As on :Approved Asset AllocationShort Term <strong>Investment</strong>EquityG‐secCorporate BondsNAV (Rs per unit) Chart‐ Since Inception2015105‐28‐Aug‐06ULGF00217/04/06GRATBALANC104‐Group Gratuity Balanced25Fund's Objective :The investment objective of the Balanced Fund is to provide balanced returns from investing in both fixed income securities (to target stability of returns) as well as in equities (to18.8596 target growth in capital value of assets).30‐Jun‐13Benchmark Composition: NSE Nifty(25%), I Sec Gilt Index (35%),Crisil Bond Index (30%),Crisil Liquid Index (10%)Distribution of Monthly Returns (Since Inception)0‐20%14%10‐40%1520‐50%34%20‐40% G‐sec 18%10Corporate BondsShort Term investmentEquity34%No.of Mon nths5010Rating bucket % Maturity bucket %Industry Exposure ‐ Top 10 Products Applicable of <strong>Max</strong> <strong>Life</strong> <strong>Insurance</strong> Co. Ltd.AAA & equivalent95% Less than 1year 16% Central & State Government 43% Mfr of Coke & Ref. Petro Prod.2% <strong>Max</strong> <strong>Life</strong> Unit Linked Group Gratuity Plan‐ 104L030V01AA & equivalent5% 1 year to 3 years 13% Financial And <strong>Insurance</strong> Activities** 35% Mfr of Pharma Medi & Botanical Prod2%A & equivalent0% 3 years to 7 years 24% Liquid Mutual Fund 4% Mfr of Tobacco Products2%Total100% Over 7 years 47% Ele Gas Steam & Air Condition Suply 4% Computer Prog Consul & Related Act2%of rated fixed incomeTotal 100% Mfr of Basic Metals 3% Mfr Motor Ve Trailer & Semi‐Trailer1%(of fixed income investments)of total fund sizeAnnualized Returns* Fund Benchmark Risk Attributes Fund Benchmark Fixed Income Company Exposure ‐ Top 10Since inception9.7% 8.4% Beta 0.8 1.0 Average Maturity in years 8.1 Issuer/CompaniesTwo Year Rolling Return (%)8.7% 8.1% Standard Deviation 6.7% 7.8% M‐ Duration 4.6 Central & State Government43%One Year Rolling Return (%)12.8% 10.5% Sharpe ratio 0.4 0.2 LIC Housing Finance Limited5%YTD4.1% 3.1% Treynor ratio 0.0 0.0 Rural Electrification Corporation Limited5%Last Quarter41% 4.1% 31% 3.1% Risk Free Rate assumed 7% Housing Development Finance Corp.Limited5%Avg monthly return0.8% 0.7% India Infrastructure Finance Company Limited4%Best Monthly return6.2% 6.9% Power Finance Corporation Limited4%Worst Monthly return‐6.4% ‐5.4% Tata Mutual Fund4%**Including CD & FD investments Power Grid Corporation of india Limited2%* Returns less than one year are absolute returns. Sundaram Finance LimitedState Bank of Patiala Limited2%2%
Group Gratuity Conservative FundInception dateAUM (Rs in crores)NAV (p.u.)As on :Approved Asset AllocationShort Term <strong>Investment</strong>EquityG‐secCorporate BondsNAV (Rs per unit) Chart‐ Since Inception2015105‐28‐Aug‐0643ULGF00317/04/06GRATCONSER104‐Group Gratuity ConservativeFund's Objective :The investment objective of this fund is to provide stable return by investing in relatively low risk assets. The fund will invest exclusively in fixed interest securities such as17.6435 Government Securities, Corporate bonds etc30‐Jun‐13Benchmark Composition: NSE Nifty(0%), I Sec Gilt Index (65%),Crisil Bond Index (25%),Crisil Liquid Index (10%)Distribution of Monthly Returns (Since Inception)0‐20%0‐0%9% 0%1550‐80%0‐50%G‐sec 1053%Corporate Bonds38%5Short Term investmentEquityNo.of Mon nths010Rating bucket % Maturity bucket %Industry Exposure ‐ Top 10Products Applicable of <strong>Max</strong> <strong>Life</strong> <strong>Insurance</strong> Co. Ltd.AAA & equivalent97% Less than 1year 2% Central & State Government 53% Mfr of Chemicals & Chemical Product1% <strong>Max</strong> <strong>Life</strong> Unit Linked Group Gratuity Plan‐ 104L030V01AA & equivalent3% 1 year to 3 years 10% Financial And <strong>Insurance</strong> Activities** 23%A & equivalent0% 3 years to 7 years 44% Ele Gas Steam & Air Condition Suply 10%Total100% Over 7 years 45% Liquid Mutual Fund 5%of rated fixed incomeTotal 100% Civil Engineering 4%(of fixed income investments)of total fund sizeAnnualized Returns* Fund Benchmark Risk Attributes Fund Benchmark Fixed Income Company Exposure ‐ Top 10Since inception8.7% 7.8% Beta 0.4 1.0 Average Maturity in years 8.6 Issuer/CompaniesTwo Year Rolling Return (%)11.5% 10.0% Standard Deviation 2.4% 3.1% M‐ Duration 4.7 Central & State Government53%One Year Rolling Return (%)13.4% 10.3% Sharpe ratio 0.7 0.2 Power Grid Corporation of india Limited7%YTD4.5% 3.1% Treynor ratio 0.0 0.0 Housing Development Finance Corp.Limited6%Last Quarter45% 4.5% 31% 3.1% Risk Free Rate assumed 7% LIC Housing Finance Limited5%Avg monthly return0.7% 0.6% Tata Mutual Fund5%Best Monthly return7.2% 7.3% Larsen & Turbo Limited4%Worst Monthly return‐1.8% ‐1.8% Power Finance Corporation Limited3%**Including CD & FD investments Nuclear Power Corporation3%* Returns less than one year are absolute returns. India Infrastructure Finance Company LimitedInfrastructure Leasing & Finance Services Limited3%2%
Group Superannuation Growth FundInception dateAUM (Rs in Lacs)NAV (p.u.)As on :Approved Asset AllocationShort Term <strong>Investment</strong>EquityG‐secCorporate BondsNAV (Rs per unit) Chart‐ Since Inception2015105‐13‐Apr‐074ULGF00423/01/07SANNGROWTH104‐Superannuation GrowthFund's Objective :The investment objective of the Growth Fund is to provide potentially higher returns to unit holders by investing primarily in Equities (to target growth in capital value of assets);15.2137 however, the fund will also invest in Government securities, corporate bonds and money market instruments.30‐Jun‐13Benchmark Composition: NSE Nifty (55%), I Sec Gilt Index (20%),Crisil Bond Index (15%),Crisil Liquid Index (10%)Distribution of Monthly Returns (Since Inception)0‐20%20‐60%26%150‐30%45%0‐30%G‐sec 10Corporate BondsShort Term investmentEquity18%11%No.of Mon nths5010Rating bucket % Maturity bucket %Industry Exposure ‐ Top 10 Products Applicable of <strong>Max</strong> <strong>Life</strong> <strong>Insurance</strong> Co. Ltd.AAA & equivalent100% Less than 1year 32% Central & State Government 43.1% Consumer Staples3.9% <strong>Max</strong> <strong>Life</strong> Unit Linked Group Superannuation Plan‐ 104L033V01AA & equivalent0% 1 year to 3 years 0% Financial And <strong>Insurance</strong> Activities** 19.9% Mfr OF petroleum products3.1%A & equivalent0% 3 years to 7 years 21% Mfr of Tobacco Products 7.7% MFG of Motor vehicle2.6%Total100% Over 7 years 48% IT Services 5.9% Mfr of pharmaceuticals2.4%of rated fixed incomeTotal 100% Extraction of Crud Oil & Gas 4.8% Construction & Engineering2.4%(of fixed income investments)of total fund sizeAnnualized Returns* Fund Benchmark Risk Attributes Fund Benchmark Fixed Income Company Exposure ‐ Top 10Since inception10.4% 11.5% Beta 0.9 1.0 Average Maturity in years 5.9 Issuer/CompaniesTwo Year Rolling Return (%)6.8% 5.6% Standard Deviation 11.4% 12.4% M‐ Duration 4.2 Central & State Government43.1%One Year Rolling Return (%)14.2% 10.6% Sharpe ratio 0.3 0.4 Indian Tobacco Co.Limited7.7%YTD5.1% 3.0% Treynor ratio 0.0 0.0 National Bank for Agriculture & Rural Development6.1%Last Quarter51% 5.1% 30% 3.0% Risk Free Rate assumed 7% Infrastructure Leasing & Finance Services Limited50% 5.0%Avg monthly return0.9% 1.0% Infosys Technologies Limited4.8%Best Monthly return10.5% 14.7% Oil & Natural Gas Corporation Limited4.8%Worst Monthly return‐5.4% ‐5.8% Housing Development Finance Corp.Bank4.0%**Including CD & FD investments Hindustan Unilever Limited3.9%* Returns less than one year are absolute returns. Reliance Industries LimitedICICI Bank Limited3.1%3.1%
Group Superannuation Balanced FundInception dateAUM (Rs in Lacs)NAV (p.u.)As on :Approved Asset AllocationShort Term <strong>Investment</strong>EquityG‐secCorporate Bonds13‐Apr‐07ULGF00523/01/07SANNBALANC104‐Superannuation Balanced1Fund's Objective :The investment objective of the Balanced Fund is to provide balanced returns from investing in both fixed income securities (to target stability of returns) as well as in equities (to16.4124 target growth in capital value of assets).30‐Jun‐13Benchmark Composition: NSE Nifty (25%), I Sec Gilt Index (35%),Crisil Bond Index (30%),Crisil Liquid Index (10%)Distribution of Monthly Returns (Since Inception)0‐20%10‐40%20‐50%20‐40%NAV (Rs per unit) Chart‐ Since Inception2015105‐15%3025G‐sec42% 2015Corporate Bonds1017%5Short Term investment0Equity26%No.of Mon nths10Rating bucket % Maturity bucket %Industry Exposure ‐ Top 10Products Applicable of <strong>Max</strong> <strong>Life</strong> <strong>Insurance</strong> Co. Ltd.AAA & equivalent97% Less than 1year 21% Central & State Government 57% Mfr of Pharma Medi & Botanical Prod2% <strong>Max</strong> <strong>Life</strong> Unit Linked Group Superannuation Plan‐ 104L033V01AA & equivalent3% 1 year to 3 years 0% Financial And <strong>Insurance</strong> Activities** 24% Extraction Crud Petro & Natural Gas2%A & equivalent0% 3 years to 7 years 47% Civil Engineering 3% Mfr of Coke & Ref. Petro Prod.1%Total100% Over 7 years 32% Mfr of Tobacco Products 3% Mfr Motor Ve Trailer & Semi‐Trailer1%of rated fixed incomeTotal 100% Mfr of Chemicals & Chemical Product 3% Telecommunications1%(of fixed income investments)of total fund sizeAnnualized Returns* Fund Benchmark Risk Attributes Fund Benchmark Fixed Income Company Exposure ‐ Top 10Since inception8.3% 8.3% Beta 0.4 1.0 Average Maturity in years 5.6 Issuer/CompaniesTwo Year Rolling Return (%)7.4% 8.1% Standard Deviation 6.1% 7.9% M‐ Duration 3.8 Central & State Government57%One Year Rolling Return (%)12.0% 10.5% Sharpe ratio 0.2 0.2 National Bank for Agriculture & Rural Development10%YTD4.6% 3.1% Treynor ratio 0.0 0.0 State Bank of India8%Last Quarter46% 4.6% 31% 3.1% Risk Free Rate assumed 7% Infrastructure Leasing & Finance Services Limited6%Avg monthly return0.7% 0.7% Larsen & Turbo Limited3%Best Monthly return6.1% 6.9% Indian Tobacco Co.Limited3%Worst Monthly return‐4.0% ‐5.4% Hindustan Unilever Limited3%**Including CD & FD investments Dr.Reddy's Labortaries Limited2%* Returns less than one year are absolute returns. Oil & Natural Gas Corporation LimitedReliance Industries Limited2%1%
Group Superannuation Conservative FundInception dateAUM (Rs in crores)NAV (p.u.)As on :Approved Asset AllocationShort Term <strong>Investment</strong>EquityG‐secCorporate Bonds13‐Apr‐07ULGF00623/01/07SANNCONSER104‐Superannuation Conservative6Fund's Objective :The investment objective of this fund is to provide stable return by investing in relatively low risk assets. The fund will invest exclusively in fixed interest securities such as14.0658 Government Securities, Corporate bonds etc30‐Jun‐13Benchmark Composition: NSE Nifty (0%), I Sec Gilt Index (60%),Crisil Bond Index (30%),Crisil Liquid Index (10%)Distribution of Monthly Returns (Since Inception)0‐20%0‐0%50‐80%0‐50%NAV (Rs per unit) Chart‐ Since Inception15105‐14% 0%50454035G‐sec 302552% 20Corporate Bonds1534%1050Short Term investmentEquityNo.of Mon nths10Rating bucket % Maturity bucket %Industry Exposure ‐ Top 10 Products Applicable of <strong>Max</strong> <strong>Life</strong> <strong>Insurance</strong> Co. Ltd.AAA & equivalent97% Less than 1year 13% Central & State Government 63.5% <strong>Max</strong> <strong>Life</strong> Unit Linked Group Superannuation Plan‐ 104L033V01AA & equivalent3% 1 year to 3 years 8% Financial And <strong>Insurance</strong> Activities** 24.9%A & equivalent0% 3 years to 7 years 40% Electricity Production 6.7%Total100% Over 7 years 38% Mfr of pharmaceuticals 1.8%of rated fixed incomeTotal 100%(of fixed income investments)of total fund sizeAnnualized Returns* Fund Benchmark Risk Attributes Fund Benchmark Fixed Income Company Exposure ‐ Top 10Since inception8.4% 7.1% Beta 0.8 1.0 Average Maturity in years 8.0 Issuer/CompaniesTwo Year Rolling Return (%)11.4% 10.0% Standard Deviation 2.3% 1.8% M‐ Duration 4.2 Central & State Government63.5%One Year Rolling Return (%)13.2% 10.3% Sharpe ratio 0.6 0.1 Housing Development Finance Corp.Limited7.2%YTD4.6% 3.1% Treynor ratio 0.0 0.0 Power Grid Corporation of india Limited6.7%Last Quarter46% 4.6% 31% 3.1% Risk Free Rate assumed 7% LIC Housing Finance Limited54% 5.4%Avg monthly return0.7% 0.6% Power Finance Corporation Limited5.4%Best Monthly return3.3% 2.0% Infrastructure Leasing & Finance Services Limited3.7%Worst Monthly return‐1.6% ‐0.9% ICICI Bank Limited2.7%**Including CD & FD investments Dr.Reddy's Labortaries Limited1.8%* Returns less than one year are absolute returns. Shriram Transport Finance Limited0.5%
Currency DepreciationIt’s not all badVOLUME 8The Indian Rupee has depreciated considerably over the last few months. The genesis of thisweakening can be attributed to the fundamentals of India's trade and current account deficits (CAD)which continued to grow beyond sustainable proportions. In the quarter ending December 2012,CAD reached a record level of 6.7% of GDP owing to burgeoning imports of gold and crude oil. Aweakening currency makes imported goods costlier and this stokes domestic inflationary pressures.This is precisely the reason RBI is making efforts to ensure that the currency weakening is arrestedand the government is playing its own role to ensure imports like gold are restricted and fundingthrough FDIs is restored.Economic theory says that when a currency depreciates, it leads to an increased competitiveness in theexports segment of that country. Another positive to the depreciation is that imports become costlierand the domestic demand for imported commodities would fall thereby helping bring down the tradedeficit. Marshall and Lerner were two eminent economists who proved that such a weakening ofcurrency will initially widen country's trade deficit because exports remain the same while import billsgrow fatter. However, with the passage of time, exporters benefit from increased competitiveness andimporters cut down their demand and the trade deficit narrows down. Also the consumers do notadjust to price change of imported goods until they can find a cheaper substitute. This is why there is atime lag between the actual depreciation of a currency and the positive impact on the country's currentaccount balance.It has been shown by a study that for India, it takes few quarters for the INR depreciation to startproducing positive results in exports and thereby reducing our trade deficit. So we may expect the INRdepreciation during April-June 2013 to have a meritorious impact on our trade deficit and CAD by FY15. However, there are many other factors at play which could influence the way the trade balanceultimate turns out viz. the simultaneous weakness of other currencies which compete directly with usfor exports, global growth and import demand, etc. Therefore, while US growth could help our cause,currency weakness witnessed all across Asia, Brazil, etc., does hamper our export competitiveness.Having understood all the potential benefits of currency depreciation it is also essential to grasp whythe RBI has always has been cautious when it comes to the CAD and the funding of this deficit. In arecent paper published by RBI, it was determined that the sustainable CAD for India would be nothingmore than 2.5% of GDP assuming India continues to grow at about 6% annually in real terms. Thecurrent rise in CAD poses a big threat to sustainability especially an issue when funding challengessurface like the severe outflows seen since May 2013. Under such circumstances the currencydepreciates, but this in turn leads to further selling and forms a vicious cycle.(Sources–Concept of J Curve effect of Currency Depreciation & Devaluation and the J curve by Mohsen BahmaniOskooee )
VOLUME 8INVESTMENT TEAMTeamPrashant SharmaRahul RanjanRohit TandonSachin BajajArit ChaudhuryParesh JainAmit TayalKapil AgarwalGaurav ChamariaMudit PainulyNitin GargKamlesh KharetaChief <strong>Investment</strong> OfficerFund Manager (Equity)Fund Manager (Equity)Fund Manager (Fixed Income)Analyst (<strong>Investment</strong>s)Analyst (<strong>Investment</strong>s)Analyst (<strong>Investment</strong>s)Analyst (<strong>Investment</strong>s)Credit Analyst (<strong>Investment</strong>s)Analyst (<strong>Investment</strong>s)Debt –DealerEquity- Dealer
VOLUME 8FAQsWhat is Beta?This is one of the most staple yardsticks for measuring risk of a stock or a portfolio. If themain objective of portfolio management is earning returns, then the most crucial constraintis risk which can be defined as the standard deviation or volatility of returns. In laymanparlance beta could be thought of as the sensitivity of the stock or portfolio to the movementof the entire market of traded securities. Lower the beta value, lower the sensitivity andhence less risky is the investment. Mathematically beta of a stock is derived from historicalanalysis of the stock returns versus market returns using a statistical tool calledregression. A portfolio’s beta is a simple weighted average of the component stocks’ beta inthe portfolio. Capital Asset Pricing model(CAPM) theorizes that the excess return of acertain portfolio over and above the risk-free rate is directly proportional to the excessreturns of the market as a whole, and in this equation the coefficient of proportionality is‘beta’.Jensen’s alphaBefore we would go on to understand Jensen’s alpha, it is imperative to get a firm purchaseon the conceptual linkage between returns and risk. The plot of values would be a positivesloping curve which goes to show that higher the risk of investments greater would be thereturns generated on holding those stocks. With this in the background let us nowcategorize the returns-earning ability of a fund manager into two parts viz. skill and riskappetite. The part called risk appetite is explained by the phenomenon of beta whichpropounds that higher the risk loving nature of a fund manager, greater can be the returnshe/she generates. However if a fund manager’s mantra is to beat his peers and thebenchmark, then skill is what can achieve that desired objective. Jensen’s alpha is thatexcess return generated by the fund manager over and above what the ‘beta’ of his portfoliowould deliver according the CAPM.Sharpe ratio?The Sharpe ratios (excess real returns divided by standard deviation of returns) are good,indicating a good risk-adjusted performance i.e. good excess return per unit of volatility.Here volatility is being captured by systematic and unsystematic risk both.Higher the ratio, better the performance of Fund Manager.
VOLUME 8CONTACT DETAILSAND DISCLAIMERS<strong>Max</strong> <strong>Life</strong> <strong>Insurance</strong> Co. Ltd<strong>Max</strong> <strong>Life</strong> <strong>Insurance</strong> Co. Ltd. is a joint venture of <strong>Max</strong> India Limited and MitsuiSumitomo <strong>Insurance</strong> Co. Ltd.Corporate Office:<strong>Max</strong> <strong>Life</strong> <strong>Insurance</strong> Company Limited11th Floor, DLF Square, Jacaranda MargDLF City, DLF Phase-II, Gurgaon-122002Registered Office:<strong>Max</strong> <strong>Life</strong> <strong>Insurance</strong> Company Limited<strong>Max</strong> House, 1 Dr. Jha Marg, Okhla,New Delhi-110020<strong>Insurance</strong> is the subject matter of solicitation.The past performance is not indicative of the future performance.For more details on the risk factors, terms and conditions, please read therespective sales brochures carefully before concluding a sale.Unit Linked <strong>Insurance</strong> Products (ULIPs) are different from the traditional insuranceproducts and are subject to the risk factors.The premium paid in Unit Linked <strong>Life</strong> <strong>Insurance</strong> policies is subject to investmentrisks associated with the capital markets and the NAVs of the units may go up ordown based on the performance of the fund and factors influencing the capitalmarkets and the insured is responsible for his/her decisions.<strong>Max</strong> <strong>Life</strong> <strong>Insurance</strong> Co. Ltd. is only the name of the <strong>Insurance</strong> Company and GrowthFund, Growth Super Fund, Balanced Fund, Secured Fund, Pension Growth Fund,Pension Growth Super Fund, Dynamic opportunities Fund, Pension Balanced Fund,Conservative fund and Pension Secured Fund are only the names of the unit linkedlife insurance contracts and do not in any way indicate the quality of the contracts,their future prospects or returns.
VOLUME 8CONTACT DETAILSAND DISCLAIMERSPlease know the associated risks and applicable charges from your insuranceagent or the Intermediary or policy document of the insurer.The various funds offered under this contract are the names of the funds and donot in any way indicate the quality of these plans, their future prospects andreturns. In the unit-linked policies, the <strong>Investment</strong> Risk in investment portfolio isborne by the policyholderToll-free numbers: 1800-180-5577 and 1800-200-5577All data referred to in the newsletter has been sourced from relevant exchanges,trading platforms and information services like Reuters and Bloomberg.Ratings of investments are as per rating agencies registered with SEBI.ARN/Web/Ind/71