Relative Bactericidal Effectiveness of Hypochlorous Acid and ...
Relative Bactericidal Effectiveness of Hypochlorous Acid and ...
Relative Bactericidal Effectiveness of Hypochlorous Acid and ...
- No tags were found...

You also want an ePaper? Increase the reach of your titles
YUMPU automatically turns print PDFs into web optimized ePapers that Google loves.
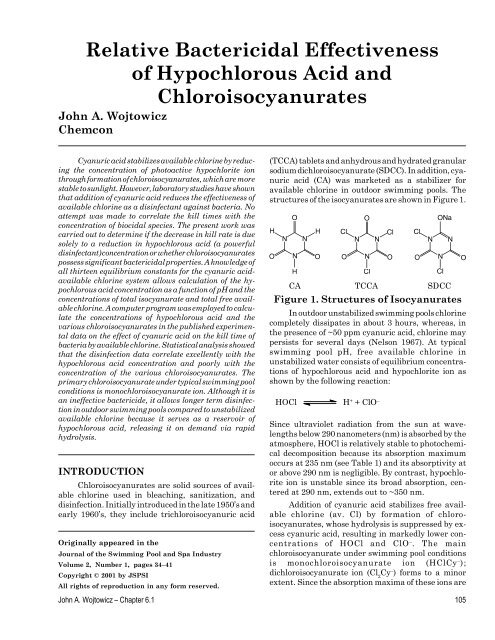
SpeciesHOClClO –HClCy –Cl 2Cy –l maxnm235290215220Table 1. Absorption Maxima forMain Chlorine Specieswell below 290 nm, they are relatively stable to sunlight.Studies with chloroisocyanurate solutions (CA =26 ppm <strong>and</strong> av. Cl = 14 ppm) showed maximumstability at pH 6.8 which corresponds to minimalhydrolysis (O’Brien et al 1975). Stability decreases aspH is increased due to increased ionization <strong>of</strong> HOClto ClO – .Shortly after the commercialization <strong>of</strong>chloroisocyanurates, it was shown that cyanuric aciddecreases the kill rate <strong>of</strong> bacteria such as S. faecalis<strong>and</strong> S. aureus by available chlorine in distilled water(Andersen 1965). Later studies confirmed these findings(Stewart <strong>and</strong> Ortenzio 1964; Fitzgerald <strong>and</strong>DerVartanian 1967; Swatek et al 1967). However, noattempts were made to correlate the observed killtimes with the concentration <strong>of</strong> biocidal species.In the absence <strong>of</strong> cyanuric acid, the rate <strong>of</strong> disinfectionby free av. Cl decreases with increased pH inaccordance with the ionization pattern <strong>of</strong> HOCl, demonstratingthat HOCl is the active biocidal agent <strong>and</strong>that hypochlorite ion is a poor disinfectant (Fair et al1948). Disinfection by HOCl is believed to be due todiffusion through the cell wall <strong>of</strong> bacteria followed byoxidative attack resulting in disruption <strong>of</strong> metabolicprocesses (Green <strong>and</strong> Stumpf 1946). The poor bactericidalproperties <strong>of</strong> hypochlorite ion are attributed toslower diffusion through the cell membrane comparedto the neutral molecule HOCl.DISCUSSIONChloroisocyanurate Equilibria – The variouscyanurate equilibria in the cyanuric acid – availablechlorine system are shown in Figure 2. Thecomplex equilibrium system consists <strong>of</strong> six ionization<strong>and</strong> six hydrolysis reactions, shown horizontally <strong>and</strong>vertically, respectively. Table 2 lists the reportedvalues <strong>of</strong> the equilibrium constants. The equilibriumconstants for the first 12 reactions were measured at24–25°C (O’Brien et al 1975). Other values <strong>of</strong> some <strong>of</strong>the chloroisocyanurate equilibrium constants havealso been reported (Brady et al 1963; Gardner 1973;Pinsky <strong>and</strong> Hu 1981). The equilibrium constant forionization <strong>of</strong> hypochlorous acid was determined overthe 4 to 34 °C temperature range (Morris 1966).Mathematical Model <strong>and</strong> Computer Program– A computer program (similar to O'Brien et al1975) was employed for calculation <strong>of</strong> the concentration<strong>of</strong> all species in the cyanuric acid – availablechlorine system. Material balance yields the followingequations for total free av. Cl (Cl T) <strong>and</strong> total cyanurate(Cy T):ReactionpK NumberpKCl 3Cy + H 2O HCl 2Cy + HOCl 1 1.8 ± 0.2HCl 2Cy H + + Cl 2Cy – 2 3.75 ± 0.03HCl 2Cy + H 2O H 2ClCy + HOCl 3 2.93 ± 0.07H 2ClCy H + + HClCy – 4 5.33 ± 0.05H 2ClCy + H 2O H 3Cy + HOCl 5 4.07 ± 0.08H 3Cy H + + H 2Cy – 6 6.88 ± 0.04Cl 2Cy – + H 2O HClCy – + HOCl 7 4.51 ± 0.09HClCy – H + + ClCy – 8 10.12 ± 0.02HClCy – + H 2O H 2Cy – + HOCl 9 5.62 ± 0.05H 2Cy – H + + HCy – 10 11.40 ± 0.10ClCy 2– + H 2O HCy 2– + HOCl 11 6.90 ± 0.11HCy 2– H + + Cy 3– 12 13.5HOCl H + + ClO – 13 7.54Table 2. Equilibrium Constants for Reactions in theCyanuric <strong>Acid</strong> – Available Chlorine System @ ˜25ºC106 The Chemistry <strong>and</strong> Treatment <strong>of</strong> Swimming Pool <strong>and</strong> Spa Water
Hydrolysis àCl 3CyWhere: m <strong>and</strong> the sum <strong>of</strong> n + m vary from 0 to 3 <strong>and</strong>b nmis the reciprocal <strong>of</strong> the product <strong>of</strong> the appropriatedichloroisocyanuric acids are essentially completely[H nCl mCy] = [H + ] n+m [HOCl] m [Cy 3– ]b nmionized at pool pH to HClCy – <strong>and</strong> Cl 2Cy – .K 1HCl 2CyK 3H 2ClCyK 5K 2K 4Cl 2Cy –K 7HClCy –K 9K 8ClCy 2–K 11equilibrium constants. Expressions for calculatingthe concentration <strong>of</strong> cyanurate <strong>and</strong> chloroisocyanuratespecies are listed in Table 3.The following working equation was employed:Cl T= Cy TN/D + [HOCl](1 + K 13/[H + ])Where: N is a 6–term summation representing theH 3CyK 6K 10K 12 various chloroisocyanurates <strong>and</strong> D is a 10–term summationrepresenting all possible cyanurates. SinceH 2Cy – HCy 2– Cy 3–Dissociation à[Cy 3– ] occurs as a factor in all terms in both theFigure 2 – Chloroisocyanurate numerator (N) <strong>and</strong> denominator (D), it cancels out.The program utilizes a Newton–Raphson convergenceEquilibriatechnique. For a given reservoir chlorine (Cl T), totalcyanurate (Cy T), hydrogen ion concentration, <strong>and</strong> estimatedCl T= [H 2ClCy] + [HClCy – ] + [ClCy 2– ] + 2[HCl 2Cy]+ 2[Cl 2Cy – ] + 3[Cl 3Cy] + [HOCl] + [ClO – ]HOCl concentration, the program iteratesthe HOCl concentration until a solution is obtained,i.e., when the calculated values <strong>of</strong> Cl T<strong>and</strong> Cy Tareequal to the actual values. While the concentration <strong>of</strong>tricyanurate ion [CyCy T= [H 3Cy] + [H 2Cy – ] + [HCy 2– ] + [Cy 3– ] + [H 2ClCy]] is not known explicitly, it isknown implicitly, i.e., once the correct HOCl is obtained,the concentration <strong>of</strong> tricyanurate ion can be+ [HClCy – ] + [ClCy 2– ] + [HCl 2Cy] + [Cl 2Cy – ]+ [Cl 3Cy]calculated by the following equation: [Cy 3– ] = Cy T/D.While chloroisocyanurates analyze as free av. Cl Species Distribution – A plot <strong>of</strong> species distributionagainst pH for water containing ~25 ppmwith swimming pool test kits because <strong>of</strong> rapid hydrolysis,they are not free in the sense <strong>of</strong> HOCl <strong>and</strong> ClO – . cyanuric acid <strong>and</strong> ~1 ppm av. Cl is shown in Figure 3.More accurately, they represent potential free av. Cl, It is seen that at pH 7.5, typical in swimming pools, thereleasing HOCl <strong>and</strong> ClO – on dem<strong>and</strong>.species distribution varies as follows:The concentration <strong>of</strong> the various cyanurate <strong>and</strong>chloroisocyanurate species can be calculated fromapplicable equilibrium constants <strong>and</strong> the concentrations<strong>of</strong> H + (calculable from the pH), HOCl, <strong>and</strong>[H 2Cy – ] > [H 3Cy] > [HClCy – ] >> [HOCl] = [ClO – ]@ [Cl 2Cy – ] > [ClCy 2– ]tricyanurate ion by the following generalized equation:By contrast to cyanuric acid, monochloro– <strong>and</strong>[HCy 2– ] = [H + ] [Cy 3– ]/K 12[H 2Cy – ] = [H + ] 2 [Cy 3– ]/K 12K 10[H 3Cy] = [H + ] 3 [Cy 3– ]/K 12K 10K 6[ClCy 2– ] = [H + ][HOCl][Cy 3– ]/K 12K 11[HClCy – ] = [H + ] 2 [HOCl][Cy 3– ]/K 12K 11K 8= [H + ] 2 [HOCl][Cy 3– ]/K 12K 10K 9[H 2ClCy] = [H + ] 3 [HOCl][Cy 3– ]/K 12K 11K 8K 4= [H + ] 3 [HOCl][Cy 3– ]/K 12K 10K 6K 5[Cl 2Cy – ] = [H + ] 2 [HOCl] 2 [Cy 3– ]/K 12K 11K 8K 7= [H + ] 2 [HOCl] 2 [Cy 3– ]/K 12K 10K 9K 7[HCl 2Cy] = [H + ] 3 [HOCl] 2 [Cy 3– ]/K 12K 11K 8K 7K 2= [H + ] 3 [HOCl] 2 [Cy 3– ]/K 12K 10K 6K 5K 3[Cl 3Cy] = [H + ] 3 [HOCl] 3 [Cy 3– ]/K 12K 11K 8K 7K 2K 1= [H + ] 3 [HOCl] 3 [Cy 3– ]/K 12K 10K 6K 5K 3K 1Table 3 – Expressions for Calculating Concentrations <strong>of</strong>Isocyanurate <strong>and</strong> Chloroisocyanurate SpeciesJohn A. Wojtowicz – Chapter 6.1 107
Figure 3 – SpeciesDisribution in theCyanuric <strong>Acid</strong>-Available ChlorineSystem at 25°CCA ~25 ppm,av. Cl ~1 ppmFigure 4 – 99% KillTime at 20°C v.s.HOCl Concentrationat 25°C (Organism:S. Faecalis)The presence <strong>of</strong> HOCl, in concentrations approximatingthe calculated values, was verified byroom temperature vacuum distillation <strong>of</strong> dilutechloroisocyanurate solutions at pH 7.5. The HOCl–enriched distillate was analyzed by infrared spectroscopy<strong>and</strong> by conventional av. Cl analysis. Calculations<strong>of</strong> HOCl concentrations in the original solutions tookinto account the appropriate enrichment factors.Disinfection Data – Disinfection data (99% killtime) <strong>of</strong> Andersen (Andersen 1965) for Streptococcusfaecalis at 20°C <strong>and</strong> pH 7 <strong>and</strong> 9 for various cyanuricacid <strong>and</strong> av. Cl concentrations are listed in Table 4along with the calculated concentration <strong>of</strong> hypochlorousacid (at 25°C). The HOCl concentrations werecalculated at 25°C because the complete set <strong>of</strong> equilibriumconstants for the isocyanurates are known onlyat this temperature. The data show that the 99% kill108 The Chemistry <strong>and</strong> Treatment <strong>of</strong> Swimming Pool <strong>and</strong> Spa Water
pHCA ppmAv. Cl ppm99% Kill Time(min) at 20°CHOCl (ppm asav. Cl) at 25°C777777777799999999999902550100255010025501000255010002550100025501000.230.250.240.240.480.480.480.980.970.970.230.240.240.240.470.480.480.470.960.980.970.950.37.211.521.73.24.710.21.62.44.13.515.529.555.31.67.712.120.40.93.35.59.40.1780.005250.002540.001270.01020.005110.002550.02140.01040.005200.007800.002090.00120.0006440.01600.004220.02410.001270.03260.008760.004920.00258Table 4 – Disinfection Data <strong>of</strong> Andersen <strong>and</strong> Calculated <strong>Hypochlorous</strong> <strong>Acid</strong>Concentrations (Organism: S. Faecalis)time: a) increased with increasing cyanuric acid concentrationat constant av. Cl, b) decreased with increasingav. Cl concentration at constant cyanuricacid concentration, c) increased with increasing pH atconstant cyanuric acid <strong>and</strong> av. Cl concentrations, <strong>and</strong>d) increased with increasing pH whether cyanuricacid was present or not. The relative importance <strong>of</strong>HOCl <strong>and</strong> the chloroisocyanurates in disinfection canbe evaluated statistically.Statistical Analysis – A plot <strong>of</strong> 99% kill time at20°C against the calculated HOCl concentration at25°C is shown in Figure 4. The plot shows very goodcorrelation <strong>of</strong> kill times with calculated HOCl concentrations.The fact that data for cyanurate <strong>and</strong> cyanurate–freemedia fall on the same line is probablyfortuitous. They should, in fact, most likely fall onseparate lines as discussed below. However, this willnot affect statistical analysis since the cyanurate datacan be analyzed separately.Extrapolation <strong>of</strong> the calculated HOCl concentrationsto 20°C should cause the two sets <strong>of</strong> data todiverge <strong>and</strong> fall on separate parallel lines because thetemperature dependence <strong>of</strong> the HOCl concentration isdifferent for stabilized <strong>and</strong> unstabilized chlorine. Theonly parameter that changes in transforming thecalculated HOCl concentrations from 25 to 20°C is theintercept; the slope should remain the same. Forunstabilized chlorine, the HOCl concentration willincrease from 25 to 20°C due to decreased ionization<strong>of</strong> HOCl. By contrast, the HOCl concentration instabilized chlorine solutions decreases with decreasingtemperature due to decreased hydrolysis <strong>of</strong>chloroisocyanurates. The extent <strong>of</strong> separation <strong>of</strong> thetwo lines will depend on the temperature dependence<strong>of</strong> ionization <strong>of</strong> HOCl <strong>and</strong> hydrolysis <strong>of</strong>chloroisocyanurates. Thus, for the lines to be coincidentat 20°C, the calculated HOCl concentrations at25°C for the isocyanurate data would have to be a littlehigher.John A. Wojtowicz – Chapter 6.1 109
Regression analysis (Table 5) shows that the killtime correlates excellently with the free HOCl concentration(r 2 = 0.98). By contrast, correlations againstthe concentrations <strong>of</strong> the various chloroisocyanurateswere poor. The lone exception was dichloroisocyanurateion (Cl 2Cy – ) which showed a high correlation (r 2 =0.95). However, this is to be expected since the concentration<strong>of</strong> Cl 2Cy – correlates with the concentration <strong>of</strong>HOCl (see Figure 3). Indeed, any significant bactericidalactivity for Cl 2Cy 2– is very unlikely given the poorstatistical correlations found for the four otherchloroisosyanurates. The following equation was obtainedwhich shows that kill time at 20°C variesinversely with the calculated HOCl concentration at25°C.t 0.99= (0.0268q)[HOCl] –1.014Where: q is the relative disinfection time at 25°Cversus that at 20°C. This equation conforms to theChick–Watson Law: C n t = k, where C is the disinfectantconcentration, t the kill time, <strong>and</strong> n <strong>and</strong> k areconstants. The fact that n = 1 means that the concentration<strong>of</strong> HOCl <strong>and</strong> time are equaly important indetermining the inactivation rate <strong>of</strong> bacteria.Effect <strong>of</strong> Temperature on Kill Time – Therate <strong>of</strong> disinfection increases with increasing temperature.Disinfection data can be extrapolated toother temperatures using the following equation:(~7.3 kcal/mol) for disinfection by hypochlorous acid(Fair et al 1948). This value represents the combinedtemperature dependance <strong>of</strong> HOCl ionization <strong>and</strong> inactivation<strong>of</strong> bacteria. Although the concentration <strong>of</strong>HOCl decreases with increasing temperature at constantpH due to increased ionization, the disinfectionrate in cyanuric acid–free media actually increasesdue to greater disinfection efficiency. By contrast, in acyanuric acid–available chlorine system, increasedtemperature can lead to an increase in the HOClconcentration due to increased hydrolysis <strong>of</strong>chloroisocyanurates, resulting in an additional increasein the disinfection rate.Although the activation energy for disinfectionin a cyanurate system has not been determined, it canbe estimated. The value <strong>of</strong> 30.5 kJ/mol (7.3 kcal/mol)for a cyanurate–free system can be adjusted to that ina cyanurate system by combining it with the appropriateenergy term applicable to a cyanurate system. Theprinciple chloroisocyanurate in pool water ismonochloroisocyanurate ion. It hydrolyzes to a smallextent at pool pH, providing increased HOCl concentrationsas temperature increases. A value <strong>of</strong> 99.2 kJ/mol/mol (23.7 kcal/mol) has been reported for theenergy (i.e., heat <strong>of</strong> hydrolysis) that determines thetemperature dependence <strong>of</strong> its hydrolysis (Wojtowiczto be published). Therefore, the overall estimatedactivation energy for disinfection in a cyanurate systemis: 30.5 + 99.2 = ~129.7 kJ/mol (31.0 kcal/mol). At25°C, this will result in a decrease in kill time by afactor (q) <strong>of</strong> 2.44 compared to that at 20°C.t 2/t 1= q = exp[(–DE/R)(1/T 2–1/T 1)]Where: t 1<strong>and</strong> t 2are the 99% kill times at temperaturesT 1<strong>and</strong> T 2(in kelvins), R is the gas constant (8.314 J/deg/mol; 1.987 cal/deg/mol), <strong>and</strong> DE is the disinfectionactivation energy. For enteric bacteria (such as E. coli)in a cyanuric acid–free system, DE = ~30.5 kJ/molSpeciesHOClClO –H 2ClCyHClCy –ClCy 2–HCl 2CyCl 2Cy –Coefficient <strong>of</strong>Determination r 2 *0.980.070.370.590.080.600.95*r 2 is the fraction <strong>of</strong> the variability in the data explained bythe regression equation.Table 5. Regression Analysis<strong>of</strong> Disinfection DataExtrapolation <strong>of</strong> Andersen’s Data to SwimmingPools – Since hypochlorous acid <strong>and</strong>chloroisocyanurates cannot be distinguished by testkit analysis (which is typically based on diethyl–p–phenylenediamine), the total free av. Cl concentrationis the only indicator <strong>of</strong> adequate disinfection. However,because disinfection is affected by the presence<strong>of</strong> cyanuric acid, a better indicator is the ratio <strong>of</strong> totalcyanurate to av. Cl since it correlates perfectly withthe HOCl concentration at pH 7 <strong>and</strong> 20°C in Andersen’sstudy:HOCl (pH 7 & 20°C) = 0.576(Cy T/Cl T) –1.008 , r 2 = 1.00This equation shows that the HOCl concentrationvaries inversely with the ratio <strong>of</strong> total cyanurate tototal free av. Cl.Regression analysis shows that Andersen’s datafor 99% kill time (t 0.99) at pH 7 <strong>and</strong> 20°C varies linearlywith the ratio <strong>of</strong> total cyanurate (Cy T) to total freeavailable chlorine (Cl T) as shown by the followingequation:t 0.99(pH 7 <strong>and</strong> 20°C) = 0.119 + 0.0516Cy T/Cl T, r 2 = 0.98110 The Chemistry <strong>and</strong> Treatment <strong>of</strong> Swimming Pool <strong>and</strong> Spa Water
In order to apply Andersen’s data to swimmingpool conditions, the data must be adjusted for theeffect not only <strong>of</strong> temperature but pH as well. Since killtime varies inversely with pH (which influences theHOCl concentration), the 99% kill time at pH 7 <strong>and</strong>20°C was first adjusted to pH 7.5 (typical in swimmingpools) by multiplying by the factor 1.40, which representsthe ratio <strong>of</strong> HOCl at pH 7 to that at pH 7.5 instabilized water. Cyanuric acid moderates the effect <strong>of</strong>pH on the HOCl concentration since the factor inunstabilized water is 1.48.t 0.99(pH 7.5 <strong>and</strong> 20°C) = [0.167 + 0.0722Cy T/Cl T]/qThe factor q allows extrapolation <strong>of</strong> kill timesfrom 20°C to other temperatures. The higher thetemperature, the higher the value <strong>of</strong> q <strong>and</strong> the lowerthe kill time. At a swimming pool temperature <strong>of</strong> 80°F(26.7°C), q = 3.29 which corresponds to 99% kill times<strong>of</strong> 0.6 – 0.2 minutes over the recommended free av. Clrange <strong>of</strong> 1 – 3 ppm at 25 ppm cyanuric for entericbacteria such as S. faecalis. Higher cyanuric acidconcentrations will cause the 99% kill times to increase.By contrast, higher temperatures, especiallyin spas, will decrease kill times.Effect <strong>of</strong> Swimming Pool Contaminants onDisinfection Rate – Longer kill times were observedin pool water, compared to distilled water, whethercyanuric acid was present or not (Swatek et al 1967).This was attributed to unknown variables, which inreality are swimming pool contaminants. In swimmingpools, nitrogenous compounds such as ammonia,amino acids, <strong>and</strong> creatinine, introduced by bathers,can react with free av. Cl. This forms bactericidallyineffective combined chlorine, resulting in increasedkill times. Combined chlorine compounds do not hydrolyzeto a significant extent to HOCl. Thus, it isimportant to maintain a low combined available chlorinelevel by frequent superchlorination or shock treatmentin order to oxidize chlorinated compounds suchas monochloramine, N–chloroamino acids, <strong>and</strong> N–chlorocreatinine, which are much poorer disinfectantsthan HOCl.Addition <strong>of</strong> ammonia to stabilized aqueous av. Clresults in increased kill times proportional to theamount added (Fitzgerald <strong>and</strong> DerVartanian 1967).By contrast to ammonia, urea, a major swimming poolcontaminant, does not affect disinfection in short termexperiments (Fitzgerald <strong>and</strong> DerVartanian 1967).Although urea is a potential source <strong>of</strong> ammonia, itshydrolysis is very slow under swimming pool conditions.However, since urea serves as a nutrient forbacteria <strong>and</strong> algae, it is necessary to oxidize it byperiodic shock treatment.ReferencesAndersen, J. R. “A Study <strong>of</strong> the Influence <strong>of</strong> Cyanuric<strong>Acid</strong> on the <strong>Bactericidal</strong> <strong>Effectiveness</strong> <strong>of</strong> Chlorine.”American Journal <strong>of</strong> Public Health 1965, 55, 1629–37.Brady, A. P., K. M. Sancier, G. J. Sirine. “Equilibria inSolutions <strong>of</strong> Cyanuric <strong>Acid</strong> <strong>and</strong> its ChlorinatedDerivitives.” Journal <strong>of</strong> the American ChemicalSociety 1963, 85, 3101–4.Fair, J. M., J. C. Morris, S. L. Chang, I. Weil, R. P.Burden. “The Behavior <strong>of</strong> Chlorine as a WaterDisinfectant.” Journal <strong>of</strong> the American WaterWorks Association 1948, 40, 1051–1061.Fitzgerald, G. P., M. E. DerVartanian. “FactorsInfluencing the <strong>Effectiveness</strong> <strong>of</strong> Swimming PoolBactericides.” Applied Microbiology 1967, 15, 504–509.Gardner, J., “Chloroisocyanurates in the Treatment<strong>of</strong> Swimming Pool Water.” Water Research 1973,7, 823–33.Green, D. E., P. K. Stumpf. “The Mode <strong>of</strong> Action <strong>of</strong>Chlorine.” Journal <strong>of</strong> the American Water WorksAssociation 1946, 38, 1301–5.Morris, J. C. “The <strong>Acid</strong> Ionization Constant <strong>of</strong> HOClfrom 5 to 35°.” Journal <strong>of</strong> the American ChemicalSociety 1966, 70, 3798–3805.Nelson, G. D. “Special Report No. 6862 – SwimmingPool Disinfection with Chlorinated–s–triazinetrione Products.”, Monsanto Chemical Co.,St. Louis, Missouri, March 1967.O’Brien, J. E., J. C. Morris <strong>and</strong> J. N. Butler in Chemistry<strong>of</strong> Water Supply, Treatment, <strong>and</strong> Distribution.(Ann Arbor, Michigan: Ann Arbor SciencePublishers, Inc. 1972) pp. 333–358.Pinsky, M. L.; H–C Hu. “Evaluation <strong>of</strong> theChloroisocyanurate Hydrolysis Constants.”Environmental Science <strong>and</strong> Technology 1981, 15,423–30.Stewart, L. S.; L. F. Ortenzio. “Swimming Pool ChlorineStabilizers.” Soap <strong>and</strong> Chemical Specialties 1964,40, 79–82, 112–13.Swatek, F. E.; H. Raj; <strong>and</strong> G. E. Kalbus. “A LaboratoryEvaluation <strong>of</strong> the Effects <strong>of</strong> Cyanuric <strong>Acid</strong> on the<strong>Bactericidal</strong> Activity <strong>of</strong> Chlorine in Distilled Water<strong>and</strong> Swimming Pool Water.”, Paper presented atNSPI Convention, Las Vegas, NV, 1967.Wojtowicz, J. A. “Re–evaluation <strong>of</strong> ChloroisocyanurateHydrolysis Constants.” Submitted for review <strong>and</strong>publication to the Journal <strong>of</strong> the Swimming Pool<strong>and</strong> Spa Industry 1996.John A. Wojtowicz – Chapter 6.1 111