Development of a new predictive model for polypathological patients ...
Development of a new predictive model for polypathological patients ...
Development of a new predictive model for polypathological patients ...
- No tags were found...

Create successful ePaper yourself
Turn your PDF publications into a flip-book with our unique Google optimized e-Paper software.
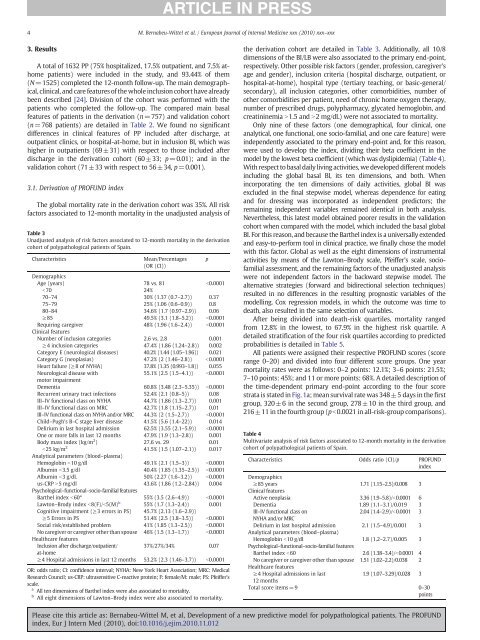
4 M. Bernabeu-Wittel et al. / European Journal <strong>of</strong> Internal Medicine xxx (2010) xxx–xxx3. ResultsA total <strong>of</strong> 1632 PP (75% hospitalized, 17.5% outpatient, and 7.5% athome<strong>patients</strong>) were included in the study, and 93.44% <strong>of</strong> them(N=1525) completed the 12-month follow-up. The main demographical,clinical, and care features <strong>of</strong> the whole inclusion cohort have alreadybeen described [24]. Division <strong>of</strong> the cohort was per<strong>for</strong>med with the<strong>patients</strong> who completed the follow-up. The compared main basalfeatures <strong>of</strong> <strong>patients</strong> in the derivation (n=757) and validation cohort(n=768 <strong>patients</strong>) are detailed in Table 2. We found no significantdifferences in clinical features <strong>of</strong> PP included after discharge, atoutpatient clinics, or hospital-at-home, but in inclusion BI, which washigher in out<strong>patients</strong> (69±31) with respect to those included afterdischarge in the derivation cohort (60±33; p=0.01); and in thevalidation cohort (71±33 with respect to 56±34, p=0.001).3.1. Derivation <strong>of</strong> PROFUND indexThe global mortality rate in the derivation cohort was 35%. All riskfactors associated to 12-month mortality in the unadjusted analysis <strong>of</strong>Table 3Unadjusted analysis <strong>of</strong> risk factors associated to 12-month mortality in the derivationcohort <strong>of</strong> <strong>polypathological</strong> <strong>patients</strong> <strong>of</strong> Spain.CharacteristicsMean/Percentages(OR (CI))DemographicsAge (years) 78 vs. 81 b0.0001b70 24%70–74 30% (1.37 (0.7–2.7)) 0.3775–79 25% (1.06 (0.6–0.9)) 0.880–84 34.6% (1.7 (0.97–2.9)) 0.06≥85 49.5% (3.1 (1.8–5.2)) b0.0001Requiring caregiver 48% (1.96 (1.6–2.4)) b0.0001Clinical featuresNumber <strong>of</strong> inclusion categories 2.6 vs. 2.8 0.001≥4 inclusion categories 47.4% (1.86 (1.24–2.8)) 0.002Category E (neurological diseases) 40.2% (1.44 (1.05–1.96)) 0.021Category G (neoplasias) 47.2% (2 (1.46–2.8)) b0.0001Heart failure (≥II <strong>of</strong> NYHA) 37.8% (1.35 (0.993–1.8)) 0.055Neurological disease with55.1% (2.5 (1.5–4.1)) b0.0001motor impairmentDementia 60.8% (3.48 (2.3–5.35)) b0.0001Recurrent urinary tract infections 52.4% (2.1 (0.8–5)) 0.08III–IV functional class on NYHA 44.7% (1.86 (1.3–2.7)) 0.001III–IV functional class on MRC 42.7% (1.8 (1.15–2.7)) 0.01III–IV functional class on NYHA and/or MRC 44.3% (2 (1.5–2.7)) b0.0001Child–Pugh's B–C stage liver disease 41.5% (5.6 (1.4–22)) 0.014Delirium in last hospital admission 62.5% (3.55 (2.1–5.9)) b0.0001One or more falls in last 12 months 47.9% (1.9 (1.3–2.8)) 0.001Body mass index (kg/m 2 ) 27.6 vs. 29 0.01b25 kg/m 2 41.5% (1.5 (1.07–2.1)) 0.017Analytical parameters (blood–plasma)Hemoglobin b10 g/dl 49.1% (2.1 (1.5–3)) b0.0001Albumin b3.5 g/dl 40.4% (1.85 (1.35–2.5)) b0.0001Albumin b3 g/dL 50% (2.27 (1.6–3.2)) b0.0001us-CRP N5 mg/dl 43.6% (1.86 (1.2–2.84)) 0.004Psychological–functional–socio-familial featuresBarthel index b60 a 55% (3.5 (2.6–4.9)) b0.0001Lawton–Brody index b8(F)/b5(M) b 55% (1.7 (1.3–2.4)) 0.001Cognitive impairment (≥3 errors in PS) 45.7% (2.13 (1.6–2.9))≥5 Errors in PS 51.4% (2.5 (1.8–3.5)) b0.0001Social risk/established problem 41% (1.85 (1.3–2.5)) b0.0001No caregiver or caregiver other than spouse 46% (1.5 (1.3–1.7)) b0.0001Healthcare featuresInclusion after discharge/outpatient/37%/27%/34% 0.07at-home≥4 Hospital admissions in last 12 months 53.2% (2.3 (1.46–3.7)) b0.0001OR:oddsratio;CI:confidence interval; NYHA: New York Heart Association; MRC: MedicalResearch Council; us-CRP: ultrasensitive C-reactive protein; F: female/M: male; PS: Pfeiffer'sscale.a All ten dimensions <strong>of</strong> Barthel index were also associated to mortality.b All eight dimensions <strong>of</strong> Lawton–Brody index were also associated to mortality.pthe derivation cohort are detailed in Table 3. Additionally, all 10/8dimensions <strong>of</strong> the BI/LB were also associated to the primary end-point,respectively. Other possible risk factors (gender, pr<strong>of</strong>ession, caregiver'sage and gender), inclusion criteria (hospital discharge, outpatient, orhospital-at-home), hospital type (tertiary teaching, or basic-general/secondary), all inclusion categories, other comorbidities, number <strong>of</strong>other comorbidities per patient, need <strong>of</strong> chronic home oxygen therapy,number <strong>of</strong> prescribed drugs, polypharmacy, glycated hemoglobin, andcreatininemia N1.5 and N2 mg/dL) were not associated to mortality.Only nine <strong>of</strong> these factors (one demographical, four clinical, oneanalytical, one functional, one socio-familial, and one care feature) wereindependently associated to the primary end-point and, <strong>for</strong> this reason,were used to develop the index, dividing their beta coefficient in the<strong>model</strong> by the lowest beta coefficient (which was dyslipidemia) (Table 4).With respect to basal daily living activities, we developed different <strong>model</strong>sincluding the global basal BI, its ten dimensions, and both. Whenincorporating the ten dimensions <strong>of</strong> daily activities, global BI wasexcluded in the final stepwise <strong>model</strong>, whereas dependence <strong>for</strong> eatingand <strong>for</strong> dressing was incorporated as independent predictors; theremaining independent variables remained identical in both analysis.Nevertheless, this latest <strong>model</strong> obtained poorer results in the validationcohort when compared with the <strong>model</strong>, which included the basal globalBI. For this reason, and because the Barthel index is a universally extendedand easy-to-per<strong>for</strong>m tool in clinical practice, we finally chose the <strong>model</strong>with this factor. Global as well as the eight dimensions <strong>of</strong> instrumentalactivities by means <strong>of</strong> the Lawton–Brody scale, Pfeiffer's scale, soci<strong>of</strong>amilialassessment, and the remaining factors <strong>of</strong> the unadjusted analysiswere not independent factors in the backward stepwise <strong>model</strong>. Thealternative strategies (<strong>for</strong>ward and bidirectional selection techniques)resulted in no differences in the resulting prognostic variables <strong>of</strong> the<strong>model</strong>ling. Cox regression <strong>model</strong>s, in which the outcome was time todeath, also resulted in the same selection <strong>of</strong> variables.After being divided into death-risk quartiles, mortality rangedfrom 12.8% in the lowest, to 67.9% in the highest risk quartile. Adetailed stratification <strong>of</strong> the four risk quartiles according to predictedprobabilities is detailed in Table 5.All <strong>patients</strong> were assigned their respective PROFUND scores (scorerange 0–20) and divided into four different score groups. One yearmortality rates were as follows: 0–2 points: 12.1%; 3–6 points: 21.5%;7–10 points: 45%; and 11 or more points: 68%. A detailed description <strong>of</strong>the time-dependent primary end-point according to the four scorestrata is stated in Fig. 1a; mean survival rate was 348±5 days in the firstgroup, 320±6 in the second group, 278±10 in the third group, and216±11 in the fourth group (pb0.0021 in all-risk-group comparisons).Table 4Multivariate analysis <strong>of</strong> risk factors associated to 12-month mortality in the derivationcohort <strong>of</strong> <strong>polypathological</strong> <strong>patients</strong> <strong>of</strong> Spain.Characteristics Odds ratio (CI)/p PROFUNDindexDemographics≥85 years 1.71 (1.15–2.5)/0.008 3Clinical featuresActive neoplasia 3.36 (1.9–5.8)/b0.0001 6Dementia 1.89 (1.1–3.1)/0.019 3III–IV functional class on2.04 (1.4–2.9)/b0.0001 3NYHA and/or MRCDelirium in last hospital admission 2.1 (1.5–4.9)/0.001 3Analytical parameters (blood–plasma)Hemoglobin b10 g/dl 1.8 (1.2–2.7)/0.005 3Psychological–functional–socio-familial featuresBarthel index b60 2.6 (1.38–3.4)/b0.0001 4No caregiver or caregiver other than spouse 1.51 (1.02–2.2)/0.038 2Healthcare features≥4 Hospital admissions in last1.9 (1.07–3.29)/0.028 312 monthsTotal score items=9 0–30pointsPlease cite this article as: Bernabeu-Wittel M, et al, <strong>Development</strong> <strong>of</strong> a <strong>new</strong> <strong>predictive</strong> <strong>model</strong> <strong>for</strong> <strong>polypathological</strong> <strong>patients</strong>. The PROFUNDindex, Eur J Intern Med (2010), doi:10.1016/j.ejim.2010.11.012