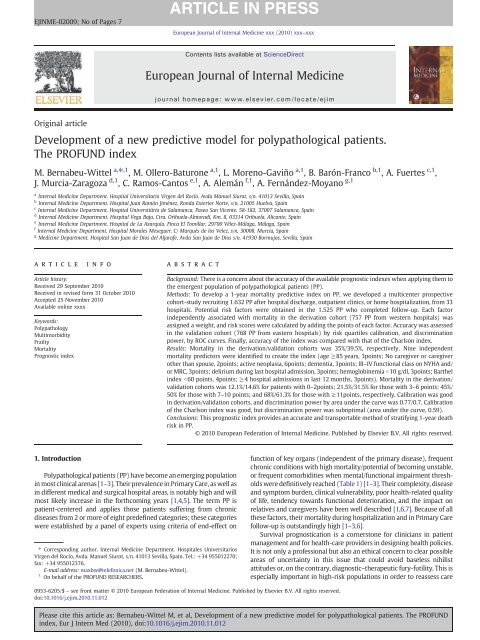
Development of a new predictive model for polypathological patients ...
Development of a new predictive model for polypathological patients ...
Development of a new predictive model for polypathological patients ...
- No tags were found...
Create successful ePaper yourself
Turn your PDF publications into a flip-book with our unique Google optimized e-Paper software.
2 M. Bernabeu-Wittel et al. / European Journal <strong>of</strong> Internal Medicine xxx (2010) xxx–xxxTable 1Functional definition <strong>of</strong> <strong>polypathological</strong> patient: the patient who suffers chronic diseasesincluded in two or more <strong>of</strong> the following clinical categories.Category AA.1 Chronic heart failure with past/present stage II dyspnea <strong>of</strong> NYHA a .A.2 Coronary heart diseaseCategory BB.1 Vasculitides and/or systemic autoimmune diseasesB.2 Chronic renal disease (creatininaemia N1.4/1.3 mg/dL inmen/women or proteinuria b , during ≥3 monthsCategory CChronic lung disease with past/present stage 2 dyspnea <strong>of</strong> MRC c ,or FEV1b65%, or basal SatO 2 ≤90%Category DD.1 Chronic inflammatory bowel diseaseD.2 Chronic liver disease with evidence <strong>of</strong> portal hypertension dCategory EE.1 StrokeE.2 Neurological disease with permanent motor deficit, leading tosevere impairment <strong>of</strong> basic activities <strong>of</strong> daily living (Barthel index b60).E.3 Neurological disease with permanent moderate–severe cognitiveimpairment (Pfeiffer's test with ≥5 errors).Category FF.1 Symptomatic peripheral artery diseaseF.2 Diabetes mellitus with proliferate retinopathy or symptomatic neuropathyCategory GG.1 Chronic anemia (Hbb10 g/dL during ≥3 months) due to digestive-tractlosses or acquired hemopathy not tributary <strong>of</strong> treatment with curative intention.G.2 Solid-organ or hematological active neoplasia not tributary <strong>of</strong> treatmentwith curative intention.Category H:Chronic osteoarticular disease, leading to severe impairment <strong>of</strong> basic activities<strong>of</strong> daily living (Barthel index b60)aSlight limitation <strong>of</strong> physical activity. Com<strong>for</strong>table at rest, but ordinary physical activityresults in fatigue, palpitation, or dyspnea.b Albumin/Creatinine index N300 mg/g, microalbuminuria N3 mg/dL in urine, albuminN300 mg/day in 24-h urine, or albuminuria/min N200 μg/min.c Short <strong>of</strong> breath when hurrying or walking up a slight hill.d Presence <strong>of</strong> clinical, analytical, echographic, or endoscopic data <strong>of</strong> portal hypertension.goals; redefine medically necessary therapies; focus on symptomcontrol; assess other physical, psychosocial, and spiritual problems‘and consider earlier palliative care. With the knowledge <strong>of</strong> a reasonableprecise prognosis, clinicians can feel more com<strong>for</strong>table raising importantissues like care goals, treatment preferences, advanced planning,and clinical therapeutic options with <strong>patients</strong> and their families [8,9].When assessing prognosis in PP populations, we are faced with manydifficulties. Organ- or disease-specific indexes are not suitable due to theusual co-protagonism and similar weight <strong>of</strong> two or more chronic disablingdiseases in PP. More generic and recent instruments require subjectiveassessments <strong>of</strong> risk by clinicians, include disused functional scales, usedifficult algorithms, or are based on administrative data [9–12]. Hence,they are not <strong>of</strong>ten used in routine practice, and most clinicians andinvestigators continue to use the Charlson–Deyo index as the goldstandardtool when referring to prognosis in <strong>patients</strong> with comorbidity[13–15]. Nevertheless, the Charlson–Deyo index has been around <strong>for</strong> over20 years; during this time, <strong>new</strong> diagnostic–therapeutic options havedrastically changed the course <strong>of</strong> many <strong>of</strong> the included conditions (likepeptic ulcer, cardiovascular diseases, AIDS, or some neoplasias), so there isa generalized concern among clinicians that it may have lost some <strong>of</strong> itsaccuracy [15].For all <strong>of</strong> the abovementioned reasons, we developed this multicenterproject with the aim <strong>of</strong> obtaining an accurate prognostic toolspecially designed <strong>for</strong> this vulnerable population, and then compare itsfitness to the Charlson–Deyo index.2. Patients and methodsThis was an observational prospective, multi-institutional studycarried out by researchers from the Polypathological Patient andAdvanced Age Study Group <strong>of</strong> the Spanish Internal Medicine Society.The study inclusion period ranged from February 2007 to June 2008(17 months).2.1. Reference populationAll PP treated in the Internal Medicine and Geriatric areas (in-hospital,as well as in outpatient clinics, and at-home hospitalization <strong>patients</strong>) fromthe 33 Spanish hospitals (17 tertiary teaching centers and 16 secondary/basic general hospitals) participated in the study (all participant centersare listed on the PROFUND Researchers list).2.2. Inclusion criteriaPatients ≥18 years old who met criteria <strong>of</strong> PP (see Table 1) wereconsecutively included, after providing their written in<strong>for</strong>med consent[16]. In-hospital <strong>patients</strong> were included at discharge, and thoseidentified at outpatient clinics (internal medicine outpatient clinics,Day Hospital, and/or at-home hospitalization <strong>patients</strong>) were includedduring any one <strong>of</strong> their visits. Patients who died during their hospital stayand those who did not concede to participate in the study were excluded.2.3. <strong>Development</strong> <strong>of</strong> the study, data collection, and follow-upAfter receiving in<strong>for</strong>med consent, a complete set <strong>of</strong> demographical,clinical, functional, analytical, pharmacological, as well as socio-familialdata were collected from all included <strong>patients</strong>.Demographic data included age, gender, residence, employment data¸and the main caregiver's pr<strong>of</strong>ile; clinical data included the differentdiseases, the fulfillment <strong>of</strong> polypathology criteria, stage <strong>of</strong> differentdiseases (NYHA and MRC dyspnea rates [17,18], and Child–Pugh stage[19]), assessment <strong>of</strong> Charlson's comorbidity index [13,14], differentsymptoms and signs, body mass index (BMI), assessment <strong>of</strong> basal aswell as inclusion ability in per<strong>for</strong>ming daily-living (ADL) and instrumentalactivities (IA) by means <strong>of</strong> Barthel (BI), and Lawton–Brody indexes (L–B)[20,21], assessment <strong>of</strong> basal cognitive impairment using the Spanishvalidated version <strong>of</strong> Pfeiffer's questionnaire (PQ) [22], and number <strong>of</strong>hospital admissions in the last 12 and 3 months, respectively; laboratorydata included plasma creatinine (CR (mg/dL)), hemoglobin (HB (g/dL)),albumin (ALB (g/dL), glycated hemoglobin (HbA1c (%)), and ultrasensitiveC reactive protein (us-CRP (mg/L); pharmacological data includednumber and type <strong>of</strong> chronically prescribed drugs at basal status; andsocio-familial data included socio-familial risk determined using the Gijónscale (GS) [23]. The GS is a validated scale that assesses the overall soci<strong>of</strong>amilialsituation exploring 5 specific dimensions (family, economics,housing, social relations, and social network support) on a 1–5Likertscale(score rank 5–25 points); a score b10 confers low social risk, 10–16confers risk <strong>of</strong> social claudicating, and N16 points defines an establishedsocial problem.All included <strong>patients</strong> were followed-up during a 12-month period.After this period, time survival was assessed, and, in the case <strong>of</strong> death,chronology <strong>of</strong> the demise was incorporated. There<strong>for</strong>e, we looked atmortality as both a dichotomous and as time-dependent outcome. Forthe dichotomous outcome, subjects were categorized depending onwhether or not they survived 12 months from their initial interviewdate. For the continuous outcome, survival time was defined as thenumber <strong>of</strong> days between the baseline interview and the date <strong>of</strong> death.2.4. DefinitionsNutritional status was categorized by means <strong>of</strong> WHO criteria <strong>for</strong> BMIvalues (overweight–obesity (BMIN24.9), normal weight (BMI between18.5 and 24.9), underweight (BMIb18.5)) [24]; hypoalbuminemia wasdefined as albumin levels b3.5 g/dL (severe hypoalbuminemia whenvalues were b1.8 g/dL, moderate when values were between1.8–2.69 g/dL, and slight hypoalbuminemia when values were between2.7 and 3.5 g/dL); Polypharmacy was defined as the chronic prescriptionPlease cite this article as: Bernabeu-Wittel M, et al, <strong>Development</strong> <strong>of</strong> a <strong>new</strong> <strong>predictive</strong> <strong>model</strong> <strong>for</strong> <strong>polypathological</strong> <strong>patients</strong>. The PROFUNDindex, Eur J Intern Med (2010), doi:10.1016/j.ejim.2010.11.012
M. Bernabeu-Wittel et al. / European Journal <strong>of</strong> Internal Medicine xxx (2010) xxx–xxx3<strong>of</strong> ≥5 drugs. Dependence in functional status <strong>for</strong> ADL and IA was definedby a BIb60 points and by a LBb8 <strong>for</strong> females/b5 <strong>for</strong> males, respectively;cognitive impairment was defined by 3 or more errors on the PQ (4 ormore if the patient had not completed elementary school and 2 or moreif the patient had a college education); this was categorized as mild–moderate impairment (between 3 and 7 errors), and severe (8 or moreerrors); and finally socio-familial risk/problem was defined as a GSscore ≥10. The need <strong>for</strong> a caregiver was defined when the patient wasfunctionally dependent (BIb60) and/or cognitively impaired (PQ≥3errors).2.5. Derivation and validation <strong>of</strong> PROFUND SCALE. Statistical analysisThe included population was divided into a derivation cohort(containing approximately one half <strong>of</strong> the participating hospitals (fromthe west <strong>of</strong> Spain) and <strong>patients</strong>) and a validation cohort (containingapproximately half <strong>of</strong> the remaining participating hospitals (from theeast <strong>of</strong> Spain and the islands) and <strong>patients</strong>).The PROFUND scale was derived and validated as follows: unadjustedrelationships between potential risk factors and mortality were assessedin the derivation cohort using logistic regression <strong>model</strong>s. Significantvariables (pb0.05) were entered into a multiple backward logisticregression <strong>model</strong>. Risk factors that remained significant after adjustment(pb0.05) were used to create the <strong>predictive</strong> <strong>model</strong>. Analysis <strong>of</strong> riskfactors associated to death as a time-dependent variable was per<strong>for</strong>medby Cox regression <strong>model</strong>s, in which the outcome was time to death.The 1-year mortality risk scoring system was created by assigningpoints to each risk factor by dividing each beta coefficient in the <strong>model</strong>by the lowest beta coefficient and rounding to the nearest integer.Subjects in the derivation and validation cohorts were divided intoquartiles based on their risk scores.To test the stability <strong>of</strong> our final <strong>model</strong>, we tried alternate methods(<strong>for</strong>ward and bidirectional selection techniques) to determine whetherthe resultant <strong>model</strong> would differ from our original <strong>model</strong>.To validate the index, we determined the calibration <strong>of</strong> the indexby comparing in the validation cohort the predicted mortality(divided into probability risk quartiles) to the observed mortality bymeans <strong>of</strong> Kaplan–Meier curves (and log-rank test) and also bycalculating the Hosmer–Lemeshow goodness-<strong>of</strong>-fit test. Then weevaluated the discrimination <strong>of</strong> the index by applying the pointscoring system created in the development cohort to the validationcohort, thereby determining risk scores <strong>for</strong> each participant, andcalculating the area under the receiver operating characteristic (ROC),<strong>for</strong> the final <strong>model</strong> in both the derivation and validation cohorts. Wechose to validate our <strong>predictive</strong> index in a different region <strong>of</strong> thecountry from where it was developed in order to test geographictransportability as well as diagnostic accuracy.Finally we compared the discrimination power <strong>of</strong> the PROFUNDindex in the whole cohort with those <strong>of</strong> the Charlson–Deyo index (CDI),the CDI adjusted by age, the Barthel, and the Lawton–Brody index bycalculating the AUC <strong>of</strong> their ROC curves.The dichotomous variables were described as whole numbers andpercentages and the continuous variables as mean and standard deviation(or median and rank in those with no criteria <strong>of</strong> normal distribution). Thedistribution <strong>of</strong> all variables was analyzed with the Kolmorogov–Smirnovtest. All statistics were per<strong>for</strong>medusingtheSPSS16.0computerpack.Table 2Comparative main basal clinical features <strong>of</strong> the derivation and validation cohorts <strong>of</strong> <strong>polypathological</strong> <strong>patients</strong> included in the PROFUND project.Clinical features (mean ±SD/median [IQR]/N [%]) Derivation cohort (n=757) Validation cohort (n=768)Age 79±9 78.8±9.8Sex (males) 408 (54.3%) 417 (54.7%)Requiring caregiver/having caregiver 391(51.7%)/530(70%) 407(53.8%)/590(78%)Illiteracy rate (men/women) 37.5% (34.3%/41.4%) 41.6% (38.1%/45%)Patients included in tertiary teaching/basic-secondary hospitals 394 (52%)/363 (48%) 422 (55%)/346 (45%)Number <strong>of</strong> defining categories/patient 2.7±0.83 2.7±0.84Patients with ≥3 categories 384 (50.7%) 389 (49.3%)Prevalence <strong>of</strong> defining categories in recruited PPCategory A (heart diseases) 598 (79%) 590 (77)Category C (lung diseases) 355 (47%) 345 (45)Category E (neurological diseases) 271 (36%) 306 (40)Category B (kidney/autoimmune diseases) 243 (32.2%) 247 (32.7%)Category G (chronic neoplasia/anemia) 197 (26%) 197 (25.7%)Category F (peripheral arterial disease/diabetes with neuropathy) 202 (27%), 188 (24.5%),Category H (degenerative osteoarticular disease) 125 (16.5%) 135 (17.5%)Category D (liver disease) 51 (6.7) 58 (7.6)Number <strong>of</strong> other comorbidities/patient 3.1±1.6 3.2±1.7Patients with ≥4 other comorbidities 246 (33 %) 287 (37%) (p=0.047)Most frequent other comorbiditiesHypertension 559 (73%) 536 (70%)Arrhythmias 268 (35.9%) 291 (37%)Atrial fibrillation 255 (34.2%) 279 (35.4%)Other arrhythmias 13 (1.7%) 12 (1.6%)Diabetes without visceral involvement 213 (28%) 239 (31%)Dyslipidemia 218 (29%) 226 (29.4%)Anxiety and depressive disorders 98 (13%) 102 (13.3%)Benign prostate hyperplasia 73 (10%) 88 (11.5%)Osteoporosis 45 (6%) 56 (7.3%)Mean plasmatic creatinine (mg/dl)/hemoglobin (g/dl) 1.28±0.8/11.8 ±2.2 1.23±0.8/11.5±2Albumin (g/dl)/body mass index 3.3[0.8]/28.5±6 3.3[0.9]/28.4±6Mean HbA1c (%)/us-CRP (mg/dl) 7.1%±1.6/6.3[20] 7.1%±1.6/7.1[17]Charlson index/Charlson index adjusted by age 4 [2]/8.5 [2.4] 4 [3]/8.1 [2]Patients with basal III–IV class <strong>of</strong> NYHA/III–IV class <strong>of</strong> MRC 226(47.4%)/178 (51.6%) 245(49%)/186 (54.5%)Patients with active neoplasia at inclusion/metastatic disease 85 (11.2%)/39 (44%) 77 (10%)/30 (33%)Hospitalizations in last 12 months 1.85±1.6 1.95±1.7Patients with delirium in last hospital admission 72 (10%) 115 (15%) (p=0.01)Basal Barthel index/basal Lawton–Brody index 69.4±31/F =2 [4]; M=3[4] 69.6±31/F =2 [4]; M=3[5]Inclusion Pfeiffer scale/Gijon's socio-familial risk scale 2 [4]/10.4 ±3.5 2 [5]/10.2 ±3.2Number <strong>of</strong> prescribed drugs at inclusion/<strong>patients</strong> with polypharmacy 7.9±3/598 (83%) 8.1±3.3/640 (87%)IQR: interquartile range; HbA1c: glycated hemoglobin; us-CRP: ultrasensitive C-reactive protein; NYHA: New York Heart Association; MRC: Medical Research Council; F=female; M=male.Please cite this article as: Bernabeu-Wittel M, et al, <strong>Development</strong> <strong>of</strong> a <strong>new</strong> <strong>predictive</strong> <strong>model</strong> <strong>for</strong> <strong>polypathological</strong> <strong>patients</strong>. The PROFUNDindex, Eur J Intern Med (2010), doi:10.1016/j.ejim.2010.11.012
4 M. Bernabeu-Wittel et al. / European Journal <strong>of</strong> Internal Medicine xxx (2010) xxx–xxx3. ResultsA total <strong>of</strong> 1632 PP (75% hospitalized, 17.5% outpatient, and 7.5% athome<strong>patients</strong>) were included in the study, and 93.44% <strong>of</strong> them(N=1525) completed the 12-month follow-up. The main demographical,clinical, and care features <strong>of</strong> the whole inclusion cohort have alreadybeen described [24]. Division <strong>of</strong> the cohort was per<strong>for</strong>med with the<strong>patients</strong> who completed the follow-up. The compared main basalfeatures <strong>of</strong> <strong>patients</strong> in the derivation (n=757) and validation cohort(n=768 <strong>patients</strong>) are detailed in Table 2. We found no significantdifferences in clinical features <strong>of</strong> PP included after discharge, atoutpatient clinics, or hospital-at-home, but in inclusion BI, which washigher in out<strong>patients</strong> (69±31) with respect to those included afterdischarge in the derivation cohort (60±33; p=0.01); and in thevalidation cohort (71±33 with respect to 56±34, p=0.001).3.1. Derivation <strong>of</strong> PROFUND indexThe global mortality rate in the derivation cohort was 35%. All riskfactors associated to 12-month mortality in the unadjusted analysis <strong>of</strong>Table 3Unadjusted analysis <strong>of</strong> risk factors associated to 12-month mortality in the derivationcohort <strong>of</strong> <strong>polypathological</strong> <strong>patients</strong> <strong>of</strong> Spain.CharacteristicsMean/Percentages(OR (CI))DemographicsAge (years) 78 vs. 81 b0.0001b70 24%70–74 30% (1.37 (0.7–2.7)) 0.3775–79 25% (1.06 (0.6–0.9)) 0.880–84 34.6% (1.7 (0.97–2.9)) 0.06≥85 49.5% (3.1 (1.8–5.2)) b0.0001Requiring caregiver 48% (1.96 (1.6–2.4)) b0.0001Clinical featuresNumber <strong>of</strong> inclusion categories 2.6 vs. 2.8 0.001≥4 inclusion categories 47.4% (1.86 (1.24–2.8)) 0.002Category E (neurological diseases) 40.2% (1.44 (1.05–1.96)) 0.021Category G (neoplasias) 47.2% (2 (1.46–2.8)) b0.0001Heart failure (≥II <strong>of</strong> NYHA) 37.8% (1.35 (0.993–1.8)) 0.055Neurological disease with55.1% (2.5 (1.5–4.1)) b0.0001motor impairmentDementia 60.8% (3.48 (2.3–5.35)) b0.0001Recurrent urinary tract infections 52.4% (2.1 (0.8–5)) 0.08III–IV functional class on NYHA 44.7% (1.86 (1.3–2.7)) 0.001III–IV functional class on MRC 42.7% (1.8 (1.15–2.7)) 0.01III–IV functional class on NYHA and/or MRC 44.3% (2 (1.5–2.7)) b0.0001Child–Pugh's B–C stage liver disease 41.5% (5.6 (1.4–22)) 0.014Delirium in last hospital admission 62.5% (3.55 (2.1–5.9)) b0.0001One or more falls in last 12 months 47.9% (1.9 (1.3–2.8)) 0.001Body mass index (kg/m 2 ) 27.6 vs. 29 0.01b25 kg/m 2 41.5% (1.5 (1.07–2.1)) 0.017Analytical parameters (blood–plasma)Hemoglobin b10 g/dl 49.1% (2.1 (1.5–3)) b0.0001Albumin b3.5 g/dl 40.4% (1.85 (1.35–2.5)) b0.0001Albumin b3 g/dL 50% (2.27 (1.6–3.2)) b0.0001us-CRP N5 mg/dl 43.6% (1.86 (1.2–2.84)) 0.004Psychological–functional–socio-familial featuresBarthel index b60 a 55% (3.5 (2.6–4.9)) b0.0001Lawton–Brody index b8(F)/b5(M) b 55% (1.7 (1.3–2.4)) 0.001Cognitive impairment (≥3 errors in PS) 45.7% (2.13 (1.6–2.9))≥5 Errors in PS 51.4% (2.5 (1.8–3.5)) b0.0001Social risk/established problem 41% (1.85 (1.3–2.5)) b0.0001No caregiver or caregiver other than spouse 46% (1.5 (1.3–1.7)) b0.0001Healthcare featuresInclusion after discharge/outpatient/37%/27%/34% 0.07at-home≥4 Hospital admissions in last 12 months 53.2% (2.3 (1.46–3.7)) b0.0001OR:oddsratio;CI:confidence interval; NYHA: New York Heart Association; MRC: MedicalResearch Council; us-CRP: ultrasensitive C-reactive protein; F: female/M: male; PS: Pfeiffer'sscale.a All ten dimensions <strong>of</strong> Barthel index were also associated to mortality.b All eight dimensions <strong>of</strong> Lawton–Brody index were also associated to mortality.pthe derivation cohort are detailed in Table 3. Additionally, all 10/8dimensions <strong>of</strong> the BI/LB were also associated to the primary end-point,respectively. Other possible risk factors (gender, pr<strong>of</strong>ession, caregiver'sage and gender), inclusion criteria (hospital discharge, outpatient, orhospital-at-home), hospital type (tertiary teaching, or basic-general/secondary), all inclusion categories, other comorbidities, number <strong>of</strong>other comorbidities per patient, need <strong>of</strong> chronic home oxygen therapy,number <strong>of</strong> prescribed drugs, polypharmacy, glycated hemoglobin, andcreatininemia N1.5 and N2 mg/dL) were not associated to mortality.Only nine <strong>of</strong> these factors (one demographical, four clinical, oneanalytical, one functional, one socio-familial, and one care feature) wereindependently associated to the primary end-point and, <strong>for</strong> this reason,were used to develop the index, dividing their beta coefficient in the<strong>model</strong> by the lowest beta coefficient (which was dyslipidemia) (Table 4).With respect to basal daily living activities, we developed different <strong>model</strong>sincluding the global basal BI, its ten dimensions, and both. Whenincorporating the ten dimensions <strong>of</strong> daily activities, global BI wasexcluded in the final stepwise <strong>model</strong>, whereas dependence <strong>for</strong> eatingand <strong>for</strong> dressing was incorporated as independent predictors; theremaining independent variables remained identical in both analysis.Nevertheless, this latest <strong>model</strong> obtained poorer results in the validationcohort when compared with the <strong>model</strong>, which included the basal globalBI. For this reason, and because the Barthel index is a universally extendedand easy-to-per<strong>for</strong>m tool in clinical practice, we finally chose the <strong>model</strong>with this factor. Global as well as the eight dimensions <strong>of</strong> instrumentalactivities by means <strong>of</strong> the Lawton–Brody scale, Pfeiffer's scale, soci<strong>of</strong>amilialassessment, and the remaining factors <strong>of</strong> the unadjusted analysiswere not independent factors in the backward stepwise <strong>model</strong>. Thealternative strategies (<strong>for</strong>ward and bidirectional selection techniques)resulted in no differences in the resulting prognostic variables <strong>of</strong> the<strong>model</strong>ling. Cox regression <strong>model</strong>s, in which the outcome was time todeath, also resulted in the same selection <strong>of</strong> variables.After being divided into death-risk quartiles, mortality rangedfrom 12.8% in the lowest, to 67.9% in the highest risk quartile. Adetailed stratification <strong>of</strong> the four risk quartiles according to predictedprobabilities is detailed in Table 5.All <strong>patients</strong> were assigned their respective PROFUND scores (scorerange 0–20) and divided into four different score groups. One yearmortality rates were as follows: 0–2 points: 12.1%; 3–6 points: 21.5%;7–10 points: 45%; and 11 or more points: 68%. A detailed description <strong>of</strong>the time-dependent primary end-point according to the four scorestrata is stated in Fig. 1a; mean survival rate was 348±5 days in the firstgroup, 320±6 in the second group, 278±10 in the third group, and216±11 in the fourth group (pb0.0021 in all-risk-group comparisons).Table 4Multivariate analysis <strong>of</strong> risk factors associated to 12-month mortality in the derivationcohort <strong>of</strong> <strong>polypathological</strong> <strong>patients</strong> <strong>of</strong> Spain.Characteristics Odds ratio (CI)/p PROFUNDindexDemographics≥85 years 1.71 (1.15–2.5)/0.008 3Clinical featuresActive neoplasia 3.36 (1.9–5.8)/b0.0001 6Dementia 1.89 (1.1–3.1)/0.019 3III–IV functional class on2.04 (1.4–2.9)/b0.0001 3NYHA and/or MRCDelirium in last hospital admission 2.1 (1.5–4.9)/0.001 3Analytical parameters (blood–plasma)Hemoglobin b10 g/dl 1.8 (1.2–2.7)/0.005 3Psychological–functional–socio-familial featuresBarthel index b60 2.6 (1.38–3.4)/b0.0001 4No caregiver or caregiver other than spouse 1.51 (1.02–2.2)/0.038 2Healthcare features≥4 Hospital admissions in last1.9 (1.07–3.29)/0.028 312 monthsTotal score items=9 0–30pointsPlease cite this article as: Bernabeu-Wittel M, et al, <strong>Development</strong> <strong>of</strong> a <strong>new</strong> <strong>predictive</strong> <strong>model</strong> <strong>for</strong> <strong>polypathological</strong> <strong>patients</strong>. The PROFUNDindex, Eur J Intern Med (2010), doi:10.1016/j.ejim.2010.11.012
M. Bernabeu-Wittel et al. / European Journal <strong>of</strong> Internal Medicine xxx (2010) xxx–xxx5Table 5Calibration <strong>of</strong> PROFUND index in the derivation and validation cohort by death-riskquartiles according to predicted probability <strong>of</strong> death, and per<strong>for</strong>mance <strong>of</strong> goodness-<strong>of</strong>fitHosmer–Lemeshow test.Risk quartile Derivation cohort Validation cohortFirst quartile 12.8% 14.6%Second quartile 24.1% 24.4%Third quartile 44.8% 46.6%Fourth quartile 67.9% 61.3%Hosmer–Lemeshow test p=0.432 p=0.063The calibration obtained in the derivation cohort was good (p=0.432inthe Hosmer–Lemeshow goodness-<strong>of</strong>-fit test); besides, discriminationpower <strong>of</strong> the PROFUND index obtained in the derivation cohort was alsogood (AUC=0.77 [0.731–0.805] in ROC curve).3.2. Validation <strong>of</strong> PROFUND indexGlobal mortality in the validation cohort was 39.5%. Mortalityaccording to risk quartiles <strong>of</strong> predicted probability ranged from 14.6%in the lowest to 61.3% in the highest risk quartile.a.When assessing individual patient scores, mortality was 14.6% inthe first group, 31.5% in the second, 50% in the third, and 61.3% in thefourth group. A detailed description <strong>of</strong> the time-dependent primaryend point according to death-risk scores is stated in Fig. 1b; the meansurvival rate was 340±6 days in the first group, 304±7 in the secondgroup, 254±11 in the third group, and 239±10 in the fourth group(pb0.0001 in all risk quartile comparisons, but pb0.08 in comparisonbetween the third/fourth groups). Accuracy testing <strong>of</strong> the PROFUNDindex showed good calibration (p=0.063) in the Hosmer–Lemeshowgoodness-<strong>of</strong>-fit test (Table 5) and also a good discrimination power(AUC=0.7 [0.67–0.74] in ROC curve).3.3. Comparison <strong>of</strong> the PROFUND index with the Charlson–Deyo indexWhen assessing accuracy <strong>of</strong> the Charlson–Deyo Index (CDI) in thewhole cohort (derivation+calibration cohorts) by its risk grouping,we obtained a global mortality <strong>of</strong> 0% in the first risk group <strong>for</strong> both CDIand CDI adjusted by age (predicted mortality 12%), 29%/23.4% in CDIand CDI adjusted by age, in the second risk group (predicted mortality26%), 35.7%/25.6% in CDI and CDI adjusted by age, in the third riskgroup (predicted mortality 52%), and 46%/38.8% in CDI and CDIadjusted by age, in the fourth risk group (predicted mortality 85%);we obtained good calibration with the Hosmer–Lemeshow goodness<strong>of</strong>-fittest (p=0.87 <strong>for</strong> CDI and p=0.95 <strong>for</strong> CDI adjusted by age,respectively). However, discrimination power <strong>for</strong> both CDI and CDIadjusted by age obtained suboptimal results (AUC=0.59 [0.56–0.62]<strong>for</strong> CDI and 0.62 [0.59–0.64] <strong>for</strong> CDI adjusted by age). Comparative 12-month mortality discrimination power <strong>of</strong> the PROFUND index, CDI,CDI adjusted by age, the Lawton–Brody index, and the Barthel index inthe whole cohort (derivation+validation) is detailed in Fig. 2.4. DiscussionWe have developed and validated a <strong>new</strong> accurate and easy-to-per<strong>for</strong>mprognostic index specifically designed <strong>for</strong> <strong>polypathological</strong> patientpopulations. The PROFUND index includes demographical (age), clinical(presence <strong>of</strong> neoplasia, dementia, disabling dyspnea, and delirium in lasthospital admission), laboratory (hemoglobin), functional (BI), socio-b.Fig. 1. Kaplan–Meier 12-month survival curves <strong>of</strong> <strong>polypathological</strong> <strong>patients</strong> from Spain, bytheir PROFUND index death-risk scores in the derivation (a) and validation cohorts (b).Fig. 2. Comparative 12-month mortality discrimination power <strong>of</strong> PROFUND index, Charlson–Deyo index, Charlson–Deyo index adjusted by age, Barthel index, and Lawton–Brody index, ina multiinstitutional population <strong>of</strong> <strong>polypathological</strong> <strong>patients</strong> from Spain, by means <strong>of</strong> ROCcurves and determination <strong>of</strong> area under the curve. AUC: area under the curve; CI: confidenceinterval; AA: adjusted by age; Barthel: Barthel index; Lawton–Brody: Lawton–Brody index.Please cite this article as: Bernabeu-Wittel M, et al, <strong>Development</strong> <strong>of</strong> a <strong>new</strong> <strong>predictive</strong> <strong>model</strong> <strong>for</strong> <strong>polypathological</strong> <strong>patients</strong>. The PROFUNDindex, Eur J Intern Med (2010), doi:10.1016/j.ejim.2010.11.012
6 M. Bernabeu-Wittel et al. / European Journal <strong>of</strong> Internal Medicine xxx (2010) xxx–xxxfamilial (No caregiver or caregiver other than spouse), and care (number<strong>of</strong> hospitalizations in last 12 months) variables. The cut-<strong>of</strong>f point <strong>of</strong>85 years is consistent with present clinical perception (nowadays agesbetween 75 and 85 are routinely not excluded from “intense management”in clinicians’ mindsinmostcases)butalsowith future trends in lifeexpectancy increase [4,5].Asamatter<strong>of</strong>fact,peoplearelivinglongerandare reaching older ages with better health status. However, these peopleprogressively accumulate chronic conditions, so the intersection <strong>of</strong> olderages and polypathology is and will be <strong>of</strong> notable interest. All clinical–laboratory items <strong>of</strong> the index are demonstrated risk factors <strong>of</strong> poor healthoutcomes in different conditions [9,11,25–27]; with respect to III–IVfunctional class <strong>of</strong> NYHA and/or MRC, we think it is a practical approach toassess severity <strong>of</strong> heart failure and chronic lung diseases because <strong>of</strong> its easydetermination, the frequent coexistence <strong>of</strong> both conditions in many PP,and their good correlation with more technical, and also more difficultapproaches like left ventricular function and spirometry [28–31].Furthermore, hemoglobinemia is a relatively easy laboratory measure,probably easier than other measures proposed in other prognostic indexes[11]. The Barthel index is nowadays the most universally used tool toassess daily living activities, and its administration can be per<strong>for</strong>med byany healthcare pr<strong>of</strong>essional in 2–3min [20,25]; in our <strong>model</strong>ling, theinclusion <strong>of</strong> the global index added significantly more calibration anddiscrimination power than the two individual dimensions independentlyassociated to mortality (dependence in eating and dressing), <strong>for</strong> all thesereasons, we considered its inclusion in our index appropriate. Finally theprognostic weight <strong>of</strong> socio-familial and care factors underscores theimportance <strong>of</strong> integrally evaluating frail populations not only <strong>for</strong> clinicalmanagement but also in order to accurately establish prognosis.Our index showed also good geographical transportability through itsvalidation in a cohort <strong>of</strong> PP from different regions than those included inthe derivation cohort. Generalizability <strong>of</strong> any prognostic index is animportant but <strong>of</strong>ten <strong>for</strong>gotten issue; in this sense spectrum transportabilityis now ongoing in a cohort <strong>of</strong> PP recruited at the Primary Care level(non-published data); nevertheless, underfitting <strong>of</strong> the PROFUND index isdifficult to exclude at the stage <strong>of</strong> development, but we think that allimportant prognostic variables with respect to this population have beenincluded. With respect to reproducibility, we think that the index is notoverfitted; on the contrary, it probably fits well to real patterns rather thanto random noise, because the ratio <strong>of</strong> the number <strong>of</strong> variables to thenumber <strong>of</strong> <strong>patients</strong> experiencing events was not at all small [32].Nevertheless, only future studies assessing its per<strong>for</strong>mance in terms <strong>of</strong>reproducibility and different aspects <strong>of</strong> transportability are needed toexactly define its external validity.Polypathological <strong>patients</strong> are a remarkably homogeneous, emergentpopulation in all hospitals, with a prevalence range <strong>of</strong> 20–45% dependingon the evaluated areas [1,2,24]. They are characterized by their highcomplexity, symptom load, clinical vulnerability, high prevalence <strong>of</strong>functional impairment, dependence on their caregivers, and social frailty[1–3,24]. Furthermore, PP are included in the so-called <strong>patients</strong> with“multiple complex chronic diseases”, who are consuming around 40–55%<strong>of</strong> all hospital stays, so they are nowadays considered a priority by manyhealthcare organizations, which have proposed innovative care pathwaysin order to improve their overall attention [33,34]. For all <strong>of</strong> these reasons,different specific health interventions could be desirable in order tooptimize their healthcare delivery, as well as to improve their healthoutcomes. Being able to count on a simple clinical tool that accuratelystratifies these high-risk <strong>patients</strong> into four mortality risk groups (rangingfrom around 10–15% to around 60–65%) is <strong>of</strong> extreme value in clinical,policy making, and epidemiological scenarios. In clinical settings, ourindex may be useful in identifying both high- and low-risk <strong>patients</strong> so thatspecific interventions can be targeted to each group. Better identification<strong>of</strong> low–moderate risk PP may speed up and intensify health interventionsthereby avoiding poor outcomes; on the other hand, better identification<strong>of</strong> <strong>patients</strong> at high risk <strong>of</strong> death may lead to an earlier onset <strong>of</strong> palliativecare, redefining the usefulness <strong>of</strong> medical therapies, and enhancedprovision <strong>of</strong> com<strong>for</strong>t measures. Our index may also be useful when riskadjustment is needed to compare patient outcomes among differenthealth care organizations in order to improve future medical care. Finally,the PROFUND index may be also useful in epidemiological as well asinterventional studies in order to avoid bias, and in order to make it easierto include PP in different clinical trials.With respect to CDI and CDI adjusted by age, our index showed higherdiscrimination power, and better calibration. The reasons are probablydue to the nature <strong>of</strong> the index and the included variables. CDI is sustainedonly by clinical diseases and age, while our index is sustained by aspectrum <strong>of</strong> multi-level variables, as the result <strong>of</strong> a global–integralapproach to <strong>patients</strong>; taking into account other areas, that have alreadybeen demonstrated as independent prognostic factors like functional,socio-familial, and care issues. The loss <strong>of</strong> accuracy <strong>of</strong> CDI probably lies inthe notable improvements <strong>of</strong> different therapies, which have deeplychanged the outcome <strong>of</strong> many <strong>of</strong> the diseases, that con<strong>for</strong>m the index (likecardiovascular diseases, different neoplasias, AIDS, and gastroduodenaldiseases), and in the improvement in global life expectancy. An additionalexplanation could be the fact that prognostic factors used in the CDI(presence <strong>of</strong> some diseases) are someway overlapped to the inclusioncriteria <strong>for</strong> PP definition. Other authors have already pointed towards thisloss <strong>of</strong> CDI accuracy in predicting health-related quality <strong>of</strong> life [35].Finally our mortality index has some limitations. Since our indexfocused on hospital-based PP, it is possible that it may not be applicableto primary-care PP, since many diseases <strong>of</strong> these PP populations are notin such advanced stages as those <strong>of</strong> hospital-based populations.Reproducibility in other cohorts <strong>of</strong> hospital-based PP, as well as futureassessment <strong>of</strong> historical transportability, is also necessary in order toassure generalizability <strong>of</strong> the PROFUND index.In conclusion, we developed and validated a prognostic indexspecifically focused on <strong>polypathological</strong> <strong>patients</strong> using nine simplemeasures <strong>of</strong> different clinical areas that can be easily determined with aroutine patient overall evaluation. The index has good calibration anddiscrimination power and was successfully validated in a geographicallydifferent cohort. It effectively stratifies <strong>polypathological</strong> <strong>patients</strong> intogroups at varying risks <strong>of</strong> death, and it can be used in a variety <strong>of</strong>different policy making, epidemiological, clinical, and research settings.Our findings provide further evidence <strong>of</strong> the importance <strong>of</strong> integrallyevaluating frail populations not only <strong>for</strong> clinical management but also inorder to accurately establish prognosis.5. Learning points• Polypathological <strong>patients</strong> con<strong>for</strong>m a homogeneous population inour hospitals. They are characterized by their high 1-year death risk.• Nine risk factors were independently associated to mortality and usedto develop the PROFUND prognostic index. These were age ≥85 years,3 points; No caregiver or caregiver other than spouse, 2 points; activeneoplasia, 6 points; dementia, 3 points; III–IV functional class onNYHA and/or MRC, 3 points; delirium during last hospital admission, 3points; hemoglobinemia b10 g/dL, 3 points; Barthel index b60 points,4 points; ≥4 hospital admissions in last 12 months, 3 points.• Mortality <strong>of</strong> PP in the derivation/validation cohorts was 12.1%/14.6%<strong>for</strong> <strong>patients</strong> with 0–2 points; 21.5%/31.5% <strong>for</strong> those with 3–6 points;45%/50% <strong>for</strong> those with 7–10 points; and 68%/61.3% <strong>for</strong> those with≥11points, respectively.• Accuracy <strong>of</strong> PROFUND index in terms calibration and discrimination,as well as geographical transportability, was good.Conflict <strong>of</strong> interestThe authors have no conflicts <strong>of</strong> interest to report.Author's contributionAll authors have contributed substantially to the work.Please cite this article as: Bernabeu-Wittel M, et al, <strong>Development</strong> <strong>of</strong> a <strong>new</strong> <strong>predictive</strong> <strong>model</strong> <strong>for</strong> <strong>polypathological</strong> <strong>patients</strong>. The PROFUNDindex, Eur J Intern Med (2010), doi:10.1016/j.ejim.2010.11.012
M. Bernabeu-Wittel et al. / European Journal <strong>of</strong> Internal Medicine xxx (2010) xxx–xxx7Ethics committee approvalThe present study has been approved by the ethics committee <strong>of</strong>Hospitales Universitarios Virgen del Rocío.List <strong>of</strong> researchers from the PROFUND projectMáximo Bernabeu-Wittel 1 , Aurelio Fuertes-Martín 2 , Bosco Barón-Franco 3 , José Murcia-Zaragoza 4 , Carmen Ramos-Cantos 5 , AntonioAlemán 6 , Antonio Fernández-Moyano 7 , Manuel Ollero-Baturone 1 ,JavierGalindo-Ocaña 1 , Alberto Escalera-Zalvide 3 , María Sanchez-Ledesma 2 ,Antonia Mora-Rufete 8 ,JoséBarbéGil-Ortega 9 , Lourdes Moreno-Gaviño 1 ,Virginia Rodríguez-Martínez 10 , Carolina Luque-Amado 11 , ManuelRomero-Jiménez 12 , María Maiz-Jiménez 11 , Mª Ángeles Soria-López 13 ,Manuel Rincón-Gómez 1 , Manuel Bayón-Sayago 1 ,PilarRetamar 14 ,JesúsMedina 15 ,NievesRamírez-Duque 1 , Pilar Giner 16 , Beatriz Massa 17 ,TomásMartínez 3 , Manuel Francisco Fernández-Miera 18 , Sixto Ruiz 19 , JoséManuel Machín-Lázaro 20 , Ignacio Novo Valeiro 2 , Guillermo Ternavasio 2 ,Montserrat Godoy 11 ,JordiAligué 21 , Luis Feliu-Mazaria 22 , Manuel Cassani-Garza 1 , Francesc Formiga 23 , Emilio Sacanella 24 , Mª Luisa Rodríguez-Benedito 25 , Manuela Castillo-Blasco 26 , Manuel Montero Pérez-Barquero 27 ,Eulalia Villegas-Bruguera 28 , Blanca Pinilla 29 ,LucyAbella-Vázquez 30 ,JordyForteza-Rey 31 , Jesús Díez-Manglano 32 , Clotilde Morales 21 ,AliciaTejera-Concepción 30 , Pedro Tenllado-Doblas 26 , Francisco Medrano-González 33 ,MªDolores Nieto-Martín 1 , Alberto Ruiz-Cantero 11 , Felipe Díez 10 , MarianoAguayo-Canela 14 , Carlos Sanromán 5 , Cristina de la Calle-Cabrera 2 ,HernánLlorente-Cancho 2 ,SandraGómez-Lesmes 2 , Antonio Sanjosé-Laporte 9 .1 Hospitales Virgen del Rocío, Sevilla; 2 Hospital Universitario, Salamanca;3 Hospital Juan Ramón Jiménez, Huelva; 4 Hospital General deAlicante; 5 Hospital de la Axarquía, Málaga; 6 Hospital Morales Meseguer,Murcia; 7 Hospital San Juan de Dios del Aljarafe, Sevilla; 8 Hospital Generalde Elche; 9 Hospital Vall d´Hebrón, Barcelona; 10 Hospital de Torrecárdenas,Almería; 11 Hospital de la Serranía, Málaga; 12 Hospital Infanta Elena,Huelva; 13 Clínica Virgen de la Vega, Murcia; 14 Hospital Virgen Macarena,Sevilla; 15 Hospital 12 de Octubre, Madrid; 16 Hospital San Cecilio, Granada;17 Hospital de Villajoyosa, Alicante; 18 Hospital Marqués de Valdecillas,Santander; 19 Hospital de Inca, Mallorca; 20 Hospital de Guadalajara;21 Hospital de Manresa, Barcelona; 22 Hospital General de Palma, Mallorca;23 Hospital de Bellvitge, Barcelona; 24 Hospital Clínico, Barcelona; 25 HospitalGeneral de Requena, Valencia; 26 Hospital Dr Moliner, Valencia;27 Hospital Reina S<strong>of</strong>ía, Córdoba; 28 Hospital Dos de Maig, Barcelona;29 Hospital Gregorio Marañón, Madrid; 30 Hospital Nuestra Sra. de laCandelaria, Tenerife; 31 Hospital Son Dureta, Mallorca; 32 Hospital RoyoVillanova, Zaragoza; 33 Hospital de Albacete.AcknowledgmentThe study was supported by Instituto de Salud Carlos III (ISCIII, FIS 07/0047), Ministerio de Sanidad y Consumo, Spain.References[1] Bernabeu-Wittel M, Jadad A, Moreno-Gaviño L, Hernández-Quiles C, Toscano F,Cassani M, et al. Peeking through the cracks: an assessment <strong>of</strong> the prevalence,clinical characteristics and health-related quality <strong>of</strong> life <strong>of</strong> people with polypathologyin a hospital setting. Arch Gerontol Geriatr 2010;51:185–91.[2] García-Morillo JS, Bernabeu-Wittel M, Ollero-Baturone M, Aguilar-Guisado M,Ramírez-Duque N, González de la Puente MA, et al. Incidencia y característicasclínicas de los pacientes con pluripatología ingresados en una unidad de MedicinaInterna. Med Clin (Barc) 2005;125:5–9.[3] Ramírez-Duque N, Ollero-Baturone M, Bernabeu-Wittel M, Rincón-Gómez M,Ortiz-Camuñez MA, García-Morillo S. Clinical, functional, mental and soci<strong>of</strong>amiliarfeatures in <strong>polypathological</strong> <strong>patients</strong>. One-year prospective study in PrimaryHealth Care. Rev Clín Esp 2008;208:4–11.[4] World Health Organization. Atlas <strong>of</strong> health in Europe 2nd Edition 2008. Availableat http://www.euro.who.int/Document/E91713.pdf2008.[5] EUROSTAT. Europe in figures. EUROSTAT Year Book 2009. Available at: http://ec.europa.eu/eurostat2009.[6] Garcia-Morillo JS, Bernabeu-Wittel M, Ollero-Baturone M, Gonzalez de la Puente MA,Cuello-Contreras JA. Risk factors associated to mortality and functional deteriorationin pluripathologic <strong>patients</strong> with heart failure. Rev Clín Esp 2007;207:1–5.[7] Moreno-Gaviño L, Bernabeu-Wittel M, Álvarez-Tello M, Rincón M, García-MorilloS, Cassani M, et al. Overload felt by the figure <strong>of</strong> the main caregiver in a cohort <strong>of</strong><strong>patients</strong> with multiple pathologies. Aten Primaria 2008;40:193–8.[8] Department <strong>of</strong> Health. Supporting people with long term conditions. An NHS andSocial Care Model to support local innovation and integration. Available at: http://www.dh.gov.uk/prod_consum_dh/groups/dh_digitalassets/@dh/@en/documents/digitalasset/dh_4122574.pdf2005.[9] Levine SK, Sachs GA, Jin L, Meltzer D. A prognostic <strong>model</strong> <strong>for</strong> 1-year mortality inolder adults after hospital discharge. Am J Med 2007;120:455–60.[10] Knaus WA, Harrell FE, Lynn J, et al. The SUPPORT prognostic <strong>model</strong>: objectiveestimates <strong>of</strong> survival <strong>for</strong> seriously ill hospitalized older adults. Ann Intern Med1995;122:191–203.[11] Walter LC, Brand RJ, Counsell SR, et al. <strong>Development</strong> and validation <strong>of</strong> a prognostic index<strong>for</strong> 1-year mortality in older adults after hospitalization. JAMA 2001;285:2987–93.[12] Teno JM, Harrell FE, Knaus WA, et al. Prediction <strong>of</strong> survival <strong>for</strong> older hospitalized<strong>patients</strong>; the HELP survival <strong>model</strong>. J Am Geriatr Soc 2000;48(Suppl):S16–24.[13] Charlson ME, Pompei P, Ales KL, MacKenzie CR. A <strong>new</strong> method <strong>of</strong> classifyingprognostic comorbidity in longitudinal studies: development and validation.J Chronic Dis 1987;40:373–83.[14] Deyo RA, Cherkin DC, Ciol MA. Adapting a clinical comorbidity index <strong>for</strong> use withICD-9-CM administrative databases. J Clin Epidemiol 1992;45:613–9.[15] Southern DA, Quan H, Ghali WA. Comparison <strong>of</strong> the Elixhauser and Charlson/Deyomethods <strong>of</strong> comorbidity measurement in administrative data. Med Care 2004;42:355–60.[16] Ollero-Baturone M, Alvarez M, Barón-Franco B, Bernabéu-Wittel M, Codina A,Fernández-Moyano A, et al. Atención al paciente pluripatológico. Proceso AsistencialIntegradoSecond Edition. . Sevilla: Public Health Direction <strong>of</strong> Andalusian AutonomusGovernment; 2007. Available at: http://www.juntadeandalucia.es/salud/servicios/contenidos/procesos/docs/pluri.pdf.[17] Hunt SA, Abraham WT, Chin M, et al. ACC/AHA guidelines <strong>for</strong> the evaluation andmanagement <strong>of</strong> chronic heart failure in the adult. J Am Coll Cardiol 2005:46.[18] Bestall JC, Paul EA, Garrod R, et al. Usefulness <strong>of</strong> the Medical Research Council(MRC) dyspnoea scale as a measure <strong>of</strong> disability in <strong>patients</strong> with chronicobstructive pulmonary disease. Thorax 1999;54:581.[19] Pugh RN, Murray-Lyon IM, Dawson JL, et al. Transection <strong>of</strong> the oesophagus <strong>for</strong>bleeding oesophageal varices. Br J Surg 1973;60:646.[20] Mahoney FI, Barthel DW. Functional evaluation: the Barthel Index. Md State Med J1965;4:61–5.[21] Lawton MP, Brody EM. Assessment <strong>of</strong> older people: self maintaining andinstrumental activities <strong>of</strong> daily living. Gerontologist 1969;9:179–86.[22] Martínez de la Iglesia J, Dueñas Herrero R, Onís Vilches M, et al. Adaptación yValidación al Castellano del Cuestionario de Pfeiffer (SPMSQ) para Detectar laExistencia de Deterioro Cognitivo en Personas Mayores de 65 Años. Med Clín(Barc) 2001;117:129–34.[23] Alarcón T, González-Montalvo JI. La escala soci<strong>of</strong>amiliar de Gijón, elemento útil enel hospital general. Rev Esp Geriatr Gerontol 1998;33:178–9.[24] Bernabeu-Wittel M, Fuertes-Martín A, Barón-Franco B, Murcia-Zaragoza J, Ramos-Cantos C, Alemán A, et al. Clinical and social characteristics <strong>of</strong> a multicenter cohort <strong>of</strong><strong>polypathological</strong> <strong>patients</strong> recruited from 36 Spanish hospitals. 30th National Congress <strong>of</strong>the Spanish Society <strong>of</strong> Internal Medicine. Valencia; 18-21th November 2009.[25] Inouye SK, Bogardus Jr ST, Vitagliano G, Desai MM, Williams CS, Grady JN, et al.Burden <strong>of</strong> illness score <strong>for</strong> elderly persons: risk adjustment incorporating thecumulative impact <strong>of</strong> diseases, physiologic abnormalities, and functional impairments.Med Care 2003;41:70–83.[26] Desai M, Bogardus ST, Williams CS, Vitagliano G, Inouye SK. <strong>Development</strong> andvalidation <strong>of</strong> a risk-adjustment index <strong>for</strong> older <strong>patients</strong>: the High-Risk Diagnoses<strong>for</strong> the Elderly Scale. J Am Geriatr Soc 2002;50:474–81.[27] Lee SJ, Lindquist K, Segal M, Covinsky KE. <strong>Development</strong> and validation <strong>of</strong> aprognostic index <strong>for</strong> 4-year mortality in older adults. JAMA 2006;295:801–8.[28] Lapu-Bula R, Robert A, De Kock M, et al. Relation <strong>of</strong> exercise capacity to leftventricular systolic function and diastolic filling in idiopathic or ischemic dilatedcardiomyopathy. Am J Cardiol 1999;83:728–34.[29] Wierzbowska-Drabik K, Krzemińska-Pakuła M, Plewka M, Drozdz J, Kurpesa M,Trzos E, et al. Relationship between echocardiographic parameters and exercisetest duration in <strong>patients</strong> after myocardial infarction. Cardiol J 2009;16:507–13.[30] Williams SG, Ng LL, O'Brien RJ, Taylor S, Wright DJ, Li YF, et al. Complementaryroles <strong>of</strong> simple variables, NYHA and N-BNP, in indicating aerobic capacity andseverity <strong>of</strong> heart failure. Int J Cardiol 2005;102:279–86.[31] Volkone N, Dajezman E, Colacone A, Kreisman H. The relationship between pulmonaryfunction and dyspnea in obstructive lung disease. Chest 1989;96:1247–51.[32] Justice AC, Covinsky KE, Berlin JA. Assessing the generalizability <strong>of</strong> prognosticin<strong>for</strong>mation. Ann Intern Med 1999;130:515–24.[33] Department <strong>of</strong> Health. Improving chronic disease management. http://www.dh.gov.uk/en/Publicationsandstatistics/Publications/PublicationsPolicyAndGuidance/DH_40752143 March 2004.[34] World Health Organization. Preventing chronic diseases: a vital investment; 2005.ISBN 92 4 156300 1.[35] Fortin M, Hudon C, Dubois MF, Almirall J, Lapointe L, Soubhi H. Comparativeassessment <strong>of</strong> three different indices <strong>of</strong> multimorbidity <strong>for</strong> studies on healthrelatedquality <strong>of</strong> life. Health Qual Life Outcomes 2005;3:74.Please cite this article as: Bernabeu-Wittel M, et al, <strong>Development</strong> <strong>of</strong> a <strong>new</strong> <strong>predictive</strong> <strong>model</strong> <strong>for</strong> <strong>polypathological</strong> <strong>patients</strong>. The PROFUNDindex, Eur J Intern Med (2010), doi:10.1016/j.ejim.2010.11.012


