victorian electric vehicle trial mid-term report - Department of Transport
victorian electric vehicle trial mid-term report - Department of Transport
victorian electric vehicle trial mid-term report - Department of Transport
- No tags were found...

You also want an ePaper? Increase the reach of your titles
YUMPU automatically turns print PDFs into web optimized ePapers that Google loves.
CREATINGA MARKETVICTORIAN ELECTRICVEHICLE TRIALMID-TERM REPORTTRANSPORT.VIC.GOV.AUCREATING A MARKET 1
EXECUTIVE SUMMARYWith the arrival <strong>of</strong> <strong>electric</strong><strong>vehicle</strong>s onto Victorianroads, we are witnessing thecreation <strong>of</strong> a new market.Over 80 organisations have taken partin the Victorian Electric Vehicle Trial,providing the foundations <strong>of</strong> a marketworth having.Electric <strong>vehicle</strong>s are fun to drive andcheap to run. They support local jobs,and create zero emissions when run onrenewable energy. By 2040, the statemay be over $20 billion better <strong>of</strong>f asa result <strong>of</strong> <strong>electric</strong> <strong>vehicle</strong> adoption– savings that will go largely in thepockets <strong>of</strong> Victorian drivers.However, right now <strong>electric</strong><strong>vehicle</strong>s are expensive. Like all newtechnologies, prices will decrease overtime. When mobile phones first arrivedin 1987, they cost the equivalent <strong>of</strong>$11,000 – around 100 times more thana basic phone costs today. Since 2010Australian <strong>electric</strong> <strong>vehicle</strong> prices havedropped by over 30 per cent, and thisis just the beginning.For households, the technology willwork now. During the <strong>trial</strong> mosthouseholds used the <strong>electric</strong> <strong>vehicle</strong>sas their main transport choice, withouthaving to change anything abouthow or where they travelled. MostMelburnians can drive during theday and charge overnight, when it’scheapest and while they sleep.Fleet operators successfully used thecars to showcase their environmentalcredentials. However, concernsabout range, charging and <strong>vehicle</strong>management reduced the appeal <strong>of</strong>the <strong>trial</strong> <strong>vehicle</strong>s for corporate fleetapplications, even if cost was the mainbarrier to uptake overall. Workplacecharging, where forward-thinkingemployers provide staff with the meansto charge their car at work, may saveVictorian commuters thousands <strong>of</strong>dollars each year.Electric <strong>vehicle</strong> charging can beaccommodated by Victoria’s <strong>electric</strong>itynetwork. Drivers will charge their<strong>vehicle</strong>s during <strong>of</strong>f-peak periods ifthey have a financial incentive to doso. Victoria’s smart meter roll-out willallow charging to be managed, andmay even address other problemsby using <strong>electric</strong> <strong>vehicle</strong>s forenergy storage.Connecting the <strong>vehicle</strong>s to the<strong>electric</strong>ity network is not withoutits challenges. Households can expectto pay between $2,000 and $3,000 fortheir charging solution. Renters andresidents with shared parking will payeven more, and will need to work withtheir landlord or fellow residents. Onaverage, fleet operators take around10 weeks to get a charging solutionand public charging outlets take evenlonger. With only a small number <strong>of</strong>customers for the foreseeable future,public charging is a difficult businessproposition despite being a key enablerfor <strong>electric</strong> <strong>vehicle</strong> adoption.By 2020, the <strong>electric</strong> <strong>vehicle</strong> operatingcost advantage is expected to outweighthe purchase price penalty for mostVictorian drivers. Before then ‘earlyadopters’ will buy the <strong>vehicle</strong>s asa reflection <strong>of</strong> their interests intechnology and the environment,or to gain a marketing advantagefor their organisation.
Measures which reduce <strong>electric</strong>car purchase prices, remove barriersto ownership, improve resale valuesor allow the <strong>vehicle</strong>s to be drivenfurther will all assist in bringing the‘take-<strong>of</strong>f point’ forwards. Raisingawareness, understanding andacceptance <strong>of</strong> the technology will helprealise the benefits for <strong>electric</strong> <strong>vehicle</strong>take-up sooner.The results from the <strong>trial</strong> so farsuggest that <strong>electric</strong> <strong>vehicle</strong>s arelikely to be an important part <strong>of</strong>Victoria’s transport future.The <strong>mid</strong>-<strong>term</strong> <strong>report</strong> explains thewhat, why, how and when <strong>of</strong> <strong>electric</strong><strong>vehicle</strong> take-up for Victoria, andhighlights the issues and opportunitiesfor future market development:Section 1 provides a brief introductionand context to the <strong>report</strong>.Section 2 is an overview <strong>of</strong> <strong>electric</strong><strong>vehicle</strong> technology.Section 3 outlines the <strong>trial</strong> designincluding the underlying principlesand arrangements.Section 4 describes the <strong>vehicle</strong>sand their deployment in householdsand fleets.Section 5 explains the charginginfrastructure network experiencesand insights.Section 6 is a triple bottom lineassessment <strong>of</strong> the <strong>electric</strong> <strong>vehicle</strong>market impacts.Section 7 details the <strong>trial</strong>communications programand learnings.Section 8 summarises the issuesand opportunities observed throughthe <strong>trial</strong>.Section 9 sets out the directionfor the remainder <strong>of</strong> the project.CREATING A MARKET 3
TABLE OF CONTENTSEXECUTIVE SUMMARY 21. INTRODUCTION 62. BACKGROUND 82.1 What is an <strong>electric</strong> <strong>vehicle</strong> (EV)? 92.2 Why <strong>electric</strong> <strong>vehicle</strong>s? 92.3 What types <strong>of</strong> <strong>electric</strong> <strong>vehicle</strong>sare available? 102.4 How does <strong>electric</strong> <strong>vehicle</strong> charging work? 113. TRIAL DESIGN 143.1 The EV ecosystem 153.2 A market development model 173.3 Commercial arrangements 203.4 Data collection and management 214. HOUSEHOLD AND FLEET VEHICLE ROLL-OUT 244.1 Vehicles 254.1.1 What <strong>vehicle</strong>s are taking partin the <strong>trial</strong>? 254.1.2 Were any differences seenin how the <strong>vehicle</strong>s were used? 264.1.3 What are the issues andopportunities for the <strong>vehicle</strong>s? 284.1.4 What about <strong>electric</strong> two-wheelers? 314.1.5 What about commercial <strong>vehicle</strong>s? 334.2 Household <strong>vehicle</strong> roll-out 334.2.1 Who’s interested in <strong>electric</strong><strong>vehicle</strong>s and why? 334.2.2 What do drivers think <strong>of</strong> <strong>electric</strong><strong>vehicle</strong>s? 344.2.3 How do people use <strong>electric</strong> <strong>vehicle</strong>s? 374.2.4 How much does it cost for anaverage household to run an EV? 414.2.5 What are the issues and opportunitiesfor <strong>electric</strong> <strong>vehicle</strong>s in households? 424.3 Fleet <strong>vehicle</strong> roll-out 434.3.1 What fleets are interested in<strong>electric</strong> <strong>vehicle</strong>s and why? 434.3.2 How do fleets use <strong>electric</strong> <strong>vehicle</strong>s? 464.3.3 How much does it cost for an averagefleet to run an EV? 474.3.4 What are the issues and opportunitiesfor <strong>electric</strong> <strong>vehicle</strong>s in fleets? 475. CHARGING INFRASTRUCTURE ROLL-OUT 525.1 Charging infrastructure 535.1.1 What are the arrangements for the<strong>trial</strong> charging infrastructure? 535.1.2 What charging infrastructure is beingused in the <strong>trial</strong>? 545.1.3 What are the relevant features <strong>of</strong> the<strong>trial</strong> charging infrastructure? 545.1.4 How do users ‘roam’ across the <strong>trial</strong>charging infrastructure network? 565.1.5 What are the charging infrastructurenetwork issues and opportunities? 585.2 Home charging 615.2.1 How much does household charginginfrastructure cost? 615.2.2 How is charging infrastructureinstalled in households? 625.2.3 What is the charging solution forrentals or shared parking? 645.2.4 When do households charge<strong>electric</strong> <strong>vehicle</strong>s? 665.2.5 What do households think <strong>of</strong><strong>electric</strong> <strong>vehicle</strong> charging? 695.2.6 What are the issues andopportunities for home charging? 705.3 Fleet and workplace charging 725.3.1 How much does charging infrastructurefor corporate applications cost? 725.3.2 How is charging infrastructureinstalled for corporate applications? 735.3.3 When do fleets charge<strong>electric</strong> <strong>vehicle</strong>s? 755.3.4 What do fleets think <strong>of</strong> charging? 765.3.5 What has been the experience <strong>of</strong>workplace charging? 765.3.6 What are the issues andopportunities for <strong>electric</strong> <strong>vehicle</strong>charging by corporate entities? 78
5.4 Public charging 815.4.1 How much does publicly-accessiblecharging infrastructure cost? 815.4.2 How are publicly-accessible chargingoutlets installed? 835.4.3 What do people think about publiccharging? 865.4.4 Where should public charging beavailable? 885.4.5 What are the issues andopportunities for public charging? 906. ECONOMIC, ENVIRONMENTALAND SOCIAL IMPACTS 986.1 Economic impacts 996.1.1 How have the economic impactsbeen assessed? 996.1.2 What is the timeline for <strong>electric</strong><strong>vehicle</strong> adoption in Victoria? 1006.1.3 What are the costs and benefits <strong>of</strong><strong>electric</strong> <strong>vehicle</strong> adoption for Victoria? 1036.1.4 How will <strong>electric</strong> <strong>vehicle</strong> marketdevelopment affect Victorian jobs? 1046.2 Environmental impacts 1056.2.1 How will <strong>electric</strong> <strong>vehicle</strong>s impactthe environment? 1056.2.2 How have environmental impactsarising from the <strong>trial</strong> been managed? 1076.2.3 How can an <strong>electric</strong> <strong>vehicle</strong> be‘zero emissions’ in Victoria? 1076.3 Social impacts 1096.3.1 How is community safety beingprotected as part <strong>of</strong> the <strong>electric</strong><strong>vehicle</strong> roll-out? 1096.3.2 How is Victoria’s future <strong>electric</strong><strong>vehicle</strong> workforce being prepared? 1107. EDUCATION AND AWARENESS PROGRAM 1127.1 Outputs and outcomes 1137.1.1 How has the <strong>trial</strong> beencommunicated? 1137.1.2 How has awareness <strong>of</strong> <strong>electric</strong><strong>vehicle</strong>s been promoted? 1157.1.3 What <strong>electric</strong> <strong>vehicle</strong> educationalactivities have been delivered andwhat do they tell us? 1187.1.4 How has the local <strong>electric</strong> <strong>vehicle</strong>industry and market been promoted? 1217.2 Insights 1237.2.1 How do we best tell the storyabout <strong>electric</strong> <strong>vehicle</strong>s? 1237.2.2 Do <strong>electric</strong> <strong>vehicle</strong>s educate orinform people about other issues? 1248. ISSUES AND OPPORTUNITIES 1259. WHERE TO FROM HERE? 13010. ACRONYMS, GLOSSARYAND UNITS OF MEASURE 133REFERENCES 136APPENDIX A – VICTORIAN ELECTRIC VEHICLETRIAL CORPORATE PARTICIPANTS 142APPENDIX B – EVS AND FLEETS 2012PRACTICAL ROLL-OUT PLAN 145APPENDIX C – CHARGING OUTLETATTRIBUTE LIST 147APPENDIX D – HOUSEHOLD CHARGINGINFRASTRUCTURE QUESTIONS PROFORMA 150APPENDIX E – EV CHARGING COURTESY SIGNAGE 151CREATING A MARKET 5
INTRODUCTIONThis <strong>report</strong> documentsthe findings up tothe half-way point<strong>of</strong> the VictorianElectric VehicleTrial. It containsexperiences, resultsand interpretationsfrom the early stages<strong>of</strong> <strong>electric</strong> <strong>vehicle</strong> (EV)market developmentin Australia.
The <strong>trial</strong> is a $5 millioninitiative <strong>of</strong> the VictorianGovernment that seeksto understand the process,timelines and barriers fortransitioning to <strong>electric</strong><strong>vehicle</strong> technologies.The <strong>trial</strong> was launched inOctober 2010 and will rununtil <strong>mid</strong>-2014.On behalf <strong>of</strong> the Victorian Government,the <strong>Department</strong> <strong>of</strong> <strong>Transport</strong>, Planningand Local Infrastructure (formerly the<strong>Department</strong> <strong>of</strong> <strong>Transport</strong>) is runninga <strong>trial</strong> to ensure that the roll-out <strong>of</strong><strong>electric</strong> <strong>vehicle</strong>s is safe and efficient,and that the needs <strong>of</strong> all Victoriansare taken into account. It considersthe effects <strong>electric</strong> <strong>vehicle</strong>s will haveon society and the State’s resources.The <strong>trial</strong> considers people as well astechnology. A successful <strong>trial</strong> will makesure that Victoria becomes an EVfriendlyplace, and that <strong>electric</strong> <strong>vehicle</strong>swork for Victoria.Through the <strong>trial</strong> the VictorianGovernment is providing thefoundations for the Australian <strong>electric</strong><strong>vehicle</strong> market. The findings willinform all levels <strong>of</strong> government on theissues and opportunities associatedwith <strong>electric</strong> <strong>vehicle</strong> uptake. This<strong>report</strong> allows many <strong>of</strong> the insightsgained to be considered alongside thearrival <strong>of</strong> <strong>electric</strong> cars from a range <strong>of</strong>manufacturers from 2013 onwards.The government’s support for thisinitiative recognises the potentialsignificance <strong>of</strong> a global trend towards<strong>electric</strong> <strong>vehicle</strong>s for Victoria’sautomotive industry and transportsystem. Unlike many developedeconomies, Victoria has no previoushistory <strong>of</strong> EV technology. The vastmajority <strong>of</strong> Victorians have onlyexperienced <strong>electric</strong> <strong>vehicle</strong> technologythrough non road-going <strong>vehicle</strong>s suchas golf-carts or <strong>electric</strong> wheel-chairs.In considering EV market development,Victoria is effectively a blank canvas.CREATING A MARKET 7
BACKGROUNDElectric <strong>vehicle</strong>s (EVs)have started to arriveon Victoria’s roads.Most major <strong>vehicle</strong>manufacturers arenow or soon will bedelivering EVsinto the market.
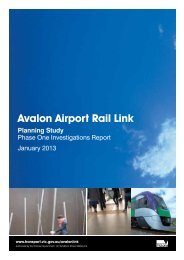
In 2012, Mitsubishi, Nissan,and Holden all deliveredEVs into Victoria. In addition,Renault, Ford, Toyota,BMW and Porsche all havemodels in the pipeline.Answers to some <strong>of</strong> themore common questionsrelating to <strong>electric</strong> <strong>vehicle</strong>sare provided below.2.1 WHAT IS AN ELECTRICVEHICLE (EV)?An <strong>electric</strong> <strong>vehicle</strong> is any <strong>vehicle</strong>that uses <strong>electric</strong>ity as energy forpropulsion. In simple <strong>term</strong>s, the maindifferences between a fully <strong>electric</strong><strong>vehicle</strong> and a conventional InternalCombustion Engine (ICE) <strong>vehicle</strong> are:• EVs have an <strong>electric</strong> motor instead<strong>of</strong> an ICE• EVs store energy in a batteryrather than a fuel tank• EVs source energy via a plug andcable rather than a petrol bowser.Figure 1 shows the functional andoperational differences between <strong>vehicle</strong>types, while Section 2.3 providesfurther explanation on the different<strong>vehicle</strong> types available.2.2 WHY ELECTRIC VEHICLES?Electric <strong>vehicle</strong>s can provide arange <strong>of</strong> benefits when comparedto conventional ICE <strong>vehicle</strong>s:• Operating cost savings due to thelower costs <strong>of</strong> <strong>electric</strong>ity relativeto liquid fuels, and the higherefficiency and lower maintenancecosts <strong>of</strong> <strong>electric</strong> drivetrains• Greenhouse gas emissionreduction, particularly when runon renewable energy• Air quality improvements forpopulated areas due to the zerotailpipe emissions• Traffic noise reductions, throughthe near-silent operation <strong>of</strong> the<strong>electric</strong> drivetrain• Employment benefits throughthe use <strong>of</strong> domestically-produced<strong>electric</strong>ity to replace imported oil,and within the automotive industry.Electric vs PetrolZero EmissionsElectricity Company100-160 km RangeHours to Recharge4 cents per km(renewable energy)Greenhouse Gases/PollutionOPEC500+ km RangeMinutes to Refuel8 cents per km(petrol price = $1.40/L)Household PlugElectricmotorRechargeablebatteriesPetrol PumpCombustionenginePetrol tankFigure 1. Schematic illustrating the functional and operational differences between<strong>electric</strong> and conventional petrol <strong>vehicle</strong>s.CREATING A MARKET 9
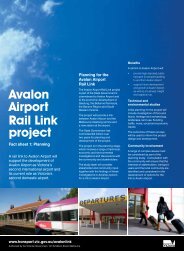
Electric <strong>vehicle</strong>s have potential tohelp Victoria in a variety <strong>of</strong> ways.This is because:• Private <strong>vehicle</strong>s account for thesignificant majority <strong>of</strong> all travelmade in Victoria, both in <strong>term</strong>s <strong>of</strong>the number <strong>of</strong> trips made and thetotal distance travelled (DOT 2009)• <strong>Transport</strong> makes up 18 per cent <strong>of</strong>Victorian household expenditure(ABS 2011)• Victoria increasingly relies on oilimports to fuel passenger <strong>vehicle</strong>s(ACIL Tasman 2008)• <strong>Transport</strong> makes up 16 per cent<strong>of</strong> Victoria’s greenhouse gasemissions, with the majoritycoming from cars (DCC 2007)• Motor <strong>vehicle</strong>s are the mainsource <strong>of</strong> urban air pollution(EPA 2012a)• Road traffic noise has beenidentified as the most commonnoise source in Victoria(EPA 2007)• Victoria has a competitiveadvantage in automotive designand manufacture (Invest Vic 2011).2.3 WHAT TYPES OF ELECTRICVEHICLES ARE AVAILABLE?There are different types <strong>of</strong> <strong>electric</strong><strong>vehicle</strong>s. They vary according tothe extent to which they rely upon<strong>electric</strong>ity as their energy source.The various types can be roughlyclassified as follows – refer also toFigure 2:• Hybrid Electric Vehicles (HEVs)have been on Victorian roads forover 10 years through cars suchas the Toyota Prius, Honda CivicHybrid and the locally-producedToyota Camry Hybrid. They useliquid fuel (petrol) as their soleexternal energy source, butsupplement this with <strong>electric</strong>alenergy captured from the brakingsystem and stored in batteries• Plug-in Hybrid Electric Vehicles(PHEVs), sometimes calledExtended-Range Electric Vehicles(EREVs), use both <strong>electric</strong>al energyand liquid fuel from externalsources. They vary in their choice<strong>of</strong> primary energy source, withthe Toyota Prius PHEV biasedtowards petrol and the HoldenVolt favouring <strong>electric</strong>ity. They areeasily differentiated from HEVs asthey have a plug• Battery Electric Vehicles(BEVs) or fully-<strong>electric</strong> <strong>vehicle</strong>s,use <strong>electric</strong>al energy as theirsole energy source. BEVsavailable in the Australianmarket include the Nissan LEAFand Mitsubishi i-MiEV.As only PHEVs and BEVs use plugsto source <strong>electric</strong>al energy, they arecollectively known as Plug-in ElectricVehicles (PEVs).Through the remainder <strong>of</strong> this paperthe <strong>term</strong> ‘EV’ will be used to denote<strong>vehicle</strong>s which use solely <strong>electric</strong>alenergy (that is, Battery ElectricVehicles described above).HEV PHEV BEVHybrid Electric Vehicle Plug-in Hybrid Electric Vehicle Battery Electric VehicleICEICERegenerativeBrakingRegenerativeBrakingRegenerativeBrakingElectricMotorElectricMotorElectricMotorBatteriesPetrol/DieselBatteriesPetrol/DieselBatteriesFigure 2. Schematic <strong>of</strong> the various <strong>electric</strong> <strong>vehicle</strong> types.
2.4 HOW DOES ELECTRIC VEHICLECHARGING WORK?Similar to mobile phones or otherportable electronic devices, <strong>electric</strong><strong>vehicle</strong>s charge their batteries via aplug into an <strong>electric</strong>al outlet. Chargingcreates issues and opportunities in thecontext <strong>of</strong> how cars are used.As they contain large batteries, <strong>electric</strong><strong>vehicle</strong>s can take hours to recharge.But as this process can take placeunattended, EVs can charge whilethey’re parked, allowing drivers to geton with living life.Many EVs can be charged more quicklythrough high-voltage quick chargers,and some EVs will include the abilityto swap their depleted batteriesfor fully charged replacements atdedicated swap stations. In futureEVs may be able to use wirelessinduction-charging similar to <strong>electric</strong>toothbrushes, however the majority <strong>of</strong>EV charging in the near-<strong>term</strong> will usea plug/cable combination as for other<strong>electric</strong>al appliances.Charging takes place where <strong>electric</strong><strong>vehicle</strong>s park – such as the home,workplace or shopping centre carparks.As charging occurs unattended,EV drivers can simply arrive at theirdestination, plug in, and walk away.A simplified/idealised day-in-thelife<strong>of</strong> a corporate fleet EV based inMelbourne’s CBD is shown in Figure 3to help explain how charging/batterycharge management works.Most <strong>electric</strong> <strong>vehicle</strong>s also containthe ability to charge significantlymore rapidly using high-powered‘quick chargers’. This quick chargingcapability exists alongside the standardcharging described above, and usesdedicated equipment – refer toFigure 4.With reference to Figure 5, EVcharging infrastructure consists<strong>of</strong> two basic elements:• Charging outlet, whichprovides the charge managementcapability and is the hardwarefrom which the connection ismade to the <strong>vehicle</strong>• Charging circuit, which connectsthe charging outlet to the point <strong>of</strong><strong>electric</strong>al supply.Charging outlets are proprietarytechnologies that contain a variety<strong>of</strong> features that vary across modelsand suppliers. A charging outlet couldbe a simple wall-socket, or it may bea fully networked device with enhancedsafety, security, damage protection,user identification, data collection andmanagement, energy management,billing capabilities, and informationprovision including advertising.Charging outlets may be ownedby the site owner/occupant, or maybe supplied under a service provisionagreement by the EV chargingservice provider.CREATING A MARKET 11
Eastern FwyDoncasterHoddle StKewBurke RdBalwynEastern FwyRingwoodMelbourneWhitehorse RdBox HillPunt RdToorak RdCamberwellWarrigal RdMiddleborough Middleborough RdSpringvale RdCanterbury RdBurwood HwyEastlink Eastlink Eastlink Eastlink Eastlink Eastlink Eastlink Eastlink Eastlink Eastlink Eastlink Eastlink Eastlink Eastlink Eastlink Eastlink Eastlink Eastlink Eastlink Eastlink Eastlink Eastlink Eastlink Eastlink Eastlink Eastlink Eastlink Eastlink Eastlink Eastlink Eastlink Eastlink EastlinkEastlink Eastlink Eastlink EastlinkEastlinkEastlink Eastlink Eastlink EastlinkEastlink EastlinkSt St St St St St St St St St St St St St St St St St St St St St St St St St St St St St St St St St St St St St St St St St St St St St St St St Kilda Kilda Kilda Kilda Kilda Kilda Kilda Kilda Kilda Kilda Kilda Kilda Kilda Kilda Kilda Kilda Kilda Kilda Kilda Kilda Kilda Kilda Kilda Kilda Kilda Kilda Kilda Kilda Kilda Kilda Kilda Kilda Kilda Kilda Kilda Kilda Kilda Kilda Kilda Kilda Kilda Kilda Kilda Kilda Kilda Kilda Kilda Kilda Kilda Rd Rd Rd Rd Rd Rd Rd Rd Rd Rd Rd Rd Rd Rd Rd Rd Rd Rd Rd Rd Rd Rd Rd Rd Rd Rd Rd Rd Rd Rd Rd Rd Rd Rd Rd Rd Rd Rd Rd Rd Rd Rd Rd Rd Rd Rd Rd Rd RdSt KildaBalaclava RdBurke RdHigh Street RdHawthorn RdDandenong RdMonash FwyGlen WaverleyWaverley RdKnoxfieldNorth RdOakleigh100Base Trip 1 Base Trip 2 Base75Battery charge state502503:00 4:00 5:00 6:00 7:00 8:00 9:00 10:00 11:00 12:00 13:00 14:00 15:00 16:00 17:00 18:00 19:00 20:00 21:00 22:00 23:00TimeFigure 3. A day-in-the-life <strong>of</strong> a corporate fleet EV – the map (top) shows the route for two 50 km round-trips taken fromMelbourne CBD, while the chart (underneath) shows the battery charge state as the EV completes these journeys alongwith an ‘opportunity’ charging event between 12 and 2pm and ‘overnight’ charging from 5pm. The figures assume thatthe EV has a range <strong>of</strong> around 100 km, and a zero-to-full charging time <strong>of</strong> 6 hours using standard (240 v / 15 A) charging.
Meter, Switch orDistribution BoardDistribution NetworkCharging OutletCharging CircuitEVCharging CableFigure 4 (Top). A Mitsubishi i-MiEV <strong>electric</strong> <strong>vehicle</strong> being plugged into a quick charger.Figure 5 (Above). Electric <strong>vehicle</strong> charging infrastructure basic description for the purposes <strong>of</strong> the Victorian Electric VehicleTrial roll-out.CREATING A MARKET 13
TRIAL DESIGNThe <strong>Department</strong> <strong>of</strong><strong>Transport</strong>, Planning andLocal Infrastructure’sapproach for theVictorian Electric VehicleTrial initiative recognisesthe pathways andtimelines for marketdevelopment.
It has brought together allthe pieces <strong>of</strong> the emerging<strong>electric</strong> <strong>vehicle</strong> marketand provided participantswith a low cost, low riskoperating environment.The <strong>trial</strong> is a test-bedfor deployment <strong>of</strong> newtechnologies and businessmodels, the learnings fromwhich will help streamlinemarket development.ELECTRICITYMARKETCHARGINGINFRASTRUCTURE3.1 THE EV ECOSYSTEMThe <strong>trial</strong> has brought togetheraround 70 corporate participantsand 120 households to form the basis<strong>of</strong> the Victorian (and Australian) <strong>electric</strong><strong>vehicle</strong> market.As summed up by the followingquote, efficient development <strong>of</strong> an EVmarket has been portrayed by manyin the automotive industry as beingdependent upon the presence <strong>of</strong> afunctioning ‘EV ecosystem’:The Chevy Volt is truly coming tolife, but preparing the market for<strong>electric</strong> <strong>vehicle</strong>s also requires capablepartners from outside the autoindustry. Momentum is building asgovernments, technology companies,communities and universities areincreasingly working togetherto prepare the market for<strong>electric</strong> <strong>vehicle</strong>s.Ed Peper, then GeneralMotors North AmericaVice-President for Chevrolet(Green Car Congress 2009)OTHERThe <strong>trial</strong> has adopted the ecosystemmodel at its foundation. An Expression<strong>of</strong> Interest (EOI) was launched inMarch 2010 seeking input from <strong>vehicle</strong>suppliers, charging infrastructureproviders, <strong>electric</strong>ity marketparticipants, fleet operators and anyother interested party on what theymight <strong>of</strong>fer in support <strong>of</strong> an <strong>electric</strong><strong>vehicle</strong> technology <strong>trial</strong> project (DOT2010a). Despite Australia’s statusas one <strong>of</strong> the most highly open andcompetitive automotive markets in theworld (MMAL 2011), at the time <strong>of</strong> theEOI, no commitments had been madeby original equipment automotivemanufacturers to bring EVs to theAustralian market. The EOI processsought to address this by leveragingthe highly competitive market operatingenvironment and in doing so chart apath forwards based upon the indicatedmarket direction.Following a multi-criteria analysis <strong>of</strong>the 76 submissions, around 60 wereaccepted at the outset to form the basis<strong>of</strong> a fully-functioning <strong>electric</strong> <strong>vehicle</strong>market model depicted as a schematicin Figure 6. Multiple participantswere selected to take part at eachlevel <strong>of</strong> the emerging EV market toavoid proprietary influence in <strong>term</strong>s<strong>of</strong> technology and/or business model,to provide a low cost/risk operatingenvironment for the participants todeploy and refine their technologiesand business models, and to promotecoordination across the market andprovide insights into barriers that mayotherwise prevent it.VEHICLESUPPLIERSVICTORIANGOVERNMENTVEHICLEOPERATORSINDUSTRYBODIESUNIVERSITIESFigure 6. Schematic illustrating the EV ecosystem thatforms the basis for the <strong>trial</strong> design.CREATING A MARKET 15
Trial componentOutcomesObjectiveHousehold/fleet<strong>vehicle</strong> roll-out• Give Victorians experience <strong>of</strong> EVs• Help us understand how EVs willwork in Victoria• Find out what EVs meanto VictoriansInfrastructureroll-out$Economic, environmentaland social impacts• Establish beginnings <strong>of</strong> VictorianEV market• Guide design <strong>of</strong> the VictorianEV charging network to meetuser requirements• Understand EV benefits andcosts – now and in the future• Identify issues and test solutionsTo makeVictoria anEV-friendlyplacethrough improvedawareness,understanding andacceptanceEducation andawareness program• Engage and inform thecommunity on EV technology• Link local designers andmanufacturers into the national/international EV marketFigure 7. EV Trial conceptual model and delivery framework.
Commercial negotiations and astructured consultation processwere then undertaken to informthe final <strong>trial</strong> design (DOT 2012b).The participants were announced inOctober 2010 to a backdrop <strong>of</strong> <strong>vehicle</strong>sand charging technology previouslyunseen in the Victorian market(Autoblog 2010). Additional participantshave joined the <strong>trial</strong> as the projecthas progressed – refer to Appendix A –Victorian EV Trial corporate participantsfor a full list <strong>of</strong> the 80 corporate <strong>trial</strong>participants including their role as <strong>of</strong>December 2012.While the participants and their goodsand services provide the basic buildingblocks for the <strong>trial</strong>, the four-partconceptual model shown in Figure 7was designed to deliver the <strong>trial</strong>.The diverse range <strong>of</strong> activities beingdone as part <strong>of</strong> the <strong>trial</strong> includes:• Household <strong>vehicle</strong> roll-out: around120 households living with an EVfor three months each (referto Section 4)• Fleet <strong>vehicle</strong> roll-out: over 50corporate fleets having theopportunity to <strong>trial</strong> a number <strong>of</strong>EVs for three months or morefor each <strong>vehicle</strong> (Section 4)• Charging infrastructure roll-out:around 200 charging outlets beinginstalled for household, fleet andpublic use (Section 5)• Economic, environmental andsocial impacts assessment: anevaluation into the triple bottomline impacts <strong>of</strong> EV technologyintroduction in Victoria (Section 6)• Education and awareness program:a wide-ranging communicationsprogram to raise awareness,understanding and acceptance <strong>of</strong> EVtechnology in Victoria (Section 7).The unifying objective ‘to makeVictoria an EV-friendly place’ is to beachieved through improved awareness,understanding and acceptance <strong>of</strong><strong>electric</strong> <strong>vehicle</strong> technology.The Victorian ElectricVehicle Trial is a trailblazingstudy that providesconsumers and businesseswith a firsthand taste <strong>of</strong>what will be an excitingfuture transport option;<strong>electric</strong> <strong>vehicle</strong>s.The industry is looking tothis <strong>trial</strong> as the cornerstone<strong>of</strong> future development inthis area and a lot <strong>of</strong> workhas already gone intoovercoming barriers intesting these <strong>vehicle</strong>s.Australian Gas Lighting (AGL),a premier partner for the Trial,14 November 20123.2 A MARKET DEVELOPMENTMODELThe <strong>trial</strong> design and outcomes arebeing viewed in the context <strong>of</strong> themarket development model fornew technologies.New technology is adopted gradually,following an ‘S-curve’, similar tothose depicted in Figure 8 for a range<strong>of</strong> technologies introduced over thelast century.This process has been characterisedby Rogers (1962) and Moore (1991),and forms the basis for consideringthe status and path forwards for theVictorian <strong>electric</strong> <strong>vehicle</strong> market(Rorke and Inbakaran 2009).With reference to Figure 9, theorysuggests that around 16 per cent <strong>of</strong>the population form the early marketfor any new technology. These people,the ‘innovators’ and ‘early adopters’,are attracted to new technologies onaccount <strong>of</strong> the reflected symbolism,that is, what ownership <strong>of</strong> newtechnology says about them. Thisperceived benefit outweighs thecosts and risks associated withany new technology for these earlymarket participants.In contrast ‘mainstream’ marketparticipants, composed <strong>of</strong> the earlyand late majority, are primarilyfinancially-motivated and will adoptthe new technology because it makessense. The transition from earlyto mainstream market adoption iscommonly <strong>term</strong>ed the ‘take-<strong>of</strong>f point’.Moore (1991) identifies the difficulttransition between these two verydifferent market segments as thekey phase in the success or failure<strong>of</strong> any new technology – a challengecommonly described as ‘crossingthe chasm’.CREATING A MARKET 17
1009080Colour TV7060ElectricityComputer50Air-conditioner403020TelephoneStoveRefrigeratorClothes washerClothes dryerDish washerVCRMobile phoneInternet1001900AutoMicrowaveRadio1915 1930 1945 1960 1975 1990 200510075Take-<strong>of</strong>f Point50Market share %25Innovators 2.5%EarlyAdopters13.5%Early Majority34%Late Majority34%Laggards16%0Figure 8 (Top). Technology adoption curves for a range <strong>of</strong> modern innovations (New York Times 2008).Figure 9 (Above). Adoption lifecycle for new technologies, where the brown line represents the increase inmarket share with time, and the green/blue line represents the market share distribution among buyer types(Rogers 1962).
TECHNOLOGY ADOPTION CASE STUDYMOBILE PHONESAlthough it is difficult to now imagine life without it, mobile phone technology has traversed theinnovation adoption curve within most people’s lifetime.The world’s first commercial portable cellular phone became available to U.S. consumers in 1984(Motorola 2012). The Motorola DynaTAC 8000x weighed over seven times as much as an iPhone,took 10 hours to charge and cost nearly $USD 4000 (Time 2010) – equivalent to over $USD 9000 in 2012.In 1987 the first mobile phone and network was launched in Australia (Access Economics 2010).The Walkabout TM cost around $5,200 (or around $11,000 today), was around the size <strong>of</strong> ten iPhones,had around one hour <strong>of</strong> talk time between recharges and quickly became known as ‘the ultimate yuppieaccessory’ (SMH 2007, Telstra 2012). The associated cellular network was launched by the CommonwealthGovernment telecommunications provider Telecom in Sydney in February 1987, Melbourne in May,and extended into other parts <strong>of</strong> Australia over time (ActewAGL 2009).From these small beginnings, the mobile phone technology evolved rapidly:• In 1993 second generation mobile phone technology (2G) commenced operation,including basic data functionality (Access Economics 2010)• By March 1994 the one millionth subscriber had joined the network (ActewAGL 2009)• With the arrival <strong>of</strong> 3G networks in 2003, the technology had improved to allow for videostreaming (ABC 2011)• By 2007 mobile phone subscriptions outnumbered people in Australia (ACMA 2008)• By 2009 over three quarters <strong>of</strong> all 12-14 year olds were <strong>report</strong>ed having their own mobilephone (ABS 2009) – a mere 25 years from when the DynaTAC 8000x went on sale in the U.S.Figure 10. Anillustration <strong>of</strong> the rapidevolution <strong>of</strong> mobilephone technology.CREATING A MARKET 19
In seeking an understanding <strong>of</strong> theearly versus mainstream market for<strong>electric</strong> <strong>vehicle</strong> technologies, the <strong>trial</strong>design has adopted these marketdevelopment theories at its core.Procurement and deployment <strong>of</strong><strong>vehicle</strong>s and charging infrastructurehas been overseen by the<strong>Department</strong> so as to gain insightsinto the issues and opportunitiesat different phases <strong>of</strong> the marketdevelopment. Insights into themotivations, behaviours and opinions<strong>of</strong> the wide range <strong>of</strong> <strong>trial</strong> participantsare being gathered and circulated aspart <strong>of</strong> efforts to promote an efficientEV market roll-out.3.3 COMMERCIALARRANGEMENTSThe <strong>trial</strong> design is underpinned by alarge and diverse range <strong>of</strong> commercialagreements addressing the activitiesand risks associated with development<strong>of</strong> a new market.An implication <strong>of</strong> the <strong>electric</strong> <strong>vehicle</strong>ecosystem project design was theneed for a large number <strong>of</strong> commercialagreements to underpin the manyand varied <strong>trial</strong> participantrelationships. This complexity wascompounded by the early marketsituation, which required newbusiness models for service delivery,and the large amount <strong>of</strong> informationexchange, which required an extensiveprivacy review and protections forsensitive information and intellectualproperty alike.Trial-specific commercial agreementswere designed for the followingfamilies <strong>of</strong> activities and relationships:• Premier partner• Vehicle procurement• Vehicle operation by fleetsincluding charginginfrastructure hosting• Charging infrastructureservice provision• Charging infrastructure hostingfor a non-<strong>vehicle</strong> operator• Private household <strong>trial</strong>participation• Trial participation other thanfor households and fleets• Data collection, transferand management.Building upon this, around 230commercial agreements have beenexecuted over the first half <strong>of</strong> theproject. The effort and resourceexpended in the design and execution<strong>of</strong> these agreements deliveredconsiderable benefits including:• Insights into the issuesand opportunities associatedwith the roll-out <strong>of</strong> EVtechnology, attained throughthe legal negotiations• Consistency across commercialagreements, which hasstreamlined the <strong>trial</strong> deliveryand ensured a low-riskoperating environment forthe <strong>trial</strong> participants.The role <strong>of</strong> the Premier Partnershas been key to the <strong>trial</strong> designand delivery:• AGL supplied renewableenergy to account for the <strong>trial</strong><strong>vehicle</strong> operation• CSIRO led the design,implementation and interrogation<strong>of</strong> the <strong>trial</strong> data collection andmanagement framework• Lumleys Insurance providedcomprehensive insurance for the<strong>vehicle</strong>s in support <strong>of</strong> the widerange <strong>of</strong> short- and long-<strong>term</strong>test-drive applications• RACV partnered in delivery<strong>of</strong> the household applicationto participate process, andpromotion <strong>of</strong> the <strong>trial</strong> generally.Detailed observations regarding thenegotiation and operation <strong>of</strong> thecharging infrastructure agreementscan be found in Section 5.1.1.
RACV considers <strong>electric</strong><strong>vehicle</strong>s to be a majorcomponent <strong>of</strong> Victoria’ssustainable transport mix.Work conducted throughthe Victorian ElectricVehicle Trial has contributedto strong engagementbetween the public,industry stakeholdersand government on issuessurrounding the successfuluptake <strong>of</strong> <strong>electric</strong> <strong>vehicle</strong>sin Victoria including pricemechanisms, energydemands and land-useplanning.Royal Automobile Club <strong>of</strong>Victoria (RACV), a premierpartner for the Trial,24 October 20123.4 DATA COLLECTION ANDMANAGEMENTThe <strong>trial</strong> data has been collected usinga range <strong>of</strong> techniques from a largenumber <strong>of</strong> sources. Management<strong>of</strong> the data has been centralised toensure data integrity and protection<strong>of</strong> sensitive information. Distribution<strong>of</strong> the findings has taken place throughregular meetings with the corporateparticipants as part <strong>of</strong> the <strong>trial</strong>stakeholder engagement strategy.Collection and management <strong>of</strong> the <strong>trial</strong>data is a key element to the overalldesign <strong>of</strong> the <strong>trial</strong>. With reference toFigure 11, the range <strong>of</strong> data sources,attributes and outputs can be seen.The role played by CSIRO in boththe design and operation <strong>of</strong> the <strong>trial</strong>data collection and managementframework has been critical toensuring private and commerciallysensitiveinformation is protected, andin facilitating analysis <strong>of</strong> the results.Data collection from the householdparticipants is a major input for the<strong>trial</strong>. With reference to Figure 12,the households first supply datathrough their application to participate.Once shortlisted, the applicant isprovided an <strong>of</strong>fer <strong>of</strong> participationin the form <strong>of</strong> their Deed. As theagreement for their participationis finalised, they complete a shortquestionnaire to provide moreinformation about their residence toinform the charging solution planning.At each point before, during and aftertheir <strong>electric</strong> <strong>vehicle</strong> experience,they are requested to complete aone-week household travel diaryand a 10 minute survey. The travel diaryis analogous to the Victorian IntegratedSurvey <strong>of</strong> Travel and Activity 1 , exceptthat it captures a week <strong>of</strong> householdtravel at each sample interval ratherthan a day. This qualitative data issupplemented by additional qualitativedata gathered from the VictorianElectric Vehicle Trial Discussion Board(refer to Section 7.1.1).Quantitative data is gathered from the<strong>vehicle</strong> instrumentation, the network <strong>of</strong>charging infrastructure and from eithertheir <strong>electric</strong>ity retailer or distributor.It represents the behavioural aspects<strong>of</strong> the household EV experience, asopposed to the attitudinal aspectsrepresented by the qualitative datadescribed above.1 http://www.transport.vic.gov.au/research/statistics/<strong>victorian</strong>-integrated-survey-<strong>of</strong>-travel-and-activityCREATING A MARKET 21
The fleet participants supplyquantitative data via the <strong>vehicle</strong>instrumentation and qualitative datavia their application to participate andresponses to various questionnairesdelivered predominantly around eventsand through interviews. This approachaddresses the limitations <strong>of</strong> the fleetdata set in <strong>term</strong>s <strong>of</strong> the number <strong>of</strong> andvariations between participants.Additional input is sourced on anas-needs basis from the corporateparticipants in the <strong>trial</strong>. An example<strong>of</strong> this was a survey <strong>of</strong> the charginginfrastructure providers to informan understanding <strong>of</strong> a standardisedcharging infrastructure circuit.Project meetings are held on amonthly basis for the <strong>trial</strong>’s corporateparticipants. These meetings include:• Trial Planning Working Group –open to all corporate participants;a variable roll-call <strong>of</strong> around 30participants regularly attend fromaround 100 invitees• Interoperability Working Group –open to all charging infrastructureproviders and convened inrecognition <strong>of</strong> the needs <strong>of</strong> thisemerging industry sector; aroundeight representatives <strong>of</strong> differentproviders regularly attend from10 invitees.Additional meetings are convenedaround specific initiatives beingadvanced under the umbrella <strong>of</strong> the<strong>trial</strong>, for example a demonstrationproject for demand response and loadcontrol <strong>of</strong> <strong>electric</strong> <strong>vehicle</strong> charging(refer to Section 5.2.4).Data Provision &Disclosure AgreementsTrial DataManagementHouseholds• Application to Participate• Household Surveys• Travel Diaries• Discussion Board• Incidents & Issues ReportingSecure Raw DataData Assembly& CleansingSecure Aggregated & De-personalised DatabaseElectricityProviders• Grid Supply Parameters• Tariffs• Household Energy Use• Billing InfoData AnalysisEngineReporting EngineChargingInfrastructureProviders• Home EV Charging• Work EV Charging• Public EV ChargingDisclosureFilteringVehicles• Vehicle ID• Operational State• GPS Data• Charging Data• State <strong>of</strong> Charge• Driving Parameters• Ancillaries StatusDoTGeneralPublicResearchBodiesFigure 11. Trial data collection and management framework.
What we need from you: The participantApplication ‘Before’ travel diary ‘During’ travel diary ‘After’ traveldiaryDeed ‘Before’ survey ‘During’ travel survey ‘After’ travelCharging pointquestions1 2 3 45 6 7 8Charging pointinstalledWhat is happening in the TrialYOUR ELECTRIC VEHICLE EXPERIENCEsurveyCharging pointremovalVehicle handover Vehicle return Charging point <strong>of</strong>ferNote: The Trial <strong>vehicle</strong>s aremonitored throughout.Household energy use willalso be monitored by therelevant <strong>electric</strong>ity retailer.Figure 12. Household participant timeline for the <strong>trial</strong>, where the period from <strong>vehicle</strong> handover to <strong>vehicle</strong> return is <strong>of</strong> threemonths duration nominally.CREATING A MARKET 23
HOUSEHOLD ANDFLEET VEHICLEROLL-OUTThe Victorian ElectricVehicle Trial has soughta range <strong>of</strong> <strong>vehicle</strong>sfrom different suppliersfor deployment inhouseholds andcorporate fleets.The car types haveincluded OriginalEquipment Manufacturer(OEM) products andaf<strong>term</strong>arket conversions,with the formersupporting all <strong>of</strong> thehousehold and most<strong>of</strong> the fleet <strong>trial</strong>s.
Information gained fromthe cars has allowed for arelative assessment <strong>of</strong> the<strong>vehicle</strong> use.The household <strong>vehicle</strong> roll-out hasprovided around 120 households withthe opportunity to live with an <strong>electric</strong><strong>vehicle</strong> for three months. Informationgained from the households hasprovided insights into the sort <strong>of</strong> peopleand motives for being interested in<strong>electric</strong> <strong>vehicle</strong>s, what they thought<strong>of</strong> them and how they used them.The fleet <strong>vehicle</strong> roll-out has providedaround 40 fleets with the opportunityto <strong>trial</strong> a range <strong>of</strong> <strong>electric</strong> <strong>vehicle</strong>s forperiods <strong>of</strong> up to six months at a time.An understanding <strong>of</strong> the fleet types,motives and uses for the <strong>electric</strong><strong>vehicle</strong>s has been gained, along withthe issues and opportunities formarket development.4.1 VEHICLES4.1.1 What <strong>vehicle</strong>s are takingpart in the <strong>trial</strong>?The mainstay <strong>of</strong> <strong>vehicle</strong>s taking partin the <strong>trial</strong> are 100 per cent <strong>electric</strong>allypowered<strong>vehicle</strong>s – primarily theMitsubishi i-MiEV and Nissan LEAF.A small number <strong>of</strong> Toyota Prius PHEVs,both pre-production prototypes andconversions, have also taken part,along with a number <strong>of</strong> af<strong>term</strong>arketEV conversions.Table 1 provides a summary <strong>of</strong> thevarious <strong>vehicle</strong>s operating as part <strong>of</strong>the <strong>trial</strong>. Vehicles for which the serviceapplication has been identified as‘fleets through affiliation’ were ownedand/or controlled by entities other thanthe former <strong>Department</strong> <strong>of</strong> <strong>Transport</strong>.These <strong>vehicle</strong>s took part in the <strong>trial</strong> toaccess a range <strong>of</strong> benefits includinguse <strong>of</strong> public charging infrastructureor the <strong>trial</strong> data collection andmanagement framework, or simplyin support <strong>of</strong> information exchange.The supply arrangements for theOEM <strong>vehicle</strong>s (Mitsubishi i-MiEV,Nissan LEAF and Toyota Prius PHEVpre-production) allowed them tobe deployed to both householdsand fleets, whereas the remaining<strong>vehicle</strong>s were operated solely by fleets.Furthermore, those <strong>vehicle</strong>s takingpart in the <strong>trial</strong> courtesy <strong>of</strong> ‘fleetsthrough affiliation’ did not supplydata into the <strong>trial</strong> collectionand management framework– refer to Table 1 and Section 3.4.Vehicle Type No. <strong>vehicle</strong>s PriceFirst <strong>vehicle</strong>commissioningdateTrial serviceapplication/sMitsubishi i-MiEV OEM BEV 14 $65,200 2 (2010) December 2010$48,800 (2011-12)3 $36,888 3 (2013) December 2010Toyota Prius PHEV 4Blade Electron 5OEM preproductionPHEVAf<strong>term</strong>arketconversion PHEVAf<strong>term</strong>arketconversion BEVNissan LEAF OEM BEV 16EV EngineeringElectricCommodore 8Af<strong>term</strong>arketconversion BEVTotal 54Fleets, householdsFleets throughaffiliation3 N/A December 2010 Fleets, households3 N/A January 20118 $48,000 (2010-11) March 2011$68,007 6 (2010)$51,500 (2012)$46,990 7 (2013)June 20117 N/A June 2012Fleets throughaffiliationFleets throughaffiliationFleets, householdsFleets throughaffiliationTable 1. Vehicles operating as part <strong>of</strong> the Victorian Electric Vehicle Trial as <strong>of</strong> December 2012, where ‘Price’ reflects the RecommendedRetail Price (RRP) unless otherwise indicated.2 Drive-away price includes $20,000 guaranteed buyback price from Mitsubishi3 Dealer drive-away price 16 January 20134 Vehicle ownership retained by Toyota (OEM pre-production) or operators (af<strong>term</strong>arket conversion)5 Blade Electric Vehicles ceased trading in April 20126 UK-specification <strong>vehicle</strong>s supplied ahead <strong>of</strong> the Australian product launch; includes $25,045 guaranteed buyback price from Nissan7 Drive-away price, representing around $8,000 saving on the 2012 RRP8 Pro<strong>of</strong>-<strong>of</strong>-concept prototype <strong>vehicle</strong>sCREATING A MARKET 25
Features <strong>of</strong> relevance regarding the<strong>vehicle</strong>s included the following:• In-<strong>vehicle</strong> GPS, a key enablingtechnology/driver-aid for EVrange management, was presentin only the Mitsubishi i-MiEVs,which utilised an af<strong>term</strong>arket GPSsolution. The Nissan LEAF <strong>trial</strong><strong>vehicle</strong>s were supplied ahead <strong>of</strong>the Australian-specification OEMGPS solution, which was not ableto be cost-effectively retr<strong>of</strong>itted tothe <strong>vehicle</strong>s• The Nissan LEAF has a climatecontrol pre-heat/cool feature thatallows it to use mains <strong>electric</strong>ityto warm/cool the cabin to a presettemperature/time, therebypreserving the battery chargefor driving range. Although use<strong>of</strong> this feature was not able to bemonitored, use <strong>of</strong> heating/coolingby both the i-MiEV and the LEAFduring driving was monitored. Thisshould have resulted in the i-MiEVbeing <strong>report</strong>ed to use heating/cooling more, all else being equal• In-<strong>vehicle</strong> range estimationworked differently from one<strong>vehicle</strong> type to the next. By way<strong>of</strong> example, the i-MiEV evaluates/displays a remaining-rangeestimate based upon the currentoperating condition <strong>of</strong> the <strong>vehicle</strong>,resulting in instantaneousfeedback to changes in operationalstate, whereas the LEAF evaluatesthis figure based upon a rollingfive kilometres average, providingmore gradual changes to theindicated range based uponchanges to the <strong>vehicle</strong> operatingstate. The more immediate driverfeedback supplied by the i-MiEVwas perceived to influence driverchoices differently from the LEAF,for example with regards use <strong>of</strong>heating/cooling• Af<strong>term</strong>arket instrumentation fittedfor the <strong>trial</strong> <strong>vehicle</strong> monitoringdrew charge from the 12 voltbattery to the extent that thisissue needed to be managedby the <strong>vehicle</strong> operators in theevent <strong>of</strong> the <strong>vehicle</strong> not beingdriven regularly – one householdparticipant rejected this solutionand returned the <strong>vehicle</strong> after ashort period, while some <strong>of</strong> thefleet participants <strong>report</strong>ed this asbeing a deterrent for their staff touse the <strong>vehicle</strong>. Overall this mayhave reduced <strong>vehicle</strong> utilisation/acceptance for the i-MiEV inparticular due to its relatively lowcapacity 12 volt battery• The complete <strong>vehicle</strong>instrumentation solutionwas applied to the Mitsubishii-MiEVs and Nissan LEAFs only.Cost, complexity and operatorpreference were factors in thereduced solution specificationapplied to the other <strong>vehicle</strong>s• The Blade Electrons were existingfleet <strong>vehicle</strong>s retr<strong>of</strong>itted with anupgraded specification for use inthe <strong>trial</strong> by their owner-operators.As a consequence <strong>of</strong> the various issuespresented above, the majority <strong>of</strong> thedata captured related to the NissanLEAF and Mitsubishi i-MiEVs.4.1.2 Were any differencesseen in how the <strong>vehicle</strong>swere used?Significant differences were noted inhow people used the <strong>trial</strong> <strong>vehicle</strong>s,with the Mitsubishi i-MiEV beingunderutilised by comparison withthe Nissan LEAF. The Toyota PriusPHEVs were generally driven furtherthan the pure EVs, however this variedconsiderably between deployments.The Blade af<strong>term</strong>arket EV conversionssuffered from a range <strong>of</strong> issues whichsignificantly impaired their utilisation.With reference to Table 2, the NissanLEAFs were driven substantiallyfurther per day than the Mitsubishii-MiEVs. The Nissan LEAF averagedaily driving distance <strong>of</strong> 32.8 kilometresis close to the Melbourne average<strong>vehicle</strong> daily driving distance <strong>of</strong> 35kilometres (DOT 2012a).The Toyota Prius PHEVs loggedsubstantially higher average dailydistances travelled than either <strong>of</strong> thepure EVs – 42.6 kilometres versus32.8 for the LEAFs and 24.5 for thei-MiEVs. Notably however, this wasaccompanied by a standard deviation <strong>of</strong>nearly 21 kilometres over the relativelysmall sample <strong>of</strong> 11 household and fleet<strong>vehicle</strong> assignments, indicating somestatistical uncertainty in the results.Nevertheless, the results suggestthat the PHEVs were generally drivenfurther than the pure EVs.
Alongside differences in utilisation,the behavioural and attitudinal dataobtained from the <strong>trial</strong> participantsillustrates differences betweenthe <strong>vehicle</strong>s.Despite household participants beingselected partly on the basis <strong>of</strong> whetherthey had an existing small to mediumsize <strong>vehicle</strong>, i-MiEV drivers <strong>report</strong>eda marked difference in their responseto the question, ‘How well does the<strong>trial</strong> <strong>vehicle</strong> fit your needs, that is, inways not related to it being an <strong>electric</strong><strong>vehicle</strong> (for example size)?’ (3.6 versus4.5 for the LEAF on a rating scalefrom 1 = ‘hardly at all’ to 5 = ‘to a greatextent’; aggregate std dev 1.2).In seeking to understand specificallyissues drivers had with thei-MiEV, perceptions <strong>of</strong> it beinga less safe <strong>vehicle</strong> were <strong>report</strong>edby some participants.A typical quote drawn from theVictorian Electric Vehicle TrialDiscussion Board sums upthese sentiments:We have only once had the i-MiEV atspeed (up to 100 km/h). It was OK…but not something I would want to d<strong>of</strong>or prolonged periods <strong>of</strong> time. My VWGolf is definitely superior at speedand gives a much greater feeling <strong>of</strong>stability and safety.Victorian Electric Vehicle Trialhousehold participant, 2012Size limitations were also citedoccasionally, however <strong>vehicle</strong> occupancyrates before, during and after thehousehold EV experience suggest thatthis was not a major issue.Table 2 below highlights the markeddiscrepancy between the use <strong>of</strong>heating and cooling on both <strong>vehicle</strong>s.Several factors may have influencedthis outcome including:• Seasonal variations between theperiods over which the <strong>vehicle</strong>shave been allocated (furtheranalysis <strong>of</strong> the raw data is beingundertaken to verify this)• Increased need to conserve energyas a result <strong>of</strong> around 10 per centlower operating range <strong>of</strong> thei-MiEV relative to the LEAF.Vehicle use attributeDistance travelled per day(km)Distance between chargeevents (km)Mitsubishi i-MiEV Nissan LEAF Toyota Prius PHEVAV SD AV SD AV SD24.5 12.7 32.8 15.3 42.6 20.934.3 10.6 35.9 8.0Statistically-significantdifference?Yes (i-MiEV / LEAF)No (Prius PHEV /others)NoState-<strong>of</strong>-Charge at plugin(%)Use <strong>of</strong> ECO driving mode(% <strong>of</strong> driving time)Use <strong>of</strong> air-conditioning(% <strong>of</strong> driving time)Use <strong>of</strong> heating(% <strong>of</strong> driving time)57.5 10.2 52.0 9.4 Yes26.1 25.6 23.1 23.0 N/ANo9.4 11.5 17.2 8.8 Yes50.0 31.2 65.7 25.0 YesAverage energy economy(kWh/km) 9 0.150 0.179 YesTable 2. Vehicle use data based upon 25, 33 and 11 three-month <strong>vehicle</strong> assignments for the i-MiEV, LEAF and Prius PHEVrespectively, where AV = average value and SD = standard deviation for the data-set.9 Derived figures based upon <strong>vehicle</strong> odometer readings and charging activity dataCREATING A MARKET 27
Although the ability <strong>of</strong> the LEAF to beprogrammed to heat or cool the carusing mains <strong>electric</strong>ity whilst chargingmay have provided an explanation forincreased use <strong>of</strong> these functions, the<strong>vehicle</strong> data monitoring did not capturethis activity due to a quirk with theproprietary <strong>vehicle</strong> firmware.An artefact <strong>of</strong> the way the <strong>trial</strong>was designed was the effect theaf<strong>term</strong>arket instrumentation had onthe cars as a result <strong>of</strong> the increasedload on the 12 volt battery. This effectwas much more pronounced fori-MiEVs than for the LEAFs due to therelatively small 12 volt battery in the<strong>vehicle</strong>. A partial fix was implementedfor the i-MiEV in the form <strong>of</strong> a devicethat isolated the 12 volt battery oncethe remaining charge dropped belowa certain point, beyond which it wasa short procedure to get the <strong>vehicle</strong>going again. Nevertheless, feedbackfrom the some <strong>of</strong> the <strong>trial</strong> participantshighlighted the inconvenience <strong>of</strong> thissituation, which for fleets in particularmay have acted as a deterrent for<strong>vehicle</strong> use.Although quantitative data was notsupplied by the fleet owner/operators<strong>of</strong> the Blade Electron EV conversions,anecdotal and survey <strong>report</strong>ingsuggests that <strong>vehicle</strong> utilisation didnot meet expectations. Vehicle deliveryand reliability issues significantlyimpaired the operation <strong>of</strong> these<strong>vehicle</strong>s, in addition to which referencewas made to range limitations versusoperational requirements, alongwith driver disapproval <strong>of</strong> the chargemanagement/range estimation.Feedback obtained from the <strong>vehicle</strong>supplier suggested that their producthad been much more favourablyreceived by private buyers, who weremore accepting and accommodating<strong>of</strong> the <strong>vehicle</strong> idiosyncrasies.4.1.3 What are the issuesand opportunities forthe <strong>vehicle</strong>s?The purchase price barrier commonto all new technologies is expectedto reduce in the near-<strong>term</strong> througha range <strong>of</strong> avenues. The total cost<strong>of</strong> ownership argument in favour <strong>of</strong><strong>electric</strong> <strong>vehicle</strong>s will strengthen inparallel. Improved driver informationwill greatly assist in realising EVoperational cost savings.Relative to other markets, sales <strong>of</strong><strong>vehicle</strong>s analogous to plug-in EVs inAustralia have traditionally been nicheat best. Australian combined sales <strong>of</strong>the Toyota Prius and Honda Insighthybrid-<strong>electric</strong> <strong>vehicle</strong>s have hoveredbetween one and two per cent <strong>of</strong> thesmall <strong>vehicle</strong> market segment for anumber <strong>of</strong> years, during which timethese same <strong>vehicle</strong>s have been theoverall market sales leaders in Japan(GoAuto 2011).35Electric <strong>vehicle</strong> sales in Australia30Nissan LeafMitsubishi i-MiEVSource: VFACTS25Sales2015Leaf Launch1050Aug Sep Oct Nov Dec Jan Feb Mar Apr Mar Jun Jul Aug Sep Oct20112012Figure 13. Early market Australian sales figures for the Mitsubishi i-MiEV and Nissan LEAF (GoAuto 2012a).
Evidence suggests that while purchaseprices remain significantly higher thanICE <strong>vehicle</strong>s <strong>of</strong> the same size and basicspecification, EVs are likely to occupya similar niche role in the Australianmarket. With reference to Figure 13,the early market sales figures for theMitsubishi i-MiEV and Nissan LEAFillustrate relatively slow take-up.However, various indicators suggestthat this is an early-market scenarioconsistent with Rogers’ theory <strong>of</strong>technology market developmentoutlined in Section 3.2:• Australian sales <strong>of</strong> green andspecifically hybrid cars areincreasing, due to lower prices,greater choice and increasedbuyer awareness, understandingand acceptance <strong>of</strong> thesetechnologies (News 2012)• OEM EV purchase prices aredropping in all markets – referto Table 1 and Figure 14 for theAustralian market story over thelife <strong>of</strong> the <strong>trial</strong>• Sales <strong>of</strong> plug-in <strong>vehicle</strong>s globallyare ahead <strong>of</strong> the sales <strong>of</strong> hybrid<strong>vehicle</strong>s at a similar stage in theirmarket development – in the U.S.alone sales <strong>of</strong> plug-in <strong>vehicle</strong>stripled in 2012 (US DOE 2013 andFigure 15)• According to industry sources,there are a range <strong>of</strong> plug-in<strong>vehicle</strong>s being considered forintroduction to the Australianmarket, which will provide morechoice for buyers and increasedcompetition on prices – notably,19 new plug-in <strong>vehicle</strong>s from15 manufacturers will arrive inthe U.S. market in 2013-14(Edmunds 2012).While the inter-related issues <strong>of</strong> new<strong>vehicle</strong> purchase prices and salesfigures are a major challenge currently,it is envisaged that local <strong>vehicle</strong> supplywill be an issue as prices continueto fall and global demand increases.Industry consultation undertaken aspart <strong>of</strong> the <strong>Department</strong>’s economicmodelling found that Australian <strong>vehicle</strong>supply represents around one percent <strong>of</strong> global production (AECOM2011). Global production is prioritisedto supply the markets which hold themost appeal for the manufacturers– traditionally the U.S./Canada,Japan and Western Europe, althoughincreasingly also the emergingeconomies <strong>of</strong> China, India, Braziland Russia. As a result, the Australianmarket may be undersupplied for<strong>vehicle</strong>s either by type or volume dueto competition from other markets.$75,000$65,000Nissan LeafMitsubishi i-MiEVMazda 3 Neo$55,000$45,000$35,000$25,000$15,0002010 201120122013Figure 14. Recommended Retail Price history for the <strong>trial</strong> EVs and Australia’s highest-selling small car.CREATING A MARKET 29
0Future product planning for theautomotive OEMs occurs at least threeyears ahead <strong>of</strong> the product sale launch(CAR 2007). Discussions held withOEMs as part <strong>of</strong> the <strong>trial</strong> have foundthat <strong>vehicle</strong> model and sales volumeforecasts are locked in at least twoyears ahead <strong>of</strong> <strong>vehicle</strong>s arriving intothe market. Noting the wide range<strong>of</strong> models forecast for delivery intothe U.S. market (Edmunds 2012), thisreality has implications for the timing<strong>of</strong> measures to encourage mainstreammarket adoption – refer to Sections6.1.2 and 6.1.3 for further discussionon this issue.Depreciation is another issue thathistory suggests will be a problem(Drive 2011). The absence <strong>of</strong> reliabilityand maintenance cost data for newtechnology creates uncertainty in themarket that results in accelerateddepreciation and lower resale values.This is a challenge for manufacturersas poor resale values can significantlyhinder sales due to depreciation beingthe largest contribution to new <strong>vehicle</strong>total cost <strong>of</strong> ownership.However, there are a range <strong>of</strong>influences that may help bolsterresale prices and reduce <strong>vehicle</strong>depreciation costs:• Australian <strong>electric</strong> <strong>vehicle</strong>sellers are known to be stronglyinterested in the second-handmarket for their <strong>vehicle</strong>s 9 , atleast partly to satisfy a market for<strong>vehicle</strong>s <strong>of</strong> lower cost• The national EV standards projecthas within its scope an industrystandardfor assessment <strong>of</strong> batterycondition (Standards Australia2010), which if implemented willimprove market confidence withinused <strong>vehicle</strong> transactions• A range <strong>of</strong> ‘second-life’applications exist for batteriesat the end <strong>of</strong> their <strong>vehicle</strong> life,including trams and trains, marineapplications, commercial and<strong>of</strong>f-road <strong>vehicle</strong>s, home energystorage, uninterruptable powersupplies, and large scale gridenergy storage (P3 2012).As any/all these influences cometo bear, the total cost <strong>of</strong> ownershipEV value proposition for new <strong>vehicle</strong>buyers will improve beyond whatwill be delivered by transport energycosts alone.In <strong>term</strong>s <strong>of</strong> range management, theeffect <strong>of</strong> improved driver information isalso a clear opportunity. A white paperprepared for the Michigan <strong>Department</strong><strong>of</strong> <strong>Transport</strong>ation (CAR 2011) outlinedthe synergy between <strong>electric</strong> <strong>vehicle</strong>sand <strong>vehicle</strong> communication systems.It identified trip planning, includingroute finding, range estimation, smartparking, and identification <strong>of</strong> charginglocations, as the earliest opportunityfor improved <strong>vehicle</strong> and energymanagement.Australian-specification models <strong>of</strong>Nissan’s LEAF are equipped within-<strong>vehicle</strong> route-finding systems thathighlight charging options, along withsmart phone connectivity that allowsusers to monitor and manage thecharging <strong>of</strong> their <strong>vehicle</strong> remotely.10,00070,000Monthly sales (dotted lines)9,0008,0007,0006,0005,0004,0003,000PEVHEVPEV cumulativeHEV cumulative60,00050,00040,00030,00020,000Cumulative sales (solid lines)2,0001,00010,00001 2 3 4 5 6 7 8 9 10 11 12 13 14 15 16 17 18 19 20 21 22 2324Figure 15. New Plug-in Electric Vehicle (PEV) sales compared to Hybrid Electric Vehicle (HEV) sales over their respective24 month introductory periods in the U.S.; PEV sales 12/2010 to 11/2012, HEV sales 12/1999 to 11/2001 (US DOE 2013).10 Personal communications
This sort <strong>of</strong> functionality is expectedto be standard on most <strong>vehicle</strong>s thatenter the market in future, even ifthe solutions are region-specific(due to local telecommunicationsand transport network issues).Facilitating improved information onthe charging network for the <strong>vehicle</strong>and/or intelligent transport systemstechnology suppliers may streamlinemarket entry for all participants (referalso to Section 5.1.5).Despite the limited data obtained forthe Toyota Prius PHEVs, indications arethat the absence <strong>of</strong> range limitationsfor this <strong>vehicle</strong> may have contributedto increased utilisation in <strong>term</strong>s <strong>of</strong>average daily driving distance. Moredata needs to be obtained beforeconclusions can be formed however.The Blade Electrons clearly sufferedfrom issues directly related to thembeing af<strong>term</strong>arket <strong>electric</strong> <strong>vehicle</strong>conversions. Furthermore, thereappears to be a significant mismatchbetween the private and fleet buyerexpectations for these <strong>vehicle</strong>s. Whileaf<strong>term</strong>arket EV conversions are wellsupported by enthusiasts, thesefindings suggest that more widespreadacceptance may prove challenging.4.1.4 What about <strong>electric</strong>two-wheelers?Electric two-wheelers are atransport option with great potential.International trends and Australianregulatory reform suggest that theymay play a greater role in Victoria’sfuture transport system as consumerawareness, understanding andacceptance <strong>of</strong> the technology improves.Electric bicycles (e-bikes) can bedefined as non-registered <strong>vehicle</strong>sthat are partly or fully propelled byan <strong>electric</strong> motor. Evidence suggeststhat <strong>electric</strong> bikes may provide anaffordable, healthy mobility optionfor the aged and physically-impairedin particular. Sales <strong>of</strong> this relativelylow-cost transport option are forecastto grow from around 30 to nearly 50million <strong>vehicle</strong>s annually between 2013and 2018 (Green Car Congress 2012).Research co-sponsored by theVictorian Electric Vehicle Trial(Johnson 2012) has found that the topreasons for purchase <strong>of</strong> e-bikes are (indescending order or importance):• To replace some car trips• To ride with less effort• Health – increase fitness• Live in a hilly area• Health – medical condition.Other findings from this researchincluded:• Nearly three quarters <strong>of</strong> e-bikecharging takes place at home,with the remainder mainly atthe destination and a minoramount elsewhere• Nearly two-thirds <strong>of</strong> ridersare male, and the largest agedemographics 40-49 and 50-59• The majority <strong>of</strong> e-bike trips werecommuting and local journeys,predominantly in place <strong>of</strong> cartravel resulting in averageestimated savings <strong>of</strong> between$21 and $49 per week• Nearly three quarters <strong>of</strong>respondents agreed that e-biketravel avoided the need for ashower at the end <strong>of</strong> the journeyshould it have been undertakenby bike, and also that the averagespeed was higher than for a bike• The main advantages <strong>of</strong> e-biketravel included health/fitnessand enjoyment/fun, while thedisadvantages included the heavybike and bad weather/rain.A subset within the e-bike researchgroup above is pedal-assist e-bikesor pedalecs, which are defined as‘a type <strong>of</strong> power-assisted bicycleequipped with one or more auxiliarypropulsion motors, a maximum power<strong>of</strong> 250 watts, and a safeguard allowingfor power assistance only when thebicycle is travelling less than 25 km/hand the rider is pedalling’ (VicRoads2012a). This definition was refined in2012 through a national process whichresulted in harmonisation acrossthe states <strong>of</strong> Australia and with theEuropean standard for these <strong>vehicle</strong>s.As a result, the availability <strong>of</strong> these<strong>vehicle</strong>s is set to increase greatly,promoting their adoption.Electric motorcycles are roadregistered<strong>vehicle</strong>s that use <strong>electric</strong>ityfor part or (more commonly) all <strong>of</strong> theirpropulsion. Figures obtained fromthe VicRoads registration databaseshowed that <strong>electric</strong> motorcycles area rare sight on Victorian roads. Therewere just 45 registrations at the end <strong>of</strong>November 2012 which represents lessthan 0.03 per cent <strong>of</strong> total motorcycleregistrations (VicRoads 2012b).However, the number <strong>of</strong> registrationshas grown by almost 30 per cent in 18months from the previous data point.While it is unclear as to whether thisis a sign <strong>of</strong> an emerging trend, thesefigures are analogous to those for<strong>electric</strong> passenger <strong>vehicle</strong> registrationsin Victoria, particularly once the <strong>trial</strong><strong>vehicle</strong> registrations are discounted.CREATING A MARKET 31
ELECTRIC TWO-WHEELER CASE STUDYDOLOMITI E-BIKE TRIALCarlton-based Italian lifestyle store Dolomiti have taken a novel approach in bringing e-bikes to theAustralian market. By <strong>of</strong>fering commuters free e-bikes for a number <strong>of</strong> weeks, they hope to raiseawareness, understanding and acceptance <strong>of</strong> e-bikes in the community.Participants in the Dolomiti <strong>trial</strong> are required to travel at least 35 kilometres per week, including acommute into Melbourne’s CBD. The e-bikes are equipped with GPS tracking, providing not only themeans to assess performance against the weekly travel requirement, but also data for the MonashUniversity research partners. Monash combine this information with entry and exit surveys <strong>of</strong>participants to gain a better understanding <strong>of</strong> how this new transport mode is used.The outcomes from the Dolomiti <strong>trial</strong> will inform stakeholders, such as local government, on themotivations and applications for e-bikes. Through these insights, measures may be designed toencourage e-bike uptake. Early findings indicate that e-bikes deliver real benefits in <strong>term</strong>s<strong>of</strong> physical activity and traffic reduction.Figure 16. Pedal-assisted<strong>electric</strong> bike or ‘pedalec’being used for theDolomiti e-bike <strong>trial</strong>.
4.1.5 What about <strong>electric</strong>commercial <strong>vehicle</strong>s?Electric commercial <strong>vehicle</strong>s are <strong>of</strong>strong interest to many fleet operatorsin Australia, particularly vans and other<strong>vehicle</strong>s at the light-duty end <strong>of</strong> themarket. Supply constraints currentlyinhibit further evaluation <strong>of</strong> the viability<strong>of</strong> these <strong>vehicle</strong>s for Victorian roads.Electric commercial <strong>vehicle</strong>s, such asvans, buses and light and heavy trucks,are already operating on roads aroundthe world with less <strong>of</strong> the fanfare thataccompanies passenger <strong>vehicle</strong>s. Thereduced operating costs and improvedenvironmental performance <strong>of</strong> <strong>electric</strong><strong>vehicle</strong> technology are an attractionfor operators <strong>of</strong> <strong>vehicle</strong>s for whichthe potential savings may greatlyexceed those from passenger <strong>vehicle</strong>s.Additionally, the near-silent operation<strong>of</strong> <strong>electric</strong> <strong>vehicle</strong>s holds potential forfreight sector productivity increasesthrough night-time deliveries innoise-sensitive areas (Freight BestPractice 2009).Extensive investigations by a largeAustralian freight and logisticsoperator identified a number <strong>of</strong>potential EVs available globally forwhich discussions were pursuedfor local import. Although theseinvestigations have been underwaysince the launch <strong>of</strong> the <strong>trial</strong> in 2010,no agreements have been reachedon local supply <strong>of</strong> <strong>vehicle</strong>s.The main issues preventing <strong>vehicle</strong>sfrom being <strong>trial</strong>led locally are:• Relatively small numbers <strong>of</strong><strong>vehicle</strong>s being sought• Australian market entry costs(<strong>vehicle</strong> homologation, serviceand repair etc.)• Technology suitability for theintended service application/operating environment• Price.Separately, investigations into alocal fleet purchasing coalition havediscerned an appetite for <strong>electric</strong> lightcommercial <strong>vehicle</strong>s. Consultation withlocal fleet operators, undertaken bythe consultants Verdant Vision as part<strong>of</strong> a project led by The Climate Groupand sponsored by the Victorian andSouth Australian Governments, foundmany fleets to be interested in <strong>trial</strong>ling<strong>electric</strong> vans and other commercial<strong>vehicle</strong>s. However, relatively few<strong>vehicle</strong>s are being sought by theoperators, which may not provide thecritical mass required for the supplyconstraint to be addressed. The final<strong>report</strong> from this project is expected forrelease in early 2013.Electric buses are already operatingon Victorian roads as charter <strong>vehicle</strong>s(Crown 2012). Assessment <strong>of</strong> <strong>electric</strong>bus technology was included as part<strong>of</strong> a wider investigation into alternativefuel and <strong>vehicle</strong> technologies for thebus industry (DOT 2012b). Indicationsfrom this and more recent analysissuggest that the long charging timesfor the <strong>vehicle</strong>s and high purchaseprices make them best suited to lightduties with high promotional value.4.2 HOUSEHOLD VEHICLEROLL-OUT4.2.1 Who’s interested in<strong>electric</strong> <strong>vehicle</strong>s and why?In general, would-be Victorian EVdrivers are strongly interested innew technology and environmentallyaware. They are also highly educatedrelative to the general population.Although the spatial distribution <strong>of</strong>EV enthusiasts was fairly flat, therewere notable ‘hot-spots’ aroundthe <strong>mid</strong>dle suburbs in Melbourne’ssoutheast and the outer suburbsin both the west and southeast.A household application to participateand survey process was run inpartnership with RACV in November/December <strong>of</strong> both 2010 and 2011(DOT 2010d and 2012c). Applicantswere requested to complete a 15minute questionnaire that soughtinformation not only to guide theparticipant selection process, butalso to inform the understanding<strong>of</strong> the potential <strong>electric</strong> <strong>vehicle</strong>market in Victoria.CREATING A MARKET 33
Some observations about the nearly9000 households who applied to takepart in the <strong>trial</strong> included:• High levels <strong>of</strong> environmentalawareness• Positive attitudes towardsgovernment action in support<strong>of</strong> EVs• Substantial take-up <strong>of</strong> solar PVsystems and GreenPower (around20 per cent <strong>of</strong> each)• Large number <strong>of</strong> householdsconsisting <strong>of</strong> two adults andno children• A high proportion <strong>of</strong> householdswith postgraduate educationalqualifications (nearly 20 percent <strong>of</strong> applicants, as comparedto around 3 per cent <strong>of</strong> thegeneral population)• Most significant motivationsto participate in the <strong>trial</strong> wereattributed to interests in new/EVtechnology (refer to Figure 17).These findings are generally consistentwith what has been observedelsewhere in relation to the <strong>electric</strong><strong>vehicle</strong> early-adopter demographic(Rorke and Inbakaran 2009).The spatial distribution <strong>of</strong> applicantswas fairly flat (DOT 2012c). Asignificant cluster <strong>of</strong> applicationswas received from the south-eastMelbourne suburbs around Waverleyand Blackburn, along with outersuburban locations aroundWerribee and Cranbourne.4.2.2 What do drivers think <strong>of</strong><strong>electric</strong> <strong>vehicle</strong>s?Drivers who experienced the <strong>trial</strong>EVs were highly accepting <strong>of</strong> thetechnology, with the caveat beingpurchase price. Purchase price wasroutinely cited as the reason for whythey would not be buying one in thenear-<strong>term</strong>. Performance, technologyfor the sake <strong>of</strong> technology, and quiet/environmentally-friendly/low-costoperation were common reasons forfavouring the technology. The limitedoperating range <strong>of</strong> the <strong>vehicle</strong>s was nota significant issue for the majority <strong>of</strong>participants, however one in five wereconcerned the majority <strong>of</strong> the time.I want to experiencemyself what an EVis like to driveThe opportunity to<strong>trial</strong> newtechnologyI am thinking aboutpurchasing anElectric VehicleI strive to be 'green'(environmentallyresponsible)I want to see whatthe running costsare likeOtherIt is free0% 5% 10% 15% 20% 25%ProportionFigure 17. Results from the 2012 <strong>trial</strong> household application to participate process highlighting the primary reason forapplying to participate in the <strong>trial</strong> (n = 2,200, single choice permitted, DOT 2012c).
A clearly positive influence on people’sattitudes towards EVs is <strong>vehicle</strong>performance. This finding arises fromthe inherent characteristics <strong>of</strong> <strong>electric</strong>motors, which generate maximumtorque from rest (in contrast to ICEs,which generate maximum torque nearthe <strong>mid</strong>dle <strong>of</strong> their operating range).Torque is ‘twisting’ force that is thebasis <strong>of</strong> acceleration – a popular<strong>vehicle</strong> driving characteristic.Evidence <strong>of</strong> this can be seen in theopinions <strong>of</strong> participants in the short<strong>term</strong>test-drives, who were surveyedon their perceptions <strong>of</strong> <strong>electric</strong> <strong>vehicle</strong>sbefore and after their test-driveexperience. Of the 127 participantssurveyed, 27.6 per cent changed theirmind in favour <strong>of</strong> EVs as a result <strong>of</strong>their test-drive experience (that is,their answer to the question ‘Wouldyou use an EV as your regular <strong>vehicle</strong>?’changed from ‘no’ before theirtest-drive to ‘yes’ afterwards). Withreference to Figure 18, the <strong>vehicle</strong>attributes that showed the greatestrating improvement according to these‘converted’ participants were mostlyperformance related.First impressions by the drivers asrecorded in the <strong>trial</strong> discussion boardmost <strong>of</strong>ten cited the lack <strong>of</strong> noiseand issues to do with comfort/space/storage, which were both cited byaround half <strong>of</strong> the contributors each.Driving modes, range and technology/features were each cited by between30 and 40 per cent <strong>of</strong> contributors.21.5Rating change (after vs before)10.50-0.5-1-1.5AccelerationFun to driveOvertakingMaintain highway speedEase to driveEase to startBrakingQuiet operationComfortInfo displayFigure 18. Changes to the <strong>vehicle</strong> attribute survey responses for the participants who changed their mind in favour<strong>of</strong> using an <strong>electric</strong> <strong>vehicle</strong> as their regular car as a result <strong>of</strong> their short-<strong>term</strong> test-drive experience (n = 127).CREATING A MARKET 35
The limited operating range <strong>of</strong> the<strong>vehicle</strong>s is a complicated issue. Withreference to Figure 19, householdparticipants surveyed around six weeksinto their EV experience were biasedtowards only occasional concernsabout range limitations, howeveraround one in five participants wereconcerned the majority or all <strong>of</strong> thetime. The following quote from thediscussion board illustrates themajority view <strong>of</strong> participants:I drove Camberwell – Dandenong –Boronia – Ferntree Gully – Camberwell(91 km) … in an i-MiEV. Was a littleconcerned that I might run out <strong>of</strong>power toward the end, but … ended upwith 7 km to spare according to theindicator. That was actually a pretty bigdrive for a suburban commute, and Idon’t think I’d ever go further in a dayin Melbourne.Victorian Electric Vehicle Trial fleetparticipant driver feedback, 2011The range difference between <strong>vehicle</strong>types does not appear to have overlyinfluenced driver opinion. Responsesto the question in Figure 19 from thei-MiEV drivers indicate only slightlymore concern than the LEAF drivers(3.6 versus 3.4 on a rating scalefrom 1 = ‘all the time’ to 5 = ‘hardlyat all’; aggregate std dev 1.2). Thissuggests that range may not be theprimary issue for the comparativeunderutilisation <strong>of</strong> the i-MiEV,and not an issue for most <strong>trial</strong>household participants.With regards the ‘significant minority’<strong>of</strong> participants who were notcomfortable with the <strong>vehicle</strong> range,it is important to note that manywere enthusiastic at the prospect <strong>of</strong>the technology. This finding may besignificant in the context <strong>of</strong> publiccharging infrastructure – refer toSection 5.4.Many household participants displayedingenuity and resolve when it came tomanaging the range limitations <strong>of</strong> their<strong>vehicle</strong>. User-generated content fromthe <strong>trial</strong> discussion board highlightsthe concept <strong>of</strong> ‘range anxiety’, howeverthe issue is more <strong>of</strong>ten expressedin the form <strong>of</strong> ‘range management’.Users cite a range <strong>of</strong> considerationsmade as part <strong>of</strong> this:• Trip planning and distanceestimation• Driving mode selection/benefits• Public charging options/accessarrangements• Interpretation <strong>of</strong> the in-<strong>vehicle</strong>range indicator (<strong>of</strong> which they arehighly critical)• Efficient driving techniques• Use <strong>of</strong> heating/cooling• Other measures that assist withrange optimisation.Don’t know/unsure <strong>of</strong> question 1.3%All the time 7.9%Hardly at all 19.7%The majority the time 13.2%About half the time 11.8%Occasionally 46.1%Figure 19. Household participant responses from around six weeks into their <strong>electric</strong> <strong>vehicle</strong> experience to the question,‘How <strong>of</strong>ten do you feel concerned about the available range <strong>of</strong> your <strong>vehicle</strong>?’ (n = 76).
Having to make these considerationsis occasionally cited as being aninconvenience that is not felt withpetrol <strong>vehicle</strong>s. A quote from thediscussion board sums this upby saying:Driving in an EV isn’t a mindlessactivity.Victorian Electric Vehicle Trialhousehold participant, 2012Of those participants who wereaccepting <strong>of</strong> EVs as a viable andeven desirable transport option, theoverwhelming majority highlightedpurchase price as being the keyobstacle to ownership. The quotesupplied by one <strong>of</strong> the householdparticipants subsequent to their threemonth<strong>electric</strong> <strong>vehicle</strong> experienceillustrates this issue:I was very close to buying myvery own Nissan LEAF about3 months ago. In fact, I went to theshowroom and tried to find out thedifferences between the Australianmodel versus the model I had from the<strong>trial</strong>. I also considered various financeoptions and a special leasing optionprovided by Nissan itself for the LEAF.At the end, I could not financially justifythe purchase <strong>of</strong> this EV. I went andbought a Toyota Prius instead.– Victorian Electric Vehicle Trialhousehold participant, 20124.2.3 How do people use<strong>electric</strong> <strong>vehicle</strong>s?Results suggest that householdsseamlessly adopted the <strong>trial</strong> <strong>electric</strong><strong>vehicle</strong>s into their normal travelbehaviours, and that they used the<strong>electric</strong> <strong>vehicle</strong>s as their primarytransport mode. Comparison withVictorian Government travel datasuggests that these conclusionsmay be transferred to the majority<strong>of</strong> the Melbourne population. Vehiclerange limitations are managed bythe majority <strong>of</strong> drivers. Workplacecommuting was the most common<strong>vehicle</strong> travel destination. Selfdescribed‘early-adopters’ were notfound to use their <strong>vehicle</strong> differentlyto mainstream market participants.BeforeCar tripsEV tripsTrial travel diary resultsDuringAfterMelbourne average0% 10% 20% 30% 40% 50% 60% 70% 80% 90% 100%Total tripsFigure 20. Results from the household travel diaries where the breakdown in car travel as a percentage <strong>of</strong> total trips is<strong>report</strong>ed for all travel diaries submitted across the three phases <strong>of</strong> the household <strong>vehicle</strong> allocations.CREATING A MARKET 37
With reference to Figure 20,households were asked to completetravel diaries for each phase <strong>of</strong> theirinvolvement in the <strong>trial</strong> – before, duringand after their EV allocation. Althoughthe completion rate <strong>of</strong> the travel diariesfell away across the phases (from 5,586trips <strong>report</strong>ed in the ‘before’ phase, to4,675 for the ‘during’ phase, to 2,733for the ‘after’ phase), the percentage <strong>of</strong>total trips <strong>report</strong>ed as using a car heldsteady at around 75 per cent – slightlyless than the Melbourne average <strong>of</strong>78 per cent. These findings providesome confidence in the comparability<strong>of</strong> the data across phases/householdsgenerally, and suggest that thehouseholds did not significantly altertheir travel behaviours as a result <strong>of</strong>having an EV.Reported household and <strong>vehicle</strong>occupancies support this conclusion.Households <strong>report</strong>ed themselves ashaving an average <strong>of</strong> 2.87 occupants,translating to two adults with drivinglicences to operate the average<strong>of</strong> almost 2 <strong>vehicle</strong>s owned perhousehold, and one non-drivingdependent. The average <strong>vehicle</strong>occupancy rates per trip were 1.94occupants per <strong>vehicle</strong> in the ‘before’phase and 1.85 ‘after’, compared to1.85 occupants per EV trip ‘during’their <strong>trial</strong> <strong>vehicle</strong> allocation.When considered in combinationwith the trip mode choice breakdownabove, it may be concluded thathouseholds seamlessly adopted the<strong>trial</strong> <strong>electric</strong> <strong>vehicle</strong>s into their normaltravel patterns.Furthermore, 62 per cent <strong>of</strong> all tripswere <strong>report</strong>ed as using the <strong>trial</strong> <strong>vehicle</strong>in the ‘during’ phase, equating toaround two-thirds <strong>of</strong> all household<strong>vehicle</strong> trips. This suggests thathouseholds used the <strong>electric</strong> <strong>vehicle</strong>as their first-choice for <strong>vehicle</strong> travel.This result is a strong endorsementfor the substitutability <strong>of</strong> EVs, asthe participant selection processprioritised households who alreadyowned small or medium <strong>vehicle</strong>s soas to avoid a functional mismatch withthe <strong>trial</strong> <strong>vehicle</strong>s.Cumulative percentage <strong>of</strong> <strong>vehicle</strong>100%90%80%70%60%50%40%30%20%42%23%65%36%85%59%94% 98% 99%89%84%79%70%100%91% 94% 95%96% 97% 98% 98% 98%10%8%Melbourne MetroVIC EV Trial0%10 20 30 40 50 60 70 80 90 100 110 120 130 140Average daily <strong>vehicle</strong> driving distance (km)150Figure 21. Average daily driving distances for the Melbourne metropolitan area (DOT 2012a) along with ave3rage daily drivingdistances for <strong>trial</strong> household participants.
Analysis <strong>of</strong> the <strong>vehicle</strong> monitoringdata provides additional insights thatsupport these conclusions and helpsexplain the spectrum <strong>of</strong> driver opinionregarding the <strong>vehicle</strong> range limitations(refer to Figure 19). Highly reliable dataobtained from 44 household <strong>vehicle</strong>allocations <strong>of</strong> three months each foundthat the average distance travelledbetween charge events was 36.9kilometre, with a standard deviation<strong>of</strong> 8.8 kilometres.With reference to Figure 21, theaverage daily driving distance forthe Melbourne metropolitan area is35 kilometres (DOT 2012a), howeverthe distribution <strong>of</strong> average dailydriving distances reveals that thereis a significant minority who travelfurther (much further in some cases).This correlates well with the findingsabove in suggesting that the <strong>electric</strong><strong>vehicle</strong>s supported by householdcharging are sufficient for the majority<strong>of</strong> Melbourne’s drivers, even if thereis a significant minority for whom thiswould not work.Further analysis <strong>of</strong> the <strong>vehicle</strong> usedata illustrates driver management <strong>of</strong>range limitations. In practical <strong>term</strong>s,the operating range <strong>of</strong> the i-MiEV isaround 90 kilometres on the highwayand 100 kilometres around town,whereas the LEAF is 110 and 120kilometres respectively. With referenceto Table 3, i-MiEV drivers on averageplug-in with less range remaining thanLEAF drivers, despite having travelleda similar distance between charging(34.3 and 35.9 kilometres respectively).Given that the distance travelledbetween charging <strong>of</strong> both <strong>vehicle</strong>sclosely approximates the average dailydriving distance for Melbourne (35kilometres), this suggests that peopleused the i-MiEV as they would theirnormal <strong>vehicle</strong> despite the reducedrange (relative to the LEAF) – inother words, they managed the rangedifference. These results also suggestthat the tension between rangeanxiety and management has beenresolved in favour <strong>of</strong> the latter for themajority <strong>of</strong> participants (refer also toSection 4.2.2).Vehicle Mitsubishi i-MiEV Nissan LEAFPractical operating range (km) 90 – 100 110 – 120Average distance travelledbetween charging (km)Average State-<strong>of</strong>-Charge atplug-in (%)Average range remaining atplug-in (km)34.3 35.957.5 5251.8 – 57.5 57.2 – 62.4Table 3. Derived average range remaining at plug-in values for the i-MiEV and LEAF,based upon the practical operating range and the average State-<strong>of</strong>-Charge at plug-in.CREATING A MARKET 39
Analysis <strong>of</strong> the <strong>report</strong>ed trip purposeprovides more insights into how peopleuse EVs. Participating households<strong>report</strong>ed 11, 11 and 12 per cent <strong>of</strong>car-trips as being direct to work inthe before, during and after phasesrespectively. Unsurprisingly given thetwo-thirds substitution for total <strong>vehicle</strong>trips above, 11 per cent <strong>of</strong> EV tripswere <strong>report</strong>ed as being direct to workin the ‘during’ phase. These resultsare slightly above the Melbourneaverage <strong>of</strong> 7 per cent, suggesting thatthe <strong>trial</strong> sample is biased towards‘car commuters’.This conclusion may also apply to thebroader group <strong>of</strong> would-be EV drivers.Figure 22 provides an insight into thedriver travel behaviours for householdsapplying to take part in the <strong>trial</strong>.Noting that multiple responseswere permitted, the workplace wasthree times more likely to be a traveldestination than the next most popularalternative. This is a significant findingin the context <strong>of</strong> ‘workplace charging’(refer to 5.3.5).Potential differences between earlyadoptersand mainstream marketparticipants were investigated in thecontext <strong>of</strong> the technology marketdevelopment model adopted at theheart <strong>of</strong> the <strong>trial</strong> (refer to Section 3.2).The <strong>trial</strong> household participants weresegmented according to their responseto the question ‘Thinking in generalabout when a new product comes onthe market, which one <strong>of</strong> the followingwould best describe you?’.Those who described themselvesas ‘I like to be in there early and getit straight away’ were not found toexhibit any statistically-significantdifference in behaviour from the rest<strong>of</strong> the population in <strong>term</strong>s <strong>of</strong> <strong>vehicle</strong>utilisation, charging behaviour orcharge management (as describedby average daily distance travelled,average distance travelled betweencharge-events, average state-<strong>of</strong>chargeat plug-in, use <strong>of</strong> heating/airconditioning,use <strong>of</strong> eco driving mode).This suggests that ‘early adopters’ inthis case may be characterised by theirpurchase rather than user behaviour,however further investigation may bewarranted into this issue.Workplace 60%Domestic duties18%Childrensschool or care6%Place <strong>of</strong> study5%Sport/Leisure 5%Figure 22. Results from the 2011 <strong>trial</strong> household application process showing the distribution <strong>of</strong> <strong>vehicle</strong> travel destinations foreach driver in the household; multiple responses are permitted for each (n = 6,147, DOT 2010d).
4.2.4 How much does it costfor an average household torun an EV?Although there was significantvariation across the <strong>vehicle</strong>assignments, the average cost for a<strong>trial</strong> household participant to run their<strong>electric</strong> <strong>vehicle</strong> on renewable energywas between $7 and $10 per week.This is about half <strong>of</strong> what it would costto run an equivalent petrol <strong>vehicle</strong>, withnone <strong>of</strong> the emissions.Analysis <strong>of</strong> the data obtained from the<strong>trial</strong> household participants providessome insights into the average drivingdistances and energy economies –refer to Table 4. These values havebeen segmented by <strong>vehicle</strong> type dueto the statistically-significant variationin energy economy recorded for thetwo <strong>vehicle</strong>s.Electricity costs have assumed aresidential tariff <strong>of</strong> $0.25 per kWh thatincludes a premium for GreenPower(renewable energy). Althoughhouseholds varied significantly in<strong>term</strong>s <strong>of</strong> their GreenPower and/or solarPV take-up, the former <strong>Department</strong><strong>of</strong> <strong>Transport</strong> has accounted for all<strong>electric</strong>ity used by the <strong>trial</strong> <strong>vehicle</strong>sfor reconciliation with an equivalentamount <strong>of</strong> renewable <strong>electric</strong>itysupplied by AGL (DOT 2012d).For the purposes <strong>of</strong> comparison acalculation was made for the Mazda3 SP20 – Australia’s highest sellingmotor <strong>vehicle</strong> and a direct sizecompetitor to the Nissan LEAF inparticular. Although differences wereobserved between the <strong>vehicle</strong>s, the EVtransport energy cost saving is around50 per cent even allowing for ‘zeroemissions’ driving.Limitations with these calculationsinclude:• Gaps in the <strong>trial</strong> data-set, limitingthe number <strong>of</strong> <strong>vehicle</strong>s from whichan average <strong>electric</strong>ity economyfigure can be derived• Wide variation in the dailydriving distances, reducing themeaningfulness <strong>of</strong> the averagedistances used for the calculations• Functional mismatch betweenthe Mitsubishi i-MiEV and theMazda 3 SP20, reducing themeaningfulness <strong>of</strong> the comparison• Assumed fuel economy for theMazda 3 SP20, which may notreflect reality (for example, citybaseddriving would increase theEV savings; DOT 2012f)• Assumed energy costs for both<strong>electric</strong>ity and petrol, which canbe expected to change over timeindependently <strong>of</strong> each other(AECOM 2011).A separate limitation relates tocalculation <strong>of</strong> operating costs forthe Prius PHEVs. As these <strong>vehicle</strong>sutilised both <strong>electric</strong>ity and petrolfrom external sources, significantchallenges exist in obtaining reliabledata and/or accounting for missingdata. These issues have been setout more clearly in the GreenPoweraccounting <strong>report</strong> released by the <strong>trial</strong>(DOT 2012d), along with an operatingcost analysis method for PHEV drivers.Based upon the <strong>electric</strong>ity usefigures obtained, it is clear thatsignificant variation exists in theextent to which individual PHEVusers rely upon <strong>electric</strong>ity. Possibleexplanations for this includemismatches between driving needsand charging opportunities, or a lack<strong>of</strong> awareness or understanding <strong>of</strong> howto access the cost savings provided by<strong>electric</strong>-operation.Attribute i-MiEV LEAFAverage daily driving distance (km/day) 26.4 31.6Average energy economy (kWh/km) 0.150 0.183Daily <strong>electric</strong>ity cost ($/day) 0.99 1.45Weekly <strong>electric</strong>ity cost ($/wk) 6.93 10.12Saving relative to Mazda 3 SP20 (%) 56.1 46.4Table 4. Renewable <strong>electric</strong>ity operating costs for the <strong>trial</strong> household i-MiEV assignments (n = 45) and LEAF assignments (n = 31);GreenPower tariff assumed to be $0.25/kWh, Mazda 3 SP20 fuel economy = 6.1 L/100km, petrol price $1.40/L.CREATING A MARKET 41
4.2.5 What are the issuesand opportunities for <strong>electric</strong><strong>vehicle</strong>s in households?Electric <strong>vehicle</strong> technology, even asthe technology currently stands, holdsgreat promise for more widespreadadoption by households. Based uponthe results obtained, EVs are suitablefor drivers averaging up to around 50kilometres per day. For average dailydriving distances <strong>of</strong> 50-80 kilometres,alternate solutions would includeworkplace charging and/or PHEVs.Beyond this, HEVs and ICEVs wouldlikely be the best choice.However, the significant minority <strong>of</strong>drivers who did not accept the <strong>trial</strong><strong>electric</strong> <strong>vehicle</strong>s as their everydaytransport choice indicates that thetechnology is not for everyone. This sitsalongside the much greater number <strong>of</strong>people who simply aren’t aware <strong>of</strong> ordon’t know much about EVs.These observations have beencombined to form a conceptualmodel for <strong>electric</strong> <strong>vehicle</strong> take-upby households. Figure 23 shows thedifferent groupings <strong>of</strong> householdsaccording to where they sit againstthe key attributes <strong>of</strong> EV awareness,understanding and acceptance, andaverage daily driving distance. Eachhousehold grouping has been scaledto provide some indication <strong>of</strong> therelative size <strong>of</strong> this grouping. Thelargest grouping, the mainstreammarket, are potential EV adopterswho need to be made aware <strong>of</strong>, moreknowledgeable about and ultimatelymore accepting <strong>of</strong> the technology.Given that <strong>electric</strong> <strong>vehicle</strong>s are a viabletransport option for a majority <strong>of</strong>Victorian drivers, the clear obstacle totake-up is purchase price. Section 4.1.3provides a discussion on the potentialfor improvement in this area, howeversignificant change is required beforeEV technology becomes financiallyviable for the majority <strong>of</strong> households.Marketing <strong>of</strong> EVs to early-adoptersshould focus on technology anddriving pleasure/<strong>vehicle</strong> performance,backed up with messages relating tooperating costs and the environment.Interestingly, no difference wasobserved in the <strong>vehicle</strong> usebehaviours between early-adopterand mainstream market households.This suggests that these messagesmay remain effective through tomainstream market adoption, even ifthe emphasis should move towardscost savings.HIGHEarlyadoptersWorkplacechargersPHEVsAWARENESSUNDERSTANDING ANDACCEPTANCE OF EVsLOWMainstreammarketNon-EVdrivers< 50 km / day 50 – 80 km / dayAVERAGE DRIVING DISTANCEFigure 23. Conceptual model for <strong>electric</strong> <strong>vehicle</strong> take-up by households based upon <strong>trial</strong> results.
Experience from overseas suggeststhat non-financial measures can behighly effective in promoting consumeradoption <strong>of</strong> new <strong>vehicle</strong> technologies.In California single-occupant hybrid<strong>vehicle</strong>s were permitted to travel inhigh-occupancy <strong>vehicle</strong> (car-pooling)lanes from 2005 to 2011 (LA Times2011). Around 10,000 Clean Air Vehiclestickers were issued to cars that metstringent emissions and fuel efficiencystandards from 2005 to 2007 as part <strong>of</strong>efforts to promote consumer uptake.In the year the program began, sales<strong>of</strong> hybrid <strong>vehicle</strong>s increased from85,000 <strong>vehicle</strong>s nationally to 207,000,and continued growing to 353,000 in2007 when the last sticker was handedout. Once the stickers stopped beinghanded out, hybrid <strong>vehicle</strong>s with thesticker sold for more than $USD 1,000above comparable <strong>vehicle</strong>s withoutthe sticker. Although the programhas sunset for hybrid <strong>vehicle</strong>s, plugin<strong>vehicle</strong>s are now eligible andbeing marketed by manufacturersaccordingly (Ford 2012).4.3 FLEET VEHICLE ROLL-OUT4.3.1 What fleets areinterested in <strong>electric</strong><strong>vehicle</strong>s and why?Government fleets, particularly localgovernment, are a key market for<strong>electric</strong> <strong>vehicle</strong>s. Motivations relateprimarily to environmental objectivesfor their fleet operations or fortheir organisation more generally.Private sector interest has arisenpredominantly through the <strong>electric</strong>itymarket, motivated by businessplanning and/or brand-building.A breakdown <strong>of</strong> the fleet participantsin the <strong>trial</strong> according to sectorindicates that government fleets area key market for <strong>electric</strong> <strong>vehicle</strong>s,followed by the private sector – referto Figure 24. Further analysis <strong>of</strong>these segments indicates that localgovernment is the primary source <strong>of</strong>interest, representing nearly 30 percent <strong>of</strong> <strong>trial</strong> fleet participants overall.Within the private sector, participantsare most commonly sourced from the<strong>electric</strong>ity market, with three out <strong>of</strong>five being goods and service providerswithin this sector.Fleet interest in <strong>electric</strong> <strong>vehicle</strong>s isstrongly motivated by environmentalcommitments relating to their fleetoperations. Figure 26 illustrates thisthrough the results <strong>of</strong> a survey <strong>of</strong>attendees at EV-related workshopstargeted at fleet managers.Higher education 9%Private sector 38%Government 47%Not-for-pr<strong>of</strong>it 6%Figure 24. Sectoral breakdown <strong>of</strong> fleets participating in the Victorian Electric Vehicle Trial (n = 41).CREATING A MARKET 43
EARLY ADOPTER FLEETS CASE STUDYLOCAL GOVERNMENT FLEETS IN AUSTRALIAThe third tier <strong>of</strong> Australian government, local government, is responsible for community needs such astown planning, waste collection and recreational facilities (Aust Govt 2012). There are about 560 localgovernment bodies in Australia, employing around 178,000 people (ALGA 2012). About one in four localgovernment bodies are ‘cities’, the name historically given to urban or suburban local government areas(Wiki 2012).In 2008 a survey was undertaken <strong>of</strong> local government fleet operations (ICLEI 2009). The survey gatheredresponses from 58 urban and 9 rural councils participating in the Cities for Climate Protection program,representing 8 per cent <strong>of</strong> all Australian local government bodies at the time. Councils <strong>report</strong>ed on atotal <strong>of</strong> 12,097 <strong>vehicle</strong>s, <strong>of</strong> which around two thirds were passenger and light commercial <strong>vehicle</strong>s.Of the councils who took part in the survey, almost three quarters <strong>report</strong>ed having specific goals orobjectives in place relating to the environmental performance <strong>of</strong> their fleet.Local government procurement methods include autonomous procurement by individual councils,demand aggregation through state government contracts or third party aggregators, and regionalprocurement clusters (Ernst & Young 2008). Third party demand aggregation contracts exist for both<strong>vehicle</strong> and fuel procurement (Local Government Procurement 2012, Procurement Australia 2012). InVictoria, local government expenditure on <strong>vehicle</strong> purchasing in 2006/07 was estimated to be$65–70 million (Ernst & Young 2008).On a separate but related note, <strong>trial</strong> experience has found that the majority <strong>of</strong> local government fleetsoperate from sites which are owned by them. This is good news in the context <strong>of</strong> charging infrastructureroll-out. However, differences arise in the <strong>vehicle</strong> assignment (such as pool, tool-<strong>of</strong>-trade), and overnightgaraging <strong>of</strong> <strong>vehicle</strong>s (which may be at the depot or at employees’ homes).Most local government fleets operate one or more fuel-card systems that allow staff to refuel <strong>vehicle</strong>s onan as-needs basis and according to the internal rules-<strong>of</strong>-use, and require staff to fill out log-sheets forreconciliation with Fringe Benefits Tax.Figure 25. City <strong>of</strong> Kingston <strong>trial</strong> <strong>vehicle</strong>.
In <strong>term</strong>s <strong>of</strong> who drives the decisionmaking,attendees to the fleet EVworkshops were asked about previousdecision-making around deployment<strong>of</strong> the Toyota Prius hybrid <strong>vehicle</strong> intotheir fleet. According to responsesfrom those attendees who had a Priusand knowledge <strong>of</strong> the factors behindthe procurement decision, the FleetManagement team was identified ashaving the strongest influence, ahead<strong>of</strong> the CEO/Executive team and theEnvironment team – refer to Figure 27.Does your organisation have any environmental commitments relatingto your fleet purchasing/operations?No, but are expectingthere will be in futureDon’t knowYesBuilding on this, attendees atthe workshops were asked aboutmeasures that would most effectivelypromote EV adoption by their fleetwithin the next two years. Withreference to Table 5, attendees were<strong>of</strong> the view that getting buy-in fromtheir senior management held themost promise in <strong>term</strong>s <strong>of</strong> influencingtheir organisation’s EV uptake.When making the decision to adopt a hybrid into your fleet, who do youbelieve had the most influence on this decision?Environment team 23%CEO/Executive team 30%Fleet Management team 47%Figure 26 (Top). Survey responses from attendees at three EV workshop events staged in 2012, where the response‘No and not expecting any’ was not selected by any attendees (n = 39).Figure 27 (Above). Survey responses from attendees at three <strong>electric</strong> <strong>vehicle</strong> workshops held in 2012, where the response ‘Marketing’was not selected by any attendees (n = 30).CREATING A MARKET 45
4.3.2 How do fleets use<strong>electric</strong> <strong>vehicle</strong>s?At this early stage <strong>of</strong> the market,corporate fleets are predominantlyusing EVs to evidence theirCorporate Social Responsibility(CSR) commitments and to gatherinformation in support <strong>of</strong> forwardbusiness planning. These deploymentdecisions are contributing to relativeunder-utilisation <strong>of</strong> the <strong>vehicle</strong>s in<strong>term</strong>s <strong>of</strong> distance travelled.With reference to Table 6, theaverage daily distance travelled bythe <strong>trial</strong> <strong>vehicle</strong>s when operatingas part <strong>of</strong> corporate fleets issignificantly less than for otherVictorian fleet applications.Feedback from the <strong>trial</strong> fleetparticipants indicates that deploymentdecisions have been the strongestinfluence on this relative underutilisation.Customer, staff andcommunity engagement activitieswere prioritised by most <strong>trial</strong>participants, in between which the<strong>vehicle</strong>s were <strong>of</strong>ten moved aroundto gain insights into their suitabilityfor different service duties. Thishas translated to reduced distancestravelled relative to purely-operational<strong>vehicle</strong>s over the nominal three-month<strong>trial</strong> <strong>vehicle</strong> assignment periods.While the <strong>trial</strong> fleet participants wereon the whole very positive about theirEV experience, other issues were notedthat may have also contributed to thisrelative under-utilisation:• The ‘EV learning curve’ in <strong>term</strong>s<strong>of</strong> trip planning, charging andrange management was citedas a major barrier to use,particularly in situations wherethe <strong>vehicle</strong> was relativelyunsupported in <strong>term</strong>s <strong>of</strong> a‘champion’ to promote and assist• The 12 volt battery issue for thei-MiEV in particular (refer Section4.1.2) was cited as a deterrent foruse by some fleet operators.OptionAverage score(out <strong>of</strong> 5)Std devGaining strong top-down commitment from senior management within your organisation 4.2 0.8Access to an independent EV coalition to potentially reduce up-front costs and provide broadassistance with EV roll-out4.1 0.7Providing more options for improved visibility <strong>of</strong> EVs such as dedicated on-street charging sites 3.9 0.8Improving the processes required for installing EV infrastructure on your premises to reducecosts and streamline installation3.9 0.9Assistance with efficient charge management strategies to maximise the utilisation <strong>of</strong> your EV 3.8 0.6Providing information packages on effective EV roll-out for fleet managers 3.8 0.7More concrete information on the environmental benefits <strong>of</strong> EV technology 3.8 0.9ApplicationAverage daily driving distance (km)Victorian EV Trial fleet participants 22Victorian EV Trial household participants 32Vehicle with privately-paid running costs – Melbourne metro (DOT 2012a) 33Vehicle with company-paid running costs – Melbourne metro (DOT 2012a) 54Victorian Government pool fleet average (DTF 2012) 77Table 5 (Top). Results from a survey <strong>of</strong> EVs & Fleets 2012 workshop attendees on their opinions <strong>of</strong> the options to promote adoption<strong>of</strong> EVs by their corporate fleet (n = 32; “In the NEXT TWO YEARS which <strong>of</strong> these do you think would PROMOTE the adoption <strong>of</strong> EVsby your fleet?”; marks out <strong>of</strong> 5 where 5 = strongly agree and 1 = strongly disagree)Table 6 (Above). Average daily driving distances for fleet <strong>vehicle</strong>s – a relative comparison
Despite this relative under-utilisation,fleet participants were generally verypositive about their <strong>electric</strong> <strong>vehicle</strong>experience, indicating that the <strong>vehicle</strong>shad been successful in promotingtheir organisation and informingfuture business planning. Corporatesustainability/branding, environmentalbenefits, operational cost and futuretotal cost <strong>of</strong> ownership savings wereall cited as important benefits <strong>of</strong>EV uptake by fleets following their<strong>trial</strong> involvement.4.3.3 How much does it costfor an average fleet to runan EV?Fleet EV energy costs provide around60 per cent saving on a comparablepetrol <strong>vehicle</strong>, even allowing forrenewable energy purchase in support<strong>of</strong> ‘zero emissions driving’. Challengesexist in making reliable calculations<strong>of</strong> PHEV operating costs which mayprevent their benefits from beingrealised by fleet operators.Based upon the energy economyfigures obtained for the different<strong>vehicle</strong> types, energy costs perkilometre can be calculated – refer toTable 7. These figures are based upona commercial <strong>electric</strong>ity tariff thatincludes an additional component forrenewable energy.Much <strong>of</strong> what is written in Section 4.2.4about the household costs <strong>of</strong> runningan <strong>electric</strong> <strong>vehicle</strong> applies to the fleetassessment also.Due to the disconnect between the<strong>vehicle</strong> driver and the fleet manager,the challenges in accounting for energyuse and by extension the operatingcosts <strong>of</strong> PHEVs are more significantfor fleets than for households (DOT2012d). A recent news item from theNetherlands tells <strong>of</strong> PHEVs whichare being operated solely on petrol(Autoblog 2012a) in spite <strong>of</strong> a likelyfinancial incentive to do otherwise.This may be partly explained by thedifficulties in accessing informationthat highlights the cost advantage fromoptimised <strong>electric</strong>-only operation.4.3.4 What are the issuesand opportunities for <strong>electric</strong><strong>vehicle</strong>s in fleets?EVs currently provide fleets withthe opportunity to showcase theirorganisation’s ‘brand’ through a highlyvisible and engaging corporate asset.However, the cost <strong>of</strong> <strong>electric</strong> <strong>vehicle</strong>ownership for fleets is currentlyprohibitive in both financial and nonfinancial<strong>term</strong>s, and technical barriersexist in relation to range/charging. Thesignificance <strong>of</strong> these items is expectedto change as the EV market evolves,moving the emphasis towards theoperational cost advantages <strong>of</strong>EV technology.The brand-building benefits <strong>of</strong> EVs aremost beneficial for organisations withenvironmental or CSR commitments,and/or business alignment withEV technology in some way. Basedupon the <strong>trial</strong> experience, theseorganisations are predominantly(local) government, or <strong>electric</strong>itymarket or <strong>electric</strong>al goods and serviceproviders. Surveys <strong>of</strong> the <strong>trial</strong> fleetparticipants found that the <strong>vehicle</strong>swere very effective promotional toolsfor these organisations.Further investigation indicates thatmany fleets are recognising themarketing value <strong>of</strong> the <strong>vehicle</strong>s withinthe business case to support EVpurchase. Specifically, the purchaseprice difference between an EV anda comparable ICE <strong>vehicle</strong> is beingaddressed through a contribution fromthe organisation’s marketing budget.This approach also addresses theresidual value risk <strong>of</strong> EVs, wherebythe expected high rate <strong>of</strong> depreciationfor the new technology can be dealtwith as part <strong>of</strong> the business case byeffectively ‘writing <strong>of</strong>f’ the marketingbudget contribution to the originalpurchase price.Attribute i-MiEV LEAFAverage energy economy (kWh/km) 0.150 0.179Renewable <strong>electric</strong>ity cost ($/km) 0.030 0.036Saving relative to Mazda 3 SP20 (%) 64.9 58.1Table 7. Renewable <strong>electric</strong>ity operating costs for the <strong>trial</strong> fleet participants; GreenPower tariff assumed to be $0.25/kWh,Mazda 3 SP20 fuel economy = 6.1 L/100km, petrol price $1.40/L.CREATING A MARKET 47
Recognising this near-<strong>term</strong> marketingobjective, relevant insights gainedfrom <strong>trial</strong> fleet <strong>electric</strong> <strong>vehicle</strong>roll-out included:• The i-MiEV’s distinctiveappearance provided animmediate advantage relative tothe more conventional-lookingNissan LEAF – this is consistentwith historical observationsregarding the Toyota Prius and itssales performance relative to lessdistinctiveHEV competitors• Design and application <strong>of</strong> eyecatchingand informative brandingfor the <strong>trial</strong> <strong>vehicle</strong>s was perhapsthe most crucial success factor forthe <strong>trial</strong> fleet participants (referto Figure 28) – the availability<strong>of</strong> exterior <strong>vehicle</strong> dimensionsand/or design data, along withgood relationships with <strong>vehicle</strong>livery designers/applicators wereimportant ingredients to delivery<strong>of</strong> the <strong>vehicle</strong> branding• Ensuring the <strong>vehicle</strong> was fullyintegratedwith the organisation’swider internal/external marketingefforts was an important startingpoint for the successful <strong>trial</strong> fleetparticipants – online videos <strong>of</strong> thebranded <strong>vehicle</strong> were a popularchoice by the more successfulparticipants, as was integrationinto messaging around renewableenergy use strategies alreadybeing pursued• Advanced marketing strategiesincluded use <strong>of</strong> visible charginglocations/opportunities, such ascharging outlets located in front <strong>of</strong>the fleet’s own corporate premises– this builds on the observationthat ‘plugged-in’ <strong>vehicle</strong>s are mosteffective at engaging passers-by• The environmental bona fides <strong>of</strong>the <strong>vehicle</strong>s were underwrittenby the former <strong>Department</strong> <strong>of</strong><strong>Transport</strong>’s ‘zero emissions’ <strong>trial</strong>commitment (DOT 2012) – thisallowed the fleet operators toconfidently leverage the nominalenvironmental benefits <strong>of</strong> thetechnology.Despite the clear promotionalbenefits from EV acquisition andsuccessful <strong>trial</strong> experience, only three<strong>trial</strong> fleet participants are knownto have acquired their own <strong>vehicle</strong>sfollowing participation. The primaryobstacle cited by participants isprice, although the range/chargingissues were also cited as a significantobstacle to uptake.The business case for <strong>electric</strong> <strong>vehicle</strong>acquisition is strongly dependentupon upfront purchase price and theresidual value at the time <strong>of</strong> disposal.By way <strong>of</strong> example, in recent timesthe Victorian Government has turned<strong>vehicle</strong>s over at service intervals<strong>of</strong> three years or 60,000 kilometres(whichever came first).Figure 28. An example <strong>of</strong> the <strong>trial</strong> fleet <strong>vehicle</strong> branding
Within the traditional fleet assetmanagement model, the operationalcost savings within this period mustexceed the initial purchase pricepenalty and residual value riskassociated with <strong>electric</strong> <strong>vehicle</strong> uptake.This is summed up by the response<strong>of</strong> one fleet manager to an <strong>electric</strong><strong>vehicle</strong> supply proposal:They’ve said they can do an EV for thesame total package cost over threeyears as one <strong>of</strong> my current <strong>vehicle</strong>s –but if I’m not going to save anything,why would I bother?Victorian fleet manager, 2012A range <strong>of</strong> opportunities exist toaddress these issues, some <strong>of</strong> whichare being addressed through theVictorian Electric Vehicle Trial:• Fleet purchasing coalition –combining the EV procurementactivities <strong>of</strong> a number <strong>of</strong>organisations is beneficial forsuppliers and customers alike(refer Local Government fleetsbreakout in Section 4.3.1). Tothis end the <strong>trial</strong> has partneredwith The Climate Group andSouth Australian Governmentto investigate a fleet purchasingcoalition for Australia, the resultsfrom which will be released inearly 2013• Market competition – by creatingconsumer interest and removingbarriers to market access, the<strong>trial</strong> is seeking to attract more<strong>vehicle</strong>s into the market and indoing so create competition thatwill have a downwards influenceon <strong>vehicle</strong> prices• Marketing contribution –as described above, some fleetsare seeking to address the initialpurchase price/residual valuerisk issue through a contributionfrom their marketing budget,however this approach is not likelyto extend much beyond the first<strong>vehicle</strong> purchase by any fleet• Guaranteed buy-backs – the <strong>trial</strong>EV residual value risk for VictorianGovernment was addressed withguaranteed buy-back priceslocked in at the time <strong>of</strong> purchasewith both Nissan and Mitsubishi;these experiences can be expectedto inform the business planning<strong>of</strong> both organisations as theyapproach EV fleet salesmore broadly.An additional cost issue identifiedas part <strong>of</strong> the fleet roll-out is theresource commitment associatedwith successful deployment <strong>of</strong> EVs.Compared to conventional <strong>vehicle</strong>s,there are significantly higher overheadsassociated with the business casedesign, procurement process, chargingstrategy design and implementation,<strong>vehicle</strong> management, projectcommunications and marketing,and staff training. In addition,organisations must acquire theknowledge and skills to complete thesetasks in order to realise the benefitsfrom their EV investment.TimeDescription9:00 – 9:10 Introduction9:10 – 9:30 EV technology 1019:30 – 10:00 Procurement options panel discussion10:00 – 10:30 Practical roll-out plan10:30 – 10:50 Morning tea / networking / charging outletdemonstrations10:50 – 11:30 Staff engagement and training panel discussionBenchmarking <strong>of</strong> the <strong>trial</strong> fleetparticipant experiences informedthe design <strong>of</strong> two half-day trainingworkshops delivered in early 2012 toaddress the information barriers tosuccessful EV roll-out by corporatefleet operators. The topic breakdownfrom these workshops is provided inTable 8, with additional information inAppendix A – Victorian EV Trial corporateparticipants.11:30 – 12:00 Future business planning12:00 – 12:30 Realising the value <strong>of</strong> your investment12:30 – 1:15 Lunch / networking / EV test-drivesTable 8. EVs and Fleets 2012 training workshop agenda.CREATING A MARKET 49
One <strong>of</strong> the objectives <strong>of</strong> the guidanceabove is to optimise the <strong>vehicle</strong>utilisation once in-service, and withthis the operational cost savings. Animplication <strong>of</strong> the observed underutilisation<strong>of</strong> the <strong>trial</strong> <strong>vehicle</strong>s isthe reduced operational cost savinginput into the total cost <strong>of</strong> ownershipbusiness case. This will work againstEV uptake, which means addressingbarriers to <strong>vehicle</strong> utilisation should bea priority to promote fleet adoption.The inter-related issues <strong>of</strong> limitedrange, long charging times and a lack<strong>of</strong> widespread charging infrastructureavailability were cited by <strong>trial</strong> fleetparticipants and attendees at the fleetworkshops as a major barrier to morewidespread fleet adoption <strong>of</strong> EVs.Options to address this include:• Larger <strong>vehicle</strong> batteries – thiswould increase range, but at theexpense <strong>of</strong> purchase price andcharging time• Faster charging – next-generationEVs are likely to be capable <strong>of</strong>drawing 32 amps, which willeffectively halve the current‘standard’ charging times;sufficient <strong>electric</strong>al supply mustbe available or installed to supportthe increased demand (refer toSection 5.1)• Public charging network –including specifically quickcharging and/or battery swap,would greatly increase theeffective range <strong>of</strong> the <strong>vehicle</strong>s,or possibly even support reducedbattery size/<strong>vehicle</strong> cost forhighly predictable <strong>vehicle</strong>applications that align with thecharging network• Corporate charging network –including charging locations atcorporate sites, staff residencesand common corporate fleetdestinations (such as customerfacilities); this approach mayprovide additional brand-buildingbenefits (by increasing the visibility<strong>of</strong> the <strong>vehicle</strong>s whilst plugged-inat strategic locations), as wellas the battery size/<strong>vehicle</strong> costoptimisation described above.The contrasting nature <strong>of</strong> these optionshighlights the importance <strong>of</strong> fleetservice duty analysis and matchingto the EV/charging solution. Serviceduties may include tool-<strong>of</strong>-trade, pool,executive, and a range <strong>of</strong> other specificpurpose <strong>vehicle</strong> applications. Of these,<strong>vehicle</strong>s which return to a centrallocation are more easily supportedwith a simple charging solution;however <strong>vehicle</strong>s which operate onpredictable and relatively high mileageroutes provide potentially the greatestopportunity for EVs. By way <strong>of</strong> example,salary-packaged <strong>vehicle</strong>s for staff thatcommute relatively long distances maybe supported with a home/workplacecharging strategy that will deliversignificant savings in transport energycosts that may be shared between boththe employer and the employee.Discussions with the <strong>trial</strong> fleetparticipants found that those whohad most successfully integrated the<strong>electric</strong> <strong>vehicle</strong>s into their operationalfleet were:• Designating an <strong>electric</strong> <strong>vehicle</strong>‘champion’ who can manage andpromote the <strong>vehicle</strong>/s, and trainand support staff• Mostly assigning the <strong>vehicle</strong>s tosmall groups <strong>of</strong> (enthusiastic)staff, who could becomefamiliar with the <strong>vehicle</strong> throughregular use and <strong>report</strong> on theirexperiences to others• Providing staff with one-on-one/tailored training in use <strong>of</strong> the EV(EV meet’n’greet sessions werepopular, and one large fleetoperator developed an onlinetraining/assessment tool)• Actively promoting the EV to staff,and characterising it as new,exciting and interesting• Providing feedback to staff ontheir own and their organisation’sEV experience.Conversely, the various issues thatmake up the <strong>electric</strong> <strong>vehicle</strong> learningcurve were routinely cited by fleetsin instances where operational use<strong>of</strong> the <strong>vehicle</strong>s had either not beenattempted or was less than successful.Noting the non-existent or less-thanidealnature <strong>of</strong> the route-planningand charge-management technologyemployed in the <strong>trial</strong> (refer to Sections4.1.1 and 5.1.1), these issues may beat least partly addressed by improvedtechnology for management <strong>of</strong>the <strong>vehicle</strong>.
CORPORATE CHARGING NETWORK CASE STUDYNHP ELECTRICAL ENGINEERING PRODUCTSAs a supplier <strong>of</strong> indus<strong>trial</strong> <strong>electric</strong>al and automation products, NHP’s core business is in goodalignment with EV technology. NHP also have a commitment to environmental sustainability,including through a Sustainability Centre where many <strong>of</strong> their products are evaluated anddemonstrated in renewable energy applications. This background has meant that NHP wereideally placed for participation in the Victorian Electric Vehicle Trial.NHP have taken a holistic outlook towards translating this strategic alignment to theirfleet operations through their corporate EV charging strategy:• To maximise visibility, an EV charging solution has been installed out the front <strong>of</strong> NHP’scorporate headquarters• To maximise <strong>vehicle</strong> utility, an EV charging solution has been installed at the most common parkinglocation for the <strong>vehicle</strong> at NHP’s manufacturing and distribution centre, around 25 kilometresfrom their corporate headquarters• To support their standard fleet practices, charging outlets have been installed at some <strong>of</strong> the moredistant NHP staff residences to allow the EVs to be garaged at these locations overnight.As a result <strong>of</strong> their corporate <strong>electric</strong> <strong>vehicle</strong> charging strategy, NHP have averaged nearly doublethe daily EV driving distance for the <strong>trial</strong> fleet participants, at 41 kilometres per day (km/day) for thei-MiEV and 46 km/day for the LEAF (at the halfway point for that <strong>vehicle</strong> assignment). Over this sametime, NHP have <strong>trial</strong>led the <strong>vehicle</strong>s in a number <strong>of</strong> different fleet service duties, and leveraged the<strong>trial</strong> <strong>vehicle</strong>s for promotional opportunities. Should they go on to deploy EVs in their fleet operations,it is not unreasonable to expect that NHP will record much greater average daily driving distanceseven using the current generation <strong>of</strong> EV technology.Figure 29. NHP ElectricalEngineering Products branded<strong>trial</strong> <strong>vehicle</strong> parked in front<strong>of</strong> their SustainabilityCentre, located at theirmanufacturing anddistribution centre inLaverton North.CREATING A MARKET 51
CHARGINGINFRASTRUCTUREROLL-OUTThe Victorian ElectricVehicle Trial charginginfrastructure roll-outhas sought to establishthe foundations <strong>of</strong>Victoria’s EV chargingnetwork as an open andcompetitive market <strong>of</strong>different technologiesand business models.The department hasacted as an ‘honestbroker’ in the formation<strong>of</strong> this new market,insulating providers,hosts and users fromcommercial andnon-commercial risk.
Nearly 140 household, fleetand publicly-accessiblecharging outlets have beendeployed up to the <strong>mid</strong>-point<strong>of</strong> the <strong>trial</strong>. Providers haverolled out the infrastructurethrough a non-prescriptiveapproach beyond basic‘rules <strong>of</strong> engagement’developed in consultationwith key stakeholders.Deployment and operation<strong>of</strong> the charging infrastructurehas been benchmarked,providing insights into theissues and opportunitiesassociated with this newmarket. An understanding<strong>of</strong> costs and benefits hasbeen obtained, which willinform planning critical tothe successful uptake <strong>of</strong><strong>electric</strong> <strong>vehicle</strong>s.5.1 CHARGING INFRASTRUCTURE5.1.1 What are thearrangements for the <strong>trial</strong>charging infrastructure?The <strong>trial</strong> charging infrastructureis delivered under a model whichaddresses the early-market investmentrisks for the relevant parties. Thedelivery model has also sought toidentify least-cost approaches toinform cost benchmarking activities,and facilitate creation <strong>of</strong> a legacy<strong>electric</strong> <strong>vehicle</strong> charging networkfor Victoria.The former <strong>Department</strong> <strong>of</strong> <strong>Transport</strong>engaged charging infrastructureproviders under service provisionagreements that provide a frameworkfor the infrastructure delivery,operation, removal and transition <strong>of</strong>responsibilities – refer to Figure 30:CHARGINGINFRASTRUCTUREOPERATOR• Once installed, the charginginfrastructure operates for theperiod <strong>of</strong> <strong>trial</strong> participation• Towards the end <strong>of</strong> this period,the charging infrastructureoperator provides the site owner/occupant with an <strong>of</strong>fer to retainthe infrastructure• The negotiation <strong>of</strong> this <strong>of</strong>feris undertaken by both partiesdrawing upon the knowledgeacquired through <strong>trial</strong>participation, allowing them tomore clearly understand the costsand benefits involved• If no agreement is reached, thecharging infrastructure is removedand the site remediated to the siteowner/occupant’s satisfaction.CHARGINGINFRASTRUCTUREOPERATORCharging infrastructureservice agreementVictorianGovernmentOffer to retain charginginfrastructureOpen marketcommercialagreementCharging infrastructurehost agreementSITE OWNERSITE OWNERTRIAL MODELPOST-TRIAL MODELFigure 30. Schematic <strong>of</strong> the commercial model developed for the <strong>trial</strong> charging infrastructure.CREATING A MARKET 53
With reference to Figure 5, thelocation <strong>of</strong> the charging outlet drivesmuch <strong>of</strong> the costs associated withthe charging circuit. As the decisionon location generally rests with thesite owner/occupier, under the <strong>trial</strong>arrangements, they bear the costs<strong>of</strong> the charging circuit. Householdswere an exception to this, howeversome contribution to the costs wassought in instances where either theyinsisted upon a solution other thanthe least-cost approach, or an<strong>electric</strong>al supply upgrade to theirproperty was required (which is ageneral home improvement).5.1.2 What charginginfrastructure is beingused in the <strong>trial</strong>?In recognition <strong>of</strong> the very early state<strong>of</strong> the market development, a range<strong>of</strong> providers have been engaged forthe <strong>trial</strong> household, fleet and publiccharging outlets.As a result <strong>of</strong> the March 2010 EOIprocess, a range <strong>of</strong> EV charginginfrastructure technology and serviceproviders were engaged in support <strong>of</strong>the <strong>trial</strong>. These were supplementedby additional technology and serviceproviders who joined the <strong>trial</strong> to accessa range <strong>of</strong> benefits, including gainingexperience in charging the range <strong>of</strong><strong>trial</strong> <strong>vehicle</strong>s or simply in support<strong>of</strong> information exchange. The list <strong>of</strong>charging infrastructure providerstaking part in the <strong>trial</strong>, their role andthe equipment supplied is detailedin Table 9.5.1.3 What are the relevantfeatures <strong>of</strong> the <strong>trial</strong> charginginfrastructure?The <strong>trial</strong> charging outlets are <strong>of</strong>‘Level 2’ standard and have minimumrequirements relating to <strong>vehicle</strong>compatibility, data provision and safety.Beyond this, the charging outletsare proprietary solutions tailoredto the specific application. Throughbenchmarking and consultation, a list<strong>of</strong> relevant attributes has been definedto inform procurement processes fordedicated EV charging outlets.As a minimum requirement, <strong>trial</strong>charging outlets need to be compatiblewith the <strong>vehicle</strong>s and have enhancedsafety and data collection/managementcapabilities relative to conventionalwall sockets. Additional features areincluded according to the needs <strong>of</strong>the site, for example a public siterequires enhanced security anddamage protection.According to the industry <strong>term</strong>inology,the charging infrastructure deployedin the <strong>trial</strong> was <strong>of</strong> ‘Level 2’ standard.This means that it is a 240 voltcircuit (standard for Australia), andincludes some interaction with the<strong>vehicle</strong> as set out by the SAE J1772technical specification as part <strong>of</strong> thecharging activity initiation. At the <strong>trial</strong>outset, ‘Level 1’ standard charginginfrastructure was deployed in <strong>term</strong>s<strong>of</strong> <strong>vehicle</strong> interaction due to the <strong>trial</strong>Mitsubishi i-MiEV <strong>vehicle</strong> specification.In 2011 a modification was made to the<strong>vehicle</strong>s to allow for standardisation <strong>of</strong>the charging infrastructure to Level 2specification (refer to Section 5.1.4 forfurther explanation <strong>of</strong> this).Although the <strong>trial</strong> <strong>vehicle</strong>s only draw15 amps current maximum, the <strong>trial</strong>charging circuits are standardised to‘future-protect’ for the next-generationEVs that are expected to draw 32 amps.However, for locations with insufficient<strong>electric</strong>al supply this specificationwas de-rated to 16 amps to avoidcostly upgrades.
The <strong>trial</strong> charging infrastructure varieswidely in user feedback and networksupport. All charging outlets providefeedback at the point <strong>of</strong> use. Howeverthis varies from a simple beep/flashinglight to indicate changes in operationalstatus, to LCD screens able to provideguidance, promotional and/or chargingactivity information. While it maybe argued that more information isbetter, the cost trade-<strong>of</strong>f is generallynot insignificant. An example <strong>of</strong> thisis stand-by power consumption. Fora charging outlet equipped with an‘always on’ LCD screen, this mayequate to an additional 20 per centenergy consumption for a typicalhousehold EV driver (DOT 2012c).Although all charging outlets arenominally networked, only someprovide network visibility from theuser perspective. One networkoperator provides users with real-time/remotely-accessible information onthe charging status <strong>of</strong> their outlets,charge management capability and asuite <strong>of</strong> data analytics. Other networkoperators provide reduced levels<strong>of</strong> support, due to the point they’vereached in their Australian businessdevelopment and/or overall corporatestrategy/business model.Three quick chargers were contractedfor delivery at the start <strong>of</strong> the <strong>trial</strong> in2010. As <strong>of</strong> December 2012, a site workorder has been released for one quickcharger and an agreement-in-principlereached for another.Benchmarking <strong>of</strong> a procurementactivity undertaken by the SouthernCalifornia Association <strong>of</strong> LocalGovernment informed a survey <strong>of</strong>the <strong>trial</strong> charging infrastructureproviders on the relevant features forspecification <strong>of</strong> charging infrastructure.These attributes should be consideredby any entity procuring dedicated EVcharging outlets. For more information,refer to Appendix C – Charging outletattribute list.ProviderBetter PlaceBoschChargePointClub AssistDiUS Computing(ChargeIQ)ECOtality (Blink)General Electric(GE)JuicepointSiemensTrial roleContractedservice providerCharginginfrastructureoperatorContractedservice providerCharginginfrastructureoperatorContractedservice providerContractedservice providerCharginginfrastructureoperatorTrial partner(observer role)Trial partner(observer role)Equipment supplied / operatedHousehold Fleet Public Other27 7 4 -2 2 - -31 11 2 Quick charger provider(x 2)- - 1 SAE J1772 af<strong>term</strong>arket<strong>vehicle</strong> solution (x 2);Mobile charging solution(roadside assistance)18 - - Grid-integrated chargingsolution (‘ZigBee’communications protocol)21 6 6 -- - 1 -- - - -- - - -Total 99 26 14Table 9. Breakdown <strong>of</strong> charging infrastructure providers and equipment taking part in the Victorian Electric Vehicle Trial as <strong>of</strong>December 2012.CREATING A MARKET 55
5.1.4 How do users ‘roam’across the <strong>trial</strong> charginginfrastructure network?Participants have been able touse the various charging outletsprovided under the <strong>trial</strong> through theprovision <strong>of</strong> cables to match <strong>vehicle</strong>sto charging outlets, RFID cards toactivate the outlets, and informationto guide planning and use. Paymentfor use has generally occurredthrough the underlying <strong>electric</strong>itybilling arrangements for the site.Arrangements for the <strong>trial</strong> have beennegotiated on a business-to-businessbasis by the <strong>Department</strong>, includingwith <strong>vehicle</strong> suppliers, charginginfrastructure providers and hosts.Despite general agreement on thegoal for streamlined network roamingcapability, there is limited appetite foran industry standard at this stage <strong>of</strong>the market development due primarilyto cost/time constraints.Drawing upon the model provided byNous (2010), roaming by users acrossdifferent charging outlets and serviceproviders is underpinned by basicelements <strong>of</strong> system ‘interoperability’:1. Physical compatibility – the<strong>electric</strong>al connection plugconfiguration must match theoutlet2. Systems compatibility – the onboard<strong>vehicle</strong> system must beable to interact with the chargingoutlet controller3. Financial reconciliation –arrangements must be in placeto allow for the various costsassociated with the chargingactivity to be reconciled4. User information – users mustknow where to find chargingoutlets and how to use them.Various layers <strong>of</strong> complexity may beadded to these elements to supportmore advanced system models.By way <strong>of</strong> example, identification<strong>of</strong> users as part <strong>of</strong> the systemscompatibility will allow for moreadvanced financial reconciliationthrough user accounts and acrosscharging infrastructure providers.At the start <strong>of</strong> the <strong>trial</strong>, some <strong>of</strong> theissues included physical and systemscompatibility. Some fixes were neededto allow for basic user roaming:• Each charging infrastructureprovider technology has its ownsystem activation strategy mostlyutilising proprietary RFID cards –each <strong>trial</strong> participant is assigneda unique set <strong>of</strong> RFID cards forthe relevant vendors, which alsoenables charging activity data tobe reconciled to individual users• One charging infrastructureprovider adopted the IEC 62196‘Mennekes’ connectors asopposed to the SAE J1772 asfeatured by the <strong>trial</strong> <strong>vehicle</strong>s – inaddition to their existing cables,each <strong>trial</strong> <strong>vehicle</strong> was kitted outwith a ‘floating’ cable that utilisedthe SAE standard on the <strong>vehicle</strong>endand the Mennekes standardon the infrastructure-end• The Model Year (MY) 2010Mitsubishi i-MiEVs were found touse a superseded specificationfor the on-<strong>vehicle</strong> charging outlet,resulting in varying degrees <strong>of</strong>physical incompatibility withthe charging infrastructure –modifications <strong>of</strong> the chargingcables were required to ensurephysical compatibility withthe <strong>vehicle</strong>s• The MY2010 i-MiEV and the UKproduction-specification MY2011Nissan LEAFs utilised differentcharging protocols, preventingthem from being charged fromthe same specification outletsand ensuring network systemcompatibility – a modificationto the MY2010 i-MiEV chargingoutlet was undertaken to allowit to be charged using the SAEJ1772 Level 2 charging protocol,supported by warranties from thecharging infrastructure providers• The Toyota Prius PHEV preproductionprototype <strong>vehicle</strong>swere found to use an unfamiliarcharging protocol for many <strong>of</strong> thecharging infrastructure providers– this required some adaptationby the charging infrastructureproviders to ensure systemcompatibility• A commercial charging stationusing the SAE J1772 standardwas installed at a site whereaf<strong>term</strong>arket EV conversions werein operation, necessitating a<strong>vehicle</strong>-based solution to allowfor both physical and systemcompatibility – the charginginfrastructure provider ClubAssist were able to provide acertified af<strong>term</strong>arket solutionthat was accepted by the othercharging infrastructure providersto allow for <strong>vehicle</strong> roamingacross the network.
Through these efforts, <strong>trial</strong> participantscan use the network <strong>of</strong> chargingoutlets operated by seven providers.They are assured <strong>of</strong> physicalcompatibility (the plugs match thesockets), systems compatibility (RFIDcards and <strong>vehicle</strong> responses willactivate the charging sequence), andare provided with sufficient informationto allow them to navigate their wayaround the charging network and usethe equipment.Financial reconciliation <strong>of</strong> chargingactivities was an issue <strong>of</strong> muchdiscussion at the outset <strong>of</strong> the <strong>trial</strong>.A discussion paper was authored forthe most complicated <strong>of</strong> scenariosrelating to on-street charging (DOT2011), however the outcome haslargely defaulted to the site owner andbilling recipient for the <strong>electric</strong>ity usedby the charging outlet paying for the<strong>electric</strong>ity costs associated with use.The main influence on this outcomehas been the transaction costsassociated with processing a relativelynovel transaction as compared tobusiness-as-usual.The only instances where costs havebeen associated with the chargingactivity are when the financialtransaction is not automated (notethat a charging activity ‘flat-rate’has been adopted in these instancesto avoid the on-selling <strong>of</strong> <strong>electric</strong>itythat is prohibited under <strong>electric</strong>itymarket rules).User information has beenstandardised in <strong>term</strong>s <strong>of</strong> a commoninformation source (the <strong>trial</strong> website)and typology (charging outletdescription, access arrangements,signage). The preferred approach toutilise Google maps as the primarynetwork information source wasconfounded by the need for a postcardcontaining the activation code forthe listing to be sent to the listingbusiness address.As charging outlets are unmannedfacilities, it proved impossible to havethese postcards be received andthe listing activated. At this point intime, the <strong>trial</strong> webpage ‘Where do Icharge my car?’ remains the primaryinformation source for <strong>trial</strong> participantsseeking to navigate their wayaround the charging network.This represents a significantopportunity for improvement that iscurrently limited by the small marketfor this information.Standardisation <strong>of</strong> signage for EVparking and charging has beenprogressed by the Victorian roadregulator through the national signagestandards working group – refer toFigure 31. Visual recognition testingand review by other road signageregulators has underpinned what ishoped to be the universal EV symbolto be adopted nationally.Figure 31. VicRoads-designed EV parking symbol, which has been endorsed for use in-principle nationally(VicRoads drawing no.V130 11 ).11 Contact tem@roads.vic.gov.auCREATING A MARKET 57
Consultation with the <strong>trial</strong> charginginfrastructure providers found thatuniversal agreement existed on thegoal for full interoperability acrossdifferent EV charging networks. Thisgoal was agreed to be outside the <strong>trial</strong>timeframe due to the large number<strong>of</strong> higher priority issues that needto be dealt with in the near-<strong>term</strong> bythe fledgling companies involved.The companies also agreed that fullinteroperability requires a uniqueand universally-recognised useridentification key.The <strong>trial</strong> experience in negotiatinga common data schema for use byall providers illustrated the issuesand opportunities in this space. Eachprovider characterises chargingevents taking place on their networkslightly differently, which necessitatedsome manipulation <strong>of</strong> data in mostcases to make it suitable for exportand incorporation into the main <strong>trial</strong>data-set. The <strong>trial</strong> defined uniqueuser identification codes which weremaintained on a ‘look-up’ table to becross-referenced with the charginginfrastructure provider’s ownuser identification.In most cases it was found that theRFID cards issued by the charginginfrastructure providers formed theonly unique user identification, asan individual user account may havemultiple cards linked to it that aresupplied and/or replaced as needsarise. The <strong>Department</strong>’s look-up tableand user identification codes to whichthe charging infrastructure RFID cardsare mapped effectively provide a modelfor business-to-business or industrywideinteroperability models forthe future.5.1.5 What are the charginginfrastructure network issuesand opportunities?A clear issue for the charginginfrastructure network is provision<strong>of</strong> information to would-be users.Information is not supplied in astandardised way, nor is it availablethrough easily-found or streamlinedchannels. This information is a keyenabler for promotion <strong>of</strong> awareness,understanding and acceptance <strong>of</strong>EV technology. Additional opportunitiesexist to streamline user roamingacross the <strong>electric</strong> <strong>vehicle</strong>charging network.Signage is a prime example <strong>of</strong> thechallenges and opportunities in thisspace. The visible presence <strong>of</strong> EVcharging stations has a recognisedimpact upon <strong>electric</strong> <strong>vehicle</strong> take-upand ultimately the economic benefitsto the state (refer to Sections 6.1.2and 6.1.3). Electric <strong>vehicle</strong> driversneed to locate the actual bays in whichcharging <strong>of</strong> their <strong>vehicle</strong> is possible –no small challenge in large multi-levelcar-parks. Educating non-EV driverson recognition and avoidance <strong>of</strong> EVparking bays is critical to increasingEV driver confidence, recovering thevalue <strong>of</strong> the charging infrastructureinvestment, and minimisingenforcement overheads.The foresight <strong>of</strong> the Victorian roadregulator has provided an excellentstarting point in the form <strong>of</strong> the EVsymbol depicted in Figure 31. However,this design is not currently availableonline, nor has it been formallyrecognised within the manual <strong>of</strong>standard drawings for road signs.Adoption <strong>of</strong> the symbol nationally willoccur at the discretion <strong>of</strong> the roadregulator in each jurisdiction.A further challenge in promoting morewidespread use <strong>of</strong> this symbol andstandardised signs generally lay in theuncertainty around the distribution<strong>of</strong> responsibilities. Local governmenthas responsibility for the majority <strong>of</strong>informational signage <strong>of</strong> this naturein the public domain, however thereare 79 councils in Victoria who mustbe educated as to the existence andappropriate use <strong>of</strong> these standardiseddesigns. For private property thesituation is even more complicateddue to the large number <strong>of</strong> potentialplayers who may be involved.Drawing upon lessons from both thefleet and public charging infrastructureroll-out (refer to Sections 5.3.2 and5.4.2), the best solution for the signageappears to be:• The road regulator in eachjurisdiction to formally adopt theEV signage symbol depicted inFigure 31 as part <strong>of</strong> their standarddrawings for road signs• Charging infrastructure providersto arrange for the signage design/manufacture as part <strong>of</strong> their‘turn-key’ EV charging product/service <strong>of</strong>fering• A leading council to designstandard work practices andtraining <strong>of</strong> staff for signage,enforcement etc. in relation toEV parking arrangements, andfor them to make this informationavailable through the relevantlocal government networks.
To support trip planning and rangemanagement (refer to Section 4.2.2),<strong>electric</strong> <strong>vehicle</strong> drivers will also greatlybenefit from remotely-accessible, realtimeinformation about the chargingnetwork. Drivers need to be able to findcharging locations, understand howto access them and reliably plan ongaining access. Feedback from the <strong>trial</strong>participants suggests that an inabilityto access this information results inunderutilisation <strong>of</strong> both the <strong>vehicle</strong>sand the charging network, and reducesthe likelihood <strong>of</strong> EV take-up.The <strong>trial</strong> charging network directoryin the ‘Where do I charge my car?’webpage is a temporary and imperfectsolution. Although the information forall charging network locations hasbeen standardised and is linked toan online mapping resource, there isno integration into <strong>vehicle</strong> navigationsystems, no real-time information,and no easy pathway to engage withthe relevant service provider for eachcharging service/location (for example,to reserve a charging station inadvance <strong>of</strong> needing it, or to verify theparking bay/charging station as beingoperational and available for use).These are potential areas <strong>of</strong>competitive advantage for individualproviders and so may be best left tothe market; however a centraliseddirectory would provide a virtualmarketplace for these services.Government and third-party solutionshave emerged internationally 12 , some<strong>of</strong> which have spawned innovationssuch as listings by private EV owners<strong>of</strong>fering their home-charging stationfor EV drivers in-need. There are alsoa range <strong>of</strong> pilot and demonstrationprojects in the EU that are focusedspecifically on connected <strong>vehicle</strong>solutions as a key input to the EV valueproposition 13 .However, discussions withinternational providers found a limitedappetite to extend their solution toVictoria. This is partly attributable tothe small size <strong>of</strong> the Victorian marketfor the foreseeable future, whichalso undermines the likelihood thata local charging network directorysolution will emerge. According to a2009 survey <strong>of</strong> U.S. experts in <strong>vehicle</strong>communications systems (CAR 2011),a comprehensive plan and fundingfor road network infrastructure arethe two main obstacles to widespreadconnected <strong>vehicle</strong> deployment.12 In the United States, www.afdc.energy.gov/locator/stations and www.plugshare.com13 For instance, www.ict4eveu.eu, www.mobieurope.eu, www.molecules-project.eu and www.smartcem-project.euCREATING A MARKET 59
The ‘holy grail’ is a fully-interoperablecharging network that supportsseamless user roaming acrossproviders, as is the case for bankingservices or mobile phone use. Whilethere is a consensus amongst industryparticipants on the desirability <strong>of</strong> thisscenario, it is unlikely in the near<strong>term</strong>due to the fledgling status <strong>of</strong> thecharging servicer provider industry(refer to Section 5.1.4). Lessons fromthe toll-roads industry and the bankingsector (Nous 2010) suggest thatcharging service providers will needto work with each other to progresstowards a better customer experienceoverall, even if there may be a role foran ‘honest broker’ to facilitatethis outcome.Business-to-business relationships areemerging internationally as a steppingstone towards this outcome (Green CarCongress 2013). One clear observationmade by all parties lay in the need for aunique data key for individual users – apotentially low-cost opportunity now in<strong>term</strong>s <strong>of</strong> its potential benefits for thefuture, and a critical component <strong>of</strong> the<strong>trial</strong> framework.An obstacle for the entire <strong>electric</strong><strong>vehicle</strong> space relates to harmonisation<strong>of</strong> charging requirements andspecifications for different <strong>vehicle</strong>types. Electric bikes and motorcyclesgenerally use conventional 10 ampGPO plug/cable as for most other<strong>electric</strong>al appliances. At the other end<strong>of</strong> the spectrum, <strong>electric</strong> commercial<strong>vehicle</strong>s <strong>of</strong>ten employ indus<strong>trial</strong> highvoltagecharging systems due to theirlarge batteries and need for shortcharging times to keep the <strong>vehicle</strong>son the road. Passenger <strong>vehicle</strong>s sitsomewhere between the two, suchthat even quick charger technologyis generally different to what is beingused in commercial <strong>vehicle</strong>s globally.These differences in chargingstrategies arise out <strong>of</strong> trade-<strong>of</strong>fsbetween battery size, cost andcharging speed, the balance for whichchanges according to the <strong>vehicle</strong> type.Furthermore, the <strong>vehicle</strong>s generallypark in different locations. As a result<strong>of</strong> these issues, few opportunities existcurrently to deploy charging solutionsthat can satisfy a number <strong>of</strong> different<strong>vehicle</strong> types. This creates furtherchallenges for the public chargingbusiness model as outlined inSection 5.4.5.Many <strong>of</strong> the standardisation issuesmay be addressed through a nationalstandards development process for<strong>electric</strong> <strong>vehicle</strong>s being delivered byStandards Australia with the support<strong>of</strong> the Victorian Electric Vehicle Trial(Standards Australia 2010). The mostsignificant workstream within thisproject is focused upon EV charginginfrastructure. Resumption <strong>of</strong> the workprogram following a hiatus as fundingissues are resolved is expected in 2013.A further issue relating to EV charginggenerally is the potential revenueimpact for government. Fuel exciseis a major contributor to governmentbudgets around the world, helping t<strong>of</strong>und those services that are not ableto be funded within themselves (forinstance, public education and health).In Australia, fuel excise raises thelargest amount <strong>of</strong> revenue <strong>of</strong> all taxeson specific goods (Aust Govt 2011).Increased use <strong>of</strong> <strong>electric</strong> <strong>vehicle</strong>swill reduce government revenues,as <strong>electric</strong>ity is not subject to excise.Internationally, some jurisdictionsare responding to this by introducingannual fees for <strong>electric</strong> <strong>vehicle</strong>s(CNET 2012).A corollary to the reduction in fuelexcise is the relative impact <strong>of</strong> carbonpricing. The Australian Government’sClean Energy Plan (2012) applies to<strong>electric</strong>ity but not transport fuels suchas petrol. Although the <strong>Department</strong>’sanalysis suggests that the relativeimpact <strong>of</strong> carbon pricing on thecompetitiveness <strong>of</strong> <strong>electric</strong> <strong>vehicle</strong>sis minor by comparison with oilprices (AECOM 2011), the contrastingtreatment <strong>of</strong> <strong>electric</strong>ity compared toother transport fuels represents aregulatory barrier <strong>of</strong> the type discussedin Section 8.
5.2 HOME CHARGING5.2.1 How much doeshousehold charginginfrastructure cost?Household charging infrastructurecosts around $1,750 for the chargingcircuit and up to $2,500 for a fullyfeatureddedicated EV charging outlet.While the costs for the latter reflectuser preference and technology, thecharging circuit is a cost that reflectsthe specifics <strong>of</strong> the residence.Based upon the <strong>trial</strong> experience, homecharging outlets can vary in price from:• Less than $100 for a standardwall-socket• Up to around $500 for an entryleveldedicated EV charging outlet• Up to around $2,500 for a moreadvanced unit with a range<strong>of</strong> features.It should also be noted that as <strong>of</strong>December 2012, one service providerprovides the charging outlet at nocost to the household under the<strong>term</strong>s <strong>of</strong> their ongoing serviceprovision agreement.The charging circuit varies significantlyin price according to the needsand wishes <strong>of</strong> the household. Withreference to Table 10, the averagecost for the charging infrastructurecircuit cost for the <strong>trial</strong> householdswas $1,750. Key influences on thisprice were distance from the point <strong>of</strong><strong>electric</strong>al supply, the condition andcapacity <strong>of</strong> the <strong>electric</strong>al supply board,and the need for a free-standingcharging outlet as opposed to beingmounted <strong>of</strong>f an existing structure.No.INSTALLATIONS94AVERAGE COST $ 1,750MEDIAN COST $ 1,429STD DEV $ 1,124MAX $ 6,650MIN $ 392Table10. Cost benchmarking <strong>of</strong> the <strong>trial</strong>household charging circuits.Information sourced from thehouseholds prior to the initial sitevisit assisted with the installationplanning process, which sometimesincluded phone conversations withthe householder to source additionalinformation and/or negotiateleast-cost alternatives.With reference to Appendix D –Household charging infrastructurequestions pr<strong>of</strong>orma:• The age <strong>of</strong> the dwelling or date<strong>of</strong> most recent major renovationprovided an early indication <strong>of</strong>potentially insufficient <strong>electric</strong>alsupply to support the addition <strong>of</strong>an EV charging load• Photos <strong>of</strong> the meter/switchboardwere a good indicator <strong>of</strong> thepotential need for an <strong>electric</strong>alsupply upgrade or refurbishment<strong>of</strong> the board itself (in support <strong>of</strong> acertificate <strong>of</strong> <strong>electric</strong>al safety)• Photos <strong>of</strong> the property and parkinglocation assisted with a subjectivereview for potential aestheticconcerns with regards the EVcharging outlet location – heritageor new/recently-renovatedhousing, along with locationswhere the charging outlet wouldbe visible from the front <strong>of</strong> theproperty increased the need toaddress aesthetic issues as part<strong>of</strong> the charging solution• Diagrams/house-plan mark-upsexplaining the property layout in<strong>term</strong>s <strong>of</strong> the parking location/srelative to the point <strong>of</strong> meter/switchboard greatly assisted withinitial discussions to find theleast-cost approach – note thatthis information was able to besourced from less than 50 per cent<strong>of</strong> participants• Observations from the photos/diagrams along with discussionswith the resident were also criticalto ensuring that charging cabletripping hazards were avoided– for instance, by consideringthe likely parking location andorientation in relation to the<strong>vehicle</strong> charging outlet location.CREATING A MARKET 61
Despite these efforts, around one infive dwellings required multiple visitsfrom the installers. Discussions withthe charging infrastructure providerssuggest that around half <strong>of</strong> thesemulti-visit sites were due to issuesthat may have been possible to discernfrom the initial information and withmore experience on behalf <strong>of</strong> theinstallers. The residual 10 per cent<strong>of</strong> households for which multiple sitevisits were thought to be unavoidablecould be mostly attributed to thelimited ability to discern the need foran <strong>electric</strong>al supply upgrade without asite visit. Figure 32 suggests that thisestimate is correct based upon theconclusion that residences built earlierthan 1970 that have not undergonesignificant renovation in the interimare more likely to be in need <strong>of</strong> an<strong>electric</strong>ity supply upgrade.5.2.2 How is charginginfrastructure installedin households?Charging infrastructure is installed by<strong>electric</strong>al contractors drawing uponinformation supplied by the household.From the time <strong>of</strong> the contractor beingnotified <strong>of</strong> the need for an installation,the process to handover usually takesabout five weeks.The average time to install a <strong>trial</strong>household charging solution was35 days, even if there was somevariability across installations(standard deviation <strong>of</strong> 17 daysacross 94 installations).Key influences on the installationleadtime include:• The accuracy and extent <strong>of</strong>information provided beforehanddescribing the household charginginstallation context• Involvement <strong>of</strong> a third party suchas a landlord or body corporate• The availability and responsiveness<strong>of</strong> the householder• Stipulation <strong>of</strong> target dates forthe installation at the time <strong>of</strong> therequest, and progress trackingthereafter (in other words, workingto a deadline)• Pre-approvals for installationswhere the site works are lessthan a reasonable thresholdvalue ($2,000 was selected forthe <strong>trial</strong> following the initialround <strong>of</strong> 14 installations)• The experience <strong>of</strong> the installer.25%20%Proportion15%10%5%0%1850 1900 1950 2000YearFigure 32. Results from the 2012 <strong>trial</strong> household application process illustrating the age <strong>of</strong> the housing stock for potential <strong>electric</strong><strong>vehicle</strong> drivers in Victoria – this attribute was felt to be a key indicator <strong>of</strong> the need for an <strong>electric</strong>al supply upgrade (n = 2,200, “Canyou estimate about when your residence was built, or the most recent date it underwent a major renovation?”, DOT 2012b).
The general process for the householdcharging infrastructure installation canbe seen in Figure 33.Further explanation <strong>of</strong> what thesesteps encompass can be found below:1. Contract negotiation – the formalagreement for the household toparticipate in the <strong>trial</strong> is explainedand executed2. Site works planning – informationis sought from the householder toinform the charging infrastructuresolution (refer to Appendix D –Household charging infrastructurequestions pr<strong>of</strong>orma and Section5.2.1); answers are supplied tocharging infrastructure provideralong with contact details – thisis the start date for assessment<strong>of</strong> the installation leadtime;charging infrastructure providercontacts household to bothprovide preliminary informationand prepare them to hear fromthe installation subcontractor;charging infrastructure providerequips installer with relevanthardware, including pre-codedRFID ‘membership’ card3. Site works – installer arrangessite visit, during which thecharging solution is installed/commissioned if possible; issuespreventing immediate installationare referred back to the charginginfrastructure provider forfurther action – this may involvedeliberation on the preferredsolution and negotiation withthe householder4. Handover – charging stationoperation is demonstrated tohouseholder; <strong>Department</strong> notifiedonce complete so that <strong>vehicle</strong>handover can be scheduled – thisis the finish date for assessment<strong>of</strong> the installation leadtime5. Operation – <strong>Department</strong> receivesinvoice/actions payment; chargingactivity commences; data gatheredthrough telemetry link to networkoperating centre; at completion<strong>of</strong> <strong>trial</strong> the household is providedwith an <strong>of</strong>fer to retain the chargingoutlet if so desired, otherwise it isremoved and the site remediatedto householder’s satisfaction.The longest leadtime components<strong>of</strong> this process generally relate tocoordination between the householdand the installation subcontractor, andin resolving any complications with theinstallation (step 3).The <strong>trial</strong> changed its processafter receiving feedback from thehousehold participants. Introductoryinformation from each charginginfrastructure provider is nowprepared to help streamline andgain their support for the installationprocess. Key information includedan explanation and images <strong>of</strong> EVcharging infrastructure (includinghow it would look once installed),what impact the installation wouldhave on their property, along with anexplanation <strong>of</strong> options/costs. Althoughmany households were nominallyinterested in free-standing units, theoverwhelming majority accepted awall-mounted solution where possibleto avoid bearing the cost difference <strong>of</strong>the alternative.AVERAGE / MEDIAN LEADTIME = 35 / 37 DAYSContractnegotiationSite worksplanningSite worksHandoverOperation• Explain deed• Q&A• Sign-<strong>of</strong>f• Questionnaire• Notifysub-contractor• Consultation• Scheduling• Site visit / works• Test andcommission• Demonstration • Paymentfor works• Reporting• TransitionFigure 33. Schematic <strong>of</strong> household charging infrastructure installation process based upon 94 installations.CREATING A MARKET 63
5.2.3 What is the chargingsolution for rentals orshared parking?Based upon <strong>trial</strong> findings and datafrom other sources, an increasingnumber <strong>of</strong> potential <strong>electric</strong> <strong>vehicle</strong>drivers in Victoria will require chargingsolutions for rental accommodation,with fewer for shared parking.Although charging solutions wereable to be delivered for all situationsinvestigated as part <strong>of</strong> the <strong>trial</strong>, theinstallation costs and resistance <strong>of</strong>key stakeholders are likely to prove anobstacle to more widespread roll-out.With reference to Figure 34, analysis<strong>of</strong> the household applications toparticipate in the <strong>trial</strong> indicatesthat around one in five potential<strong>electric</strong> <strong>vehicle</strong> drivers lives in rentalaccommodation, which is slightly lessthan the proportion <strong>of</strong> renters for theVictorian population more broadly (DOT2010d, ABS 2012).The <strong>trial</strong> investigated the implications<strong>of</strong> this through a selection <strong>of</strong>household participants residing inrental accommodation. A pr<strong>of</strong>ormaletter was designed for the participantto pass onto their landlord succinctlydescribing what was being proposedin <strong>term</strong>s <strong>of</strong> the charging infrastructureinstallation and operation, andreassuring them that all costs andliabilities would be covered includingfull remediation <strong>of</strong> the site to theirsatisfaction upon the <strong>trial</strong> conclusion(as per arrangements for the<strong>trial</strong> more generally). In someinstances clarifications were soughtwhich extended the leadtime forthe installation, however in allinstances the approval was gainedfor <strong>trial</strong> participation.Own /paying <strong>of</strong>fRent /Lease2010 Trial household application (n=6,237)ABS 2011 Australian census – Victoria0% 10% 20% 30% 40% 50% 60% 70% 80% 90%Figure 34. Results from the 2011 <strong>trial</strong> household application to participate process as compared to the Victorian results from 2011Australian census, highlighting the significant minority <strong>of</strong> rental accommodation with an interest in EVs (n = 6,327, DOT 2010d,ABS 2012).
Although this outcome was a successin the context <strong>of</strong> the <strong>trial</strong> delivery, itdoes not provide any insight into themore likely scenario where costs mustbe borne by one <strong>of</strong> the landlord orthe tenant. Installation <strong>of</strong> <strong>electric</strong><strong>vehicle</strong> charging infrastructure intenanted premises is characterisedby the ‘principle-agent problem’ thathas been found to inhibit investmentin energy efficiency (de T’Serclaesand Jollands 2007). Landlords wereclearly concerned about any aspect<strong>of</strong> the installation or operation <strong>of</strong>the charging infrastructure that mayimpact them in <strong>term</strong>s <strong>of</strong> cost oreffort. Given that the charging circuitrepresents a cost <strong>of</strong> just under $2,000that cannot be recovered by the tenantshould they move, it seems likelythat this will represent a significantbarrier to EV adoption by the one in fiveVictorians who rent.Dwellings with shared parkingarrangements were found to be aspecial case. Although differenceswere observed in the approach takenby different charging infrastructureproviders, a common solutionwas to run a circuit from the agreedparking/charging location to thepoint <strong>of</strong> metered <strong>electric</strong>al supply forthe dwelling. In some instances thisrequired a cherry-picker to route thecircuit to apartments above groundlevel, driving significantly higher costsinto the installation – around doublethat <strong>of</strong> detached housing with <strong>of</strong>fstreetparking.With reference to the results from the<strong>trial</strong> application process as describedin Figure 35, this issue does not appearto be as significant as for renters.However, urban developmenttrends are likely to increasethe significance <strong>of</strong> this issue asaccommodation with shared parkingincreases in prevalence.Expert advice provided for Melbourne’sMetropolitan Planning Strategy (MAC2012) illustrates this issue:About half <strong>of</strong> all newhousing in Melbourneis being constructed inestablished areas. Work bythe Grattan Institute showsthere are ‘shortages’ <strong>of</strong>semi-detached dwellingsand apartments inMelbourne’s <strong>mid</strong>dle andouter suburbs.This suggests that the costs <strong>of</strong> retr<strong>of</strong>itfor apartments are likely to be adeterrent for EV take-up by a growingnumber <strong>of</strong> Victorians.Question 1. Do you have <strong>of</strong>f street parking?YES 98% NO 2%Question 2. Is this parking location shared with others?YES 3% NO 97%Question 3. Do you have the final decision on how power outletsin the shared parking facility can be used?YES 55% NO 43%Body corporate, landlord or other organisation decides0% 10% 20% 30% 40% 50% 60% 70% 80% 90% 100%Figure 35. Results from the 2011 <strong>trial</strong> household application to participate process, highlighting the relatively low number <strong>of</strong> peoplewithout <strong>of</strong>f-street parking and/or oversight <strong>of</strong> the decision-making that relates to their regular place <strong>of</strong> parking (n = 6,327, DOT 2011).CREATING A MARKET 65
5.2.4 When do householdscharge <strong>electric</strong> <strong>vehicle</strong>s?In the absence <strong>of</strong> outside influence,charging by households takes placeimmediately upon their arrival home.However, results from solar-PVequipped <strong>trial</strong> participants suggestthat households will defer theircharging to <strong>of</strong>f-peak periods shouldthey receive a financial benefit to doso. Households may also agree to havetheir charging managed in line withnetwork demand, if the implications <strong>of</strong>this are demonstrated to be minor andprovided they have some control overthe situation.Data recorded from the householdEV charging infrastructure showedthat charging demand basically alignswith general household <strong>electric</strong>itydemand (CSIRO 2012). This is becausefor the majority <strong>of</strong> households, themost convenient and desirable optionis to begin charging by plugging inimmediately upon arriving home beforeheading inside to turn other <strong>electric</strong>alappliances on. Although the chargemanagement options available tohouseholds varied according to theirspecific <strong>vehicle</strong> and charging solution(refer to Sections 4.1.1 and 5.1.2),these all require some effort andpossibly inconvenience.With reference to Figure 36, somevariation in the charging demandpr<strong>of</strong>ile was observed for participantswho <strong>report</strong>ed having a solar PVinstallation at their home. This issignificant as a majority <strong>of</strong> solarPV owners are on a time-<strong>of</strong>-use<strong>electric</strong>ity tariff that provides afinancial incentive to defer <strong>electric</strong>ityuse to <strong>of</strong>f-peak periods.Peak EV charging demand for <strong>trial</strong>households with solar PV occurs at<strong>mid</strong>night, coinciding with the likelybeginning <strong>of</strong> the <strong>of</strong>f-peak tariff period.This indicates that in the absence <strong>of</strong>outside guidance and with limitedcharge management capability, solarPV households are managing their EVcharging in response to the financialincentive to do so – refer to thefollowing unprompted quote from one<strong>of</strong> the household participants:As I have solar panels with feed-intariff I did virtually all charging at nightVictorian Electric Vehicle Trialhousehold participant, 20120.500.450.400.35Power (kW)0.300.250.200.150.100.05Solar PVNon-solar005101520Time <strong>of</strong> use (24 hour clock)Figure 36. EV charging demand pr<strong>of</strong>iles for solar and non-solar <strong>trial</strong> household participants (n = 12 and 71 respectively).
The appeal <strong>of</strong> a financial incentiveto defer charging was investigatedwith the entire sample <strong>of</strong> householdparticipants. With reference toFigure 37, the bias in the results wastowards maximising the <strong>vehicle</strong> utility.This result is consistent with findingsfrom the Ergon Energy EV <strong>trial</strong> inQueensland, where drivers pushedback on mandatory deferred charging<strong>of</strong> their <strong>vehicle</strong> under the ‘Tariff 33’arrangement that is more generallyapplied to pool-pumps (Ergon 2012).In late 2012, a small group <strong>of</strong><strong>trial</strong> household participants wereselected to take part in an <strong>electric</strong>itydemand response and load controldemonstration project – refer to thebreakout box below. These householdswere equipped with DiUS Computing’sChargeIQ EV charging outlet, whichwas bound to their residential smartmeter upon installation. The objective<strong>of</strong> the project was to demonstrateuse <strong>of</strong> Victoria’s Advanced MeteringInfrastructure for the purposes <strong>of</strong>managing EV charging demand.A total <strong>of</strong> 64 charge-managementevents were deployed by thedistribution network operator for theregion, split between ‘peak charging’events for which 24 hours’ noticewas provided to participants, and‘emergency charge management’events for which just one hour noticewas provided. Results from a survey<strong>of</strong> participants indicated widespreadacceptance <strong>of</strong> the charge managementmethod and technology, to the extentthat the majority <strong>of</strong> participants wouldagree to have their charging managedthis way in future even if there was n<strong>of</strong>inancial benefit to them.This outcome suggests that smartgrid, or other charge managementtechnologies, will be effective in themanagement <strong>of</strong> EV charging so as toavoid costly network investments.Would you be open to having your <strong>vehicle</strong> charge when it wascheaper rather than as soon as you plugged in?Yes, but only ifmy <strong>vehicle</strong> wasfully chargedwhen I needed itYes, if itprovideda betterenvironmentaloutcomeYes, but onlyif it were halfthe costNo0% 10% 20% 30% 40% 50% 60% 70% 80% 90%Figure 37. Results from a survey <strong>of</strong> <strong>trial</strong> household participants on their outlook towards deferred charging in responseto a financial incentive; survey interval was around six weeks into their EV experience (n = 77; multiple choices permitted).CREATING A MARKET 67
HOME CHARGING CASE STUDYDIUS COMPUTING / CHARGEIQIn late 2012 Melbourne-based DiUS Computing, in what appears to be a world-first, used Victoria’s‘smart grid’ to manage <strong>electric</strong> <strong>vehicle</strong> charging as part <strong>of</strong> the Victorian Electric Vehicle Trial(Smart Grid News 2012).The DiUS ChargeIQ unit, already the world’s first smart grid (Zigbee) certified EV charger (Electronics News2012), was deployed to ‘smart meter’ equipped households within United Energy’s distribution region. Chargemanagement events were then issued to the ChargeIQ units through the United Energy network. The chargemanagement events formed part <strong>of</strong> an EV charging demand management project known to participants as‘grid-friendly’ charging.The ChargeIQ units are equipped with charge management capability that allows users to take advantage <strong>of</strong>cheaper ‘<strong>of</strong>f-peak’ <strong>electric</strong>ity tariffs – this is a form <strong>of</strong> demand response generally known as ‘smart charging’.The ChargeIQ units also allow EV charging loads to be controlled by the <strong>electric</strong>ity distributor – these eventswere <strong>term</strong>ed ‘peak charging’ and ‘emergency charge management’ in the project according to the extentparticipants were pre-warned.Participants were informed <strong>of</strong> the charge management events through the ChargeIQ network, including viaemail, SMS, the internet and on the ChargeIQ device. Control <strong>of</strong> the <strong>vehicle</strong> charging was possible throughphone applications, the web portal and on the ChargeIQ unit. In simulated conditions to real network scenarios,participants received warnings either 24 hours or immediately before charge management events, along withoptions that would allow them to control charging <strong>of</strong> their <strong>vehicle</strong> while minimising impacts on cost and/or use.Charge management capabilities ensure that households are able to minimise their charging costs withoutimpacting upon their <strong>vehicle</strong> use. Additionally, charging is able to be managed by the <strong>electric</strong>ity distributor soas to preserve the reliability <strong>of</strong> the network and prevent increases in <strong>electric</strong>ity costs as a result <strong>of</strong> avoidablenetwork investments.Technology solutions, such as ChargeIQ, will help ensure that <strong>electric</strong> <strong>vehicle</strong> charging can be easilyaccommodated by our <strong>electric</strong>ity networks at minimal cost and inconvenience for everyone.Figure 38. DiUSComputing ChargeIQhome charging device,the world’s firstsmart grid EV charger.
5.2.5 What do households think<strong>of</strong> <strong>electric</strong> <strong>vehicle</strong> charging?The majority <strong>of</strong> households felt thathome charging alone met their needs.Despite the relative immaturity <strong>of</strong> thetechnology, most found it easy to use,and felt confident and reassured intheir understanding <strong>of</strong> what was goingon. However, an appetite existed formore information about costs andenergy use.Around six weeks into their EVexperience household participantswere asked, ‘Does home charging <strong>of</strong>the <strong>trial</strong> <strong>vehicle</strong> meet your needs?’Consistent with the findings inSections 4.2.2 and 4.2.3, 79 per cent <strong>of</strong>respondents replied in the affirmative(n = 76). Notably however, the majority<strong>of</strong> respondents felt they would alsocharge outside <strong>of</strong> their home undercertain circumstances – this isexplored further in Section 5.4.3.Additional information was soughtfrom the household participantson what they thought <strong>of</strong> their homecharging solution. With reference toTable 11, participants were generallyvery positive about their chargingoutlet design and operation. The cable/plug combination and basic feedbackprovided by the outlets were bestreceived, the former potentiallyhaving implications for the wirelesscharging solutions currently beingdeveloped (Pike Research 2012).The least well received and most highlyvaried responses related to supportinginformation on costs and energy.This is likely due to the significantvariation in user feedback and networksupport across the providers (refer toSection 5.1.2).Household participants were alsoasked about the sort <strong>of</strong> informationthey thought would be useful inrelation to EV charging. Although thesurvey question was not constrained tohome charging, for most participantsthis formed the basis <strong>of</strong> their EVcharging experience. With reference toFigure 39, cost information was clearlythe highest priority accordingto participants.Although the survey question abovelimited respondents to cost informationabout each charging session only,other survey responses indicatethat households generally considertheir <strong>vehicle</strong> fuel costs in weekly ormonthly <strong>term</strong>s (65 and 32 per cent <strong>of</strong>107 respondents respectively; ‘daily’,‘quarterly’, ‘yearly’ and ‘don’t know’being the other options).Additional suggestions for charginginformation were provided by aboutone third <strong>of</strong> respondents. The mostcommon requests were for informationrelating to charge management <strong>of</strong>the <strong>vehicle</strong>, including how long untilcharging would be complete and/ornotifications on when charging hadbeen completed.Charging infrastructure attributeAverage score(out <strong>of</strong> 5)Std devEase <strong>of</strong> use – cable/plug 4.6 0.7Confidence in understanding what was happening 4.6 0.7Convenience 4.3 1.0Perceived safety 4.3 1.0Reliability 4.2 1.2Something to look forward to if all cars go this way 4.0 1.0Costs and energy use info 3.6 1.3Table 11. Results from a survey <strong>of</strong> <strong>trial</strong> household participants on their perceptions <strong>of</strong> their home charging solution; survey intervalwas around six weeks into their EV experience (n = 76).CREATING A MARKET 69
5.2.6 What are the issuesand opportunities forhome charging?The home charging infrastructurecost is a potentially significantobstacle to wider <strong>electric</strong> <strong>vehicle</strong>take-up, particularly for rentersand the increasing numbers <strong>of</strong>apartment dwellers. This issuenot only compounds the purchaseprice obstacle <strong>of</strong> the <strong>vehicle</strong> itself,it represents an additional cost forwould-be EV buyers that is not factoredinto their initial <strong>vehicle</strong> purchaseconsideration.The best case/least cost homecharging solution for around $500will provide no charge managementcapability or insight into energy use –a significant limitation based upon thecurrent generation <strong>of</strong> <strong>electric</strong> <strong>vehicle</strong>s.For an average household seekingbasic charge management capability,a home charging solution willcost $2,000-3,000. Electricitysupply upgrades, charging circuitcomplications, and shared parkingarrangements are likely to doublethis cost. Most <strong>of</strong> this investment getswritten-<strong>of</strong>f for EV owners who movehouse. When it is considered that mostwould-be <strong>electric</strong> <strong>vehicle</strong> buyers willnot even be aware <strong>of</strong> these issues,home charging costs represent apotentially significant barrier toEV adoption.Charging outlets are an evolvingand largely proprietary technology,the specification for which will varyaccording to the specific needs <strong>of</strong> theuser and their <strong>vehicle</strong>. However, aclear opportunity exists for chargingcircuits to be included as part <strong>of</strong>the design and construction <strong>of</strong> newproperty developments or as part <strong>of</strong>refurbishments.For a greenfield development, thecost <strong>of</strong> charging circuit materialsand labour are estimated to be $200-300. This represents nearly an order<strong>of</strong> magnitude less than the averageretr<strong>of</strong>it, underpinning a clear netpresent value argument in favour <strong>of</strong>charging circuit inclusion during theinitial build. For apartments and otherdevelopments with shared parking thesolution may be to include a revenuegrademeter to allow for <strong>electric</strong>ity useto be reconciled to any user, which mayadd $50-100 to the parts and labourcost above.The <strong>Department</strong> has recognisedthis opportunity with its Guidance onLand-use Planning for Electric VehicleParking and Charging (DOT 2012e).This document explains the public andproperty value benefits <strong>of</strong> includingcharging circuits during initial designand construction <strong>of</strong> new developments.What information would be useful in relation to <strong>electric</strong> <strong>vehicle</strong> charging?How much eachcharging session costsHow much energywas consumed ina charging sessionRemotely accessibleinformation onthe charge level<strong>of</strong> the <strong>vehicle</strong>How much CO 2was saved relativeto the petrol <strong>vehicle</strong>0% 10% 20% 30% 40% 50% 60% 70% 80% 90% 100%No informationrequiredFigure 39. Results from a survey <strong>of</strong> <strong>trial</strong> household participants on the sort <strong>of</strong> EV charging information they thought would beuseful; survey interval was around six weeks into their EV experience (n = 77; multiple choices permitted).
It provides guidance on the allocation,placement and design <strong>of</strong> <strong>electric</strong><strong>vehicle</strong> charging infrastructure. Theadvice addresses the informationbarriers for land-use planners, trafficmanagers and property developerslooking to future-pro<strong>of</strong> for EV take-up.Savings for building retr<strong>of</strong>its maybe possible through improvedinformation gained from homeownersand learning benefits from theinstallers. This will have the addedbenefit <strong>of</strong> reducing the leadtime on theinstallation, allowing consumers tomore quickly take delivery <strong>of</strong> and startusing their <strong>electric</strong> <strong>vehicle</strong>s. Marketforces are likely to drive this innovationamongst the various charginginfrastructure providers.Promoting an improved awarenessand understanding <strong>of</strong> <strong>electric</strong> <strong>vehicle</strong>sshould include consideration <strong>of</strong>landlords and other entities with a keyrole in the approvals for installation <strong>of</strong>charging infrastructure. By providinga credible source <strong>of</strong> information onthe emerging technology and itsimplications for landowners, barriersto uptake <strong>of</strong> the technology will bereduced. For example, descriptions<strong>of</strong> preferred models for EV charginginfrastructure installation andoperation specific to rental propertiesand/or body corporate administeredparking locations may help streamlinethe negotiations between parties.Internationally, some jurisdictionshave legislated to resolve challengesassociated with <strong>electric</strong> <strong>vehicle</strong>charging by renters and inmulti-unit dwellings 14 .Integration <strong>of</strong> <strong>electric</strong> <strong>vehicle</strong> charginginto Victoria’s <strong>electric</strong>ity networkis both manageable and desirable.Results from the <strong>trial</strong> clearly showconsumers to be responsive to theprice signals, including specificallythe time-<strong>of</strong>-use <strong>electric</strong>ity tariffthat accompanies most solar PVinstallations. As Victoria’s <strong>electric</strong>itymarket evolves towards wider use <strong>of</strong>time-<strong>of</strong>-use tariffs, consumers canbe expected to select and employtechnologies that allow them totake advantage <strong>of</strong> <strong>of</strong>f-peak tariffs.Communicating the benefits <strong>of</strong> <strong>of</strong>fpeakcharging practices that avoidundesirable impacts upon <strong>vehicle</strong>utility should and is likely to beprioritised by EV technology andservice providers.An emerging opportunity maybe using <strong>electric</strong> <strong>vehicle</strong>s as energystorage devices. Japanese EV suppliersare bringing products into the marketthat allow for energy to be drawnback from the <strong>vehicle</strong> (Mitsubishi 2012,Nissan 2012). Although these devicesare not configured for Australian<strong>electric</strong>ity network standards,the potential appeal to the largenumber <strong>of</strong> households with solarPV is a potentially synergisticopportunity to more closely alignthe two technologies.Beyond home energy storage, otheractivities suggest that the opportunityto use EVs for grid-energy storage maynot be too far away:• The standards developmentprocess for Demand ResponseCapabilities and SupportingTechnologies for Electrical Productsis progressing towards completion<strong>of</strong> an Australian Standard forEVs as energy storage (workingtitle AS 4755.3.4) – this willprovide government, industry andconsumers with a consensusbackedtechnical and performancespecification for EV chargemanagement systems capable <strong>of</strong>supplying energy into the grid• The Victorian Competition andEfficiency Commission recogniseddistributed storage in their review<strong>of</strong> feed-in tariffs (VCEC 2012),providing a starting point forconsideration <strong>of</strong> the use <strong>of</strong> EVs asdistributed energy storage devicesin Victoria• Victoria’s Advanced MeteringInfrastructure roll-out isprogressing towards completionin 2013 (DPI 2012), which willprovide network operators withthe means to manage energytransactions with EVs (as hasbeen demonstrated with the DiUSComputing EV charging demandresponseload-control projectdescribed in Section 5.2.4).Finally, local grid impacts havebeen investigated by United EnergyDistribution as part <strong>of</strong> the <strong>trial</strong>.Although the findings are preliminary,indications are that the main issuecreated by EV charging is potentialvoltage drop below the regulatedminimum standard <strong>of</strong> 230 volts. Thisis an issue that may need addressingparticularly where EV take-uphas ‘clustered’ into a number <strong>of</strong>households along a single feeder.14 For example, Hawaii (Act 186 HRS 196-7.5) and California (Senate Bill 880)CREATING A MARKET 71
The Energy NetworksAssociation (ENA)appreciates the opportunityto have participated in theVictorian Electric VehicleTrial and has been pleasedwith the results to date. Inparticular, our objectives togain, through participation,a clearer understanding<strong>of</strong> the implications <strong>of</strong> andopportunities from theintroduction <strong>of</strong> <strong>electric</strong><strong>vehicle</strong>s for energy networkshave been largely satisfied.We applaud the VictorianGovernment’s initiativein committing fundingand resources to the <strong>trial</strong>and believe that <strong>electric</strong><strong>vehicle</strong>s have a definite andimportant role in Victoria’stransport andenergy future.Energy Networks Association,8 November 20125.3 FLEET AND WORKPLACECHARGING5.3.1 How much does charginginfrastructure for corporateapplications cost?At around $5,000, charging outlet costsare generally higher than for homecharging due to the preference forincreased functionality and durability.Average charging circuit costs <strong>of</strong>around $2,200 are also slightly higherdue to the increased separationbetween parking locations and points<strong>of</strong> <strong>electric</strong>al supply. However, manyfleets have implemented lower costsolutions drawing upon existinginfrastructure and their own<strong>electric</strong>al tradespeople.Similar to home charging solutions, theentry-level 15A GPO <strong>electric</strong>al outletis likely to cost around $100. Howeverfor most fleets there is a preferencetowards devices with enhanced safety,security and data capture. Based uponthe <strong>trial</strong> experience this translatesto around $4,000-$6,000 for a fairlysophisticated charging outlet, althoughprices are likely to have fallen dueto market competition, economies<strong>of</strong> scale and design/manufacturingprocess improvements.The charging circuit was generallyinstalled at the cost <strong>of</strong> the fleetoperator, ensuring strong interest inidentifying least cost solutions. For thisreason many fleets elected to installthe charging circuit themselves usingexisting infrastructure and/or their own<strong>electric</strong>al tradespeople. A consequence<strong>of</strong> this is a reduction in the cost dataobtained for analysis relative to thesites installed.With reference to Table 12, the averagecost <strong>of</strong> the charging circuit was foundto be slightly higher than for homecharging at around $2,200. While thedifference between the average figuressits well within the standard deviationfor both sets <strong>of</strong> data, there is a $500difference in the median values whichreflects the generally shorter distancethat home charging circuits have totravel between the point <strong>of</strong> <strong>electric</strong>alsupply and the parking/charginglocation. It should be noted that due tothere being more control <strong>of</strong> the designsolution with owner-occupied sites,the missing data from the sites wherethe charging circuit was installed bythe fleet operator is likely to be biasedtowards lower cost solutions.No.INSTALLATIONS14AVERAGE COST $ 2,152MEDIAN COST $ 1,910STD DEV $ 1,279MAX $ 4,382MIN $ 550Table 12. Cost benchmarking <strong>of</strong> the <strong>trial</strong>fleet charging circuits.As for the home charging solutions,sites which necessitated more complexsolutions such as free-standing unitshad the potential to greatly increasecosts. In most cases lower costsolutions were able to be identified,however this <strong>of</strong>ten greatly extendedthe leadtime for the installation oreven resulted in a different sitealtogether serving as the charginglocation for the <strong>vehicle</strong>.
An example <strong>of</strong> this was the<strong>Department</strong>’s own experiencewith its property at 121 ExhibitionSt, Melbourne. The <strong>Department</strong>leases levels 5 to 16 <strong>of</strong> the 36 levelbuilding, along with a portion <strong>of</strong> theunderground car-parking. As part <strong>of</strong>the <strong>trial</strong>, the <strong>Department</strong> requestedpermission to install an <strong>electric</strong><strong>vehicle</strong> charging solution. The buildingmanager proposed a charging circuitbe run from the lowest point <strong>of</strong>metered <strong>electric</strong>al supply billed tothe <strong>Department</strong> on building level 5 tothe nearest underground car-park onbasement level 3. This was de<strong>term</strong>inedto be cost-prohibitive, and despiteextensive negotiations to obtain a costeffectivealternative the proposal had tobe aborted.A charging outlet was instead installedin a nearby property also tenantedby the <strong>Department</strong>, using an unused<strong>electric</strong>ity billing meter thatwas one level away from the nearest<strong>Department</strong> parking location. Thisinstallation cost $4,500, which was stillsignificantly higher than the averagefor a commercial property but muchlower than what was expected underthe alternate arrangement.5.3.2 How is charginginfrastructure installed forcorporate applications?Charging infrastructure for corporateapplications is installed by <strong>electric</strong>alcontractors. Charging circuits can beinstalled by in-house contractors, evenif this is <strong>of</strong>ten done by the chargingservice provider during installation<strong>of</strong> the dedicated <strong>electric</strong> <strong>vehicle</strong>charging outlets. From the time whencommitment to establish EV chargingcapability is made, the averageleadtime to commissioning/handoveris around 10 weeks.Installation <strong>of</strong> <strong>electric</strong> <strong>vehicle</strong>charging infrastructure for corporateapplications is greatly complicated byinternal approval requirements, alongwith the likely involvement <strong>of</strong> a thirdand sometimes fourth party in theproperty management and ownership.As a result, the average leadtime forinstallation <strong>of</strong> a corporate chargingsolution is around 70 days, whichis twice as long as for a homecharging solution.The general process for the installation<strong>of</strong> charging infrastructure for corporateapplications can be seen in Figure 40.AVERAGE / MEDIAN LEADTIME = 73 / 59 DAYSContractnegotiationSite worksplanningSite worksHandoverOperation• Explain deed• Q&A• In-principleagreement• Legal• Notifysub-contractor• Site survey• Report / quote• Signage• Scheduling• Site prep• Site works• Test andcommission• Demonstration • Paymentfor works• Staff training• Reporting• Transition• Sign-<strong>of</strong>f• Works approval• Install signage• Consultation• Ground-markingFigure 40. Schematic <strong>of</strong> the charging infrastructure installation process for commercial property.CREATING A MARKET 73
Further explanation <strong>of</strong> what thesesteps encompass can be found below:1. Contract negotiation – the formalagreement for the corporateentity to participate in the <strong>trial</strong> isnegotiated through to sign-<strong>of</strong>f; theagreement includes provisions forlease <strong>of</strong> the <strong>trial</strong> <strong>vehicle</strong>s, whichwas the focus <strong>of</strong> the corporateparticipant involvement; gaininginternal approval for the costsassociated with the chargingcircuit and <strong>vehicle</strong> lease was thecause <strong>of</strong> significant variation inthe leadtime for completion <strong>of</strong>this step (which due to the <strong>vehicle</strong>lease issue has been excludedfrom the installation leadtimescope definition)2. Site works planning – thecharging infrastructureprovider is introduced to thecorporate participant and asite visit arranged – this is thestart date for assessment <strong>of</strong>the installation leadtime; thesite visit kicks the project <strong>of</strong>fand includes a preliminarysurvey <strong>of</strong> options informedby all parties; the corporateparticipant identifies theirpreferred location taking initialadvice into account and agreeson the installation strategy – touse the charging infrastructureprovider subcontractor or installthe charging circuit to thecharging infrastructure providerspecification; example contentis supplied to the corporateparticipant for deliberation on thesignage/ground-marking for thesite, and the plan for manufactureand installation agreed; the worksplan is formalised between partiesand signed-<strong>of</strong>f through a worksapproval/work order process3. Site works – installer arrangessite visit, to either complete theentire installation or install thecharging outlet at the <strong>term</strong>inal tothe charging circuit supplied bythe corporate participant; chargingstation commissioned into service;signage and ground-markingis delivered/installed as per theworks plan agreement4. Handover – charging stationoperation is demonstrated tocorporate participant; <strong>Department</strong>notified once complete sothat <strong>vehicle</strong> handover can bescheduled – this is the finishdate for assessment <strong>of</strong> theinstallation leadtime5. Operation – <strong>Department</strong>/corporateparticipant receives invoice/actions payment; corporateparticipant staff are trained aspart <strong>of</strong> <strong>electric</strong> <strong>vehicle</strong> induction;charging activity commences; datais gathered through a telemetrylink to the network operatingcentre; at completion <strong>of</strong> <strong>trial</strong> thecorporate participant is providedwith an <strong>of</strong>fer to retain the chargingoutlet if so desired, otherwise it isremoved and the site remediatedto their satisfactionThe site works planning (step 2)has the strongest bearing on theinstallation leadtime. Various pitfallsthat may be encountered include:• Budget approval for the works (asa spillover from step 1)• Unforeseen cost blow-outs, due to:−−−the need for trenching insupport <strong>of</strong> a free-standingcharging outletlong cable-runs to link upwith a point <strong>of</strong> <strong>electric</strong>alsupply that is billed back tothe corporate participantParking and/or trafficmanagement issues for thesite, particularly in seekingleast-cost locations relativeto a point <strong>of</strong> <strong>electric</strong>al supply.• Third-party approvals from theproperty management/owner,which may stumble on:−−−difficulties engaging with theproperty management/owner,or fostering an understandingin what is being proposedacceptance <strong>of</strong> risks andliabilities, particularly forissues arising out <strong>of</strong> siteworks conducted in thevicinity <strong>of</strong> the charging outletinstitutionalised approvalsprocesses, such as those thatrelate to airports or othersites with security concerns.
Based upon the <strong>trial</strong> experience, theincidence <strong>of</strong> these issues greatlyincreases in shared tenancies. Thesepremises were <strong>of</strong>ten characterised byunsupportive property management,challenging energy metering andinflexible parking arrangements. Forthese reasons, corporate entities thatlease space in multi-storey buildingsin which their parking allocation islocated remotely from their <strong>of</strong>ficespace <strong>of</strong>ten face insurmountableobstacles to installation <strong>of</strong> <strong>electric</strong><strong>vehicle</strong> charging capability. The<strong>Department</strong>’s own experiencedescribed in Section 5.3.1 took nearlyfour months to resolve by ultimatelyresorting to a different location fromwhere the <strong>vehicle</strong> would have beenlocated by choice.Signage and ground-marking issuesare also worthy <strong>of</strong> special mention,both on account <strong>of</strong> their importancein realising the fleet operator EV valueproposition (by maximising visibility<strong>of</strong> their <strong>vehicle</strong>), and on account <strong>of</strong>the inefficient process and problemscommonly experienced.The <strong>trial</strong> charging infrastructureproviders generally did not includethis as part <strong>of</strong> their service <strong>of</strong>fering.The corporate participant generallydid not have expertise or capacity toaddress the issue. Where required,the <strong>Department</strong> usually facilitatedthe design <strong>of</strong> the signage/groundmarkingbased upon the basicdesigns developed as part <strong>of</strong> the<strong>trial</strong> (refer to Figure 31 andFigure 49). Signage was generallydelivered to the site for installationby the corporate participant or theirproperty management, a processwhich was prone to lengthy delays(for example, to source fastenersfor attachment <strong>of</strong> the signage, orsimply due to a lack <strong>of</strong> prioritisationby the relevant parties). Groundmarkingwas generally completedby specialist providers referred onby the <strong>Department</strong> to the corporateparticipant, a process which wasalso prone to lengthy delays. Efficientsignage/ground-marking designand implementation was generallydependent upon it being included aspart <strong>of</strong> the overall works planning/delivery process.5.3.3 When do fleets charge<strong>electric</strong> <strong>vehicle</strong>s?In contrast with the households, thefleets participating in the <strong>trial</strong> havemostly charged their <strong>vehicle</strong>s duringbusiness hours.As shown in Figure 41, the fleetcharging demand pr<strong>of</strong>ile can beexplained in <strong>term</strong>s <strong>of</strong> the following<strong>vehicle</strong> travel behaviours:• Returning from having spent thenight travelling to/from employeeresidences that are mostly notequipped with charging outlets(6am to 12pm)• Returning from work-relatedtravel duties during the day(10am to 4pm)• Departing from the fleet garaginglocation to employee residences(4pm onwards).0.500.450.40HouseholdsFleets0.35Power (kW)0.300.250.200.150.100.0505101520Hours (GMT + 10)Figure 41. Electric <strong>vehicle</strong> charging demand pr<strong>of</strong>iles for fleet and household <strong>trial</strong> participants (n = 41 and 83 respectively).CREATING A MARKET 75
Very few fleet participants deployed‘network’ charging strategies thatprovided overnight charging optionsoutside <strong>of</strong> the central charginglocation for the <strong>vehicle</strong>. Despite this,the majority <strong>of</strong> the fleet participantcharging has taken place at thebusiness premises during businesshours, effectively reducing the <strong>vehicle</strong>availability for operational duties.This may be explained by thedeployment strategy for the <strong>trial</strong><strong>vehicle</strong>s, which were strongly promotedfor staff to ‘experience’ throughovernight evaluations. While thismay have contributed to the staffenthusiasm for the <strong>vehicle</strong>s <strong>report</strong>edby many fleets, it may have been asignificant contributor to the relativeunder-utilisation <strong>of</strong> the <strong>vehicle</strong>s as wasevidenced by average distance travelled(refer Section 4.3.2).5.3.4 What do fleets think<strong>of</strong> charging?Fleets were generally <strong>of</strong> the view thatfast charging, longer range and/orpublic charging options were neededfor <strong>electric</strong> <strong>vehicle</strong>s to succeed.These responses reflect the assetmanagement challenge for a corporateEV – a <strong>vehicle</strong> that is plugged inand charging is also incurringdepreciation and other standingcosts without providing any benefitto the organisation.Trial fleet participants were alsoresistant to the staff time requiredfor charging management. Ensuringa <strong>vehicle</strong> was plugged in, balancing<strong>vehicle</strong> bookings with chargingrequirements, easily and reliablyknowing what the actual chargelevel was <strong>of</strong> a <strong>vehicle</strong> at any one time– these were issues that persistedfor many fleet operators over theduration <strong>of</strong> their involvement in the<strong>trial</strong> and reduced their acceptance<strong>of</strong> the <strong>vehicle</strong>.These experiences varied between fleetparticipants on account <strong>of</strong> the variationbetween charging service providers,and also due to the deploymentstrategy for the <strong>vehicle</strong>. At least onefleet operator developed an automatedbooking system that took chargingneeds into account, reducing the<strong>vehicle</strong> management overhead for staff.It should also be noted that none <strong>of</strong>the <strong>trial</strong> <strong>vehicle</strong>s and only a smallamount <strong>of</strong> the charging infrastructure/services provided real-time, remotelyaccessibleinformation about thecharging status or level <strong>of</strong> the <strong>vehicle</strong>.These features are available to varyingdegrees on <strong>vehicle</strong>s and charginginfrastructure that are now in theAustralian market.5.3.5 What has beenthe experience <strong>of</strong>workplace charging?Workplace charging for the householdparticipants was a key enabler forincreased utilisation and acceptance<strong>of</strong> the <strong>trial</strong> <strong>vehicle</strong>s. Although the<strong>trial</strong> findings suggest that workplacecharging could significantly enhancethe EV value proposition for would-bebuyers, the case for employers has yetto be substantiated.The average daily <strong>electric</strong> <strong>vehicle</strong>driving distance for the 11 householdswith a workplace charging optionwas 38 kilometres compared to27 kilometres for the 65 non-workplacecharging households. Furthermore,<strong>of</strong> the eight households who hadan average EV driving distance <strong>of</strong>50 kilometres or more, four wereequipped with workplace charging.This indicates that workplace charginghas been a key enabler for increasedutilisation <strong>of</strong> the <strong>trial</strong> <strong>vehicle</strong>s.In addition, discussions with thehousehold participants who hadaccess to workplace chargingdiscerned increased acceptance <strong>of</strong>their EV as a result <strong>of</strong> the workplacecharging option. Many driversdescribed workplace charging ashaving removed the range limitation<strong>of</strong> the <strong>vehicle</strong>, even for relatively longdistance commutes – refer to thebreak-out for a more detailed accountfor one <strong>of</strong> these participants.
WORKPLACE CHARGING CASE STUDYVICTORIAN EV TRIAL HOUSEHOLD PARTICIPANTOne household participant supplied with a Nissan LEAF had a workplace commute <strong>of</strong> around 40 kilometreseach way. Their normal <strong>vehicle</strong> was a current model Volkswagen Golf GTI, for which the Nissan LEAF is areasonable comparison for assessment <strong>of</strong> EV acceptance. Prior to commissioning <strong>of</strong> their workplace chargingoption they described the <strong>vehicle</strong> as being a pleasure to drive, but significantly limited by the available rangewith a home charging option alone –‘It prevented me from doing anything more than simply driving to and from home, which has meant that most <strong>of</strong> thetime I left the <strong>vehicle</strong> for my wife to drive’.Following commissioning <strong>of</strong> the workplace charging option, the participant said their perception <strong>of</strong> the EV hadbeen transformed –‘I don’t have to worry at all about range now… it’s just like a normal car’.Further assessment <strong>of</strong> the costs and benefits revealed some interesting findings. Based upon the <strong>report</strong>ed fueleconomy figure for the Golf GTI, this household participant would spend around $45 per week on fuel costs fortheir commute alone (using petrol priced at $1.40/L). When asked as to what they would be prepared to pay forthe workplace charging option, the participant was <strong>of</strong> the opinion that the service should either be free or nomore than the cost <strong>of</strong> the <strong>electric</strong>ity supplied under a commercial tariff (which is likely to be cheaper than theirresidential tariff). Under a commercial tariff the cost <strong>of</strong> the <strong>electric</strong>ity consumed by workplace charging <strong>of</strong> theirLEAF can be approximated as $5.50 per week, which would be in addition to the $9 per week they would pay fortheir home charging contribution to the commute (assuming $0.25/kWh for GreenPower).This suggests that even if required to meet the <strong>electric</strong>ity costs <strong>of</strong> their workplace charging use, the <strong>trial</strong>participant would save around $30 per week on transport energy costs from their commute as compared totheir Golf GTI, or nearly $1,400 across the working year (46 weeks).CREATING A MARKET 77
5.3.6 What are the issuesand opportunities for<strong>electric</strong> <strong>vehicle</strong> charging bycorporate entities?The clear challenge for corporatecharging locations relates to theinvolvement <strong>of</strong> third parties in theapproval process for the manycommercial properties which areleased. Delays and even denialson requests for cost-effectivecharging solutions have provento be a major obstacle for manycorporate <strong>trial</strong> participants.This situation appears to mirrorthe experiences elsewhere. A survey<strong>of</strong> 70 Californian employers foundthat the majority that were supplyingworkplace charging options foremployees owned both their ownbuilding and the accompanying parkingarea (CALSTART 2012).Future-pro<strong>of</strong>ing for <strong>electric</strong><strong>vehicle</strong> charging during thedesign and construction <strong>of</strong> newdevelopments should be promoted– this is the objective <strong>of</strong> the Guidanceon Land-use Planning for ElectricVehicle Parking and Charging (DOT2012e) described earlier.This document should support effortsto raise awareness, understanding andacceptance <strong>of</strong> EV technology withinthe commercial property managementsector. Engagement should includeconsultation to better understand whatthe preferred solutions are for propertyowners and managers, with a viewto streamlining approvals processesfor all involved. Industry associationssuch as the Real Estate Institute <strong>of</strong>Victoria and the Property Council <strong>of</strong>Australia provide a starting point fordissemination <strong>of</strong> information anddiscussion <strong>of</strong> ‘best practice’ solutionsfor all parties. There are also a number<strong>of</strong> key players within the sector whocan be engaged directly and efficiently.Another means by which support for<strong>electric</strong> <strong>vehicle</strong> charging outlets incommercial property may be increasedis through recognition within buildingrating schemes, as is the case withthe U.S. Leadership in Energy andEnvironmental Design program 15 .Recognition <strong>of</strong> this type wouldprovide benefits to property ownersand managers in <strong>term</strong>s <strong>of</strong> increasedmarketability and returns. To this endthe <strong>trial</strong> has been in discussions withthe Green Building Council <strong>of</strong> Australiaaround development <strong>of</strong> their GreenStar – Interiors building fit-out ratingtool. The pilot rating tool has includedrecognition <strong>of</strong> EV charging (GBCA2012), and support has been <strong>of</strong>feredfor pilot tool users to assist in take-up<strong>of</strong> this option as part <strong>of</strong> their GreenBuilding fit-out plan.A corporate network charging strategyprovides a range <strong>of</strong> benefits thatmay greatly increase the appeal <strong>of</strong>EVs to fleet operators. Locationsthat may be considered based uponthe service duties for fleet <strong>vehicle</strong>sinclude the portfolio <strong>of</strong> corporate sites,key customer sites (installed underpartnership), and staff residences– refer to Table 13.15 http://new.usgbc.org/leed
Workplace charging appears to be akey enabler for the EV business case– charging at both ends <strong>of</strong> the journeyallows high mileage drivers to takeadvantage <strong>of</strong> the EV operational costsavings, and removes any concernsabout range limitations.The significance <strong>of</strong> workplacecharging for the emerging EV marketis highlighted by the results from the<strong>trial</strong> application to participate process.Figure 42 provides a breakdown in dayand night-time parking locations forthe would-be EV drivers who appliedto participate in the <strong>trial</strong>. For all carsin these households, nearly four infive were <strong>report</strong>ed to be parked atthe workplace during daytime hours.Additional evidence in support <strong>of</strong>workplace charging can be seen inFigure 22.Employer benefits are suggested toinclude improved staff attraction/retention, reduced transport energycosts for salary-packaged employees,and addition <strong>of</strong> a leading-edgecapability to their sustainabilitycredentials. However while theevidence-base for these items isonly now being compiled, the coststo employers may be a significantdeterrent. Direct costs may be incurredfrom parking, infrastructure and/orenergy use, while indirect costs includestaff education and training, planningand management overheads.Once an organisation elects to pursueworkplace charging, this may occurthrough a number <strong>of</strong> different avenues:• Making fleet EV charging outletsavailable for staff use• Partnering with nearbycommercial car-parking for theprovision <strong>of</strong> EV charging locations• Installing EV charging outlets incompany car-parking• Aligning <strong>vehicle</strong> and chargingsalary packaging options.Location Opportunities IssuesPortfolio <strong>of</strong> corporate sitesKey customer sitesOn-street sponsored sitesStaff residencesIncrease <strong>vehicle</strong> utilisationPromote learning across the organisationIncrease visibility to key stakeholdersIncrease visibility to key stakeholdersShare learningsPromote EV uptake through the supply-chainPotential cost sharing between organisationsIncrease <strong>vehicle</strong> utilisation for all partiesIncrease visibility <strong>of</strong> branded <strong>vehicle</strong>Cost sharing may be a key enabler for chargingstation establishmentIncreased/guaranteed utilisation for chargingstationPromote EV uptake in wider communityImproved oversight <strong>of</strong> transport energy costsReduction in transport energy costs for salarypackaged<strong>vehicle</strong>sEmployee attraction/retentionCoordination across facilities managersVehicle energy use accounting across charginglocationsNegotiations to finalise arrangementsVehicle energy use accounting and/or costreconciliation across charging locationsPotential/perceived risk and liability issuesSunk investment if partnership dissolvesHigh upfront cost <strong>of</strong> on-street locationsVehicle energy use accounting across charginglocationsIncreased damage risk for <strong>vehicle</strong>/chargingstationArrangements for installation <strong>of</strong> charging outletVehicle energy use accounting and/or costreconciliation across charging locationsFringe benefits tax treatment <strong>of</strong> chargingTable 13. Corporate charging network locations – opportunities and issues.CREATING A MARKET 79
CALSTART (2012), a Californianmembership-based organisation thatpromotes clean transport solutions,is seeking to address these issuesthrough their EV Employer Initiative.They are currently developing a range<strong>of</strong> materials to assist in the promotion<strong>of</strong> workplace charging:• Case studies <strong>of</strong> <strong>electric</strong> <strong>vehicle</strong>strategies and internal policies• Electric <strong>vehicle</strong> infrastructureoptions• Guidance on <strong>electric</strong> <strong>vehicle</strong>infrastructure installation• The <strong>electric</strong> <strong>vehicle</strong> valueproposition (costs/benefits)for businesses.An example early-mover companyis Google. At March 2012, Googlehad installed 227 workplacecharging stations at their Californianheadquarters (Schreiber 2012). Theinstallations are part <strong>of</strong> their goal toprovide EV charging capability at fiveper cent <strong>of</strong> regular parking places.Take-up has been impressive, witharound 200 EV driving employeestaking advantage <strong>of</strong> the workplacecharging option provided. Google’smotivations for this includedstaff recruitment and retention,consistency with their CorporateSocial Responsibility commitments,alignment with their EV fleetpractices, and support for their greenbuilding certification.A corporate network charging strategyhas many potential benefits:• Increases effective <strong>vehicle</strong>range/utilisation• Increases productivity throughavoided refuelling <strong>of</strong> normal<strong>vehicle</strong>s and better transportenergy data access/reliability• Increases visibility and byextension the marketing potential<strong>of</strong> the <strong>vehicle</strong>s• Provides partnership opportunitieswith key stakeholders/commondestinations.At homeon-street10%9%At home<strong>of</strong>f-street87%88%Workplacecarpark1%78%Commercialcarpark0%7%Street1%11%Daytime parkingNight time parkingFigure 42. Results from the 2010 <strong>trial</strong> household application to participate process, highlighting the significance <strong>of</strong> theworkplace as a daytime charging location for would-be EV drivers; responses to the question ‘For each car in your household,please provide the daytime/night-time parking location’ (n = 6,237).
One scenario <strong>of</strong> particular interestis the ‘milk run’ as is applied inthe freight and logistics sector.Figure 43 shows a simple milk run<strong>of</strong> component parts being supplied toa manufacturing plant. For a <strong>vehicle</strong>servicing this route, each stop-<strong>of</strong>fpresents as a potential chargingopportunity. Furthermore, if the energyconsumption between stop-<strong>of</strong>fs andthe charging opportunity are both fairlyreliable, the <strong>vehicle</strong> battery might bedownsized so as to be ‘fit-for-purpose’.This would make the <strong>vehicle</strong> cheaper tobuy and may even increase the carryingcapacity <strong>of</strong> the <strong>vehicle</strong>.Preliminary investigations into thisscenario failed to progress due tosupply constraints on <strong>electric</strong> light andmedium commercial <strong>vehicle</strong>s.An additional opportunity exists forfleet <strong>vehicle</strong>s that are charged in acentral location to be used as thebasis for a distributed <strong>electric</strong>itystorage facility. Advanced managementsystems would be required to optimiseagainst <strong>electric</strong>ity and <strong>vehicle</strong>demands, however this scenario is thebest stepping stone for network-wide<strong>vehicle</strong>-to-grid (V2G) interactions asoutlined in Section 5.2.6.A pilot project utilising a captivefleet <strong>of</strong> <strong>electric</strong> <strong>vehicle</strong>s that aremanaged to provide useful energystorage, particularly in alignment withon-site renewable energy generation,would provide a better understanding<strong>of</strong> the technical solution andcommercial viability for largergrid-scale deployment.5.4 PUBLIC CHARGING5.4.1 How much doespublicly-accessible charginginfrastructure cost?Standard charging outlets for publiclocations generally cost aboutthe same as for corporate fleetapplications – around $5,000 per unit.Standard charging circuit costs arehigher however, with the average <strong>of</strong>nearly $3,500 reflecting the greateremphasis on parking location overcost minimisation. Since the VictorianElectric Vehicle Trial launch in 2010,high voltage ‘quick charger’ equipmentcosts have halved to be now around$40,000. Quick charger installationcosts are highly variable, but canbe minimised if provisions aremade during general site constructionor refurbishment.SUPPLIERSUPPLIERManufacturingplantSUPPLIERFigure 43. Conceptual model <strong>of</strong> ‘milk run’ logistics for freight delivery from a range <strong>of</strong> regular suppliers to a manufacturingplant – a scenario potentially well suited to a corporate charging strategy.CREATING A MARKET 81
With reference to Table 14, the limitednumber <strong>of</strong> public charging locations forwhich cost data is available resultedin average cost for the charging circuit<strong>of</strong> around $3,500. These costs reflectpublic charging outlets located incommercial premises rather thanon-street locations.No.INSTALLATIONS11AVERAGE COST $ 3,393MEDIAN COST $ 3,224STD DEV $ 995MAX $ 5,500MIN $ 2,056Table 14. Cost benchmarking <strong>of</strong> the <strong>trial</strong>public charging circuits.Several on-street charging outletslocated on public lands wereinvestigated, and found to be largelycost prohibitive without additionalfunding assistance (beyond thatprovided by the <strong>Department</strong>). Threeon-street locations investigated inMelbourne’s CBD had installationcosts quoted from $15,000-$25,000,in response to which only one sitewas approved to go forwards with theassistance <strong>of</strong> supplementary funding.The funding provider was a corporatefleet operator seeking a high pr<strong>of</strong>ilelocation in the vicinity <strong>of</strong> their place<strong>of</strong> business in which to charge theirbranded <strong>vehicle</strong>.Influences on these costs wereprimarily related to the trenchingrequirements for cabling betweenthe nearest point <strong>of</strong> <strong>electric</strong>al supply(sourced from an underground pit)and the on-street location for thecharging outlet.Quick chargers were contracted at theoutset <strong>of</strong> the <strong>trial</strong> in 2010 at a cost <strong>of</strong>around $90,000 per unit based uponestimated prices for equipment thatwas undergoing commercialisationat that time. Design evolution andmanufacturing improvements haveresulted in rapid cost reductions suchthat in late 2012 the equipment costswere around $40,000. In 2012 Nissanbegan rolling out quick chargers inthe U.S. and Europe at a price <strong>of</strong> $US10,000 (Autoblog 2012b), suggestingthat further cost reductions arehighly likely.For reasons explained in Section 5.4.4,the <strong>trial</strong> quick charger roll-out has yetto be completed. Two quick chargersare being installed in locationswhich are undergoing significantredevelopment for separate reasons,limiting the ability to extract costdata in relation to the quick chargerinstallation specifically.Item Cost CommentsSite preparation $ 2,000 – 4,000 Includes review <strong>of</strong> site, works planning, applications andsubmissions for permits / approvalsTrenching $ 10,000 – 50,000 Varies according to site specific issues including extent <strong>of</strong> cable-run,allowances for existing ground assets/utilities encountered, specialexcavation requirements, possible soil contamination/asbestos/geotechnical issues, consultation required with affected landowners etc.Pipe, pits, conduit $ 3,000 – 6,000 Varies according to extent <strong>of</strong> cable-run, size <strong>of</strong> conduit; typically 3pits for 50 metre cable-runCabling $ 1,000 – 1,500 Varies according to extent <strong>of</strong> cable-run; 16 mm diameter typicalcable size cost is around $20 – 30 per metreCabling pull-through $ 250 – 500 Varies according to extent <strong>of</strong> cable-run; typical cost is around$5 – 10 per metreDistribution board $ 1,500 Varies according to distances, capacity and supplySlab, mounting, installation $ 5,000 – 7,000 For a typical slab length/width/depth <strong>of</strong> 1.2 x 0.8 x 0.2 metresTermination andcommissioning$ 1,000 Includes connection <strong>of</strong> cables, RCD installation, equipment testingand commissioning, customer handover and training; note that thisexcludes network testing and commissioningTotal $ 23,750 – 80,500 Establishment costs only – excludes quick charger hardware costTable 15. Quick charger establishment cost estimates for a ‘brownfield’ site, where distance between the 25 kW quick charger andthe point <strong>of</strong> <strong>electric</strong>al supply is around 50 metres and <strong>electric</strong>al supply upgrades are not required.
Cost data obtained from various sitenegotiations has been benchmarkedto provide indicative costs for quickcharger establishment – refer toTable 15. For a ‘brownfield’ site it isclear that the establishment costs cangreatly exceed that <strong>of</strong> the quick chargerunit, highlighting the reasons forleveraging site works being undertakenfor separate reasons (for example, toreduce/avoid trenching costs).5.4.2 How are publiclyaccessiblechargingoutlets installed?Charging infrastructure is installed by<strong>electric</strong>al contractors drawing uponinformation supplied by the household.From the time <strong>of</strong> the contractor beingnotified <strong>of</strong> the need for an installation,the process to handover usually takesabout five weeks.The general process for the installation<strong>of</strong> publicly-accessible charginginfrastructure on commercial propertycan be seen in Figure 44.Further explanation <strong>of</strong> what thesesteps encompass can be found below:1. Site identification – consideration<strong>of</strong> <strong>electric</strong> <strong>vehicle</strong> ownership andusage informs initial consideration<strong>of</strong> the region and specific locationsthat public charging optionsmay best support; potentialhost sites in these locations arecontacted either at the premise orthrough the parent organisation;discussions are pursued to engagepotential hosts and identifypreferred sites based upon awillingness to proceed2. Contract negotiation – the formalagreement for the corporateentity to participate in the <strong>trial</strong>as a charging infrastructurehost is negotiated through tosign-<strong>of</strong>f; finalisation <strong>of</strong> theagreement occurs in parallelwith de<strong>term</strong>ination <strong>of</strong> thetransaction model for the siteoperation (user payment forparking, charging activities, bothor neither); consideration <strong>of</strong> thecommunications plan for the siteis also initiated; this step wasgenerally found to be the mostlengthy, for reasons that areexplained further belowAVERAGE / MEDIAN LEADTIME = 201 / 140 DAYSSite IDContractnegotiationSite worksplanningSite worksHandoverOperation• Vehicles• Potential hosts• Contact• Meet• Follow-up• Preferred sites• Explain deed• Q&A• In-principleagreement• Legal• Sign-<strong>of</strong>f• Transactionmodel• Communicationsplan• Notifysub-contractor• Site survey• Report / quote• Signage• Worksapproval• Work order• Scheduling• Sitepreparation• Site works• Test andcommission• Install signage• Groundmarking• OH&S• Training• Communications• Transactions• Paymentfor works• Reporting• Surveys• Enforcement• Evaluation• TransitionFigure 44. Schematic <strong>of</strong> the publicly-accessible charging infrastructure installation process for commercial property.CREATING A MARKET 83
3. Site works planning – thecharging infrastructure provideris introduced to the potential hostand a site visit arranged – thisis the start date for assessment<strong>of</strong> the installation leadtime;the site visit kicks the project<strong>of</strong>f and includes a preliminarysurvey <strong>of</strong> options informed by allparties; the corporate participantidentifies their preferred locationtaking initial advice into account;example content is supplied tothe corporate participant fordeliberation on the signage/ground-marking for the site, andthe plan for manufacture andinstallation agreed; the worksplan is formalised betweenparties and signed-<strong>of</strong>f througha works approval/work orderprocess; this step was found tobe lengthy due to the need tonegotiate agreement with multiplestakeholders for reasons that areexplained further below4. Site works – installer arrangesa site visit to undertake theinstallation as per the agreedworks plan; the host prepares thesite by ensuring that it is cordoned<strong>of</strong>f for the duration <strong>of</strong> the works;charging station commissionedinto service; signage and groundmarkingis delivered/installed asper the works plan agreement5. Handover – an OH&S reviewmay be undertaken <strong>of</strong> the site;instruction on the arrangementsfor the site/equipment operationis provided to staff on the groundif required; a launch eventand/or other communicationsare kicked <strong>of</strong>f as part <strong>of</strong> theservice promotion and benefitsrealisation; <strong>Department</strong> notifiedonce the site can be advertisedto <strong>trial</strong> participants as beingavailable for use – this is thefinish date for assessment <strong>of</strong>the installation leadtime6. Operation – <strong>Department</strong>/corporate participant receivesinvoice/actions payment; chargingactivity commences; data gatheredthrough telemetry link to networkoperating centre; various surveys<strong>of</strong> users/stakeholders initiated toassess awareness/understanding/acceptance <strong>of</strong> the charging facility;management <strong>of</strong> site undertakenas part <strong>of</strong> broader enforcementprogram; collective evaluation <strong>of</strong>site performance against prede<strong>term</strong>inedtargets undertaken atagreed milestones; arrangementsat completion <strong>of</strong> <strong>trial</strong> implementedbased upon host agreement.The contract negotiation (step 2) hasbeen by far the most challenging andlongest leadtime aspect <strong>of</strong> the publiccharging infrastructure roll-out. On thepart <strong>of</strong> the hosts there is a desire tonot cede ownership <strong>of</strong> any commercialbenefits to the charging serviceprovider. From a legal perspective,the uncertainty and perceived risks indealing with a new concept such as<strong>electric</strong> <strong>vehicle</strong> charging translate to anunwillingness by the host legal team toaccept liabilities regardless <strong>of</strong> howeverreasonable. Despite the former<strong>Department</strong> <strong>of</strong> <strong>Transport</strong> acting as an‘honest broker’ in these negotiationsand underwriting the cost and riskissues, the majority <strong>of</strong> negotiationswith portfolio-level property ownersbroke down at this stage. In the case<strong>of</strong> one large property asset investmentgroup who have majority interests insome <strong>of</strong> Melbourne’s most prominentshopping centres, negotiations havebeen stuck in this stage for nearly14 months as <strong>of</strong> January 2013 despitethere being an expressed desire fromsenior management to participatein the <strong>trial</strong> and host <strong>electric</strong> <strong>vehicle</strong>charging services.The site works planning (step 3) wasby far the greatest contributor tothe lengthy leadtime that has beenquantified above. The main issue wasthe handover between the corporatelevelproject supporters and thoseon the ground who own the detaileddecision-making. By way <strong>of</strong> example, alarge property investment firm enteredinto an agreement to participate asa charging infrastructure host at acorporate level, following which anew round <strong>of</strong> negotiations commencedwith the individual site managers.The site manager resistance isgenerally related to the opportunitycost associated with assignment<strong>of</strong> the parking asset exclusively forEV parking/charging. Institutionalfailures in transferring decisionsbetween the strategic and operationalarms <strong>of</strong> the organisation are alsovery common, ins<strong>of</strong>ar as therebeing no support to ensure that thecorporate-level agreement progressesto implementation.The signage/ground-marking issuesdescribed in Section 5.3.2 for corporateproperties are also evident, howeverorganisations playing the role <strong>of</strong> ‘host’are generally <strong>of</strong> the view that thisforms part <strong>of</strong> the charging serviceprovider’s responsibilities.
PUBLIC CHARGING CASE STUDYON-STREET CHARGING STATIONS IN MELBOURNE CBDIn 2010 City <strong>of</strong> Melbourne agreed to provide up to 12 on-street parking bays in Melbourne’s CBD for exclusive useas <strong>electric</strong> <strong>vehicle</strong> parking/charging locations for the duration <strong>of</strong> the <strong>trial</strong>. This commitment has underpinned aninvestigation into the process, timelines, obstacles and opportunities for on-street charging stations.Initial attempts to identify suitable sites were confounded by the limited information available about theunderground cables, pipes etc. that may enable/inhibit establishment <strong>of</strong> <strong>electric</strong>al infrastructure. A key inputinto site selection is the location <strong>of</strong> convenient points <strong>of</strong> <strong>electric</strong>al supply, as this has a large bearing on theexcavation/structural works and with this the project costs. This information was possible to obtain through:(i)Formal applications to the <strong>electric</strong>ity network operator in response to detailed works plans (a large andcostly commitment at the site identification stage), or(ii) Informal dialog with the <strong>electric</strong>ity network operator via their representative taking part in the <strong>trial</strong> projectmeetings (who agreed to investigate a number <strong>of</strong> regions <strong>of</strong> around 300 metres diameter as an in-kindcontribution to the <strong>trial</strong>), or(iii) On-the-ground site surveys to identify potential sources <strong>of</strong> <strong>electric</strong>al supply (signified most <strong>of</strong>tenby the presence <strong>of</strong> <strong>electric</strong>al man-hole covers/pits, or above-ground ventilation stacks forunderground substations).As a starting point for the <strong>trial</strong> site identification, an informal request was supplied to the <strong>electric</strong>ity networkoperator for information about relevant underground <strong>electric</strong>al infrastructure within a 300 metre radius <strong>of</strong> sixlocations <strong>of</strong> interest. These locations were selected to coincide with fleet EV operator parking preferences, whichwould help ensure site utilisation. In response to this request a mark-up map was supplied <strong>of</strong> potentially relevant<strong>electric</strong>al infrastructure in each area. On-the-ground site surveys eliminated all but one site, primarily due to thenetwork infrastructure not aligning with the parking and/or traffic arrangements. Criminal damage risks,for example due to the proximity <strong>of</strong> a late-night entertainment venue, were also an influence on the site review.One preferred location was taken forwards initially via an application by the charging service provider for anexemption from Energy Safe Victoria under the Electrical Safety Act 2000. The exemption was granted partlydue to the agreement with City <strong>of</strong> Melbourne for the provision <strong>of</strong> on-street parking/charging locations asan in-kind contribution to the <strong>trial</strong>. Having gained the exemption, the charging service provider developed adetailed works plan in consultation with the <strong>electric</strong>ity network operator. Despite the preliminary site surveysundertaken above, the detailed works plan was costed at around $30,000 for a single standard charging outlet,in addition to which complications were identified in relation to some heritage-listed trees in the vicinity <strong>of</strong> thesite. At this point a decision was made to not proceed with this site.Separate and subsequent to the experience above, a new site was identified in partnership with a corporatesponsor who was seeking a highly visible location outside <strong>of</strong> their <strong>of</strong>fices to showcase their branded <strong>electric</strong><strong>vehicle</strong>s. Having secured the supplementary funding commitment along with a minimum-level site utilisation,a decision to proceed with the preliminary works plan and approvals processes was made in May 2012.A similar process to that outlined above was undertaken by a <strong>trial</strong> charging service provider. An exemptionapproval was obtained from Energy Safe Victoria, following which a detailed works plan was developed. Thedetailed works plan drew on input supplied by the <strong>electric</strong>ity network operator, confirming the adequacy <strong>of</strong><strong>electric</strong>al supply and outlining the proposed method <strong>of</strong> connection to the network. At this point the projectproposal costs were estimated at around $20,000.The detailed works plan was then lodged with City <strong>of</strong> Melbourne for a planning approval. The initial reviewreturned an approval in-principle for the parking reassignment, along with a request for further information.The main risk issues discerned by council as needing to be addressed were:• Tripping hazard from the charging cable• Cyclist hazard from the charging plug protruding from the <strong>vehicle</strong>• Shock hazard potential.As <strong>of</strong> January 2013 discussions were still underway regarding the risk assessment submission– eight months from when the detailed works planning process was initiated.Indications from City <strong>of</strong> Melbourne are that works are generally scheduled to occur aroundeight weeks from when the planning approval is finalised.CREATING A MARKET 85
5.4.3 What do people thinkabout public charging?Widespread opinion both here andoverseas indicates that on account <strong>of</strong>its role in addressing <strong>electric</strong> <strong>vehicle</strong>range limitations, the availability <strong>of</strong>public charging infrastructure is a keyissue for EV uptake. Even once peoplehave lived with the <strong>vehicle</strong>s, opinionpersists on the value <strong>of</strong> public charginginfrastructure despite widespreadacceptance that home chargingaddresses most driver needs. The role<strong>of</strong> public charging infrastructure as arange ‘insurance policy’ was furtherhighlighted by the identification <strong>of</strong>measures to ensure the accessibility <strong>of</strong>charging outlets as being <strong>of</strong>high priority.Surveys <strong>of</strong> stakeholders on the barriersto widespread/successful introduction<strong>of</strong> <strong>electric</strong> <strong>vehicle</strong>s have routinelyidentified the availability <strong>of</strong> publiccharging infrastructure as beinga key issue for EV market development:• The 2,200 applicants forparticipation in the household<strong>vehicle</strong> roll-out rated the lack<strong>of</strong> recharge infrastructure 4.2out <strong>of</strong> 5 (std dev 0.8) in <strong>term</strong>s<strong>of</strong> significance as a barrier tosuccessful EV introduction forVictoria (DOT 2012)• Fleet participants and attendeesat the fleet workshops all ratedcharging infrastructure availabilityas a key issue for EV uptake (referto Section 4.3.4)• A survey <strong>of</strong> 53 attendees at theDecember 2012 EV Conferencein Melbourne rated the lack <strong>of</strong>recharge infrastructure4.1 out <strong>of</strong> 5 (std dev 1.0) in<strong>term</strong>s <strong>of</strong> significance as abarrier to successful EVintroduction for Victoria.These results correlate well withfindings from overseas, where non-EVowners in particular consider the lack<strong>of</strong> public charging infrastructure to bea key barrier for EV adoption (Gopaland Thawrani 2012).Public charging outlets have beencommissioned into service graduallyover the life <strong>of</strong> the <strong>trial</strong> such that20 locations were available inthe greater Melbourne area byJanuary 2013. For the majority <strong>of</strong><strong>trial</strong> participants, this has meantthat charging locations have onlyoccasionally been available at theirintended destination. Nevertheless,the <strong>trial</strong> household participantsurvey results are representative<strong>of</strong> people with a minimum <strong>of</strong>six weeks experience <strong>of</strong> life withan <strong>electric</strong> <strong>vehicle</strong>.Issue for considerationAverage score(out <strong>of</strong> 5)Std devFines for non-EV users who park in EV-specific locations 4.5 1.0Promote EV usage with high-pr<strong>of</strong>ile locations and/or free charging 4.4 0.9Availability <strong>of</strong> charging points similar to that <strong>of</strong> petrol stations / bowsers 4.2 1.1Provision <strong>of</strong> a booking facility that allows drivers to reserve their charging point before arrival 4.0 1.1Ensure the safety <strong>of</strong> other road users (for example pedestrians, cyclists) 3.8 1.3User-pays approach where charging costs reflect energy use, parking and equipment costs 3.4 1.0Preferential treatment for EV drivers on account <strong>of</strong> their contribution to the 'public good' 3.3 1.3Appease the concerns <strong>of</strong> local stakeholders in nearby businesses 3.1 1.1Discourage car use in highly-populated areas 2.9 1.3Table 16. Results from a survey <strong>of</strong> <strong>trial</strong> household participants on their opinions <strong>of</strong> the issues that should be taken into accountin the provision <strong>of</strong> publicly-accessible EV charging points; survey interval was around six weeks into their EV experience(n = 76, marks out <strong>of</strong> 5 where 5 = very important and 1 = very unimportant).
Household participants were askedabout various issues they felt shouldbe taken into consideration in relationto public charging. With referenceto Table 16, the highest priorityissues according to <strong>trial</strong> householdparticipants were:• Accessibility – ensuring chargingoutlets would be accessible whenrequired, with enforcement <strong>of</strong>EV-only parking the highestranked response and provision<strong>of</strong> a reservation facility alsohighly ranked• Availability – consistent withthe views <strong>of</strong> other stakeholders,provision <strong>of</strong> public charginginfrastructure was highlyranked – at high pr<strong>of</strong>ile locationsin order to promote EV usage,and at a density similar to petrolstations/bowsers.The importance <strong>of</strong> accessibility maybe interpreted as an insight into therole <strong>of</strong> public charging infrastructureas an ‘insurance policy’ for <strong>electric</strong><strong>vehicle</strong> range limitations. Withreference to Section 5.2.5, nearly80 per cent <strong>of</strong> participants felt thathome charging met their needs.This suggests that most EV driverswill only use public charging outletsinfrequently, but they want to be ableto reliably access it when they do needit. This interpretation is consistentwith the perception <strong>of</strong> the role <strong>of</strong>public charging infrastructure as a keyenabler for promoting adoption <strong>of</strong> EVs.Household participants were alsoasked about the influence <strong>of</strong> cost andconvenience on the likely appeal <strong>of</strong>public charging infrastructure.Results suggest that convenienceoutweighs cost in <strong>term</strong>s <strong>of</strong> its effecton driver appeal, with the number <strong>of</strong>participants who would not use publiccharging outlets regardless <strong>of</strong> priceincreasing from 5 to around 50 per centif they had to go out <strong>of</strong> their way to findthem – refer to Figure 45. This findingis potentially inconsistent with the view<strong>of</strong> public charging infrastructure as an‘insurance policy’.While nearly 87 per cent <strong>of</strong> drivers saythey’d be willing to pay for the serviceif the charging outlet was located attheir intended parking destination,it should be recalled that a highproportion <strong>of</strong> drivers also said thathome charging met their needs (referto above/Section 5.2.5). These resultshighlight the potentially high-riskmarket opportunity for public charginginfrastructure hosts and operators.Yes, even if itwere double thecost <strong>of</strong> homechargingYes, but only if itcost the same ashome chargingYes, but only ifthey were freeDo you think you would use <strong>electric</strong><strong>vehicle</strong> charging points if they wereavailable at places that you parkother than your home?Do you think you would use standard<strong>electric</strong> <strong>vehicle</strong> charging points otherthan your home if they were availablebut you had to go out <strong>of</strong> your wayto find them?No0% 10% 20% 30% 40% 50% 60% 70% 80%Figure 45. Results from a survey <strong>of</strong> <strong>trial</strong> household participants in response to two questions relating to the likely appeal <strong>of</strong> publiccharging outlets; the identical response options for both questions examined cost influences, while the difference between thetwo questions assessed convenience; survey interval was around six weeks into their EV experience (n = 76; multiple choice/singlechoice only).CREATING A MARKET 87
As further evidence <strong>of</strong> the uncertaintieswithin the public charging stationbusiness model, the quote belowsourced from the Victorian ElectricVehicle Trial Discussion Boardprovides an interesting insight intoone driver’s reckoning on use <strong>of</strong> publiccharging outlets:So where’s the line between theconvenience, economy and luxury<strong>of</strong> driving to work in an EV and thecommute by public transport?... for usthe economy is the governing factor,followed closely by convenience.The basic maths says if we cancommute in and out on one chargefrom our home or if required anadditional charge from a freecharge point in the CBD, then it’s aneconomical solution, while at least twopeople are traveling.The approx $3 for the full charge athome @ 16kWh x approx $0.20/kWhfor the i-MiEV or approx $0.80 forthe full charge <strong>of</strong> the Prius and the$15 parking costs is comparable butcheaper than the $22 odd for two allday zone 1&2 myki transactions (wearand tear on the EV plays a part, but inthe interest <strong>of</strong> simplicity I’ve ignoredthose additional costs).The convenience <strong>of</strong> the 40 to 50 minutecommute by EV beats the 1 to1.25 hour commute on public transportuntil you add a 20 min walk to workand back to the car if the chargepoint is not conveniently located nearwork, then the two options comefrighteningly close.Victorian Electric Vehicle Trialhousehold participant, 2012Results from more mature marketsin <strong>term</strong>s <strong>of</strong> <strong>vehicle</strong> and charginginfrastructure roll-out provide similarlymixed messages about the viability <strong>of</strong>publicly-accessible charging outlets.Up to September 2012 the largestinfrastructure roll-out taking place inthe United States as part <strong>of</strong> ‘The EVProject’ had delivered 1,818 publiclyaccessiblecharging stations (ECOtality2012). In the assessment <strong>of</strong> thecharging activities <strong>of</strong> the 6,071 <strong>vehicle</strong>staking part in the project, a preliminaryassessment is that around 80 per cent<strong>of</strong> private <strong>electric</strong> <strong>vehicle</strong> chargingevents typically take place at the home.The remaining 20 per cent<strong>of</strong> charging events take place atpublicly-available and workplacecharging locations. Although theperformance <strong>of</strong> individual chargingstations has not been <strong>report</strong>ed,it was noted that the presence <strong>of</strong>an <strong>electric</strong> car-share operator inSan Diego resulted in significantincrease in utilisation <strong>of</strong> the publiccharging stations.5.4.4 Where should publiccharging be available?Parking areas within or nearby toshopping centres and strips should bea priority for public charging facilities.Specific locations should be selectedon the basis <strong>of</strong> their alignment with theEV driver demographic. Local factorsrelating to existing parking demandor management, along with <strong>electric</strong>itynetwork configuration and potentialsponsorship opportunities shouldalso be taken into account in order tostreamline the roll-out. Quick chargersshould be strategically placed alongtraffic corridors.The most convenient locations for‘opportunity’ charging are those where<strong>vehicle</strong>s are most commonly parkedother than home and work (the twomost common locations – refer toFigure 42). Based upon the responsesfrom the household application toparticipate, this means shoppingcentres or strips – refer to Figure 46.This observation is consistent withpublic infrastructure guidance providedelsewhere (US DOE 2012a).Other locations where <strong>vehicle</strong>s maypark regularly and for periods <strong>of</strong>several hours may also be well suitedto ‘opportunity’ charging <strong>of</strong> <strong>electric</strong><strong>vehicle</strong>s. Hospitality and entertainmentlocations such as restaurants andcinemas, recreation facilities,airports, railway stations and other‘park-and-ride’ locations could allplay a role in a comprehensive publicEV charging network.
The following quote supplied to the<strong>trial</strong> discussion board at anearly stage <strong>of</strong> the public chargingnetwork roll-out sums up thedriver perspective:I got a list <strong>of</strong> public charging locationsfrom both ChargePoint and BetterPlace but didn’t actually use anyduring the <strong>trial</strong> as they didn’t prove tobe convenient to the places I went.Given the time required to be useful(probably min 1-2 hours), none endedup being close to the shops, cinemasor work where I spent any extendedtime – I would’ve had to change whereI went. Obviously this will change asmore get rolled out – I think it would begreat to be able to plug in at shoppingcentre or cinema for example.In <strong>term</strong>s <strong>of</strong> specific locations, thereare a range <strong>of</strong> indicators that may beuseful in ascertaining whether a siteis a good candidate for public charging(Luskin 2012):• Electric <strong>vehicle</strong>s are already usingthe site or a nearby site• Customer/driver surveys revealan interest in <strong>electric</strong> <strong>vehicle</strong>sor intention to purchase an<strong>electric</strong> <strong>vehicle</strong>• There is a higher-than-averageconcentration <strong>of</strong> hybrid <strong>vehicle</strong>susing the site or a nearby site• The site user demographicsmatch those <strong>of</strong> people likelyto be interested in <strong>electric</strong><strong>vehicle</strong>s, such as higher levels <strong>of</strong>educational achievement, higherthan average household incomes,interest in new technology,environmentally-aware(refer also Section 4.2.1).Shoppingcentre/stripFriend's/relative'shouseNoneOther(Specify Q1D3o)Recreation facilityEducation facilityHospitality/entertainment0% 10% 20% 30% 40%Proportion <strong>of</strong> <strong>vehicle</strong>sFigure 46. Results from the 2012 <strong>trial</strong> household application to participate process in response to the question ‘What isthe most common parking location for each <strong>vehicle</strong> in your household other than home or work?’ (n = 2,200; DOT 2012c).CREATING A MARKET 89
Drawing upon the <strong>trial</strong> experience,additional factors which maypromote or reduce the likely successin a site hosting EV charginginfrastructure include:• Existing parking demand: wheredemand exceeds supply, allocation<strong>of</strong> parking for exclusively <strong>electric</strong><strong>vehicle</strong>s may be resisted bythe operator and resented byother users• Existing parking arrangements:where the concerns <strong>of</strong> keystakeholders for any site limit theappetite to reconfigure existingparking allocations to better alignwith EV charging establishmentor operation• Parking user model: where<strong>vehicle</strong>s are normally parkedfor the entire day, this will limitthe ability to recover costs oncharging infrastructure• Electricity network infrastructure:where <strong>electric</strong>al supply isinsufficient, difficult to access,or requiring separate metering,establishment costs for charginginfrastructure may be prohibitive• Sponsorship opportunities: wherenearby retailers or hospitalityproviders are seeking to attractthe EV driver demographic, orwhere a fleet EV operator isseeking to promote the visibility<strong>of</strong> their (branded) <strong>vehicle</strong> in aspecific location (refer to Section5.4.3 for an example relating to<strong>electric</strong> car-share).From the perspective <strong>of</strong> influencingEV market growth, high pr<strong>of</strong>ilesites are more likely to influence driverperceptions regarding management <strong>of</strong>EV range limitations. While this drovemuch <strong>of</strong> the planning behind the<strong>trial</strong> public charging infrastructureroll-out, the factors above werefound to be the ultimate de<strong>term</strong>inants<strong>of</strong> a site owner electing to host EVcharging infrastructure.Quick charger locations align moreclosely with the ‘emergency’ chargingmodel where a quick top-up is requireden route. This suggests that locationsshould be sited as close as possible tohigh traffic thoroughfares suchas arterial roads. Service stationsare <strong>of</strong>ten sited at these locationsfor similar reasons, making themwell-suited to the role <strong>of</strong> hostingquick chargers.Despite this, the <strong>trial</strong> experience hasfound that the issues identified forstandard chargers above dominatednegotiations on quick charger sites.Even in instances where solutions forthese issues existed, the difficulty inproviding compelling answers to thekey questions <strong>of</strong> ‘why here?’ and ‘whynow?’ severely delayed or ultimatelyprevented sites from being progressed.5.4.5 What are the issuesand opportunities forpublic charging?Due to their influence on driverperceptions regarding management<strong>of</strong> EV range limitations (refer to Section5.4.3), public charging options appearto have a significant influence on<strong>electric</strong> <strong>vehicle</strong> uptake. Consequently,the challenges in promoting a viablepublic charging network are some <strong>of</strong>the most pertinent for the promotion<strong>of</strong> the <strong>electric</strong> <strong>vehicle</strong> market generally.The opinions <strong>of</strong> the <strong>trial</strong> householdparticipants indicate that there maybe a market for public charging by EVdrivers, however this market is likely tobe financially-challenging for chargingservice providers.Experience from the United Statessupports this view. Between Julyand September 2012 the mostadvanced market for public charginginfrastructure availability taking partin the EV Project was the Phoenixmetropolitan area 16 (ECOtality 2012).During this time, 259 publiclyaccessibleEV Project charging outletswere servicing a market <strong>of</strong> 250participating EVs and an undisclosednumber <strong>of</strong> EVs beyond this. Theseoutlets were <strong>report</strong>ed as having a carplugged in around two per cent <strong>of</strong> theavailable time and delivering energy(charging) around half that.16 Oregon had more publicly-accessible charging infrastructure than Phoenix during this period, however it has been excluded from this discussion due to thedistortion in the utilisation figures <strong>report</strong>ed by the involvement <strong>of</strong> an <strong>electric</strong> car-share service
Despite these challenging figuresand based upon the large body <strong>of</strong>information arising out <strong>of</strong> The EVProject overall, ECOtality (2012)believe that around 20 per cent <strong>of</strong>charging activities may be carriedout at publicly-accessible locations.This conclusion may be influenced bya contrast between the behavioursadopted by drivers <strong>of</strong> different <strong>electric</strong><strong>vehicle</strong> technologies. The averagenumber <strong>of</strong> charge events per day forNissan LEAF participants is 1.1 andthe daily driving distance is within thebattery capacity – results consistentwith those from the Victorian ElectricVehicle Trial. However for the ChevroletVolt PHEV the average charge eventsper day is 1.4 – this indicates that Voltdrivers, who drive a greater distanceeach day than LEAF drivers, arestriving to operate their cars as muchas possible on <strong>electric</strong>ity (due to thefinancial advantage in doing this).It may also mean that Volt drivers seekout public charging infrastructuremore <strong>of</strong>ten than LEAF drivers to realisethis benefit – a theory that may besubstantiated by future data fromThe EV Project.On-street charging locations are rarelyeconomic to install and operate due touncertainties in the planning process,high installation costs, parking policychallenges, and low revenue potential.Information about <strong>electric</strong>ity networkconfiguration is not openly availableand decision-making on <strong>electric</strong>alinfrastructure proposals is fraughtwith uncertainty in relation to time,requirements and outcomes. Most onstreetsites require carefully plannedand executed excavation works as part<strong>of</strong> the installation, making costs farhigher than for <strong>of</strong>f-street locations.Parking revenue is a valuable budgetinput for many councils, whichcombined with efforts to disincentivizecar traffic, limits council appetite to<strong>of</strong>fer free or even reduced parkingcosts for EV parking/charging. Userswill only pay a small premium (at most)for the charging service beyond the cost<strong>of</strong> the energy and parking combined.Transaction arrangements may bechallenging, either for the user whomust pay separately for parking andcharging, or for the host/operator whomust integrate payment systems.Some <strong>of</strong> these issues may be addressedthrough better support from the<strong>electric</strong>ity network operators andcouncils, particularly in municipalitieswhere on-street EV charging servicesare most desired, however <strong>of</strong>f-streetcharging locations are clearly thepreferred public charging option. Anexception to this may be locations wherevisibility is a priority for promotionalpurposes – in these instances fundingsupport from third-parties such ascorporate fleet EV operators seekingexposure may be a key enabler.While easier, <strong>of</strong>f-street publiccharging locations are significantlyimpeded by the opportunity cost forparking facility operators. Parkingis a lucrative business. Based upondaily and monthly revenue estimates,a single parking bay in Melbourne’sCBD generates between $6,000 and$15,000 <strong>of</strong> income per year (Colliers2012). Furthermore, many parkinglocations are already over-subscribed(<strong>trial</strong> examples include WestfieldDoncaster Shopping Centre, DoncasterPark & Ride and many railway stationcar-parks). For a parking bay to beexclusively assigned to EV parking/charging, the relatively low number <strong>of</strong>likely users in the near-<strong>term</strong> creates asignificant opportunity cost that mostfacility operators will not accept. Thisissue has been the most significantbarrier to roll-out <strong>of</strong> public chargingfacilities as part <strong>of</strong> the <strong>trial</strong>.CREATING A MARKET 91
Quick charging may be a potentialsolution to this issue – refer to Figure4 and Figure 47 for examples. For thesame footprint, quick chargers are ableto service many more customers thanstandard chargers. Quick charging alsoprovides an enhanced value propositionrelative to standard charging that userswill pay a premium for (that is, morethan simply the cost <strong>of</strong> the energy used).They have the potential to significantlyextend the operating range <strong>of</strong> EVs, bothfrom actual use and as a by-product <strong>of</strong>the reassurance they provide EV drivers(who consider quick charging to be arange ‘safety net’). In Japan, the countrywith the highest concentration <strong>of</strong> quickchargers, Nissan (2012b) have <strong>report</strong>edpositive impacts on both <strong>electric</strong> <strong>vehicle</strong>uptake and use from the presence <strong>of</strong>quick chargers. Following an increasefrom 2 to 7 quick chargers on the 350kilometres highway between Tokyo andNagoya, <strong>electric</strong> <strong>vehicle</strong> registrationsincreased from around 1500 to 1900<strong>vehicle</strong>s and the number <strong>of</strong> EV highwaydrivers increased from 19 to 41 per centin the surrounding region.While quick chargers hold greatpotential in their ability to influence<strong>electric</strong> <strong>vehicle</strong> uptake, they are notwithout their challenges. Table 17provides a description <strong>of</strong> these issuesalong with a snap-shot <strong>of</strong> currentprogress towards resolution.An additional opportunity that appliesto both standard and quick chargersrelates to better information for themarket on likely EV parking/charginglocations. Although general informationhas been supplied in Section 5.4.4above, specific information in <strong>term</strong>s<strong>of</strong> a map <strong>of</strong> priority locations wouldhelp address property owner/manageruncertainty on the risks <strong>of</strong> allocatingreal-estate for EV parking/charging.While the <strong>Department</strong>’s Guidance onLand-use Planning for Electric VehicleParking and Charging (DOT 2012e)provides advice for new developments,it is not targeted at existing landuses/facilities.Southern CaliforniaAssociation <strong>of</strong> Governments have beendeveloping a regional plug-in <strong>electric</strong><strong>vehicle</strong> readiness plan that seeks toaddress this information barrier for themarket with more specific guidance(Luskin 2012). The opportunity existsto develop and publish more detailedinformation for Victoria that will assistwith site identification and negotiations,thereby streamlining public charginginfrastructure roll-out.The existence <strong>of</strong> the <strong>trial</strong> publiccharging locations does however provethe existence <strong>of</strong> a value propositionfor some parking facility operators.According to the operators, this mostlyrelated to the marketing benefits fortheir facility through having been anearly-adopter <strong>of</strong> EV charging technology– a view endorsed by findings in theU.S. (RMI 2009).Figure 47. ChargePoint quick charger installed in North Strathfield, New South Wales.
According to theory (Lieberman andMontgomery 1988), early-adopteradvantages that may be obtained bya parking facility operator in thissituation include:• Influence customer choice underuncertainty – early-adopterparking facilities may establish areputation for quality from havingthe latest technology, which maythen translate to a preference fromcustomers (particularly given thatparking is a relatively low-cost‘convenience good’ where thebenefits from finding a superioralternative may be insufficient tooutweigh the search effort involved)• Create switching costs forcustomers – building on theadvantage above, once a customerhas adapted to the characteristics<strong>of</strong> a parking facility, competitorparking facilities must investadditional resources in order totempt them away from theirinitial choice.These benefits are difficult to discernat a practical level and mostly relatedto the marketing value <strong>of</strong> hosting EVcharging facilities, which has a ‘use-by’date in <strong>term</strong>s <strong>of</strong> novelty. As a result,most parking facility participants drewcomfort at the outset from the finite<strong>term</strong> <strong>of</strong> their <strong>trial</strong> involvement, andindicated their intention to removethe EV charging capability unlessthe corresponding parking bays metexpected occupancy levels. Someoperators also opened up the EVparking/charging bay to generaluse, but would rope the bay<strong>of</strong>f temporarily in response to anEV driver ‘reservation’.Issue Description Mitigation strategyEquipment costs Early-market designs cost $55,000–$90,000 Latest generation equipment costs have reduced to$10,000-$40,000EstablishmentcostsConnectorstandardsGrid impactsVehicle batteryimpactsUser ergonomicsExceed equipment costs – potentially$80,000 depending upon site specifics(refer to Table 14)A range <strong>of</strong> designs have emerged globally,increasing complexity and market-accessbarriersPHEVs do not generally include quick chargercapabilitySeparate connectors for standard and quickcharging increases costsQuick charging increases the peak- toaverage<strong>electric</strong>ity demand load, reducingnetwork reliability or necessitating investmentQuick charging degrades battery life morequickly than standard chargingUncertainty relating to quick charging impactson battery life, including <strong>vehicle</strong> re-saleEarly-market designs are not especiallyuser-friendlyDrivers are unfamiliar with quick chargeroperationLatest generation 25 kW quick chargers have much lowerinstallation costs with only minor impact on charging timesStreamlining through the development <strong>of</strong> ‘best practice’installation processesProvisioning during initial site development or leveragingsite redevelopment will potentially avoid trenching costs(the largest contribution to establishment costs)A combination standard is in the final stages<strong>of</strong> development that will be globally recognised, backwardscompatible and allow for a single connector that may bepotentially adopted even by PHEVsNew standards will support grid communication anddemand management strategiesOn-site energy storage may reduce grid impacts bysmoothing the demand pr<strong>of</strong>ileBattery technologies are evolving to reduce charging timesand increase battery lifeIncreased understanding and transparency for all EVmarket participants on quick charging impacts uponbattery lifeLatest generation/emerging standard designs are moreuser-friendlyDrivers acquire experience in the use <strong>of</strong> quick chargersTable 17. Quick charging issues and mitigation strategies.CREATING A MARKET 93
PUBLIC CHARGING CASE STUDYRETAIL STORE CHARGING STATIONS IN CALIFORNIACalifornia, as one <strong>of</strong> the major EV markets globally, provides some useful insights into the publiccharging models.In January 2012 six dual-outlet charging stations were installed in the parking-lot for a retail premisesin Fremont South, California. The charging stations are available for public use free <strong>of</strong> charge during thebusiness hours <strong>of</strong> the associated retail store.Customer feedback for the store is tracked via an online user-review site for local businesses.Of the 42 customer reviews <strong>of</strong> this store, 26 per cent mention the EV charging stations highlightingtheir influence on customer perceptions:I’ve never been a Target shopper and as a matter <strong>of</strong> fact I don’t really like big box storesBUT I just bought a Chevy Volt.This store has a row <strong>of</strong> EV chargers – that’s enough for me and they will now be my store<strong>of</strong> choice for pretty much all my shopping and my Starbucks <strong>of</strong> choice will now be the one in this store.The fact that they are forward thinking enough to recognize the benefit <strong>of</strong> dedicating a row<strong>of</strong> parking places and spending money to install EV chargers is enough for me.Use <strong>of</strong> the public charging stations has increased steadily from the time they were commissionedsuch that in November 2012 around 1.3 MWh <strong>of</strong> <strong>electric</strong>ity was consumed by EV charging activities(equivalent to the battery capacity <strong>of</strong> 54 Nissan LEAFs). Most significantly, the average chargingsession for users was two hours – substantially longer than the 30 minute average customer visitduration companywide – at a cost <strong>of</strong> under $USD 0.50 per customer for the <strong>electric</strong>ity.Figure 48. EV charging outletsoutside <strong>of</strong> a ‘big-box’ retailerin Fremont South, California(ChargePoint 2013).
The pushback by parking operatorsagainst reserving parking assets solelyfor the use <strong>of</strong> EV drivers highlightsanother challenge within the publiccharging business model – protectingand promoting utilisation <strong>of</strong> the EVcharging infrastructure asset. Publiccharging outlets may be underutilisedfor a range <strong>of</strong> reasons:• Inappropriate occupancy – wherenon-EV drivers, or EV drivers whodo not use the charging facility,occupy the parking/charging bayeither mistakenly or in spite <strong>of</strong> the‘EV charging only’ restrictions,thereby preventing EV driversfrom accessing the chargingfacility; a U.S. survey <strong>of</strong> EV ownersfound that the Toyota Priushybrid-<strong>electric</strong> (not the plug-in)was the most likely <strong>vehicle</strong> to beinappropriately occupying anEV-only parking/charging bay(PSRC 2010)• Customer confidence – wherewould-be users err towards nonusedue to a lack <strong>of</strong> confidencethat the parking/charging facilitywill be available when they needit; many <strong>trial</strong> householdparticipants provided feedbackon this issue, particularly for theMelbourne Airport EV parking/charging facilities• Commuter charging – whereusers occupy the parking/charging bay for most <strong>of</strong> the dayin spite <strong>of</strong> needing the chargingfacility for only a fraction <strong>of</strong> thistime. Anecdotal <strong>report</strong>s fromCalifornia suggest that EV driversare conscious <strong>of</strong> how much the<strong>electric</strong>ity used in a chargingsession costs, reducing theirappetite to pay a premium forextended occupancy.A range <strong>of</strong> measures wereidentified to promote publiccharging asset utilisation:• Signage/ground-marking –standardisation <strong>of</strong> the EV parkingsymbol depicted in Figure 31,and inclusion <strong>of</strong> this designin directional and restrictionsignage (Figure 49) and groundmarkingwas felt to be themost cost effective deterrentfor inappropriate occupancy, inaddition to which it increased thevisibility and marketing benefit forthe site owner• Real-time/remote chargingstatus <strong>report</strong>ing and reservationcapability – provided to varyingdegrees by the <strong>trial</strong> chargingservice providers; provides userswith better information andconfidence but does not eliminateinappropriate occupancy• Parking technology – which ifused in combination with thereal-time/remote charging status<strong>report</strong>ing can address uncertaintyabout inappropriate occupancy;preliminary investigations foundthat there was limited appetiteto integrate the technology intothe charging service providernetworks at this time• Enforcement – training <strong>of</strong> parking<strong>of</strong>ficers for on-street EV parking/charging restriction enforcementhas been agreed in-principlewith the City <strong>of</strong> Melbourne,but deferred until an on-streetparking/charging location iscommissioned; conversely,parking enforcement for manycommercial car-parks was foundto be haphazard or non-existent;enforcement also fails to addressinappropriate occupancy beyondserving an infringement noticeon the <strong>of</strong>fending <strong>vehicle</strong>s• Low-value parking assetutilisation – discussions withcharging service providers inthe U.S. found that some werepursuing the least-utilised parkingassets in their negotiationswith parking facility operators,primarily to gain access to thesite but with the added benefit<strong>of</strong> reducing the likelihood <strong>of</strong>inappropriate occupancy• Charging etiquette – where aprotocol is developed that allowsEV drivers to unplug other <strong>vehicle</strong>sto allow them to charge theirown in a neighbouring location;this is best suited to workplace/commuter charging, where simplesignage has been developed byusers in the US informing otherdrivers <strong>of</strong> their charging outletavailability for this purpose(refer to Appendix E – EV chargingcourtesy signage)• Interoperability/network roaming –increasing the number <strong>of</strong> potentialusers by promoting the ability <strong>of</strong>users to roam across the networkis an agreed medium to longer<strong>term</strong>objective for chargingservice providers which was feltto be a lower priority at this end<strong>of</strong> the industry development(refer to Section 5.1.4).CREATING A MARKET 95
At this stage <strong>of</strong> the marketdevelopment, the signage/groundmarkingand real-time/remotecharging status <strong>report</strong>ing andreservation capability have emergedas the two solutions for the near<strong>term</strong>,with enforcement likely to haveapplication in on-street locations andcharging etiquette for workplace/commuter charging. Section 5.1.5contains insights into the issues andopportunities for network-level issues.Another major challenge encounteredin the <strong>trial</strong> was the legal negotiationthat accompanied the commercialagreement to host public charginginfrastructure. The most commonissue raised by would-be hosts relatedto the distribution <strong>of</strong> liabilities forclaims made in relation to the publiccharging infrastructure.A lack <strong>of</strong> understanding about <strong>electric</strong><strong>vehicle</strong> charging infrastructureand EVs generally was a commontheme from the would-be host legaladvisor/s, in response to which theywould insist that all risks be borneby the <strong>Department</strong> and/or chargingservice provider. While this is generallyappropriate, there are limits to theliabilities that will be accepted bythese parties – for example, for issuesarising from unrelated site works thatcome into contact with some aspect <strong>of</strong>the charging infrastructure.By comparison with the issues outlinedabove, equipment and installationcosts were <strong>of</strong> lesser concern. Whileit is unclear if any/all <strong>of</strong> the sitescommissioned would have occurredwithout government funding support,the majority <strong>of</strong> hosts accepted thecharging circuit costs with littlecomplaint. However, some sites wereclearly resistant to any expenditure,pointing out that their contributionwas the not-insignificant opportunitycost associated with the likely lostparking revenue.Figure 49. VicRoads-designed EV directional and parking signage, drawing upon the standardised symbol design depicted in Figure 31.
There’s a lot to like aboutincreased use <strong>of</strong> <strong>electric</strong>cars in Victoria. They’remuch quieter and cleanerthan petrol <strong>vehicle</strong>s. EVscan reduce our dependenceon oil imports and canplay a big part in makingour <strong>electric</strong>ity systemmore efficient. However,EVs could also potentiallyexacerbate peak demand,putting more pressure onour energy networks andincreasing costs forall consumers.Finding out how peopleuse and recharge theirEVs is essential to help usplan for the future <strong>of</strong> ourenergy system and thelong-<strong>term</strong> development<strong>of</strong> the EV industry.The Victorian ElectricVehicle Trial will give themarket real-life directionabout opportunities andchallenges <strong>of</strong> more carsbecoming part <strong>of</strong> theenergy grid.Energy Suppliers Association<strong>of</strong> Australia (ESAA),19 November 2012CREATING A MARKET 97
ECONOMIC,ENVIRONMENTALAND SOCIAL IMPACTSAs part <strong>of</strong> the VictorianElectric Vehicle Trial, ananalysis <strong>of</strong> the economic,environmental andsocial impacts <strong>of</strong> <strong>electric</strong><strong>vehicle</strong> adoption in thestate <strong>of</strong> Victoria hasbeen undertaken.
The economic analysis hasexamined the likely costsand benefits to the Stateunder a range <strong>of</strong> scenariosup to 2040. It has identifiedkey influences on theoutcomes, along with timingfor various milestones in themarket development.The environmental impactsassessment has included acomprehensive investigation <strong>of</strong>the lifecycle impacts <strong>of</strong> <strong>electric</strong><strong>vehicle</strong> production, operation anddisposal in Victoria. It has sought anunderstanding <strong>of</strong> the main issuesinfluencing environmental impacts,and de<strong>term</strong>ined pathways to securethe best environmental outcomes.The <strong>trial</strong> has been used as a test-casefor management <strong>of</strong> the environmentalimpacts, and guidance has beendeveloped for Victorian EV operators.An understanding <strong>of</strong> the social impactsfrom EV uptake has been soughtin <strong>term</strong>s <strong>of</strong> employment benefitsalong with education and trainingneeds. Opportunities for the Victorianeconomy in <strong>term</strong>s <strong>of</strong> research, designand development have been collated.Measures to protect and enhancecommunity safety have been identifiedand are being progressed through acollaborative process.6.1 ECONOMIC IMPACTS6.1.1 How have the economicimpacts been assessed?The case for or against <strong>electric</strong> <strong>vehicle</strong>sin Victoria will depend to a large extentupon the economic implications forthe State. In recognition <strong>of</strong> this, theformer <strong>Department</strong> <strong>of</strong> <strong>Transport</strong>commissioned consultants AECOMin <strong>mid</strong>-2010 to undertake economicmodelling <strong>of</strong> future EV uptake inVictoria (AECOM 2011).The economic model directly calculateslikely take-up rates <strong>of</strong> <strong>electric</strong> <strong>vehicle</strong>susing known data and industry inputabout the relative importance <strong>of</strong>different criteria in shaping consumerpurchasing decisions. The benefits <strong>of</strong>this approach are two-fold:(i) It avoids use <strong>of</strong> assumptions abouttake-up <strong>of</strong> <strong>vehicle</strong>s based upon pastbehaviour – this is a new market forwhich little information <strong>of</strong> this type isavailable; and(ii) By directly estimating take-up, itis possible to consider the impact<strong>of</strong> various potential sensitivitiesaround prices (such as, <strong>electric</strong>ityprices, fuel prices, <strong>vehicle</strong> prices)and how these affect take-up.The analysis considers three scenariosagainst the base case, reflectingavailability <strong>of</strong> <strong>electric</strong> <strong>vehicle</strong>s andcharging infrastructure. The basecase assumes that only conventional<strong>vehicle</strong>s are available, including ICEVsand HEVs. The three comparisonscenarios investigate the levels <strong>of</strong>PHEV and BEV take-up under marketconditions that vary as follows:• Scenario 1 – assumes that there ishousehold charging available only• Scenario 2 – assumes there isenhanced household chargingrelative to Scenario 1, and publiccharging available in the Victorianmetropolitan region• Scenario 3 – same as forScenario 2 with the addition <strong>of</strong><strong>electric</strong> <strong>vehicle</strong> service stationsthat <strong>of</strong>fer battery-swap or fastchargecapability.The analysis:• Looks at small, medium andlarge passenger <strong>vehicle</strong>s, taxisand light-commercial <strong>vehicle</strong>sbeing used in the Victorianmetropolitan region (that is,Melbourne plus regional centres).Passenger <strong>vehicle</strong> use was furthersegmented according to how manykilometres <strong>vehicle</strong>s travel eachyear. This approach recognisesthe differences in capital costs,operating costs and payback ratesfor each technology choice relativeto a conventional <strong>vehicle</strong>• Includes consideration <strong>of</strong> <strong>vehicle</strong>prices, fuel and <strong>electric</strong>ity prices(including carbon price impacts)along with other <strong>vehicle</strong> operatingcosts, <strong>vehicle</strong> supply constraints,discount rates, emissions impacts,and consumer acceptance criteria• Provides an estimate <strong>of</strong> the neteconomic impacts over a 30-yearperiod from 2010 to 2040.CREATING A MARKET 99
Notably, the economic analysis doesnot include assessment <strong>of</strong> potentialimpacts on Victoria’s automotiveindustry (costs or benefits), which arediscussed further in Section 6.1.4.It should also be noted that thesummary <strong>of</strong> issues presented inSection 8 is also a key consideration forinterpretation <strong>of</strong> the economic model.Many <strong>of</strong> the issues identified mustbe resolved in order for the <strong>electric</strong><strong>vehicle</strong> market to progress in line withthe modelling forecasts.6.1.2 What is the timelinefor <strong>electric</strong> <strong>vehicle</strong> adoptionin Victoria?Results from the modelling predictthat sales <strong>of</strong> PHEVs/EVs will makeup a small share <strong>of</strong> new <strong>vehicle</strong> salesuntil around 2020, however current oiland <strong>vehicle</strong> technology prices suggestthat this ‘take-<strong>of</strong>f point’ may occurslightly earlier depending upon local<strong>vehicle</strong> supply.The ‘take-<strong>of</strong>f point’ reflects the pointat which purchase <strong>of</strong> an <strong>electric</strong><strong>vehicle</strong> becomes a financially prudentchoice for new <strong>vehicle</strong> buyers relativeto a conventional ICEV, and there aresufficient EVs available for purchase.It is an important date in the context <strong>of</strong>the economic analysis, as EV uptakebefore this time occurs at a cost to theeconomy (due to expenditure on <strong>vehicle</strong>purchase that is not paid back byoperating cost savings). Following thetake-<strong>of</strong>f point, EV adoption provides abenefit to the economy through savingsin transport energy costs that outweighthe <strong>vehicle</strong> purchase price penalty.Up until the take-<strong>of</strong>f point, <strong>vehicle</strong>sare bought mostly by ‘early adopters’who purchase the <strong>vehicle</strong> at leastpartly for non-financial reasons – referto Section 3.2. Following the take-<strong>of</strong>fpoint, EV purchase is a financiallyprudent decision.450400350EVPHEVHEVICE3002502001501005002010201220142016201820202022202420262028203020322034203620382040Vehicles sales per year (’000)Figure 50 The breakdown in projected new <strong>vehicle</strong> sales for Victoria according to technology type. The scenario depicted representsa ‘<strong>mid</strong>-range’ forecast in <strong>term</strong>s <strong>of</strong> oil prices, <strong>vehicle</strong> purchase prices and public charging infrastructure availability (AECOM 2011).
Under a ‘<strong>mid</strong>-range’ scenario asenvisaged in 2010 for oil and <strong>vehicle</strong>purchase prices, the take-<strong>of</strong>f point forVictorian <strong>electric</strong> <strong>vehicle</strong> market is2020 (AECOM 2011). Based upon thismodelling, <strong>electric</strong> <strong>vehicle</strong>s will makeup around 25 per cent <strong>of</strong> new <strong>vehicle</strong>sales from 2020 if they are availableand supported with a basic publiccharging network – refer toFigure 50. Under this scenario, uptakewill increase to become around twothirds <strong>of</strong> new car sales by 2030.To better understand both this andalternate scenarios, the influence<strong>of</strong> key variables on the marketdevelopment should be noted.Extensive modelling commissionedby the United States <strong>Department</strong> <strong>of</strong>Energy (US DOE), who are responsiblefor President Obama’s ‘one millionEVs by 2015’ target, highlights theuncertainty in forecasts for <strong>electric</strong><strong>vehicle</strong> market development – referto Figure 51.This uncertainty is due to the highlyuncertain nature <strong>of</strong> key variables thatinfluence the purchase price versusoperating cost balance that economicmodels use to de<strong>term</strong>ine <strong>electric</strong><strong>vehicle</strong> market development:• Technology costs – EV purchaseprices relative to conventional<strong>vehicle</strong>s are influenced by EVtechnology costs, particularlybatteries, and by the decisionson ‘price-point’ by the sellers,which reflect their positioning ineach market and the businesscase that underpins each <strong>vehicle</strong>development program• Oil prices – potential savings in<strong>vehicle</strong> operating costs are a keyinfluence on EV uptake, howeverthe extent <strong>of</strong> these savings ishighly dependent upon oil priceswhich themselves are highlyuncertain; oil prices reflect thebalance <strong>of</strong> global supply anddemand, the former in particularbeing strongly influenced by nonmarketforces such as politicalinstability or interference(Sperling and Gordan 2009),or the emergence <strong>of</strong> new sources<strong>of</strong> supply such as shale oil(Reuters 2012)PEV annual U.S. market penetration projections10075% <strong>of</strong> total annual sales5025020102020 2030 2040 2050Figure 51. Predictions for PEV market uptake in the United States according to modelling commissioned by the US <strong>Department</strong> <strong>of</strong>Energy (DOE) drawing on predictions from the Argonne National Laboratory, AT Kearney, Bloomberg, Deutsche Bank, EIA, ElectricCoalition, EPRI, MIT, National Academies, Deloitte, JD Power, JP Morgan, Lux Research, Pacific Northwest Laboratory, RolandBerger, Shell and the US DOE amongst others (US DOE 2012b).CREATING A MARKET 101
• Consumer preferences –operating costs are only oneconsideration made by consumersin the <strong>vehicle</strong> purchase decisionalongside other factors such assafety, quality, purchase price andreliability; the relative importance<strong>of</strong> each factor varies over time (forexample, fuel economy becomesmore important when fuel pricessuddenly increase), and may notbe ‘economically rational’ (such asthe decision to purchase a <strong>vehicle</strong>with high fuel consumption whenfuel prices show a short-<strong>term</strong>dip despite the long-<strong>term</strong> trendupwards); the availability <strong>of</strong> publiccharging infrastructure has beenidentified as a key influence onconsumer preference towards<strong>electric</strong> <strong>vehicle</strong>s.The variations seen in the economicmodelling can be mostly explainedby the differences in how these keyvariables are forecast to unfold andinteract with each other.According to the <strong>Department</strong>’s model,if both technology and oil pricesfollow forecasts, the take-<strong>of</strong>f point forEV technology mainstream marketadoption is 2020. With referenceto Section 4.1.1, <strong>vehicle</strong> prices aredecreasing slightly ahead <strong>of</strong> forecasts,whereas oil prices are slightly aboveprojections (EIA 2012). This suggeststhat the breakeven year for EVs may beslightly earlier than 2020.Consumer preferences manifestthemselves differently before andafter this take-<strong>of</strong>f point. Before thetake-<strong>of</strong>f point, the early market isdriven primarily by ‘early adopters’ asoutlined in Section 3.2 who purchasethe <strong>vehicle</strong>s for mostly non-financialreasons. This behaviour may bethought <strong>of</strong> as ‘economically irrational’,and by extension not well suited toeconomic modelling. As a result, EVsales predictions differ wildly up totheir predicted take-<strong>of</strong>f point.Once the take-<strong>of</strong>f point has beenreached, the market is effectively‘mainstream’ and more likely tobehave in ‘economically rational’ways. Once this occurs the economicforecasting becomes more reliable,even if consumers may still pursuepurchase preferences which are noteconomically rational.A consideration made in the economicmodelling commissioned by the<strong>Department</strong> relates to Australianmarket <strong>vehicle</strong> supply constraints(AECOM 2011). As was outlined inSections 4.1.3 and 4.1.5, supply <strong>of</strong><strong>vehicle</strong>s into the Australian marketdoes not match that for marketselsewhere. For <strong>electric</strong> <strong>vehicle</strong>technologies this is envisaged to bean issue until around 2020, which hassignificant implications for the salesvolume forecasts prior to this time.A range <strong>of</strong> factors may influence localsupply constraints. Poor sales and/or a perceived lack <strong>of</strong> support mayreduce OEM interest in the Australianmarket, thereby extending the supplyconstraints. Conversely, burgeoningconsumer interest and/or support forlocal manufacture may reduce supplyconstraints. These influences arerelevant to considerations relating tooptimisation <strong>of</strong> the economic benefitsto the state made in Section 6.1.3.A relatively constant influence onconsumer preference is the availability<strong>of</strong> public charging infrastructure.Charging infrastructure availabilitywill not affect the timing <strong>of</strong> the take<strong>of</strong>fpoint for mainstream EV adoption,however it will strongly affect the<strong>vehicle</strong> sales either side <strong>of</strong> this date.This is discussed further in Section6.1.3 below.
6.1.3 What are the costs andbenefits <strong>of</strong> <strong>electric</strong> <strong>vehicle</strong>adoption for Victoria?Under all scenarios, <strong>electric</strong> <strong>vehicle</strong>swill provide a net economic benefitfor Victoria. The benefit varies from$1.8 billion to $23.4 billion over theperiod to 2040, without considering theeconomic contribution <strong>of</strong> the <strong>electric</strong>ityand automotive industry sectors. Oilprices and EV purchase costs arethe key factors driving the timingand extent <strong>of</strong> the economic benefit.Local <strong>vehicle</strong> supply constraintsare an important influence on theeconomic analysis, both in the earlyyears while the <strong>vehicle</strong>s are expensiveand following the point at whichthey become economically viable.The availability <strong>of</strong> public charginginfrastructure has a strong influenceon the size <strong>of</strong> the economic benefitonce EV uptake begins at scale.EVs cost more to purchase initially,but they are cheaper to run thanconventional <strong>vehicle</strong>s. Over time, thepurchase price for EVs is expected t<strong>of</strong>all, and running costs <strong>of</strong> conventional<strong>vehicle</strong>s are likely to increase asoil gets more expensive. Under allscenarios modelled, the EV marketis both economically and financiallystrong with a net present value thatbecomes positive in the period between2026 and 2031. Over the 30-yearevaluation period, economic benefitsto the State range from $1.8 billionto $23.4 billion, mostly as savingsto households and businesses intransport costs.Notably, the modelling does not takeinto account the potentially significanteconomic contributions from <strong>electric</strong><strong>vehicle</strong> market goods or serviceprovision, <strong>electric</strong>ity generation forEV operation, or from local designand/or production <strong>of</strong> EV technology.These contributions may be additionalto existing economic activity, as is thecase with <strong>electric</strong>ity generation, orsimply an evolution, such as design <strong>of</strong><strong>electric</strong> rather <strong>of</strong> internal combustionengine <strong>vehicle</strong>s. Section 6.1.4provides some insights into potentialemployment benefits for the state.The key influences on the modellingpredictions are the same as thosedescribed in Section 6.1.2:• Technology costs – in the shortto medium-<strong>term</strong> take-up <strong>of</strong> EVsis strongly influenced by theirprice relative to conventional<strong>vehicle</strong>s. Measures to reduceEV costs earlier bring forwardthe economic benefits• Oil prices – take-up <strong>of</strong> EVs ishighly sensitive to oil prices butless sensitive to <strong>electric</strong>ity pricesand/or a carbon tax. Should oilprices increase ahead <strong>of</strong> forecasts,measures to promote EV uptakewill increase economic benefits• Consumer preferences –increasing the availability <strong>of</strong>charging infrastructure andremoving barriers to EV ownershipwill encourage take-up <strong>of</strong> EVswhen prices become moreaffordable, and bring forward theeconomic benefits.The economic model finds that in orderto optimise the economic benefit <strong>of</strong>EVs, rapid uptake <strong>of</strong> EVs should bepromoted once the take-<strong>of</strong>f point isreached where the higher purchaseprice <strong>of</strong> an EV (technology costs) ismatched by the operating cost savingsEVs provide versus conventional<strong>vehicle</strong>s (oil prices).An important consideration inpromoting uptake <strong>of</strong> EVs is <strong>vehicle</strong>supply constraints. As outlined inSection 4.1.3, the Australian marketis envisaged to be constrainedto around one per cent <strong>of</strong> globalproduction until 2020 (AECOM 2011).This forecast is beneficial in thecontext <strong>of</strong> the economic analysis, asprior to this time EV uptake occursat a cost to the economy due tothe unfavourable purchase price/operating cost relationship. Followingthe removal <strong>of</strong> supply constraints,uptake is de<strong>term</strong>ined by the factorsabove (technology costs, oil prices andconsumer preferences).It is important to note however thatdue to the leadtime on productplanning decisions (refer to Section4.1.3), automotive OEMs should bemade aware <strong>of</strong> EV market supportmeasures at least two years ahead <strong>of</strong>when improved supply is being soughtto optimise the overall economicbenefit to the state – in other words,around 2018 based upon the forecastscontained in the <strong>Department</strong>’seconomic modelling.CREATING A MARKET 103
A range <strong>of</strong> levers exist to influenceEV prices relative to conventional<strong>vehicle</strong>s. Investment in researchand development has documentedbenefits in <strong>term</strong>s <strong>of</strong> bringingforward technology price reductions.Manufacturing investments provideeconomies <strong>of</strong> scale for <strong>vehicle</strong>production. Bulk procurementprograms provide economies <strong>of</strong> scalefor <strong>vehicle</strong> sales. Measures to promotemarket competition and reduce thecosts <strong>of</strong> doing business will also putdownward pressure on <strong>vehicle</strong> prices.By reducing EV technology costs toconsumers, the take-<strong>of</strong>f point formainstream EV adoption is broughtforward and the economic benefitsfrom EV take-up increased.In contrast, oil prices are de<strong>term</strong>inedby global commodity markets that arelargely outside the control <strong>of</strong> individualmarkets or entities. For this reason,the economic benefit to the statecan be maximised by identifyingmeasures to effectively promote EVtake-up by mainstream consumersand introducing them as oil pricesshow signs <strong>of</strong> increasing.As described in Section 6.1.2,the availability <strong>of</strong> public charginginfrastructure is one <strong>of</strong> the maininfluences on consumer preferencestowards <strong>electric</strong> <strong>vehicle</strong> take-up andthe corresponding economic benefitsfor Victoria. To optimise the economicbenefits, widespread public charginginfrastructure should become availablejust prior to the take-<strong>of</strong>f point formainstream EV adoption describedabove. Based upon current forecasts,this would suggest a widespreadcharging network should come online around 2018–19 having beencommitted to at least two years earlierto inform OEM product planning.6.1.4 How will <strong>electric</strong> <strong>vehicle</strong>market development affectVictorian jobs?Electric <strong>vehicle</strong>s may be a ‘sweet-spot’for Victorian jobs. Opportunities existto protect and enhance employmentin Victoria’s automotive industry,one <strong>of</strong> the State’s key industries.Greater use <strong>of</strong> domestically-produced<strong>electric</strong>ity for transport in favour <strong>of</strong>imported hydrocarbon-based fuels willcreate local jobs.Victoria’s automotive industry employsaround 28,000 people (Invest Vic 2011).In 2010, the industry identified <strong>vehicle</strong>electrification as the highest priorityopportunity area for the long-<strong>term</strong>success <strong>of</strong> the Australian automotiveindustry (AutoCRC 2010).A survey conducted <strong>of</strong> the <strong>trial</strong>participants in 2010 suggested thatover 500 new jobs would be createdover the life <strong>of</strong> the <strong>trial</strong>, accompaniedby $43 million <strong>of</strong> investment in Victoria(DOT 2010c).The Automotive Australia 2020roadmap (AutoCRC 2010) providessome insights into the EV technologyapplications around which these jobsmay be created:• Supercapacitors for EVs• Design and assembly <strong>of</strong> PowerElectronics Modules (PEMs)• High energy-density batteries• Low cost, robust, efficient<strong>electric</strong> machines• Modular, standardisedbattery packs• Expertise in solutions for EVarchitectures and technologies• Seamless integrated charginginfrastructure• S<strong>of</strong>tware and hardware for EVspecific driver-interface• Hybrid and EV production forfleets and taxis.Additional jobs can be expected inother sectors that form part <strong>of</strong> the EVecosystem described in Section 3.1.The consultants McKinsey (Klintsovet al 2010) identify utilities andautomotive assembly as the top twoemployment multiplier sectors, with5.1 and 4.6 additional jobs in the widereconomy for every full-time employeewithin either sector. Electric <strong>vehicle</strong>uptake, which will drive employmentin <strong>electric</strong>ity utilities and potentiallyautomotive design and manufacture,represents a unique sweet-spot toprotect and enhance Victorian jobs.
6.2 ENVIRONMENTAL IMPACTS6.2.1 How will <strong>electric</strong> <strong>vehicle</strong>simpact the environment?If run on renewable energy,<strong>electric</strong> <strong>vehicle</strong>s can providesignificant reductions in total lifetimegreenhouse gas emissions forVictorian drivers. These benefitsincrease as conditions tend towardsmore ‘stop-start’ driving. Impacts from<strong>vehicle</strong> operation far outweigh thosefrom <strong>vehicle</strong> production, and <strong>vehicle</strong>disposal impacts are expected to berelatively minor.In late 2012, the departmentreleased a paper which provideda comparative assessment <strong>of</strong> theenvironmental impacts <strong>of</strong> EVs relativeto their ‘conventional’ petrol <strong>vehicle</strong>counterparts in the Victorian contextout to the year 2030 (DOT 2012f).The paper found that the impactsarising from <strong>vehicle</strong> operation faroutweigh those in relation to <strong>vehicle</strong>production, even allowing for an EVbattery replacement over the <strong>vehicle</strong>life. Vehicle disposal impacts, includingthose <strong>of</strong> the EV battery, were found tobe negligible due to the high expectedrate <strong>of</strong> material recycling.The dominant influence <strong>of</strong> <strong>vehicle</strong>operation on EV lifecycle impactshighlights the importance <strong>of</strong> the wayin which <strong>electric</strong>ity is made, energyconversion efficiency, and the way inwhich a <strong>vehicle</strong> is used on the overallenvironmental performance.The source <strong>electric</strong>ity used to power<strong>electric</strong> <strong>vehicle</strong>s is a key issue inVictoria. Despite various influencesdriving decarbonisation <strong>of</strong> thestationary energy sector, projectionsindicate that for a <strong>vehicle</strong> operating onVictoria’s grid <strong>electric</strong>ity thebreakeven point in <strong>term</strong>s <strong>of</strong> carbonemissions from <strong>vehicle</strong> operationis some years away. Conversely, an<strong>electric</strong> <strong>vehicle</strong> operating on renewableenergy may provide a net benefit in<strong>term</strong>s <strong>of</strong> lifecycle carbon emissionswithin three years <strong>of</strong> operation,and a saving <strong>of</strong> over 50 per centacross the 20-year average Victorian<strong>vehicle</strong> lifetime.210200Electric <strong>vehicle</strong>energy economy(Wh / km)190180170Nissan LEAFenergyeconomy=173 Wh/kmFull fuel cycleemissions(gCO 2e/km)200 – 300100 – 2000 – 100Mazda 3 SP20= 154 gCO 2e/km1601501401301200 0.1 0.2 0.3 0.4 0.5 0.6 0.7 0.8 0.9 1.0 1.1Grid emissions intensity(tCO 2e/MWh)Vic 2030 grid emissionsintensity = 0.78 tCO 2e/MWh1101.2 1.3 1.4Vic 2012 grid emissionsintensity = 1.35 tCO 2e/MWhFigure 52. Chart depicting the interrelationship between EV energy economy and the <strong>electric</strong>ity grid emissions intensity inde<strong>term</strong>ining full fuel cycle greenhouse gas emissions, including some pertinent figures for comparison (DIT 2012, DCCEE 2012b,personal communications).CREATING A MARKET 105
Based upon current information,the advantage <strong>of</strong> <strong>electric</strong> <strong>vehicle</strong>sover petrol engine <strong>vehicle</strong>s grows asthe conditions tend towards more‘stop-start’ driving. Given the stronginfluence <strong>of</strong> <strong>vehicle</strong> energy economyon overall environmental impacts,better information and guidance onthe selection <strong>of</strong> <strong>vehicle</strong> technologies,particularly <strong>electric</strong> <strong>vehicle</strong>s, so asto be ‘fit-for-purpose’ could providesignificant benefits.Other observations <strong>of</strong> note as relateto greenhouse gas emissions fromEV operation include:• As a result <strong>of</strong> the Victorian<strong>electric</strong>ity generation mixcharacteristics, ‘demand’charging during peak periods <strong>of</strong><strong>electric</strong>ity use is likely to be <strong>of</strong>lower greenhouse gas emissionsintensity than ‘smart’ chargingduring <strong>of</strong>f-peak periods• The most reliable, if complicated,way to charge an EV using gridconnectedon-site renewableenergy generation such as a homesolar system, is to voluntarilysurrender the associatedrenewable energy certificates• By comparison, the GreenPowerpurchasing program was foundto be the simplest, most effectiveway <strong>of</strong> using renewable energyfor <strong>electric</strong> <strong>vehicle</strong> charging,even for those with on-siterenewable energy generationsuch as home solar• Complications associated with<strong>electric</strong>ity metering and billingarrangements for publiclyaccessible<strong>electric</strong> <strong>vehicle</strong>charging facilities highlightthe need for transparency anddiligence in support <strong>of</strong> renewableenergy charging strategies.Consideration <strong>of</strong> the impacts that maybe transferred elsewhere through<strong>electric</strong> <strong>vehicle</strong> uptake in Victoriahighlighted both existing and emergingrisks to the environment. The EVbattery and <strong>electric</strong> motor may causeharmful impacts to land, water and airquality if using raw materials and/orproduction processes in locations thathave either weak or poorly-enforcedenvironmental regulation. However,these risks are already evident for oiland rare earth metal extraction and/orprocessing for ‘conventional’ <strong>vehicle</strong>soperating on Victorian roads.Nevertheless, greater transparencywith regards to the environmentalimpacts from EV battery productionwould go some way towards ensuringall <strong>of</strong> the nominal environmentalbenefits from EV uptake translate toreality. A further sensitivity relatesto battery replacement timeframes,which have the effect <strong>of</strong> multiplyingthe uncertain impacts associated withbattery production.8070EV / Vic grid energyEV / renewable energyICEV60GHG emissions (tCO 2e)504030201002012 2013 2014 2015 2016 2017 2018 2019 2020 2021 2022 2023 2024 2025 2026 2027 2028 2029 2030 2031Year2032Figure 53. Cumulative greenhouse gas emissions calculated over an average Victorian <strong>vehicle</strong> lifetime for an ICEV and acomparable <strong>electric</strong> <strong>vehicle</strong> operating on both the Victorian <strong>electric</strong>ity grid mix and renewable energy. The step change in bothEV calculations reflects impacts arising from the single battery replacement forecast.
Based upon the limited informationavailable, up to six batteryreplacements would be possible over a<strong>vehicle</strong> life before the greenhouse gasemissions advantage <strong>of</strong> a petrol <strong>vehicle</strong>over an EV operated on renewableenergy would be lost.Impacts arising from increases in<strong>electric</strong>ity production are consideredto be minimal as a result <strong>of</strong> Victoria’seffective program <strong>of</strong> environmentalmanagement for indus<strong>trial</strong> facilities.Rather, impacts on the environmentare likely to be reduced throughavoidance <strong>of</strong> the transferred impactsattributable to oil extraction processes,and from preferential use <strong>of</strong> renewableenergy for <strong>electric</strong> <strong>vehicle</strong> charging.Due to Victoria’s carbon-intensive<strong>electric</strong>ity production, potentiallocalisation <strong>of</strong> any aspects <strong>of</strong> <strong>electric</strong><strong>vehicle</strong> production may increase theembodied greenhouse gas emissions<strong>of</strong> the <strong>vehicle</strong>s. This conclusiondraws upon evidence that highlightsVictoria’s existing <strong>vehicle</strong> production asbeing more carbon-intensive than forcomparable facilities elsewhere.Benefits to urban air quality andhuman health are likely to be minimalas the period <strong>of</strong> EV market growthcorresponds with the implementation<strong>of</strong> ever-tighter emissions standards forconventional <strong>vehicle</strong>s. A more detailedassessment <strong>of</strong> this may becomeavailable in the near-<strong>term</strong> as anoutcome from EPA’s Future Air Qualityin Victoria project.Environmental impacts arisingfrom <strong>electric</strong> <strong>vehicle</strong> electromagneticfields are likely to be negligible, EVnear-silent operation at low speedsis likely to be manageable, and EVreduced traffic noise impacts arelikely to be beneficial.6.2.2 How have environmentalimpacts arising from the <strong>trial</strong>been managed?The greenhouse gas emissionsassociated with the <strong>trial</strong> <strong>vehicle</strong>operation have been accounted forand reconciled with renewable energypurchases by the Australian energyretailer AGL, a premier partner for the<strong>trial</strong> (DOT 2012d). In having done this,the <strong>trial</strong> is effectively ‘carbon neutral’in <strong>term</strong>s <strong>of</strong> operational impacts.The total <strong>electric</strong>ity used by<strong>vehicle</strong> deployments and charginginfrastructure operation up toand including 30 June 2012 was66,393.9 kWh. This is the equivalentto around 79 tCO2e in greenhouse gasemissions from <strong>electric</strong>ity production.Results from the energy-useinventory have been presented tothe <strong>trial</strong> participants to help informdecisions around EV technologyroll-out. For example, the potentiallydisproportionate impacts arisingfrom charging outlet stand-by powerconsumption have been highlighted.6.2.3 How can an <strong>electric</strong><strong>vehicle</strong> be ‘zero emissions’in Victoria?Zero emissions driving <strong>of</strong> ElectricVehicles (EVs) requires renewableenergy for charging via one <strong>of</strong> thefollowing options:• On-site renewable energygeneration• GreenPower or Renewable EnergyCertificate (REC) purchase• Charging service agreements.Each option must deal with issuessuch as EV charging time andlocation relating to renewable energyproduction, cost and convenience. Thismeans charging should be undertakenusing outlets which are known to userenewable energy. In instances wherethis isn’t possible or certain, chargingshould be monitored and accountedfor as part <strong>of</strong> the overall renewableenergy strategy.In 2012 the department publisheda guidance document for driversdescribing the options above in moredetail (DOT 2012g) – refer to Table 18for a summary <strong>of</strong> this information.The Climate Groupbelieves that effectivelyimplemented, innovative<strong>electric</strong> <strong>vehicle</strong> deploymentwill help accelerate aClean Revolution: themassive upscale <strong>of</strong> smarttechnologies, design andnew policy and businesspractices that will ensurethat the nine billion peopleon the planet by 2050 willnot only subsist – but thrive.The Victorian ElectricVehicle Trial has played animportant and critical rolein articulating the case for<strong>electric</strong> <strong>vehicle</strong> deploymentin an independent, rigorousand comprehensive manner.The Climate Group,27 November 2012CREATING A MARKET 107
Renewable<strong>electric</strong>itysupply option Advantages Disadvantages More informationOn-siterenewableenergygenerationTakes advantage <strong>of</strong> existingrenewable energy supplyMore obvious link torenewable energy supplyConfusing in prospectUpfront cost if no system already inplaceMeasurement and accountingrequired to reconcile EV chargingwith renewable energy productionNeed to cater for <strong>of</strong>f-site chargingMay prove more costly thanGreenPower or REC purchaseClean Energy Councilsolar PV accreditationwww.solaraccreditation.com.au/Alternative Technology Associationwww.ata.org.auClean Energy Regulatorhttp://ret.cleanenergyregulator.gov.au/GreenPoweror RenewableEnergyCertificate(REC) purchaseNo upfront costsSimpleMost reliable way <strong>of</strong>linking EV charging torenewable energy useOngoing costsGreenPower may struggle with<strong>of</strong>f-site chargingREC purchase a burden and may becomplicatedYour <strong>electric</strong>ity retailerGreenPower programwww.greenpower.gov.auREC trading companiesREC purchaseaccommodates<strong>of</strong>f-site chargingMeasurement and accountingrequired if only a percentage <strong>of</strong> thebill is GreenPower or to reconcilewith RECsChargingserviceagreementLikely to support<strong>of</strong>f-site chargingSimpleGood information andcharge managementcapabilitiesNeed to account for chargingusing outlets not operated by yourcontracted providerOngoing costsUpfront cost for a dedicatedcharging unit (if so desired)Electric <strong>vehicle</strong> chargingservice providersTable 18. ‘Zero emissions driving’ options for <strong>electric</strong> <strong>vehicle</strong> operation in Victoria (DOT 2012g).
6.3 SOCIAL IMPACTS6.3.1 How is community safetybeing protected as part <strong>of</strong> the<strong>electric</strong> <strong>vehicle</strong> roll-out?The safety <strong>of</strong> the Victorian communityis being ensured through the creationand application <strong>of</strong> a technical standardsframework and accredited trainingcourses for technicians. Theseinitiatives streamline the existing,individual approaches being taken by<strong>electric</strong> <strong>vehicle</strong> market participants.Electric <strong>vehicle</strong> technology must bedesigned and deployed to cope withthe enormous range <strong>of</strong> scenarioswhich could result in a safety risk.Figure 54 illustrates just one suchscenario, where an <strong>electric</strong> <strong>vehicle</strong>has been left to charge prior to a thickblanket <strong>of</strong> snow falling. Equipmentsuppliers and operators must preemptthese scenarios in their design,manufacture and deployment <strong>of</strong>equipment so as to ensure communitysafety is maintained.Regulators must verify that equipmentsuppliers and operators have takenthe necessary measures as part <strong>of</strong>their due diligence when reviewing/approving deployment proposals.Technical standards are peer-reviewed,consensus-backed rules relating tothe design and operation <strong>of</strong> productsand work practices. They draw uponexpertise from all relevant stakeholdersto ensure consistency with existingpractices and management <strong>of</strong>emerging issues. While communitysafety is likely to be maintainedthrough the individual efforts <strong>of</strong> variouscompanies and regulators, standardssupport harmonisation <strong>of</strong> these effortsand avoid individual entities fromhaving to ‘reinvent the wheel’ at greatcost in both time and resources.In 2009, the Victorian Governmentcommissioned a scoping study for anational <strong>electric</strong> <strong>vehicle</strong> standardsframework (Standards Australia2010). An agreed work-plan wasdeveloped, following which the firstphase <strong>of</strong> the technical standardsdevelopment was initiated under theumbrella <strong>of</strong> the <strong>trial</strong>. The project willultimately deliver a comprehensivetechnical standards framework thatwill help <strong>electric</strong> <strong>vehicle</strong> marketparticipants harmonise their approachto ensuring community safety.Separately accredited training courseproviders are addressing the knowledgegaps within workforce training for<strong>electric</strong> <strong>vehicle</strong> technologies. Throughthe systematic deployment <strong>of</strong> trainingalongside the arrival <strong>of</strong> EV technologyin the market, workplace safety willbe maintained and the community canbe confident in the work practices thatkeep their <strong>vehicle</strong>s on the roads.Figure 54. Electric <strong>vehicle</strong> charging in the New York winter (photo by A.Rogers – used with permission).CREATING A MARKET 109
One issue that may need to beaddressed as part <strong>of</strong> standards andregulatory development processesrelates to the potential hazard to otherroad users as a result <strong>of</strong> the nearsilentoperation <strong>of</strong> <strong>electric</strong> <strong>vehicle</strong>s atlow speed. Around six weeks into the<strong>electric</strong> <strong>vehicle</strong> experience, the <strong>trial</strong>household participants were askedhow frequently the quiet operation<strong>of</strong> their EV had caught other roadusers unawares. Nearly one in threeparticipants <strong>report</strong>ed this experienceoccurring either ‘frequently’ or‘very frequently’.International regulators have acted toaddress this risk by requiring <strong>electric</strong><strong>vehicle</strong>s to emit a minimum sound levelduring low speed operation (NHTSA2011). The Australian Government(Aust Govt 2012b) is committed toharmonisation with international<strong>vehicle</strong> safety standards, as isevidenced by the following excerptfrom the responsible <strong>Department</strong>:The Australian Government’s policyis to harmonise the national <strong>vehicle</strong>safety standards with internationalregulations where possible andconsideration is given to the adoption<strong>of</strong> the international regulations<strong>of</strong> the United Nations EconomicCommission for Europe (UNECE).Australia is a signatory to the UNECE1958 Agreement and the 1998Agreement. The policy to harmoniseis also important to fulfil WorldTrade Organisation and Asia PacificEconomic Cooperation commitments.Australian Government <strong>Department</strong><strong>of</strong> Infrastructure and <strong>Transport</strong>website, February 2013As these standards are agreedinternationally and applied tothe design and manufacture <strong>of</strong><strong>electric</strong> <strong>vehicle</strong>s destined for theAustralian market, communitysafety will be ensured.6.3.2 How is Victoria’s future<strong>electric</strong> <strong>vehicle</strong> workforcebeing prepared?As the focus <strong>of</strong> Australia’s automotiveindustry, Victoria is home to a range <strong>of</strong>education and training providers whospecialise in automotive engineeringand repair. Recognising the futureneeds <strong>of</strong> the EV market, many <strong>of</strong> theseproviders have been actively developingtheir programs in support <strong>of</strong> EVs.The emerging trend towards <strong>electric</strong><strong>vehicle</strong> technology is being recognisedin Victoria’s higher education sector:• Swinburne University <strong>of</strong>Technology has establishedan <strong>electric</strong> <strong>vehicle</strong> researchgroup that in 2012 was workingon drivetrain and <strong>electric</strong>motor technologies, batterytechnology and management,<strong>vehicle</strong> architecture anddesign, lightweighting, Clean21Manufacturing, <strong>vehicle</strong>-to-<strong>vehicle</strong>and <strong>vehicle</strong>-to-infrastructurecommunications, the smart<strong>electric</strong>ity grid, consumerbehaviour and public policy,new business models andentrepreneurship, and EVpromotion, training and education(Swinburne 2012a)• University <strong>of</strong> Melbourne has aresearch program underway onthe impact <strong>of</strong> mass adoption <strong>of</strong><strong>electric</strong> cars on the Australian<strong>electric</strong>ity grid (Uni <strong>of</strong> Melb 2010).A novel means by which the futureEV workforce is being prepared isthrough the Formula SAE-A event.Formula SAE is an internationaleducation program where universitystudents design, build and competein small open-wheeler <strong>vehicle</strong>s (SAE-Aust 2012). Since 2009 it has beenpossible to enter an <strong>electric</strong> <strong>vehicle</strong> inthe competition, with local entrantsincluding Swinburne University<strong>of</strong> Technology (Swinburne 2012b)and Royal Melbourne Institute <strong>of</strong>Technology (DOT 2012h).Technical standards such as thosedescribed in Section 6.3.1 canform the basis <strong>of</strong> training courseand workshop practices for EVtechnicians. Training providers suchas the Victorian Automotive Chamber<strong>of</strong> Commerce and Kangan Institutehave already begun to address theseskills shortages with the creation<strong>of</strong> nationally accredited trainingcourses (VACCSDC 2012). As <strong>electric</strong><strong>vehicle</strong>s spread through dealershipand repair networks, manufacturersand workshop operators will beincreasingly able to draw upon widelyrecognised competencies rather thanbe required to address this skills gapin isolation.
A key challenge for many <strong>electric</strong><strong>vehicle</strong> market participants is gaininga return on the investment in trainingand equipment required to supportwhat will be a relatively small marketin the near-<strong>term</strong>. Additionally, theimplications <strong>of</strong> this can influenceother market participants. By way <strong>of</strong>example, a major automotive serviceand repair organisation has deferredthe decision to train staff and fitworkshops out with equipment toservice hybrid-<strong>electric</strong> <strong>vehicle</strong>s(HEVs) due to the relatively lownumber <strong>of</strong> <strong>vehicle</strong>s on Victorianroads 17 . As a result, HEVmanufacturers must rely upon alimited number <strong>of</strong> trained techniciansin the field to support their product,and operators <strong>of</strong> HEVs have a reducednumber <strong>of</strong> service and repair options.The <strong>trial</strong> experience <strong>of</strong> this issuehas been limitations in the dealerand roadside assistance network. Ininstances where roadside assistancehas been sought, the attendingtechnician has <strong>of</strong>ten little <strong>electric</strong><strong>vehicle</strong> knowledge and/or experience.Parts inventory and/or supply havealso been key influences in theresponse to <strong>vehicle</strong> damage and repair.This has resulted in delays and/orinconvenience in remedying problemsand getting the <strong>vehicle</strong>s back onthe road.17 personal communicationCREATING A MARKET 111
EDUCATION ANDAWARENESSPROGRAMThe VictorianElectric Vehicle Trialhas undertaken acomprehensiveeducation and awarenessprogram encompassinga range <strong>of</strong> online andoutreach initiatives.
The effectiveness <strong>of</strong>these initiatives has beenmeasured and interpretedto inform future effortsaimed at promotingawareness, understandingand acceptance <strong>of</strong><strong>electric</strong> <strong>vehicle</strong>s.7.1 OUTPUTS AND OUTCOMES7.1.1 How has the <strong>trial</strong> beencommunicated?The project has been communicatedbroadly through three online outlets,all <strong>of</strong> which have been found to beeffective when assessed againstcomparable benchmarks:1. Website – providing a range <strong>of</strong>information about the <strong>trial</strong>2. E-news – monthly news updateswhich also directs users back tothe website3. Discussion board – for usersto discuss their experiences<strong>of</strong> the EV <strong>trial</strong>.From the start <strong>of</strong> 2011 to the end<strong>of</strong> June 2012, the Victorian ElectricVehicle Trial website received nearly30,000 visits. The most popular pageswere the ‘what’s happening’ page with4,103 visits, followed by the homepagewith 3,886. The various publicationsmade available through the websitehad been downloaded 1,108 times,with the <strong>trial</strong> information booklet thataccompanied the <strong>trial</strong> launch havingbeen downloaded most at 83 times.Over 80 per cent <strong>of</strong> the 76 household<strong>trial</strong> participants surveyed <strong>report</strong>ed theVictorian Electric Vehicle Trial websiteas being ‘somewhat’ or ‘very helpful’.The <strong>trial</strong>’s e-news was launched in July2011 and has been published monthlysince that time except for January 2012which was deferred to February due tolikely impact <strong>of</strong> the holiday season onreadership. With reference to Figure55, the number <strong>of</strong> subscribers grewmarkedly as a result <strong>of</strong> the inclusion<strong>of</strong> an ‘opt-in’ question as part <strong>of</strong> the2012 household participation surveyand questionnaire, and has held fairlyconstant ever since.Subscription growth42103517 3492 3480 3492 3492 3507 3495 3481 34781741252308441 474 526Jun Jul Aug Sep Oct Nov Dec Feb Mar Apr May Jun Jul Aug SepJune 2011 – August 2012OctFigure 55. Victorian Electric Vehicle Trial e-news subscription rates.CREATING A MARKET 113
Figure 56 shows the open rate for thee-news email has averaged around 46per cent. This measure is considereda good indicator for audienceengagement, with the open rate forthe <strong>trial</strong> being more than double theindustry average figure <strong>of</strong> 20 per cent(Silverpop 2012).Click-through rates, another indicator<strong>of</strong> e-news effectiveness, were observedto be relatively low as a percentage <strong>of</strong>email opens, however feedback fromrecipients suggests that the e-newss<strong>of</strong>tware design and copy-writing stylemake much <strong>of</strong> the content visible inthe email. Recipients suggested thatthis is the preferred approach, as it issufficient for readers to glean the storycontent quickly and efficiently.The most popular stories (accordingto click-through rate as a percentage<strong>of</strong> the email opens) have beenthose relating to the <strong>trial</strong> householdparticipants. This can be explainedin the context <strong>of</strong> the majority <strong>of</strong>subscribers joining through the 2012household application to participate.Information about where and/or how tocharge cars was also popular, with themost surprising result being the fifthmostpopular story titled ‘Would youunplug someone else’s car?’ 18 , relatingto the etiquette surrounding shareduse <strong>of</strong> charging facilities.The objectives <strong>of</strong> the Victorian ElectricVehicle Trial Discussion Board were:• To provide a facility for <strong>trial</strong>participants to interact in avirtual space and in doing socreate an online Victorian <strong>electric</strong><strong>vehicle</strong> community• To gain unprompted feedbackfrom participants on theirattitudes towards <strong>electric</strong> <strong>vehicle</strong>swith which to supplement thestructured survey responses.From the launch <strong>of</strong> the discussionboard on 1 December 2010 to 6September 2012, 3,656 users hadregistered generating 378 posts and276 replies to 101 topics in 6 forums.This user-generated content had beenviewed 15,796 times, with the winnerin <strong>term</strong>s <strong>of</strong> content and views being‘first impressions’ with 6920 views<strong>of</strong> 29 topics/120 replies, followedby ‘day-to-day experiences’ with4,694 views <strong>of</strong> 41 topics/81 replies.70%60%50%40&30%20%10%0%Jun Jul Aug Sep Oct Nov Dec Feb Mar Apr May Jun Jul Aug Sep OctJune 2011 – October 2012Figure 56. Victorian Electric Vehicle Trial e-news open rate, which has averaged 46 per cent over 16 editions up to October 2012.18 http://enews-ev<strong>trial</strong>s.transport.vic.gov.au/link/id/zzzz4ffccf7b47eb8706/page.html#zzzz4ffccebcf305e132
The supplementary data andinteraction with participants enabledby the discussion board has proveninvaluable. Many EV industryparticipants, particularly the carmakers,drew insights from the contentprovided. Issues raised by the <strong>trial</strong>participants were able to be addressedthrough the discussion boardenvironment. A variety <strong>of</strong> observationswere drawn from the discussion boardthat weren’t arrived at via other means.An example <strong>of</strong> this relates to theMelbourne Airport charging facility,which was identified as being <strong>of</strong> stronginterest to users, with the caveatbeing their lack <strong>of</strong> confidence that itwould be vacant and available uponarrival. Measures were investigatedto optimise the site in <strong>term</strong>s <strong>of</strong>availability, access and informationprovision, with the case for actionsupported by the unprompted, usergeneratedcontent provided throughthe discussion board.Efficient communication andconsultation with the <strong>trial</strong>’s corporateparticipants has been achievedprimarily through the monthly TrialPlanning Working Group meetingsdescribed in Section 3.4. Learningsfrom the <strong>trial</strong> have been deliveredcontinuously through this pathway,streamlining participant interactionsand reducing the overheads associatedwith more formal communications.The mailing list for this group isaround 100 individuals representing80 organisations – the emergingAustralian EV market participants.Attendance at this meeting has beenreliably around 30 to 40 individualswho themselves vary from onemeeting to the next. The persistence<strong>of</strong> attendance has been interpretedas an endorsement for the meetingeffectiveness and the <strong>trial</strong>more generally.The appeal <strong>of</strong> EVs as a topic to awide variety <strong>of</strong> audiences has beenleveraged to communicate the <strong>trial</strong>through speaking engagements. Upto November 2012 the project hasbeen presented to around 75 formallyconvenedaudiences. This method <strong>of</strong>communication has been found to bevery effective in promoting awareness,understanding and ultimatelyacceptance <strong>of</strong> EVs.7.1.2 How has awareness<strong>of</strong> <strong>electric</strong> <strong>vehicle</strong>s beenpromoted?Awareness <strong>of</strong> <strong>electric</strong> <strong>vehicle</strong>s hasbeen promoted through the use <strong>of</strong>easily-recognisable branding oncollateral and signage, along withformal test-drive events and carsharefacilities. While these methodshave been efficient in <strong>term</strong>s <strong>of</strong> projectresources, their effectiveness in <strong>term</strong>s<strong>of</strong> Victorian community engagement islimited in <strong>term</strong>s <strong>of</strong> reach.Cars are an iconic and powerfullyengagingconsumer product. As aresult, EVs have a significant advantageover many other ‘clean’ technologies in<strong>term</strong>s <strong>of</strong> community engagement.This advantage has been leveragedto raise awareness <strong>of</strong> EVs by simplymaking the <strong>trial</strong> <strong>vehicle</strong>s availablefor events, exhibitions and displays.Collateral has been created toaccompany the <strong>vehicle</strong>s, along withan interactive storyboard that explainsthe background to EVs and the <strong>trial</strong>project more generally. Over 5,500DL brochures <strong>of</strong> the design shown inFigure 57 were distributed in the 12months to October 2012.CREATING A MARKET 115
The <strong>vehicle</strong>s used for the <strong>trial</strong> havebeen made available for over 1,000people to experience EV technologyfirst-hand through a short test-drive.The largest test-drive opportunitieshave been the 2010 and 2011 RACVGreenzone events, the 2011 AustralianInternational Motor Show and the 2012LEV Automotive Partnership FleetForum and Drive-day. The attraction<strong>of</strong> new technology has been clearlyevident throughout, with the <strong>electric</strong><strong>vehicle</strong>s being the most popularchoice in <strong>term</strong>s <strong>of</strong> test-drives taken ateach event. In addition to the resultsfrom participant surveys presentedin Section 4.2.2, key success factorsrelating to the event delivery included:• Involvement <strong>of</strong> an event organiserwith experience in delivering<strong>vehicle</strong> test-drive events• Partnerships with the carmanufacturers, whoprovide funding supportand staff resources• An online test-drive bookingfacility to maximise <strong>vehicle</strong>utilisation and streamline theparticipant experience• Comprehensive <strong>vehicle</strong> insuranceto cover the test-drive activitycoupled with participant licencechecking and consent forms• Dedicated event staff includingfor bookings and to provideone-on-one instruction/supervision for the test-drives• Printed collateral to provideparticipants with moreinformation/sign-postingto online resources• Participant surveys to gaugeperceptions before/after thetest-drive experience (includingadvance consideration and on-thegroundverification <strong>of</strong> the surveydelivery arrangements).Test-drives have also been possiblethrough a car-share facility. As atest-drive option, car-share hassignificant advantages over theformal events described above in<strong>term</strong>s <strong>of</strong> cost (funding and staff) andaccess for participants. This optionwas investigated in partnership withPlaces Victoria, ChargePoint andGoGet, through placement <strong>of</strong> a <strong>trial</strong> EVin a car-share facility located at TheNicholson residential development.While complications arising from theoperating environment have limitedand ultimately curtailed the car-sharefacility at this location, insights gainedfrom the initial roll-out are informingthe design <strong>of</strong> other <strong>electric</strong> car-shareroll-outs elsewhere.The Victorian Electric Vehicle TrialThe Victorian Government’s Electric Vehicle Trialaims to smooth our move towards <strong>electric</strong> <strong>vehicle</strong>technologies. The <strong>trial</strong> will run until the end <strong>of</strong> 2013,collecting real-world information on how <strong>electric</strong><strong>vehicle</strong>s are used by the Victorian households andfleets taking part.Want to get involved?Visit the website to find out how. You’ll also find <strong>report</strong>s,fact sheets and other informative resources.www.transport.vic.gov.au/ev<strong>trial</strong>sWant the latest news?Keep up to date with the most recent developments.Subscribe to the monthly newsletter and get the latestnews delivered to your inbox.http://enews-ev<strong>trial</strong>s.transport.vic.gov.au/Want to have your say?Join the Discussion Board. Share yourthoughts and chat about <strong>electric</strong> <strong>vehicle</strong>swith community members.http://ev<strong>trial</strong>s.invisionzone.com/www.transport.vic.gov.au/ev<strong>trial</strong>sAuthorised by the Victorian Government, 121 Exhibition St, Melbourne Victoria 3000Figure 57. Victorian Electric Vehicle Trial DL-size brochure design.
EV PROMOTION CASE STUDYELECTRIC CAR-SHARECar-share is a fast-growing alternative to <strong>vehicle</strong> ownership where members have access to a fleet <strong>of</strong><strong>vehicle</strong>s in a network <strong>of</strong> locations and typically pay per use (Shaheen et al 2010). In Australia and aroundthe world, car-sharing is gaining popularity as a means to reduce transport costs, traffic congestion andimpacts on the environment (SGS 2012).Electric <strong>vehicle</strong>s are a potentially great fit with car-share. The <strong>vehicle</strong>s can be charged where they park,rather than needing to be refuelled at a service station. The majority <strong>of</strong> car-share journeys are well withinthe range <strong>of</strong> an <strong>electric</strong> <strong>vehicle</strong> – GoGet (2011) <strong>report</strong>ed 97 per cent <strong>of</strong> trips made by their members asbeing less than 50 kilometres.Car-sharing also provides a means for the wider community to experience <strong>electric</strong> <strong>vehicle</strong> technologyfirst-hand. Users can choose when and where they take a test-drive, potentially to a location which haspriority parking for <strong>electric</strong> <strong>vehicle</strong>s.GoGet joined the Victorian Electric Vehicle Trial in 2011, and have since deployed three <strong>electric</strong> car-shareservices in contrasting locations. Insights gained to date suggest that similar issues and opportunitiesexist for <strong>electric</strong> car-share deployment as for fleet EV take-up more broadly (refer to Section 4.3.4).Figure 58. GoGet <strong>electric</strong>car-share <strong>vehicle</strong> at TheNicholson residentialdevelopment.CREATING A MARKET 117
7.1.3 What <strong>electric</strong> <strong>vehicle</strong>educational activities havebeen delivered and what dothey tell us?Electric <strong>vehicle</strong> education programsare an effective way <strong>of</strong> promotingacceptance <strong>of</strong> the technology, and arepopular with those who experiencethem. Attracting interest at the outsetis however a major challenge thatrequires further work.Lyons and Breakwell (1994)found that attitudes towards theenvironment begin to form early inchildhood development. Additionalresearch suggests that higher levels<strong>of</strong> commitment to environmentaleducation programs in schools notonly result in greater understandingand behaviour change in the childrenpartaking in the program, but can evenhave flow on effects in raising parentalawareness <strong>of</strong> these concepts (Davisonet al 2003, Kopina 2011).These insights, along with engagementby school teachers and children in the<strong>trial</strong> household participation process,led to a dedicated EV educationprogram for schools beingdeveloped. The EV School program(www.transport.vic.gov.au/evschool)was launched in early 2012.The EV School program draws uponthe Victorian teaching curriculumlearning objectives in the areas <strong>of</strong>science, humanities, civics, and design,creativity and technology. It alignswith the Victorian Essential LearningStandards (VELS) for primary (Gradethree to six) and secondary (Yearsseven to ten) school levels. Withreference to the step-guide shownin Figure 59, the program provideseducators with all they need toachieve their required teachingobjectives through the topic thatis <strong>electric</strong> <strong>vehicle</strong>s.Although the program was successfullypiloted with a Melbourne high school,promoting its wider adoption hasproven challenging. Brochureshave been prepared for distributionat the many teaching conferencesthat take place at the end and start<strong>of</strong> each calendar year, followingwhich it is hoped that widespreadawareness <strong>of</strong> the program intime for formulation <strong>of</strong> the 2013teaching plans will help uptake.EV School for teachers1 EnlightenRead the teacher’s notes todiscover <strong>electric</strong> <strong>vehicle</strong>s andfind out more about the EVSchool program.2 Educate• Go to the EV School lessonplan curriculum matrix andselect the matrix for yourteaching domain• From the Matrix, choose alesson plan which best suitsyour teaching needs• Classroom resources arealso available to supportyour lesson.3 Explore• The student project ideasprovide expanded andprintable versions <strong>of</strong> theproject ideas for primary andsecondary students found inthe ‘Learning Method Matrix’• If you’re looking for anentertaining classroomactivity, check out end <strong>of</strong> unitfun for some ideas!Figure 60 (Top). Kingswood College 2012 World Environment Day <strong>electric</strong> <strong>vehicle</strong> showroom event.Figure 59 (Above). Step-by-step guide for the EV School program introduced by ‘Evie’, the EV School mascot.
In addition to the EV School program,an education partnership has beenformed with the Centre for Educationand Research into EnvironmentalStrategies (CERES). CERES is anot-for-pr<strong>of</strong>it sustainability centreand Australia’s largest deliverer<strong>of</strong> environmental education. Inrecognition <strong>of</strong> CERES’s role in hostingregular visits by schools, conductingincursion programs into schools, andbeing a community hub for sustainableliving, <strong>trial</strong> <strong>vehicle</strong>s have been providedfor the CERES fleet and a solarchargingstation has been built at theirfacility to form part <strong>of</strong> the Victorian EVcharging network – refer to Figure 62and the break-out box.The <strong>trial</strong> has also partnered with alocal school for an EV-themed WorldEnvironment Day event. An <strong>electric</strong>car showroom was created for theYear 11 students to ‘sell’ the <strong>vehicle</strong>sto their Year 7 ‘buyers’. The strongengagement from the studentsinvolved provides further evidence<strong>of</strong> the effectiveness <strong>of</strong> EVs as anexample <strong>of</strong> ‘clean technology’.The department also delivered two EVsand Fleets 2012 workshops as outlinedin Section 4.3.4 and Appendix B – EVsand Fleets 2012 Practical roll-out plan.These workshops were intendedto address the knowledge gap onsuccessful EV deployment by educatingthose responsible for the <strong>vehicle</strong> rollout.Surveys <strong>of</strong> attendees returneda 98 per cent approval rating on theworkshop (“Would you recommendthe EVs & Fleets 2012 workshopattendance to colleagues looking toroll-out EV technology?”, n = 53).While this result is encouraging withregards the workshop design anddelivery, promoting and securingattendance was and remains thegreater challenge. This findinghighlights the need to address otherstakeholders within organisationsto secure support for <strong>electric</strong><strong>vehicle</strong>s. With reference to Table5 (page 46), a major educationalopportunity to promote fleet EVuptake would be to target seniormanagement/executives. To this endthe <strong>Department</strong> has conceived asmall project to be delivered in 2013aimed at investigating this further.Select which features you like the most about <strong>electric</strong> cars(more than one option may be selected)Green and moresustainableLess or nopetrol requiredThey are coolHigh-techEnvironmentalcredibilityPrior brandexperienceOtherFigure 61. Results <strong>of</strong> the Year 11 ‘sellers’ survey <strong>of</strong> their Year 7 ‘buyers’ from the Kingswood College 2012 World Environment DayEV showroom event (n = 57).CREATING A MARKET 119
EV EDUCATION CASE STUDYCENTRE FOR EDUCATION AND RESEARCHINTO ENVIRONMENTAL STRATEGIES (CERES)The Centre for Education and Research into Environmental Strategies, or CERES, is a 4.5 hectare communityenvironment park based in East Bruswick. The award-winning not-for-pr<strong>of</strong>it has been internationallyrecognised for its work in community and environmental practice (CERES 2012).Around 60,000 students and their teachers visit the CERES facility per year, along with three adult tours perweek and a thriving community market. With their focus on sustainable living, CERES has emerged as the ideallocation for the solar EV charging canopy launched in 2012 (refer to Figure 61). Although grid-connected, colocation<strong>of</strong> the solar canopy with the EV charging facility has proven to be an excellent means <strong>of</strong> engaging thecommunity on <strong>electric</strong> <strong>vehicle</strong> technology (ABC 2012). Awareness <strong>of</strong> the CERES public charging facility is amongthe highest in the <strong>trial</strong> charging network.CERES has previously been active in the delivery and training <strong>of</strong> EV af<strong>term</strong>arket conversions, and hassuccessfully integrated <strong>electric</strong> <strong>vehicle</strong>s into its sustainable energy education programs. In 2013 they arebuilding upon these experiences to more fully integrate <strong>electric</strong> <strong>vehicle</strong>s into their school incursion/excursionprograms, including use <strong>of</strong> the <strong>trial</strong> EVs as part <strong>of</strong> the program delivery.CERES is amongst the most successful <strong>of</strong> the <strong>trial</strong> partners in promoting <strong>electric</strong> <strong>vehicle</strong> awareness,understanding and acceptance.Figure 62. CERES solar EVcharge station – a hub forcommunity EV education.
7.1.4 How has the local <strong>electric</strong><strong>vehicle</strong> industry and marketbeen promoted?The role <strong>of</strong> the <strong>trial</strong> in providing ameeting place for over 80 corporateparticipants in the emerging EV markethas been significant. No other forumexists in Australia for the variousmarket players to interact and in doingso engage with the wider market.A key objective for the <strong>trial</strong> has beento promote Victoria as a place todo business. This has severalobvious benefits:• Promote investment andemployment in Victoria• Create competition in the Victorianmarket and downwards pressureon costs for consumers.To this end, the <strong>trial</strong> has beensuccessful in positioning Victoria asthe most <strong>electric</strong> <strong>vehicle</strong>-friendlystate in Australia. As <strong>of</strong> November2012, around 60 per cent <strong>of</strong> Australia’sEV charging facilities are located inVictoria. Victoria is the only state tohave a registration discount for EVs,and has recognised EVs within theroad safety framework includingnumber-plate labelling andstandardised signage.Promotion <strong>of</strong> Victoria has beenachieved through numerous nationaland international forums. In May 2012,Victoria took part in the World EV Citiesand Ecosystems conference in LosAngeles. Victoria has also taken partin the International Energy Agency’sImplementing Agreement on Hybridand Electric Vehicles.The value <strong>of</strong> the <strong>trial</strong> in bringingthe market together at its outset isevidenced by the regular and reliableattendance <strong>of</strong> the monthly projectmeetings (refer to Section 3.4), and bythe steady base <strong>of</strong> subscribers to theproject e-news (Section 7.1.1).CREATING A MARKET 121
LOCAL EV INDUSTRY CASE STUDYBOSCH AUSTRALIARobert Bosch Australia Pty Ltd are part <strong>of</strong> the global Bosch group <strong>of</strong> companies. Founded in 1922 andheadquartered in Clayton, in 2012 Bosch Australia had over 1,100 employees and $680 million in sales splitbetween automotive, consumer goods, building and indus<strong>trial</strong> technologies.Bosch Australia have participated in the Victorian Electric Vehicle Trial as a fleet operator, charginginfrastructure provider and host, and <strong>vehicle</strong> supplier courtesy <strong>of</strong> their support for the EV Engineeringproject. As one <strong>of</strong> the first fleets to receive a Mitsubishi i-MiEV in December 2010, Bosch Australia haveleveraged their <strong>trial</strong> involvement to good effect.By receiving one <strong>of</strong> the <strong>trial</strong> EVs so early in the global market roll-out, Bosch Australia were able to engageat the forefront <strong>of</strong> Bosch’s global electro-mobility development activities. As a result, valuable EV chargingstation and network s<strong>of</strong>tware product and operational experience has been gained by the Bosch Australiaorganisation, years earlier than what may have occurred otherwise.A particular area <strong>of</strong> interest for Bosch both locally and globally has been network roaming interoperabilityas is discussed in Section 5.1.4. Bosch’s eMobility platform is a network solution for charginginfrastructure operators to provide customers with a seamless ‘roaming’ experience.With reference to Sections 3.1 and 5.1.2, the size and complexity <strong>of</strong> the <strong>trial</strong> has permitted Bosch Australiato investigate the network roaming model and business arrangements as an input into their global productdevelopment. An outcome has been the introduction <strong>of</strong> new products and innovation into the local market,all <strong>of</strong> which will ultimately benefit the Victorian consumer.Figure 63. A <strong>trial</strong> <strong>vehicle</strong>charging from aBosch charging outletat their Australianheadquartersin early 2013.
7.2 INSIGHTS7.2.1 How do we best tell thestory about <strong>electric</strong> <strong>vehicle</strong>s?A range <strong>of</strong> insights can be drawnfrom the <strong>trial</strong> results that may informcommunication plans relating to<strong>electric</strong> <strong>vehicle</strong> technologies. Keyissues that should be considered incommunicating the ‘EV story’ includeenvironmental bona fides, newtechnology as a defining characteristic,driving enjoyment due to the inherentcharacteristics <strong>of</strong> <strong>electric</strong> motors, andoperating cost benefits expressed infamiliar ways. Challenges include thecomplexity <strong>of</strong> the individual and interrelatedenvironmental and <strong>electric</strong>itysupply stories.Based upon insights gained fromthe <strong>trial</strong>, a range <strong>of</strong> opportunities existto more effectively communicate the‘EV story’:• Technology is clearly a significantreason as to why individuals maybecome initially interested inEVs – ‘interest in new technology’was the primary motivation forhousehold applicants to the <strong>trial</strong>(Section 4.2.1)• The demographic skew towardshigher education for thoseinterested in EVs (Section 4.2.1)may provide some opportunitiesin <strong>term</strong>s <strong>of</strong> communicationspathways – for example,most universities publish anddistribute magazines to alumniand maintain active socialnetworks, and <strong>of</strong>ten have roadsystems on campus that may lendthemselves to test-drive events• Vehicle performance in <strong>term</strong>s<strong>of</strong> acceleration and othercharacteristics that make <strong>electric</strong><strong>vehicle</strong>s fun to drive should be afocus for bringing people acrossto the technology, as has beenevidenced by the results from thetest-drive events undertaken aspart <strong>of</strong> the <strong>trial</strong> (Section 4.2.2)• Environmental benefits as thebasis for brand-building is theprimary reason for fleets tobecome initially interested inEVs (Section 4.3.1), and asignificant motivator forhouseholds also (Section4.2.1). The majority <strong>of</strong> fleetswho applied to participate inthe Victorian Electric VehicleTrial have significant corporatesocial responsibility commitmentsthey believe EVs may visiblydemonstrate• ‘Getting the story straight’ on theenvironmental benefits <strong>of</strong> EVsis a key to avoiding perceptions<strong>of</strong> ‘greenwash’ and gaining a‘social licence’ for EV technologyto operate within the community.Almost without fail at any exhibit<strong>of</strong> the technology, questions havebeen asked about the legitimacy<strong>of</strong> the environmental benefits<strong>of</strong> EVs. This is even more so inVictoria given the state’s widelyacknowledgedcarbon-intensive<strong>electric</strong>ity generation, whichis a key issue that needs to beaddressed as part <strong>of</strong> EV chargingstrategies (Section 6.2)• Operating costs should beexpressed in <strong>term</strong>s <strong>of</strong> dollarsper week or month. Of the107 household participantssurveyed, nearly 65 per centrecorded the existing <strong>vehicle</strong>fuel costs as a weekly expense,while nearly 32 per cent recordedthese costs in monthly <strong>term</strong>s(Section 5.2.5)• Solar PV owners have a goodunderstanding <strong>of</strong> <strong>electric</strong>ity costsand use, including the financialbenefits <strong>of</strong> deferring energy useto <strong>of</strong>f-peak periods, providing apotential avenue for discussion<strong>of</strong> the low operating costs <strong>of</strong>EVs charged in <strong>of</strong>f-peak periods(Section 5.2.4). Solar PV ownersare also an excellent demographicfit for ‘technology/environment’as highlighted above, and sorepresent a likely early marketopportunity for EVs• The first EV drivers are effectively‘ambassadors’ for the technologywho should be provided withrelevant information so as to bewell-informed. This was evidencedby the frequency <strong>of</strong> conversations<strong>report</strong>ed by the <strong>trial</strong> householdparticipants with family, friends,work colleagues and evenstrangers on the topic (referto Section 7.2.2).CREATING A MARKET 123
Communicating the environmentalbenefits <strong>of</strong> <strong>electric</strong> <strong>vehicle</strong>s is bothan obstacle and an opportunity. Withreference to Section 6.2, the relianceon and arrangements for renewableenergy to deliver the environmentalbenefits <strong>of</strong> <strong>electric</strong> <strong>vehicle</strong>s is acomplicated story. Experience fromthe <strong>trial</strong> suggests that a general lack<strong>of</strong> understanding or even cynicismregarding operation <strong>of</strong> the <strong>electric</strong>itymarket creates additional challengesin explaining the environmentalbenefits <strong>of</strong> renewable energy powered<strong>electric</strong> <strong>vehicle</strong>s.Given that environmental benefitsare a strong motivator for EV takeupby early adopters (Section 3.2) inboth households (Section 4.2.1) andfleets (Section 4.3.1), providing aneasily-understood, defensible meansto evidence ‘zero emissions driving’may be a key enabler for EV take-up.Options to address this may include:• Linking EV support andidentification measures toGreenPower purchase contracts• Documenting, publicising andrecognizing ‘zero emissions’stories for households andfleets that link distributedrenewable energy generationwith EV operation• Working with key stakeholders todevelop or leverage an existingaccreditation program/brand thatcan underpin recognition <strong>of</strong> EVsthat can be defensibly linked torenewable energy• Leveraging the good understanding<strong>of</strong> solar PV owners and the ‘EVambassador’ role <strong>of</strong> the first EVdrivers identified above as part <strong>of</strong> arecognition program.7.2.2 Do <strong>electric</strong> <strong>vehicle</strong>seducate or inform peopleabout other issues?Results from the householdparticipants suggest that <strong>electric</strong><strong>vehicle</strong> experience engages, educatesand motivates people in relation toenergy use issues more broadly.These and other insights are likelyto be shared with family, friends,colleagues and even strangers onaccount <strong>of</strong> the ‘conversation-starter’effect <strong>of</strong> EV ownership.Although around 80 per cent <strong>of</strong>household participants <strong>report</strong>edthemselves as ‘having a goodunderstanding <strong>of</strong> their householdenergy use’, nearly 60 per cent <strong>of</strong>participants suggested that theywould ‘like to know more about theirhousehold energy use/costs’ as aresult <strong>of</strong> having an <strong>electric</strong> <strong>vehicle</strong>(n = 62). As an outcome from their<strong>electric</strong> <strong>vehicle</strong> experience, nearlyone in three household participants<strong>report</strong>ed themselves as having animproved understanding <strong>of</strong> household<strong>electric</strong>ity use/costs, and one in fouron measures to save on <strong>electric</strong>ityuse/costs.To a lesser extent this also applied to<strong>vehicle</strong> fuel use. Around 40 per cent <strong>of</strong>participants suggest that they ‘wouldlike to know more about how to drivein a way that saves fuel in conventionalcars’, to the extent that nearly one infive actually sought this informationout as a result <strong>of</strong> their EV experience.And as a result <strong>of</strong> their EV experience,nearly 41 per cent <strong>of</strong> participants<strong>report</strong>ed themselves as having animproved understanding <strong>of</strong> how todrive in a way that saves fuel inconventional cars.This improved awareness andunderstanding <strong>of</strong>ten translatesinto action. Some 29 per cent <strong>of</strong>participants <strong>report</strong>ed themselves ashaving made changes to their homeand/or behaviour that will reduce<strong>electric</strong>ity use/costs, which is the samenumber <strong>of</strong> participants who <strong>report</strong>edthemselves as having changedtheir driving style so as to be moreeconomical in conventional cars.Household participants also <strong>report</strong>edthemselves as having regularlytalked with others about their <strong>electric</strong><strong>vehicle</strong> experience. Over 96 per cent <strong>of</strong>participants <strong>report</strong>ed having ‘frequent’or ‘very frequent’ conversations withfamily, friends or work colleagueson account <strong>of</strong> their Victorian ElectricVehicle Trial experience, and over 45per cent <strong>report</strong>ed similar experienceswith strangers. This suggests thatEV drivers may act as ‘experts’ in thecommunity in relation to energy useissues more broadly.
ISSUES ANDOPPORTUNITIESA significant outcomefrom the VictorianElectric Vehicle Trialhas been the range <strong>of</strong>issues and opportunitiesobserved in relation to<strong>electric</strong> <strong>vehicle</strong> marketdevelopment in Victoria.The issues/opportunitiesapply to both the earlyand mainstream market,and are relevant for all<strong>electric</strong> <strong>vehicle</strong> marketstakeholders.CREATING A MARKET 125
With reference to Section 3.2, the <strong>trial</strong> focus is on technology market development, or in other words the adoption <strong>of</strong> newtechnology. Drawing upon Dunstan et al (2011) and Jaffe et al (2005), barriers to technology adoption may be broken downaccording to the categories listed in Table 19.BarrierDefinitionTechnical Current technology The performance <strong>of</strong> the new technology (as compared to theincumbent/competitors)Current costsThe cost <strong>of</strong> the new technology (as above)Institutional Regulatory barriers Regulation biased against the new technologyExternalities and price structuresFailure to reflect costs accurately in prices, including:• Environmental impact costs from a technology that arenot borne by users• Knowledge acquisition costs about a new technology for oneindividual/firm which create benefits for others• Adoption costs <strong>of</strong> a new technology for one user being dependentupon the number <strong>of</strong> other users that have adopted thetechnology (sometimes called ‘dynamic increasing returns’).Payback gapSplit incentivesIncomplete informationCultural valuesConfusionThe gap in acceptable payback periods between stakeholdersThe challenges <strong>of</strong> capturing benefits spread across numerousstakeholdersAbsence or difficulty in accessing relevant, reliable informationInsufficient attention given by individuals and organisations to newtechnologies and opportunitiesThe additional barriers created by the interaction <strong>of</strong> thebarriers aboveTable 19. The classification <strong>of</strong> barriers to adoption <strong>of</strong> new technology/innovations.With reference to Section 3.2, an additional consideration relates to the significance <strong>of</strong> a barrier in the context <strong>of</strong> the timelinefor adoption <strong>of</strong> a new technology/innovation. Some barriers may be particularly significant at the outset <strong>of</strong> the marketdevelopment, but may reduce over time. Other barriers may be <strong>of</strong> greater significance as the market goes ‘mainstream’.Dunstan et al (2011) have provided a systematic and comprehensive analysis <strong>of</strong> the wide range <strong>of</strong> barriers to <strong>electric</strong><strong>vehicle</strong> adoption against the classifications in Table 19. Building upon this and the phases <strong>of</strong> market development asoutlined in Sections 3.2 and 6.1.2, Table 20 provides a summary <strong>of</strong> the issues and opportunities for EV market growthidentified throughout this <strong>report</strong>. It should be noted that the observations made are relevant for all <strong>electric</strong> <strong>vehicle</strong> marketstakeholders, not just government.
Issue Classification Sections Opportunities Early marketEarly-adopter Confusion 6.2 • Evidencing environmental bona fides xvalue proposition• Linking EV uptake to renewableenergy.Current costs 7.2.1 • High Occupancy Vehicle lane access xElectric <strong>vehicle</strong>purchase pricesDepreciation /resale valuesElectric <strong>vehicle</strong>range / chargingtimeCurrent costs /Payback gapExternalities(knowledgeacquisition,dynamic increasingreturns)4.2.54.3.15.2.65.3.65.4.54.2.34.3.24.3.45.1.55.2.35.2.65.3.25.4.25.4.5Current costs 4.1.34.3.4• Local government and/or <strong>electric</strong>itymarket fleet focus• Building rating program recognition• Workplace charging programpromotion• Sponsorship <strong>of</strong> on-street publiccharging locations• Signage for public charging locations• Reservation facility for commercialcharging / parking locations.• EV drivers forum• Fleet knowledge sharing• Corporate charging networks• Centralised charging networkinformation• Information for developers, landlords,property managers etc.• Reduced barriers to market entry• Increased market competition• Purchasing coalitions.Current costs 4.1 • OEM intervention• Battery standards• Second-life battery market.Current technology 4.2.34.3.45.3.65.4.5Incompleteinformation4.1.34.2.24.3.45.1.55.3.65.4.5• Workplace charging• Public charging network, includingquick chargers.• Improved charging networkinformation• Optimised <strong>vehicle</strong> connectivity• Promote awareness <strong>of</strong> drivingpatterns/distances• Knowledge-sharing through EVdrivers forum.xxxxxxMainstreammarketxxCREATING A MARKET 127
Issue Classification Sections Opportunities Early marketFleet EV uptake Current costs 4.1.2 • Purchasing coalitions (particularly x4.1.5 E-LCVs)4.3.1 • Promotion to decision-makers4.3.3 • Improved charging activity data4.3.4 • Improved operational cost data forPHEVs• Knowledge sharing• Marketing-focused <strong>vehicle</strong>deployments (local government and<strong>electric</strong>ity market fleets; corporatecharging strategies).Current technology 4.3.4 • 32 amp charging <strong>vehicle</strong> capability x5.3.6 • PHEVs• Quick charger network• Corporate charging strategies• Improved charging managementcapability.Cultural values 4.3.4 • Designated EV championsx5.3.6 • Strategic <strong>vehicle</strong> deployments• Corporate charging strategies.Charging Current technology 4.1.3 • Improved charging networkxinfrastructure4.2.2 informationroll-out4.3.4 • Optimised <strong>vehicle</strong> connectivity5.1.5 • Technical standards development /5.3.6 adoption.5.4.5Externalities5.1.5 • Agreed signagex(knowledge5.2.1 • Guidance for parking management /acquisition,5.2.3 enforcementdynamic increasingreturns)5.2.6 • Analysis <strong>of</strong> Victorian housing stock5.3.2 • Measures to address rentals, leased5.4.2 commercial premises, on-street5.4.5locations holders• Identification <strong>of</strong> priority locations forpublic charging outlets.Payback gap 5.1.4 • Facilitation <strong>of</strong> network roamingx5.1.5 arrangements / agreements5.3.6 • Workplace charging program5.4.3promotion5.4.5 • Sponsorship <strong>of</strong> on-street publiccharging locations• Promotion for public charginglocations• Reservation facility for commercialcharging / parking locations.Mainstreammarketx
Issue Classification Sections Opportunities Early marketCharging Incomplete5.2.3 • Information for developers, builders, xinfrastructure information5.3.2 landlords, property managers,roll-outcouncils, <strong>electric</strong>ity distributors etc5.3.65.4.2• Identification <strong>of</strong> priority publiccharging locations.5.4.5Split incentives 5.2.3 • Building rating program recognition x5.2.6 • Measures to address new5.3.2 developments, rentals, leased5.4.2commercial premises5.4.4 • Support for priority public charging5.4.5locations• Quick chargers.Environmental Externalities6.2 • Linking EV uptake with renewableximpacts(environmentalenergy.impacts)Grid impactsElectric <strong>vehicle</strong>awareness,understandingand acceptanceIncompleteinformationExternalities(dynamicincreasing returns)5.2.45.2.65.3.35.2.65.3.6Cultural values 4.1.44.2.24.2.55.4.35.4.55.3.67.2.1• Information for EV operators(households, fleets) on ‘smart’charging strategies• Information for <strong>electric</strong>ity distributorson grid impacts from EV charging andmanagement options.• Measures to promote EVs for energystorage (V2G).• Information about E2Ws• Promotion <strong>of</strong> the performancecharacteristics <strong>of</strong> EVs• Targeting information at universitiesand their alumni• Specify EV operating cost advantagesas weekly / monthly• Establish environmental bona fides• High Occupancy Vehicle lane access• Partnerships for on-street charginglocations• Promotion <strong>of</strong> the public chargingnetwork.xMainstreammarketxxxxxTable 20. Issues and opportunities for EV market development as observed within the <strong>trial</strong>.The timeline and economic benefits <strong>of</strong> EV market development as outlined in Section 6.1 are heavily dependent uponresolution <strong>of</strong> these issues and opportunities. In simple <strong>term</strong>s, many <strong>of</strong> these issues must be addressed if the <strong>electric</strong> <strong>vehicle</strong>market is to ever move beyond its current state <strong>of</strong> infancy.CREATING A MARKET 129
WHERE TOFROM HERE?The Victorian ElectricVehicle Trial project willbe completed in <strong>mid</strong>-2014. The final phase<strong>of</strong> the <strong>trial</strong> will seek toposition Victoria for theperiod following the <strong>trial</strong>conclusion up until 2020,the forecast ‘take-<strong>of</strong>fpoint’ for mainstreammarket adoption.
Drawing upon the learnings acquired in the project to date, the three broad subject areas that will be the primary focus forthe remainder <strong>of</strong> the <strong>trial</strong> are:1. Enhancing the early-adopter EV value proposition (‘early adopters’)2. Reducing the costs <strong>of</strong> EV uptake – now and in future (‘reducing costs’)3. Raising awareness, understanding and acceptance <strong>of</strong> EVs in the Victorian community (‘education and awareness’).A range <strong>of</strong> detailed tasks will be completed in the intervening period, a summary <strong>of</strong> which can be seen in Table 21 includingalignment with the subject areas above. The final project <strong>report</strong> will update the findings presented in this <strong>mid</strong>-<strong>term</strong> <strong>report</strong>,along with additional insights made in the interim.TaskEV charging DR/LCproject <strong>report</strong>EV purchasingcoalition <strong>report</strong>Completion <strong>of</strong>household <strong>vehicle</strong>roll-outsNational leadershipEV test-driveprogramLand-use planningguidance projectEV Schooleducation program<strong>report</strong>Completion <strong>of</strong> fleet<strong>vehicle</strong> roll-outsCompletion<strong>of</strong> charginginfrastructure rolloutsFinal <strong>report</strong>EV stakeholderengagementDescriptionPublication <strong>of</strong> final <strong>report</strong> forthe <strong>electric</strong> <strong>vehicle</strong> chargingdemand response / load controldemonstration projectPublication <strong>of</strong> final <strong>report</strong> for thefleet <strong>electric</strong> <strong>vehicle</strong> purchasingcoalition feasibility studyFinalisation <strong>of</strong> householdparticipant data sets, including<strong>vehicle</strong> and charging activitymonitoring, surveys and traveldiariesIn partnership with RACV,test-drive program aimed atexecutive-level management<strong>of</strong> large fleet operatorsFurther engagement with landdevelopment sector and finalassessmentContinued delivery and finalassessment <strong>of</strong> school-basededucation programFinalisation <strong>of</strong> fleet <strong>vehicle</strong> datasets, including charging activitymonitoring and surveysInstallation and commissioning <strong>of</strong>all household and fleet charginginfrastructure, quick chargers,and decommissioning/transition<strong>of</strong> legacy infrastructure at <strong>trial</strong>conclusionCompilation and validation <strong>of</strong>complete <strong>trial</strong> data set; analysisand completion <strong>of</strong> final project<strong>report</strong>Continuation <strong>of</strong> and transitionarrangements for EV marketstakeholder engagementEarly-adoptersSubject areaReducing costsEducation andawarenessTimeframeX X March 2013X March 2013X X X April 2013X X July 2013X X X October 2013X November 2013X X X December 2013X X X April 2014X X X June 2014X X X June 2014CREATING A MARKET 131
TaskNational EVstandardsdevelopmentprocessProject websiteand associatedpublicationsDescriptionContinuation <strong>of</strong> and transitionarrangements for the national EVstandards development processTransition and/or exitarrangements for the website,discussion board, guidancematerials etc.Early-adoptersSubject areaReducing costsEducation andawarenessTimeframeX X X June 2014X June 2014Table 21. Victorian Electric Vehicle Trial high-level task list for project completion.With reference to Sections 4.1.1 and 5.1.1, the <strong>vehicle</strong>s and charging infrastructure will be transitioned out <strong>of</strong> the <strong>trial</strong>through arrangements set out in the initial project agreements:• The <strong>trial</strong> <strong>vehicle</strong>s are to be returned to the relevant <strong>vehicle</strong> suppliers via the Victorian Government fleetmanagement organisation• The <strong>trial</strong> charging infrastructure will be either transitioned over to a direct commercial relationship between the siteowner/operator and the charging infrastructure provider as a result <strong>of</strong> an <strong>of</strong>fer made by the latter to the former,or it will be removed and the site remediated back to near-original condition.These arrangements reflect the finite duration <strong>of</strong> the <strong>trial</strong> project along with the objective to provide a foundation for theVictorian <strong>electric</strong> <strong>vehicle</strong> market.
ACRONYMS,GLOSSARY ANDUNITS OF MEASURECREATING A MARKET 133
A – ampere or amps, a measure<strong>of</strong> <strong>electric</strong>al currentBEV – Battery Electric Vehicle, ora <strong>vehicle</strong> that runs exclusively on<strong>electric</strong>al energyAdvanced Metering Infrastructure– or smart meters, a type <strong>of</strong> hightechnology <strong>electric</strong>al meter thatidentifies consumption in moredetail than a conventional meter andcommunicates that information by way<strong>of</strong> a network back to the local utility formonitoring and billing purposesBalance <strong>of</strong> Payments – a system <strong>of</strong>recording all <strong>of</strong> a country’s economictransactions with the rest <strong>of</strong> the worldover a period <strong>of</strong> one yearBaseload – or baseload demand, isthe minimum amount <strong>of</strong> power thata utility or distribution company mustmake available to its customers,or the amount <strong>of</strong> power required tomeet minimum demands based onreasonable expectations <strong>of</strong> customerrequirementsCharge state – the amount <strong>of</strong> <strong>electric</strong>alenergy stored in a battery as areflection <strong>of</strong> its total storage capacityCharging circuit – the <strong>electric</strong>al circuitwhich connects the charging outlet tothe point <strong>of</strong> <strong>electric</strong>al supplyCharging event – the activity <strong>of</strong>supplying <strong>electric</strong>al energy to an<strong>electric</strong> <strong>vehicle</strong> from an externalsource, for example via a plug/cableCharging outlet – the device that sitsbetween the <strong>vehicle</strong> and the <strong>electric</strong>itynetwork, sometimes known as EVSECharging infrastructure – thededicated equipment used fordelivering <strong>electric</strong>al energy to EVs viacharging eventsCoal-generated <strong>electric</strong>ity – <strong>electric</strong>itygenerated from burning coalCorporate Social Responsibility (CSR)– a form <strong>of</strong> corporate self-regulationthat underpins efforts by business toprotect and promote community valuesCradle-to-grave – a total productlifecycle assessment (LCA)CSIRO – Commonwealth Science andIndus<strong>trial</strong> Research OrganisationDemand charging – or Conveniencecharging, are Charging events thatcommence as soon as a <strong>vehicle</strong> isplugged in (as opposed to a later timebased upon other considerations)Duty cycle – the way in which <strong>vehicle</strong>sare driven, taking into account driverinputs, traffic conditions, <strong>vehicle</strong>payload in <strong>term</strong>s <strong>of</strong> passengersand cargo etc.EIA – Environmental ImpactAssessmentElectric Light Commercial Vehicles orE-LCVs – commercial <strong>vehicle</strong>ssuch as vans and small trucks thatare either partly or completely<strong>electric</strong>ally-poweredElectric Two-Wheelers or E2Ws – twowheeled<strong>vehicle</strong>s such as bicycles andmotorcycles that are either partly orcompletely <strong>electric</strong>ally-poweredEOI – Expression <strong>of</strong> InterestEV – Electric Vehicle, used in thisdocument to mean any <strong>vehicle</strong> witha plug (i.e. a PEV)EVSE – Electric Vehicle SupplyEquipment, which is the emergingindustry-standard name for <strong>electric</strong><strong>vehicle</strong> charging outletsEconomies <strong>of</strong> scale – savings in theper unit costs <strong>of</strong> production that aregained through production <strong>of</strong> largerquantities, for example via amortization<strong>of</strong> the production facility overheadsacross larger volumesEV charging network – the network<strong>of</strong> charging infrastructuregCO2e – grams <strong>of</strong> carbondioxide equivalent, a measure<strong>of</strong> greenhouse gasesGHG – Greenhouse GasGrid – a network <strong>of</strong> cables designedto connect power stations with theircustomers in <strong>of</strong>fices, homes, schools,factories, etc.HEV – Hybrid Electric Vehicle, or a<strong>vehicle</strong> that uses solely a hydrocarbonbasedfuel but supplements this with<strong>electric</strong>al energy recovered throughregenerative brakingICE – Internal Combustion EngineICEV – Internal Combustion EngineVehicleKm – kilometre, a measure <strong>of</strong> distanceLCA – Life Cycle Assessment,an EIA methodLead-acid battery – an <strong>electric</strong>itystorage device based upon a lead (Pb)and sulphuric acid electrochemical cellLithium-ion battery – an <strong>electric</strong>itystorage device based upon the family<strong>of</strong> lithium (Li) electrochemical cellsMWh – Megawatt hours, a measurefor <strong>electric</strong>al energyN2O – Nitrogen dioxide, an air pollutantNOx – Oxides <strong>of</strong> Nitrogen,an air pollutantOEM – Original EquipmentManufacturer, a <strong>term</strong> that describesthe company that is the originalsupplier <strong>of</strong> a <strong>vehicle</strong>On-street charging – Charging eventswhich take place using charginginfrastructure located on public lands(‘on-street’)
OPEC – Organisation <strong>of</strong> the PetroleumExporting CountriesPeak / <strong>of</strong>f-peak – periods <strong>of</strong> greater orlesser demand for something; in thecontext <strong>of</strong> this paper, the <strong>term</strong> relatesto <strong>electric</strong>ity demandPEV – Plug-in Electric Vehicle, one <strong>of</strong>either a PHEV or a BEV, both <strong>of</strong> whichuse plugs to source <strong>electric</strong>al energyPHEV – Plug-in Hybrid ElectricVehicle, a <strong>vehicle</strong> that uses both<strong>electric</strong>al and hydrocarbon-basedenergy sourced externallyPV – Photovoltaic, a technologyfor turning solar radiation into<strong>electric</strong>al energyPM2.5 – Particulate Matter <strong>of</strong>2.5 microns or less in diameter,sometimes known as ‘fine particles’(an air pollutant)Primary use / secondary use batterymarket – <strong>term</strong>s to distinguish the twomarkets for <strong>electric</strong>al storage batteries(new and used)Quick chargers – a high current/voltage charging infrastructure devicethat reduces the amount <strong>of</strong> timeneeded to charge an EVRange – the distance a <strong>vehicle</strong>can travel based upon the amount<strong>of</strong> energy stored and the energyconversion efficiency <strong>of</strong> the<strong>vehicle</strong> technologyRare Earth metals – or Rare Earthelements, are a collection <strong>of</strong> seventeenchemical elements in the periodictable, namely scandium, yttrium, andthe fifteen lanthanides, that are keymaterials for automotive catalyticconverters and a range <strong>of</strong> <strong>electric</strong>alequipmentRegenerative braking – a method <strong>of</strong>braking whereby the kinetic energythat is normally lost as heat duringstopping is instead gathered andstored for re-useRenewable energy – energy generatedfrom renewable sources such as thesun and windRFID – Radio Frequency Identification,which is communications technologycommonly used for ‘swipe cards’ suchas Victoria’s myki public transportticketing systemSmart charging – sometimes known as<strong>of</strong>f-peak charging, are charging eventsthat are scheduled to take place duringperiods <strong>of</strong> low <strong>electric</strong>ity demandSOx – Sulfur oxides, an air pollutantSO2 – Sulfur dioxide, an air pollutantStandard charging – Chargingevents that are based upon thestandard domestic <strong>electric</strong>al supply(240 v in Australia)Supply chain – a system <strong>of</strong>organisations, people, technology,activities, information and resourcesinvolved in moving a product or servicefrom supplier to customerSwap stations – a proprietary charginginfrastructure technology wheredepleted EV batteries are swappedout <strong>of</strong> the <strong>vehicle</strong> for fully-chargedequivalents in automated facilitiesTailpipe emissions – a <strong>term</strong> todescribe the measured quantities <strong>of</strong>air pollutants emitted from a motor<strong>vehicle</strong> exhaustTank-to-wheel – a <strong>vehicle</strong> lifecycleassessment <strong>term</strong> that relates to theupstream impactstCO2e – tonnes <strong>of</strong> carbondioxide equivalent, a measure<strong>of</strong> greenhouse gasesTorque – the measure <strong>of</strong> rotationalforce that is the basis for <strong>vehicle</strong>accelerationTraction battery – the propulsionenergy <strong>electric</strong>al storage device inan EV (as opposed to the 12 v batterythat is used to operate the ancillarysystems such as lighting, security etc.)Upstream/downstream impacts – theoutcomes from different aspects <strong>of</strong> a<strong>vehicle</strong> lifecycle that relate to the fuelenergy cycle (upstream) and the <strong>vehicle</strong>energy conversion cycle (downstream)Vehicle-to-grid/ <strong>vehicle</strong>-to-building/<strong>vehicle</strong>-to-home – scenarios wherean EV is used as an <strong>electric</strong>alstorage deviceVoltage – <strong>electric</strong>al potential,measured in volts (v)VOCs – Volatile Organic Compounds,an air pollutantWh/km – Watt hours per kilometre,a measure <strong>of</strong> EV energy economyWell-to-tank – a <strong>vehicle</strong> lifecycleassessment <strong>term</strong> that relates to thedownstream impactsWell-to-wheel – the total <strong>vehicle</strong>lifecycle assessment, also knownas Cradle-to-graveWireless induction charging – a type<strong>of</strong> charging infrastructure technologythat utilises electromagnetic inductionto transfer energy as opposed toconduction through a plug/cablearrangementCREATING A MARKET 135
REFERENCES
Actew AGL 2009, History <strong>of</strong> mobile phones in Australia, 11 June 2009, viewed 29 January 2013,http://kids.actewagl.com.au/education/communications/MobilePhones/DevelopmentOfMobiles/MobileHistory.aspxAECOM 2011, Forecast Uptake and Economic Evaluation <strong>of</strong> Electric Vehicles in Victoria, <strong>report</strong> for Victorian <strong>Department</strong> <strong>of</strong><strong>Transport</strong>, 6 May 2011, http://www.transport.vic.gov.au/__data/assets/pdf_file/0010/33499/Economic-Viability-<strong>of</strong>-Electric-Vehicles-in-Victoria-rev-C-final-issued.pdfAustralian Broadcasting Company (ABC) 2011, 30 years <strong>of</strong> the mobile phone in Australia, 11 August 2011, viewed 15 January2013, http://www.abc.net.au/news/2011-08-11/30-years-<strong>of</strong>-the-mobile-phone-in-australia/2835564Australian Broadcasting Company (ABC) 2012, First solar car charge station opens, 22 March 2012, viewed 19 February 2013,http://www.abc.net.au/worldtoday/content/2012/s3461227.htmAustralian Bureau <strong>of</strong> Statistics (ABS) 2009, Children’s participation in cultural and leisure activities, release no. 4901.0,April 2009Australian Bureau <strong>of</strong> Statistics (ABS) 2011, Household expenditure survey, release no. 6530.0, September 2011Australian Bureau <strong>of</strong> Statistics (ABS) 2012, 2011 Australian Census, 30 October 2012Australian Communications and Media Authority (ACMA) 2008, Number <strong>of</strong> mobile phones now exceeds Australia’s population,28 April 2008, viewed 15 January 2013, http://www.acma.gov.au/WEB/STANDARD..PC/pc=PC_311135Australian Government (Aust Govt) 2011, Architecture <strong>of</strong> Australia’s tax and transfer system: Taxation <strong>of</strong> fuel, viewed 8 February2013, http://www.taxreview.treasury.gov.au/content/Paper.aspx?doc=html/publications/papers/<strong>report</strong>/Section_9-03.htmAustralian Government (Aust Govt) 2012a, About Australia – Local Government (Councils), viewed 16 December 2012,http://australia.gov.au/about-australia/our-government/local-government-councilsAustralian Government (Aust Govt) 2012b, Australian Design Rules, viewed 19 February 2013,https://www.infrastructure.gov.au/roads/motor/design/index.aspxAutoblog Green (Autoblog) 2010, Australian state <strong>of</strong> Victoria launches massive 5-year <strong>electric</strong> <strong>vehicle</strong> <strong>trial</strong>, 9 October 2010,viewed 25 February 2012, http://green.autoblog.com/Autoblog Green (Autoblog) 2012a, Dutch fleet owners buying PHEVs for rebates, then using only gas, 9 November 2012, viewed28 December 2012, http://green.autoblog.comAutoblog Green (Autoblog) 2012b, Who’s ready now? Nissan deploys first <strong>of</strong> 400 planned DC fast chargers in Europe, 25 May 2012,viewed 16 January 2013, http://green.autoblog.com/2012/05/25/nissan-deploys-first-400-planned-dc-fast-chargers/AutoCRC 2010, Automotive Australia 2020, Cooperative Research Centre for Advanced Automotive Technology (AutoCRC),August 2010CALSTART 2012, EV employer initiative: Webinar #2 minutes, 30 October 2012, http://www.evworkplace.orgCenter for Automotive Research (CAR) 2007, How Automakers Plan Their Products: A Primer for Policymakers on AutomotiveIndustry Business Planning, July 2007, viewed 10 February 2013, http://www.cargroup.org/?module=Publications&event=Download&pubID=32&fileID=38Center for Automotive Research (CAR) 2011, Green and Connected, white paper prepared for the Michigan <strong>Department</strong><strong>of</strong> <strong>Transport</strong>ation, 28 September 2011, viewed 10 February 2013, http://www.cargroup.org/assets/files/green.pdfCentre for Education and Research into Environmental Strategies (CERES) 2012, Awards, viewed 19 February 2013,http://www.ceres.org.au/about/awards.htmlCNET 2012, Washington State senate passes bill to charge EV owners $100 annual fee, 13 February 2012, viewed 8 February 2013,http://reviews.cnet.com/8301-13746_7-57376322-48/wash-state-senate-passes-bill-to-charge-ev-owners-$100-annualfee/#!Colliers International (Colliers) 2012, Australian CBD Car Parking – The Next Decade, White Paper, Colliers International, 2012Crown 2012, Fleet information – BCI Promo Electric, Crown, viewed 20 December 2012, http://www.crowncoaches.com.au/fleet-information/bci-proma-<strong>electric</strong>Davison, P., Davison, P., Reed, N., Halden., D., Dillon, J. 2003, Children’s Attitudes to Sustainable <strong>Transport</strong>: an investigation intohow children and young people view sustainability in relation to their personal transport, including to school and leisure facilities,Scottish Executive Social Research, viewed 28 November 2012, http://www.scotland.gov.uk/Publications/2003/12/18668/30698CREATING A MARKET 137
<strong>Department</strong> <strong>of</strong> Climate Change (DCC) 2007, Information Sheet: Victorian Greenhouse Gas Inventory – 2007, AustralianGovernment, Canberra<strong>Department</strong> <strong>of</strong> Climate Change & Energy Efficiency (DCCEE) 2012, National Greenhouse Gas Inventory, <strong>Department</strong> <strong>of</strong> ClimateChange & Energy Efficiency, Canberra, viewed 21 September 2012, http://ageis.climatechange.gov.au/#<strong>Department</strong> <strong>of</strong> Primary Industries (DPI) 2012, Smart Meters, Victorian Government, viewed 18 December 2012,http://www.dpi.vic.gov.au/smart-meters<strong>Department</strong> <strong>of</strong> <strong>Transport</strong> (DOT) 2009, Victorian Integrated Survey <strong>of</strong> Travel and Activity (VISTA) 2007, Victorian Government,viewed 29 January 2013, http://www.transport.vic.gov.au/research/statistics/<strong>victorian</strong>-integrated-survey-<strong>of</strong>-travel-andactivity?a=31280<strong>Department</strong> <strong>of</strong> <strong>Transport</strong> (DOT) 2010a, Expression <strong>of</strong> Interest – Victorian Electric Vehicle Trial, Victorian Government,March 2010<strong>Department</strong> <strong>of</strong> <strong>Transport</strong> (DOT) 2010b, Design Discussion Paper – Victorian Electric Vehicle Trial, Victorian Government,July 2010<strong>Department</strong> <strong>of</strong> <strong>Transport</strong> (DOT) 2010c, Local <strong>electric</strong> <strong>vehicle</strong> technology, Victorian Government, December 2010<strong>Department</strong> <strong>of</strong> <strong>Transport</strong> (DOT) 2010d, Survey <strong>of</strong> household participants, Victorian Government, December 2010<strong>Department</strong> <strong>of</strong> <strong>Transport</strong> (DOT) 2011, Interoperability arrangements discussion paper – Victorian Electric Vehicle Trial, VictorianGovernment, December 2010<strong>Department</strong> <strong>of</strong> <strong>Transport</strong> (DOT) 2012a, Victorian Integrated Survey <strong>of</strong> Travel and Activity (VISTA), Victorian Government, viewed28 October 2012, http://www.transport.vic.gov.au/research/statistics/<strong>victorian</strong>-integrated-survey-<strong>of</strong>-travel-and-activity<strong>Department</strong> <strong>of</strong> <strong>Transport</strong> (DOT) 2012b, Planning for our bus industry’s future, Victorian Government, viewed 20 December 2012,http://www.transport.vic.gov.au/research/sustainability/sustainable-transport-projects-and-programs/planning-for-our-busindustrys-future<strong>Department</strong> <strong>of</strong> <strong>Transport</strong> (DOT) 2012c, The Victorian Electric Vehicle Trial – Results <strong>of</strong> 2012 Applications, Victorian Government,January 2012<strong>Department</strong> <strong>of</strong> <strong>Transport</strong> (DOT) 2012d, The Victorian Electric Vehicle Trial – GreenPower Accounting Mid-<strong>term</strong> Report, VictorianGovernment, November 2012<strong>Department</strong> <strong>of</strong> <strong>Transport</strong> (DOT) 2012e, Guidance on Land-use Planning for Electric Vehicle Parking and Charging, VictorianGovernment, September 2012<strong>Department</strong> <strong>of</strong> <strong>Transport</strong> (DOT) 2012f, The Victorian Electric Vehicle Trial – Environmental Impacts <strong>of</strong> Electric Vehicles in Victoria,Victorian Government, November 2012<strong>Department</strong> <strong>of</strong> <strong>Transport</strong> (DOT) 2012g, Zero emissions driving for <strong>electric</strong> <strong>vehicle</strong>s, Victorian Government, November 2012<strong>Department</strong> <strong>of</strong> <strong>Transport</strong> (DOT) 2012h, Electric <strong>vehicle</strong> racing – EV School case study, Victorian Government, 26 October 2012,viewed 21 January 2013, http://www.transport.vic.gov.au/projects/ev-<strong>trial</strong>/ev-school/rmit-videode T’Serclaes, P. and Jollands, N. 2007, Mind the gap: Quantifying Principal-agent Problems in Energy Efficiency, InternationalEnergy Agency, OECD publishing, 1 October 2007Drive 2011, Why hybrid cars could cost you thousands, viewed 27 December 2012,http://news.drive.com.au/drive/selling-tips/why-hybrid-cars-could-cost-you-thousands-20110212-1aqze.htmlECOtality 2012, The EV Project – Q3 2012 Report, ECOtality North America, 25 October 2012Eddington, R. 2008, Investing in <strong>Transport</strong>, Victorian Government, March 2008Edmunds 2012, What’s coming – Alternative <strong>vehicle</strong>s 2013-15, 9 November 2012, viewed 16 January 2013,http://www.edmunds.com/fuel-economy/whats-coming-alternative-<strong>vehicle</strong>s-2013-15.htmlElectronics News 2012, Aussie company to launch first smart grid integrated EV charger, 19 November 2012, viewed 18 February 2013,http://www.electronicsnews.com.au/news/aussie-company-to-launch-first-smart-grid-integratEnergy Information Administration (EIA) 2012, Annual Energy Outlook 2013 Early Release Overview, United States EIA,5 December 2012
Ergon 2012, Pool pump connections, Ergon Energy, viewed 18 December 2012, http://www.ergon.com.au/your-home/accounts--and--billing/tariffs-and-prices-2012-13/pool-pump-connectionsErnst & Young 2008, Local Government Procurement Strategy, Victorian Government, September 2008Ford 2012, Ford C-MAX Energi Plug-in Hybrid Qualifies for California Carpool Lane Access and Incentives Up to $5,250,23 October 2012, viewed 18 January 2012, http://media.ford.com/article_display.cfm?article_id=37270Freight Best Practice 2009, The Benefits <strong>of</strong> Operating Electric Vehicles in an Urban Environment, The Scottish Government,June 2009GoAuto 2011, Up to $7500 cut from the price <strong>of</strong> Toyota’s pioneering Prius petrol-<strong>electric</strong> car, GoAuto, viewed 20 December 2012,http://www.goauto.com.au/mellor/mellor.nsf/story2/5927CA2776C7E4E2CA25786B0005A68F, 7 April 2011GoAuto 2012a, New and upgraded <strong>electric</strong> cars from Nissan, GM to address slow global EV sales, GoAuto, viewed 20 December2012, http://www.goauto.com.au/mellor/mellor.nsf/story2/AD3CDABD6A9B3087CA257ABF0005406A, 23 November 2012GoAuto 2012b, Nissan LEAF flutters down to $47k driveaway, GoAuto, viewed 20 December 2012,http://www.goauto.com.au/mellor/mellor.nsf/story2/F6563306BC8BA82CCA257AD100179ADC, 11 December 2012GoGet 2011, Case-study – GoGet CarShare, presentation to the Smart Utilities 2011 conference, Melbourne, June 2011Gopal, K. and Thawrani, P. 2012, Is the lack <strong>of</strong> public charging infrastructure a barrier for EV adoption?, paper presented at theEVS26 International Battery, Hybrid and Fuel Cell Electric Vehicle Symposium, Los Angeles, 6 – 9 May 2012Green Building Council <strong>of</strong> Australia (GBCA) 2012, Green Star – Interiors, Green Building Council <strong>of</strong> Australia, viewed20 December 2012, http://www.gbca.org.au/green-star/green-star-interiors/Green Car Congress 2009, GM Working with Communities to Develop Roadmap for Plugin Infrastructure, Green Car Congress,viewed 25 February 2012, http://www.greencarcongress.com/2009/02/gm-working-with.htmlGreen Car Congress 2012, Pike Research forecasts annual sales <strong>of</strong> <strong>electric</strong> bicycles to surpass 47M units by 2018; Li-ionbattery share to climb to 12%, Green Car Congress, viewed 30 January 2013, http://www.greencarcongress.com/2012/03/ebike-20120327.htmlGreen Car Congress 2013, ChargePoint and DBT USA partner on networked EV charging in North America, Green Car Congress,viewed 11 February 2013, http://www.greencarcongress.com/2013/01/cpdbt-20130108.htmlInternational Council for Local Climate Initiatives (ICLEI) 2009, Local Government Vehicle Fleets – Status and Emissions,Australian Government, CanberraInvest Victoria (Invest Vic) 2011, Automotive industry, Melbourne, Victoria, Australia, Victorian Government, viewed 24 February 2012,http://www.invest.vic.gov.au/Assets/1425/3/Automotive-Industry-Brochure-201106-WEB.pdfJaffe, A.B., Newell, R.G. and Stavins, R.N. 2005, A tale <strong>of</strong> two market failures: Technology and environmental policy, EcologicalEconomics, vol.54, pp 164-174Johnson, M. 2012, Electric bike investigation – Powered Two-wheeler ARC linkage grant project, Monash University Intelligent<strong>Transport</strong> System Roadshow presentation, 24 November 2012Klintsov, V., Klussman, S., Nikomarov, M., Remes, J. and Schubert, J. 2010, Looking Under the Hood 2: How the AutomotiveIndustry Grows, Automotive & Assembly Extranet, McKinsey & Company Inc, 2010Kopina, H. 2011, Kids and cars: Environmental attitudes in Children, <strong>Transport</strong> Policy, vol. 18, pp 573-578Lieberman, M. and Montgomery, D. 1988, First mover advantages, Strategic Management Journal, vol.9, summer 1998Local Government Procurement 2012, Current contracts, Local Government Procurement, viewed 16 December 2012,http://www.lgp.org.au/councils/current-contractsLos Angeles Times (LA Times) 2011, Yellow hybrid stickers for carpool lanes set to expire, 16 May 2011, viewed 16 January 2012,http://media.ford.com/article_display.cfm?article_id=37270Luskin Center for Innovation (Luskin) 2012, Southern California Plug-in Electric Vehicle Readiness Plan, University <strong>of</strong> CaliforniaLos Angeles (UCLA), December 2012Lyons, E. and Breakwell. G.M. 1994, Factors predicting environmental concern and indifference in 13 to 16 year-olds,Environment and Behaviour, vol 26.2, pg’s 223-238CREATING A MARKET 139
Ministerial Advisory Committee (MAC) 2012, Melbourne – let’s talk about the future, Victorian Government, October 2012Mitsubishi 2012, Mitsubishi Motors to launch MiEV power BOX 1500 watt power feeder for its Electric Vehicles, Mitsubishi, viewed18 December 2012, http://www.mitsubishi-motors.com/publish/pressrelease_en/corporate/2012/news/detail0834.html, 18March 2012Mitsubishi Motors Australia (MMAL) 2011, Submission to the Light Vehicle CO2 Emission Standard Key Issues Paper,Mitsubishi, viewed 24 February 2012, http://www.infrastructure.gov.au/roads/environment/co2_emissions/files/MitsubishiMotorsAustralia.pdfMoore, GA 1991, Crossing the Chasm: Marketing and Selling High-Tech Products to Mainstream Customers, Harper Business,New YorkNational Highway Traffic Safety Administration (NHTSA) 2011, Notice <strong>of</strong> proposed rulemaking – Minimum sound requirementsfor hybrid and <strong>electric</strong> <strong>vehicle</strong>s, Docket no. NHTSA-2011-0148News 2012, Cool and green hybrid car sales surge to Australian record, News Limited, viewed 20 December 2012,http://www.news.com.au/business/cool-and-green-hybrid-car-sales-surge-to-australian-record/storye6frfm1i-1226441599395Nissan 2011, Zero emission Nissan LEAF priced to deliver zero emission leadership, Nissan Australia, MelbourneNissan 2012a, Nissan and Nichicon to launch ‘LEAF to Home’ power supply system with ‘EV Power Station’, Nissan,viewed 18 December 2012, http://www.nissan-global.com/EN/NEWS/2012/_STORY/120530-01-e.html , 30 May 2012Nissan 2012b, Nissan LEAF and DC Quick Charging, presentation to the International Energy Agency Implementing Agreementon Hybrid and Electric Vehicles Task 20 Quick Charging Technology kick-<strong>of</strong>f meeting, 6 May 2012Nous 2010, Electric Vehicle Interoperability – Lessons from the Telematics Arena, Victorian Government, MelbourneP3 North America (P3) 2012, Secondary use <strong>of</strong> electrified <strong>vehicle</strong> batteries, webinar presentation for AutomotiveWorld.com,30 May 2012Pike Research 2012, Wireless <strong>electric</strong> <strong>vehicle</strong> charging system sales set to surpass 280,000 by 2020, 20 December 2012, viewed30 January 2013, http://www.pikeresearch.com/newsroom/wireless-<strong>electric</strong>-<strong>vehicle</strong>-charging-system-sales-to-surpass-280,000-by-2020Procurement Australia 2012, Current contracts, Procurement Australia, viewed 16 December 2012, http://www.procurementaustralia.com.au/content/contractsPuget Sound Regional Council (PSRC) 2010, Web-based Electric Vehicle Consumer Survey, Appendix D-4 in Electric VehicleInfrastructure: A Guide for Local Governments in Washington State, Puget Sound Regional Council, viewed 23 December 2012,http://www.psrc.org/assets/4326/EVI_full_appendices.pdf , July 2010Reuters 2012, U.S. oil production to surge on shale output: EIA, 23 January 2012, viewed 31 January 2013, http://www.reuters.com/article/2012/01/23/us-usa-eia-outlook-idUSTRE80M1LE20120123Rocky Mountain Institute (RMI) 2009, Plugging in: A stakeholder investment guide for public <strong>electric</strong> <strong>vehicle</strong> charginginfrastructure, July 2009Rogers, E 1962, Diffusion <strong>of</strong> Innovations, Free Press, New YorkRorke, J. and Inbakaran, C. 2009, Potential Early Adopters <strong>of</strong> Electric Vehicles in Victoria, Victorian Government, viewed13 November 2012, http://go.vic.gov.au/vK6LmHSchreiber, R. 2012, Workplace charging at Google, presentation to EV Employer Initiative, 31 July 2012SGS Economics and Planning (SGS) 2012, Benefit-cost Analysis <strong>of</strong> Car Share within the City <strong>of</strong> Sydney, <strong>report</strong> for the council <strong>of</strong>City <strong>of</strong> Sydney, June 2012, viewed 18 February 2013, http://www.city<strong>of</strong>sydney.nsw.gov.au/__data/assets/pdf_file/0012/122502/CarShareEconomicAppraisalFINALREPORT.pdfShaheen, S.A, Cohen, A.P. and Martin, E., Carsharing practice and policy: A review <strong>of</strong> North American practices and SanFrancisco Bay Area case study, <strong>Transport</strong>ation Research Record, 15 March 2010, viewed 18 February 2013,http://www.carsharing.net/library/TRB10-2921final.pdfSilverpop 2012, 2012 Silverpop Email Marketing Metrics Benchmark Study, Silverpop, viewed 25 February 2013,http://www.silverpop.com/downloads/white-papers/WP_2012_Benchmark.pdf
Smart Grid News 2012, Aussie firm unveiling EV charger that can talk to smart meters, 20 November 2012, viewed 18 February2013, http://www.smartgridnews.com/artman/publish/End_Use_Electric_<strong>Transport</strong>ation/Aussie-firm-unveiling-EV-chargerthat-can-talk-to-smart-meters-5297.html#.USIQZR2NrU8Society <strong>of</strong> Automotive Engineers Australia (SAE-Aust) 2012, About Formula SAE-A, viewed 21 January 2013,http://www.saea.com.au/formula-sae-a/media/Sperling, D. and Gordan, D. 2009, Two Billion Cars: Driving Towards Sustainability, Oxford University Press, USA, 2009Standards Australia 2010, Electric <strong>vehicle</strong> standards in Australia – Standards workplan, Standards Australia, SydneySustainability Victoria (SV) 2012, Energy use in Victoria, Victorian Government, viewed 24 February 2012,http://www.sustainability.vic.gov.au/www/html/1819-energy-use-in-victoria.aspSwinburne University <strong>of</strong> Technology (Swinburne) 2012a, Electric Vehicle research at Swinburne, viewed 21 January 2013,http://www.swinburne.edu.au/engineering/<strong>electric</strong>-<strong>vehicle</strong>/Swinburne University <strong>of</strong> Technology (Swinburne) 2012b, Going <strong>electric</strong> – Team Swinburne Formula SAE, viewed21 January 2013, http://teamswinburne.com/going-<strong>electric</strong>.htmSydney Morning Herald (SMH) 2007, Mobile phone technology in Australia turns 20, 23 February 2007, viewed 15 January 2013,http://www.smh.com.au/news/mobiles--handhelds/history-calls/2007/02/23/1171734007650.html?page=2Telstra 2012, Mobile memories – in celebration <strong>of</strong> 25 years <strong>of</strong> hand-held phones, 23 February 2012, viewed 15 January 2013,http://exchange.telstra.com.au/2012/02/23/mobile-memories-in-celebration-<strong>of</strong>-25-years-<strong>of</strong>-hand-held-phones/Time 2010, Motorola DynaTAC 8000x, Time magazine, 25 October 2010, viewed 15 January 2013, http://www.time.com/time/specials/packages/article/0,28804,2023689_2023708_2023656,00.htmlUnited States <strong>Department</strong> <strong>of</strong> Energy (US DOE) 2012a, Plug-in Electric Vehicle Handbook for Public Charging Station Hosts, DOE/GO-102012-3275, April 2012, http://www.afdc.energy.gov/pdfs/51227.pdfUnited States <strong>Department</strong> <strong>of</strong> Energy (US DOE) 2012b, Electric-drive Technology Futures – <strong>Transport</strong>ation Transition in the U.S.,presentation to the International Energy Agency Implementing Agreement on Hybrid and Electric Vehicles, 6 May 2012United States <strong>Department</strong> <strong>of</strong> Energy (US DOE) 2013, EV Everywhere Grand Challenge Blueprint, 31 January 2013, viewed6 February 2013, http://www1.eere.energy.gov/<strong>vehicle</strong>sandfuels/<strong>electric</strong>_<strong>vehicle</strong>s/pdfs/eveverywhere_blueprint.pdfUniversity <strong>of</strong> Melbourne (Uni <strong>of</strong> Melb) 2010, Impact <strong>of</strong> the mass-adoption <strong>of</strong> <strong>electric</strong> cars on the Australian <strong>electric</strong>ity grid,30 December 2010, viewed 21 January 2012, http://energy.unimelb.edu.au/index.php?page=alias-8VicRoads 2012a, Power-assisted bicycles, Victorian Government, viewed 7 December 2012, http://www.vicroads.vic.gov.au/Home/SafetyAndRules/SaferRiders/BikeRiders/PowerAssistedBicycles.htmVicRoads 2012b, <strong>vehicle</strong> registration database extract, Victorian Government, 6 December 2012Victorian Automotive Chamber <strong>of</strong> Commerce Skills Development Centre (VACCSDC) 2012, HEV and BEV safety, inspectionand servicing, VACCSDC, viewed 28 November 2012, http://www.vaccsdc.com.au/Technical/TechnicalShortCourses/HEVBEVSafetyInspectionandServicing/tabid/235/language/en-AU/Default.aspxVictorian Competition and Efficiency Commission (VCEC) 2012, Power from the People – final <strong>report</strong> from the Inquiry into FeedinTariff Arrangements and Barriers to Distributed Generation, Victorian Government, Melbourne, July 2012Wikipedia (Wiki) 2012, Local Government in Australia, viewed 16 December 2012, http://en.wikipedia.org/wiki/Local_government_in_AustraliaCREATING A MARKET 141
APPENDIX AVICTORIAN ELECTRIC VEHICLETRIAL CORPORATE PARTICIPANTSParticipation in the <strong>trial</strong> is underpinned by a formal contract for each participant. Various other organisations not listed belowhave engaged to varying degrees over the life <strong>of</strong> the project however these interactions have not involved a formal agreement.An explanation <strong>of</strong> what each participant role constitutes can be found at the foot <strong>of</strong> the table.EntityChargingInfrastructureHostChargingInfrastructureProviderFleetOperatorPremierPartnerServiceProviderTrialParticipantVehicleSupplierAECOMxAGL Energy x x xAustin HealthBayside City CouncilxxBetter Place Australia x xCardinia Shire CouncilCentre for Education andResearch in EnvironmentalStrategies (CERES)Cloud Utilityx x xxxChargePoint Australia x xCitiPower x xCSIRO x x xCity <strong>of</strong> CaseyCity <strong>of</strong> FranksonxxCity <strong>of</strong> Greater Dandenong x xCity <strong>of</strong> KingstonCity <strong>of</strong> MaribyrnongxxCity <strong>of</strong> Melbourne x xCity <strong>of</strong> MeltonCity <strong>of</strong> Port PhillipCity <strong>of</strong> MonashxxxClub Assist x x xColonial First State GlobalAsset ManagementxDiUS Computing x xDolomiti Italian LifestylexECOtalityxE-Day LifexEnhancex
EntityChargingInfrastructureHostChargingInfrastructureProviderFleetOperatorPremierPartnerServiceProviderTrialParticipantVehicleSupplierEPA VictoriaxExigencyxEV EngineeringxFederation SquarexFreeFuelxGeneral Electric (GE) x x xGM HoldenxGo Get Car ShareGreen Energy TradingxxJuicePointxKangan Institute <strong>of</strong> TAFELinking Melbourne AuthorityLINK Community <strong>Transport</strong>xxxLumley Insurance x xManningham City CouncilxMelbourne Airport x xMelbourne Museum x xMitsubishi CorpxMitsubishi Motors AustraliaxMomentum EnergyxMonash University x xMoreland City CouncilMornington Peninsula ShireCouncilMount Alexander Shire CouncilxxxMT DataxMunicipal Association <strong>of</strong>Victoria (MAV)xNissan Motor Company (Aust) x xNHP Electrical EngineeringProductsxOrigin x xPowercor Australia x xCREATING A MARKET 143
EntityChargingInfrastructureHostChargingInfrastructureProviderFleetOperatorPremierPartnerServiceProviderTrialParticipantVehicleSupplierRMIT UniversityxRobert Bosch (Australia) x xSG FleetxS<strong>of</strong>itel on CollinsxSouth East Councils ClimateChange Alliance (SECCCA)xSP AusNet x xSwinburne University x xSustainability VictoriaSynergetics (The Green Spaces)xxThe Climate GroupxRoyal Automobile Club <strong>of</strong>Victoria (RACV)The Victorian Arts Centre Trustx x xxToyota Motor Corp AustxTRUenergyUnited Energy DistributionxxUniversity <strong>of</strong> Melbourne x xVACC x xVicRoadsxVicUrbanxVisionStream x xWellington Shire CouncilYarra City CouncilYarra TramsxxxDEFINITIONSThe role <strong>of</strong> each participant as setout in the column headings above isdefined below:• Charging Infrastructure Host –owner/manager <strong>of</strong> property whichhosts publicly-accessible chargingoutlets (refer to Section 5.1.1)• Charging InfrastructureProvider – provider <strong>of</strong> charginginfrastructure services forhousehold, fleet and/or public use(refer to Section 5.1.1)• Fleet Operator – commercial fleetoperator for <strong>vehicle</strong>s participatingin the <strong>trial</strong> (refer to Section 4.1.1)• Premier Partner – foundationpartner for the <strong>trial</strong>, includingin-kind contribution <strong>of</strong>goods/services• Trial Participant – formalparticipant in the <strong>trial</strong> includingdata/information exchange and/orpromotional activities• Vehicle Supplier – provider <strong>of</strong><strong>vehicle</strong>s for use as part <strong>of</strong> the <strong>trial</strong>.
APPENDIX BEVS AND FLEETS 2012 PRACTICAL ROLL-OUT PLANThe guidance material below draws upon the experiences <strong>of</strong> fleets who have participated in the Victorian Electric VehicleTrial. The material was presented to attendees at the EVs and Fleets 2012 workshops.No. Task Inputs OutputsStarttimingKey Questions1 Design <strong>vehicle</strong>deployment planStrategic /corporateobjectivesFleet / operationaldataEV typeEV deploymentlocation / taskEV champion- 14 wks What do we want to know?Who is our audience?Where should the EV be based?Who is best suited to managing the EV?Which technology matches our fleet task?2 Procure <strong>vehicle</strong> EV typeBudget / timing3 Design charging plan EV specEV deploymentlocation / taskBudget / timingEV specEV delivery dateCharging planCharging spec /provider-12 wks Which technology and functional spec?Buy or lease?What are our charging needs/options?When will the <strong>vehicle</strong> be delivered?-10 wks Where could/should we charge tomaximise <strong>vehicle</strong> utilisation and exposure?What charging solution/s are available inthese location/s?What info do we require from chargingactivities?Do we need a charging service provider?Do we need a renewable energy strategy?4 Implement basecharging solutionCharging spec /providerCharging planBase chargingsolution-10 wks Where is our base charging solutionlocated and how does it work?How do we ensure the availability <strong>of</strong> ourbase charging solution?Do we want/need signage/groundmarking?How do we get energy use info?5 Design marketing plan Strategic /corporateobjectivesCorporatecommunicationsplanCharging planEV marketingstrategyEV livery design-6 wks What are we trying to tell our audiencewith the EV?What comm’s pathways work best for thisstory?How can we maximise the <strong>vehicle</strong> visibilityto our audience?6 Design <strong>vehicle</strong>management planEV deploymentlocation / taskCharging planEV marketingstrategyEV managementplanStaff training& engagementplan-6 wks What’s our operational plan for the<strong>vehicle</strong>?How do we find out what we want to know?How do we minimise risk/maximiseutilisation?CREATING A MARKET 145
No. Task Inputs OutputsStarttimingKey Questions7 Receive <strong>vehicle</strong> &validate plansEV delivery dateEV livery designCharging planBranded EVValidatedmanagement/charging plans0 Who can make/apply our <strong>vehicle</strong> livery andwhen?Does our EV operate as expected?Does our EV champion understandall aspects <strong>of</strong> the <strong>vehicle</strong> operation/management plan?Does our EV work with all aspects <strong>of</strong> ourcharging plan?8 Commission <strong>vehicle</strong>into fleetBranded EVValidatedmanagement/charging plansStaff training &engagement planEV marketing planEV deployment +2 wks Are our staff aware <strong>of</strong> the <strong>vehicle</strong>?Who <strong>of</strong> our Exec team could drive the<strong>vehicle</strong>?Do the drivers understand how to operatethe <strong>vehicle</strong> in line with the management/charging plans?Have drivers accepted the <strong>vehicle</strong>?When do we implement ourcommunications activities?9 Evaluate performance& realise valueEV deploymentEV managementplanEV marketing planOptimal <strong>vehicle</strong>utilisationFulfilment<strong>of</strong> strategic/ corporateobjectives+3 wksonwardsAre we meeting our <strong>vehicle</strong> utilisationtargets and if not, why and what changescan be made?What are our target audience awarenesslevels <strong>of</strong> the <strong>vehicle</strong>?Have we obtained investment-gradeinformation to inform future businessplanning?Notes:• Advice applies to early-market / initial <strong>vehicle</strong> adoption in 2012-3• Assumes the business case to proceed has already been approved• Start timing doesn’t take internal approval processes or product supply leadtimes into account• Variations in supplier business models may influence the solution design and timing.
APPENDIX CCHARGING OUTLET ATTRIBUTE LISTThe charging outlet attribute list below should be considered by people or organisations seeking to buy dedicated <strong>electric</strong><strong>vehicle</strong> charging equipment. It is a comprehensive list <strong>of</strong> features that are available in the market and potentially relevant tothe buyer. Buyers should consider the list <strong>of</strong> attributes an input into their final equipment specification, due to the inevitablecost trade-<strong>of</strong>f in seeking such a comprehensive list <strong>of</strong> features.The list is an outcome from benchmarking <strong>of</strong> international procurement activities and consultation with eight charginginfrastructure providers taking part in the Victorian Electric Vehicle Trial.The benchmarking activity focused primarily on the 2011 Southern California Association <strong>of</strong> Local Government jointprocurement activity RFB-IS-12200325 for 300 to 400 ‘Level 2’ chargers to be installed over 2012-13 19 . The outcomes fromthis joint procurement activity are available online in the form <strong>of</strong> an evaluation matrix 20 .Area Attribute DefinitionGeneral Mounting style Wall / pedestal (free-standing)Weather-pro<strong>of</strong>ingNo. charging outletsDimensionsIndoor / outdoorSingle / multi (no.)Unit; mounting (anchor bolts, concrete pad etc)Compliance AS/NZS 3000KEMAC-TickNEMACharging standard SAE J1772 / IEC 62196AC / DCVarious levels and modesRated power deliveryAmperageStand-by power consumptionRe-start / cold load pick-upCable typeCable lengthElectrical protectionGeneral power outletUser interfaceBilling / cost recoveryPayment system integrationKilowatts (kW)Amps (A)Watts (W)In<strong>term</strong>ediate / randomized / noneFloating (detached) / fixedStraight / formed-coil / retractableMetres (m)Residual Current Device (RCD) / Residual CircuitBreaker with Overload (RCBO)Standard 240 v outlet included / not includedIncluded / not includedSolution descriptionIncluded / not includedIncluded / not includedPayment systems supported19 http://www.google.com.au/url?sa=t&rct=j&q=rfb-is-12200325&source=web&cd=5&cad=rja&ved=0CEQQFjAE&url=https%3A%2F%2Fs3.amazonaws.com%2FResearchDocuments%2FProd%2F11-2-2011%2FRFB_IS_12200325_SPECIFICATIONS.docx&ei=xjAYUc32A7GyiQeE94G4Ag&usg=AFQjCNFyz3VsfAoZKIM-uDiWXDzj3T-CSw&bvm=bv.42080656,d.dGY, viewed 11 February 201320 http://www.aqmd.gov/tao/Demonstration/ElectricHybrid/SoCalEV_RFP_Evaluation.pdfCREATING A MARKET 147
Area Attribute DefinitionGeneralParking access and revenue control system(PARCS) integrationWeb-based / mobile phone system integrationEnergy demand response system integrationIncluded / not includedPARCs supportedIncluded / not includedSystems supportedSolution descriptionIncluded / not includedDescriptionData capture Percentage <strong>of</strong> time the <strong>vehicle</strong> is drawing power Captured / not capturedEach unique charging eventDate / time <strong>of</strong> use (start / end)Length <strong>of</strong> time <strong>vehicle</strong> was connected per charging eventTotal <strong>electric</strong>ity consumed (kWh) and peak power drawn(kW) per charging eventEach unique <strong>vehicle</strong> charged from outletState-<strong>of</strong>-charge <strong>of</strong> each <strong>vehicle</strong> as it was connected /disconnected to outletAbility to indicate time and energy consumption for costrecoveryData collected and storedLength <strong>of</strong> time data is storedHow long / how many transactions are stored if there’s acommunications failureWhat happens when communications failure occursMethod <strong>of</strong> accessing data locallyWhere does / will data collected resideFleet <strong>vehicle</strong> data provisionReporting descriptionNetwork capabilities for data transmissionOn-Board & remote diagnosticsAlertsCaptured / not capturedCaptured / not capturedCaptured / not capturedCaptured / not capturedCaptured / not capturedCaptured / not capturedCaptured / not capturedIncluding / in addition to attributes aboveDurationIncluded / not includedDescriptionDescriptionDescriptionProvider network / host networkDescriptionDescriptionFibre / cellular / wireless / EthernetIncluded / not includedDescriptionIncluded / not includedDescription
Area Attribute DefinitionBilling / costrecoveryCapable <strong>of</strong> accepting / processing user payments andmanaging settlements with hostPoint-<strong>of</strong>-sale payment capabilityPayment Card Industry Data Security Standard (PCI DSS)compliantAuthentication system for user IDBilling options (time, energy etc)Service feesIncluded / not includedDescriptionIncluded / not includedDescriptionIncluded / not includedIncluded / not includedDescriptionDescriptionApplicable / not applicableCosts Terms and conditionsSupport Service / inspection / maintenance schedule DescriptionWarranty for partsWarranty for labourUpgrade capability / method / costsTerms and conditionsTerms and conditionsDescriptionAdditional considerations relating to service performance should also be made as part <strong>of</strong> a procurement agreement for<strong>electric</strong> <strong>vehicle</strong> charging services. Evidence relating to the reliability <strong>of</strong> service provision, time taken for fault diagnosis andremedy and other metrics relating to service delivery should be considered as part <strong>of</strong> the initial procurement activity andsubsequent service agreement.CREATING A MARKET 149
APPENDIX DHOUSEHOLD CHARGING INFRASTRUCTURE QUESTIONS PROFORMAThe following questionnaire was supplied to the <strong>trial</strong> household participants following completion <strong>of</strong> their formal agreementto participate. The participant’s response informed planning on the choice <strong>of</strong> charging infrastructure provider and the design<strong>of</strong> their charging solution, thereby streamlining the charging infrastructure installation process.A charging unit will need to be installed at your home to enable recharging <strong>of</strong> your EV. The following questions relate to where youwill be parking the EV when it’s not being driven. To avoid us making numerous visits to your home, please answer the followingquestions as best you can:1. Is the parking location undercover or outside?2. Is a wall-mounted charging unit possible, or will the charging unit need to be on a free-standing pole?3. Is there any risk <strong>of</strong> asbestos in the location where the charging unit will be installed?4. What is the age and type <strong>of</strong> your house (free-standing, semi-detached, town-house, apartment etc)?5. When was your house last renovated (if at all)?6. Is the EV parking bay attached to the home or building where the power supply is available? Or will there need to be wiringinstalled between the house and garage?7. Is the path between EV parking bay and household power supply blocked by trees, household storage, rubbish, walls etc?8. What is the estimated length from your <strong>electric</strong>ity meter and/or switchboard to parking bay?If it is not too much trouble, could you please supply photos <strong>of</strong> the house, the garage, the proposed parking space and location, themeter and switch boards, and anything else you think might be usefulThe answers to these questions will give us a good indication <strong>of</strong> what to expect when we come out to your residence to install theunit. If you’re not sure what the question is asking, please don’t hesitate to give us a call.Example <strong>electric</strong>ity metersExample switchboards
APPENDIX EEV CHARGING COURTESY SIGNAGEThe pr<strong>of</strong>orma design from the U.S. below 21 is an example <strong>of</strong> simple but effective communication between EV drivers thatallows them to share EV charging infrastructure.21 http://www.evchargernews.com/chargeprotocolcard.pdf, viewed 23 December 2012CREATING A MARKET 151
If you would like to receive this publication in analternative format please telephone the PublicAffairs branch on 9655 6000.© State Government <strong>of</strong> Victoria 2013This publication is copyright. No part may bereproduced by any process except in accordancewith the Provisions <strong>of</strong> the Copyright Act 1968.Authorised by the Victorian Government121 Exhibition Street, Melbourne.DOT 7610/13