ARRA's experience in the identification of top research teams:
ARRA's experience in the identification of top research teams:
ARRA's experience in the identification of top research teams:
- No tags were found...

You also want an ePaper? Increase the reach of your titles
YUMPU automatically turns print PDFs into web optimized ePapers that Google loves.
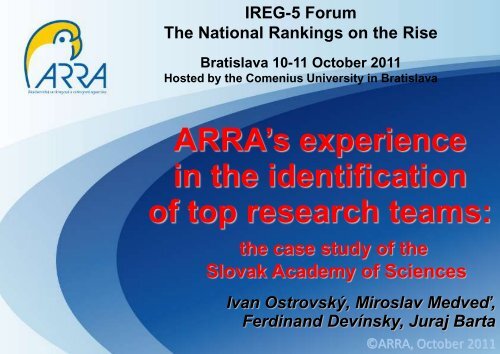
IREG-5 ForumThe National Rank<strong>in</strong>gs on <strong>the</strong> RiseBratislava 10-11 October 2011Hosted by <strong>the</strong> Comenius University <strong>in</strong> BratislavaARRA’s <strong>experience</strong><strong>in</strong> <strong>the</strong> <strong>identification</strong><strong>of</strong> <strong>top</strong> <strong>research</strong> <strong>teams</strong>:<strong>the</strong> case study <strong>of</strong> <strong>the</strong>Slovak Academy <strong>of</strong> SciencesIvan Ostrovský, Miroslav Medveď,Ferd<strong>in</strong>and Devínsky, Juraj Barta©ARRA, October 2011
CONCEPT:Fénix 2Common and standardised system <strong>of</strong> periodicassessment <strong>of</strong> R&D for HEIs and o<strong>the</strong>r <strong>research</strong><strong>in</strong>stitutions – basis <strong>of</strong> long-term <strong>in</strong>stitutional f<strong>in</strong>anc<strong>in</strong>g <strong>of</strong>R&DConcept <strong>of</strong> national and <strong>in</strong>ternational excellenceInternational criteria for R&D assessmentOutputs - publications, citations, <strong>in</strong>novations........Lead<strong>in</strong>g companies are h<strong>in</strong>dered by <strong>the</strong> collaborationwith average/mediocre HEIs or <strong>research</strong> <strong>in</strong>stitutions.2
Ma<strong>in</strong> Goals <strong>of</strong> <strong>the</strong> ProjectSAS asked for <strong>the</strong> <strong>identification</strong> <strong>of</strong><strong>top</strong> and at <strong>the</strong> same time perspective<strong>research</strong> <strong>teams</strong>3 critical questions to achieve <strong>the</strong> goal: How is a “<strong>research</strong> team” def<strong>in</strong>ed? When is <strong>the</strong> team classified as “<strong>top</strong>”? When <strong>the</strong> team has “good prospects”?3
Pr<strong>in</strong>ciplesTeam and Team Leader• Top team should be led by a <strong>top</strong> leader (leaders); however, a <strong>top</strong><strong>research</strong>er is not necessarily <strong>the</strong> leader <strong>of</strong> <strong>the</strong> <strong>top</strong> team Comparison is correct and accurate among <strong>the</strong> SAS<strong>teams</strong>, but only <strong>in</strong> <strong>the</strong> same discipl<strong>in</strong>e/set <strong>of</strong> fields No K.O. criteria applied, but complex assessment (not“bl<strong>in</strong>d” scientometry), with needs for:• identify<strong>in</strong>g <strong>the</strong> team‟s ma<strong>in</strong> scientific field• decid<strong>in</strong>g whe<strong>the</strong>r a particular <strong>research</strong>er is a member <strong>of</strong> <strong>the</strong> team ornot• assess<strong>in</strong>g criteria <strong>in</strong> <strong>the</strong> context4
Teams’ <strong>identification</strong> Primary list: SAS‟s formal division (<strong>in</strong>stitutes/departments) Level and degree <strong>of</strong> mutual collaboration Author(s), with whom <strong>the</strong> o<strong>the</strong>r team members have <strong>the</strong> highest %<strong>of</strong> collaboration, are considered as team leaders Team „Core‟ and „Non-core‟ members Collaboration outside <strong>the</strong> <strong>in</strong>stitute/department, or outside SASNumber <strong>of</strong> Articles (author)> 10% <strong>of</strong> co-operative articles> 30% <strong>of</strong> co-operative articles> 60% <strong>of</strong> co-operative articlesFyzio-VascDisOrd PHYSIOLOGYKristek AB Cacanyiova CD Torok EF Cebova GH Zemancikova IJ Malekova KLFrantišek ABKristek 27 15/56 4/15 10/37Soňa CDČačányiová (Kyselá) 15/94 16 3/19Jozef EFTörök 4/40 10 4/40 3/30Mart<strong>in</strong>a GHCebová 10/77 3/23 4/31 13Anna IJZemančíková 3/100 3Magdaléna KLMaleková5
SAS structureSLOVAK ACADEMY OF SCIENCESSECTION 1 SECTION 2 SECTION 3PHYSICAL, SPACE,EARTH, ANDENGINEERINGSCIENCESLIFE,CHEMICAL,MEDICAL,AND ENVIRONMENTALSCIENCESSOCIAL SCIENCES,HUMANITIES, ARTSAND CULTURE6
First “filter” In Sections 1 and 2 - more than 200 <strong>teams</strong> were identified First selection criteria: (who is def<strong>in</strong>itely NOT <strong>in</strong> <strong>the</strong> TOP)• Team leader has less than 10 WoK Articles s<strong>in</strong>ce 2006• Team leader/most members have at most a part-time (no morethan 50%) contract with SAS• Modified H-<strong>in</strong>dex for particular scientific field (ModH) is lowerthan 15 Borderl<strong>in</strong>e cases were also evaluated 63 <strong>teams</strong> matched <strong>the</strong>se criteria 7
Basic Pr<strong>in</strong>ciples Time scale – 2001 to 2010 9 steps to <strong>teams</strong> assessment – no K.O. criteria Steps 1-2 focus on <strong>in</strong>dividual team members – <strong>the</strong>ir overallperformance and <strong>the</strong> contribution to <strong>the</strong> quality <strong>of</strong> <strong>the</strong> team Steps 3-5 focus on <strong>the</strong> team‟s performance – quantity, qualityand <strong>the</strong> effectiveness <strong>of</strong> published papers Steps 6-8 assess team‟s exceptional articles and <strong>the</strong>ir relativeimpact Step 9 describes <strong>the</strong> progress <strong>of</strong> <strong>the</strong> team dur<strong>in</strong>g <strong>the</strong>evaluated period All comparisons were done aga<strong>in</strong>st <strong>in</strong>ternational benchmarks „Avg citation per article‟ was also compared with <strong>the</strong> world‟sbest 35 universities (<strong>top</strong> 25 from: ARWU, USN&WR, TimesHE)8
AnorChem-TeoChem Art Cit Cit/Art H-<strong>in</strong>dex DoB Age PhD 1st Art ActiveResm-quotient FTEM OL [100] 70 3663 52,33 28 1956 55 1998 1990 27 1,04 100MVG [100] 73 3526 48,30 28 1956 55 1990 1979 21 1,33 100N J [53] 88 4856 55,18 30 1955 56 1995 1980 16 1,88 67,1KO S [100] 8 53 6,63 4 1982 29 2009 2006 2 2,00 53,3KE S [100] 8 144 18,00 6 1981 30 2009 2003 2 3,00 63,3RE M [0] 10 74 7,40 5 1981 30 2009 2004 2 2,50 55,8HO P [0] 16 160 10,00 9 1981 30 2008 2001 3 3,00 43,3PA A [100] 1 1 1,00 1 1985 26 2010 1 1,00 13,3MA E [outside SAV] 3 15 5,00 2 2006 5 0,40KA M [outside SAV] 188 4941 26,28 36 1990 21 1,71H-<strong>in</strong>dex 01-11 (Lead) 21Art 01-10 Cit 01-10 Cit/Art 01-10 W Avg Cit/Art T/World BestUni ACA T/BestUniAvgCoAuthUnCit H-<strong>in</strong>dex 01-11 (Rest w/Lead) 963 1088 17,27 10,74 1,61 19,41 0,89 4,5 8 H-<strong>in</strong>dex 01-11 (Rest w/o Lead) 2Top 5 Journals 26.1st Percentile1st Percentile 1st Decile2nd DecileAvg% 03-10H-<strong>in</strong>dex 01-10 ModH 2 Angew. Chem. Int. Edit.0 0 18 14 30,9 21 17 2 J. Am. Chem. Soc.Art% Proc% Rev% 17 J. Chem. Phys.33,17 26,46 12,59 1 J. Chem. Theor. Comput.4 Phys. Chem. Chem. Phys.Art Cit Cit/Art W Avg Cit/Art T/World 4,502001 7 175 25,00 17,62 1,42 4,002002 8 251 31,38 17,61 1,783,502003 7 122 17,43 16,07 1,083,002004 4 71 17,75 14,88 1,192,502005 10 178 17,80 13,09 1,362,002006 6 100 16,67 10,57 1,582007 6 54 9,00 8,35 1,08 1,502008 4 97 24,25 5,79 4,19 1,002009 5 31 6,20 2,98 2,08 0,502010 6 9 1,50 0,44 3,41 0,002011 3 0,002001200220032004200520062007200820092010
Data evaluation Collected data were assessed accord<strong>in</strong>g to four ma<strong>in</strong>criteria:• publication productivity (quantity <strong>of</strong> outputs),• total <strong>in</strong>fluence (no. <strong>of</strong> citations, H-<strong>in</strong>dex),• effectiveness (avg cit/art, uncited articles),• relative impact (<strong>top</strong> papers, 1 st percentile/decile) Each <strong>of</strong> <strong>the</strong> abovementioned <strong>in</strong>formation is important fordifferent aspect <strong>of</strong> <strong>the</strong> <strong>research</strong> evaluation10
Summary 1 22 <strong>top</strong> <strong>teams</strong> were identified• Only Sections 1 and 2 are presented here• Section 3 (SSH) has different publication patterns (more onSlide 13) 17 above-average <strong>teams</strong> were detected• Several “<strong>top</strong>-<strong>teams</strong>” criteria were not met11
Summary 2 from 1800 assessed <strong>research</strong>ers <strong>in</strong> Sections 1 and 2,~ 1000 are members <strong>of</strong> some team questionnaire sent to 63 <strong>teams</strong>, cover<strong>in</strong>g some ~ 400<strong>research</strong>ers 870 <strong>research</strong>ers do not belong to any team 580 <strong>research</strong>ers do not belong to <strong>top</strong> or above-average<strong>teams</strong>
Section 3 (SSH)The majority are <strong>in</strong>dividual <strong>research</strong>ers (occasional pairs)• even <strong>the</strong> review <strong>of</strong> mutual citations has led to <strong>the</strong> same data Problems with <strong>the</strong> performance evaluation us<strong>in</strong>g WoK,InCites, ESI – due to <strong>the</strong> lack <strong>of</strong> data regard<strong>in</strong>g SAS SSHfields (except for several <strong>in</strong>dividuals with<strong>in</strong> Psychology andEconomics, none with H>2)Additional sources from SAS Library• Lack <strong>of</strong> proper scientometric data (average percentile, etc.)• Non-exist<strong>in</strong>g benchmarks (no systematic <strong>in</strong>formation aboutworks and citations outside ma<strong>in</strong> databases)13
Social Sciences <strong>in</strong> <strong>the</strong> world,region and Slovakia2001-2010 World The most citedArticle100th most citedArticleEconomics 883 239Social Sciences 620 214Psychology/Psychiatry 2037 399Matematics 2280 144Technical Sciences 1822 2881994 SVK CZE HUN2011 Art Cit <strong>top</strong>1<strong>top</strong>10Art Cit <strong>top</strong>1<strong>top</strong>10Art Cit <strong>top</strong>1Econ 1264 770 22 9 2927 2665 123 30 1033 2682 230 45Psy 836 1608 41 23 1686 5941 383 72 1447 12442 466 132<strong>top</strong>10
HumanitiesChanges to evaluation methodology Due to <strong>the</strong> different publication patterns, it was impossible toapply all <strong>the</strong> assessment methods/criteria used for Sections 1and 2 Moreover, no benchmarks were available Bibliometric analyses were possible only to some extent; and<strong>the</strong> four ma<strong>in</strong> categories <strong>of</strong> evaluation (similar to those usedfor Section 1 and 2) were applied:• Quantity: <strong>the</strong> number and <strong>the</strong> „quality‟ (categories: books,articles, conf.papers, etc.) <strong>of</strong> publications, <strong>in</strong>clud<strong>in</strong>g articles andbooks outside <strong>in</strong>ternational databases• Global <strong>in</strong>fluence: number <strong>of</strong> citations for <strong>the</strong>se publications• Effectiveness: an average number <strong>of</strong> citations per publication• Relative impact: publications cited more than 10/20/50/100times (rough equivalent <strong>of</strong> papers <strong>in</strong> 20/10/1/0.1/.01 percentile)
F<strong>in</strong>al list <strong>of</strong> <strong>teams</strong>The f<strong>in</strong>al list <strong>of</strong> <strong>teams</strong> conta<strong>in</strong>s follow<strong>in</strong>g <strong>in</strong>formation: Name <strong>of</strong> <strong>the</strong> <strong>in</strong>stitute/department, where <strong>the</strong> majority <strong>of</strong>team members are based Team collaboration with<strong>in</strong> SAS (with o<strong>the</strong>rdepartments) FTE <strong>of</strong> each team member Team Leader(s) (<strong>in</strong>clud<strong>in</strong>g <strong>the</strong>ir H-<strong>in</strong>dex) „Core‟/ „Non-core‟ team members Team members outside SAS (if such exist)18
Comparison <strong>of</strong> total data <strong>in</strong> a 10-year period <strong>in</strong> <strong>the</strong>world(selected ESI fields)World benchmarks(average citation/article)Fields 2001 2002 2003 2004 2005 2006 2007 2008 2009 2010 01-10Biology&Biochem 29.64 27.36 24.84 21.97 18.12 14.21 10.98 7.22 3.62 0.52 15.85Chemistry 17.62 17.61 16.07 14.88 13.09 10.57 8.35 5.79 2.98 0.44 10.74Computer Science 7.66 7.93 5.35 3.99 3.51 2.51 3.26 2.13 0.98 0.15 3.75Economics 11.5 11.72 10.39 9.25 7.43 5.58 4.03 2.22 0.97 0.2 6.33Eng<strong>in</strong>eer<strong>in</strong>g 8.11 7.57 7.04 6.69 5.63 4.54 3.8 2.41 1.2 0.16 4.72Geosciences 17.88 15.62 14.47 12.82 10.79 9.21 6.24 4.07 2 0.43 9.35Ma<strong>the</strong>matics 6.05 5.99 5.39 4.8 4.19 3.36 2.51 1.67 0.86 0.14 3.50Mol Bio&Genetics 46.34 42.79 37.83 33.71 27.86 22.34 16.94 11.1 5.81 0.9 24.56Physics 14.32 13.23 12.2 11.52 10 8.18 5.77 3.8 1.94 0.39 8.14Psychology 21.11 18.94 18.08 15.84 12.89 10.21 7.33 4.42 1.88 0.34 11.10Social Sciences 8.63 8.37 7.67 7.21 6.19 4.82 3.49 2.02 0.88 0.2 4.95
World benchmarks(<strong>top</strong> percentile) No. <strong>of</strong> articles with <strong>the</strong> <strong>top</strong> citation rates <strong>in</strong>a particular field, <strong>in</strong> <strong>the</strong> last 10 years(ESI classifications)Physics 2000 2001 2002 2003 2004 2005 2006 2007 2008 2009 20100.01% 1427 1377 1041 966 671 717 630 336 348 244 370.10% 517 462 395 348 313 248 192 143 103 70 151.00% 148 139 121 109 100 82 66 51 36 19 610.00% 36 33 31 29 27 24 20 14 10 5 220.00% 20 19 18 17 16 14 12 9 6 3 150.00% 6 6 6 5 5 5 4 3 2 1 0
Summary 2 (chart)from 1900 assessed <strong>research</strong>ers <strong>in</strong> Sections 1 and 2,~ 1000 are members <strong>of</strong> some team questionnaire sent to 63 <strong>teams</strong>• ~ 400 <strong>research</strong>ersTop <strong>teams</strong> (22<strong>teams</strong>)Above average(17 <strong>teams</strong>)Without team(870 <strong>research</strong>ers)O<strong>the</strong>r <strong>teams</strong>(660 <strong>research</strong>ers)
Social Sciences AssessmentOnly two small <strong>teams</strong> and two o<strong>the</strong>r <strong>in</strong>dividualsabove <strong>the</strong> average• Almost all <strong>in</strong>volved <strong>in</strong> wider <strong>in</strong>ternational collaborationOddelenie Meno Art WoSCit WoSC/A WoSH WoSm-quotient 1% 10% 20% Art Cit Cit/Art100+ Cit 50+ Cit 30+ Cit 20+ Cit 10+ CitTeamsSocComABianchi G 29 133 4.59 4 0.16 1 4 1 46 201 4.37 2 2 2Luksik B I 14 132 9.43 4 0.19 1 4 1 38 201 5.29 2 2 1Popper C M 17 127 7.47 4 0.22 1 4 1 29 189 6.52 2 2 1XPsi AdamovovaDL 6 77 12.83 2 0.29 2 3 21 140 6.67 1 2Fickova E E 23 146 6.35 5 0.19 2 3 28 165 5.89 1 2 1IndividualsProgn Balaz X V 47 142 3.02 8 0.30 3 2 62 249 4.02 2 1 4Socio Gajdos Y P 18 14 0.78 2 0.12 3 1 28 147 5.25 1 2 122