Keizer Station FCn.pub - HSM Pacific
Keizer Station FCn.pub - HSM Pacific
Keizer Station FCn.pub - HSM Pacific
- No tags were found...

Create successful ePaper yourself
Turn your PDF publications into a flip-book with our unique Google optimized e-Paper software.
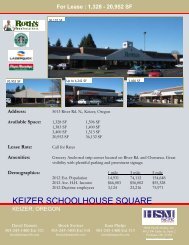
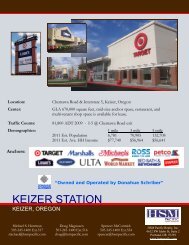
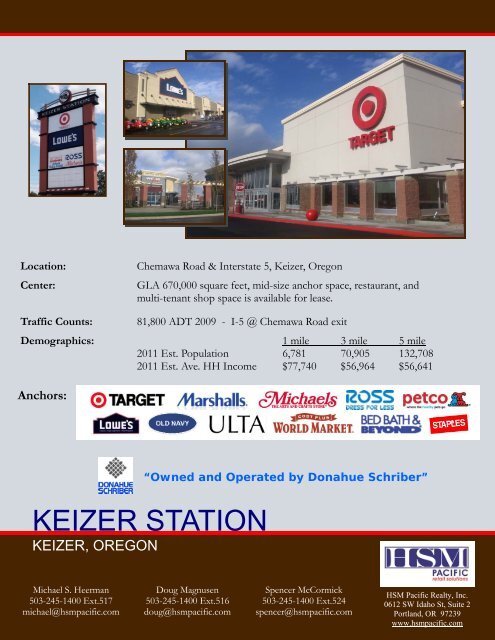
Location:Center:Chemawa Road & Interstate 5, <strong>Keizer</strong>, OregonGLA 670,000 square feet, mid-size anchor space, restaurant, andmulti-tenant shop space is available for lease.Traffic Counts:81,800 ADT 2009 - I-5 @ Chemawa Road exitDemographics: 1 mile 3 mile 5 mile2011 Est. Population 6,781 70,905 132,7082011 Est. Ave. HH Income $77,740 $56,964 $56,641Anchors:“Owned and Operated by Donahue Schriber”KEIZER STATIONKEIZER, OREGONMichael S. Heerman503-245-1400 Ext.517michael@hsmpacific.comDoug Magnusen503-245-1400 Ext.516doug@hsmpacific.comSpencer McCormick503-245-1400 Ext.524spencer@hsmpacific.comThe information contained herein was obtained from sources we deem reliable, however we do not guarantee its accuracy.<strong>HSM</strong> <strong>Pacific</strong> Realty, Inc.0612 SW Idaho St, Suite 2Portland, OR 97239www.hsmpacific.com
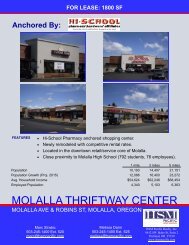
NSALEM / KEIZER, OREGONRetail Aerial
MAJOR ‘3B’ ‐ 2,100 S.F.‐ 5,000 S.F.RETAIL ‘1’T MOBILE: 2,477 S.F.AMERICAS BEST EYERWARE: 2,781 S.F.Edward D. Jones: 630 S.F.TACO DEL MAR: 1,400 S.F.RETAIL ‘2’VACANT: 2,749 S.F.GAMESTOP 1,493 S.F.ADOBO CAFÉ 2,165 S.F.FUTURERETAIL ‘3’GENTLE DENTAL: 3,579 S.F.MASSAGE ENVY: 2,696 S.F.VACANT: 1,192 S.F.GNC: 1,097 S.F.VACANT: 1,890 S.F.RETAIL ‘7’VACANT: 2,000 S.F.OSU BEAVER SHOP: 1,097 S.F.
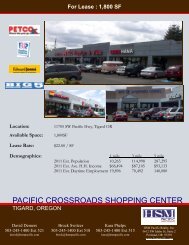
<strong>Keizer</strong> <strong>Station</strong>Trade Area Map
FULL PROFILE2000 - 2010 Census, 2011 Estimates with 2016 ProjectionsCalculated using Proportional Block GroupsLat/Lon: 45.0054/-122.9967Chemawa Road & Interstate 5<strong>Keizer</strong>, OR1 Mile 3 Miles 5 MilesAGEHOUSEHOLDS POPULATIONMARITAL STATUSINCOME& SEX2011 Estimated Population 6,781 70,905 132,7082016 Projected Population 6,900 73,096 136,8032010 Census Population 6,753 70,533 131,8852000 Census Population 6,362 62,953 118,389Historical Annual Growth 2000 to 2011 0.6% 1.1% 1.1%Projected Annual Growth 2011 to 2016 0.3% 0.6% 0.6%2011 Est. Households 2,408 25,392 47,8352016 Proj. Households 2,459 26,214 50,0552010 Census Households 2,401 25,378 47,3522000 Census Households 2,292 22,921 43,181Historical Annual Growth 2000 to 2011 0.2% 0.5% 0.5%Projected Annual Growth 2011 to 2016 0.4% 0.6% 0.9%2011 Est. Population 0 to 9 Years 16.0% 15.3% 15.0%2011 Est. Population 10 to 19 Years 14.7% 14.1% 14.1%2011 Est. Population 20 to 29 Years 13.8% 13.8% 13.8%2011 Est. Population 30 to 44 Years 18.6% 19.2% 18.7%2011 Est. Population 45 to 59 Years 18.7% 20.1% 20.2%2011 Est. Population 60 to 74 Years 12.0% 11.7% 12.0%2011 Est. Population 75 Years Plus 6.1% 5.9% 6.2%2011 Est. Median Age 33.4 34.2 34.62011 Est. Male Population 52.7% 49.9% 50.6%2011 Est. Female Population 47.3% 50.1% 49.5%2011 Est. Never Married 23.1% 24.8% 26.0%2011 Est. Now Married 59.5% 52.2% 49.1%2011 Est. Separated or Divorced 12.8% 17.3% 18.4%2011 Est. Widowed 4.6% 5.8% 6.4%2011 Est. HH Income $200,000 or More 3.9% 1.8% 2.0%2011 Est. HH Income $150,000 to $199,999 3.2% 2.4% 2.2%2011 Est. HH Income $100,000 to $149,999 13.0% 9.0% 9.0%2011 Est. HH Income $75,000 to $99,999 20.1% 13.1% 11.8%2011 Est. HH Income $50,000 to $74,999 20.2% 18.8% 18.6%2011 Est. HH Income $35,000 to $49,999 14.1% 15.0% 15.5%2011 Est. HH Income $25,000 to $34,999 9.9% 12.8% 13.4%2011 Est. HH Income $15,000 to $24,999 8.9% 13.5% 13.6%2011 Est. HH Income $0 to $14,999 6.7% 13.7% 14.0%2011 Est. Average Household Income $77,740 $56,964 $56,6412011 Est. Median HH Income $58,833 $46,718 $45,7512011 Est. Per Capita Income $27,857 $20,741 $21,136This report was produced using data from private and government sources deemed to be reliable. The information herein is provided without representation or warranty.2011 Est. Number of Businesses 179 1,881 4,7772011 Est. Total Number of Employees 2,083 22,449 59,680©2012, Sites USA, Chandler, Arizona, 480-491-1112 page 1 of 3 Demographic Source: Applied Geographic Solutions 8/2011, TIGER Geography
FULL PROFILE2000 - 2010 Census, 2011 Estimates with 2016 ProjectionsCalculated using Proportional Block GroupsLat/Lon: 45.0054/-122.9967Chemawa Road & Interstate 5<strong>Keizer</strong>, OR1 Mile 3 Miles 5 MilesHISPANIC RACEEDUCATION(Adults 25 or Older)HOME VALUESHOMES BUILT BY YEAR HOUSING2011 Est. White Population 81.8% 73.8% 74.2%2011 Est. Black Population 0.7% 1.0% 1.2%2011 Est. Asian & <strong>Pacific</strong> Islander 2.4% 3.3% 3.5%2011 Est. American Indian & Alaska Native 1.1% 1.5% 1.6%2011 Est. Other Races Population 14.0% 20.4% 19.5%2011 Est. Hispanic Population 1,367 21,981 39,5592011 Est. Hispanic Population Percent 20.2% 31.0% 29.8%2016 Proj. Hispanic Population Percent 24.4% 35.5% 34.1%2010 Hispanic Population Percent 19.2% 29.4% 28.6%2011 Est. Adult Population (25 Years or Older) 4,219 45,346 85,0042011 Est. Elementary (0 to 8) 4.8% 8.4% 8.6%2011 Est. Some High School (9 to 11) 10.2% 9.8% 9.7%2011 Est. High School Graduate (12) 22.0% 25.2% 26.7%2011 Est. Some College (13 to 16) 27.2% 26.6% 25.6%2011 Est. Associate Degree Only 7.0% 11.2% 10.3%2011 Est. Bachelor Degree Only 20.8% 12.7% 12.8%2011 Est. Graduate Degree 8.0% 6.1% 6.2%2011 Est. Total Housing Units 2,516 26,801 50,8682011 Est. Owner Occupied Percent 70.3% 51.7% 52.2%2011 Est. Renter Occupied Percent 25.4% 43.0% 41.9%2011 Est. Vacant Housing Percent 4.3% 5.3% 6.0%2000 Homes Built 1999 to 2000 2.7% 3.1% 2.5%2000 Homes Built 1995 to 1998 11.6% 15.8% 12.9%2000 Homes Built 1990 to 1994 10.3% 12.2% 10.3%2000 Homes Built 1980 to 1989 13.1% 10.6% 10.8%2000 Homes Built 1970 to 1979 39.7% 27.2% 24.9%2000 Homes Built 1960 to 1969 13.7% 14.5% 12.9%2000 Homes Built 1950 to 1959 3.8% 9.3% 10.6%2000 Homes Built Before 1949 4.9% 7.2% 15.0%2000 Home Value $1,000,000 or More - 0.1% 0.1%2000 Home Value $500,000 to $999,999 0.1% 0.4% 0.4%2000 Home Value $400,000 to $499,999 - 0.3% 0.3%2000 Home Value $300,000 to $399,999 0.7% 0.9% 0.9%2000 Home Value $200,000 to $299,999 3.0% 7.6% 7.0%2000 Home Value $150,000 to $199,999 21.7% 18.8% 17.3%2000 Home Value $100,000 to $149,999 67.2% 55.5% 52.2%2000 Home Value $50,000 to $99,999 7.3% 15.8% 21.1%2000 Home Value $25,000 to $49,999 - 0.3% 0.6%2000 Home Value $0 to $24,999 - 0.3% 0.2%2000 Median Home Value $134,570 $132,036 $128,0292000 Median Rent $562 $494 $479This report was produced using data from private and government sources deemed to be reliable. The information herein is provided without representation or warranty.©2012, Sites USA, Chandler, Arizona, 480-491-1112 page 2 of 3 Demographic Source: Applied Geographic Solutions 8/2011, TIGER Geography
FULL PROFILE2000 - 2010 Census, 2011 Estimates with 2016 ProjectionsCalculated using Proportional Block GroupsLat/Lon: 45.0054/-122.9967Chemawa Road & Interstate 5<strong>Keizer</strong>, ORLABOR FORCEOCCUPATIONTRANSPORTATIONTO WORKTRAVEL TIMECONSUMER EXPENDITURE1 Mile 3 Miles 5 Miles2011 Est. Labor: Population Age 16+ 5,101 53,926 101,3962011 Est. Civilian Employed 60.9% 58.1% 56.1%2011 Est. Civilian Unemployed 8.4% 9.7% 9.5%2011 Est. in Armed Forces 1.1% 0.3% 0.2%2011 Est. not in Labor Force 29.7% 32.0% 34.3%2011 Labor Force: Males 52.4% 49.4% 50.2%2011 Labor Force: Females 47.6% 50.6% 49.8%2000 Occupation: Population Age 16+ 3,020 28,514 52,7732000 Mgmt, Business, & Financial Operations 16.4% 12.2% 11.7%2000 Professional & Related 18.2% 15.5% 16.0%2000 Service 17.1% 17.4% 17.4%2000 Sales and Office 26.6% 26.3% 26.5%2000 Farming, Fishing, and Forestry 1.0% 3.5% 3.6%2000 Construction, Extraction, & Maintenance 9.3% 10.0% 9.6%2000 Production, Transport, & Material Moving 11.5% 15.2% 15.1%2000 Percent White Collar Workers 61.2% 53.9% 54.2%2000 Percent Blue Collar Workers 38.8% 46.1% 45.8%2000 Drive to Work Alone 78.9% 73.9% 71.7%2000 Drive to Work in Carpool 14.8% 17.1% 17.2%2000 Travel to Work by Public Transportation 1.8% 2.3% 2.7%2000 Drive to Work on Motorcycle - 0.2% 0.1%2000 Walk or Bicycle to Work 0.7% 2.2% 3.7%2000 Other Means 0.7% 0.7% 0.9%2000 Work at Home 3.1% 3.6% 3.7%2000 Travel to Work in 14 Minutes or Less 30.2% 29.7% 33.4%2000 Travel to Work in 15 to 29 Minutes 46.8% 42.5% 40.4%2000 Travel to Work in 30 to 59 Minutes2000 Travel to Work in 60 Minutes or More 6.2% 7.3% 7.2%2000 Average Travel Time to Work 21.8 22.3 21.72011 Est. Total Household Expenditure $142 M $1.21 B $2.25 B2011 Est. Apparel $6.77 M $57.7 M $108 M2011 Est. Contributions & Gifts $9.00 M $73.2 M $138 M2011 Est. Education & Reading $3.81 M $31.5 M $59.1 M2011 Est. Entertainment $7.96 M $66.9 M $125 M2011 Est. Food, Beverages & Tobacco $22.5 M $196 M $366 M2011 Est. Furnishings & Equipment $6.36 M $52.2 M $97.2 M2011 Est. Health Care & Insurance $10.1 M $87.6 M $164 M2011 Est. Household Operations & Shelter & Utilities $42.2 M $360 M $673 M2011 Est. Miscellaneous Expenses $2.36 M $20.3 M $38.1 M2011 Est. Personal Care $2.06 M $17.6 M $32.9 M2011 Est. Transportation $28.8 M $244 M $454 MThis report was produced using data from private and government sources deemed to be reliable. The information herein is provided without representation or warranty.©2012, Sites USA, Chandler, Arizona, 480-491-1112 page 3 of 3 Demographic Source: Applied Geographic Solutions 8/2011, TIGER Geography