Testing More, Teaching Less - American Federation of Teachers
Testing More, Teaching Less - American Federation of Teachers
Testing More, Teaching Less - American Federation of Teachers
- No tags were found...

Create successful ePaper yourself
Turn your PDF publications into a flip-book with our unique Google optimized e-Paper software.
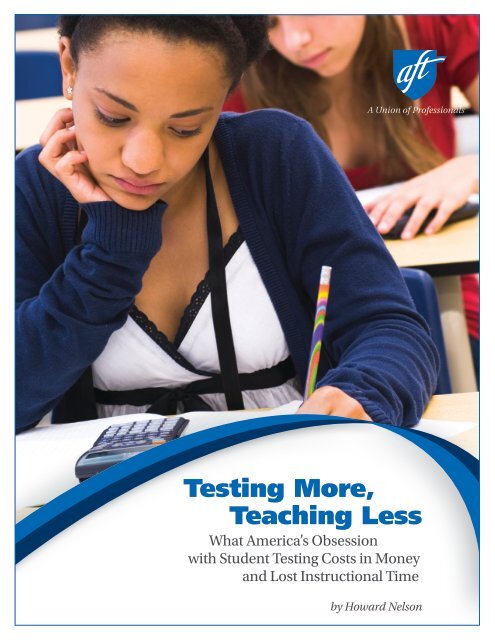
<strong>Testing</strong> <strong>More</strong>,<strong>Teaching</strong> <strong>Less</strong>What America’s Obsessionwith Student <strong>Testing</strong> Costs in Moneyand Lost Instructional Timeby Howard Nelson
<strong>Testing</strong> <strong>More</strong>,<strong>Teaching</strong> <strong>Less</strong>What America’s Obsessionwith Student <strong>Testing</strong> Costs in Moneyand Lost Instructional Timeby Howard Nelson
Randi WeingartenpresidentLorretta Johnsonsecretary-treasurerFrancine Lawrenceexecutive vice presidentOUR MISSIONThe <strong>American</strong> <strong>Federation</strong> <strong>of</strong> <strong>Teachers</strong> is a union <strong>of</strong> pr<strong>of</strong>essionals that championsfairness; democracy; economic opportunity; and high-quality public education,healthcare and public services for our students, their families and our communities.We are committed to advancing these principles through community engagement,organizing, collective bargaining and political activism, and especially through thework our members do.Copyright © <strong>American</strong> <strong>Federation</strong> <strong>of</strong> <strong>Teachers</strong>, AFL-CIO (AFT 2013). Permission is herebygranted to AFT state and local affiliates to reproduce and distribute copies <strong>of</strong> the work fornonpr<strong>of</strong>it educational purposes, provided that copies are distributed at or below cost, andthat the author, source, and copyright notice are included on each copy. Any distribution<strong>of</strong> such materials to third parties who are outside <strong>of</strong> the AFT or its affiliates is prohibitedwithout first receiving the express written permission <strong>of</strong> the AFT.
IntroductionAll children deserve a rich, meaningful publiceducation that prepares them for the opportunities,responsibilities and challenges thatawait them as contributing members <strong>of</strong> a democraticsociety and a global economy. That vision shouldbe as true for students in Birmingham or the SouthBronx as it is for those in Beverly Hills. And it’s whythe AFT and our affiliates have been advocates <strong>of</strong>clear, common, core curricular standards for morethan 20 years, and why we strongly support the CommonCore State Standards (CCSS) for mathematicsand English language arts and other career- andcollege-ready standards efforts today. But the deeperlearning we aspire to has too <strong>of</strong>ten been a rhetoricalaspiration—not accompanied by the supportsneeded to make implementation a reality—andeclipsed by the misuse and overuse <strong>of</strong> standardizedassessments required by policymakers fixated on accountabilityabove all else.The coupling <strong>of</strong> state standards and assessmentsto measure and report student and school performanceunder the No Child Left Behind Act narrowedcurricula across the country. Despite a laudatorygoal <strong>of</strong> shining the light on student needs, it took usin another direction, away from valuing the essentialskills <strong>of</strong> persistence, critical thinking and collaboration.Instead <strong>of</strong> resulting in the standards-basedpublic education system our nation and our childrendeserve, the current standardized test-basedaccountability system has left classroom teachersalmost solely responsible for the performance <strong>of</strong>students and schools. Many districts piled on, addinga plethora <strong>of</strong> other standardized tests to benchmarkstudent performance levels, measure progress towardsa state’s standardized test, or layer on requirementsfor promotion or graduation.Educators know the necessity <strong>of</strong> gauging studentlearning—they use various assessment techniquesthroughout the school day. And we support theproper use <strong>of</strong> standardized testing and sensible accountabilitymeasures. Educators, parents and othershave joined the AFT’s efforts to restore the balancebetween teaching and testing, most recently throughour “Learning Is <strong>More</strong> Than a Test Score” campaign.The current test-and-punish accountability systemhas squeezed out vital parts <strong>of</strong> the curriculum thatare not subjected to accountability testing, sacrificedstudent learning time to testing and test preparation,and forced teachers—particularly those teaching ourmost vulnerable students—to focus their attentionon students achieving just below the passing score.That is not what countries with high-performingeducation systems do, and it is not what the UnitedStates should do.Last summer, delegates to the AFT conventionwent on record in support <strong>of</strong> testing that informs,rather than impedes, teaching and learning, and infavor <strong>of</strong> studies that shed light on the real costs <strong>of</strong>testing. <strong>Testing</strong> <strong>More</strong>, <strong>Teaching</strong> <strong>Less</strong> is part <strong>of</strong> deliveringon our commitment to provide guidelines, studiesand other helpful information to our membersand the broader public about the nature, amountand costs <strong>of</strong> student assessments. Many otherstakeholders have voiced their concerns about theimpact <strong>of</strong> standardized tests and have taken actionto curtail overtesting and its consequences. In Texas,lawmakers cut the number <strong>of</strong> high school end-<strong>of</strong>courseexams required for graduation from 15 to five,and eliminated the requirement that results wouldcount for 15 percent <strong>of</strong> a student’s overall grade.The Orchard Park Central School District Board <strong>of</strong>Education in New York took a stand with a resolutionproposing that this year’s state assessments be usedfor “measuring the state’s progress in introducingthe Common Core Learning Standards rather thanfor measuring student performance or educatoreffectiveness.” Lawmakers in New Mexico called foran analysis <strong>of</strong> the cost, both in instructional timeand money, <strong>of</strong> all student assessments. And just thismonth, the New York Times ended a strongly wordededitorial about the dangers <strong>of</strong> “testing mania” with acall for the country to “reconsider its obsession withtesting, which can make education worse, not better.”We’re at a point where the adoption and implementation<strong>of</strong> the Common Core State Standardsfor the majority <strong>of</strong> the nation’s students should bedeepening the potential for all students to learn whatthey need to be college- or career-ready upon gradu-<strong>Testing</strong> <strong>More</strong>, <strong>Teaching</strong> <strong>Less</strong> 1
ation. Instead, public policy and politics have putthe testing cart before the standards-and-curriculumhorse. As educators, we know that any meaningfulstandards need more than assessments to succeed.Resources for improved instruction are necessary, inaddition to aligned curriculum, pr<strong>of</strong>essional development,and time and tools for teachers to learn andcollaborate. Unfortunately, the majority <strong>of</strong> teachersrecently polled by the AFT say that this is not happening—orit is happening without the voice andviews <strong>of</strong> teachers. Yet, states are moving forward withassessments that have consequences for students,teachers and schools. That’s why I called for a moratoriumon high-stakes consequences associated withnew standards-based assessments. The U.S. Department<strong>of</strong> Education heard and responded to thevoices <strong>of</strong> teachers who haven’t had enough time orsupport to translate these standards into classroompractice, allowing states to ask for additional timebefore using outcomes <strong>of</strong> new assessments based onthe CCSS to evaluate teachers.In this climate, it is more important than ever thatwe look at testing and its impacts in a more informedway. This analysis aims to illuminate with data whatmany educators know from experience, parents learnfrom their children, and students feel firsthand—testing has spiraled out <strong>of</strong> control, and the relatedcosts are unacceptably high and are taking theireducational toll on students, teachers, principals andschools. Our study examines that very concern: thetotal cost <strong>of</strong> testing, including the direct (financial)costs <strong>of</strong> tests and the cost <strong>of</strong> instructional time lostto testing and test preparation associated with twodistricts’ testing schedules. This is an illustration <strong>of</strong>the kind <strong>of</strong> information we as pr<strong>of</strong>essionals and asa public need in order to ask and answer the rightquestions about the role <strong>of</strong> testing in our schools.How much do we spend? What do we get in return?What do we give up as a consequence? What are thebest ways to use precious instructional time and resourcesso all our students have the content, criticalthinking, problem-solving and persistence they needto succeed in school and in life? <strong>Testing</strong> <strong>More</strong>, <strong>Teaching</strong><strong>Less</strong> doesn’t provide all the answers. But it makesclear that the current testing environment is inhospitableto the knowledge, skills, and abilities we aspireto develop in students—and it <strong>of</strong>fers some concreterecommendations for correcting the dangerouscourse we are on.I would like to gratefully acknowledge thoughtfulreviews <strong>of</strong> an earlier version <strong>of</strong> this analysisfrom Jesse Rothstein <strong>of</strong> the University <strong>of</strong> California-Berkeley, Elena Silva <strong>of</strong> the Carnegie Foundation forthe Advancement <strong>of</strong> <strong>Teaching</strong>, and a reviewer whoprefers to remain anonymous.Randi WeingartenPresident, <strong>American</strong> <strong>Federation</strong> <strong>of</strong> <strong>Teachers</strong>July 20132 <strong>American</strong> <strong>Federation</strong> <strong>of</strong> <strong>Teachers</strong>
AbstractBased on a detailed grade-by-grade analysis <strong>of</strong> the testing calendars fortwo mid-size urban school districts, and the applied research from otherstudies <strong>of</strong> state mandated testing, our study found that the time studentsspend taking tests ranged from 20 to 50 hours per year in heavily tested grades.In addition, students can spend 60 to more than 110 hours per year in test prepin high-stakes testing grades. Including the cost <strong>of</strong> lost instructional time (at$6.15 per hour, equivalent to the per-student cost <strong>of</strong> adding one hour to theschool day), the estimated annual testing cost per pupil ranged from $700 tomore than $1,000 per pupil in several grades that had the most testing. If testingwere abandoned altogether, one school district in this study could add from 20to 40 minutes <strong>of</strong> instruction to each school day for most grades. The other schooldistrict would be able to add almost an entire class period to the school day forgrades 6-11. Additionally, in most grades, more than $100 per test-taker couldbe reallocated to purchase instructional programs, technology or to buy bettertests. Cutting testing time and costs in half still would yield significant gains tothe instructional day, and free up enough dollars in the budget that could fundtests that are better aligned to the standards and produce useful information forteachers, students and parents.<strong>Testing</strong> <strong>More</strong>, <strong>Teaching</strong> <strong>Less</strong> 3
Executive SummaryOBJECTIVESStudents are engaged in various types <strong>of</strong> testingeach year. The purpose and quality <strong>of</strong> such testing,the time spent taking and administering tests andthe usefulness <strong>of</strong> the results are ongoing topics <strong>of</strong>discussion among students, parents, educators andpolicymakers. Advocates for more testing implicitlyassume that more testing improves student achievementand that the benefits <strong>of</strong> more testing outweighthe additional costs, which they typically view onlyas the money paid to testing companies. Opponents<strong>of</strong> excessive testing claim that schools have sacrificedlearning time in favor <strong>of</strong> testing and test preparation,reduced learning time for non-test subjects,and focused time and attention on the “bubble kids”(students whose scores are clustered right below thepr<strong>of</strong>iciency cut score) at the expense <strong>of</strong> developingevery student’s full potential.To get a complete picture <strong>of</strong> the resources nowdevoted to testing in the United States, our studydocuments the types <strong>of</strong> assessments, the number<strong>of</strong> assessments and the number <strong>of</strong> times each testis administered annually, as well as the associatedtest-taking time and the direct budgetary cost <strong>of</strong>such tests. Our analysis encourages policymakers tojudge the benefits <strong>of</strong> current testing policy relative tobudgetary costs and alternative uses <strong>of</strong> student andteacher time, such as more instruction and more attentionto non-test subjects.Although more comprehensive than most otherstudies <strong>of</strong> the cost <strong>of</strong> testing, our study excludesmany testing costs that could have a significantimpact, such as a teacher’s non-classroom timepreparing for testing, the cost <strong>of</strong> test prep materials,the extra hours spent with special needs and ELL(English language learner) students due to testing accommodations,the cost <strong>of</strong> tests specifically administeredonly to special education and ELL students, lostservices from reading and special education teacherswhen they administer or proctor tests, cost <strong>of</strong>data/instructional coaches and teacher time lost todata reporting and analysis activities, hardware andtechnology costs attributable to testing, time spenton assessing and grading homework and classroomtests, and the costs <strong>of</strong> tutoring and summer schoollinked to high-stakes testing. Outside the scope <strong>of</strong>our study are the hours students spend taking quizzesor teacher-made tests, and the time teachersspend grading tests and homework. In Chicago, forexample, teachers report spending 32 minutes perday, “assessing students’ work during contractualhours” and 22 minutes a day “giving curriculumsubject assessments (tests, quizzes, etc.)” (Bruno etal., 2012).METHODOLOGYTo gather this information, the AFT collected theassessment inventory and testing calendar fromtwo, medium-size urban school districts with thepseudonyms Midwestern School District and EasternSchool District. In both districts, the AFT had verygood access to the assessment inventories as well astime and cost data. Unlike a case study, a two-districtanalysis recognizes variety in assessment practices.One district has more testing than the other and thestates in which they are located also reflect a big differencein state-mandated testing time and test quality.Although neither state was among the highest orlowest spending, one state spent twice as much onstate testing as the other (Chingos, 2012).The direct budget costs <strong>of</strong> the tests and logisticalsupport for testing were estimated, as well as thetime needed for students to take and prepare for thetests. Time and cost data were provided in districtdocumentation or came from Internet searches<strong>of</strong> commercial test publishers. The information ispresented by grade because the cost and lost instructionaltime vary greatly by grade; students and teachersin high-stakes testing grades lose the most time totest-taking and test preparation.Our study used a detailed researched-basedrubric for estimating instructional time lost to testpreparation (narrowly defined as giving practicetests and teaching test-taking strategies, but does notcount activities aligning content to the test such asreview, reteaching or tutoring). The narrow definition<strong>of</strong> test prep yielded conservative estimates relative toother studies <strong>of</strong> test prep.<strong>Testing</strong> <strong>More</strong>, <strong>Teaching</strong> <strong>Less</strong> 5
FINDINGSTests in the United States can be categorized intoseveral groups, including:• Large-scale standardized tests, usually summative,mandated by states primarily for accountabilitypurposes;• Interim/benchmarking tests used by districtsto improve performance <strong>of</strong> low-achievingstudents on the state-mandated tests throughtargeted instructional interventions, review andreteaching, regrouping students, identifyingstudents for tutoring and sharing results withstudents; and• A variety <strong>of</strong> locally determined tests, includingsummative, diagnostic and miscellaneoustests, or formative assessment techniques byteachers.Based on a detailed grade-by-grade analysis <strong>of</strong> thedirect costs and the time costs <strong>of</strong> testing in the twoschool districts’ assessment inventories, our studyfound:• Pervasive testing. One <strong>of</strong> the districts in ourstudy had 14 different assessments given toall students at least once a year in at least onegrade. Some assessments are administered forseveral subjects multiple times a year resultingin 34 different test administrations. The otherdistrict’s testing inventory had 12 different assessmentsbut 47 separate administrations overthe course <strong>of</strong> the year.• Test-taking time. Students in one district ingrades 3-10 spent approximately 15 hours ormore per year (about three full school days)taking state-mandated tests, interim/benchmarkingtests and other district academicassessments. Students in the other district ingrades 6-11 devoted up to 55 hours per yearto taking tests (about two full weeks <strong>of</strong> theschool year).• Time for administrative tasks with students.This includes giving directions, passing out testbooklets and answer sheets, reading directionson the computer, etc., before and after eachtesting session. These administrative tasks withstudents took more than five hours annually—one full school day—in one <strong>of</strong> the districts. Inthe other district, administrative tasks with studentsused up more than 10 hours <strong>of</strong> the schoolyear—two full school days—in the most highlytested grades.• Direct budgetary costs. Several national studiesshow that the direct cost <strong>of</strong> purchasing,licensing and scoring state-mandated tests isaround $25 per test-taker, and the annual cost<strong>of</strong> interim/benchmark testing is about $20 pertest-taker. But when considering the cost <strong>of</strong> allthe tests in a school district’s inventory, thedirect budgetary costs <strong>of</strong> the district testingprogram ranged from $50 per test-taker in onedistrict to over $100 per test-taker in the otherfor grades 2-11. The direct budgetary cost <strong>of</strong>state testing represents less than 1 percent <strong>of</strong>K-12 per-pupil education spending. Nationally,education spending averages about $11,000per pupil and reaches $20,000 per pupil in thehighest-spending states.• Logistics and administrative costs. Estimatedat $2 per student per hour <strong>of</strong> testing (up to $80per year for students in several grades in onedistrict), these are costs associated with managingpallets <strong>of</strong> testing boxes; verifying andaffixing data labels to test booklets, which couldinclude three versions <strong>of</strong> the test at each gradelevel; and placing testing materials in securelocations before and after each round <strong>of</strong> testingto prevent cheating. After testing is completed,each school has to collect booklets, pack themand ship them <strong>of</strong>f for scoring.• Test preparation time. The detailed researched-basedrubric narrowly defined “testpreparation” to include giving practice testsand teaching test-taking strategies, but does notcount review, reteaching or tutoring. Studentsin grades 3-8 in one district spent at least 80hours per year (approximately 16 full schooldays) preparing for state-mandated tests, the6 <strong>American</strong> <strong>Federation</strong> <strong>of</strong> <strong>Teachers</strong>
associated interim/benchmarking tests and all<strong>of</strong> the other district assessments. In the otherdistrict, students in grades 6-11 devoted 100hours or more per year on test prep (approximatelyone full month <strong>of</strong> the school year).• The cost <strong>of</strong> testing and lost instructional time.If school districts lengthen the school day orthe school year to regain the instructional timelost to testing, the direct budget costs <strong>of</strong> testingare far from inconsequential. Adding one hourto the school day costs about $6.15 per student.In one district, the annual cost <strong>of</strong> testing perpupil in grades 3-8, including the cost <strong>of</strong> lostinstructional time, was about $700—approximately7 percent <strong>of</strong> per-pupil expenditures inthe typical state. In the other district, the cost<strong>of</strong> testing in grades 6-11 exceeded $1,100 perstudent—about 11 percent <strong>of</strong> per-pupil expendituresin the typical state.• Alternate uses <strong>of</strong> testing time and costs.Redirecting time and money devoted to testingto other uses would provide a lot more time forinstruction—possibly including partial restoration<strong>of</strong> art, music and PE programs, duringthe existing school day. Cutting test prep andtesting time in half could still restore significantminutes for instruction and would free upfunding that could be used to purchase bettertests, such as the Common Core assessments.RECOMMENDATIONS• <strong>Testing</strong> for accountability. Parents, teachers,principals, school districts, states and otherstakeholders should be able to access theoutcomes <strong>of</strong> standardized testing, but simple“snapshot” test and accountability measuresshould be no substitute for high-quality researchand sophisticated evaluations <strong>of</strong> schoolsand educators.• Proper purpose <strong>of</strong> testing. Tests should beused to improve instruction for students and tohelp improve schools—not to sanction, punishor close schools. Achievement tests should bejust one <strong>of</strong> multiple measures used in a schoolevaluation system. Students should not taketests for the sole purpose <strong>of</strong> evaluating educators’performance.• State monitoring <strong>of</strong> the testing burden. Statesand districts should conduct reviews <strong>of</strong> the cost<strong>of</strong> the entire inventory <strong>of</strong> assessments used intypical school districts, including test preparationtime and lost instructional time.• Assessment literacy for educators. Providesupport to improve the assessment literacy <strong>of</strong>educators needed for developing and usingclassroom (formative) assessments and theproper use and interpretation <strong>of</strong> formal assessments,and then hold educators accountablefor using best assessment practices. Thisincludes teachers, as well as school, district andstate administrators.• Streamline testing with teacher input. Schooldistricts should review their entire assessmentinventory with teachers to determine the usefulness<strong>of</strong> the assessments for improving instruction;unnecessary testing that doesn’t supportimproved instruction should be eliminated.• Interim/benchmark testing. Eliminate orsharply reduce this form <strong>of</strong> testing to no morethan one administration per year. Most educatorsand many experts believe that interim/benchmark tests are not useful for improving instruction,and instead are ineffective low-qualitytests, not aligned well to state standards presentedin an overly elaborate, confusing manner;and used primarily to identify “bubble kids”.• Common Core assessments. Common Corestates should adopt the “next generation” CommonCore assessments designed by PARCC(Partnership for Assessment <strong>of</strong> Readiness forCollege and Careers) or SBAC (Smarter BalancedAssessment Consortium) as the onlystate-mandated assessments and eliminateall duplicative out-<strong>of</strong>-data state assessments,including the old recycled state tests claimingto be aligned to the Common Core.<strong>Testing</strong> <strong>More</strong>, <strong>Teaching</strong> <strong>Less</strong> 7
• Moratorium on high-stakes consequences.Adopt a moratorium on the high-stakes consequencesattached to all forms <strong>of</strong> state-mandatedtesting, including the Common Core assessments.<strong>Teachers</strong> need to reduce time spent ontest prep and benchmark testing aligned to theold tests and instead focus their time on acquiringthe skills and knowledge necessary to implementthe Common Core standards in a threatfreeenvironment.• Accelerate the development <strong>of</strong> embeddedand rapid assessments. Assessments embeddedin instructional materials, using emergingtechnology and research on learning, havethe potential to inform instruction better thantime-consuming accountability tests througha balance <strong>of</strong> fine-grained classroom diagnostictests, challenging tasks and projects in whichstudents work through individual topics at theirown pace, taking brief tests <strong>of</strong> their masteryalong the way.8 <strong>American</strong> <strong>Federation</strong> <strong>of</strong> <strong>Teachers</strong>
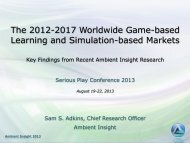
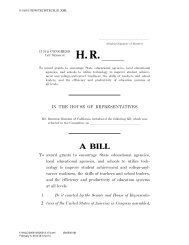
The <strong>Testing</strong> LandscapeState-mandated testing exploded in the 1990swhen students in selected grades (usually one inelementary, one in middle school and one in highschool) were tested once a year to measure schoolperformance with respect to the nascent “standards”movement. Some research found that the first statesto implement a standards-based reform with statemandatedtesting improved student achievementfaster than non-implementing states (Hanushek andRaymond, 2005). <strong>Teachers</strong> have always supportedhigher standards in large percentages, but they neverfound the end-<strong>of</strong>-year state tests useful for the specificpurpose <strong>of</strong> improving instruction on a day-to-daybasis, preferring instead the formative techniquesand diagnostic tests.The No Child Left Behind (NCLB) law, enactedin 2002, and subsequent federal mandates broughtabout a significant increase in accountability testingby requiring the testing <strong>of</strong> all students in grades3-8 and some grades in high school. The federallymandated tests are used to sanction schools and, inextreme cases, to close some schools or convert themto charter schools. The federal Race to the Top (RTTT)program further fueled high-stakes testing by requiringteacher evaluations to be based in part on studentachievement measured by test scores, as well as onother measures not related to testing. Subsequently,the federal government allowed states to receivewaivers on some <strong>of</strong> NCLB’s test-based sanctions ifthey implemented different test-based sanctions andenacted prescriptive teacher evaluation systems. Thefederal School Improvement Grant (SIG) program alsothreatens schools and staff with job loss, conversion tocharter schools or closure based on student performanceon state and federally mandated tests.Schools use many types <strong>of</strong> assessments. Some arerequired by the state; others are chosen or developedat the district level. Some <strong>of</strong> a district’s student assessmentinventory is linked to federal laws and regulationsother than NCLB. In many respects, given theubiquitous emphasis on data reporting and analysis,nearly every assessment has become a high-stakesassessment with consequences for students, teachersand schools.State-mandated summative tests are designed toassess whether students are meeting state standardsin a given year. Tests are generally conducted in thespring as a means <strong>of</strong> “summing up” what studentsknow that year, which is why these tests are referredto as summative assessments. The results <strong>of</strong> thesetests are tied to the state’s accountability system asmandated by NCLB. When linked to prior-year summativetest scores, student progress can be measured,which provides some information about howwell schools or teachers did in the current testingyear, the true measure <strong>of</strong> school effectiveness. Unfortunately,many states and the federal governmentsanction schools for a single summative test score—a measure <strong>of</strong> student achievement but not schoolor teacher effectiveness—rather than the students’progress, which would show the school’s contributionto learning over the course <strong>of</strong> the school year.Both Midwestern School District (Table 1A) andEastern School District (Table 1B) are implementingnew state end-<strong>of</strong>-course testing in high school. NCLBrequires testing in only one high school grade, butteacher evaluation requirements and tougher careerandcollege-readiness standards in the RTTT andNCLB waiver requirements have supported the pushtoward end-<strong>of</strong>-course assessments.Eastern District students may take as many as 10state-mandated end-<strong>of</strong>-course assessments (algebra1, algebra 2, geometry, literature, English composition,biology, chemistry, U.S. history, world history,civics and government) by the time they finish highschool. Midwestern District students may take asmany as seven state-mandated end-<strong>of</strong>-course assessments(algebra 1, advanced algebra, geometry,English 9, English 10, <strong>American</strong> history, and government).Next-generation summative assessments. ThePARCC- and SBAC-developed Common Core assessments,scheduled for full implementation in2014-15, represent the next generation <strong>of</strong> summativetests. However, they still provide only a snapshot <strong>of</strong>student achievement at a specific point in time andwill be used primarily for accountability purposes.Both the PARCC and the SBAC assessment consortia<strong>Testing</strong> <strong>More</strong>, <strong>Teaching</strong> <strong>Less</strong> 9
Table 1AAssessment Inventory, Midwestern School DistrictMinutes Per Test, Number <strong>of</strong> Annual Administrations and Total Annual <strong>Testing</strong> MinutesLocal Assessments Grade Minutes Annual MinutesDIAL Pre-K Developmental indicators 30 2x 60NNAT2 – Naglieri Nonverbal K,2,6,8 Ability 30 1x 30DRA K-6 Developmental reading 60-70 3x 180-210Stanford Achievement Test K Reading, math 90 1x 901 Reading, math 150 2x 3002 Reading, math 177 2x 35421st Century Skills Test 5,8 Tech literacy 60 2x 1206-7 Tech literacy 60 1x 60ACT EXPLORE 7-8 ACT prep 165 1x 165ACT PLAN 9-10 ACT prep 175 1x 175ACT 11 ACT prep 235 1x 235NOCTI 12 Career/technical EOC 300 1x 300Interim/Benchmark TestsACUITY 3-6 Communication arts, math 180 3x 5407-8 Communication arts, math 180 1x 1805,8 Science 90 2x 180Mock End-<strong>of</strong>-Course 9-12 Algebra, Eng., bio., govt. 50 2x 100Scantron Performance Series 7-11 Communication arts, math 60 2x 120State-Mandated TestsGrade 3-8 Assessments 3-8 Communication arts, math 270 1x 2705,8 Science 120 1x 120End-<strong>of</strong>-Course Assessments 9-10 Communication arts 90 1x 909-11 Math 90 1x 909 Science 180 1x 1809,10 Social studies 90 1x 90are developing computer-based testing systems thatwill be accompanied by benchmarking tools and usemore innovative types <strong>of</strong> questions, online delivery,automated and artificial-intelligence powered scoringengines, and immediate Web-based reporting <strong>of</strong>results. Both Midwestern and Eastern school districtswill fully implement the Common Core assessmentsin 2014-15.Interim/Benchmarking Assessments. In additionto state-mandated summative testing, almost alldistricts now have some type <strong>of</strong> interim or benchmarkingassessments, which are essentially duplicativesummative assessments, to measure studentgrowth toward passing the state-mandated test overthe course <strong>of</strong> a school year (Heppen et al., 2011).Unlike the state-mandated summative assessments,results from these assessments are available duringthe school year and are believed to help improvescores on state-mandated tests when used to targetinstructional interventions, to review and reteach,to regroup students, to identify students for tutoring,and to share results with students. A survey <strong>of</strong> curriculumcoordinators and research directors revealed10 <strong>American</strong> <strong>Federation</strong> <strong>of</strong> <strong>Teachers</strong>
Table 1BAssessment Inventory, Midwestern School DistrictMinutes Per Test, Number <strong>of</strong> Annual Administrations and Total Annual <strong>Testing</strong> MinutesLocal Assessments Grade Minutes Annual MinutesKindergarten Test K Developmental indicators 30 3x 90DIBELS K-3 Reading diagnostic 10 3x 304-5 10 1x 10SRI (Scholastic) 6-9 Reading 30 3x 90TerraNova K-1 Reading, math 120 1x 1202 130 1x 130Curriculum-Based Assessments (CBA) 2-3 Math 50 3x 1506-12 Math 50 2x 100Reading 75 2x 150Science 110 2x 220Social studies 110 3x 330PSAT 10,11 Preliminary SAT 135 1x 135NOCTI 12 Career/technical EOC 300 1x 300GRADE (Pearson) 3-11 Literacy (federal grant) 90 3x 270Interim/Benchmark TestsCurriculum-Based Assessments (CBA) 3-5 Math 50 4x 200Classroom Diagnostic (CDT) 6-11 Reading 75 5x 375State-Mandated TestsMath, reading, science 270 3x 810Grades 3-8, 11 3-8 Math, reading 395 1x 3954, 8 Science 160 1x 1605, 8 Writing 330 1x 33011 Math, reading, writing,scienceEnd-<strong>of</strong>-Course* 9-12 Math, reading, socialstudies, science*Assumes students take two end-<strong>of</strong>-course assessments per year for four years.990 1x 990120 2x 240that while nearly all respondents believed that thepurpose <strong>of</strong> interim assessments was to guide andimprove instruction, 90 percent <strong>of</strong> the same respondentsbelieved they measure progress toward theend-<strong>of</strong>-year state test, 80 percent believed they werealso diagnostic and 90 percent thought they wereformative (Heppen et al., 2011).Despite the ubiquity <strong>of</strong> interim/benchmark testing,research on these tests has failed to demonstratea positive and statistically significant impact onimproving student achievement on end-<strong>of</strong>-year tests,which is the tests sole purpose. 1 The studies that havefound some positive impacts focused more on datause and accessibility.” 2 It is not clear whether the1. A national study conducted by Mathematica Policy Research (Furgeson et al., 2012) <strong>of</strong> 22 Charter Management Organizations (CMOs) found that “frequent formativestudent assessments” (referring to interim/benchmarking assessments) had no impact on positive achievement impacts among CMOs. In a study <strong>of</strong> Formative Assessments<strong>of</strong> Student Thinking in Reading (FAST-R), teachers in Boston were given test data aligned to the state assessments every three to 12 weeks, and data coaches helpedteachers interpret and use the data. A two-year evaluation <strong>of</strong> 21 elementary schools found small but statistically insignificant effects (Quint et al., 2008). A one-year study<strong>of</strong> benchmark assessments in 22 Massachusetts middle schools also showed no effect (Henderson et al., 2007). May and Robinson (2007) studied a benchmark assessmentprogram used in high schools to prepare students for the Ohio Graduation Tests and found no statistically significant impact from the benchmarking for students takingthe graduation test for the first time.<strong>Testing</strong> <strong>More</strong>, <strong>Teaching</strong> <strong>Less</strong> 11
esults <strong>of</strong> those studies are due to the benchmarkingtests, the practice effects <strong>of</strong> repeated test-taking, orthe improved data literacy <strong>of</strong> teachers. New Leadersfor New Schools (Marshall et al., 2006) identifiedseveral reasons why interim assessments may notproduce significant achievement gains:• Poor alignment with state standards, tests orpacing guides;• Results presented in an overly elaborate, confusingmanner;• Results used only to focus on bubble kids;• Not administered frequently enough to have animpact on instruction;• Scored externally with teachers having no investmentin the results;• Too short and don’t give teachers enough detaileddata; and• <strong>Teachers</strong> think tests will be used to blame them.Both Midwestern School District and EasternSchool District layered on an array <strong>of</strong> interim/benchmarkingtests administered several times a year:Midwestern School District: ACUITY is a statetailoredcommercial benchmarking test administeredthree times annually. The ScantronPerformance Series, given twice annually, is alsoused for benchmarking in grades 7-11. MidwesternDistrict has “mock” end-<strong>of</strong>-course testingtwice a year in high school.Eastern School District: The state-developedClassroom Diagnostic Tool (CDT), administeredthree times annually, is used to predict outcomeson the state-mandated test in grades 6-11and is also used for benchmarking to the stateend-<strong>of</strong>-course tests. For benchmarking purposesin grades 3-5, the district used a modified version<strong>of</strong> the district-developed Curriculum-BasedAssessments, which is administered four times ayear in math and five times a year in reading.Classroom-based assessments. These assessmentsare used during teaching and are embedded ininstruction; they are a tool that helps teachers adjusttheir instruction in the moment to meet the needs<strong>of</strong> students. This isn’t just about giving a quiz at theend <strong>of</strong> class, but it’s also questioning and observingstudents on performance tasks. Results are receivedinstantly, which allows teachers to adjust theirinstruction immediately. <strong>Teachers</strong> also use tests,quizzes and homework to assess student learning.<strong>Teachers</strong> surveyed in Chicago spent 22 minutes aday giving students curriculum subject assessments(tests, quizzes, etc.) and another 32 minutes a dayassessing students’ work during contractual hours(Bruno, Ashby and Manzo, 2012).Embedded and rapid assessments. Embeddedassessments could be thought <strong>of</strong> as the “next generation”formative assessment. Assessments embeddedin instructional materials using emerging technologyand research on learning aims to inform instructionthrough a balance <strong>of</strong> fine-grained classroom diagnostictests, challenging tasks and projects in whichstudents work through individual topics at theirown pace, taking brief tests <strong>of</strong> their mastery alongthe way, with feedback delivered to the student andteacher on individual processes or misconceptionsthat cause the student problems (Gordon Commission,2013). They are now used in some computerbasedmath programs such as Carnegie Learning,Khan Academy and Agile Mind, and in Scholastic’sREAD 180 and Lexia Reading. Both Eastern and Midwesternschool districts already use READ 180, andEastern School District also uses a Carnegie Learningprogram.Randomized and quasi-experimental researchindicate that “rapid formative assessment systems”effectively raise student achievement (Nunneryet al., 2006; Ross et al., 2004; Ysseldyke and Bolt,2007; Ysseldyke and Tardrew, 2007) and are a moreefficient use <strong>of</strong> resources than a range <strong>of</strong> alternativeinterventions such as a longer school day, value-2. A multidistrict, multistate quasi-experimental study <strong>of</strong> the first year <strong>of</strong> a data-driven reform strategy (Carlson, Borman, Robinson, 2011) found a small positive impacton math scores but no statistically significant impact on reading scores. However, subsequent research on all four years <strong>of</strong> the same program (Slavin et al., 2013) revealedthat impacts on elementary reading and math were never statistically significant in any <strong>of</strong> the four years except fourth-year reading. In middle school, significant positiveeffects were limited to the first two years in reading and only the first year in math. In a value-added study <strong>of</strong> four districts (102 principals and 593 teachers), an index <strong>of</strong>teacher general data use had a positive impact on middle-grades math and elementary-grades reading, but no impact on middle school reading or elementary math (Fariaet al., 2012). An index <strong>of</strong> principal general data use had a positive impact on middle-grades math but no impact on middle-grades reading or at the elementary level foreither subject.12 <strong>American</strong> <strong>Federation</strong> <strong>of</strong> <strong>Teachers</strong>
Midwestern Public Schools<strong>Testing</strong> Calendar<strong>Testing</strong> <strong>More</strong>, <strong>Teaching</strong> <strong>Less</strong> 13
14 <strong>American</strong> <strong>Federation</strong> <strong>of</strong> <strong>Teachers</strong>Eastern School District<strong>Testing</strong> Calendar
added teacher assessment, class size reduction, orfull-day kindergarten (Yeh, 2008; Yeh, 2010). Therapid assessment systems in these studies havestudents choose books based on their readinglevels and then they take a comprehension quizafter reading each book. In math, each student receivesindividualized math problem sets daily, andstudents score their answers using a device in theclassroom. The rapid assessment system imposes aminimal burden on teachers because students scantheir own bubble sheets, s<strong>of</strong>tware is used to scoreeach assessment, and reports are available to teachersand administrators electronically.Diagnostic <strong>Testing</strong>. Districts use various assessmentsto ascertain each student’s strengths andweaknesses to adjust curricula and instruction tomeet student needs. Some states require districtsto administer assessments to students on basic literacy.Some diagnostic assessments are given to allstudents in the early grades but only to low-scoringstudents in subsequent grades.Midwestern School District: The DIAL assessment<strong>of</strong> developmental indicators is given toall pre-K students; the Naglieri nonverbal abilitytest is administered in kindergarten andgrades 2, 6 and 8. The Developmental ReadingAssessment (DRA) is administered threetimes annually in kindergarten through grade6. Both the DIAL and the DRA are administeredand scored by teachers. Although strictlyspeaking not a diagnostic test, the StanfordAchievement Test is given once a year tokindergartners and twice annually to studentsin grades 1-2—those grades not subject tomandated state testing.Eastern School District: A kindergarten assessment<strong>of</strong> developmental indicators isindividually administered to each studentthree times annually followed by the DIBELSlanguage assessment, also administered threetimes a year, to all students in grades K-3 andonce annually in grades 4-5. Technically nota diagnostic test, the TerraNova achievementtest is given annually in grades K-2.College Entrance Exams and Advanced Placement.College-bound students are <strong>of</strong>ten interestedin taking Advanced Placement or InternationalBaccalaureate courses, and this course work hasnational tests. Midwestern District has a multiyearprogram to prepare students for the college entranceexamination. The EXPLORE (Grades 7-8),PLAN (Grades 9-10) and ACT District Choice <strong>Testing</strong>are pre-ACT tests that project ACT scores as wellas data regarding concepts and skills that studentscan improve to help progressively increase theirperformance. Most students in the district participatein PLAN and EXPLORE. In Eastern District,students in grades 10 and 11 take the PreliminarySAT (PSAT).Other Academic Assessments. Districts maychoose, at their discretion, to administer otherassessments, although these locally chosen assessmentsmay be related to a federal or state mandate.Midwestern School District, for example, adoptedthe 21st Century Skills Assessment for its NCLBTechnology Literacy measure. This test is given tostudents in grades 5 and 8 twice a year; in grades6-7 it is given once in the spring.Eastern School District has implemented an extensivedistrict-developed Curriculum-Based Assessments(CBA) system, which is administered at leasttwice yearly. The CBAs are “standardized” acrossthe district in grades 2-12, but they are teacher-developedand teacher-scored. The CBAs overlap withstate-mandated testing, and in grades 3-5 modifiedversions <strong>of</strong> the CBAs (administered four times a yearin math and five times a year in reading) are used asinterim/benchmarking tests. The GRADE (Pearson)literacy assessment adds a fourth layer <strong>of</strong> tests (inaddition to state tests, benchmarking and the CBAs).The 90-minute test, which is given three times ayear, is a requirement for participating in a federallyfunded literacy program.<strong>Testing</strong> <strong>More</strong>, <strong>Teaching</strong> <strong>Less</strong> 15
Time Committed to <strong>Testing</strong>Time for Students to Read and Respond to Questions.Most students in Midwestern School Districtspent approximately 15 hours or more per year onstate-mandated tests, interim/benchmarking testsand other district assessments (Figure 1A). The timecommitted to testing in Eastern School District—where students in grades 6-11 spent up to 55 hoursper year on state-mandated, benchmarking tests anddistrict assessments (Figure 1B)—was substantiallyhigher than in Midwestern School District.Midwestern School District: Fifth- and eighthgradestudents spent the most time on tests(more than 20 hours per pupil); students in K-2and grades 11-12 spent the least time (five to10 hours per pupil). The state-mandated testsexceeded five hours only in the fifth, eighth andninth grades, in part because the state tests useonly multiple-choice questions. Many states addshort-answer or extended-response questionsthat demonstrate performance but require costlygrading by hand. The interim/benchmarkingtests are more time-consuming than the statemandatedtests.Eastern School District: Eighth- and 11th-gradestudents spent the most time on tests (50 to 55hours per year) and K-2 students the least (aboutfive hours per year). The district tests are themost time-consuming <strong>of</strong> all <strong>of</strong> the tests examined,amounting for more than 30 hours peryear in grades 6-11. Interim/benchmarking testsexceeded nine hours per year in grades 3-5 andexceeded 13 hours per year in grades 6-11.Time for Administrative Tasks with Students. Inaddition to the time students are given to read testitems and answer questions, students sit in testingsites while administrative tasks are being performed(e.g., receiving directions, as test booklets and answersheets are passed out, reading directions on thecomputer, etc.) before and after each testing session.The widely used MAP interim/benchmark test, for example,allows about an hour per subject for studentsto read and answer questions, but MAP wants districtsto reserve 75 minutes to allow for administrative taskswith students (NWEA, 2006).In Pennsylvania, state <strong>of</strong>ficials recommend thatdistrict test administrators add 20 minutes for eachtesting session to account for administrative tasks withstudents (Pennsylvania Department <strong>of</strong> Education,2011). For example, the three math testing sessionsadd up to 185 minutes, but test administrators needto schedule another 60 minutes (three sessions at 20minutes each) for administrative tasks with students.Over all four subjects, the 12 testing sessions add16 <strong>American</strong> <strong>Federation</strong> <strong>of</strong> <strong>Teachers</strong>
approximately four hours to student testing time toaccount for administrative tasks with students—nearlya full day <strong>of</strong> instruction out <strong>of</strong> each school year.Online testing may require more time for administrativetasks with students even though test booklets,pencils and scoring sheets are not used. Pennsylvania’sinterim/benchmarking test, the ClassroomDiagnostic Tool (CDT), is an online computer adaptivetest. Before taking the CDT, students take onlineassessment tutorials (nine to 15 minutes) for eachcourse tested, and they are allowed to repeat thetutorial as <strong>of</strong>ten as desired or needed. Pennsylvaniarecommends giving students at least 20 minutes to gothrough all questions in the online tools training foreach course tested.For estimates <strong>of</strong> time spent on testing, our studyadds 20 minutes per testing session for administrativetasks with students. Table 2 shows the hours per gradeconsumed for administrative tasks with students thatneed to be added to the time students spend readingand answering test questions. In Eastern School District,students in many grades spend two full schooldays just on getting directions, handing out test booklets,handing in answer sheets and similar administrativeactivities.Table 2Time for Administrative Tasks with StudentsState-Mandated, Benchmarking and Local TestsMidwestern DistrictEastern DistrictSessions Hours Sessions HoursK 6 2.0 2 0.71 11 3.7 5 1.72 12 4.0 5 1.73 15 5.0 18 6.04 15 5.0 20 6.75 21 7.0 22 7.36 16 5.3 29 9.77 17 5.7 29 9.78 23 7.7 35 11.79 16 5.3 25 8.310 14 4.7 27 9.011 12 4.0 41 13.712 7 2.3 19 6.3<strong>Testing</strong> <strong>More</strong>, <strong>Teaching</strong> <strong>Less</strong> 17
Direct Cost <strong>of</strong> TestsCosts <strong>of</strong> Test Development and Implementation.A recent Brookings Institution study (Chingos,2012) calculated that states spent roughly $27annually per student tested on contracts for statemandatedtests. In another highly regarded study(Topol et al., 2012), the Assessments SolutionsGroup (ASG) calculated higher state costs than theBrookings study. Finding that the average currentstate spending on mathematics and ELA summativeassessments required by NCLB is approximately$25 per student tested, additional state spendingon non-NCLB required assessments (additional assessments,subjects and grades) added roughly $10per pupil tested. In addition, the ASG study concludedthat school districts are spending an average<strong>of</strong> $15 to $20 or more per student on interim/benchmarking assessments. The combined costs<strong>of</strong> typical state and local spending on interim andsummative assessments in ELA and mathematicsare in the vicinity <strong>of</strong> $35 to $55 per pupil tested.Our study’s calculation <strong>of</strong> direct costs <strong>of</strong> testingapplies the ASG direct cost estimates for state-mandatedtests ($25 for ELA and math plus $10 for eachadditional test) and interim-benchmarking tests($20) to the testing regime in Midwestern and Easternschool districts. Additionally, our study addsthe direct costs <strong>of</strong> other local assessments based oncosts reported by the school districts or on pricescharged to school districts by the test developers onthe Internet. Appendix Tables A and B describe thegrade-by-grade, test-by-test direct cost estimates.Midwestern School District spent more than$80 per pupil tested in grades 5-6 and 8, butless than $60 per pupil in grades K-1 and 12.See Figure 2A.Eastern School District spent around $50 to$70 per pupil tested in most grades. Grade8 costs hit $80 per pupil, and grade 11 costssurpassed $100 per pupil tested. See Figure2B. CBAs are not included as a direct cost inFigure 2B because they are developed by districtteachers and staff rather than purchasedfrom a vendor.The direct cost <strong>of</strong> state testing in the two districtsrepresents less than 1 percent <strong>of</strong> per-pupil spendingon K-12 education. U.S. education spending averagesabout $11,000 per pupil in 2010-11 and reaches18 <strong>American</strong> <strong>Federation</strong> <strong>of</strong> <strong>Teachers</strong>
$20,000 per pupil in the highest-spending states(Hussar and Bailey, 2011; Cornman et al., 2013).Costs <strong>of</strong> Logistics and Administrative Support. Ina study <strong>of</strong> Wisconsin’s state-mandated testing program,Zellner, Frontier and Pheifer (2006) describethe cost <strong>of</strong> logistics and administrative support as,“a broad range <strong>of</strong> efforts from school staff. Pallets<strong>of</strong> testing boxes arrive in districts. Before testing,data labels generated by the state must be verifiedfor accuracy and affixed to individual test booklets.Booklets, which include three versions <strong>of</strong> the test ateach grade level, must be placed in secure locationsbefore and after each round <strong>of</strong> testing. After testingis completed, each school has to collect booklets,pack them, and ship them <strong>of</strong>f for scoring.”Table 3 uses the time data from the Wisconsinsurvey to reach an estimate <strong>of</strong> the costs <strong>of</strong> logisticsand administrative support for testing:The average school district in the Wisconsinsurvey enrolled 1,432 students. The state-mandatedtest applied to students in grades 3-8 and 10, orapproximately 800 students. Overall, the cost <strong>of</strong> logisticsand administration averaged $14 per studenttested and was composed <strong>of</strong> the following elements:• Parapr<strong>of</strong>essionals spent a per-district average<strong>of</strong> 102 hours engaged in duties ranging fromgiving tests to small groups <strong>of</strong> test-takers to assistingteachers with whole-class testing.• Administrators spent a per district average <strong>of</strong>62 hours engaged in a variety <strong>of</strong> testing-relatedtasks. Some schools had to modify schedulesand readjust staffing needs for the several daysneeded for testing.• Test administration required substitute teachersto proctor tests or supervise the classrooms<strong>of</strong> teachers who were engaged in other testingtasks. Across all districts in the sample, 1,021substitute teachers facilitated testing or supervisedstudents.• Guidance counselors spent 92 hours, a greaterpercentage <strong>of</strong> their time facilitating the testingprocess than any other group, suggesting amarked loss <strong>of</strong> guidance services.Wisconsin students spent between 4.75 to 8.66hours a year on the state-mandated tests. The $14<strong>Testing</strong> <strong>More</strong>, <strong>Teaching</strong> <strong>Less</strong> 19
Table 3Logistics and Administrative supportAverage District CostTotal Hours Hourly Cost Total Cost Pupils Tested Cost Per pupilSecretaries 91 $23 $2,093 800 $2.62Counselors/test coordinators 92 $40 $3,680 800 $4.57Parapr<strong>of</strong>essionals 102 $13 $1,326 800 $1.68Administrators 62 $51 $3,162 800 $3.96Substitute teachers 48 $20 $960 800 $1.20$14.03per student cost for approximately 7 hours <strong>of</strong> testingyields a logistics and administration cost estimate <strong>of</strong>$2 per student, per hour <strong>of</strong> testing.The logistics and test administration burdenis likely to be comparable, if not higher, for teststaken on computers. The computer-delivered MAPinterim/benchmarking test (NWEA, 2012), forexample, lists numerous administrative activitiesneeded before the test:• Train new proctors, new teachers and staff.• Ensure technical readiness <strong>of</strong> computer labs.• Have the latest version <strong>of</strong> the test-taking s<strong>of</strong>twareinstalled.• Create and submit class roster files two weeksbefore testing begins.• Download student data and test packages.• Distribute proctor and teacher usernames andpasswords.During the testing window, test results need tobe updated daily. After testing, end-<strong>of</strong>-term reportsneed to be ordered, downloaded and/or printed.20 <strong>American</strong> <strong>Federation</strong> <strong>of</strong> <strong>Teachers</strong>
Instructional Time Lostto Test PreparationTime spent on test preparation reduces instructionaltime by the same amount, giving rise to great concernamong educators and parents. Test-preparationtime has grown substantially with the expansion <strong>of</strong>state-mandated testing, the proliferation <strong>of</strong> interim/benchmarking assessments and the expansion <strong>of</strong>high-stakes consequences attached to test scores.Rubric for Measuring Classroom Time spent onTest Preparation. Our study estimates the amount <strong>of</strong>time teachers spend with students on test preparationusing the rubric in Table 4, compiled mainly from twostudies <strong>of</strong> state-mandated testing described in theAppendix—one by the Center for the Study <strong>of</strong> <strong>Testing</strong>,Evaluation, and Educational Policy (Pedulla et al.,2003) and one by the Consortium on Chicago SchoolResearch (Tepper Jacob and Stone, 2005).The research on which the rubric is based narrowlydefined test prep as giving practice tests and teachingtest-taking strategies but does not count activitiesaligning content to the test such as review, reteachingor tutoring. The research shows that teachers preparedtheir students for testing even in the absence <strong>of</strong> highstakesaccountability, but that high-stakes considerablyincreased test-prep time. Further, our study assumesthat teachers prepare students for the interim/benchmarking assessments as if they were low-stakestests rather than treating them as part <strong>of</strong> the practicetesting for the high-stakes assessments. The testpreprubric is based on studies that predate interim/benchmark testing. As with the other low-stakes tests,and unlike test prep, the interim/benchmarking testsare part <strong>of</strong> district data systems and used to allocateinstructional time and resources to improve statemandatedtesting outcomes.The rubric assumes at least two hours <strong>of</strong> classroomtest prep for any kind <strong>of</strong> test except for individuallyadministered one teacher-one student diagnostictests, such as DIBELS. In low-stakes situations in bothtest-prep studies reviewed, teachers reported spendingabout 10 hours annually on test prep for a testgiven once a year covering two or more subjects. Therubric assumes five hours for a one-subject test givenonce a year.High-stakes for students or schools increasedtest prep to 30 hours per year for elementary teachersin high-stakes grades and to 20 hours per yearfor high school teachers in high-stakes classrooms.The Center for the Study <strong>of</strong> <strong>Testing</strong>, Evaluation, andEducational Policy (Pedulla et al., 2003) reportedhigh school teachers spending less time on testprep. The rubrics in Table 4 apply to average schoolsbut the Consortium on Chicago School Research(Tepper Jacob and Stone, 2005) found that teachersin low-performing schools with high percentages <strong>of</strong>minority students reported more than 35 hours <strong>of</strong>test prep.The rubric applies to each test administration regardless<strong>of</strong> the length <strong>of</strong> the test, but test-prep timeestimates vary with the number <strong>of</strong> subjects tested.When a test was given multiple times a year, ourstudy assumes that the first administration <strong>of</strong> thetest involved minimal preparation (two hours) becausethere are no consequences attached to poorTable 4Rubric for Estimating ClassroomTest-Preparation TimeDiagnostic tests (individuallyadministered)Diagnostic tests (group administered) 2Pretests (first test, if test givenmultiple times a year)Low-stakes test, low-stakes grades(one subject)Low-stakes test, low-stakes grades(two subjects)Low-stakes test, high-stakes grades(elementary)Low-stakes test, high-stakes grades(high school)High-stakes tests, high-stakes grades(elementary)High-stakes tests, high-stakes grades(high school)Hours Per TestAdministration0251015103020<strong>Testing</strong> <strong>More</strong>, <strong>Teaching</strong> <strong>Less</strong> 21
aseline student performance (and perhaps evenmotivation for poor student performance in orderto inflate test score gains in subsequent test administrations).Interim/benchmark tests were treatedas low-stakes tests but were almost always given inhigh-stakes grades, which resulted in the assumption<strong>of</strong> 15 hours <strong>of</strong> test prep for each administrationafter the first for elementary teachers.Estimates <strong>of</strong> Time Spent on Test Preparation.Students in grades 3-8 in Midwestern District spentat least 60 hours per year preparing for state-mandated,interim/benchmarking and district assessments(Figure 3A). The time committed to testingin Eastern District was substantially higher than inMidwestern District, with students in grades 6 -10spending approximately 110 hours or more per yearon test prep across all assessments (Figure 3B).Midwestern School District: Fifth- and eighthgradestudents spent the most time on testprep (more than 90 hours per pupil, or 18full days, in eighth grade) while students ingrades K-2 had 10-12 hours <strong>of</strong> test prep peryear. Except for seniors, high school studentsspent around 45 to 55 hours in test prep peryear. Estimates for test prep for the statemandatedtests never exceeded 35 hours peryear. However, the test prep for the interim/benchmarking tests amounted to more thanthe test prep for the state-mandated tests ingrades 3-8. Appendix Table C provides moredetailed information about the hours spent ontest prep by test and grade.Eastern School District: In grades 3-5, the localCBAs have been developed into an interim/benchmarking system (administered five timesannually in reading and four times annually inmath). Test prep escalates after grade 5 becausethe district uses both the state-prepared benchmarkingtests and district-developed CBAs. Ingrades 6-12, the CBAs are listed as local tests.Test prep for interim/benchmarking tests consumedabout the same number <strong>of</strong> hours as testprep for state-mandated tests in grades 3-7 andslightly less time in grades 8-11. See AppendixTable D for estimates <strong>of</strong> test prep time by testand grade.Our test-prep time estimates for grades 3-8in Midwestern School District amounted to approximatelytwo hours per week. In grades 6-11 inEastern School District, test prep time totaled ap-22 <strong>American</strong> <strong>Federation</strong> <strong>of</strong> <strong>Teachers</strong>
proximately three hours per week. These estimatesare low when compared with many other studies. InNorth Carolina, 80 percent <strong>of</strong> teachers in one studyindicated that “they spent more than 20 percent <strong>of</strong>their total instructional time practicing for the end<strong>of</strong>-gradetests” (Jones et al., 1999). <strong>Teachers</strong> in NewYork City report approximately the same percentageas the North Carolina survey. <strong>More</strong> than half <strong>of</strong> theteachers in New York said they spent five hours aweek on test prep, the equivalent <strong>of</strong> one full day <strong>of</strong>instruction each week (Lucadamo, 2005). Likewise,in a Chicago teacher survey (Bruno, Ashby andManzo, 2012), the average amount <strong>of</strong> additionaltime consumed monthly by prepping and administeringmandated standardized tests was 20 hours(approximately one a day, or five hours per week).But our very conservative findings <strong>of</strong> two to threehours <strong>of</strong> test prep per week reflect our narrow definition<strong>of</strong> test prep as giving practice tests and teachingtest-taking strategies but not counting activitiesaligning content to the test such as review, reteachingor tutoring. In Texas, for example, the 89 percent<strong>of</strong> teachers who said, “I have been encouraged toconduct drill and practice on the TAKS objectiveswhere I work” also reported that on average theyspent two hours a week conducting “drill and practiceon the TAKS objectives where I work” (Texas<strong>Federation</strong> <strong>of</strong> <strong>Teachers</strong>, 2005). But the same teachersalso reported using an average <strong>of</strong> 40 percent <strong>of</strong>class time “devoted to preparation for the TAKS.”<strong>Testing</strong> <strong>More</strong>, <strong>Teaching</strong> <strong>Less</strong> 23
Total Cost <strong>of</strong> <strong>Testing</strong>Expanding instructional time is an important reform.The time for students to take tests and preparefor tests is not a budgetary cost, but it is paid forthrough the reduction <strong>of</strong> instructional time in theexact amount by which testing time increases. Theevidence <strong>of</strong> instructional time lost to test-takingand test prep suggests that resources for expandedlearning time should concentrate on upper elementaryschool and middle school where testingconsumes the most instructional time.Expanded learning time is <strong>of</strong>ten needed just tocompensate for expanded testing. The HamiltonProject at the Brookings Institution (Fryer, 2012)is an example <strong>of</strong> a reform agenda asking for bothmore learning time and more time for taking testsand using data. The report identified five educationalpractices that are most successful for improvingstudent achievement; two <strong>of</strong> them were “usingstudent data to drive instruction” and “increasingthe length <strong>of</strong> the school day and the number <strong>of</strong> daysin the school year.” Data-driven instruction was definedas conducting regular assessments <strong>of</strong> studentsevery four to six weeks, more in-depth assessmentsgiven several times a year, and teacher meetingswith individual students to discuss and set goals forthe state test after each interim assessment.In addition to reducing instructional time to makeroom for ever increasing test-taking and test prep,high-stakes assessments may distort the educationalprocess by shifting instructional time into subjectscovered on the high-stakes exams and away fromother core subjects like science and social studies, orfrom enrichment activities such as art and music.Estimated Cost <strong>of</strong> Instructional Time Lost toStudent <strong>Testing</strong>. Increasing learning time tocompensate for test-taking and test prep time isexpensive. Experience with expanded learning timedemonstrates that costs do not rise in proportionto the increase in time (Roza and Hawley, 2008).School-related, non-teaching costs such as facilities,transportation and administration do not riseautomatically with the addition <strong>of</strong> time. Second, notall teachers participate in extended time. Accordingto Education Sector (Silva, 2007), several analystshave suggested that a 10 percent increase in schooltime would increase education operating costs by 6to 7 percent. The Massachusetts Expanded Learning24 <strong>American</strong> <strong>Federation</strong> <strong>of</strong> <strong>Teachers</strong>
Time Initiative estimated that increasing time by 30percent (two hours per day) would cost an additional20 percent <strong>of</strong> average operating expenditures(Silva, 2007).A study by the Center for <strong>American</strong> Progress(Roza and Hawley Miles, 2008) provides a model forestimating the cost <strong>of</strong> expanding learning time by approximately30 percent (equaling two hours per dayor 360 hours per year on top <strong>of</strong> a 6.5 hour day over a180-day instructional school year). The national averageoperating expenditure for 2012-13 is projected at$11,081 per student according to Projections <strong>of</strong> EducationStatistics to 2020 (Hussar and Bailey, 2011).Based on the assumption that increasing instructionaltime by 30 percent (two hours per day) raisesexpenditures by 20 percent, costs would increase by$2,216 per student for the 360 additional hours (or$6.15 per hour, per student).The annual cost <strong>of</strong> testing for Midwestern SchoolDistrict (Figure 4A) and for Eastern School District(Figure 4B) combines: (1) direct costs for test purchasingand licensing; (2) costs for logistics and administration;and (3) time costs at $6.15 per hour, perstudent tested to account for instructional time lostto test-taking, test administration time with students,and test preparation.Midwestern School District: The annual costper pupil <strong>of</strong> student assessments in grades 3-8,including the cost <strong>of</strong> lost instructional time, isat least $600 per student. In grades K-2, testingcosts are around $200 per student. In highschool, except grade 12, per-student testingcosts are in the $400 to $600 range.Eastern School District: The annual cost perpupil for student assessment in grades 6-11,including the cost <strong>of</strong> lost instructional time,exceeded $1,100 per student. In grades 1-2,testing costs are around $400 per student andin grades 3-5, the annual per-student cost <strong>of</strong>testing was in the $700 to $800 range.<strong>Testing</strong> <strong>More</strong>, <strong>Teaching</strong> <strong>Less</strong> 25
ConclusionThe Impact <strong>of</strong> <strong>Testing</strong> on Instructional Time and the BudgetTable 5Given the current fiscal austerity, it is unlikely thattaxpayers will finance the longer days or summerschool needed to provide the instructional time lostto testing and test prep. The simple alternative is toredirect the time and money devoted to expansivetesting to other uses, including but not limited tomore instruction. A lot more time for instructionwould be available during the existing school day,including restoration <strong>of</strong> time to subjects that are nottested. Plus, a little money in the budget that is nowImpact <strong>of</strong> Eliminating Testson Instructional Time and BudgetDaily Minutes<strong>of</strong> Added InstructionDollars Per Year Availablefor Other PurposesMidwestern Eastern Midwestern EasternK 6 3 $47 $731 8 10 $67 $602 8 10 $84 $603 28 25 $100 $1084 28 26 $101 $1185 37 26 $141 $1246 28 38 $116 $1507 31 38 $96 $1508 40 41 $149 $1869 25 41 $117 $13010 22 41 $101 $14811 26 51 $110 $22612 10 30 $50 $118*Base on a typical summer school day <strong>of</strong> 4 hours <strong>of</strong> instruction.being spent to purchase and administer tests couldbe used instead to buy more instructional time orfor any purpose, including perhaps spending moremoney on better tests (such as the Common Coreassessments).Table 5 presents the “Daily Minutes <strong>of</strong> AddedInstruction”, which comes from the elimination <strong>of</strong>minutes per day for test-taking, test administrationand test prep based on 180 instructional days for MidwesternDistrict and Eastern District. The elimination<strong>of</strong> test purchasing, licensing and logistics costs is alsosummed for each grade in each district as “Dollars PerYear Available for Other Purposes”.If testing were abandoned altogether, MidwesternSchool District could add from 20 to 40 minutes <strong>of</strong>instruction to each school day for most grades. Ingrades 6-11, Eastern School District could add almostan entire class period each day. Additionally, in mostgrades, more than $100 per test-taker would be availablefor reallocation to purchase interventions, technology,better tests, Common Core staff development,or for any other purpose.Completely eliminating all testing is both unrealisticand undesirable. However, cutting testing time andcosts in half would yield significant gains both to theinstructional day and to the budget. It is estimated thatthe Common Core assessments will cost between $20to $35 per test-taker more than the current $20 averageper test-taker in a typical state (Topol et al., 2012).Cutting the current budget costs for testing and testinglogistics in half would easily fund higher-quality CommonCore assessments with plenty left over.These findings suggest the need for more widespreadanalysis <strong>of</strong> the instructional costs <strong>of</strong> testing,particularly at the local district and community level.<strong>More</strong> importantly, they call for careful consideration<strong>of</strong> the issues outlined in the recommendations foundon pages 7-8. The real costs <strong>of</strong> testing, along with itspurposes, proper uses and instructional impacts—and the voices <strong>of</strong> frontline educators on these issues—deservemuch greater attention in educationpolicy decisions at the federal, state and local levels.26 <strong>American</strong> <strong>Federation</strong> <strong>of</strong> <strong>Teachers</strong>
ReferencesBruno, Robert, Steven Ashby and Frank Manzo (2012).Beyond the Classroom: An Analysis <strong>of</strong> a ChicagoPublic School Teacher’s Actual Workday. School <strong>of</strong>Labor and Employment Relations, University <strong>of</strong>Illinois at Urbana-Champaign.Carlson D., G.D. Borman and M. Robinson (2011). “AMulti-State District-Level Cluster Randomized Trial<strong>of</strong> the Impact <strong>of</strong> Data-Driven Reform on Readingand Mathematics Achievement.” EducationalEvaluation and Policy Analysis, 33(3), 378–398.Chingos, Matthew (2012). Strength in Numbers: StateSpending on K-12 Assessment Systems. WashingtonDC: Brookings Institution.Cornman, Stephen, Jumaane Young and KennethC. Herrell (2013). Revenues and Expenditures forPublic Elementary and Secondary Education:School Year 2010-11 (Fiscal Year 2011). NationalCenter for Education Statistics.Faria, Ann-Marie, Jessica Heppen, Yibing Li, SuzanneStachel, Wehmah Jones, Katherine Sawyer, KerriThomsen, Melissa Kutner, David Miser, SharonLewis, Michael Casserly, Candace Simon, RenataUzzell, Amanda Corcoran, and Moses Palacios(2012). Charting Success: Data Use and StudentAchievement in Urban Schools. Washington DC:Council <strong>of</strong> the Great City Schools.Fryer, Roland (2012). Learning from the Successesand Failures <strong>of</strong> Charter Schools. Washington DC:Hamilton Project, Brookings Institution.Furgeson, Joshua, Brian Gill, Joshua Haimson,Alexandra Killewald, Moira McCullough, IraNichols-Barrer, Bing-ru Teh, Natalya VerbitskySavitz, Melissa Bowen, Allison Demeritt, Paul Hilland Robin Lake. Charter-School ManagementOrganizations: Diverse Strategies and DiverseStudent Impacts. Cambridge, MA: MathematicaPolicy Research, January 2012.The Gordon Commission on the Future <strong>of</strong> Assessmentin Education (2013). A Public Policy Statement.Washington DC: Educational <strong>Testing</strong> Service.Hanushek, E. A., and M. E. Raymond. 2005. “Doesschool accountability lead to improved studentperformance?” Journal <strong>of</strong> Policy Analysis andManagement 24: 297-327.Henderson, S., A. Petrosino, S. Guckenburg andS. Hamilton (2007). Measuring how benchmarkassessments affect student achievement (Issues &Answers Report, REL 2007-No. 039). Washington,DC: U.S. Department <strong>of</strong> Education Institute<strong>of</strong> Education Sciences, National Center forEducation Evaluation and Regional Assistance,Regional Educational Laboratory Northeast andIslands.Heppen, Jessica, Wehmah Jones, Ann-Marie Faria,Katherine Sawyer, Sharon Lewis, AmandaHorwitz, Candace Simon, Renata Uzzelland Michael Casserly (2011). Using Data toImprove Instruction in the Great City Schools:Documenting Current Practice. <strong>American</strong>Institutes for Research and Council <strong>of</strong> the GreatCity Schools.Hussar, W., and T. Bailey (2011). Projections <strong>of</strong>Education Statistics to 2020 (NCES 2011-026).U.S. Department <strong>of</strong> Education, National Centerfor Education Statistics. Washington, DC: U.S.Government Printing Office.Jones, G., B. Jones, B. Hardin, L. Chapman, T.Yarbrough and M. Davis (1999). “The Impacts <strong>of</strong>High-Stakes <strong>Testing</strong> on <strong>Teachers</strong> and Students inNorth Carolina.” Phi Delta Kappan, 81(3).Lucadamo, Kathleen (2005). “Test Prep Saps<strong>Teaching</strong> Time.” New York Daily News.Marshall , Kim (2006). Interim Assessments: Keyto Successful Implementation. New York: NewLeaders for New Schools.May, H., and M.A. Robinson (2007) A randomizedevaluation <strong>of</strong> Ohio’s Personalized AssessmentReporting System (PARS). Philadelphia:University <strong>of</strong> Pennsylvania Consortium for PolicyResearch in Education.<strong>Testing</strong> <strong>More</strong>, <strong>Teaching</strong> <strong>Less</strong> 27
Northwest Evaluation Association (2006). MAP TestPreparation Checklist.Northwest Evaluation Association (2012). <strong>Testing</strong>Season Checklist. www.nwea.org/sites/www.nwea.org/files/resources/<strong>Testing</strong>_Season%20_Checklist.pdf.Nunnery, J. A., S.M. Ross and A. McDonald (2006).A randomized experimental evaluation <strong>of</strong>the impact <strong>of</strong> Accelerated Reader/ReadingRenaissance Implementation on readingachievement in grades 3 to 6. Journal <strong>of</strong> Educationfor Students Placed At Risk, Vol. 1, No. 1.Pedulla, J., L. Abrams, G. Madaus, M. Russell, M.Ramos and J. Mia (2003). Perceived Effects <strong>of</strong>Standardized <strong>Testing</strong> Programs on <strong>Teaching</strong> andLearning: Findings from a National Survey <strong>of</strong><strong>Teachers</strong>. Chestnut Hill, MA: Center for the Study<strong>of</strong> <strong>Testing</strong>, Evaluation, and Educational Policy,Boston College.Pennsylvania Department <strong>of</strong> Education (2011).2011-2012 PSSA/PSSA-M Assessment Handbook.Pennsylvania Department <strong>of</strong> Education, Bureau<strong>of</strong> Assessment and Accountability, Division <strong>of</strong>Assessment.Quint, J., S. Sepanik and J. Smith and MDRC (2008)Using student data to improve teaching andlearning: findings from an evaluation <strong>of</strong> theFormative Assessments <strong>of</strong> Students Thinking inReading (FAST-R) Program in Boston elementaryschools. Retrieved from ERIC database(ED503919).Ross, S. M., J. Nunnery and E. Goldfeder. (2004).A Randomized Experiment on the Effects <strong>of</strong>Accelerated Reader/Reading Renaissance in anUrban School District. Memphis, TN: Center forResearch in Educational Policy, University <strong>of</strong>Memphis.Roza, Marguerite and Karen Hawley Miles (2008).Taking Stock <strong>of</strong> the Fiscal Costs <strong>of</strong> ExpandedLearning Time. Washington, DC: Center for<strong>American</strong> Progress.Silva, E. (2007). On the Clock: Rethinking the WaySchools Use Time. Washington, DC: EducationSector.Slavin, Robert, Alan Cheung, GwenCarol Holmes,Nancy Madden and Anne Chamberlain (2013).“Effects <strong>of</strong> a Data-Driven District Reform Modelon State Assessment Outcomes,” <strong>American</strong>Educational Research Journal, Vol. 50, No. 2.Tepper Jacob, Robin and Susan Stone (2005).“<strong>Teachers</strong> and Students Speak,” Education Next,Vol. 5, No. 1.Texas <strong>Federation</strong> <strong>of</strong> <strong>Teachers</strong> (2005). Texas<strong>Federation</strong> <strong>of</strong> <strong>Teachers</strong> Survey on the Impacts <strong>of</strong>TAKS.Topol, Barry, John Olson, Ed Roeber and Pat Hennon(2012). Getting to Higher-Quality Assessments:Evaluating Costs, Benefits, and InvestmentStrategies. Assessment Solutions Group.Yeh, S. ( 2008). The Cost-Effectiveness <strong>of</strong>Comprehensive School Reform and RapidAssessment. Education Policy Analysis Archives(13), http://epaa.asu.edu/epaa/v16n13/.——— (2010). The Cost-Effectiveness <strong>of</strong> 22Approaches for Raising Student Achievement.Journal <strong>of</strong> Education Finance, Vol. 36, No. 1.Ysseldyke, J. and D.M. Bolt, D. M. (2007). Effect <strong>of</strong>Technology-Enhanced Continuous ProgressMonitoring on Math Achievement. SchoolPsychology Review, 36(3), 453–467.Ysseldyke, J. and S. Tardrew. (2007). Use <strong>of</strong> aProgress-Monitoring System to Enable <strong>Teachers</strong>toDifferentiate Math Instruction. Journal <strong>of</strong>Applied School Psychology, 24(1), 1–28.Zellner, Michael, Anthony Frontier and DenisePheifer (2006). “What Are NCLB’s InstructionalCosts?” Educational Leadership, Vol. 44, No. 3.28 <strong>American</strong> <strong>Federation</strong> <strong>of</strong> <strong>Teachers</strong>
APPENDIXResearch on Time Used for Test PreparationAlthough there is rich literature on test preparation,very little research exists on the time students spendpreparing for tests. Our study creates a rubric (Table4) for estimating test prep time based on findingsfrom two high-quality studies.Center for the Study <strong>of</strong> <strong>Testing</strong>, Evaluation, andEducational Policy. The 80-item survey <strong>of</strong> teachers(Pedulla et al., 2003) sought to ascertain teacher’attitudes and opinions about state-mandated testingprograms and then analyzed the data according tothe nature <strong>of</strong> the consequences or stakes attached totheir state test results. For districts, schools or teachers,high stakes refers to state-regulated or legislatedsanctions <strong>of</strong> significant consequence such as accreditation,financial rewards or placing a school inreceivership. The low-stakes category included stateswith testing programs that did not have any knownconsequences attached to test scores. If the stakesattached to the state tests did not meet the criteria <strong>of</strong>either the high- or low-stakes definitions, states wereplaced in the moderate category.Responding to the question, “Approximately howmany class hours PER YEAR do you spend preparingstudents specifically for the state-mandated test (i.e.,teaching test-taking skills)?” teachers responded asfollows:In high-stakes states, 13 percent <strong>of</strong> teachersspent 21-30 hours on test prep, and 44 percentdevoted more than 30 hours to test prep.In low-stakes states, 7 percent <strong>of</strong> teachers spent21-30 hours on test prep and 44 percent devotedmore than 10 hours to test prep.The study found that test prep practices vary withthe stakes attached to testing. Chosen from a list <strong>of</strong> testpreparation practices, the largest differences betweenteachers in high-stakes and low-stakes states are:“I provide students with items similar to those onthe test” (75 percent compared to 54 percent);“I provide test-specific preparation materialsdeveloped commercially or by the state” (63percent compared to 19 percent); and“I provide students with released items fromthe state-mandated test” (44 percent comparedto 19 percent).<strong>Teachers</strong> in high-stakes states were much morelikely to report that their districts required or recommendedsummer school for low-scoring students(43 percent compared to 8 percent), or retain studentsin grade (25 percent compared to 3 percent).Consortium on Chicago School Research: Thecenterpiece <strong>of</strong> Chicago’s high-stakes testing programimplemented in the late 1990s was a set <strong>of</strong>minimum test score standards on the reading andmathematics sections <strong>of</strong> the Iowa Test <strong>of</strong> Basic Skillsfor students in grades 3, 6 and 8. Students who didnot meet the test score cut<strong>of</strong>fs at the end <strong>of</strong> theschool year were required to participate in a specialsummer program.Survey data collected by the consortium (TepperJacob and Stone, 2005) showed that teachersdefined test preparation narrowly. <strong>Teachers</strong> didcount giving practice tests and teaching test-takingstrategies as test prep. <strong>Teachers</strong> did not count activitiesaligning content to the test as test prep. Half <strong>of</strong>the teachers, for instance, said they had aligned thecontent <strong>of</strong> their curriculum with the content <strong>of</strong> thetest, but only 4 percent included curriculum contentin what they considered “test preparation.” Based oninterviews, teachers viewed test preparation as themost effective way to improve test scores. <strong>Teachers</strong>used a variety <strong>of</strong> approaches to test prep emphasizing,above all, test simulation and familiarizationwith the layout and format.Data collected from teacher surveys beforeimplementation <strong>of</strong> the high-stakes social promotionpolicy in 1994, and after five years <strong>of</strong> implementationin 1999, yielded teacher estimations <strong>of</strong> timethey spent on test preparation:<strong>Testing</strong> <strong>More</strong>, <strong>Teaching</strong> <strong>Less</strong> 29
Test prep time doubled with the high-stakespressure. Before high-stakes testing, teachersspent 10.5 hours on test preparation comparedwith 21 hours five years into high-stakes testing.<strong>Teachers</strong> in the lowest-performing schoolsincreased test preparation from 14 hours priorto the high-stakes testing policy to 32 hours fiveyears into implementation.Impact was greater in high-stakes grades. Beforethe high-stakes testing regimen, 30 percent<strong>of</strong> teachers in high-stakes grades (grades 3, 6and 8) spent more than 20 hours on test prep.Five years into implementation, 65 percent <strong>of</strong>teachers spent more than 20 hours. Amongthird-grade teachers, test prep moved from anaverage <strong>of</strong> 14 hours to 31 hours.30 <strong>American</strong> <strong>Federation</strong> <strong>of</strong> <strong>Teachers</strong>
Appendix Table ADirect Cost <strong>of</strong> Assessments and Licensing, Midwestern School DistrictK 1 2 3 4 5 6 7 8 9 10 11 12Locally Adopted AssessmentsNNAT2 – Naglieri NonverbalDRA $14 $14 $14 $14Stanford Achievement Test $22 $22 $22 $22 $22 $22 $2221st Century Skills Test $29 $29ACT EXPLORE, or PLAN $6 $6Career/technical EOC $9 $9 $11 $11 $34 $22Total Local $36 $51 $65 $22 $22 $28 $36 $9 $29 $11 $11 $34 $22Interim/Benchmark AssessmentsACUITY – Math, Comm. Arts $20 $20 $20 $20 $20 $20ACUITY – Science $10 $10Scanton – Math, Comm. Arts $14 $14 $14 $14 $14Mock End <strong>of</strong> Course $14 $14 $14 $14Total Interim/Benchmark $20 $20 $30 $20 $34 $44 $29 $29 $29 $14State-Mandated AssessmentsMath, Comm. Arts $25 $25 $25 $25 $25 $25 $25 $25 $25Science $10 $10 $10Social Studies $10 $10Total State-Mandated $25 $25 $35 $25 $25 $35 $45 $35 $25Total Local, Interim and State $36 $51 $65 $67 $67 $93 $81 $68 $108 $85 $75 $88 $36<strong>Testing</strong> <strong>More</strong>, <strong>Teaching</strong> <strong>Less</strong> 31
Appendix Table BDirect Cost <strong>of</strong> Assessments and Licensing, Eastern School DistrictK 1 2 3 4 5 6 7 8 9 10 11 12Locally Adopted AssessmentsGRADE (Pearson) $14 $11 $11 $11 $11 $11 $11 $11 $11Kindergarten Assessment $15DIBELS $25 $25 $25 $25 $25 $25SRI Reading $15 $15 $15 $15 $15 $15 $15TerraNova $25 $25 $25CBA Math a a a a a a a a aCBA Reading a a a a a a aCBA Science a a a a a a aCBA Social Studies a a a a a a aPSAT $14 $14Career/Technical EOC $22Total Local $65 $50 $50 $39 $36 $36 $26 $26 $26 $26 $40 $40 $37Interim/Benchmark AssessmentsCBA Math b b bCBA Reading b b bCDT Math, Reading, Science $20 $20 $20 $20 $20 $20State-Mandated AssessmentsEnd <strong>of</strong> Course $10 $10 $10 $10Reading, Math $25 $25 $25 $25 $25 $25 $25 $25Science $10 $10 $10Writing $10 $10 $10Total State-Mandated $25 $35 $35 $25 $25 $45 $10 $10 $55 $35Total Local, Interim and State $65 $50 $50 $64 $71 $71 $71 $71 $91 $56 $70 $115 $7232 <strong>American</strong> <strong>Federation</strong> <strong>of</strong> <strong>Teachers</strong>
Appendix Table CEstimated Hours <strong>of</strong> Test Preparation Time, Midwestern School DistrictK 1 2 3 4 5 6 7 8 9 10 11 12Locally Adopted AssessmentsNNAT2 – Naglieri Nonverbal 0 0 0 0DRA 0 0 0 0 0 0 0Stanford Achievement Test 10 12 1221st Century Skills Test 7 7ACT EXPLORE, or PLAN 0 0 0 0 0Career/Technical EOC 10Total Local 10 12 12 0 0 7 0 0 7 0 0 0 10Interim/Benchmark AssessmentsACUITY - Math, Comm. Arts 32 32 32 32 32 32ACUITY- Science 5 5Scanton - Math, Comm. Arts 12 12 12 12 12Mock End <strong>of</strong> Course 12 12 12 12Total Interim/Benchmark 32 32 37 32 44 49 24 24 24 12State-Mandated AssessmentsMath, Communiction Arts 30 30 30 30 30 30 20 20 20Science 5 5 5Social Studies 5 5Total State-Mandated 30 30 35 30 30 35 30 25 20Total Local, Interim and State 10 12 12 62 62 79 62 74 91 54 49 44 22<strong>Testing</strong> <strong>More</strong>, <strong>Teaching</strong> <strong>Less</strong> 33
Appendix Table DEstimated Hours <strong>of</strong> Test Preparation Time, Eastern School DistrictK 1 2 3 4 5 6 7 8 9 10 11 12Locally Adopted AssessmentsGRADE (Pearson) 12 12 12 12 12 12 12 12 12Kindergarten Assessment 0DIBELS 0 0 0 0 0 0SRI Reading 12 12 12 12 12 12 12TerraNova 10 10 10CBA Math 12 12 7 7 7 7 7 7 7CBA Reading 7 7 7 7 7 7 7CBA Science 7 7 7 7 7 7 7CBA Social Studies 7 7 7 7 7 7 7PSAT 0 0Career/technical EOC 10Total Loccal 10 22 22 12 12 12 52 52 52 52 52 52 50Interim/Benchmark AssessmentsCBA Math, Reading 32 32 32CDT Math and Reading 32 32 32 32 32 32Total Interim/Benchmark 32 32 32 32 32 32 32 32 32State-Mandated AssessmentsEnnd <strong>of</strong> Course 40 40 40 40Math, Reading 30 30 30 30 30 30 20Science 5 5 5Writing 5 5 5Total State-Mandated 30 35 35 30 30 40 40 40 70 40Total Local, Interim and State 10 22 22 74 67 79 114 114 124 124 124 154 9034 <strong>American</strong> <strong>Federation</strong> <strong>of</strong> <strong>Teachers</strong>