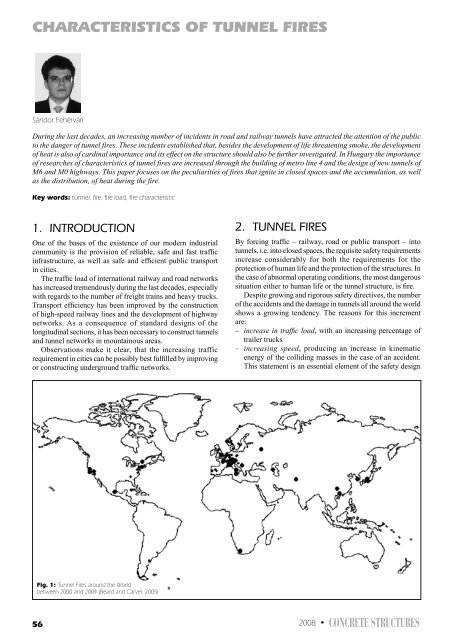
CHARACTERISTICS of TunnEl fIRES
CHARACTERISTICS of TunnEl fIRES
CHARACTERISTICS of TunnEl fIRES
- No tags were found...

Create successful ePaper yourself
Turn your PDF publications into a flip-book with our unique Google optimized e-Paper software.
Fig. 6: Equivalent heat load for different kinds <strong>of</strong> vehicles (Putz, 2005)the structure. Fig. 7 shows that the heat-time distribution isalso more advantageous.When designing tunnels, there is no opportunity (with somerare exceptions) to calculate and analyse the individual heatevolving. Instead <strong>of</strong> describing <strong>of</strong> fires in terms <strong>of</strong> a “correct”standard fire, characteristic curves were established to describethe characteristic <strong>of</strong> an average tunnel fire. The common usedfire-characteristic curves are shown on the Fig. 8.Each curve is based on one or more <strong>of</strong> the following:various research, suppositions, national standards, flammablematerial compositions and the results <strong>of</strong> small or large scaletests (Promat, 2006).ISO Standard: The characteristic curve used mostly in thedesign <strong>of</strong> buildings, which is defined by many EuropeanNational Standards (ISO 834, BS 476:part 20, DIN 4102,AS 1530). It is based on the continuous ignition and naturalburning <strong>of</strong> flammable materials surrounding the fire. Theequation <strong>of</strong> the curve is shown in (1). T C 20 345log(8tmin 1)The maximum temperature 0,167 min 2,5 min 20 1080 1 0,325 t can be calculated on tthe basis <strong>of</strong>T C e 0,675ethe fire load time defined by the National Standards.The maximum evolving heat mass is around 30 MW. It isnot proposed that the ISO standard “ISO” curve be used in0,167 min 2,5 min 20 1280 1 0,325 t tT C the design <strong>of</strong> tunnels. eFig. 8 shows 0,675that the estandard “ISO”curve has a relatively long heat accumulation time whichis not acceptable to describe the tunnel fire theory <strong>of</strong> fastheat accumulation.HydroCarbon: Hydrocarbon fires demonstrate an alternatecharacteristic behaviour. Both the characteristic behaviourFig. 7: Vehicles <strong>of</strong> small and large combustion heat (Blennemann andand the extreme <strong>of</strong> the curve differ from the commonlyGirnau, 2005)used standard “ISO” curve. The faster ignition <strong>of</strong> thehydrocarbons causes a faster increase and larger combustionfires produce higher maximum temperatures. The equationT<strong>of</strong> the curveC is shown 20 345log(8tin (2).min1)0,167 min 2,5 min 20 1080 1 0,325 t t 0,675T C e eTC 20 345log(8tmin1)0,167 min 2,5 min 20 1280 1 0,325 t t 0,6750,167 min 2,5 min 20 1080 1 0,325 t t 0,675HydroCarbon Modified: Analogue to the “Hydrocarbon” fire,Tthe CFrench Standard defines a efire characteristic ecurve with amaximum T C temperature <strong>of</strong> 1300 e °C as opposed to ethe 1100 °Cshown above. The equation <strong>of</strong> the curve is shown in (3).0,167 min 2,5 min 20 1280 1 0,325 t t0,675T C e e (3)(1)(2)Fig. 8: Standardized fire-characteristic curves; air/gas temperatures aroundthe fire (after Blennemann and Girnau, 2005)(Blennemann and Girnau, 2005). However, this evolvingenergy is distributed in time and space. Thereby the total energymass is definable for every kind <strong>of</strong> vehicle if the componentscan be summated.It is important to note that real fire protection begins withthe applied materials <strong>of</strong> the vehicles. The total mass <strong>of</strong> theflammable materials in a vehicle design conforming to modernstandards and considerations is smaller, so the evolving <strong>of</strong> heatand (toxic) smoke puts less strain on the human organism andBoth the “HydroCarbon” and the “HydroCarbon Modified”fire characteristic curves came from the petrol chemicalindustry into civil engineering. Their use could bedemonstrated because <strong>of</strong> the huge amounts <strong>of</strong> benzene andgasoline around the fire, especially in road tunnels.RABT-ZTV: The “RABT-ZTV” fire characteristic curves havebeen determined and standardized in Germany as a result <strong>of</strong>large scale tests. In contrast with the foregoing theories, thecurves are described with break points instead <strong>of</strong> equations.Different characteristic curves were determined for bothrailway and road tunnels. Both curves rapidly reach themaximum temperature (1200 °C) within 5 minutes. Themaximum temperature is then held for 25 to 55 minutesdepending on the type <strong>of</strong> curve. The cooling phase is 110minutes for both curves (Table 1).The German fire characteristic curves are used for designas well as for research because <strong>of</strong> the linear drive. Curveswell define the rapid increase <strong>of</strong> the temperature in the first58 2008 • CONCRETE STRUCTURES
Table 1: Significant break points <strong>of</strong> the “RABT-ZTV” curves (Promat, 2006)Fig. 9: Large scale test in Germany (1998) (Haack, 2002)Table 2: Significant point <strong>of</strong> the RWS, RijksWaterStaat fire characteristiccurve (Promat, 2006)Fig. 10: Maximum air temperatures in the walls during a railway tunnelfire (Richter, 1993)few minutes (Fig. 9). However, this is the only characteristicwhich determines the parameters <strong>of</strong> the cooling phases.The speed <strong>of</strong> the cooling is also important, not only for themodel, but also for the residual properties <strong>of</strong> the material.RWS, RijksWaterStaat: Characteristic curves from theNetherlands determined at 1979. This curve shows thehighest maximum temperature <strong>of</strong> all the curves above. Itdescribes the worst case scenario on an accident in a roadtunnel when a tanker with 50 m 3 gasoline explodes. As aconsequence <strong>of</strong> the accident, 300 MJ <strong>of</strong> energy evolvesin 180 minutes. The behaviour <strong>of</strong> the curve shows rapidincreasing during the ignition period, deceleration in rate<strong>of</strong> temperature increase in the second period, a significantmaximum point, slight recession and stagnation (Table 2)Apart from the lack <strong>of</strong> the cooling phase (the flammablematerial is burn out after 180 minutes) the RWS firecharacteristic curve has the greatest upper bound <strong>of</strong> almost100% <strong>of</strong> the tunnel fires.The curves above represent the distribution the maximumdesign value <strong>of</strong> air or gas temperature in a tunnel versustime.The spatial changes <strong>of</strong> temperature were also examined. Itwas verified that the maximum temperature develops at thero<strong>of</strong> <strong>of</strong> the tunnel; lower temperatures are noticeable at thewalls. Figs. 10-12 shows the distribution <strong>of</strong> developed airtemperatures during the fire flaming out from different kind<strong>of</strong> vehicles.The longitudinal distribution also shows the spatial changesextending away from the fire. However by the time <strong>of</strong> ignition,the secondary ignition <strong>of</strong> flammable materials around thefire is also possible. Thereafter the maximum points <strong>of</strong> thetemperature curve are extended over the tunnel’s longitudinalFig. 11: Maximum air temperatures in the walls during an undergroundrailway tunnel fire (Richter, 1993)Fig. 12: Maximum air temperatures in the walls during a road tunnel fire(Richter, 1993)CONCRETE STRUCTURES • 2008 59
Fig. 13: Distribution <strong>of</strong> air temperature parallel to the longitudinal axis,away from the fire (Richter, 1993)the actual countries. Thereby the special curves are advisablefor the numerical modelling <strong>of</strong> the effect <strong>of</strong> fire heat on thewall, as well as for research propose into the structural materialsand the structure itself.This paper demonstrates that the air temperature around theplace <strong>of</strong> the fire shows a distribution in the cross section aswell as in the longitudinal section <strong>of</strong> the tunnel. Thereby thetemperature values for the load <strong>of</strong> the structure are definable.It can be stated that by designing a new tunnel, from whicha burning vehicle cannot escape, the consequences <strong>of</strong> the heatevolving should be examined. In older tunnels, where heatresistant <strong>of</strong> structure was not observed, the same considerationsshould be performed and the structure should be equipped withadditional fire protection.Thence in Hungary it is necessary to determine our standardsfor the characterization <strong>of</strong> tunnel fires. Thereunto researches(full scale test and small models, numerical analysis) are tobe carried out beside the acceptance <strong>of</strong> European regulationsand standards.5. acknowledgementsAuthor wish to express his gratitude to Mr. Martin Smith andMr. György Posgay for their advices and pro<strong>of</strong> reading <strong>of</strong> thepresent paper.Fig. 14: Distribution <strong>of</strong> air temperature parallel to the longitudinal axis,away from the fire (Blennemann és Girnau, 2005)section, and increasingly more tunnel linings will be subjectedto the maximum thermal load as shown on Figs. 13-14.4. ConclusionsDuring a tunnel fire, a huge amount <strong>of</strong> heat is evolved.Developing heat can only dissipate slowly due to the form<strong>of</strong> the structure and the surrounding soil and rock. Thereforesignificant values <strong>of</strong> air temperature can be formed at the place<strong>of</strong> fire in the structure.International research provides valuable information aboutthe evolving heat mass based on the theoretical assumptionsin small or large scale tests. Special fire characteristic curveswere drawn up by West European practices which calculatefaster heat accumulation and higher maximum temperaturevalue than the “conventional” characteristics that are valid in6. referencesBeard, A. and Carvel, R. (eds.) (2005): „The Handbook <strong>of</strong> Tunnel Fire Safety”,Thomas Telford Ltd., LondonBlennemann, F. and Girnau, G. (eds.) (2005): „Brandschutz in Fahrzeugenund Tunneln des ÖPNV”, Alba Fachverlag, DüsseldorfHaack, A. (2002): „Current Safety Issues in Traffic Tunnels”, STUVA, KölnPromat (2006): „Fire Curves”, www.promat-tunnel.comPutz, U. (2005): „Brandbeanspruchung von Tunnelbeton“, 45.Forschungskolloquium des DAfStb, 100. Jahrgang, Beton- undStahlbetonbau, pp. 173-176.Richter, E. (1993): „Heißgasentwicklung bei Tunnelbränden mit StraßenundSchienenfahrzeugen – Vergleich gemessener und in Vorschriftenenthaltener Temparatur-Zeit-Verläufe“, STUVA Tagung ’93 in Hamburg,STUVA, Köln, pp. 131-137.Schlüter, A. (2004): „Baulicher Brandschutz für Tunnelbauwerke: Richtlinien,Vorgaben, die Realität und geeignete Maßnahmen“, Tunnel, November2004 (Sonderdruck: Promat GmbH.)DIN 5510-2 (2003. 09.): Vorbeugender Brandschutz in Schienenfahrzeugen- Teil 2: Brennverhalten und Brandnebenerscheinungen von Werkst<strong>of</strong>fenund Bauteilen; Klassifizierungen, Anforderungen und PrüfverfahrenSándor Fehérvári (1981), MSc. in civil engineering (BME 2006). PhDstudent at BME, Dep. <strong>of</strong> Construction Materials and Engineering Geology.Main fields <strong>of</strong> interest are the effect <strong>of</strong> the tunnel fires on structures, structuraland curtain grouting, building and repair techniques <strong>of</strong> underground andtunnel structures. Member <strong>of</strong> the Hung. Group <strong>of</strong> fib, the Hung. Chamber <strong>of</strong>Engineers, the Hung. Tunnelling Assoc., the Hung. Sci. Assoc. for Transport,the Sci. Society <strong>of</strong> Silicate Industry (Concrete Div.). Activities: ITA WG 6(Maintenance and Repair).60 2008 • CONCRETE STRUCTURES