

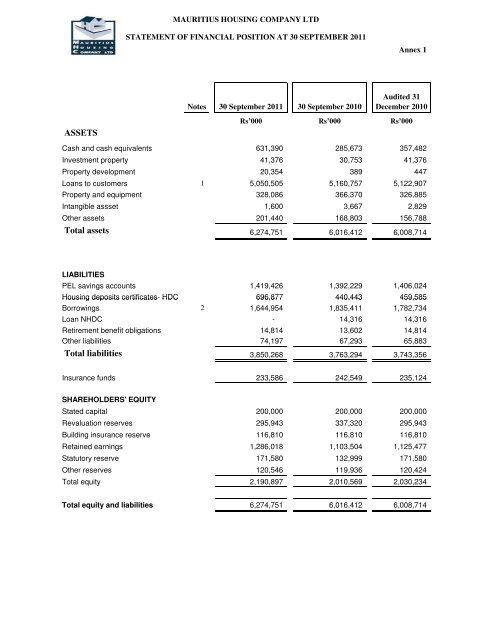
ASSETS Total assets Total liabilities - Mauritius Housing MHC
ASSETS Total assets Total liabilities - Mauritius Housing MHC
ASSETS Total assets Total liabilities - Mauritius Housing MHC
- No tags were found...

You also want an ePaper? Increase the reach of your titles
YUMPU automatically turns print PDFs into web optimized ePapers that Google loves.
MAURITIUS HOUSING COMPANY LTDSTATEMENT OF CHANGES IN EQUITY FOR PERIOD ENDED 30 SEPTEMBER 2011Annex 3BuildingShare Revaluation insurance Retained Statutory Othercapital reserves reserve earnings reserves reserves <strong>Total</strong>Rs'000 Rs'000 Rs'000 Rs'000 Rs'000 Rs'000 Rs'000At 1 January 2010 200,000 337,320 116,810 893,987 132,999 119,842 1,800,958Profit for the period - - - 209,517 - - 209,517Movement on reserves - - - - - 94 94At 30 September 2010 200,000 337,320 116,810 1,103,504 132,999 119,936 2,010,569At 1 January 2010 200,000 337,320 116,810 893,987 132,999 119,842 1,800,958Adjustments/Reclassification- (41,377) - 12,864 - - (28,513)<strong>Total</strong> comprehensive income for the year- - - 257,207 - - 257,207Transfer to statutory reserve- - - (38,581) 38,581 - -Movement on reserves - - - - - 582 582At 31 December 2010 200,000 295,943 116,810 1,125,477 171,580 120,424 2,030,234At 1 January 2011 200,000 295,943 116,810 1,125,477 171,580 120,424 2,030,234Profit for the period - - - 217,126 - - 217,126Movement on reserves - - - - - 122 122Corporate Social Responsibility(5,144) (5,144)Dividend- - - (51,441) - - (51,441)At 30 September 2011 200,000 295,943 116,810 1,286,018 171,580 120,546 2,190,897
MAURITIUS HOUSING COMPANY LTDSTATEMENT OF CASH FLOWS FOR THE PERIOD ENDED 30 SEPTEMBER 2011Annex 430 September 2011 30 September 2010Audited 31December 2010Rs’000 Rs’000 Rs’000Cash flows from operating activitiesProfit for the period 217,126 209,517 257,207Adjustments for:Provision and adjustments to income for credit losses (29,025) (28,058) (9,443)Depreciation 7,245 7,553 9,436Amortisation of intangible <strong>assets</strong> 1,553 1,641 2,042Impairment/loss on foreclosed property 9,959 (10,138) 17,560(Profit)/loss on disposal of property development (3,305) - (12,638)Interest in suspense (12,116) (14,387) (23,039)(Profit)/Loss on disposal of property and equipment (925) (585) (585)Operating profit before working capital changes 190,512 165,543 240,540Change in operating <strong>assets</strong> and <strong>liabilities</strong>(Increase)/Decrease in other <strong>assets</strong> (56,830) (13,334) (49,248)Increase/(decrease) in other <strong>liabilities</strong> 8,314 (7,907) (9,316)Increase/(decrease) in accrued interest payable (6,145) 12,918 11,069Increase/(decrease) in loans to customers 110,308 (2,415) 55,859Increase/(decrease) in others (1,537) 8,238 (4,196)Net cash generated by/(used in) operating activities 54,110 (2,500) 4,168Cash flows from investing activitiesPurchase of property and equipment and intangible asset (6,236) (2,264) (3,275)Proceeds from disposal of foreclosed property - 2,049 582Proceeds from disposal of property and equipment 925 515 585Proceeds from disposal of property development 1,205 18,900 10,900Payments for property development (19,906) - -Net cash generated by investing activities (24,012) 19,200 8,792Cash flows from financing activitiesGrant and subsidies received - 3,820 13,965<strong>Housing</strong> deposits certificates (HDC) 228,197 49,865 68,779Plan Epargne Logement Savings (PEL) 28,641 29,620 48,917Proceeds from borrowings 8,267 - -Repayments of borrowings (150,872) (184,321) (253,637)Dividends paid (51,441) (51,615) (51,615)Net cash used in financing activities 62,792 (152,631) (173,591)(Decrease)/increase in cash and cash equivalents 283,402 29,612 79,909Movement in cash and cash equivalentsCash and cash equivalents at start of the period 284,584 204,675 204,675(Decrease)/increase in cash and cash equivalents 283,402 29,612 79,909Cash and cash equivalents at end of period 567,986 234,287 284,584Cash and cash equivalentsCash at bank and in hand 631,390 285,673 357,482Bank overdrafts (63,404) (51,386) (72,898)567,986 234,287 284,584
MAURITIUS HOUSING COMPANY LTDNotes to Accounts1 LOANS TO CUSTOMERS - SECURED30 September 2011 30 September 2010Audited 31December2010Rs 000 Rs 000 Rs 000Fast loans 3,704 17,934 11,837Secured loans 5,899,503 6,027,023 6,005,152<strong>Total</strong> loan advanced 5,903,207 6,044,957 6,016,989Provision for Bad debts (12,500) (12,500) (12,500)Provision for credit losses (Note (b)) (594,605) (605,336) (623,870)Interest suspended (245,597) (266,364) (257,712)5,050,505 5,160,757 5,122,907Analysed as follows:Current 472,109 381,227 472,109Non-current 5,431,098 5,663,730 5,544,8805,903,207 6,044,957 6,016,989(b) Provision for credit lossesSpecificPortfolioProvision Provision <strong>Total</strong>Rs’000 Rs’000 Rs’000At 1 January 2010 582,363 51,029 633,392Movement during the period(27,031) (1,025) (28,056)At 30 September 2010 555,332 50,004 605,336At 1 January 2010 582,363 51,029 633,392Amount written off (79) - (79)Movement during the year(7,975) (1,468) (9,443)At 31 December 2010 574,309 49,561 623,870At 1 January 2011 574,309 49,561 623,870Movement during the period (26,611) (2,654) (29,265)At 30 September 2011 547,698 46,907 594,6052BORROWINGSCurrentBank overdraftsLoan capitalBank loansNon-currentLoan capitalBank loansLoan - Government of <strong>Mauritius</strong><strong>Total</strong> borrowings30 September 2011 30 September 2010Audited 31December2010Rs’000 Rs’000 Rs’00063,404 51,386 72,89833,060 34,665 33,060160,000 204,167 160,000256,464 290,218 265,958211,914 237,783 224,7831,165,414 1,296,248 1,280,83111,162 11,162 11,1621,388,490 1,545,193 1,516,7761,644,954 1,835,411 1,782,734


![MHC Annual Report 02[047]03 co.qxp - Mauritius Housing MHC](https://img.yumpu.com/6489833/1/184x260/mhc-annual-report-0204703-coqxp-mauritius-housing-mhc.jpg?quality=85)