by SENS and SWICO - Ecotic
by SENS and SWICO - Ecotic
by SENS and SWICO - Ecotic

You also want an ePaper? Increase the reach of your titles
YUMPU automatically turns print PDFs into web optimized ePapers that Google loves.
PCB’s in Small Capacitors from Waste Electrical <strong>and</strong> Electronic EquipmentsElaborated <strong>by</strong>:On the behalf of:Martin Eugster / Empa, St. Gallen<strong>SENS</strong> / Swiss Foundation for Waste ManagementAnne-Christine Chappot / Ecoservices, Yverdon<strong>SWICO</strong> / Swiss Association for Information, Communications<strong>and</strong> Organization TechnologyUeli Kasser / Büro für Umweltchemie, ZürichSLRS / Swiss Lighting Recycling FoundationTable of Contents1 Initial Situation <strong>and</strong> Target 61.1 Capacitors <strong>and</strong> Environment 61.2 Legal Provisions <strong>and</strong> System Regulations 61.3 Previous Analyses 71.4 Objectives 72 Sampling <strong>and</strong> Sample Preparation 82.1 Sampling 82.2 Sample Preparation 93 Laboratory Analyses 103.1 Procedure 103.2 PCB Analysis 103.3 GC-MS Full Scan Analysis 113.4 GC-ECD / FID Fingerprint Analysis 124 Discussion on the Results 134.1 Uncertainties with the Sample Preparation 134.2 Annual PCB Flows 144.3 PCB Substitutes 164.4 Electrolytes 175 Final Conclusions <strong>and</strong> Measures 185.1 Final Conclusions 185.2 Recommendations 186 Bibliography 19Annex A: Summarized Results of the Analyses 2005 <strong>by</strong> Technical Control Bodies of <strong>SENS</strong> <strong>and</strong> <strong>SWICO</strong> 20Annex B: Pictures of Supplied, Precrushed Capacitor Samples 21Annex C: Characterization of the Bulk Sample “Capacitors from Ballasts in Fluorescent tube lamps” 232
PCB’s in Small Capacitors from Waste Electrical <strong>and</strong> Electronic Equipments1 Initial Situation <strong>and</strong> Target1.1 Capacitors <strong>and</strong> EnvironmentSmall capacitors are passive electrical building elements<strong>and</strong> found in many electrotechnical devices. Inelectrical <strong>and</strong> electronic equipments, they serve as energy<strong>and</strong> charge-coupled memory, frequency dependingresistances, converters or sensors. A capacitor consistsof two electro-conducting surfaces, mostly at small intervals,i.e. the electrodes. Between them, there is alwaysan area with isolating properties, the dielectric,which may be solid or liquid. The case of one of theelectrodes formed <strong>by</strong> a conducting liquid refers to anelectrolyte capacitor. The dielectric is found in the aluminiumoxide (Al 2O 3) or tantalum oxide (Ta 2O 5) of theelectrolyte capacitor, generated as a chemical reactionbetween electrodes <strong>and</strong> electrolytes. Most current designsare winding capacitors (i.e. paper sheet, syntheticsheet, metal paper systems), mass capacitors (i.e. ceramic<strong>and</strong> electrolyte capacitors) <strong>and</strong> layer capacitors(Hentschel 2000).Due to the electrical insulating property, diffi cult infl ammability,chemical <strong>and</strong> thermal stability of polychlorinatedbiphenyls (PCB’s), these chemical chlorine compoundswere often used as dielectrics in paper capacitors.As a consequence of their hazardous impacts onhuman health (BAG 2006) <strong>and</strong> their extraordinary stability,the production <strong>and</strong> application of PCB’s in Switzerl<strong>and</strong>was generally prohibited in 1986. On an internationallevel, the production <strong>and</strong> application of PCB’s wasbanned, fi rst in open systems in 1978 <strong>and</strong> then broadlyprohibited in 1986 (UNEP 1999). Various non-conductiveoils, mainly without halogens, were used as substitutesfor PCB’s. But as these substitutes must also havea certain thermal <strong>and</strong> electrical stability, the environmentalhazard cannot be excluded. In Al capacitors,organic carbonic acids – heavily toxic <strong>and</strong> corrosive(Baumann 2005) – are frequently used as electrolytes.These electro-conductive matters are often mixed withadditives <strong>and</strong> solvents.1.2 Legal Provisions <strong>and</strong> System RegulationsIn 2006, 121 t small capacitors from 96’400 t electrical<strong>and</strong> electronic waste equipments were removed <strong>and</strong>disposed of separately in Switzerl<strong>and</strong> (<strong>SENS</strong>-<strong>SWICO</strong>2007) . The Swiss legal provisions differentiate on principlebetween the disposal routes for PCB-containing<strong>and</strong> PCB-free capacitors. According to the Swiss Ordinanceon the Return, Acceptance <strong>and</strong> Disposal of Electrical<strong>and</strong> Electronic Equipments (VREG), Art. 6 Abs. 1lit. a (VREG 1998), “especially contaminated componentssuch as PCB-containing capacitors must be disposedof separately”. The guidance on the VREG (BU-WAL 2000) stipulates high-temperature incineration forPCB-containing capacitors.Specifi c requirements for the disposal of PCB-free capacitorsare not defi ned in the Swiss legislation, unlesstheir classifi cation as “heavily contaminated components”can be justifi ed. According to the VeVA Waste Catalogue(Ordinance on the H<strong>and</strong>ling of Waste), PCB-freecapacitors are assigned to the other wastes which aresubject to control (Waste Code: 16 02 16 [ak]).In Annex 2 (EU 2002) of the European WEEE Directive,the removal from equipments <strong>and</strong> a separate disposalof PCB-containing capacitors <strong>and</strong> electrolyte capacitorswith environmentally relevant matters (height> 25 mm; diameter > 25 mm or proportionally similarvolumes) are stipulated. Following the European WasteCatalogue, these capacitors are also ranked as hazardouswaste.The Treatment Requirements of the Swiss system operators<strong>SENS</strong> <strong>and</strong> <strong>SWICO</strong> on the disposal of electrical <strong>and</strong>electronic equipments are ruling the h<strong>and</strong>ling of smallcapacitors in accordance with Swiss <strong>and</strong> Europeanst<strong>and</strong>ards. Basing on the defi nition in Annex 2 of theWEEE Directive, all the PCB-containing <strong>and</strong> electrolytecapacitors shall be removed from the equipments <strong>and</strong>disposed of separately.In practice, a differentiation between PCB-containing<strong>and</strong> PCB-free capacitors is diffi c ult – also for qualifi edpersonnel – cost <strong>and</strong> time intensive, <strong>and</strong> therefore rarelydone. Available auxiliary documents for identifying6
PCB’s in Small Capacitors from Waste Electrical <strong>and</strong> Electronic Equipments2 Sampling <strong>and</strong> Sample Preparation2.1 SamplingIn dismantling plants <strong>and</strong> at the work places of diverserecycling companies, who are currently discharging pollutants,capacitors from diverse categories <strong>and</strong> types ofequipments were collected. The analysed categories ortypes of equipments, respectively, <strong>and</strong> the amount ofremoved capacitors are shown on Table 2.The capacitors were removed from the equipmentsbetween June <strong>and</strong> August 2006, <strong>and</strong> the amount of r<strong>and</strong>omsamples was 1’482 kg, which corresponds to about1.2 % of all the capacitors removed in 2006 from equipments.The various recycling companies represent differingtrading areas <strong>and</strong> customer segments.The amount of capacitor samples was chosen in a wayto have, the relative quantity of sampled equipmentscorrespond in each case to at least 1 % of the yearlytotal of processed units. Table 3 composes the sampledshare of the yearly processed equipments followingtheir respective categories. The estimations on theshare of capacitors within a category of equipments arebased upon r<strong>and</strong>om sample analyses or batch tests.With regard to cooling <strong>and</strong> freezing appliances <strong>and</strong> IT/CE’s, more than one per cent of the yearly total could besampled, as for LHA’s, they reached 0.7 %, lamps 0.5 %<strong>and</strong> SHA’s merely 0.2 %, due to the temporally limitedsampling. The quantity of processed uninterruptiblepower supply systems has not been accounted in thematerial fl ow compilation of <strong>SENS</strong> <strong>and</strong> <strong>SWICO</strong>. Hence,there are no indications about the processed amounts.It is assumed that a large part of the fl uorescent tubelamps is not being registered <strong>by</strong> the collective systems<strong>and</strong> ending directly in the scrap metal. According to theSwiss Lighting Recycling Foundation (SLRS) about 1.5million fl uorescent tube lamps were sold in 2006. Bysupposing an average weight of 3.7 kg per fl uorescenttube lamp (see Annex C), it would correspond to a materialamount of 5’570 t. In 2006, only 420 t lamps (fl uorescenttube <strong>and</strong> other lamps) were processed withinthe collective systems, however, a much higher wastevolume is expected.Table 2 Amount of capacitor r<strong>and</strong>om samples following the category or type of equipmentN° Origin of Capacitors WEEE Category Amount of Capacitors[ kg ] [ % ]Large Household Appliances (LHA), Small Household Appliances (SHA)1 LHA mixture 1 415 28.02 Dishwashers 1 22 1.53 SHA mixture, without microwave devices 2 13 0.94 Microwave devices 1 50 3.45 Cooling <strong>and</strong> freezing appliances 1 148 10.06 Ballasts in fl uorescent tube lamps 3 5 99 6.7IT (Information Technology) / CE (Consumer Electronics) / UPS (uninterruptible power supply systems)7 IT/CE: capacitors < 1 cm 3, 4 21 1.48 IT/CE: capacitors 1-2.5 cm 3, 4 322 21.79 IT/CE: capacitors > 2.5 cm 3, 4 125 8.410 UPS (uninterruptible power supply systems) – 267 18.0Total 1’482 100.03Two separate samplings – campaigns: June – August 2006 (38 kg) <strong>and</strong> June – July 2007 (61 kg)8
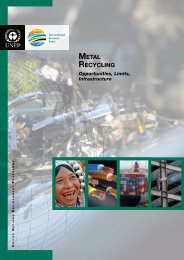
Fig. 1 Shredder for the reduction of the capacitors (type: Vecoplan VAZ105/120, 18.5 kW, approx. 550 kg/h) <strong>and</strong> 8 mm sieve used for IT/CE< 1cm (bulk sample N° 7)Fig. 2 Splitting <strong>and</strong> reduction of samples <strong>by</strong> means of splitting the angle ofrepose of the shredded materialTable 3 Share of sampled equipments from the total amount of processed units in the collectivesystems <strong>SENS</strong>, <strong>SWICO</strong> <strong>and</strong> SLRS in 2006Category of EquipmentBulkSampleN°Amount ofCapacitorSamples[ kg ]Share ofCapacitors(Estimation)[ kg/t ]ProcessedTotal 2006[ t ]Amount of SampledEquipments[ t ]LHA 1, 2 437 2.5 24’709 175 0.7SHA 3, 4 63 2.4 1 10’673 26 0.2Fluorescent tubelampsCooling <strong>and</strong>freezing appliances6 99 32 420 2 0.75 148 0.1 14’929 1’480 9.9IT/CE 7, 8, 9 468 0.8 41’713 585 1.4UPS 10 267 n.d. 2 n.d. n.d. n.d.Sample Share/Amount 2006[ % ]1determined from estimated shares of capacitors in SHA’s (0.8 kg/t) <strong>and</strong> microwave devices (5 kg/t); in Switzerl<strong>and</strong>, microwaved e vices are assigned to SHA’s, in the EU, they are considered as large WEEE equipments, category 12n.d.: no data availableThe capacitor samples collected according to the categoriesof equipments were checked visually for theirbelonging to the respective categories of equipments<strong>and</strong> for the eventual presence of interfering matters. Itmay be assumed that the separation according to thecategories of equipments was performed reliably. AnnexB presents the supplied or coarsely shredded capacitors,respectively. The number of capacitors, the manufacturersor other product data were seized for bulk sample“ballasts in fl uorescent tube lamps” only. Consideringthe very high quantities (about 30’000 smallcapacitors), such cost <strong>and</strong> time consuming compilationshad to be ab<strong>and</strong>oned for the other samples.2.2 Sample PreparationThe crushing of the collected small capacitors occurredin a fi ne shredder (sieve 12 mm or 8 mm, respectively, forbulk sample IT/CE < 1 cm). After every passage, theshredder was dry cleaned <strong>and</strong> eventual residues removedwith toluene. As a further measure to avoid transmissions,a forerun of about 10 % of the input was practisedin every case <strong>and</strong> not used for the sample concerned.After shredding, the amount of samples was reduced toabout 2 kg <strong>by</strong> means of splitting the angle of repose ofthe shredded material in a structured way. Further preparations<strong>and</strong> analyses were practiced in the laboratory.9
PCB’s in Small Capacitors from Waste Electrical <strong>and</strong> Electronic Equipments3 Laboratory Analyses3.1 ProcedureNo st<strong>and</strong>ardised preparation <strong>and</strong> identifi cation methodsare yet ruling the h<strong>and</strong>ling of shredded small capacitors.Neither do relevant analytical experiences <strong>by</strong> PCBspecialised laboratories exist on this heterogeneousmixture of oily metal, plastic <strong>and</strong> paper particles ofvarying size. To verify the results, three different certifi edlaboratories specialised in PCB analyses were thereforecommissioned to test certain samples. They were freeto choose appropriate homogenisation, sample splitting<strong>and</strong> extraction method.In a fi rst step, the PCB content was determined after thepreparation in all ten bulk samples (see paragraph 3.2).Secondly, further compounds or substance classes, respectively,were identifi ed <strong>by</strong> means of a GC-MS fullscan analysis (see paragraph 3.3). Further tests wereperformed on capacitors from microwave devices, asfi n dings about the use of PCB substitutes <strong>and</strong>, perhaps,of electrolytes were expected (see paragraph 3.4). Suchhigh-tension capacitors have a relatively uniform design;they often include signifi cant amounts of liquids<strong>and</strong> should not hold any PCB’s, as the fi rst devices ofthis kind were introduced on the market only after thePCB prohibition. A GC-ECD / FID fi n gerprint analysis<strong>and</strong> a quantifi cation of the main components werepracticed.3.2 PCB AnalysisThe preparation of the heterogeneous samples, thedivision of the congeners <strong>and</strong> the identifi cation werediversely performed <strong>by</strong> the three analytical laboratories.Table 4 illustrates the essential differences. Measurementerrors are evaluated up to 20 – 25 % or 20 – 30 % <strong>by</strong> thelaboratories. The results of the analyses are shown inTable 5, with the fi gures ranging within < 1%. In case ofhigh PCB contents, the values of the different laboratoriesvary signifi cantly <strong>and</strong> may come up to factor 10.Table 4 Differences in the preparation of bulk samplesAmount of extractHomogenisationExtraction solventControl of extraction effi ciencyExtract evaporation7– 30 g; 0.2 g; 5 gdisk vibratory mill, ultra-centrifugal millSoxhlet extraction with n-hexane; ultrasound extractionwith cyclohexane / acetone / or cyclohexane / ethyl acetatenone / insuffi c ienthighly variable10
Table 5 PCB contents [mg/kg] as sum of 6 PCB congeners 5 <strong>and</strong> its multiplication <strong>by</strong> factor 5 following LAGA;results of the tests in the three analytical laboratoriesN° Origin of Capacitors PCB Content [ mg/kg ]Large Household Appliances (LHA), Small Household Appliances (SHA)Laboratory 1 Laboratory 2 Laboratory 31 LHA mixture 16’450 1’490 3’1102 Dishwashers 224 172 –3 SHA mixture, without microwave devices 439 353 –4 Microwave devices 11 – –5 Cooling <strong>and</strong> freezing appliances
PCB’s in Small Capacitors from Waste Electrical <strong>and</strong> Electronic EquipmentsTable 6 Identifi ed individual substances <strong>and</strong> substance classes in the capacitor samplesN° Origin of Capacitors Possible Compounds / Substance ClassesLarge Household Appliances (LHA), Small Household Appliances (SHA)1 LHA mixture naphthalene, hydrocarbons, chlorinated naphthalene, phthalates2 Dishwashers naphthalene, hydrocarbons, biphenyls, chlorinated naphthalene,phthalates3 SHA mixture, without microwavedeviceshydrocarbons, methyl-naphthalene, chlorinated naphthalene4 Microwave devices biphenyls (for ex. ethyl methyl), phthalates5 Cooling <strong>and</strong> freezing appliances naphthalene, benzyl-methylbenzene, hydrocarbons, biphenyls,triphenyl phosphate, phthalates, phosphoric acid ester6 Ballasts in fl uorescent tube lamps phthalatesIT (Information Technology) / CE (Consumer Electronics) / UPS (uninterruptible power supply systems)7 IT / CE: capacitors < 1 cm hydroxybutyric acid, chloro-butyrophenon, phthalates, fatty acid,fatty acid ester, hexabrome benzene8 IT / CE: capacitors 1 –2.5 cm dimethylacetamide, hydroxybenzoic acid, benzyl alcohol, dimehylbenzylalcohol, dibenzoyloxy-heptane-diamide, benzoic acid ester,chlorinated naphthalene, carbonic acids, fatty acid ester, hexabromebenzene, phthalates, phosphoric acid ester9 IT / CE: capacitors > 2.5 cm Dimethyl acetamide, hydroxybutyric acid, methyl pirrolidon, benzoicacid chlorethyl ester, benzoic acid ester, tetrabutyl ammonium cyanide,butoxyethoxy-ethyl acetate, biphenyls, chlorinated naphthalene,phthalates10 UPS hydrocarbons3.4 GC-ECD / FID Fingerprint AnalysisBulk sample N° 4 “microwave devices” was submittedto a differentiated analysis, in order to enable, as muchas possible, more precise statements on the di-electrodes<strong>and</strong> electrolytes used after the PCB prohibition.The samples were prepared so as to allow individualidentifi cations within the substance classes, includingquantifi cation. Table 7 displays the results.Two signifi cant substance groups could be traced witha fi ngerprint measure <strong>by</strong> GC-ECD / FID: a technical mixtureof alkylated biphenyls <strong>and</strong> a technical mixture ofphthalates within DINP <strong>and</strong> DIDP range (di-isononylphthalate <strong>and</strong> di-isodecyl phthalate). The identifi cationof individual substances was not obvious <strong>and</strong> led toprobabilities in the laboratory report. But these areclearly technical mixtures as used in typical products forhigh-tension capacitors in microwave ovens (see paragraph4.3). With that, the results of the GC-MS full scananalysis could be asserted. The quantifi cation of thesemain components revealed that especially a very highamount of substituted biphenyls (18%) is found in capacitorsfrom microwave devices. In opposition, theamount of phthalates is situated in the per thous<strong>and</strong>range.Table 7 Quantifi cation of main components in capacitors from microwave devices (bulk sample Nº 4)Substance Group [ mg/kg ]Sum of biphenyls: (substituted <strong>by</strong> 4 methyl groups at most) 180’000Sum of DINP (di-isononyl phthalates) <strong>and</strong> DIDP (di-isodecyl phthalates) 2’15012
4 Discussion on the Results4.1 Uncertainties with the Sample PreparationThe varying results from the different laboratories on thesame bulk sample for the PCB content approximate factor10 with regard to N° 1 “mixture of large householdappliances” <strong>and</strong> N° 6 “ballasts in fl uorescent tubelamps”. Even with a complex matrix, such as shreddedold capacitors, this is, on principle, not acceptable. Anoverall survey was therefore set to clarify the causes ofthe differences <strong>and</strong> fi nd out which results were the mostreliable. Even an experienced PCB analyst could notfi n d a concluding answer to the two questions as,among others, gaps occurred in the specifi cations formethods <strong>and</strong> quality assurance systems of the laboratories.Potential sources of error with reconditioning <strong>and</strong>splitting were identifi ed in the three laboratories. Insuffi -cient extraction yield may have caused the low values,while too high values can result from the unsatisfactorysplitting of congeners, if, according to the st<strong>and</strong>ard,they are multiplied with the factor following LAGA. All inall, we must assume that the real PCB contents aresituated in the middle of the ranges given <strong>by</strong> Table 5.The values derived for interpretation were calculated onthe basis of these ranges. Anyway, for deriving conclusions,the analytical uncertainties are of minor signifi -cance.For plausibility considerations <strong>and</strong> comparisons withanalyses dating back about 20 years (BUWAL 1994), thenumber of PCB-containing capacitors was estimatedfrom the PCB contents in Table 5. By assuming a PCBshare of 40 % in PCB-containing capacitors (KTAG1998) <strong>and</strong> an average weight for small capacitors reckonedaccording to the corresponding device category,we come to the absolute <strong>and</strong> percentual shares from themeasured PCB contents of Table 8. It is a rough estimate,as these assumptions are not suffi c iently securedstatistically. In spite of this reservation, these results allowa comparison with studies performed in 1988 (BU-WAL 1994). The decrease is signifi cant for all the devicecategories. Moreover, both studies reveal that the highestshares in PCB-containing capacitors originate fromdevice categories averaging the longest service life.Also this result is plausible.Table 8 Calculated number of PCB-containing capacitors, compared with 1988N° Origin of Capacitors AverageWeight[g]Number ofCapacitors,R<strong>and</strong>omSample[ – ]Large Household Appliances (LHA), Small Household Appliances (SHA)Number ofPCB-ContainingCapacitors[ – ]Share1 LHA mixture 150 2’767 10–114 0.4–4.1 8.42 Dishwashers 150 147 < 1 < 0.1 4.23 SHA mixture, without microwave devices[ % ]ComparisonBUWAL 1994 7[ % ]80 163 < 1 < 0.1 1.44 Microwave devices 225 222 < 1 < 0.1 –5 Cooling <strong>and</strong> freezing appliances 100 1’480 < 1 < 0.1 0.56 Ballasts in fl uorescent tube lamps 120 825 51–511 6.2–61.9 68.5IT (Information Technology) / CE (Consumer Electronics) / UPS (uninterruptible power supply systems)7 IT / CE: capacitors < 1 cm 10 2’100 < 1 < 0.18 IT / CE: capacitors 1–2.5 cm 20 16’100 3 < 0.19 IT / CE: capacitors > 2.5 cm 40 3’125 8–15 0.3–0.510 UPS 500 534 < 1 < 0.1 –2.57Specimens of 1988, share calculated from subcategories13
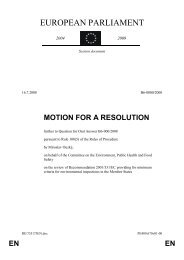
PCB’s in Small Capacitors from Waste Electrical <strong>and</strong> Electronic EquipmentsTable 9: Estimation of the PCB fl ows 2006 from small capacitors in diverse categories of wasteelectrical <strong>and</strong> electronic equipmentsDevice Category Capacitors 2006 8 [ t ] PCB Content [ mg/kg ] PCB Flows 2006 [ kg/a ]LHA 62 1’500–16’500 Ca. 90–1’020SHA 51 350–440 Ca. 20Fluorescent tube lamps 13 24’500–250’000 Ca. 330–3’330Cooling <strong>and</strong> freezingappliances1.5 5 0IT/CE 33 1’080–1’900 Ca. 40–60Total Ca. 500–4’4008The amount of capacitors per category has been estimated on the total; the amount of fl uorescent tube lamps, however, is very uncertain.4.2 Annual PCB FlowsPCB values measured <strong>and</strong> yearly amounts of processeddevices <strong>and</strong> capacitors allow the estimate of PCB fl owsfrom small capacitors in electrical <strong>and</strong> electronic equipments.Most notably, the amount of capacitors percategory is evaluated, as the companies are not differentiatingthem according to the categories. The rangesshown in Table 9 come from the analytical uncertainties(see paragraph 4.1). Obviously, > 95 % of the PCB fl oworiginates from large household appliances (90 –1’020 kg/a) <strong>and</strong> ballasts in fl uorescent tube lamps(330 – 3’330 kg/a). This annual fl ow of 500 – 4’400 kg/afrom WEEE is to be related with fl ows in the environment<strong>and</strong> earlier consumption data. Distinctly lower PCBfl o ws result from small household appliances, IT <strong>and</strong>CE. With regard to the very small PCB concentrations incapacitors from cooling <strong>and</strong> freezing appliances, thisfl o w is insignifi cant. In Table 9, the annual PCB fl ows2006 are compiled.According to a study <strong>by</strong> the Swiss Federal Offi c e for theEnvironment (BUWAL 1994), the total yearly atmosphericPCB deposition is rated 2’000 – 8’000 kg/a. For a majorpart, this deposition emanates from the remobilisationof already present environmental contaminations.Ballasts from fl uorescent tube lamps, contaminated oilsfrom motors, transformers <strong>and</strong> switches, contaminatedfl o ors in scrap treatment plants <strong>and</strong> former PCB usersare cited as primary anthropogenic sources for a possiblenew entry. In this study, small capacitors fromhousehold appliances are considered as insignifi cantsources, <strong>and</strong> the load due to waste electronic equipment(IT/CE) is rated as minor.Basing upon offi c ial statistical enquiries, net imports,consumption fi gures <strong>and</strong> waste exports of PCB forSwitzerl<strong>and</strong> in 1975-1984 are registered in Fig. 3. Thetotal consumption in the course of these 10 years rangedaround 600 t. The latter are not including the importedsmall capacitors (BUWAL 1994). In this same study,the consumption of PCB’s in ballasts in fl uorescent tubelamps has been derived from German conditions. Thus,a yearly total averaging 50 t was supposedly used in thetime span 1959 –1980 for this purpose exclusively. Infl u orescent tube lamps disposed of under control, approximate5 % of the former consumption are supposedto be dealt with about 50 years later. Taking into accountthe fact that nearly 50 % of the capacitors in ballastsoriginate from the bulk sample between 1960 <strong>and</strong> 1980(see Annex C), the calculated fl ow of 0.3 – 3 t/a is verysmall – a further indication that the largest share of fl u-orescent tube lamps is being disposed of uncontrolledlywith the metal scrap. On 29.7.1983, the production ofPCB-containing small capacitors was stopped (BUWAL1994).14
Fig. 3 Import <strong>and</strong> use of PCB’s in Switzerl<strong>and</strong>; small capacitors imported in devices are not covered <strong>by</strong> thestatistical data (BUWAL 1994)180160140120net importswaste exports (t)use in devices (t)tons/year100806040200-201975 1976 1977 1978 1979 1980 1981 1982 1983 1984According to a PCB mass balance for Austria <strong>by</strong> the Umweltbundesamt(Austrian Federal Environment AgencyUBA-AU 1996), the whole PCB inventory 1995 in closedsystems amounted to 481– 571 t. As rendered <strong>by</strong> thisstudy, an essential share of the estimated stock inventoryof 47– 56 % is to be derived from small capacitors indevices <strong>and</strong> electronics. The annual emission potentialin the year 2006 from old washing machines <strong>and</strong> fl uorescenttube lamps is rated at 9’700 kg, with over 99 % ofthe capacitors coming from ballasts in fl uorescent tubelamps. By considering the relative rejection rates, theannual emission potential was calculated from 1960 to2020 (see Fig. 4).Fig. 4: Annual potential level of PCB emissions in tons, from small capacitors in fl uorescent tube lamps <strong>and</strong>washing machines – projections for Austria (UBA-AU 1996); error range 20 %tons PCB40353025201510501961 1965 1969 1973 1977 1981 1985 1989 1993 1997 2001 2005 2009 2013 2017year15
PCB’s in Small Capacitors from Waste Electrical <strong>and</strong> Electronic EquipmentsWe may assume that the situation in Switzerl<strong>and</strong> doesnot differ much from that in Austria. By converting thetotal annual fl ow 2006 in Austria proportionally to theSwiss population fi gure, we reach a PCB fl ow of approx.8’500 kg/a from WEEE in Switzerl<strong>and</strong>. Compared withSwiss consumption fi gures, circumstances abroad <strong>and</strong>former examinations, <strong>and</strong> in spite of the analyticaluncertainties, the fl ows derived from the analyses areplausible.4.3 PCB SubstitutesAll matters <strong>and</strong> groups of substances identifi ed qualitativelywith the screening methods described under paragraph3.3, are presented in Table 10. In most of thecases, larger groups of substances with a great numberof individual matters are found, <strong>and</strong> these latter can varyconsiderably from each other. Interpretations must thereforebe made with great reservations. As far as it isknown, the substances are subdivided according totheir functions in capacitors <strong>and</strong> labelled with the EUClassifi cation Risk Phrases for Hazardous Substances.As a fi rst priority, the offi c ial classifi cation of hazardousmatters was founded upon the Directive (1967/548/EWG). A list of the hazardous matters with their respectiveclassifi cation is given in Annex II of the present Directive.Hazard classifi cations for substances not includedin this list can be found in safety data sheets frommanufacturers or other databases, such as the IUCLID 9Chemical Data Sheet.Table 10: Overview of identifi ed substance groups following capacitor samples with the marking ofhazardous materialsIdentified Substances <strong>and</strong>Substance GroupsMarking of Hazardous MaterialsOfficialAnnex II 67/548/CEElectrolytes, Solvents <strong>and</strong> Other AdditivesOther SourcesN,N, dimethylacetamide, R20/21, 36, 40, 61 X X(2-)hydroxybenzoic acid R22, 37/38, 41 XBenzyl alcohol R20, 22 XDimethylbenzyl alcohol R22, 36/37/38 XPCB Substitutes (Dielectrics)Naphthalene R22, 40, 50/53 X X X X XChlorinated naphtaleneR20/21/22,36/37/38X X X X XDibutyl phtalates R40, 50, 61, 62 X X X X X X X XDiethyl phtalates X X X X X X X XDiethylhexyl phathalates R40, 60, 61 X X X X X X X X1,1-diphenyl ethan2,2’-dimethyl biphenylBiphenyl, substituted(alkyled) biphenylsXXX X 10 X XDiverse hydrocarbons X X X X XMatters with Unknown Function(1-)methyl naphthalene R22, 36/37/38,42/43, 51/53Triphenyl phosphate R50/53 XHexabrom-benzene1,11-dibromoundecaneR20/21/22/22,36/37/381 LHA MIxture2 Dishwashers3 SHA MixtureX4 MicrowavesX5 Cooling <strong>and</strong> freezingappliances6 Fluorescent Tube Lamps7 IT / CE < 1 cmX8 IT / CE 1 – 2.5 cmX7 IT / CE > 2.5 cm10 UPS Systems9International Uniform Chemical Information Database10Quantitative value: 18 % referring to capacitor weight16
6 BibliographyBAG (2006). PCB und seine Auswirkungen auf die menschliche Gesundheit. Bern, Bundesamt für Gesundheit.Baumann, J. (2005). Stoffe in elektronischen Anwendungen. Zürich, Siemens.BUWAL (1994). Diffuse Quellen von PCB in der Schweiz. Schriftenreihe Umwelt Nr. 229. Bern, BUWAL.BUWAL (2000). Wegleitung zur Verordnung über die Rückgabe, die Rücknahme und die Entsorgung vonelektrischen und elektronischen Geräten (VREG). W. u. L. Bundesamt für Umwelt.BUWAL (2004). Metallische und nicht-metallische Stoffe im Elektronikschrott. Schriftenreihe UmweltNr 374. Bern, BUWAL.EU (2002). Directive on waste electrical <strong>and</strong> electronic equipment (WEEE). E. Union, Offi c ial Journal of theEuropean Union. 2002/96/EC.Hentschel, J. (2000). Kondensatoren – Kenngrössen und Bauformen, BBS II Merseburg-Leuna.KTAG (1998). PCB in Vorschaltgeräten von Fluoreszenzlampen – eine Bilanzierung. Aarau.Kuhn, E. und R. Arnet (2000). PCB in Fluoreszenzlampen. Bulletin SEV/VSE.Morf, L. S., J. Tremp, et al. (2007). “Metals, non-metals <strong>and</strong> PCB in electrical <strong>and</strong> electronic waste – Actuallevels in Switzerl<strong>and</strong>.” Waste Management 27(10): 1306–1316.19
PCB’s in Small Capacitors from Waste Electrical <strong>and</strong> Electronic EquipmentsAnnex A: Summarized Results of the Analyses 2005 <strong>by</strong> Technical Control Bodies of<strong>SENS</strong> <strong>and</strong> <strong>SWICO</strong>In 2005, the technical control bodies of <strong>SENS</strong> <strong>and</strong> SWI-CO studied the case of polychlorinated biphenyls(PCB’s) in small capacitors. The study focussed on thesampling of eight varying types of small capacitors fromelectrical <strong>and</strong> electronic equipments, their preparation<strong>and</strong> analysis of PCB’s <strong>and</strong> total chlorine concentration.Additionally, the composition of three capacitors fromuninterruptible power supply systems (UPS) was examined<strong>by</strong> Empa St. Gall.By means of a gas chromatograph with electron capturedetector (ECD), the PCB’s were determined, accordingto DIN 51’527, <strong>and</strong> rated <strong>by</strong> projection basing on factor5 following LAGA. The total chlorine content was appraisedaccording to DIN EN ISO 10’304.It appears from the analyses that the PCB content ofcapacitors from printed wiring boards, power supplyunits, uninterruptible power supply systems, smallhousehold appliances (SHA) <strong>and</strong> lamps was situatedunder the detection limit (< 5 mg/kg) or approximating,for electrolyte capacitors, 6 mg/kg. Capacitors from largehousehold appliances (LHA) reached a PCB contentof 3’623 mg/kg.By determining the total chlorine content, the chlorine inPVC was taken into account. Consequently, the resultsare undifferentiated <strong>and</strong> cannot be used for further interpretations.The analyses performed <strong>by</strong> Empa St. Gall on the compositionof three capacitors from uninterruptible powersupply systems (see Table 12) did not reveal the presenceof particularly toxic matters. As dielectrics in papercapacitors which, previously to 1984, often consisted ofPCB’s, the following substitutes could be identifi ed:Capacitors A: glycol derivate, totally absorbed <strong>by</strong> paperCapacitors B: l ow volatile mineral oil, consistence resemblingpetroleum jellyCapacitors C: d ioctyl phtalate, diphenyl ethane <strong>and</strong> dimethyldiphenyl, thin fl uid consistenceTable 11 PCB <strong>and</strong> total chlorine content of diverse capacitor types from waste electrical <strong>and</strong>electronic equipmentDevice Categories / Components Amount Weight [ g ] PCB’s [ mg/kg ] Total Chlorine [ % ]Printed wiring boards, mid-size 200 2’580 < 5 1.20Printed wiring boards, large 50 3’340 < 5 0.36Power supply, small 400 2’040 < 5 0.68Power supply, mid-size – large 40 760 < 5 0.51UPS, mixed 50 600 < 5 0.92Large electrical equipments 35 4’270 3’623 0.81Elektrolyte capacitors 24 2’950 6 0.38Small household appliances<strong>and</strong> lamps25 2’709,5 < 5 0.10Table 12 Composition of three capacitors from uninterruptuble power supply systems (Empa St. Gallen, 2005)Text Capacitors A Capacitors B Capacitors CTotal weight, g 750 344 139Aluminium casing, weight in g 110 60 41Aluminium casing, share in % 15 17 29Aluminium sheet, weight in g 330 105 31Aluminium sheet, share in % 44 31 22Plastic material etc., weight in g 320 140 40Plastic material etc., share in % 43 41 29Oil etc., weight in g 0 35 30Oil etc., share in % 0 10 2220
Annex B: Pictures of Supplied, Precrushed Capacitor SamplesLarge Household Appliances (LHA), Small Household Appliances (SHA) <strong>and</strong> Cooling <strong>and</strong> Freezing Appliances1 Large household appliances (LHA), mixed2 Dishwashers (LHA)3 Small household appliances (SHA), mixed, without microwave devices4 Microwave devices (SHA)5 Cooling <strong>and</strong> freezing appliances21
PCB’s in Small Capacitors from Waste Electrical <strong>and</strong> Electronic Equipments6 Ballasts in fl uorescent tube lampsIT (Information Technology) / CE (Consumer Electronics) / UPS (uninterruptible power supply systems)Information technology <strong>and</strong> consumer electronics (IT/CE):capacitors < 1 cmInformation technology <strong>and</strong> consumer electronics (IT/CE):capacitors 1–2.5 cmInformation technology <strong>and</strong> consumer electronics (IT/CE):capacitors > 2.5 cm22Uninterruptible power supply systems (UPS)
Annex C: Characterization of the Bulk Sample “Capacitors from Ballasts inFluorescent tube lamps”In the table below, quantities <strong>and</strong> weights of the analysedcapacitors from fl uorescent tube lamps or ballastsfor fl uorescent tubes, respectively, are compiled:Table 13 Sampling of capacitors from lamps; quantities <strong>and</strong> weights (campaign June – July 2007)Company Quantity apacitors Weight Capacitors[ kg ]Average Weight[ kg ]Weight Lamps[ kg ]Share Capacitorsin Lamps [ % ]Company 1 55 6.5 0.118 291 2.2Company 2 318 38.0 0.119 880 4.3Company 3 134 16.1 0.120 713 2.2Total 507 60.6 0.120 1884 3.2Compared to a previous study <strong>by</strong> the Cantonal LaboratoryAargau (Kantonales Labor Aargau), the averageweight of the capacitors (0.120 g) is lower <strong>by</strong> about65 %. Such a difference is probably due to a higher shareof more recent <strong>and</strong>, thus, capacitors lighter in weight(see Fig. 5 <strong>and</strong> Fig. 6).From the 507 collected capacitors, 239 (47 %) were individuallycharacterized with the name of the manufacturer,model / type, production date, weight <strong>and</strong> specifi cdeclarations. But considering the state of the capacitors(damages, painting), not all of them could be categorisedunambiguously. On the whole, 124 of the 507 examinedcapacitors (24 %) were designated as PCB-free.The average service life of capacitors from ballasts variesbetween 20 <strong>and</strong> 30 years (Kuhn <strong>and</strong> Arnet 2000). Itmay therefore be assumed that a signifi cant share ofPCB-containing capacitors is still in use.Fig. 5 Distribution of the years of manufacture for the analysed capacitors from ballasts infl u orescent tube lampsNumber of Capacitors [-]9080706050403020100until 1955 1956–1965 1966–1975 1976–1985 since 1986year notidentifiedFig. 6 Distribution of the weights of the analysed capacitors from ballasts in fl uorescent tube lamps350 00300 00250 00200 00150 00100 0050 000 00019501955 1960 1965 1970 1975 1980 1985 1990 1995 2000 2005year of manufacture23