by SENS and SWICO - Ecotic
by SENS and SWICO - Ecotic
by SENS and SWICO - Ecotic
You also want an ePaper? Increase the reach of your titles
YUMPU automatically turns print PDFs into web optimized ePapers that Google loves.
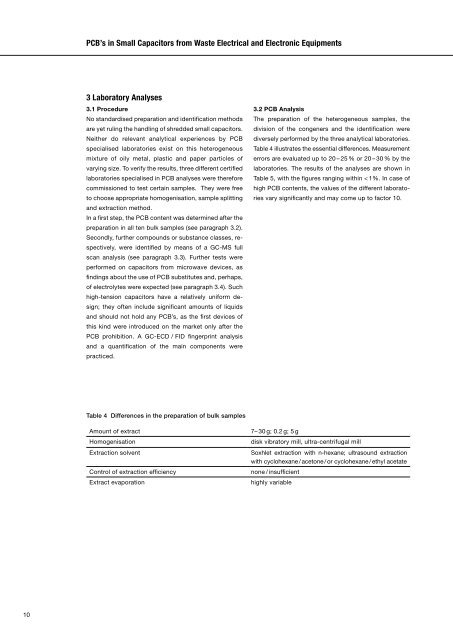
PCB’s in Small Capacitors from Waste Electrical <strong>and</strong> Electronic Equipments3 Laboratory Analyses3.1 ProcedureNo st<strong>and</strong>ardised preparation <strong>and</strong> identifi cation methodsare yet ruling the h<strong>and</strong>ling of shredded small capacitors.Neither do relevant analytical experiences <strong>by</strong> PCBspecialised laboratories exist on this heterogeneousmixture of oily metal, plastic <strong>and</strong> paper particles ofvarying size. To verify the results, three different certifi edlaboratories specialised in PCB analyses were thereforecommissioned to test certain samples. They were freeto choose appropriate homogenisation, sample splitting<strong>and</strong> extraction method.In a fi rst step, the PCB content was determined after thepreparation in all ten bulk samples (see paragraph 3.2).Secondly, further compounds or substance classes, respectively,were identifi ed <strong>by</strong> means of a GC-MS fullscan analysis (see paragraph 3.3). Further tests wereperformed on capacitors from microwave devices, asfi n dings about the use of PCB substitutes <strong>and</strong>, perhaps,of electrolytes were expected (see paragraph 3.4). Suchhigh-tension capacitors have a relatively uniform design;they often include signifi cant amounts of liquids<strong>and</strong> should not hold any PCB’s, as the fi rst devices ofthis kind were introduced on the market only after thePCB prohibition. A GC-ECD / FID fi n gerprint analysis<strong>and</strong> a quantifi cation of the main components werepracticed.3.2 PCB AnalysisThe preparation of the heterogeneous samples, thedivision of the congeners <strong>and</strong> the identifi cation werediversely performed <strong>by</strong> the three analytical laboratories.Table 4 illustrates the essential differences. Measurementerrors are evaluated up to 20 – 25 % or 20 – 30 % <strong>by</strong> thelaboratories. The results of the analyses are shown inTable 5, with the fi gures ranging within < 1%. In case ofhigh PCB contents, the values of the different laboratoriesvary signifi cantly <strong>and</strong> may come up to factor 10.Table 4 Differences in the preparation of bulk samplesAmount of extractHomogenisationExtraction solventControl of extraction effi ciencyExtract evaporation7– 30 g; 0.2 g; 5 gdisk vibratory mill, ultra-centrifugal millSoxhlet extraction with n-hexane; ultrasound extractionwith cyclohexane / acetone / or cyclohexane / ethyl acetatenone / insuffi c ienthighly variable10


