PCB’s in Small Capacitors from Waste Electrical <strong>and</strong> Electronic Equipments2 Sampling <strong>and</strong> Sample Preparation2.1 SamplingIn dismantling plants <strong>and</strong> at the work places of diverserecycling companies, who are currently discharging pollutants,capacitors from diverse categories <strong>and</strong> types ofequipments were collected. The analysed categories ortypes of equipments, respectively, <strong>and</strong> the amount ofremoved capacitors are shown on Table 2.The capacitors were removed from the equipmentsbetween June <strong>and</strong> August 2006, <strong>and</strong> the amount of r<strong>and</strong>omsamples was 1’482 kg, which corresponds to about1.2 % of all the capacitors removed in 2006 from equipments.The various recycling companies represent differingtrading areas <strong>and</strong> customer segments.The amount of capacitor samples was chosen in a wayto have, the relative quantity of sampled equipmentscorrespond in each case to at least 1 % of the yearlytotal of processed units. Table 3 composes the sampledshare of the yearly processed equipments followingtheir respective categories. The estimations on theshare of capacitors within a category of equipments arebased upon r<strong>and</strong>om sample analyses or batch tests.With regard to cooling <strong>and</strong> freezing appliances <strong>and</strong> IT/CE’s, more than one per cent of the yearly total could besampled, as for LHA’s, they reached 0.7 %, lamps 0.5 %<strong>and</strong> SHA’s merely 0.2 %, due to the temporally limitedsampling. The quantity of processed uninterruptiblepower supply systems has not been accounted in thematerial fl ow compilation of <strong>SENS</strong> <strong>and</strong> <strong>SWICO</strong>. Hence,there are no indications about the processed amounts.It is assumed that a large part of the fl uorescent tubelamps is not being registered <strong>by</strong> the collective systems<strong>and</strong> ending directly in the scrap metal. According to theSwiss Lighting Recycling Foundation (SLRS) about 1.5million fl uorescent tube lamps were sold in 2006. Bysupposing an average weight of 3.7 kg per fl uorescenttube lamp (see Annex C), it would correspond to a materialamount of 5’570 t. In 2006, only 420 t lamps (fl uorescenttube <strong>and</strong> other lamps) were processed withinthe collective systems, however, a much higher wastevolume is expected.Table 2 Amount of capacitor r<strong>and</strong>om samples following the category or type of equipmentN° Origin of Capacitors WEEE Category Amount of Capacitors[ kg ] [ % ]Large Household Appliances (LHA), Small Household Appliances (SHA)1 LHA mixture 1 415 28.02 Dishwashers 1 22 1.53 SHA mixture, without microwave devices 2 13 0.94 Microwave devices 1 50 3.45 Cooling <strong>and</strong> freezing appliances 1 148 10.06 Ballasts in fl uorescent tube lamps 3 5 99 6.7IT (Information Technology) / CE (Consumer Electronics) / UPS (uninterruptible power supply systems)7 IT/CE: capacitors < 1 cm 3, 4 21 1.48 IT/CE: capacitors 1-2.5 cm 3, 4 322 21.79 IT/CE: capacitors > 2.5 cm 3, 4 125 8.410 UPS (uninterruptible power supply systems) – 267 18.0Total 1’482 100.03Two separate samplings – campaigns: June – August 2006 (38 kg) <strong>and</strong> June – July 2007 (61 kg)8
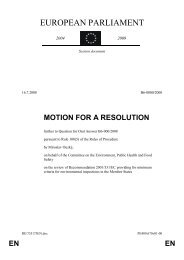
Fig. 1 Shredder for the reduction of the capacitors (type: Vecoplan VAZ105/120, 18.5 kW, approx. 550 kg/h) <strong>and</strong> 8 mm sieve used for IT/CE< 1cm (bulk sample N° 7)Fig. 2 Splitting <strong>and</strong> reduction of samples <strong>by</strong> means of splitting the angle ofrepose of the shredded materialTable 3 Share of sampled equipments from the total amount of processed units in the collectivesystems <strong>SENS</strong>, <strong>SWICO</strong> <strong>and</strong> SLRS in 2006Category of EquipmentBulkSampleN°Amount ofCapacitorSamples[ kg ]Share ofCapacitors(Estimation)[ kg/t ]ProcessedTotal 2006[ t ]Amount of SampledEquipments[ t ]LHA 1, 2 437 2.5 24’709 175 0.7SHA 3, 4 63 2.4 1 10’673 26 0.2Fluorescent tubelampsCooling <strong>and</strong>freezing appliances6 99 32 420 2 0.75 148 0.1 14’929 1’480 9.9IT/CE 7, 8, 9 468 0.8 41’713 585 1.4UPS 10 267 n.d. 2 n.d. n.d. n.d.Sample Share/Amount 2006[ % ]1determined from estimated shares of capacitors in SHA’s (0.8 kg/t) <strong>and</strong> microwave devices (5 kg/t); in Switzerl<strong>and</strong>, microwaved e vices are assigned to SHA’s, in the EU, they are considered as large WEEE equipments, category 12n.d.: no data availableThe capacitor samples collected according to the categoriesof equipments were checked visually for theirbelonging to the respective categories of equipments<strong>and</strong> for the eventual presence of interfering matters. Itmay be assumed that the separation according to thecategories of equipments was performed reliably. AnnexB presents the supplied or coarsely shredded capacitors,respectively. The number of capacitors, the manufacturersor other product data were seized for bulk sample“ballasts in fl uorescent tube lamps” only. Consideringthe very high quantities (about 30’000 smallcapacitors), such cost <strong>and</strong> time consuming compilationshad to be ab<strong>and</strong>oned for the other samples.2.2 Sample PreparationThe crushing of the collected small capacitors occurredin a fi ne shredder (sieve 12 mm or 8 mm, respectively, forbulk sample IT/CE < 1 cm). After every passage, theshredder was dry cleaned <strong>and</strong> eventual residues removedwith toluene. As a further measure to avoid transmissions,a forerun of about 10 % of the input was practisedin every case <strong>and</strong> not used for the sample concerned.After shredding, the amount of samples was reduced toabout 2 kg <strong>by</strong> means of splitting the angle of repose ofthe shredded material in a structured way. Further preparations<strong>and</strong> analyses were practiced in the laboratory.9