Nishuane Elementary School - NJ Safe Routes to School
Nishuane Elementary School - NJ Safe Routes to School
Nishuane Elementary School - NJ Safe Routes to School
- No tags were found...

Create successful ePaper yourself
Turn your PDF publications into a flip-book with our unique Google optimized e-Paper software.
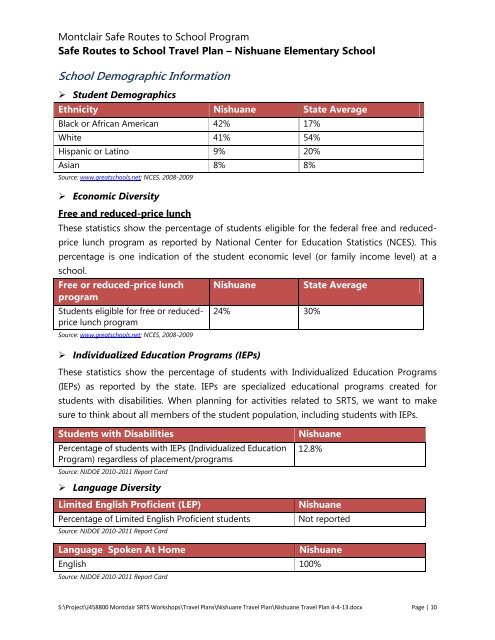
Montclair <strong>Safe</strong> <strong>Routes</strong> <strong>to</strong> <strong>School</strong> Program<strong>Safe</strong> <strong>Routes</strong> <strong>to</strong> <strong>School</strong> Travel Plan – <strong>Nishuane</strong> <strong>Elementary</strong> <strong>School</strong><strong>School</strong> Demographic Information‣ Student DemographicsEthnicity <strong>Nishuane</strong> State AverageBlack or African American 42% 17%White 41% 54%Hispanic or Latino 9% 20%Asian 8% 8%Source: www.greatschools.net; NCES, 2008-2009‣ Economic DiversityFree and reduced-price lunchThese statistics show the percentage of students eligible for the federal free and reducedpricelunch program as reported by National Center for Education Statistics (NCES). Thispercentage is one indication of the student economic level (or family income level) at aschool.Free or reduced-price lunchprogramStudents eligible for free or reducedpricelunch programSource: www.greatschools.net; NCES, 2008-2009<strong>Nishuane</strong>‣ Individualized Education Programs (IEPs)24% 30%State AverageThese statistics show the percentage of students with Individualized Education Programs(IEPs) as reported by the state. IEPs are specialized educational programs created forstudents with disabilities. When planning for activities related <strong>to</strong> SRTS, we want <strong>to</strong> makesure <strong>to</strong> think about all members of the student population, including students with IEPs.Students with DisabilitiesPercentage of students with IEPs (Individualized EducationProgram) regardless of placement/programsSource: <strong>NJ</strong>DOE 2010-2011 Report Card<strong>Nishuane</strong>12.8%‣ Language DiversityLimited English Proficient (LEP)Percentage of Limited English Proficient studentsSource: <strong>NJ</strong>DOE 2010-2011 Report Card<strong>Nishuane</strong>Not reportedLanguage Spoken At Home<strong>Nishuane</strong>English 100%Source: <strong>NJ</strong>DOE 2010-2011 Report CardS:\Project\J458800 Montclair SRTS Workshops\Travel Plans\<strong>Nishuane</strong> Travel Plan\<strong>Nishuane</strong> Travel Plan 4-4-13.docx Page | 10