Statistics 13 Solution for Homework #5
Statistics 13 Solution for Homework #5
Statistics 13 Solution for Homework #5
- No tags were found...
Create successful ePaper yourself
Turn your PDF publications into a flip-book with our unique Google optimized e-Paper software.
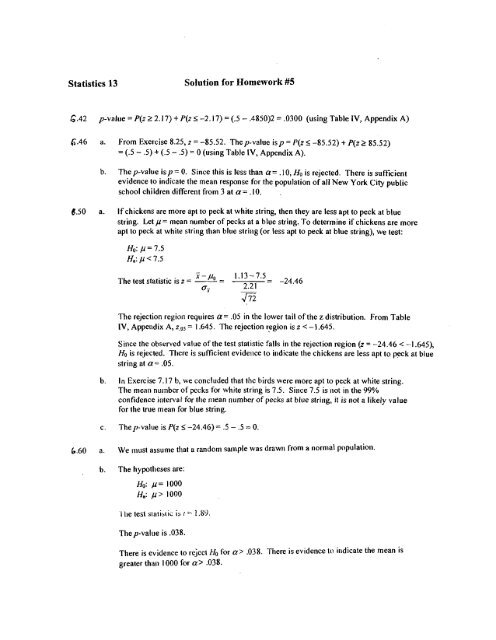
<strong>Statistics</strong> <strong>13</strong> <strong>Solution</strong> <strong>for</strong> <strong>Homework</strong> <strong>#5</strong>6.42 p-value = P(z 2 2.17) + P(z I -2.17) = (-5 - .4850)2 = .0300 (using Table IV, Appendix A)6.46 a. From Exercise 8.25, z = -85.52. The y-value isp = P(z 5 -85.52) + P(z 2 85.52)= (.5 - .5) -+ (.5 - .5) = 0 (using Table lV, Appendix A).b. The y-value is y = 0. Since this is less than a= .lo, Ho is rejected. There is sufficientevidence to indicate the mean response <strong>for</strong> the population of all New York City publicschool children different from 3 at a= .lo. .6.50 a. If chickens are more apt to peck at white string, then they are less apt to peck at bluestring. Let ,u= mean number of pecks at a blue string. To determine if chickens are moreapt to peck at white string than blue string (or less apt to peck at blue string), we test:The test statistic isZ-PO 1.<strong>13</strong>-7.5z = - fl.. 2.21= -24.46The rejection regio~i requires ff= .05 in tlie lower tail of the z distribution. From TableIV, Appendix A, 2.0~ = 1.645. The rejection region is z < -1.645.Since the observed value of the test statistic falls in the rejection region (z = -24.46 < --I .645),Ho is rejected. There is sufficient eviderice to indicate the chickens are less apt to peck at bluestring at a= .05.b. In Exercise 7.17 b, we concluded that tlic birds were more apt to peck at white string.The mean nurnbcr of pccks <strong>for</strong> white string is 7.5. Since 7.5 is riot in the 99%confidence interval <strong>for</strong> the mean number of pecks at blue string, it is not a likely value<strong>for</strong> the true mean <strong>for</strong> blue string.6.60 a. We ~iiust assume that a random sample was draw11 from a normal population.b. The hypotheses are:'I Ile test slati>~.ii: is I1 .S9.The y-value is ,038.There is evidence to rejcct kIO <strong>for</strong> a> .038. There is evidence to indicate tlie mean isgreater than I000 <strong>for</strong> a> .038.
c. The hypotheses are:The test statistic is t = 1.89.'There is no evidence to reject Ho <strong>for</strong> a= .05. There is insufficient evidence to indicatethe mean is different than 1000 <strong>for</strong> a= .05.'fliere is evidence to reject Ho <strong>for</strong> a > .076. There is evidence to indicate the mean isdifferent than I000 <strong>for</strong> a > .076.6.62 a. To determine if the average number of books read by all students who participate in theextensive reading program exceeds 25, we test:b. The rejection region requires a=.05 in the upper tail of the t distribution with df = n - 1= 14 - 1 = <strong>13</strong>. From Table V1, Appendix A, toj = 1.771. The rejection region is t >1.77 1.X-,D, - 31.64-25c. 'I'he test statistic is t = - S 10.485= 2.37d. Since the observed value of the test statistic falls in the rejection region(t = 2.37 > 1.771), Ho is rejected. There is sufficient evidence to indicate that theaverage number of books read by all students who participate in the extensive readingprogram exceeds 25 at a = .05.e. The conditions required <strong>for</strong> this test is a random sample from the target population andthe population from which the sample is selected is approximately normal.6.66 a. To deter~iiine if the mean repellency percentage of the new mosquito repellent is lessthan 95, we test:Z-Po 83 - 95The test statistic is t = ----- ------ = -1.79s/& 15/&
The rejection region requires a= . I0 in the lower tail of the t distribution. From 'TableV1, Appendix A, with df = n - I = 5 - I = 4, t = 1.533. The rejection region is t 1.28.Since the observed value of the test statistic falls in the rejection region (1.89 > 1.28),Ho is rejected. There is sufficient evidence to indicate that the proportion is greater than.65 at a= .lo.P - po - p - po - .74 -.90The test statistic is z L - ----- . = -5.33The rejection region requlres d 2 = ,0512 = .025 in each tail of the z distribution. FromTable lV, Appendix A. = 1 96. The re-iection region is z .: - 1.96 or z > I .96.Since the observed value of the test statistic falls in the rejection region (-5.33 < -1.96),Ho is rejected. There is sufficient evidence to indicate that the proportion is differentfrom .90 at a= .05.
d. For confidence coefficient .95, a= .05 and d2 = .025. From Table IV, Appendix A,z 025 = 1.96. The confidence interval is:e. For confidence coefficient .99, a= .0l and d2 = .005. From Table IV, Appendix A,zoos = 2.58. The confidence interval is:x 646.78 a. The point estimate <strong>for</strong>p is j = - =- = .604n 106b. Ho: p = .70Ha: p # .70p - po - ,604 - .70c. The test statistic is z = -2.16d. 'The rejection region requires d 2 = .01/2 -= .005 in each tail of the z distribution. FromTable IV, Appendix A, zoos = 2.58. The rejection region is z < -2.58 or z > 2.58.e. First, check to see if the normal approximation will be adequate:Since the interval is co~npletely in the interval (0, I), the normal approxi~nation will beadequate. ,Since the observed value of the test statistic does not fall in the rejection region(z = -2.16 Q: -2.58), Ho is not rejected. There is insufficient evidence to indicate theproportion of consumers who believe "Made in the USA" means 100% of labor andmaterials are from the United States is different from .70 at a= .O1.x 356.82 ' a. ?.he point estimate <strong>for</strong> p is p = - = ---- = .030n 1,165First, check to see if the normal approximation will be adequate:Since the interval is completely in the interval (0, I), the normal approximation will beadequate.
To determine if the true driver cell phone use rate differs from .02, we test:,030 - .02The test statistic is z = ----- - 2.44The rejection region requires d 2 = .05/2 = .025 in each tail of the z distribution. Fro111Table IV, Appendix A, 2.025 = 1.96. The rejection region is 2 < -1.96 or z > 1.96.Since the observed value of the test statistic falls in the rejection region(z = 2.44 > 1.96), Ho is rejected. There is sufficient evidence to indicate the true drivercell phone use rate differs from .02 at a= .05.b. I11 Exercise 7.49, the confidence interval <strong>for</strong>p is (.020, .040). Since .02 is contained inthis interval, there is no evidence to reject Ho. This does not agree with the conclusion<strong>for</strong> this test. However, if the calculations were carried out to 4 decimal places, theinterval would be (.0202, .0398). Using this interval, .02 is not contained in the interval.This agrees with the test in part a.6.86 For the Top of the Core:First, check to see if the normal approximation is adequate:Since the interval falls conlpletelq in the interval (0,l ), the normal tlistribution will bcadequate.To determine if the coat index exceeds .5, we test:The test statistic ia z -The rejection region requires a = .05 in the upper tai I of the z distribution. From Table IV,Appendix A, zo5 = 1.645. The rejection region is z > 1.645.Since thc observed value of the test statistic falls 111 the rejection region (z - 4.80 > 1.645), fhis rejected. 'fhere is sufficient evidence to indicate that the coat index exceeds .5 at LY= .05For tllc Rliddle of the Core:First, check to see if the ~~onnal approxi~nation is adequate:puk 30,) ail + 7 -3 5 5 3u- -v-11 -('5)('5) 3 .5 & 1 76 =, t.324, ,676)
Since the interval falls completely in the interval (0,l ), the normal distribution will beadequate.To determine if the coat index differs from .5, we test:p-po .479-.5 1The test statistic is z = - . - -.36The rejection region requires ~$2 = .05/2 = .025 in each tail of the z distribution. From TableIV, Appendix A, 2025 = I .96. The rejection region is z < -1.96 6r z > 1.96.Since the observed value of the test statistic does rlot fall in the rejection region (z = -.36 P:-1.96), Ho is not rejected. There is insufficient evidence to indicate that the coat index differsfrom .5 at a= .05.For the Bottom of the Core:First, check to see if the normal approxi~natioll is adequate:Since the interval falls co~npletely in the interval (0,l ), the normal distribution will beadequate.To determine if the coat index is less than .5, we test:The test statistic is z =The rejection region requires a= .05 in lhe lower tail of'the z distribution. From Table IV.Appendix A, zoj - 1.645. The rejectiorl region is z < -1.645.Since the observed value of the test statictic fklls in the re-jection region (z = -2.56 < -1.645),Ho is rejected. There is sufficient evidence to indicate that the coat index is less than .5 ata= .05.


