Sample Final(modified) - Statistics
Sample Final(modified) - Statistics
Sample Final(modified) - Statistics
Create successful ePaper yourself
Turn your PDF publications into a flip-book with our unique Google optimized e-Paper software.
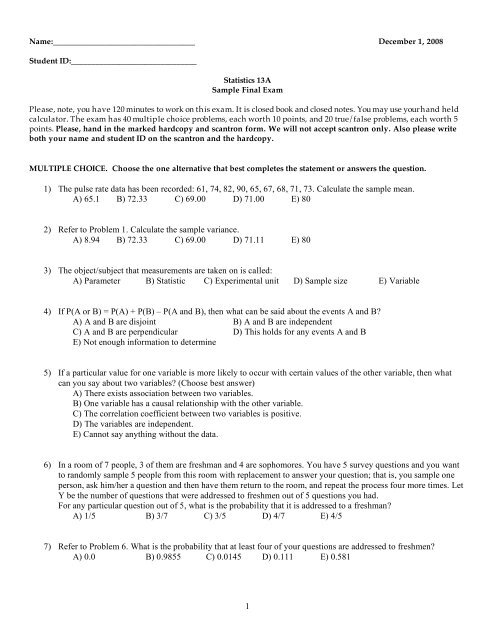
35) Find the p-value for a 2-tailed hypothesis test for population mean if the test statistics is observed to be 0.492 andthe sample size is 13.A) 0.6316 B) 0.6842 C) 0.3158 D) 0.492 E) 0.630936) The New York Times ran an article about a study in which Professor Denise Korniewicz and other John Hopkinsresearches subjected laboratory gloves to stress. Among 240 vinyl gloves, 63% leaked viruses. Among 240 latexgloves, 7% leaked viruses. Give the value of test statistic for testing the claim that vinyl groves have a larger virusleak rate than latex gloves.A) 15.89 B) 12.86 C) 450.70 D) 0.0205 E) 0.075837) When is it appropriate to use a pooled estimate of the standard deviation in hypothesis testing about comparingtwo population means?A) Two random samples are independent B) Two samples have approximately normal distributionsC) Population standard deviations are equal D) A and B E) A, B, and C38) In a study of red/green color blindness, 500 men and 2100 women are randomly selected and tested. Among men,45 have red/green color blindness. Among the women, 6 have re/green color blindness. Construct the 98%confidence interval for the difference between the color blindness rate of men and women.A) (0.0868, 0.0875) B) (0.0710, 0.1032) C) (0.0586, 0.1157)D) (0.0870, 0.0872) E) (0.0700, 0.1073)39) The 95% confidence interval of difference in two population means, µ 1 - µ 2 is (-0.63, 2.04). What conclusions canyou draw about the two population means?A) With 95% confidence, the mean of the first group is smaller than the mean of the second group.B) There is a 95% chance that the mean of the first group is bigger than the mean of the second group.C) With 95% confidence, the mean of the first group is not different from the mean of the second group.D) With 95% confidence, the mean of the first group is bigger than the mean of the second group.E) There is a 95% chance that the mean of the first group is not different from the mean of the second group.40) Refer to Problem 39. What can you conclude about a hypothesis test of the difference in two population means?A) Reject Ho that the two populations means are equal.B) Do not reject Ha that the two populations means are different.C) Reject Ha that the two populations means are different.D) Do not reject Ho that the two populations means are equal.E) There is not enough information to determine.TRUE/FALSE. Write 'A' if the statement is TRUE and 'B' if the statement is FALSE to the left of the question41) A categorical variable cannot be continuous.42) The median can also be referred to as a percentile.43) The second quartile of a standard normal distribution is 0.5
44) Consider a continuous random variable X=length of time (in hours) of a flight from SF to NY and suppose it has adistribution that looks like the following:The probability that a flight from SF to NY will be longer than 3.5 hours is 0.875.45) A histogram is a graphical display of one quantitative variable.46) For a discrete random variable X, P(X > 2) = P(X ≥ 2).47) In a room that contains 5 people, the probability that at least 2 of them have the same birthday is 0.548) The experiment consists of tossing 5 unbiased coins simultaneously. The number of outcomes in this experimentis 5.49) A numerical measure describing a sample is called a statistic.50) In a family of 3 children, the probability that exactly 2 of them are girls is 0.25.51) If a random sample is of size n ≥ 30, or if the original population is normally distributed, the distribution of thesample means has a normal distribution.52) An interval of numbers containing the most believable values for a parameter is called the confidence interval.53) When the degrees of freedom are small, t-distribution is slightly skewed.54) P-value is the probability that the test statistic equals the observed value or a value even more extreme, when thenull hypothesis is true.55) When performing the hypothesis test regarding population proportion, the assumption that np 0 ≥ 15 and n(1-p 0 ) ≥15 are required so that the sampling distribution of the sample proportion is normal.6
56) A test statistic is a quantity that is far away from zero when Ho is true and that is close to zero if Ha is true.57) If the null hypothesis is true but the test concluded with “do not reject null hypothesis”, then a Type II error ismade.58) The 95% confidence interval for the population proportion of voters supporting the bill is (0.78, 0.86). It isreasonable to expect to observe the proportion of voters supporting the bill to be p = 0.70.59) When the alternative hypothesis is two-sided, the null hypothesis is rejected for values of the test statistics locatedin either tail of that statistic’s sampling distribution.60) Degrees of freedom are equal to the difference between the 2 sample sizes.7


