The Distribution of Income in Ireland (2000) - Combat Poverty Agency
The Distribution of Income in Ireland (2000) - Combat Poverty Agency
The Distribution of Income in Ireland (2000) - Combat Poverty Agency
- No tags were found...
You also want an ePaper? Increase the reach of your titles
YUMPU automatically turns print PDFs into web optimized ePapers that Google loves.
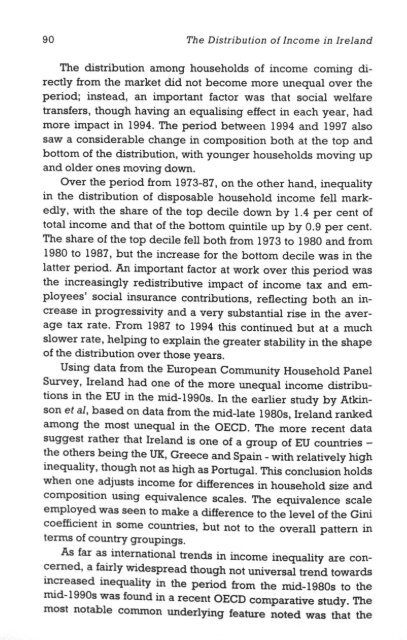
90 <strong>The</strong> <strong>Distribution</strong> <strong>of</strong> <strong>Income</strong> <strong>in</strong> <strong>Ireland</strong><strong>The</strong> distribution among households <strong>of</strong> <strong>in</strong>come com<strong>in</strong>g directlyfrom the market did not become more unequal over theperiod; <strong>in</strong>stead, an important factor was that social welfaretransfers, though hav<strong>in</strong>g an equalis<strong>in</strong>g effect <strong>in</strong> each year, hadmore impact <strong>in</strong> 1994. <strong>The</strong> period between 1994 and 1997 alsosaw a considerable change <strong>in</strong> composition both at the top andbottom <strong>of</strong> the distribution, with younger households mov<strong>in</strong>g upand older ones mov<strong>in</strong>g down.Over the period from 1973-87, on the other hand, <strong>in</strong>equality<strong>in</strong> the distribution <strong>of</strong> disposable household <strong>in</strong>come fell markedly,with the share <strong>of</strong> the top decile down by 1.4 per cent <strong>of</strong>total <strong>in</strong>come and that <strong>of</strong> the bottom qu<strong>in</strong>tile up by 0.9 per cent.<strong>The</strong> share <strong>of</strong> the top decile fell both from 1973 to 1980 and from1980 to 1987, but the <strong>in</strong>crease for the bottom decile was <strong>in</strong> thelatter period. An important factor at work over this period wasthe <strong>in</strong>creas<strong>in</strong>gly redistributive impact <strong>of</strong> <strong>in</strong>come tax and employees'social <strong>in</strong>surance contributions, reflect<strong>in</strong>g both an <strong>in</strong>crease<strong>in</strong> progressivity and a very substantial rise <strong>in</strong> the averagetax rate. From 1987 to 1994 this cont<strong>in</strong>ued but at a muchslower rate, help<strong>in</strong>g to expla<strong>in</strong> the greater stability <strong>in</strong> the shape<strong>of</strong> the distribution over those years.Us<strong>in</strong>g data from the European Community Household PanelSurvey, <strong>Ireland</strong> had one <strong>of</strong> the more unequal <strong>in</strong>come distributions<strong>in</strong> the EU <strong>in</strong> the mid-1990s. In the earlier study by Atk<strong>in</strong>sonet al, based on data from the mid-late 1980s, <strong>Ireland</strong> rankedamong the most unequal <strong>in</strong> the OECD. <strong>The</strong> more recent datasuggest rather that <strong>Ireland</strong> is one <strong>of</strong> a group <strong>of</strong> EU countries -the others be<strong>in</strong>g the UK, Greece and Spa<strong>in</strong> - with relatively high<strong>in</strong>equality, though not as high as Portugal. This conclusion holdswhen one adjusts <strong>in</strong>come for differences <strong>in</strong> household size andcomposition us<strong>in</strong>g equivalence scales. <strong>The</strong> equivalence scaleemployed was seen to make a difference to the level <strong>of</strong> the G<strong>in</strong>icoefficient <strong>in</strong> some countries, but not to the overall pattern <strong>in</strong>terms <strong>of</strong> country group<strong>in</strong>gs.As far as <strong>in</strong>ternational trends <strong>in</strong> <strong>in</strong>come <strong>in</strong>equality are concerned,a fairly widespread though not universal trend towards<strong>in</strong>creased <strong>in</strong>equality <strong>in</strong> the period from the mid-1980s to themid-1990s was found <strong>in</strong> a recent OECD comparative study. <strong>The</strong>most notable common underly<strong>in</strong>g feature noted was that theConclusionsshare <strong>of</strong> earn<strong>in</strong>gs go<strong>in</strong>g to the lower <strong>in</strong>come groups among thework<strong>in</strong>g population decreased <strong>in</strong> all the countries covered <strong>in</strong> thestudy. This was not, or not entirely, translated <strong>in</strong>to higher <strong>in</strong>equality<strong>of</strong> disposable <strong>in</strong>comes because both transfers and taxes<strong>of</strong>f-set its effects, and <strong>in</strong>deed <strong>in</strong> many countries the redistributiveeffects <strong>of</strong> taxes and transfers <strong>in</strong>creased over the period.Data from the ESRI household surveys was also used to exam<strong>in</strong>ethe distribution <strong>of</strong> earn<strong>in</strong>gs among Irish employees <strong>in</strong>1987, 1994 and 1997. <strong>The</strong> dispersion <strong>in</strong> Irish earn<strong>in</strong>gs was relativelyhigh by <strong>in</strong>ternational standards <strong>in</strong> 1994, hav<strong>in</strong>g <strong>in</strong>creasedfrom 1987 by more than most other OECD countries for whichdata are available. <strong>The</strong> comb<strong>in</strong>ation <strong>of</strong> changes <strong>in</strong> the ageeducationpr<strong>of</strong>ile <strong>of</strong> employees and higher returns to educationaccounted for much <strong>of</strong> that <strong>in</strong>crease <strong>in</strong> dispersion. Between 1994and 1997, when Irish economic growth accelerated rapidly, the<strong>in</strong>crease <strong>in</strong> earn<strong>in</strong>gs <strong>in</strong>equality slowed although the top <strong>of</strong> thedistribution did cont<strong>in</strong>ue to move away from the middle.<strong>The</strong> participation <strong>of</strong> married women <strong>in</strong> the paid labour forcehas been <strong>in</strong>creas<strong>in</strong>g rapidly <strong>in</strong> <strong>Ireland</strong>, so their wages havebeen account<strong>in</strong>g for a grow<strong>in</strong>g proportion <strong>of</strong> household <strong>in</strong>come.Elsewhere, this has been seen to <strong>in</strong>crease household <strong>in</strong>come<strong>in</strong>equality. That was found not to be the case for <strong>Ireland</strong>between 1987 and 1994, <strong>in</strong>deed the overall impact <strong>of</strong> <strong>in</strong>creasedparticipation was seen to have an equalis<strong>in</strong>g effect. This wasmostly because <strong>in</strong>creases <strong>in</strong> female employment rates weregreatest among wives married to husbands with relatively lowearn<strong>in</strong>gs. <strong>The</strong>re is no guarantee that this has cont<strong>in</strong>ued to bethe case as married women's labour force participation hascont<strong>in</strong>ued to rise, but this f<strong>in</strong>d<strong>in</strong>g serves to demonstrate thecomplexity <strong>of</strong> the relationship between trends <strong>in</strong> the labourmarket and the household <strong>in</strong>come distribution.Much rema<strong>in</strong>s to be done before we fully understand howme shape <strong>of</strong> the Irish <strong>in</strong>come distribution has been evolv<strong>in</strong>gand the nature <strong>of</strong> the forces produc<strong>in</strong>g that distribution. Thisstudy should be seen as provid<strong>in</strong>g one <strong>of</strong> the build<strong>in</strong>g-blockson which such an understand<strong>in</strong>g can be built.91


