Annual Report 2010 2009 2008 2007 - Kvaerner
Annual Report 2010 2009 2008 2007 - Kvaerner
Annual Report 2010 2009 2008 2007 - Kvaerner
- No tags were found...

Create successful ePaper yourself
Turn your PDF publications into a flip-book with our unique Google optimized e-Paper software.
<strong>Annual</strong> report <strong>2010</strong>
2 Aker Solutions annual report <strong>2010</strong>ContentsContents• Key figures <strong>2010</strong> 3• Letter to shareholders 4• Board of directors’ report 5Summary 5Business overview 5<strong>Report</strong> for <strong>2010</strong> 6Company, people and community 10• <strong>Annual</strong> accounts 17Declaration by the Board of Directorsand President & CFO 17Aker Solutions group 19Aker Solutions ASA 67Auditor’s report 75• Share and shareholder information 76Share and shareholder information 76Analytical information 80• Corporate governance 81Corporate governance 81Board of directors 88Executive chairman and President 90Business management 90Corporate centre functions 92Company information 93Aker Solutions annual report <strong>2010</strong>
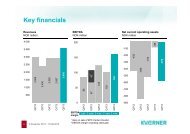
Aker Solutions annual report <strong>2010</strong>This is Aker Solutions3Key figures <strong>2010</strong>(Continuing operations only)Orders and results <strong>2010</strong> <strong>2009</strong>Order backlog 31 December NOK mill 50 775 52 740Order intake NOK mill 46 341 49 048Operating revenues NOK mill 46 267 49 856EBITDA NOK mill 3 778 4 095EBITDA-margin Percent 8.2% 8.2%Net profit NOK mill 1 658 2 186Cash flowCash flow from operational activities NOK mill 2 131 4 245Balance sheetBorrowings NOK mill 8 224 7 515Equity ratio Percent 25.9% 22.8%Return on equity Percent 17.3% 25.5%Return on captial employed 1 Percent 12.1% 14.4%ShareShare price 31 December NOK 99.25 75.45Dividend per share 2 NOK 2.75 2.60Basic earnings per share (NOK) NOK 5.96 7.86Diluted earnings per share (NOK) NOK 5.95 7.85EmployeesEmployees 31 December Full time equivalents 19 444 19 415HSELost time incident frequency Per million worked hours 0.83 0.90Total recordable incident frequency Per million worked hours 2.62 2.68Sick leave rate Percent of worked hours 2.04 2.181) Including discontinued operations2) Proposed dividends for <strong>2010</strong>
4 Aker Solutions annual report <strong>2010</strong>This is Aker SolutionsLetter to shareholdersThere are certain milestones that define acompany like Aker Solutions. I believe thethree-way split of Kværner, from which AkerSolutions emerged back in 2004, was sucha moment. I believe that <strong>2010</strong> will also godown in history as one of the more significantyears in the history of our company.One reason for this is that we have managedthe aftermath of the <strong>2008</strong>-09 financialturmoil quite well. Although revenuesdeclined somewhat, order backlog andprofits were relatively stable, despite experiencingunfortunate quality and performanceissues that diluted our returns.Reducing such costs is naturally a paramountobjective of our continual improvementwork in Aker Solutions.Our earnings before interest, tax, depreciationand amortisation (EBITDA) wereNOK 4.3 billion for the year <strong>2010</strong> and thenet profit was NOK 2.0 billion. Our financialposition is strong and is reflected in theboard’s proposal to pay NOK 2.75 pershare in dividend, in line with our dividendpolicy.The numbers from <strong>2010</strong> are now history.Of more importance are the steps we havedecided to take for the future; steps whichaim to create a more focused AkerSolutions, with a more simplified and transparentstructure. We are building an organisationwhich I believe will accelerate growthand put emphasis on our company values.First of all, we have divested substantialparts of our non-oil and gas related businessesand we are reallocating our financialand organisational resources. During <strong>2010</strong>we announced several divestments with acombined value of NOK 7 billion. Whenthese transactions were completed in thefirst quarter of 2011, our net debt was zero,providing a strong foundation for furthergrowth.Secondly, as we enter into 2011, weprepare for a two-fold future. In May thisyear, shareholders will be invited to decideon a transfer of our large scale engineering,procurement and construction (EPC)project business to a new company.The relocated EPC company will have astrong position in the North Sea fielddevelop ment market and key positions inselected international target markets foronshore and offshore EPC projects. Thenewly structured Aker Solutions willcontinue to provide engineering solutions,product solutions and field life solutions tothe upstream oil and gas industry.The separation will take place through ade-merger and all Aker Solutions ownerswill receive shares in the new company.Investors can thereafter adjust their shareholdingaccording to their preferred investmentprofile. Aker ASA, which through AkerHolding is the leading shareholder in AkerSolutions, has stated that it will maintain itsshareholding in both companies after thedemerger.Preparations for these changes are wellunderway and include the establishment ofnew organisations and leadership teams forboth companies.In this transition period, it is with greatpleasure that I have accepted the board’schallenge to continue as executive chairman,and as part of this role also functionas CEO. This will allow us to continue theimplementation of our strategy at fullspeed, and at the same time further clarifythe profile and mandate of the newPresident and CEO of the company.I have appointed a new leadership teamwhich I will work with in this interim period.The composition of the team reflects ourambitions both to keep leadership close tobusiness and to further internationaliseAker Solutions. The new leadership teamincludes eight business leaders who willreport directly to me.Also a part of the leadership team aresix function heads from the corporatecentre that have the responsibility forshaping and safeguarding our activitieswithin key functional areas. The corporatecentre includes several new functions,which we believe will be particularly importantin driving through our strategy.The following four topics are on the top ofour operational improvement agenda:Customer focus: Build strong and lastingrelationships to individual customers anddevelop regional and country strategies.Quality and performance: Chase operationalexcellence (HSE, project management,cost efficiency), reduce quality costsand continue to strengthen performanceculture.People: Retain and attract the best andmost competent people and ensure highquality programs for people and leadershipdevelopment.Technology: Focus existing technologyprocesses and initiatives in the operatingbusinesses and identify and co-ordinateresearch and development initiatives.The above mentioned four priorities arereflected in the new corporate centre withChief Operating Officer, Chief TechnologyOfficer and Chief Strategic Marketingintroduced as new functions within AkerSolutions. My expectation is that with thisnew organisation we will be better positionedto inspire and to drive the functionalpriorities across the business units andhence, further improve the performance ofAker Solutions.Furthermore, with the structuralchanges and the operational improvementinitiatives outlined above, we believe AkerSolutions and the new EPC company arewell prepared to face the challenges andopportunities that lie ahead.It is our intention to see both AkerSolutions and the new EPC company grow.The world needs more oil and gas, and ourpeople and teams have the technology,competence and experience required toproduce hydrocarbons in a safe andenvironmentally careful way.We believe the fundamentals are inplace, for a lot of hard work that stillremains.Øyvind EriksenExecutive Chairman
Aker Solutions annual report <strong>2010</strong>Board of directors’ report5Board of directors’ reportSummaryAker Solutions has emerged from the <strong>2008</strong>-09 financial turmoil on a strong note.Revenues declined in <strong>2010</strong> but profitsremained at similar levels as the previousyear. Earnings before interest, tax anddepreciation (EBITDA) for the year wasNOK 4.3 billion, including businessesaccounted for as discontinued operations.In <strong>2010</strong> order intake was NOK 51.9billion, on the same level as in <strong>2009</strong>. Orderbacklog at the end of <strong>2010</strong> was NOK 55.4billion including discontinued operations,marginally down from the end of <strong>2009</strong>.Bidding activity increased through <strong>2010</strong>,signalling that the company’s main marketsare on the rebound.In <strong>2010</strong> Aker Solutions concluded acomprehensive strategy process. In linewith the direction set out by the board andmanagement to focus and streamline thebusiness, Aker Solutions agreed to the saleof parts of the Process & Construction(P&C) business area, and the sale of themarine specialist subsidiary Aker MarineContractors (AMC).The board also resolved to propose tothe general meeting, that the large projectEPC (engineering, procurement andconstruction) business within the EnergyDevelop ment & Services business area islaunched into a new company, separatefrom the rest of Aker Solutions. This separationis due to be completed in the secondhalf of 2011.Two focused, well trimmed organisationswill emerge, both positioned for growth.Aker Solutions provides product solutions,engineering solutions and field life solutionsfor the oil and gas industry. The new EPCcompany, provisionally named AkerContractors, will have a strong position inthe North Sea field development marketwith key positions in selected internationaltarget regions. Both companies were presentedat the company’s capital marketsday in December. They are described infurther detail below.Although operations have improved inmany parts of the business, a more detailedanalysis reveals opportunities for furtherimprovement and increased profits. Thecontinued losses in the drilling riser businessand weak financial performance on apower project in the United States areimportant reminders in this respect.The board and management have identifiedseveral areas of improvement andactions are under way. The following areaswill be specifically addressed: customerrelations, quality in project execution,technology and finally, organisationaldevelopment and recruitment and retentionof personnel.In terms of organisation, a new andmore transparent operating business structurewas complemented by a corporatecentre charged with responsibility andmeans to chase operational improvementsand synergies throughout the company.Aker Solutions expects that the restructuringwill unleash energy and drive in eachof the new, streamlined businesses andultimately contribute to accelerated growth.The market fundamentals for AkerSolutions are good, but the board wouldlike to point out that any assessment offuture conditions are subject to uncertainty.The company expects that annual averagegrowth in the years 2011-2015 could be inthe 9-15 percent range, partly as a result ofgrowing markets, growing market sharesand revenues from businesses acquired inthe period.Business overviewPrincipal operationsAker Solutions provides engineeringsolutions, product solutions, field lifesolutions and executes large and complexfield development projects for the oil andgas industry.In <strong>2010</strong> the group had four reportingsegments: Energy Development & Services(ED&S), Subsea, Products & Technologies(P&T) and Process & Construction (P&C).Each of these business areas is describedbelow in the “Presentation of the <strong>2010</strong>accounts” section.The P&C business area was involved inengineering and construction services,primarily in the mining and metals, energyand environmental and downstream oil, gasand petrochemicals industry segments. InDecember an agreement was reached todivest a significant part of this business.The transaction was completed in February2011.Following the sale of the P&Cbusinesses and restructuring of the oil andgas business, a new reporting structurewas implemented with effect from March2011.The Aker Solutions group is organised ina number of separate legal entities. AkerSolutions is used as the common trademarkfor most of these entities.At the end of <strong>2010</strong> the group had 19 444employes in continued businesses andactivities in more than 25 countries. Itshead office is in Norway, at Fornebuoutside Oslo. The parent company, AkerSolutions ASA, is listed on the Oslo StockExchange.MarketsDemand for Aker Solutions’ technology,products and services is driven by theworld’s increasing consumption of oil andgas for transportation, energy productionand industrial purposes.Market prospects are regarded as good.The world’s energy consumption isexpected to continue to grow. Combinedwith declining reserves and reduced oil andgas production in many parts of the world,this is expected to generate a persistentneed for new developments.For many years, the North-WestEuropean continental shelf has been theworld’s primary geographical market foroffshore oil and gas activities. Historically,this was also Aker Solutions’ home marketand a breeding ground for new technologiesand solutions.This region continues to play a key rolefor Aker Solutions, although the compositionof this market is shifting. With thematuring of the oil and gas fields in theregion, demand has grown for technologiesand solutions required for increased oil andgas recovery, satellite field developmentsand maintenance and modificationsrequired to extend the lifespan of existingfield infrastructure.Over the past 15-20 years, other
6 Aker Solutions annual report <strong>2010</strong>Board of directors’ reportgeographical markets have become increasinglyimportant. International oil companieshave shifted the focus of theirexploration activities to new frontier areas.National oil companies supported bygoverments with ambitious developmentplans are playing an important role in manyregions.Today Brazil represents the most rapidlygrowing single market in the offshoreindustry. Other countries with recent stronggrowth and high national ambitions arefound in West Africa, South and South EastAsia, around the Caspian Sea and in theArctic region.One common denominator for thesefrontier regions is the fact that remaining oiland gas reserves are increasingly difficult toproduce from. New fields are often locatedin deep waters, tough climate and remoteareas. Exploration and production in suchregions typically involve development ofnew technology, deployment of groundbreakingproducts and large and complexprojects.The oil price influences oil companies’priorities for, and choices between, newdevelopments, upgrades to existing facilitiesand commitments to improvingrecovery from producing fields. Oil pricesthereby affect activity in Aker Solutions’main markets. The group’s share of newdeliveries compared with lifecycle servicesmay accordingly vary over time in line withoil price trends.Aker Solutions’ success depends on thetrust the company inspires in its customers.The most important success factor forachieving that trust is to deliver qualityproducts and projects predictably accordingto agreed milestones.Strategic target areasIn a thorough strategy process in <strong>2010</strong>, theboard observed that Aker Solutions enjoysa prominent position in many of these geographicalmarkets and industry segments.The company’s portfolio of servicesincludes engineering competence,products, technologies and integratedsolutions.Its long tenure in the oil service industryhas left it with distinctive relations andexperience which are embedded in individualsand in organisational structures. Thecompany also enjoys a growing installedbase of products and solutions that representsopportunity for service and repeatsales.The strategy work also revealed areaswhere the company clearly has room forimprovement. In its concluding strategymeeting, the board pointed to the followingthree priorities: Firstly: focus the business;secondly: reorganise for greater transparencyand better positioning in growingmarkets; and thirdly: chase operationalimprovements. As a result, Aker Solutionswill begin 2011 with strengthened focus onquality in project execution, technology,customer relations and people and teams.A more focused portfolio was achievedby divestment of parts of the P&C businessarea and the marine operation businessagreed in <strong>2010</strong>. The formation of an internationalEPC contract company will furtherstreamline operations. These transactionsare further described below. Over time, thecompany will further scale down its financialexposure in ships and marineequipment.The future Aker Solutions will provideengineering solutions, product solutionsand field life solutions for the upstream oiland gas industry. Its range of offeringsinclude deepwater drilling technologies,subsea oil and gas production systems,well services, mooring and offloadingsystems, well-stream processing technologies,as well as life-of-field solutionsthrough its maintenance, modification andoperations business. Aker Solutions willalso offer front end engineering design andconcept studies as stand-alone services tooil companies and construction companies.These changes and the correspondingchanges to the business segment compositionand operating model will result in amore transparent company. It will be ableto offer greater flexibility to customers andbe well placed to capture opportunities forgrowth.The relatively large and complex businessareas known from before have beenreorganised into new and more focusedsegments: Engineering Solutions, ProductSolutions and Field Life Solutions. ProductSolutions consists of the following foursub-segments: Subsea, Drilling Technologies,Mooring & Loading Systems andProcess Systems. Field Life Solutionsconsists of Well Intervention Services,Oilfield Service & Marine Assets andMaintenance, Modifications & Operations.The new business structure was complementedby a corporate centre chargedwith responsibility and means to chaseoperational improvements throughout thecompany and achieve synergies in keyareas across the businesses such ascompetence sharing, lessons learned,technology and customer relations.The starting point for reinforcement ofoperational quality and performance will bethe company’s six core values: Customerdrive, People and teams, Open and directdialogue, Hands-on management,Delivering results and HSE mindset.For more than 20 years, the companyhas worked hard to improve health, safetyand environmental (HSE) performance. Inthe industries which Aker Solutions work,excellence in HSE is considered to be alicence to operate. Consequently this areahas had – and will continue to have aspecial place in the company’s culture.Now corresponding efforts will be made toadvance and strengthen the other fivevalues.<strong>Report</strong> for <strong>2010</strong>HighlightsOperational highlights and milestones for<strong>2010</strong> are described in the business areareview later in this report. The mainstrategic and structural highlights for <strong>2010</strong>were as follows.Launching Aker ContractorsThe new company provisionally namedAker Contractors will be a focused EPC(engineering, procurement and construction)company with a strong position in theNorth Sea field development market, keypositions in selected international targetregions, and offerings of distinct offshoreproducts within a global market. The newcompany will continue to target offshoreand onshore EPC field developmentprojects with the ambition to maintain itsstrong position in the North Sea and furthergrow its international presence.Assuming approval from the generalmeeting, the new company will be establishedthrough a demerger. Until this transactionis concluded Aker Contractors willoperate as an increasingly self-containedentity with separate board and management.This new structure will offer customersmore flexibility in alternative delivery
Aker Solutions annual report <strong>2010</strong>Board of directors’ report7models for offshore greenfield oil and gasdevelopments. Aker Contractors will positionitself for large EPC contracts whichtypically would involve delivery of completeplatforms and integrated solutions.Sale of P&CAs mentioned above, Aker Solutionsdecided to divest most of its onshore nonoiland gas related process and constructionbusinesses. Parallel paths were exploredwith a spin-off and listing of theentity with a new brand as the base case.At the end of <strong>2010</strong> an agreement wasreached to transfer most of Aker Solutions’process and construction businesses toJacobs Engineering Group. The agreedtransaction value is NOK 5.5 billion (USD913 million). The consideration was settledin cash at completion in February 2011.For Aker Solutions, the transaction hada positive net cash effect of approximatelyNOK 3.8 billion (USD 634 million), and acash to treasury effect of approximatelyNOK 4.2 billion (USD 701 million). Net gainis estimated to be approximately NOK 2.4billion (USD 400 million).The transaction did not include the USEPC centre in Houston, and the UnionConstruction business located in the USand Canada. They will be part of the newAker Contractors company describedabove.Sale of AMCIn October <strong>2010</strong> an agreement was madeto sell Aker Marine Contractors (AMC), asubsidiary within the Subsea business area,to the Singapore listed company EzraHoldings Ltd (Ezra) in exchange for equityinstruments in Ezra and other consideration.Furthermore 50 percent of AkerSolutions’ ownership in the Aker Connector(now AMC Connector) installation vesselwill be transferred to Ezra.The transaction was completed in March2011. AMC is valued at USD 250 million. Ofthis, USD 50 million was settled in cash,USD 100 million in shares in Ezra HoldingsLtd, equivalent to approximately sevenpercent ownership, and USD 50 million in aconvertible bond with maturity after 36months. The final USD 50 million plus interestwill be settled in cash on and subsequentto delivery of Aker Connector,which is expected to take place in fourthquarter 2011.New office projectsAker Solutions has been involved in thedevelopment of two major office buildingsfor the company in Norway. In December<strong>2010</strong>, majority ownership of the building inOslo was transferred to other investors anda letter of intent to sell the Stavangerproperty was signed.The two transactions are expected togive a cash effect of approximately NOK500 million each which will be recognisedin 2012 when the buildings are completed.The Oslo transaction was completed in<strong>2010</strong>. The sale of the Stavanger property isexpected to be concluded in first half of2011. Aker Solutions will retain an ownershipinterest of 25 percent in bothproperties.Management changesIn June <strong>2010</strong> President & CEO SimenLieungh left the company. Since then, ChiefFinancial Officer Leif H Borge has beenPresident of Aker Solutions ASA, whileØyvind Eriksen in his capacity as executivechairman has taken on the role of CEO forthe group.A new leadership team was effective asof March 2011. The team consists of theheads of eight sub-segments and sixcorporate centre managers and is headedby the executive chairman.The team composition reflects the newcorporate structure and the corporatestrategic priorities described above. Chiefoperating officer, chief technology officerand chief strategic marketing are newfunctions in the corporate leadership team.Three of the team members are non-Norwegian citizens. Two are women.Each member of the 2011 corporateleadership team are presented on page 90of this report. Members of the <strong>2010</strong>executive team are listed on page 41.The identification and appointment ofPresident & CEO for Aker Solutions and thenew company Aker Contractors is ongoing.Presentation of the accountsAker Solutions presents its accounts inaccordance with the International Financial<strong>Report</strong>ing Standards (IFRS) as adopted bythe EU. Unless otherwise specified, figuresin brackets present comparative data forthe corresponding accounting period orbalance sheet date for the previous year.In Aker Solutions’ consolidated financialstatements, the P&C businesses that havebeen transferred to Jacobs are classified asdiscontinued operations. In <strong>2010</strong> thesebusinesses had operating revenues of NOK4 500 million (NOK 4 221 million) andEBITDA of NOK 522 million (NOK 273million). Furthermore, AMC is classified asdisposal group held for sale.Income statementConsolidated operating revenues for <strong>2010</strong>for continuing operations declined by 7.2percent to NOK 46 267 million (NOK 49 856million). Earnings before interest, tax, depreciationand amortisation continuingoperations (EBITDA) amounted to NOK3 778 million (NOK 4 095 million), adecrease of 7.7 percent from <strong>2009</strong>. TheEBITDA margin in <strong>2010</strong> was 8.2 percent(same as in <strong>2009</strong>).The decrease in operating revenues andEBITDA is partly due to fairly low activitywithin some of Aker Solutions’ operationsand partly due to phasing of projects.However, due to good execution on someimportant projects, the EBITDA marginincreased somewhat.Depreciation, impairment charges andamortisation from continuing operationstotalled NOK 871 million (NOK 897 million).Consolidated earnings before interestand taxes from continuing operations(EBIT) were NOK 2 907 million (NOK 3 198million). Net financial expenses amountedto NOK 552 million (NOK 229 million).The group hedges currency risk for allproject exposures in accordance with wellestablishedpractice. Although this providesa full currency hedge, parts of the hedging(about 20 percent) do not meet the requirementsfor hedge accounting specified inIFRS. This means that fluctuations in thevalue of the associated hedging instrumentsare recognised with full effect asfinancial items in the accounts. Theaccounting effect appears as an expense ofNOK 84 million (income of NOK 161 million)in a separate line under financial items. Theunderlying projects hedged by the unqualifiedhedging instruments have had apositive accounting effect of NOK 23million (negative effect of NOK 81 million),which is recognised as an ordinary operatingexpense.Associated companies and jointventures reported a loss of NOK 32 million(gain of NOK 112 million). The <strong>2009</strong> figure
8 Aker Solutions annual report <strong>2010</strong>Board of directors’ reportincludes a gain of NOK 109 million on thesale of the holding in ODIM ASA.Tax expense was NOK 697 million (NOK783 million). This corresponded to an effectivetax rate of 29.6 percent (26.4 percent).Consolidated net profit from continuingoperations in <strong>2010</strong> was NOK 1 658 million(NOK 2 186 million). Profit from discontinuedoperations net of income tax wasNOK 352 million (NOK 145 million), and netprofit for <strong>2010</strong> was NOK 2 010 million (NOK2 331 million). This represented basic earningsper share of NOK 7.27 (NOK 8.40).Basic earnings per share for continuingoperations were NOK 5.96 (NOK 7.86).Cash flowConsolidated cash flows from operatingactivities depend on a number of factors,including progress with and delivery ofprojects, changes in working capital andpre-payments from customers. Net cashflow from operations was NOK 2 131million (NOK 4 245 million).Net cash flow from investment activitiesin <strong>2010</strong> was negative NOK 2 109 million(NOK 3 927 million, of which around NOK1 400 million related to the acquisitionscarried out in April <strong>2009</strong>). Net cash flowfrom financing activities was negative NOK121 million (NOK 278 million), withdividends for the previous year of NOK 700million (NOK 431 million).Balance sheet and liquidityConsolidated interest-bearing debtamounted to NOK 8.2 billion (NOK 7.5billion) as of 31 December <strong>2010</strong>.Long-term debt consists of five bondloans in the Norwegian market. These loansincluded one of NOK 572 million maturingin 2011, two of NOK 150 million and NOK300 million respectively which mature in2013, and two of NOK 1 913 million andNOK 187 million maturing in 2014. Thebond loans have floating interest rates withthe exception of the NOK 150 million loanmaturing in 2013 and of NOK 1 913 millionmaturing in 2014, which have a fixed rate.Parts of the loans with floating rateshave been converted to fixed rates throughinterest swap agreements, and parts of theloans with fixed rates have been convertedto floating rates. 44 percent of the totalbond loans accordingly have fixed rates.The average remaining term to maturity forthese loans is just under three years.In addition, a syndicated bank facility ofEUR 750 million (corresponding to NOK5 864 million) was established in October2006, maturing in October 2012. NOK2 800 million of this facility had been drawndown as of 31 December <strong>2010</strong>.A credit facility of NOK 2 000 million wasestablished by the group in December <strong>2008</strong>with a term of 18 months and an option toextend this period by a further 18 months.The company exercised the extensionoption in <strong>2010</strong> and the credit facility has afinal maturity in December 2011. No drawingshad been made on this facility as of 31December <strong>2010</strong>.A term loan of NOK 750 million with amaturity of five years was established withan international bank during the fourthquarter of <strong>2009</strong> to strengthen the group’sfinancial platform even further. This loanmatures in October 2014.Fixed interest agreements entered intofor 2011 on that date covered 46 percent ofthe total debt.Consolidated non-current assets totalledNOK 15.9 billion (NOK 16.1 billion) as of 31December <strong>2010</strong>, of which goodwillamounted to NOK 6.2 billion (NOK 7.4billion). The reduction in goodwill in <strong>2010</strong> ismainly due to reclassification of goodwill toheld for sale related to the expected transactionsof AMC and P&C.Net interest-bearing liabilities totalledNOK 4 180 million (NOK 3 705 million) as of31 December <strong>2010</strong>.Book equity including non-controllinginterests totalled NOK 10 354 million (NOK9 123 million) as of 31 December <strong>2010</strong>.Non-controlling interests amounted to NOK189 million (NOK 147 million). The group’sequity ratio was 25.9 percent (22.8 percent)of the total balance sheet as of 31 December<strong>2010</strong>.Consolidated capital adequacy andliquidity are good, and help to ensure thatthe group is well equipped to meet thechallenges and opportunities faced overthe next few years.Segment reviewsFrom 2011 Aker Solutions will present itsaccounts with three reporting segments:Product Solutions, Engineering Solutionsand Field Life Solutions. Product Solutionsinclude the following sub-segments:Subsea, Drilling Technologies, ProcessSystems and Mooring & Loading Systemswhile Field Life Solutions include thesub-segments Maintenance, Modifications& Operations (MMO), Well InterventionServices and Oilfield Services & MarineAssets.In the review of <strong>2010</strong> accounts below,reporting follows the old business areastructure which was effective until March2011.Energy Development & ServicesThe business area experienced high activityin the North Sea maintenance,modifications and operations market andon several international projects includingSakhalin I, Kashagan and Hebron. In addition,some new North Sea developmentsalso contributed to a good workloadthrough the year.Operating revenues totalled NOK 20 876million (NOK 19 827 million). EBITDA wasNOK 2 040 million (NOK 1 116 million). TheEBITDA margin was 9.8 percent, improvingfrom 5.6 percent in <strong>2009</strong>. The improvementpartly reflected contract formats in theorder backlog and improvements in operations.The order backlog as of 31December <strong>2010</strong> was NOK 26 265 million(NOK 25 396 million).Maintaining a strong position in theNorth Sea market and further increasing itsinternational competitiveness were two keytargets for the ED&S business area in <strong>2010</strong>.Several significant contracts related to newfield developments and field life extensionswere awarded, supporting this ambition.The business area reported high activityon the operations in Kazakhstan andRussia throughout <strong>2010</strong> and delivery of thegroundbreaking Gjøa semi-submersiblefrom the Stord yard. Within studies andFEEDs, tendering activity has been highwith several contract wins.In order to build flexible, cost-effectivedelivery models, a joint venture was establishedwith the Kazakh industrial groupKazKiproNefteTrans and the cooperationwith COOEC’s Quingdao yard in China hasbeen further developed.From March 2011, ED&S was separatedinto three business segments: Engineering,MMO (a sub-segment within AkerSolutions’ reporting segment Field LifeSolutions) and Aker Contractors (the EPCbusiness) which will be established as aseparately listed company on the OsloStock Exchange.
Aker Solutions annual report <strong>2010</strong>Board of directors’ report9SubseaThe business area performed relatively wellin a demanding market. Total operatingrevenues in <strong>2010</strong> were NOK 11 844 million(NOK 12 972 million). EBITDA was NOK1 170 million (NOK 1 399 million) andEBITDA margin decreased from 10.8percent in <strong>2009</strong> to 9.9 percent. The EBITDAwas negatively affected by low capacityutilisation for the installation vessels and nowell intervention work for the vessel SkandiAker. Record high well services activitylevel in the North Sea and increasedactivity within lifecycle services affected theresults positively. The order backlog at theend of <strong>2010</strong> was NOK 15 356 million (NOK12 395 million).Key contract awards in <strong>2010</strong> includedthe USD 300 million Iara & Guara contractoffshore Brazil, and the NOK 3.4 billioncontract to deliver a subsea gas compressionstation to Statoil’s Åsgard field in theNorth Sea.Execution of key projects has been astrong focus throughout the year. Successfuldeliveries have been made to DongEnergy’s two fast-track projects, Trym andOselvar. In August, first oil was producedfrom Statoil’s demanding Morvin HP/HTfield, through a subsea production systemfrom Aker Solutions. The groundbreakingOrmen Lange subsea gas compressionpilot project also progressed well, withstart-up of system testing commencing asplanned in Q4 <strong>2010</strong>.The investment programme hascontinued in <strong>2010</strong>. During <strong>2010</strong> AkerSolutions has increased capacity byinvestments in subsea infrastructure, drivenparticularly by developments in the NorthSea and off Brazil, South-East Asia and WestAfrica. The group expects to continue thisinvestment programme in the years to come.The divestment of Aker MarineContractors was announced in October<strong>2010</strong>. The transaction was completed inMarch 2011 as previously described.From March 2011 the business area wassplit in three sub-segments: Subsea, WellIntervention Services and Oilfield Services& Marine Assets. The first is a part of thereporting segment Product Solutions whilethe last two are part of the reportingsegment Field Life Solutions.Products & TechnologiesProducts & Technologies experiencedlower activity during <strong>2010</strong> compared to<strong>2009</strong>. The decline was mainly due to ageneral slowdown in drilling rig new builds,resulting in a lack of new contracts forcomplete drilling packages in <strong>2009</strong> and into<strong>2010</strong>.Operating revenues decreased by 19.8percent from the year before and came toNOK 10 206 million (NOK 12 729 million).EBITDA for <strong>2010</strong> was NOK 859 million(NOK 1 304 million), and profitabilitydecreased to an EBITDA margin of 8.4percent (10.2 percent).Profit in the business area was adverselyaffected by performance issues in thedrilling riser business. Mitigating actionswere initiated and the issues are expectedto be resolved in the first half of 2011.The order backlog as of 31 December<strong>2010</strong> was NOK 7 360 million (NOK 9 632million). The main contracts awardedduring the year were two complete drillingequipment packages to Daewoo and onefor an undisclosed customer, in addition toseveral smaller contracts within processtechnologies and offshore and marineequipment.Four complete drilling equipmentpackages were delivered during <strong>2010</strong> andten drilling equipment packages arescheduled for delivery in 2011. The activitywithin process systems, deck machineryand mooring equipment has been highthroughout the year. The installed base ofproducts continues to grow and provides astrong basis for continued growth inlifecycle services.In August, a new iPort technology centrewas opened in Stavanger, combiningsimulators, technological facilities andservices under one roof. In Brazil, a newdrilling lifecycle services centre wasopened in Rio das Ostras, bringing to theBrazilian market the first 240° dome baseddrilling equipment simulator. This visualisationand simulator technology has provento be a powerful tool to increase efficiencyin design and operation of offshoreproducts and solutions.From March 2011 the business area wassplit in three sub-segments: DrillingTechnologies, Process Systems andMooring & Loading Systems, which will allbe part of the reporting segment ProductSolutions.Process & ConstructionIn <strong>2010</strong> Process & Construction enjoyedhigh activity within the mining and metals,and energy and environmental segmentswhile other segments within onshore oil,gas and process still experienced slowmarkets.Operating revenues fell by 8.7 percent toNOK 8 703 million (NOK 9 534 million).EBITDA was NOK 213 million (NOK 484million). The EBITDA margin fell to 2.4percent (5.1 percent). The order backlogstood at NOK 6 594 million at year end<strong>2010</strong> (NOK 9 037 million). These numbersinclude discontinued operations.The main reason for the decrease inEBITDA was the delay and cost increaseson the Longview power project. This wasdue to, among other factors, force majeureevents, changes to the project, and thirdparty actions in furnishing engineeringservices, equipment and materials, all ofwhich have directly and adversely impactedAker Solutions’ project work. As a consequenceof this, Aker Solutions decided toreverse previously reported profits on thisproject in third quarter <strong>2010</strong>. Additionallosses were recognised in fourth quarter<strong>2010</strong>.A major natural gas fired power plant,the Halton Hills Generating Facility forTransCanada Energy Ltd. was completed inCanada. The single biggest contractawarded during the year was the design,supply, installation, construction andcommissioning for a Biomass renewableenergy plant for RWE in Scotland.In December, a transfer of the majorityof the operations in the Process &Construction business area to JacobsEngineering Group Inc was agreed. Thetransaction was closed in February 2011.The transfer does not include the US EPCcentre in Houston and the UnionConstruction business located in the USand Canada, which will all be part of thenew Aker Contractors company.Going concernBased on the group’s financial results andposition, the board affirms that the annualaccounts for <strong>2010</strong> have been prepared onthe assumption that the company is agoing concern.
10 Aker Solutions annual report <strong>2010</strong>Board of directors’ reportParent company accounts andallocation of net profitThe parent company, Aker Solutions ASAhad a net profit of NOK 3 153 million for<strong>2010</strong> (NOK 1 052 million). Pursuant to thecompany’s dividend policy, the board proposesthat an ordinary dividend of NOK2.75 per share be paid. The board therebyproposes the following allocation of netprofit:Dividend NOK 741 millionOther equity NOK 2 412 millionTotal allocated NOK 3 153 millionUnrestricted equity after the proposeddividend payment amounts to NOK 5 874million.DividendThe parent company’s dividend policyinvolves an intention to pay shareholdersan annual dividend of 30-50 percent of netprofit. The dividend will be paid in cashand/or through share buy-backs.The board will propose a total dividendof NOK 2.75 per share for <strong>2010</strong> to theannual general meeting. Shareholders willthen have received about 38 percent of netprofit in the form of share buy-backs anddividend for the fiscal year.Events after the balance sheet dateIn February 2011, Aker Solutionscompleted the sale of parts of its Process& Construction business area to Jacobs, aspreviously described.The transaction value was approximatelyNOK 5.5 billion and the considerationwas settled in cash at completion.In February 2011, the rulings related tothe 2003 contract with Hitachi America Ltd.were presented. Hitachi was awarded damagesbut the conclusion did not have amaterial effect on the financial statementsof Aker Solutions.In March 2011, Aker Solutionscompleted the transfer of ownership ofsubsidiary Aker Marine Contractors (AMC)to Singapore listed Ezra Holdings Ltd. Inthe transaction, AMC is valued at USD 250million, as previously described.Company, people and communityCorporate governance and riskmanagementCorporate governance in Aker Solutions isperformed within the framework of severaldifferent legal regulations and principles.The respective national legal regulationswill always prevail at our different locationsaround the world.As Aker Solutions exercises ultimategovernance and control from its headquarters in Norway, and is listed on OsloStock Exchange, Norwegian legislation isnaturally a significant framework in terms ofcompany and securities legislation,financial reporting and other corporateissues.Aker Solutions has therefore adoptedthe Norwegian code of practice forcorporate governance. A special statementon the way Aker Solutions observes thecode of practice issued by the NorwegianCorporate Governance Board can be foundon page 81 of this annual report.The corporate governance in AkerSolutions is the traditional model where theshareholders through the annual generalmeeting appoint the board of directors toact as their representatives in governingthe company.The board of directors sets the strategicdirection, the overall governance structure,values and main policies. The policies, ofwhich there are 20, provide direction onacceptable performance and guidedecision-making in all parts of thecompany. The policy framework providesthe delegated authority and authorisationsof the chief executive officer and theorganisation.Among its members, the board of AkerSolutions has appointed an auditcommittee. In <strong>2010</strong> this committee waschaired by Ida Helliesen. Other members ofthe committee at the end of <strong>2010</strong> were AtleTeigland and Lone Fønss Schrøder. FønssSchrøder replaced Øyvind Eriksen on theaudit committe when he assumed the roleas executive chairman in June <strong>2010</strong>.Risk managementThe intention of the governance frameworkis to minimise risk through guidingbehaviour and decisions in the directionthat is most appropriate for the company.The management in Aker Solutions has putin place business processes, managementmeetings and organisational structures toensure that the governing framework isbeing adhered to.Aker Solutions manages risks based onfour main areas.These are the strategic andfinancial risks, reputation risks, risks relatedto mergers and acquisitions and the risksrelated to the operations and projectexecution.Strategic risks arise from pursuing thewrong markets, segments, services andproducts or customers. These aremanaged through the annual strategyprocess. In this process the board ofdirectors ensures that the overall direction,markets and customers are reflected in thestrategies.Financial risk includes currency, interestrate, counterparty and liquidity risk. Thecorporate treasury function is responsiblefor managing financial market risk and thegroup’s exposure to financial markets. AkerSolutions has defined procedures androutines for managing the group’s financialmarket exposure.■■Currency risk: operating units in AkerSolutions identify their own foreigncurrency exposure and mitigate this viacorporate treasury when contracts areawarded. Such cover is provided in theoperating unit’s functional currency. Allmajor contracts are furthermore hedgedin the external market and documentedto qualify for hedge accounting. Morethan 80 percent of project relatedcurrency risk exposure either qualifyfor hedge accounting or are embeddedderivatives.■■Interest rate risk: it has been decidedthat 30–50 percent of the group’s grossdebt will have fixed interest rates withdurations related to the outstandingdebt at any given time.Floating and fixed interest rate loansare combined with interest rate swaps.46 percent of the borrowings had fixedinterest rate at the balance date.■■Counterparty risk: assessmentsare made of major contractualcounterparties and sub-contractors.Risk is reduced through bank and parentcompany guarantees and/or structuringof payment terms. Where bank risk andthe placement risk for surplus liquidityare concerned, specific maximum levelshave been set for the group’s exposureto each financial institution. A special
Aker Solutions annual report <strong>2010</strong>Board of directors’ report11debtor list is signed annually by thegroup’s CFO.■■Liquidity risk: the group’s policy is tomaintain satisfactory liquidity at thecorporate level. This liquidity bufferis expressed as the sum of undrawnbank credit facilities and available cashand bank deposits. Working capitalwill vary over time, depending on thecomposition of revenues in the varioussegments – and good liquidity is important.Reputation risks could typically be bothhard to identify and assess as they canappear in many forms and situations. Albeitelusive and intangible in its nature it cannevertheless have the most severe impacton a business. Aker Solutions has chosento focus reputation risk on assessments ofthe risks related to countries with specialchallenges, frameworks for managing risksand making decisions and the processesfor ensuring compliance with policies.Merger and acquisition risks can arise fromdecisions to invest in other companies.Typically the risks are related to the pricingof an acquisition, buying a company thatdoes not fit well with the existing portfolioor a company with hidden problems. Risksin this category are managed through aspecial corporate investment committee.Operations and project execution risks areoften more specific and related to potentialincidents or challenges in a project or otherbusiness operations. These are typicallydirectly managed by the operating businessesand followed up by corporatethrough the fixed monthly and quarterlyreview structure and the corporate riskcommitteeThe board receives monthly reports on thecompany’s performance and the status ofits most important individual projects.Risk management at corporate levelControl of risks and compliance withpolicies represent key activities of thecorporate functions. As part of the strategyprocess in <strong>2010</strong>, the strenght of thiscorporate role was further emphasised andstrengthened.Each corporate function has a globalresponsibility for following up policies andassociated framework for its respectivearea. This applies regardless of theapproach adopted for organising thebusiness, and is pursued in part through aclose dialogue with the company’scorporate risk and investment committeesand through monthly meetings related tofinancial and operational reporting by thebusiness areas. Each corporate functionwill also follow up its area of responsibilityoutside these formal processes throughdirect dialogue with the businesses.The corporate functions which are mostrelevant to risk managment are as follows:Enterprise Risk coordinates risk managementoutside the traditional project andfinancial areas, and monitors and mitigatesrisks by way of ensuring coordination of thecompliance program and overall businessethics standards.Internal Compliance ensures that the unitshave established and implemented thenecessary systems and routines forensuring compliance with both financialand operational procedures and systemswithin the group, and conducts regularvisits to and checks of units with consequentreporting of possible improvementmeasures.Project and Operational Support providessupport for project assessments in thetendering and execution phases, and chairsthe corporate risk committee which reviewsall major tenders prior to bid approval andevaluates project performance.Corporate Treasury is responsible forfinancial market risk and the group’sexposure to financial markets, and is apermanent member of the CorporateInvestment Committee. Any acquisition,disposal or capex investment that requireapproval from CEO or CFO is reviewed bythis committee prior to final approval.Corporate Insurance handles the purchaseof the group’s insurance programme andprovides insurance-related support forprojects, as well as operating as thegroup’s captive underwriter.Corporate Tax manages Aker Solutions’ taxaffairs, delegates responsibilities forcompliance with the tax policy and followup execution of the tax policy in thebusiness. Taxes include, but are not limitedto, corporate and personal income taxes,value added taxes (VAT), sales taxes,customs, duties, payroll taxes, employmenttaxes and stamp duties.Corporate Business Development ensuresthat all merger and acquisitions, majorrestructurings, real estate transactions andstrategic partnerships are managedeffectively. A key control for BusinessDevelopment is the Corporate InvestmentCommittee.Corporate Legal supports all the abovementionedfunctions in their managementof risk, in part through permanent membershipof the Corporate Risk and InvestmentCommittees, and is also responsible forcontractual and legal follow-up of projects,partners, contracts and disputes.Risk management in operating entitiesEach operating unit is responsible forensuring compliance with corporateprocedures and systems and with all otherapplicable regulations and legal requirements.The corporate staff and theoperating units collaborate closely toidentify, monitor, report on and manage riskfor the whole group. This ensurescompliance with requirements from theboard of directors and with internal andexternal frame conditions and regulations.The Project Execution Model (PEM) isa key element in the operating units’operating system. The PEM is themethodology followed when executingprojects. All risk management processesand controls shall be described in therespective operating system of the businessunit. The process descriptions in thePEM vary according to the type of businessor project being performed but thegeneral requirements of the PEM are thesame across the company.The PEM has defined phases forprojects. The main phases are Feasibility &Concept, Tender & Kick-off, SystemDefinition, Detailing & Fabrication,Assembly & Erection and System Completion.In each of these phases there are definedmilestones that the project needs topass and between all the phases there aregates.In order for a project to move from onegate to another a gate review is executed.
12 Aker Solutions annual report <strong>2010</strong>Board of directors’ reportThis follows a set of defined controls andtemplates, all of which must be passed andcompleted. Risk review is a key control inthe gate review. The gate review is approvedby the project manager and all documentationshall be stored for future reference.All projects in Aker Solutions have aregister where identified risks and opportunitiesare categorised and assessed interms of impact and probability. Mostprojects use the standard template in therisk dashboard tool, known as the Risk andOpportunity Register, while some havedeveloped their own registers.All these risk registers are live documentsthat support follow-up of all risks inthe project as well as the improvementopportunities. It is the responsibility of themanager for any project to manage therisks in the project and to update the riskregister. Depending on the size of theproject, and the complexity, a project mayalso have a separate Risk Manager.Risks in the operating entities arereported to the CEO in monthly operatingreviews. These reviews form the main internalmanagement control procedures andreporting line across Aker Solutions. Thereport consists of a written report and asubsequent review meeting with the CEO,CFO and other functional staff as required.The operating entities are required toperform regular audits of their projects andoperations to ensure they follow the establishedprocesses and procedures. Everyyear management of the unit reviews itsoperating system to ensure its integrity andrelevance to operations. This reviewincludes assessment of opportunities forimprovement and the need for changes tothe operating system, strategy andobjectives.Aker Solutions has also implemented aControl Self Assessment (CSA) which iscompulsory for operating entities. In thisprocess, the operating units assess thequality and relevance of the establishedcontrol activities. The timing of the CSA isdetermined by the Corporate CFO. Furthermore,each of the business units is requiredto conduct an annual evaluation of itsinternal financial reporting control systems.Finally, Internal Compliance may alsodecide to conduct reviews of individualoperating units’ compliance with systemsand procedures. In <strong>2010</strong> such reviews wereconducted in 8 units.Corporate responsibilityAker Solutions influences the economicposition, environment and lives of peopleand their communities in many parts of theworld. This position carries great responsibilityand calls for solid governance andrisk management within all areas of operation.Environmental, social responsibilityand governance issues are deeply embeddedin the activity of operating entities aswell as the functional resources.The company’s history and values, aswell as international norms such as the UNGlobal Compact, the Global <strong>Report</strong>ing Initiativeand the OECD guidelines, form thebasis of Aker Solutions’ corporate responsibility(CR) principles and of the way it reportsin this area.A comprehensive set of policies andcompliance procedures are in place to ensurethat the entities operate according tosound principles in this respect. In <strong>2010</strong>focus has continued to be high on ethics,whistle-blowing and combat of financialcrime. Furthermore, the company has conducteda thorough review of all third partyrepresentation agreements and updatedthe country risk management process.Following this review, the restrictedcountries list was expanded in <strong>2010</strong> toinclude Myanmar (Burma), Iran, NorthKorea, Sudan and Western Sahara(Morocco). These are countries where AkerSolutions will not engage in any newbusiness or investment activities.Targeted training programmes help tostrengthen understanding of, and ensurecompliance with Aker Solutions’ rules. Thecode of conduct is available on the group’swebsite.In <strong>2010</strong>, particular attention has beengiven to business ethics and the code ofconduct for operations abroad. An importantpart of Aker Solutions’ strategy is togrow its business and presence in targetedmarkets outside of Norway. Although theoperational conditions and challenges willdiffer from one market to another, there isonly one standard for Aker Solutions’conduct of business world wide; fullcompliance with applicable laws andinternal policies. This is a prerequisite for allour operations. Having in mind thechallenges that some businesses andprojects might be faced with from time totime, there has been a targeted effort toassist the businesses with, inter alia,awareness training, reviews of agreementsand potential partners, the performance ofintegrity due diligence, the auditing ofcooperation partners books and recordsand the set-up of business structures innew markets. During <strong>2010</strong>, the corporatefunctions and the operating businesseshave been re-organised in a manner thatwill allow for a continuation and even closerfollow-up of this work in the years to come.Aker Solutions became a member of theUN’s Global Compact in <strong>2008</strong>. Both globallyand locally, this opens up opportunitiesfor dialogue and collaboration with otherenterprises, voluntary organisations, unionsand governmental authorities on a range ofcrucial issues.Aker ASA’s frame agreement withNorway’s United Federation of TradeUnions and the International MetalworkersFederation commits Aker Solutions toworking towards good labour relations andto respecting human and workers’ rights inthe communities in which it operates.Aker Solutions has extended itssuccessful partnership with the NorwegianRed Cross to the end of 2011. This collaborationincorporates financial support,exchanges of knowledge and voluntarycontributions.Health, safety and the environmentConcern for health, safety and the environment(HSE) is one of Aker Solutions’ corevalues. It has been a top managementdrivenguiding principle in the business formany years. The fundamental principle andattitude is that all incidents can beprevented. On that basis, Aker Solutionsworks continuously to prevent incidentswhich could cause harm to personnel or tomaterial or non-material assets.Driven by careThe Just Care concept was introducedas a common symbol for the group’s HSEculture and work in 2005. A key element isthat each person accepts personal responsibilityfor HSE, based on care for peopleand the environment. Through Just Care,the HSE message reaches the individualemployee more effectively. Managers asrole models and a strong commitment tocommunication and training createattitudes which integrate HSE in everydaywork.
Aker Solutions annual report <strong>2010</strong>Board of directors’ report13A common HSE cultureEducation occupies a central place in AkerSolutions’ HSE programme. Since it wasintroduced in 2005, the tailored HSEleader ship programme has been completedby more than 2 700 leaders. 200 participatedin <strong>2010</strong>. This programme equipsmanagers with the competence required tobecome better role models and to driveHSE improvements.To reach out to all employees in anefficient way, the group has also developedeLearning programmes for key areas withinHSE. These include the Just Care cultureand HSE as a core value, as well as morespecific topics on mastering stress andprotecting the environment. More than77 000 eLearning sessions have beencompleted since these programmes wereintroduced in <strong>2007</strong>.Clear expectationsA common HSE operating system for thewhole company sets standards for themost important elements in HSE managementand leadership. Regular audits uncoverpossible gaps in relation to expectations,and the necessary counter-measuresare identified and initiated. This systemalso functions as a framework for crossorganisationalsharing and learning.Learning from incidentsOn the basis of an analysis of incidents inrecent years and exchange of experience inthe industry, Aker Solutions developed anew component in its HSE programme in<strong>2008</strong>. Entitled Just Rules, this is a set ofsimple but specific safety regulations forparticular work operations which arejudged on the basis of experience to posehigher risks.Since the implementation more than32 000 employees, contract staff andsubcontractor personnel have participatedin presentations of Just Rules. By makingthe most important preventative measuresmandatory, clear and simple, Just Rulesessentially contributes to preventingserious incidents.AchievementsDespite continuous efforts to avoid seriousincidents, Aker Solutions regrettablysuffered 19 serious personal injuries in<strong>2010</strong>, compared to 23 in <strong>2009</strong> and 18 in<strong>2008</strong>. No fatalities occurred in <strong>2010</strong>.Of these 19 injuries, five involved workingat height, two occurred during liftingoperations, two from falling objects, threefrom energy isolation, three from trippingand four from operating hand tools.The total recordable injury frequency(TRIF) per million working hours fell from2.7 in <strong>2009</strong> to 2.6 in <strong>2010</strong>. The lost-timeinjury frequency (LTIF) per million workinghours declined from 0.9 in <strong>2009</strong> to 0.8.These figures also include Aker Solutions’sub-contractors.All serious incidents and near misses areinvestigated and the lessons from themimplemented with the aim of preventingsimilar incidents in the future.In <strong>2010</strong> the company’s umbilicals manufacturingfacilities in Mobile, US and Moss,Norway both celebrated five years withoutlost time incidents and received companywiderecognition for their results. Also in<strong>2010</strong> Aker Solutions was named the winnerof the prestigious Malaysian NationalOccupational Safety & Health Award in theheavy industry manufacturing category.Sick leaveSick leave amounted to 2.0 percent of totalworking hours in <strong>2010</strong>, compared with 2.2percent the year before. Sick leave hasremained stable at a low level after a cleardecline in 2003-2006. However, it shouldbe noted that differences in local regulationscomplicate a direct comparison ofsick leave between different countries.Although low in comparison withnational average, company statistics showthat sick leave in Aker Solutions’Norwegian operations is relatively higherthan in other areas of the group, with anaverage 4.1 percent in <strong>2010</strong>.Special initiatives have been introducedin <strong>2010</strong> with a focus on exercise andnutrition. The company’s sponsorship ofthe 2011 FIS Nordic World Ski Championshipand participation in the Aker Aktivprogramme is part of this.EnvironmentThe board takes the view that AkerSolutions’ activities pose only a limiteddirect burden on the environment. Nosignificant unintentional discharges oremissions to the surrounding environmentwere recorded in <strong>2010</strong>.Total energy consumption by thebusiness in <strong>2010</strong> (figures for <strong>2009</strong> inbrackets), based on recorded use of oil,gas and electricity, amounted to 473 950(588 206) megawatt-hours. Carbonemissions related to this usage areestimated at 109 573 (136 797) tonnes. Themethodology used derives from the GreenhouseGas Protocol – GHG, and Global<strong>Report</strong>ing Initiative – GRI.Waste recorded in connection with thebusiness totalled 42 171 (45 744) tonnes, ofwhich 86 percent was recycled. <strong>Report</strong>ingprocesses for environmental parametershave been improved, and the figures aboveare being reported since <strong>2008</strong> with greateraccuracy than before.At the end of <strong>2010</strong>, 20 out of 50 operatingunits were certified to the ISO 14001environmental standard. An eLearningprogramme with a particular focus on theenvironment was introduced during <strong>2008</strong>,and 15 000 employees have so farcompleted it.The above mentioned HSE leadershipdevelopment initiatives, eLearning and themanagement system incorporate clearcomponents which focus attention on theenvironment. Collectively, these contributeto continuous improvements in environmentalawareness and attitudes amongmanagers and other employees.This inspires the organisation to achievefurther gains in environmental performancein Aker Solutions’ own activities, and toassist customers in making environmentalimprovements through the productsdeveloped by the group.Examples can be found in such areas ascarbon capture, drilling rigs with a strongenvironmental performance in arctic conditions,treatment of volatile organiccompounds, treatment of sulphur andammonia discharges, installation equipmentand support structures for windturbines, as well as the next generation ofbio fuels.People and teamsKeeping a workforce of highly skilled andmotivated employees and leaders is a keysuccess factor for Aker Solutions. Thecompany continuously strives to increaseattractiveness, recruit new talent anddevelop the competence of people andteams. For most operating entities in AkerSolutions, lack of skilled personnel isregarded as a potential challenge andtherefore systematically addressed.The attention paid by Aker Solutions to
14 Aker Solutions annual report <strong>2010</strong>Board of directors’ reportemployee and leadership development isregarded as an important competitiveadvantage. Aker Academy serves as theinternal arena for know-how building andemployee development throughout thegroup. It offers programmes in importantprofessional subject areas such as leadership(at various levels), project execution,commercial management and HSE.In addition, there are online and remote“eLearning” programmes, with a total of24 000 active users in more than 30 countries.More than 118 000 eLearning courseshave been completed by Aker Solutions’people since 2005.The group’s global eLearning portaloffers more than 30 tailored programmescovering areas including project execution,HSE (described above), corporate responsibility,cultural awareness and morecompany-specific, operational topics.Special courses are available in Englishwhich is the company’s corporatelanguage.The commitment to eLearning gives allemployees access to a cost-effective andaccessible range of courses. In addition toboosting professional expertise in keyareas, these courses make a strong contributionto building a common corporateculture, as well as providing opportunitiesfor mandatory certification in specificareas.Corporate programmes offered acrossthe group are supplemented by coursesorganised by local units, while deliveredunder the umbrella of the Aker Academy.Organisation and recruitmentAs of 31 December <strong>2010</strong>, the overall workforcecomprised 24 814 people, including19 444 employed directly and 5 370 oncontract. During the year the overall workforcereduced by 678, as a result of orderintake and activities.Aker Solutions has two main categoriesof employees: skilled workers andoperators (27.8 percent) and white collarstaff (72.2 percent).Of the employees, 50.3 percent workedin Norway, 16.6 percent in the Americas,16.2 percent in the Asia Pacific region, 15.9percent in Europe outside Norway and 1.0percent in Africa and the Middle East.Workforce turnover in <strong>2010</strong> averaged 8.9percent, an increase of 2.2 percent fromthe year before.More than 59 000 applicants from over30 countries were registered in the group’srecruitment system during the year. A totalof 2 128 new employees were recruitedfrom this base, with women accounting for21.3 percent.In <strong>2010</strong> the third class of Aker Solutions’international trainee programme completedtheir final assignments. All ten traineeswere offered permanent employment in thecompany. Since 2006 25 employees havebeen part of the programme. Recruitmentfor class four is under way. A recordnumber of 989 applications were submitted.Up to 15 will be offered to participatein the 24 month programme whichstarts in August 2011.Diversity and equal opportunityWith operations in most parts of the worldand activities that typically involveemployees from several operating entitiesand geographical regions, Aker Solutions isenriched by people from many cultures,religions and ethnic groups. Equal opportunityfor everyone is an established principlefor the group. No differences should existbetween genders or ethnic groups.This commitment to equal opportunity isclearly described in policies and by agreement,for instance in a three-party frameagreement with national and internationaltrade unions. This agreement, which wasextended for a new two-year period in<strong>2010</strong>, covers general employment termsand employee relations, with specific focuson non-discrimination.Each entity is encouraged to seek awork pattern which suits both employeesand the company, and which ensures agood balance between work and privatelife. Examples of work patterns includeflexible working hours, remote or homeworking and compressed working weeks.These benefits are regarded as importantelements in ensuring equal opportunities.Equal opportunity for people of bothgenders is a basic principle in AkerSolutions. For several reasons, mainlyrelated to history and industry tradition,male employees continue to be in majoritywithin the company. Of the total employees80.7 percent were men.Requirements are set for diversity inrecruitment and people development. Ofthe total 2 128 new employees in <strong>2010</strong>,21.3 percent were women. Thecorresponding number for <strong>2009</strong> was 24percent.Management development programmesmake an important contribution to gettingwomen into senior posts. 26 percent ofparticipants in the company’s managementdevelopment programmes in <strong>2010</strong> werewomen. A special executive managementtraining programme completed in <strong>2010</strong> hadsix women participants of a total 27 (22percent). Two female managers have alsoparticipated in McKinsey’s Centred LeadershipProgramme, an external managementand networking scheme for senior femaleexecutives.Of the 815 participants in a culturalawareness programme, 212 are women.Women account for 41 percent of theparticipants in the international traineeprogramme.Three of Aker Solutions’ six shareholderelecteddirectors are women. All directorselected by and amongst employees aremen. This is in accordance with legalrequirements, since women account forless than 20 percent of the overall workforce.The corporate management team hadone female member as of 31 December<strong>2010</strong>. Ten percent of employees in seniormanagement positions are women. Averagepay in the group is somewhat higherfor men than for women. This reflects thefact that, on average, male employeescontinue to have greater pay seniority thanwomen.Performance culture and employee rewardsThe group’s remuneration policy specifiesthat the same pay will be given for thesame work, and that good performance willbe rewarded. Key factors in determiningpay are the scope and level of responsibility,job requirements, levels of expertiseand commitment, results achieved, andlocal pay levels.Aker Solutions is working to increase thecorrespondence between performance andpay. Objectives are set and performance ismeasured on both team and individuallevels, and for both behaviour and commercialdimensions. Objectives are determinedon the basis of strategies and budgetsfor each unit.At least once a year, manager andemployees evaluate the results achieved.This performance dialogue provides thebasis for recognition, rewards and career
Aker Solutions annual report <strong>2010</strong>Board of directors’ report15opportunities, and gives direction forpotential individual performance improvements.Performance based pay is regarded asan attractive part of the total remunerationpaid to employees. Different variable payprogrammes are in place for different typesof positions. <strong>Annual</strong> variable pay is given toemployees on the basis of the commercialresults achieved by the relevant businessunit or project. Managers earn variable payon the basis of the commercial results forthe units they influence and the extent towhich they comply with the group’s values.Variable pay for senior executives isspread over several years to encouragelong-term achievement of results and alasting employee relationship. Furtherdetails of the remuneration of senior executivesare provided in Note 10 Salaries,wages and social security costs to theconsolidated financial statements.Research and developmentAker Solutions has a long standing culturefor innovation and technology development.This is founded on a broad andstrong engineering community with handsonexperience from project driven engineeringand project management throughprocurement, construction, commissioningand operations.The ability to continuously develop andqualify new technology to meet ourcustomers’ needs and secure our competitiveadvantage is fundamental to the groupand it will continue to be further strengthenedgoing forward.In <strong>2010</strong>, the company’s IP position wasfurther developed through new patentfilings and granted applications. Totalresearch and development (R&D) investmentsin <strong>2010</strong> was NOK 329 million (NOK341 million), of which NOK 157 million hasbeen expensed because the criteria forcapitalisation was not met (NOK 164million). In addition the group receivedcontributions from customers and publicfunding worth NOK 110 million for R&D(NOK 22 million) related to specific projects.Aker Solutions strives to maintain investmentlevels in R&D through the businesscycles. For this reason the <strong>2010</strong> R&Dspend was only slightly reduced from <strong>2009</strong>levels despite lower overall revenue for thegroup and fewer projects awarded by customersthrough the year compared to <strong>2009</strong>levels. However, the customer contributionto product development increased significantly.The technology development in AkerSolutions is market driven and costeffective. It is often pursued in close cooperationwith business partners andcustomers worldwide. Our skilled engineeringteams around the world are focused onunderstanding the local and global marketchallenges and translate these into costeffective technical solutions with focus onquality and safety. Aker Solutions’ longstanding track record and experience fromdeveloping and qualifying solutions for theNorth Sea will continue to be exploited andfurther to that developed and exported intoglobal markets.In <strong>2010</strong> the process systems businessengineered and fabricated the first fullstream multistage cyclonic separationsystem using three different types of hydrocyclonesand compact degassing. With acapacity of 40 000 barrels of liquid per day,the system is designed for de-oiling ofheavy oil with very high water productionlevels. In 2011 this CySep system will beinstalled on an offshore heavy oil field in theCampos Basin, where performanceverification testing will be initiated in cooperationwith field operator Petrobras.Within the MMO business the R&Dprojects have focused on integrated operationsand strategic development of technicalintegrity management services (TIMS),enhanced structural integrity maintenanceprograms (SIMP) and implementation ofadvanced non-destructive testing (NDT)inspection technologies.These technologies and services willfurther strengthen our position andcapabili ties within this area and helps usimprove regularity and predictability vital forour clients and authorities. MMO participationin joint industry projects and internaldevelopment programmes have strengthenedour position in areas such as computationalfluid dynamics (Comflow) andwithin analysis of extreme stresses andfatigue in the tensile- and pressure armourlayers of flexible pipes in <strong>2010</strong>.Methods and technologies for thedecommissioning market have been developedas a spin-off of performed removalprojects. The decommissioning market isgrowing with 350 platforms to be removedwithin the next 30 years on the Norwegianand UK sector. Further improvement of thejacket removal technology has beeninitiated.Within Subsea, Aker Solutions continuedto strengthen its production systemsproduct portfolio. New and furtherdeveloped products and solutions werecommercialised within power, processingand boosting.Cost effective installation and operationfriendlysolutions for gas fields, deepwaterapplications and complex fluids were prioritisedin <strong>2010</strong>. During the year, AkerSolutions succeeded in qualifying importantproduct elements which enabled thecompany to take a lead in several of thesegments in which it is competing.Solutions and products for the Brazilianpre-salt fields and solutions for deepwatersubsea well intervention were just some ofthe <strong>2010</strong> achievements.Within power, processing and boosting,Aker Solutions are working together withmajor customers and suppliers to qualifyand commercialise concepts for subseagas compression and ultra-deepwatersubsea boosting. In subsea gas compression,major milestones were reached in<strong>2010</strong> through successful system integrationtesting of the Ormen Lange subsea gascompression pilot station and through theaward of the Åsgard subsea gas compressionproject.The landmark Åsgard project builds onthe technology leap achieved through theOrmen Lange subsea gas compressionpilot, where challenges within real timecondition monitoring and process control,all electric controls, cooling, power distribution,and customising and packaging oftopside technologies for subsea environmenthave been overcome.Aker Solutions is a leading player insteel tube umbilicals. To be able to addressthe increasingly more complex and harshfluids, the company is focusing on qualifyingnew materials and composites. Workhas also been done to further develop andqualify direct electric heating (DEH) cablesfor risers, pipelines and other applications.The first of the company’s deepwatersubsea equipment installation vessels wasdelivered to Petrobras in early <strong>2010</strong>. Thesecond of these vessels – which features atotal solution for installation, completionand well intervention – was also completedand delivered for operation in <strong>2010</strong>.
16 Aker Solutions annual report <strong>2010</strong>Board of directors’ reportLast year, some of the most significanttechnology achievements for AkerSolutions in the field of drilling technologieswere the opening of the iPort centre inStavanger and the spotlight on new technologyawards at Offshore TechnologyConference (OTC) where Aker Solutionsreceived a prestigious innovation award forthe top drive MH MDDM 1000 AC.The iPort centre in Stavanger was inauguratedduring the Offshore NorthernSeas (ONS) conference in Stavanger inAugust. The main engine behind the iPortproducts is a 3D simulator software technologythat is used for training, planningand testing purposes in relation to drillingprojects. The simulator makes qualityassurance of rigs and equipment mucheasier. Having access to complex information,in the form of images, simplifiesproject planning and execution, clarifiescommunication, and reduces risk and costin addition to having simulators as workingtools.The modular derrick drilling machine(MDDM’s) 1000 AC was developed inclose collaboration with drilling contractorTransocean and was designed as what isdescribed as a radically improved derrickdrilling machine that provides enhancedsafety, extreme performance efficiency, anddrilling uptime.The companies put considerable effortinto identifying the current and future limitationsof available top drives and therelated design and components. The resultof this is the modular derrick drillingmachine called MDDM 1000 AC.Aker Solutions also commercialisedother new drilling products in <strong>2010</strong>, such asa new iron roughneck and a new pipe deckpipe handler.Share and share capitalDuring <strong>2010</strong>, the price of the company’sshares rose by 31.5 percent. The closingprice as of 31 December was NOK 99.25.Aker Solutions is included in he OBX indexof the 25 most liquid shares listed on theOslo Stock Exchange. This index rose by18 percent over the same period. Nochanges occurred in the proportion of theshares owned by the principal shareholderin <strong>2010</strong>. Further information on the shareand shareholders can be found on page 76of this annual report.In connection with the share purchaseprogramme for employees (see page 78),the board was mandated by the annualgeneral meeting on 8 April <strong>2010</strong> to buyback shares up to a total nominal value ofNOK 54 800 000, corresponding to tenpercent of the issued shares. The mandateapplies until the next general meeting,which is due to take place on 6 May 2011.As of 31 December <strong>2010</strong>, Aker Solutionshad bought back 680 000 of its own shareswith a value of NOK 56.7 million correspondingto 0.2 percent of the issued total.The board will propose an extension ofthe mandate from the date of the generalmeeting’s decision until the next ordinarygeneral meeting, but no longer than 30June 2012. New terms will then be set forthe buy-back programme. The board wasnot mandated in <strong>2010</strong> to increase the sharecapital.AcknowledgementsThe board extends its thanks to themanagement and workforce for thecommitment displayed in <strong>2010</strong>. The qualityand expertise built up in Aker Solutions willmake important contributions to enhancingthe group’s competitive advantage in ademanding market.Fornebu, 9 March 2011Board of Directors and President & CFO of Aker Solutions ASAØyvind Eriksen Lone Fønns Schrøder Kjell Inge Røkke Vibeke Hammer Madsen Mikael Lilius Ida HelliesenChairmanAtle Teigland Åsmund Knutsen Arild Håvik Arve Toft Leif Hejø BorgePresident & CFO
Aker Solutions annual report <strong>2010</strong><strong>Annual</strong> accounts – group17Declaration by the Board of Directors and President & CFOThe Board and the President & CFO have today considered and approved the annualreport and financial statements for the Aker Solutions group and its parent company AkerSolutions ASA for the <strong>2010</strong> calendar year ended on 31 December <strong>2010</strong>.The Board has based this declaration on reports and statements from the group’sExecutive Chairman and President & CFO, on the results of the group’s activities, and onother information that is essential to assess the group’s position.To the best of our knowledge:■ ■ The <strong>2010</strong> financial statements for the group and parent company have been prepared inaccordance with all applicable accounting standards■ ■ The information provided in the financial statements gives a true and fair portrayal of thegroup and parent company’s assets, liabilities, profit and overall financial position as of31 December <strong>2010</strong>■ ■ The annual report provides a true and fair overview of:– the development, profit and financial position of the group and parent company– the most significant risks and uncertainties facing the group and the parent companyFornebu, 9 March 2011Board of Directors and President & CFO of Aker Solutions ASAØyvind Eriksen Lone Fønns Schrøder Kjell Inge Røkke Vibeke Hammer Madsen Mikael Lilius Ida HelliesenChairmanAtle Teigland Åsmund Knutsen Arild Håvik Arve Toft Leif Hejø BorgePresident & CFO
18 Aker Solutions annual report <strong>2010</strong><strong>Annual</strong> accounts – groupFinancial statements and notes• Aker Solutions group • Aker Solutions ASAConsolidated income statement 19Consolidated statement of comprehensive income 20Consolidated balance sheet as of 31 December 21Consolidated statement of changes in equity 22Consolidated statement of cash flow 23Notes to the financial statements 24Note 1 Corporate information 24Note 2 Basis for preparation 24Note 3 Accounting principles 24Note 4 Accounting estimates and judgements 28Note 5 Financial risk management and exposures 29Note 6 Business combinations andacquisition of non-controlling interests 33Note 7 Disposal groups and discontinued operations 33Note 8 Related parties 35Note 9 Operating segments 36Note 10 Salaries, wages and social security costs 39Note 11 Operating leases 42Note 12 Other operating expenses 43Note 13 Finance income and expenses 43Note 14 Tax 44Note 15 Net capital employed 46Note 16 Trade and other receivables 46Note 17 Inventories 46Note 18 Construction contracts 47Note 19 Trade and other payables 47Note 20 Provisions 47Note 21 Derivative financial instruments 48Note 22 Property, plant and equipment 50Note 23 Intangible assets 51Note 24 Interest-bearing receivables 52Note 25 Investments in associated companies andjointly controlled entities 52Note 26 Jointly controlled operations 54Note 27 Investments in other companies 54Note 28 Borrowings 55Note 29 Other non-current liabilities 58Note 30 Employee benefits - pension 58Note 31 Capital and reserves 61Note 32 Earnings per share 61Note 33 Financial instruments 62Note 34 Contingent events 63Note 35 Number of employees (unaudited) 64Note 36 Group companies as of 31 December <strong>2010</strong> 64Note 37: Subsequent events 66Income statement 67Balance sheet 67Statement of cash flow 68Notes to the financial statements 68Note 1 Accounting principles 68Note 2 Operating expenses 69Note 3 Net financial items 69Note 4 Tax 69Note 5 Investments in group companies 70Note 6 Shareholders’ equity 70Note 7 Receivables and borrowings from group companies 71Note 8 Other non-current interest-bearing receivables 71Note 9 Other current receivables and current liabilities 71Note 10 Borrowings 72Note 11 Guarantees 74Note 12 Financial risk management and financial instruments 74Note 13 Related parties 74Note 14 Shareholders 74• Auditor’s reportAuditor’s report 75
Aker Solutions annual report <strong>2010</strong><strong>Annual</strong> accounts – group19Aker Solutions groupConsolidated income statement 1.1 – 31.12Amounts in NOK million Note <strong>2010</strong> <strong>2009</strong>Amounts in NOK Note <strong>2010</strong> <strong>2009</strong>Operating revenue 46 109 49 527Other income 158 329Total revenue and other income 9 46 267 49 856Materials, goods and services (24 876) (27 949)Salaries, wages and social security costs 10 (12 606) (12 511)Other operating expenses 11, 12 (5 007) (5 301)Total operating expenses (42 489) (45 761)Operating profit before depreciation, amortisation andimpairment 3 778 4 095Earnings per share 32Basic earnings per share 7.27 8.40Diluted earnings per share 7.25 8.39Earnings per share continuing operationsBasic earnings per share 5.96 7.86Diluted earnings per share 5.95 7.85Depreciation, amortisation and impairment 22, 23 (871) (897)Operating profit 2 907 3 198Finance income 13 101 63Finance expenses 13 (537) (565)Profit (loss) from associated companies and jointlycontrolled entities 25 (32) 112Profit (loss) on foreign currency forward contracts 13 (84) 161Profit before tax 2 355 2 969Income tax expense 14 (697) (783)Profit from continuing operations 1 658 2 186Profit from discontinued operations (net of income tax) 7 352 145Profit for the period 2 010 2 331Profit for the period attributable to:Equity holders of the parent company 1 957 2 260Non-controlling interests 53 71Profit for the period 2 010 2 331
20 Aker Solutions annual report <strong>2010</strong><strong>Annual</strong> accounts – groupAker Solutions groupConsolidated statement of comprehensive income 1.1 – 31.12Amounts in NOK million <strong>2010</strong> <strong>2009</strong>Profit for the period 2 010 2 331Other comprehensive incomeCash flow hedges, effective portion of changes in fair value (102) (761)Cash flow hedges, reclassification to income statement 46 397Cash flow hedges, deferred tax 16 102Total cash flow hedges (40) (262)Net gain on hedge of net investment in foreign operations, net of tax 68 -Translation differences - equity-accounted investees (2) (17)Translation differences - foreign operations (73) (972)Other comprehensive income, net of tax (47) (1 234)Total comprehensive income for the period, net of tax 1 963 1 080Attributable to:Equity holders of Aker Solutions ASA 1 903 1 027Non-controlling interests 60 53Total comprehensive income for the period 1 963 1 080
Aker Solutions annual report <strong>2010</strong><strong>Annual</strong> accounts – group21Aker Solutions groupConsolidated balance sheet as of 31 DecemberAmounts in NOK million Note <strong>2010</strong> <strong>2009</strong>AssetsNon-current assetsProperty, plant and equipment 22 7 494 6 531Deferred tax assets 14 487 389Intangible assets 23 6 783 7 915Employee benefit assets 30 95 167Non-current interest-bearing receivables 24 225 184Other non-current operating assets 221 338Investments in associated companies and jointly controlled entities 25 424 423Investments in other companies 27 157 135Total non-current assets 15 886 16 082Current assetsCurrent tax assets 14 238 97Inventories 17 1 686 1 417Trade and other receivables 16 14 870 18 332Derivative financial instruments 21 386 372Current interest-bearing receivables 24 621 440Cash and cash equivalents 3 198 3 186Assets classified as held for sale 7 3 136 -Total current assets 24 135 23 844Total assets 40 021 39 926Amounts in NOK million Note <strong>2010</strong> <strong>2009</strong>Equity and liabilitiesEquityIssued capital 548 548Treasury shares (9) (9)Other capital paid in 1 534 1 534Reserves (763) (709)Retained earnings 8 855 7 612Total equity attributable to the equity holders inAker Solutions ASA 10 165 8 976Non-controlling interests 189 147Total equity 10 354 9 123Non-current liabilitiesNon-current borrowings 28 7 508 7 335Employee benefits obligations 30 647 910Deferred tax liabilities 14 829 692Other non-current liabilities 29 753 891Total non-current liabilities 9 737 9 828Current liabilitiesCurrent borrowings 28 716 180Current tax liabilities 14 115 211Provisions 20 1 039 869Trade and other payables 19 16 278 19 370Derivative financial instruments 21 243 345Liabilities classified as held for sale 7 1 539 -Total current liabilities 19 930 20 975Total liabilities 29 667 30 803Total liabilities and equity 40 021 39 926Fornebu, 9 March 2011Board of Directors and President & CFO of Aker Solutions ASAØyvind Eriksen Lone Fønns Schrøder Kjell Inge Røkke Vibeke Hammer Madsen Mikael Lilius Ida HelliesenChairmanAtle Teigland Åsmund Knutsen Arild Håvik Arve Toft Leif Hejø BorgePresident & CFO
22 Aker Solutions annual report <strong>2010</strong><strong>Annual</strong> accounts – groupAker Solutions groupConsolidated statement of changes in equity 1.1 – 31.12Amounts in NOK millionNumber ofsharesSharecapitalTreasurysharesOther capitalpaid inRetainedearningsHedgingreserve 2Currencytranslationreserve 2Total parentcompany equityholdersNoncontrollinginterestsTotalequityEquity as of 1 January <strong>2009</strong> 274 000 000 548 (10) 1 534 5 868 410 100 8 450 156 8 606Profit for the period 2 260 2 260 71 2 331Other comprehensive income (262) (971) (1 233) (18) (1 251)Total comprehensive income 2 260 (262) (971) 1 027 53 1 080Business combination (14) 14 - -Transactions with equity holdersDividend - - - (431) (431) (20) (451)Treasury shares acquired - (1) - (19) - - (20) (20)Employee share purchase programme 1 2 - 44 - - 46 46Change in non-controlling interests - - - (96) - - (96) (42) (138)Total transactions with equity holders - 1 - (502) - - (501) (62) (563)Equity as of 31 December <strong>2009</strong> 274 000 000 548 (9) 1 534 7 612 162 (871) 8 976 147 9 123Profit for the period 1 957 1 957 53 2 010Other comprehensive income (40) (14) (54) 7 (47)Total comprehensive income 1 957 (40) (14) 1 903 60 1 963Transactions with equity holdersDividend - - - (700) - - (700) (14) (714)Treasury shares acquired - (1) - (56) - - (57) (57)Employee share purchase programme 1 - 1 - 55 - - 56 56Change in non-controlling interests - - - (13) - - (13) (4) (17)Total transactions with equity holders - - - (714) - - (714) (18) (732)Equity as of 31 December <strong>2010</strong> 274 000 000 548 (9) 1 534 8 855 122 (885) 10 165 189 10 3541) See note 10 Salaries, wages and social security costs.2) See note 32 Capital and reserves.
Aker Solutions annual report <strong>2010</strong><strong>Annual</strong> accounts – group23Aker Solutions groupConsolidated statement of cash flow 1.1 – 31.12Amounts in NOK million Note <strong>2010</strong> <strong>2009</strong>Amounts in NOK million Note <strong>2010</strong> <strong>2009</strong>Cash flow from operating activitiesProfit for the period continuing operations 1 658 2 186Profit for the period discontinued operations 7 352 145Profit for the period 2 010 2 331Adjusted for:Income tax expense 14 826 877Net interest cost 460 411(Profit) loss on foreign currency forward contracts 13 84 (161)Depreciation, amortisation and impairment 22, 23 889 910(Profit) loss on disposals and non-cash effects 1 (156) (332)(Profit) loss from associated companies and jointlycontrolled entities 31 (114)Interest paid (454) (308)Interest received 70 27Income taxes paid (997) (1 008)Changes in other net operating assets (632) 1 612Net cash from operating activities 9 2 131 4 245Cash flow from investing activitiesAcquisition of subsidiaries, net of cash acquired (101) (1 117)Acquisition of property, plant and equipment 22 (2 467) (2 201)Proceeds from sale of property, plant and equipment 742 40Proceeds from sale of associates 24 622Other investments (82) (1 184)Payment related to increase in interest-bearing receivables (225) (87)Net cash from investing activities (2 109) (3 927)Cash flow from financing activitiesProceeds from borrowings 799 3 341Repayment of borrowings (200) (3 116)Acquisition of non-controlling interests (13) (78)Proceeds from non-controlling interests 8 -Repurchase of treasury shares 31 (57) (20)Proceeds from employees share purchase programme 31 56 46Dividends paid to non-controlling interests (14) (20)Dividends to shareholders in Aker Solutions 31 (700) (431)Net cash from financing activities (121) (278)Effect of exchange rate changes on cash and bank deposits 111 (682)Net increase (decrease) in cash and bank deposits 12 (642)Cash and cash equivalents at the beginning of the period 3 186 3 828Cash and cash equivalents at the end of the period 2 3 198 3 186Of which is restricted cash 3 723 3801) Includes gain or loss on disposals of property, plant and equipment and gain on acquisitions related to remeasurement of previouslyheld interests.2) Additional undrawn committed non-current bank revolving credit facilities amounted to NOK 5.1 billion, and is together with cashand cash equivalents giving a total liquidity buffer of NOK 8.3 billion.3) Restricted cash includes inter alia cash in joint ventures where both partners must agree before use outside the joint venture, andNOK 381 million regarding sale of office building at Fornebu which was released in January 2011.
24 Aker Solutions annual report <strong>2010</strong><strong>Annual</strong> accounts – groupAker Solutions groupNotes to the financial statementsNote 1Corporate informationAker Solutions ASA (the company) is a limited liabilitycompany incorporated and domiciled atFornebu in Bærum, Norway. The consolidatedfinancial statements of Aker Solutions ASA incorporatethe financial statements of the companyand its subsidiaries (referred to collectively as “thegroup” and separately as group companies) andthe group’s interest in associates and jointly controlledentities.Aker Solutions provides engineering solutions,product solutions, field life solutions and executeslarge and complex field development projects forthe oil and gas industry.The company is listed on the Oslo Stock Exchangeunder the ticker AKSO.Note 2Basis for preparationStatement of complianceThe consolidated financial statements have beenprepared in accordance with International Financial<strong>Report</strong>ing Standards (IFRS) as approved by theEuropean Union, their interpretations adopted bythe International Accounting Standards Board(IASB) and the additional requirements of the NorwegianAccounting Act as of 31 December <strong>2010</strong>.The consolidated financial statements wereapproved by the Board of Directors and President& CFO as shown on the dated and signed balancesheet. The consolidated financial statements willbe authorised by the <strong>Annual</strong> General Meeting on 6May 2011. Until the latter date the Board of Directorshave the authority to amend the financialstatements.Basis of measurementThe consolidated financial statements have beenprepared on the historical cost basis exceptfor the following material items in the statement offinancial position:■■Derivative financial instruments are measuredat fair value■■The defined benefit asset is recognised as thenet total of the plan assets, plus unrecognisedpast service cost and unrecognised actuariallosses, less unrecognised actuarial gainsand the present value of the defined benefitobligation.Functional and presentation currencyThese consolidated financial statements are presentedin NOK, which is Aker Solutions ASA’s functionalcurrency. All financial information presentedin NOK has been rounded to the nearestmillion (NOK million), except when otherwise indicated.Use of estimates and judgementsThe preparation of financial statements in conformitywith IFRS requires management to make judgements,estimates and assumptions that affect theapplication of policies and reported amounts ofassets and liabilities, income and expenses.Although management believes these assumptionsto be reasonable, given historical experience,actual amounts and results could differ from theseestimates. The items involving a higher degree ofjudgement or complexity, and items whereassumptions and estimates are material to the consolidatedfinancial statements are disclosed in note4 Accounting estimates and judgements.The estimates and underlying assumptions arereviewed on an ongoing basis. Revisions toaccounting estimates are recognised in the periodin which the estimate is revised and in any futureperiods affected.Changes in accounting policiesThe group has not made any changes in accountingpolicies in <strong>2010</strong>.The group early adopted IFRS 3 Business Combinations(<strong>2008</strong>) and IAS 27 Consolidation and SeparateFinancial Statements (<strong>2008</strong>) for all businesscombinations occurring in the financial year starting1 January <strong>2009</strong>. The impacts of these adoptionswere provided in the annual report for <strong>2009</strong>.IFRIC 16 ‘Hedges of a net investment in a foreignoperation’ was effective 1 July <strong>2009</strong>. This amendmentstates that, in a hedge of a net investment ina foreign operation, qualifying hedging instrumentsmay be held by any entity or entities within thegroup, including the foreign operation itself, as longas the designation, documentation and effectivenessrequirements of IAS 39 that relate to a netinvestment hedge are satisfied. IFRIC 16 is implemented,but does not have a significant effect onthe consolidated financial statements.Note 3Accounting principlesSummary of significant accounting policiesThe principal accounting policies applied in thepreparation of these consolidated financial statementsare set out below. These policies have beenconsistently applied to all the years presented,unless otherwise stated.ConsolidationSubsidiariesSubsidiaries are entities controlled by the company.Control exists when the company has thepower, directly or indirectly, to govern the financialand operating policies of an entity so as to obtainbenefits from its activities. When assessing control,voting rights that are exercisable or convertible aretaken into account. The financial statements ofsubsidiaries are included in the consolidated financialstatements from the date that control commencesuntil the date that control ceases.Investments in associates and jointly controlledentitiesAssociates are those entities in which the grouphas significant influence, but not control, over thefinancial and operating policies. Significant influenceis presumed to exist when the group holdsbetween 20 and 50 percent of the voting power ofanother entity. Joint ventures are those entitiesover whose activities the group has joint control,established by contractual agreement and requiringunanimous consent of the venturers for strategic,financial and operating decisions.Investments in associates and jointly controlledentities are accounted for using the equity methodand are recognised initially at cost. The group’sinvestment includes goodwill identified on acquisition,net of any accumulated impairment losses.The consolidated financial statements include thegroup’s share of the income and expenses andother comprehensive income, after adjustments toalign the accounting policies with those of thegroup, from the date that significant influence orjoint control commences until the date that significantinfluence or joint control ceases. The purposeof the investment determines where the investmentis presented in the income statement. When entitiesare formed to share risk in executing a projector are closely related to Aker Solutions operatingactivities, the share of the profit or loss is reportedas part of Other income in operating profit. Shareof the profit or loss on financial investments isreported as part of Financial items.When the group’s share of losses exceeds its interestin an equity-accounted investee, the carryingamount of that interest, including any long-terminvestments, is reduced to zero, and further lossesare not recognised except to the extent that thegroup incurred legal or constructive obligations orhas made payments on behalf of the investee.Jointly controlled operationsJointly controlled operations involve the use ofassets and other resources of the venturers ratherthan the establishment of a corporation, partnershipor other entity. Each venturer uses its ownassets and incurs liabilities which represents itsown obligations under the agreement. The agreementalso determines how the revenues are sharedamong the venturers.Transactions eliminated on consolidationIntra-group balances and transactions, and anyunrealised gains and losses or income andexpenses arising from intra-group transactions, areeliminated in preparing the consolidated financialstatements. Unrealised gains arising from transactionswith associates and jointly controlled entitiesare eliminated to the extent of the group’s interestin the entity. Unrealised losses are eliminated in thesame way as unrealised gains, but only to theextent that there is no evidence of impairment.
Aker Solutions annual report <strong>2010</strong><strong>Annual</strong> accounts – group25Non-current assets and disposal groupsheld for saleNon-current assets and disposal groups are classifiedas held for sale when their carrying amountswill be recovered principally through a sale transactionrather than through continuing use. Thiscondition is regarded as met only when the sale ishighly probable and the asset or disposal group isavailable for immediate sale in its present condition.Management must be committed to the sale,which should be expected to qualify for recognitionas a completed sale within one year from the dateof classification.Non-current assets and disposal groups classifiedas held for sale are measured at the lower of theircarrying amount and fair value less costs to sell.Property, plant and equipment and intangibleassets once classified as held for sale are notdepreciated or amortised, but are considered in theoverall impairment testing of the disposal group.No reclassifications are made for years prior to theyear a business is first classified as a held for sale.Discontinued operationsA discontinued operation is a component of thegroup’s business that represents a separate majorline of business or geographical area of operationsthat has been disposed of or is held for sale ordistribution, or is a subsidiary acquired exclusivelywith a view to resale. Classification as a discontinuedoperation occurs upon disposal or when theoperation meets the criteria to be classified as heldfor sale, if earlier.In the consolidated income statement income andexpenses from discontinued operations arereported separately from income and expensesfrom continuing operations, down to the level ofprofit after taxes. When an operation is classifiedas a discontinued operation, the comparativeincome statement is re-presented as if the operationhad been discontinued from the start of thecomparative year.Foreign currencyForeign currency transactions and balancesTransactions in foreign currencies are translated atthe exchange rate at the date of the transaction.Monetary assets and liabilities denominated inforeign currencies at the balance sheet date aretranslated to the functional currency at theexchange rate on that date. Foreign exchange differencesarising on translation are recognised inthe income statement. Non-monetary assets andliabilities measured in terms of historical cost in aforeign currency are translated using the exchangerate on the date of the transaction. Non-monetaryassets and liabilities denominated in foreign currenciesthat are stated at fair value are translated tothe functional currency at the exchange rates onthe date the fair value was determined.Investments in foreign operationsItems included in the financial statements of eachof the group’s entities are measured using the currencyof the primary economic environment inwhich the entity operates. The results and financialposition of all the group entities that have a functionalcurrency different from the group’s presentationcurrency are translated into the presentationcurrency as follows:■■Assets and liabilities, including goodwill andfair value adjustments, for each balance sheetpresented are translated at the closing rate on■■the date of that balance sheet.Income and expenses for each incomestatement are translated at average exchangerates for the year, calculated on the basis of 12monthly rates.Exchange differences arising from the translationof the net investment in foreign operations, and ofrelated hedges, are included in comprehensiveincome as a translation reserve. These translationdifferences are reclassified to the income statementupon disposal of the related operations orwhen settlement is likely to occur in the nearfuture.Exchange differences arising on a non-currentmonetary item where settlement in the near futureis not probable forms part of the net investment inthat entity. Such exchange differences are recognisedin comprehensive income.Hedging activitiesDerivatives are either:■■Hedges of the fair value of assets or liabilities(fair value hedge)■■Hedges of a particular risk associated with arecognised liability or a highly probable forecast■■transaction (cash flow hedge)Hedges of a net investment in a foreignoperation (net investment hedge).Fair value hedgesThe change in fair value of the hedging instrumentis recognised in the consolidated income statement.The change in fair value of the hedged itemattributable to the risk hedged is recorded as partof the carrying value of the hedged item. When anunrecognised firm commitment is designated as ahedged item, the subsequent cumulative change infair value of the firm commitment attributable to thehedged risk is recognised as an asset or liabilitywith corresponding gain or loss recognised in theincome statement.Cash flow hedgesThe effective portion of changes in the fair value ofderivatives that are designated and qualifying ascash flow hedges is recognised in comprehensiveincome as a hedge reserve. The gain or loss relatingto the ineffective portion of derivative hedging instrumentsis recognised immediately in the incomestatement within net financial items. Amounts accumulatedin hedge reserves are reclassified to theincome statement in the periods when the hedgeditem is recognised in the income statement.Hedge accounting is discontinued when the grouprevokes the hedging relationship, or when thehedging instrument expires or is sold, terminated,or exercised, or no longer qualifies for hedgeaccounting. Any cumulative gain or loss deferred incomprehensive income as a hedge reserve at thattime remains in the hedge reserve and is recognisedin income statement when the forecast transactionis ultimately recognised in the income statement.When a forecast transaction is no longerexpected to occur, the cumulative gain or loss thatwas deferred in the hedge reserve is recognisedimmediately in the income statement.Net investment hedgeGains or losses arising from the hedging instrumentsrelating to the effective portions of the netinvestment hedges are recognised in comprehensiveincome as translation reserves. These translationreserves are reclassified to the income statementupon disposal of the hedged net investments,offsetting the translation differences fromthese net investments. Any ineffective portion isrecognised immediately in the income statementwithin net financial items.Gains and losses accumulated in equity areincluded in the income statement when the foreignoperation is partially disposed of or sold.Revenue recognitionConstruction contractsEngineering and construction contract revenuesare recognised using the percentage of completionmethod, based primarily on contract costs incurredto date compared to estimated total contractcosts. When the final outcome of a contract cannotbe reliably estimated, contract revenue is recognisedonly to the extent of costs incurred that areexpected to be recoverable. The revenue recognisedin one period will be the revenues attributableto the period’s progress and the progress todate effect of any changes to the estimated finaloutcome. Losses on contracts are fully recognisedwhen identified.Contract revenues include variation orders andincentive bonuses when it is probable that they willresult in revenue that can be measured reliably.Disputed amounts and claims are recognised whenit is probable the customer will accept the claimand the amount can be measured reliably. Contractcosts include costs that relate directly to the specificcontract and allocated costs that are attributableto general contract activity. Costs that cannotbe attributed to contract activity are expensed.Bidding costs are capitalised when it is probablethat the company will obtain the contract. All otherbidding costs are expensed as incurred.See note 4 Accounting estimates and judgementsfor further description of recognition of constructioncontract revenue.Goods sold and services renderedRevenue from the sale of goods is recognised inthe income statement when the significant risksand rewards of ownership have been transferred tothe buyer, which is usually when goods areshipped to customers. Revenue from services renderedis recognised in the income statement inproportion to the stage of completion of the transactionat the balance sheet date or is invoicedbased on hours performed at agreed rates. Thestage of completion is normally assessed based onthe proportion of costs incurred for work performedto date compared to the estimated totalcontract costs. No revenue is recognised if there issignificant uncertainty regarding recovery of considerationdue.Other incomeGains and losses resulting from acquisitions anddisposal of businesses which do not represent
26 Aker Solutions annual report <strong>2010</strong><strong>Annual</strong> accounts – groupdiscontinued operations are included in otherincome within operating profit. Such gains mayresult from the remeasurement of a previously heldinterest in the acquired entity. Changes in the fairvalue of the deferred consideration from acquisitionof a subsidiary or non-controlling interest fortransactions after 1 January <strong>2009</strong> will be recognisedin other income as gains or losses. Suchchanges will continue to be adjusted against goodwillfor transactions completed prior to 1 January<strong>2009</strong>.Share of profit from associated companies andjointly controlled operations, to the extent thatthese investments are related to the group’s operatingactivities, are included in Other income withinoperating profit, as well as gains and losses relatedto the sale of operating assets.ExpensesConstruction contractsExpenses attributable to construction contracts arerecorded as they are incurred and are often usedas a basis for determining progress on the contracts(expenses incurred to date as a ratio of totalexpected contract expenses). See note 4 Accountingestimates and judgements for further descriptionof recognition of construction contract costs.Operating lease paymentsPayments made under operating leases are recognisedin the income statement on a straight-linebasis over the term of the lease when there arevariations in the contractual lease payments due.Share purchase programme for employeesAker Solutions employees participate in a sharepurchase programme whereby an employee canbuy Aker Solutions shares at a discount. Anemployee who is still employed by the group andstill holds the shares in September, one and a halfyear after the close of each annual savins programme,will receive one bonus share for each twoshares bought under the programme. The cost ofthe contribution towards the purchase of theshares is expensed as salary costs immediately.The value of the bonus shares is expensed overthe vesting period based on the fair value of eachaward, adjusted for estimated forfeitures.Financial income and expenseFinancial income and expense comprises interestpayable on borrowings calculated using the effectiveinterest rate method, interest receivable onfunds invested, dividend income, foreign exchangegains and losses, and gains and losses on derivativesnot subject to hedge accounting recognisedin the income statement (see Hedging activities).Interest income is recognised in the income statementas it accrues, using the effective interestmethod.Income taxIncome tax on the income statement for the yearcomprises current and deferred tax. Income tax isrecognised in the income statement except to theextent that it relates to items recognised directly inequity or in comprehensive income.Current tax is the expected tax payable or receivableon the taxable income or loss for the year,using tax rates enacted or substantially enacted atthe reporting date, and any adjustment to tax payablein respect of previous years. Current tax payablealso includes any tax liability arising from thedeclaration of dividends, recognised at the sametime as the liability to pay the related dividend.Deferred tax is recognised in respect of temporarydifferences between the carrying amounts ofassets and liabilities for financial reporting and theamounts used for taxation purposes. Deferred taxis not recognised for:■■Goodwill not deductible for tax purposes■■The initial recognition of assets or liabilities that■■affect neither accounting nor taxable profitDifferences relating to investments insubsidiaries to the extent that they will notreverse in the foreseeable future.Deferred tax is measured at the tax rates that areexpected to be applied to temporary differenceswhen they reverse, based on the laws that havebeen enacted or substantively enacted by thereporting date.Deferred tax assets and liabilities are offset if thereis a legally enforceable right to offset current taxliabilities and assets, and they relate to incometaxes levied by the same tax authority on the sametaxable entity, or on different tax entities, but theyintend to settle current tax liabilities and assets ona net basis or their tax assets and liabilities will berealised simultaneously.A deferred tax asset is recognised for unused taxlosses, tax credits and deductible temporary differences,to the extent that it is probable that futuretaxable profits will be available against which theycan be utilised. Deferred tax assets are reviewed ateach reporting date and are reduced to the extentthat it is no longer probable that the related taxbenefit will be realised.Trade and other receivablesTrade and other receivables are carried at the originalinvoice amount, less an allowance made fordoubtful receivables. Provision is made when thereis objective evidence that the group will be unableto recover balances in full. Balances are written offwhen the probability of recovery is assessed asbeing remote. Trade receivables are thus valued atamortised cost using the effective interest ratemethod. The interest rate element is disregarded ifit is insignificant, which is the case for the majorityof the group’s trade receivables.Construction work in progressConstruction work in progress represents the valueof construction work performed less payments bycustomers. The value of construction work performedis measured at revenue recognised to date.Payments by customers are deducted from thevalue of the same contract or, to the extent theyexceed this value, disclosed as advances fromcustomers.InventoriesInventories are stated at the lower of cost or netrealisable value. Net realisable value is the estimatedselling price in the ordinary course of business,less the estimated costs of completion andselling expenses.The cost of inventories is based on the first-in firstoutprinciple and includes expenditures incurred inacquiring the inventories and bringing them to theirexisting location and condition. In the case of manufacturedinventories and work in progress, costincludes an appropriate share of overheads basedon normal operating capacity.ImpairmentThe carrying amounts of the group’s assets, otherthan inventories, deferred tax assets and derivativesare reviewed at the end of each reporting period todetermine whether there is any indication of impairment.For goodwill, assets that have an indefiniteuseful life and intangible assets that are not yetavailable for use, the recoverable amount is estimatedannually. If indication of impairment exists,the asset’s recoverable amount is estimated.Recoverable amountThe recoverable amount of the group’s investmentsin held-to-maturity securities and receivablescarried at amortised cost are calculated as thepresent value of estimated future cash flows, discountedat the original effective interest rate (i.e.,the effective interest rate computed at initial recognitionof these financial assets). Receivables with ashort duration are not discounted.The recoverable amount of other assets is thegreater of their net selling price and value in use. Inassessing value in use, the estimated future cashflows are discounted to their present value using apre-tax discount rate that reflects current marketassessments of the time value of money and therisks specific to the asset. For an asset that doesnot generate largely independent cash inflows, therecoverable amount is determined for the cashgeneratingunit to which the asset belongs.Impairment loss recognitionAn impairment loss is recognised whenever thecarrying amount of an asset or its cash-generatingunit exceeds its recoverable amount. An impairmentloss on available-for-sale assets is recognisedin equity. Other impairment losses are recognisedin the income statement.An impairment loss recognised in respect of cashgeneratingunits is allocated first to reduce thecarrying amount of any goodwill allocated to cashgeneratingunits (group of units) and then, toreduce the carrying amount of the other assets inthe unit (group of units) on a pro rata basis.Reversals of impairmentAn impairment loss on goodwill is not reversed. Animpairment loss on other assets is reversed if therehas been a change in the estimates used to determinethe recoverable amount.An impairment loss is reversed only to the extentthat the asset’s carrying amount does not exceedthe carrying amount that would have been determined,net of depreciation or amortisation, if noimpairment loss had been recognised.ProvisionsA provision is recognised in the balance sheetwhen the group has a present obligation as a resultof a past event and it is probable that the group willbe required to settle the obligation. If the effect ismaterial, provisions are determined by discounting
Aker Solutions annual report <strong>2010</strong><strong>Annual</strong> accounts – group27the expected future cash flows at a market basedpre-tax rate that reflects current market assessmentsof the time value of money and, whereappropriate, the liability-specific risks.WarrantiesA provision for warranties is recognised when theunderlying products or services are sold. The provisionis based on historical warranty data and aweighting of all possible outcomes against theirassociated probabilities.Onerous contractsA provision for onerous contracts is recognisedwhen the expected benefits to be derived by thegroup from a contract are lower than the unavoidablecost of meeting the obligations under the contract.Derivative financial instrumentsThe group uses derivative financial instruments tohedge its exposure to foreign exchange and interestrate risks arising from operational, financial andinvestment activities. The group also has embeddedforeign exchange derivatives which have beenseparated from their ordinary commercial contracts.The embedded derivatives and the hedgingderivatives that do not qualify for hedge accountingare accounted for as trading instruments.An embedded derivative is any contract embeddedin a host contract which meets the definition of aderivative. In Aker Solutions this normally occurswhen a commercial contract is agreed to be settledin a foreign currency. Under certain conditionsthe embedded derivative must be separated fromits host contract and the derivative is then to berecognised and measured as any other derivativein the financial statements. Normally this is when asettlement is denominated in a currency differentfrom any of the major contract parties’ own functionalcurrency. Typically this happens with deliveriesto countries that do not have an internationalconvertible currency, but also in other countrieswhere some clients may wish to use foreign currencysettlements as part of their own hedgingstrategy.Derivatives are initially recognised at fair value onthe date a derivative contract is entered into andare subsequently remeasured at their fair value.The gain or loss on remeasurement is recognisedimmediately in the income statement. Where derivativesqualify for hedge accounting, recognition ofany resultant gain or loss depends on the nature ofthe item being hedged (see Hedging activities).Property, plant and equipmentOwned assetsProperty, plant and equipment are stated at costless accumulated depreciation and impairmentlosses. The cost of self-constructed assetsincludes the cost of materials, direct labour, thecost for interest on qualifying assets effective from1 January <strong>2009</strong>, and, where relevant, the estimatedcosts of dismantling and removing the items andrestoring the site on which they are located, and anappropriate proportion of production overheads.Where components of property, plant and equipmenthave different useful lives, they are accountedfor as separate components.Leased assetsLeases where the group assumes substantially allthe risks and rewards of ownership are classifiedas finance leases. Assets acquired by way offinance leases are stated at an amount equal to thelower of the asset’s fair value or the present valueof the minimum lease payments at inception of thelease, less accumulated depreciation and impairmentlosses.Subsequent costsThe group capitalises the cost of a replacementpart or a component of property, plant and equipmentwhen that cost is incurred if it is probable thatthe future economic benefits embodied with theitem will flow to the group and the cost of the itemcan be measured reliably. All other costs areexpensed as incurred.DepreciationDepreciation is normally recognised on a straightlinebasis over the estimated useful lives of property,plant and equipment. The production unitmethod is used for depreciation in limited circumstanceswhen appropriate.Intangible assetsGoodwillAll business combinations are accounted for usingthe acquisition method. Goodwill represents theexcess of the cost of an acquisition over the fairvalue of the group’s share of the net identifiableassets of acquired businesses or interest in associatesor joint ventures that are businesses at thedate of acquisition. Goodwill on acquisitions ofsubsidiaries is included in intangible assets. Goodwillon acquisitions of associates and joint venturesis included in the investment balance and is testedfor impairment as part of the overall balance.Goodwill is carried at cost less accumulatedimpairment losses (see Impairment). Gains andlosses on the disposal of an entity or an interest inan entity include the carrying amount of goodwillrelating to the ownership interest sold. Where thefair value of net assets acquired exceeds considerationpaid, the resulting gain arising on an acquisitionis recognised directly in the income statement.The acquisition of a company is based upon itsstrategic fit and anticipated profitability of thatcompany over a long period of time. Goodwill isassumed to have an indefinite useful life becausethere is no foreseeable limit to the period overwhich the asset is expected to generate net cashinflows for the entity.Goodwill is allocated to cash-generating units forthe purpose of impairment testing. The allocation ismade to those cash-generating units or groups ofcash-generating units that are expected to benefitfrom the business combination in which goodwillarose.When the group disposes of an operation within aCGU or group of CGUs to which goodwillhas been allocated, then a portion of the goodwillis included in the carrying amount of theoperation when determining the gain or loss ondisposal. The portion of the goodwillallocated is measured based on the relative valuesof the operation disposed of and theportion of the CGU retained at the date of partialdisposal, unless it can be demonstratedthat another method better reflects the goodwillassociated with the operation disposed of. Thesame principle is used for allocation of goodwillwhen the group reorganises its businesses.Research and developmentExpenditures on research activities undertakenwith the prospect of obtaining new scientific ortechnical knowledge and understanding is recognisedin the income statement as an expense asincurred.Expenditures on development activities, wherebyresearch findings are applied to a plan or designfor the production of new or substantially improvedproducts and processes, is capitalised if the productor process is technically and commercially feasibleas well as being a separable asset. Capitalisedcosts include the cost of materials, externalcontractors, direct labour and capitalised intereston qualifying assets arising after 1 January <strong>2009</strong>.Other development expenditures are recognised inthe income statement as an expense as incurred.Capitalised development expenditures are statedat cost less accumulated amortisation and impairmentlosses.Other intangible assetsOther intangible assets that are acquired by thegroup are stated at cost less accumulated amortisationand impairment losses.Subsequent expendituresSubsequent expenditures on capitalised intangibleassets are capitalised only when they increase thefuture economic benefits embodied in the specificasset to which they relate. All other expendituresare expensed as incurred.AmortisationAmortisation is charged to the income statementon a straight-line basis over the estimated usefullives of intangible assets unless such lives areindefinite. Intangible assets are amortised from thedate they are available for use.Employee benefitsDefined contribution plansObligations for contributions to defined contributionpension plans are recognised as an expense inthe income statement as incurred.Defined benefit plansThe group’s net obligation in respect of definedbenefit pension plans is calculated separately foreach plan by estimating the amount of future benefitthat employees have earned in return for theirservice in the current and prior periods; that benefitis discounted to determine its present value, andthe fair value of any plan assets is deducted. Thediscount rate is the yield at the balance sheet dateon government bonds or high-quality corporatebonds with maturities consistent with the terms ofthe obligations. The calculation is performed by aqualified actuary using the projected unit creditmethod.When the benefits of a plan to employees areincreased, the portion of the increased benefitrelating to past service by employees is recognised
28 Aker Solutions annual report <strong>2010</strong><strong>Annual</strong> accounts – groupas an expense in the income statement on astraight-line basis over the average period until thebenefits become vested. To the extent that thebenefits vest immediately, an expense is recognisedimmediately in the income statement.To the extent that any subsequent cumulativeunrecognised actuarial gain or loss exceeds 10percent of the greater of the present value of thedefined benefit obligation and the fair value of planassets, that portion is recognised in the incomestatement over the expected average remainingworking lives of the employees participating in theplan. Otherwise, the actuarial gain or loss is notrecognised.When the actual calculation results in a benefit tothe group, the recognised asset is limited to thenet total of any unrecognised actuarial losses andpast service costs and the present value of anyfuture refunds from the plan or reductions in futurecontributions to the plan.Share-based payment transactionsFor cash-settled share-based payments, a liabilityequal to the portion of the goods or servicesreceived is recognised at the current fair valuedetermined at each balance sheet date.Financial instrumentsFinancial instruments in the Aker Solutions groupconsists of cash and cash equivalents, investmentsin other companies, derivative financialinstruments, non-current interest-bearing receivables,trade and other receivables/payables andnon-current borrowings. The categorisation andmethod for measurement of these items isdescribed in note 33 Financial Instruments.Cash and cash equivalentsCash and cash equivalents include cash on hand,demand deposits held at banks and other shorttermhighly liquid investments with original maturityof three months or less. Restricted cash is mainlycash tied up in projects through joint ventures withexternal parties. The amounts fluctuate with theprojects’ life cycle and are usually released whenthe project is delivered or close to delivery.Interest-bearing borrowingsInterest-bearing borrowings are recognised initiallyat fair value less attributable transaction costs.Subsequent to initial recognition, interest-bearingborrowings are stated at amortised cost with anydifference between cost and redemption valuebeing recognised in the income statement over theperiod of the borrowings on an effective interestbasis.Share capitalOrdinary shares are classified as equity. Repurchaseof share capital is recognised as a reductionin equity and is classified as treasury shares.New standards and interpretations not yetadoptedStandards issued but not yet effective up to thedate of issuance of the group’s financial statementsare listed below. This listing is of standardsand interpretations issued, which the group reasonablyexpects to be applicable at a future date.The group intends to adopt those standards whenthey become effective.Revised IAS 24 Related Party Disclosure is applicableeffective 1 January 2011. The impact for thegroup is currently under evaluation, but is notexpected to have a significant effect on the consolidatedfinancial statements.IFRS 9 Financial Instruments: Classification andmeasurement as issued reflects the first phase ofthe IASBs work on the replacement of IAS 39 andapplies to classification and measurement of financialassets as defined in IAS 39. The standard iseffective for annual periods beginning on or after 1January 2013. In subsequent phases, the IASB willaddress classification and measurement of financialliabilities, hedge accounting and derecognition.The completion of this project is expected in early2011. The adoption of the first phase of IFRS 9 willhave an effect on the classification and measurementof the Group’s financial assets. The group willquantify the effect in conjunction with the otherphases, when issued, to present a comprehensivepicture.Note 4Accounting estimates andjudgementsEstimates and judgements are continually reviewedand are based on historical experiences andexpectations of future events. The resultingaccounting estimates will, by definition, seldomaccurately match actual results, but are based onthe best estimate at the time. Estimates andassumptions that have a significant risk of causingmaterial adjustments to the carrying amounts ofassets and liabilities within the next financial yearare discussed below.Revenue recognitionThe percentage-of-completion method is used toaccount for construction contracts. This methodrequires estimates of the final revenue and costs ofthe contract, as well as measurement of progressachieved to date as a proportion of the total workto be performed.The main uncertainty when assessing contractrevenue is related to recoverable amounts fromvariation orders, claims and incentive paymentswhich are recognised when, in the group’s judgement,it is probable that they will result in revenueand are measurable. This assessment is adjustedupon management’s evaluation of liquidated damagesto be imposed by customers typically relatingto contractual delivery terms. In many projectsthere are frequent changes in scope of work resultingin a number of variation orders. Normally thecontracts with customers include procedures forpresentation of and agreement of variation orders.At any point in time, there will be unapproved variationorders and claims included in the projectrevenue where recovery is assessed as probableand other criteria are met. Even though managementhas extensive experience in assessing theoutcome of such negotiations, uncertainties exist.Cost to complete depends on productivity factorsand the cost of inputs. Weather conditions, theperformance of subcontractors and others with animpact on schedules, commodity prices and currencyrates can all affect cost estimates. Experience,systematic use of the project executionmodel and focus on core competencies reducesbut do not eliminate the risk that estimates maychange significantly. A risk contingency is includedin project cost based on the risk register that isprepared for every project.Progress measurement based on costs has aninherent risk related to the cost estimate asdescribed above. In situations where cost is notseen to properly reflect actual progress, alternativemeasures such as hours or plan progress are usedto achieve more precise revenue recognition. Theestimation uncertainty during the early stages of acontract is mitigated by a policy of normally notrecognising revenue in excess of costs on largeprojects before the contract reaches 20 percentcompletion.In the group’s view, the following project is subjectto estimation uncertainty, the outcome of whichcould have a material impact on the consolidatedfinancial statements:LongviewThe Longview project was awarded to Aker Construction,Inc., an indirect subsidiary of Aker SolutionsASA, in January <strong>2007</strong>, in a consortium withSiemens Energy, Inc. The consortium contractstotal combined value is approximately USD 1.1billion with Aker Construction’s individual contractvalued at approximately USD 654 million. Completionof the project is currently scheduled to occurmid 2011. The project is delayed and costs haveincreased due to, among other factors, forcemajeure events, changes to the project, and thirdparty actions in furnishing engineering services,equipment and materials, all of which have directlyand adversely impacted Aker Solutions’ projectwork.Drilling Riser portfolioThe Drilling Riser business, which is fairly newbusiness for Aker Solutions, has been loss-makingdue to quality problems and execution delays. Theproduction has improved, but in fourth quarter newquality issues appeared on some risers systemsthat have been delivered, and NOK 328 million wasbooked in fourth quarter in losses. Around 250million of the losses are provisions for repair andpotential liquidated damages. The remaining drillingriser backlog consists of 13 systems, of which10 to be delivered in the first half of 2011.WarrantiesA provision is made for expected warranty expenditures.The warranty period is normally two years.Based on experience, the provision is often set atone percent of the contract value, but can also bea higher or lower amount following a specificevaluation of the actual circumstances for each
Aker Solutions annual report <strong>2010</strong><strong>Annual</strong> accounts – group29contract. Both the general one percent provisionand the evaluation of project specific circumstancesare based on experience from earlier projects.Factors that could affect the estimated warrantycost include the group’s quality initiatives andproject execution model. Reference is made tonote 20 Provisions for further information aboutprovisions for warranty expenditures on deliveredprojects.Property, plant and equipment and intangibleassetsAt every balance sheet date, the group considerswhether there are indications of impairment on thebook values of long-term assets. If such indicationsexist, a valuation is performed to assesswhether or not the asset should be written downfor impairment. Such valuations will often have tobe based on estimates of future results for a numberof cash flow generating units. References aremade to note 22 Property, plant and equipmentand note 23 Intangible assets.GoodwillIn accordance with the stated accounting policy,the group tests annually whether goodwill has sufferedany impairment or more frequently if impairmentindicators are identified. The recoverableamounts of cash-generating units have been determinedbased on value-in-use calculations. Thesecalculations require the use of estimates and areconsistent with the market valuation of the group.Further details about goodwill and impairmentreviews are included in note 23 Intangible assets.Income taxesThe group is subject to income taxes in numerousjurisdictions. Significant judgement is required todetermine the worldwide provision for incometaxes. There are many transactions and calculationsfor which the ultimate tax determination isuncertain during the ordinary course of business.Provisions for anticipated tax audit issues arebased on estimates of eventual additional taxes.Income tax expense is calculated based onreported income in the different legal entities.Deferred income tax expense is calculated basedon the differences between the assets’ carryingvalue for financial reporting purposes and theirrespective tax basis that are considered temporaryin nature. The total amount of income tax expenseand allocation between current and deferredincome tax requires management’s interpretationof complex tax laws and regulations in the manytax jurisdictions where Aker Solutions operates.Valuation of deferred tax assets is dependent onmanagement’s assessment of future recoverabilityof the deferred benefit. Expected recoverabilitymay result from expected taxable income in thenear future, planned transactions or planned taxoptimising measures. Economic conditions maychange and lead to a different conclusion regardingrecoverability, and such change may affect theresults for each reporting period. Tax authorities indifferent jurisdictions may challenge calculation oftaxes payable from prior periods. Such processesmay lead to changes to prior periods’ taxableincome, resulting in changes to income taxexpense in the period of change. During the periodwhen tax authorities may challenge the taxableincome, management is required to make estimatesof the probability and size of possible taxadjustments. Such estimates may change as additionalinformation becomes known. Further detailsabout income taxes are included in note 14 Incometax.Fair value measurement of contingent anddeferred considerationContingent and deferred consideration, resultingfrom business combinations, is valued at fair valueat the acquisition date as part of the businesscombination. Where the deferred and contingentconsideration meets the definition of a derivativeand, thus, a financial liability, it is subsequentlyremeasured to fair value at each reporting date.The determination of the fair value is based ondiscounted cash flows. The key assumptions takeinto consideration the probability of meeting eachperformance target and the discount factor.Pension benefitsThe present value of the pension obligationsdepends on a number of factors determined on thebasis of actuarial assumptions. These assumptionsinclude financial factors such as the discount rate,expected salary growth, inflation and return onassets as well as demographical factors concerningmortality, employee turnover, disability andearly retirement. Assumptions about all these factorsare based on the situation at the time theassessment is made. However, it is reasonablycertain that such factors will change over the verylong periods for which pension calculations aremade. Any changes in these assumptions willaffect the calculated pension obligations. Theeffect on the accounts of such changes is, however,spread over relatively long time periods by theuse of the corridor approach, where changes areamortised over many years. Further informationabout the pension obligations and the assumptionsused are included in note 30 Employee benefits- pension.Note 5Financial risk management andexposuresFinancial risksThe group is exposed to a variety of financial risks:currency risk, interest rate risk, price risk, creditrisk, liquidity risk and capital risk. The market risksaffects the group’s income or the value of financialinstruments held. The objective of financial riskmanagement is to manage and control financialrisk exposures and thereby increase the predictabilityand minimise potential adverse effects on thegroup’s financial performance. The Aker Solutionsgroup uses derivative financial instruments tohedge certain risk exposures and seeks to applyhedge accounting in order to reduce the volatility inthe income statement.Risk management is present in every project and isthe responsibility of the project managers in cooperationwith the central treasury department (CorporateTreasury) to identify, evaluate and hedgefinancial risks under policies approved by theBoard of Directors. The group has well-establishedprinciples for overall risk management, as well aspolicies for the use of derivatives and financialinvestments. There have been no changes in thesepolicies during the year. All figures below includediscontinued operations.Currency riskThe group operates internationally and is exposedto currency risk on commercial transactions, recognisedassets and liabilities and net investmentsin foreign operations. Commercial transactions andrecognised assets and liabilities are subject to currencyrisk when payments are denominated in acurrency other than the respective functional currencyof the group company. The group’s exposureto currency risk is primarily to USD, EUR and GBPbut is also exposed to several other currencies ona smaller scale.The Aker Solutions policy requires group companiesto hedge their entire currency risk exposure inany project using forward contracts and currencyoptions. The group’s Treasury department managesinternal exposures by entering into forwardcontracts or currency options with the financialmarket place. The Aker Solutions group has a largenumber of contracts involving foreign currencyexposures and the currency risk policy has beenwell-established for many years.For segment reporting purposes, each businessunit designates all currency hedge contracts withCorporate Treasury as cash flow hedges. Externalforeign exchange contracts are designated at thegroup level as hedges of currency risk on a grossbasis, and more than 80 percent of these hedgesare done back-to-back and either they qualify forhedge accounting or they are embedded derivatives.When hedges do not qualify for hedgeaccounting in the external reporting, a correction isperformed at group level and is included in the“unallocated” part of the segment reporting. Seenote 21 Derivative financial instruments for informationregarding the accounting treatment ofhedging and embedded derivatives.Currency exposure from foreign currency investmentsare hedged when this has been specificallydecided by management. During <strong>2010</strong> the grouphad one hedge of net investment in US entities ofUSD 310 million (terminated in November) and asper December <strong>2010</strong> the group has one hedge ofnet investments in an EUR entity of EUR 29 million.The principal and interest amounts of the group’snon-current borrowings are denominated in currenciesthat match the cash flows generated by thegroup companies holding the loans, primarily NOK,but also GBP and USD. This provides an economichedge without entering into any derivatives.
30 Aker Solutions annual report <strong>2010</strong><strong>Annual</strong> accounts – groupThe group’s exposure to the main foreign currencies<strong>2010</strong> <strong>2009</strong>Amounts in million USD EUR GBP USD EUR GBPBank (264) (84) (41) (376) (52) (57)Intercompany loans 218 (13) 32 197 43 36Balance sheet exposure (46) (97) (9) (179) (9) (21)Estimated forecast receipts from customers 2 545 162 86 1 932 113 98Estimated forecast payments to vendors (369) (312) (163) (539) (266) (202)Cash flow exposure 2 176 (150) (77) 1 393 (153) (104)Forward exchange contracts (2 129) 243 85 (1 212) 154 124Net exposure 1 (4) (1) 2 (8) (1)Estimated forecasted receipts and payments in the table above are calculated based on the group’shedge transactions through the Corporate Treasury department. These are considered to be the bestestimate of the currency exposure given that all currency exposure is hedged, in accordance with thegroup’s policy. The net exposure is managed by the Corporate Treasury department that is allowed tohold positions within an approved trading mandate. This mandate is closely monitored and reported ona daily basis to the management.A foreign currency sensitivity analysis indicates that changes in the foreign currency rates have onlyminor effects on equity and profit and loss. A 10 percent weakening of the NOK against the currencieslisted below at 31 December would have increased (decreased) equity and profit and loss by theamounts shown. The selected rate of 10 percent reflects the recent years’ changes in currency rates.Changes in currency rates change the values of hedging derivatives. Hedges that qualify for hedgeaccountingare reported in the profit and loss according to the progress of projects. The deferred valueof the hedging derivative is reported as equity reserve. Any changes to currency rates will thereforeaffect equity.The value of hedging instruments that do not qualify for hedge-accounting can not be deferred fromprofit and loss. Changes in profit and loss are based on changes in fair values of the hedges that do notqualify for hedge-accounting and any ineffectiveness in hedges that are hedge-accounted. The analysisincludes only project-related items and assumes that all other variables, in particular interest rates,remain constant. Calculations are based on amounts and foreign currency exchange rates as of 31December. The analysis is performed on the same basis for <strong>2009</strong>.<strong>2010</strong> <strong>2009</strong>Amounts in NOK million Profit before tax Equity 1 Profit before tax Equity 1USD 1 (130) 2 (106)EUR 70 56 38 45GBP 71 - 133 11) The effects to equity that follow directly from the effects to profit and loss are not included.A 10 percent strengthening of the NOK against the above currencies at 31 December would have hadthe equal but opposite effect on the above amounts, on the basis that all other variables remain constant.The sensitivity analysis does not include effects on the consolidated result and equity fromchanged exchange rates used for consolidation of foreign subsidiaries.The primary currency-related risk is the risk of reduced competitiveness abroad in the case of astrengthened NOK. This risk relates to future commercial contracts and is not included in the sensitivityanalysis above.Translation exposureTranslation exposure occurs when foreign operations are translated for inclusion in the financial statementsof the Aker Solutions group.The group has several investments in foreign operations, whose net assets are exposed to foreign currencytranslation risk. Currency exposure arising from the net assets of the group’s foreign operations isnormally only hedged to the extent of agreed future payments.Significant exchange rates applied for group consolidationAverage rateClosing rateCurrency <strong>2010</strong> <strong>2009</strong> <strong>2010</strong> <strong>2009</strong>USD 6.074 6.306 5.851 5.778EUR 8.049 8.797 7.819 8.304BRL 3.443 3.145 3.526 3.321GBP 9.377 9.750 9.073 9.292Although hedge accounting is not applied to all foreign exchange contracts, these contracts are still“economically” hedged. The effect on profit and loss under financial items in the following table, willhave an opposite effect on future operating income or expense as progress on projects increases.Equity in the following table is the hedge reserve that follows from the cash flow hedges.
Aker Solutions annual report <strong>2010</strong><strong>Annual</strong> accounts – group31The next table illustrates Aker Solutions exposure to translation risk. If the Norwegian currency haddepreciated 10 percent during <strong>2010</strong>, the consolidated statement would be affected with the changes inthe table. The sensitivity analysis is only a translation sensitivity and does not reflect changes incompetetiveness, derivatives or other effects from currency fluctuations. The table includesdiscontinued operations.Amounts in NOK million 10% depreciation of NOK ChangeRevenue EBITDA Equity Revenue EBITDA Equity Revenue EBITDA EquityUSD 10 382 (316) 2 326 11 420 (348) 2 559 1 038 (32) 233EUR 2 130 356 1 626 2 343 392 1 789 213 36 163GBP 5 774 528 2 607 6 352 581 2 868 577 53 261BRL 1 632 28 152 1 795 31 167 163 3 15CAD 1 334 69 690 1 468 76 759 133 7 69NOK 25 514 3 010 1 422 25 514 3 010 1 422 - - -Other 4 001 624 1 341 4 401 686 1 475 400 62 134Total 50 767 4 300 10 165 53 292 4 429 11 040 2 525 129 874Interest rate riskThe group’s interest rate risk arises from non-current borrowings. Borrowings issued at variable ratesexpose the group to cash flow interest rate risk. Borrowings issued at fixed rates expose the group tofair value interest rate risk. However, as these borrowings are measured at amortised cost, interest ratevariations do not effect profit and loss. Group policy is to maintain approximately 30-50 percent of itsborrowings in fixed rate instruments using interest rate swaps to achieve this when necessary.As the group has no significant interest-bearing operating assets, operating income and operating cashflows are substantially independent of changes in market interest rates. At year end, 48 percent of NOK3 122 million in bonds was fixed for the duration of the bonds through interest rate swaps. In additionwe have entered into a NOK 1 300 million fixed rate swap as hedge for drawings on the RevolvingCredit Facilities and a NOK 375 million floating rate swap for a NOK 750 million term loan.An increase of 100 basis points in interest rates during <strong>2010</strong> would have increased (decreased) equityand profit and loss by the amounts shown in the table below. This analysis assumes that all other variables,in particular foreign currency rates, remain constant. The analysis is performed on the samebasis as for <strong>2009</strong>.<strong>2010</strong> <strong>2009</strong>Amounts in NOK millionProfitbefore tax Equity 1 Profitbefore tax Equity 1A decrease of 100 basis points in interest rates during <strong>2010</strong> would have had the equal but oppositeeffect on the above amounts, on the basis that all other variables remain constant.Price riskThe group is exposed to fluctuations in market prices both in the investment portfolio and in the operatingbusinesses related to individual contracts.The investment portfolio is limited and does not include shareholdings in listed companies.The businesses may be exposed to changes in market price for raw materials, equipment and developmentin wages. This is managed in the bid process by locking in committed prices from vendors asbasis for offers to customers or through escalation clauses with customers.Credit riskCredit risk is the risk of financial losses to the group if customer or counterparty to financial investments/instrumentsfails to meet its contractual obligations, and arises principally from investment securitiesand group receivables. Investment securities and derivatives are only traded against approvedbanks. All approved banks are participants in the Aker Solutions loan syndicate and have the highestrating at Moody’s and S&P. Credit risk related to investment securities and derivatives is therefore consideredto be insignificant.Assessment of credit risk related to customers and subcontractors is an important requirement in thebid phase and throughout the contract period. Such assessments are based on credit ratings, incomestatement and balance sheet reviews and using credit assessment tools available (e.g. Dun & Bradstreetand Credit Watch). Sales to customers are settled in cash.Based on estimates of incurred losses in respect of trade and other receivables, the group establishes aprovision for impairment. Provision for loss on debtors are based on individual assessments. Provisionsfor loss on receivables are low (NOK 115 million in <strong>2010</strong>, NOK 201 million in <strong>2009</strong>), and higher than thehistorical losses (NOK 5 million in <strong>2010</strong> and NOK 21 million in <strong>2009</strong>). Revenues are mainly related tolarge and long-term projects closely followed up in terms of payments up front and in accordance withagreed milestones. Normally, lack of payments are due to disagreements related to project deliveriesand are solved together with the client or escalated to the local authority, see note 34 Contingentevents. The customers are mainly large and highly reputable oil companies with a low credit risk, whichreduces the credit risk significantly. Based on the above the group’s credit risk is considered to beinsignificant.At the balance sheet date, there were no significant concentrations of credit risk. The maximum exposureto credit risk at the reporting date equals the book value of each category of financial assets, seecarrying amounts in note 33 Financial instruments. The group does not hold collateral as security.Aker Solutions ASA provides parent company guarantees to group companies. For further information,see note 11 Guarantees in the Aker Solutions ASA’s accounts.Cash and cash equivalents 24 - 29 -Interest rate swap 44 35 66 41Non-current interest-bearing receivables 2 - 1 -Current interest-bearing receivables 6 - 5 -Borrowings (55) - (70) -Cash flow sensitivity (net) 21 35 31 411) Not including tax effect on hedge reserve or effects to equity that follow directly from the effects to profit and loss.
32 Aker Solutions annual report <strong>2010</strong><strong>Annual</strong> accounts – groupLiquidity riskLiquidity risk is the risk that the group will encounter difficulty in meeting the obligations associated with its financial liabilities. The group’s approach to managing liquidity is to ensure, as far as possible, that it will alwayshave sufficient liquidity reserves to meet its liabilities when due.Prudent liquidity risk management includes maintaining sufficient cash, the availability of funding from an adequate amount of committed credit facilities and the ability to close out market positions. Due to the dynamicnature of the underlying businesses, Corporate Treasury maintains flexibility in funding by maintaining availability under committed credit lines, see note 28 Borrowings.Management monitors rolling weekly and monthly forecasts of the group’s liquidity reserve on the basis of expected cash flow. For information regarding capital expenditures and net operating assets, see note 9 Segmentinformation.Financial liabilities and the period in which they are mature<strong>2010</strong>Amounts in NOK million Note Book valueTotal undiscountedcash flow 1, 2 6 mths and less 6-12 mths 1-2 years 2-5 years More than 5 yearsBorrowings 28 (8 224) (9 767) (352) (762) (3 836) (4 804) (13)Other non-current liabilities 29 (753) (645) (16) (26) (210) (339) (54)Net derivative financial instruments 21 143 143 150 (28) 28 (7) -Trade and other payables 19 (16 278) (16 278) (16 262) - (16) - -Total (25 112) (26 547) (16 480) (816) (4 034) (5 150) (67)<strong>2009</strong>Amounts in NOK million Note Book valueTotal undiscountedcash flow 1, 2 6 mths and less 6-12 mths 1-2 years 2-5 years More than 5 yearsBorrowings 28 (7 515) (8 959) (277) (194) (1 077) (7 394) (17)Other non-current liabilities 29 (891) (1 031) (14) (24) (444) (407) (142)Net derivative financial instruments 21 27 (3) (18) 40 (9) (16) -Trade and other payables 19 (19 370) (19 370) (18 982) (63) (325) - -Total (27 749) (29 363) (19 291) (241) (1 855) (7 817) (159)1) Nominal currency value including interest.2) Cash from the sale of the Process & Construction operations was used to repay all of the EUR 750 million revolving credit as per February 2011. See note 37 Subsequent events for information about the sale.The group policy for the purpose of optimising availability and flexibility of cash within the group is to operate a centrally managed cash pooling arrangement. Such arrangements are either organised with a bank as aservice provider, or as a part of the operation of the internal treasury function. An important condition for the participants (business units) in such cash pooling arrangements is that the group as an owner of such pools isfinancially viable and is able to prove its capability to service its obligations concerning repayment of any net deposits made by business units.
Aker Solutions annual report <strong>2010</strong><strong>Annual</strong> accounts – group33Capital managementThe group’s objective for managing capital is to safeguard the group’s ability to continue as a goingconcern in order to provide returns for shareholders and benefits for other stakeholders while maintainingan optimal capital structure to reduce the cost of capital.In order to maintain or adjust the capital structure, the group may adjust the amount of dividends paidto shareholders, return capital to shareholders, issue new shares or sell assets to reduce debt. Fromtime to time, the group purchases its own shares in the market; the timing of these purchases isdependent on market prices.There were no changes in the group’s approach to capital management during the year.In the first quarter of <strong>2007</strong> Aker Solutions announced a buy-back of treasury shares, and in connectionwith the <strong>Annual</strong> General Meeting it was decided to cancel parts of the treasury shares. There were additionalshare buy-backs in <strong>2008</strong>, <strong>2009</strong> and <strong>2010</strong> and sales related to the share purchase programme foremployees. At year end, the group holds 1.68 percent of outstanding shares. The consolidated statementof changes to equity provides further details.The group monitors capital on the basis of a gearing ratio (gross debt/EBITDA) and interest coverageratio (EBITDA/net finance cost). The ratios are calculated from gross debt, including all interest-bearingliabilities as shown in note 33 Financial instruments, EBITDA (earnings before interest, tax, depreciationand amortisation) and finance cost. The reported ratios are well within the requirements in the loanagreements.Guarantee obligationsThe group has provided the following guarantees on behalf of wholly owned subsidiaries as of 31December <strong>2010</strong> (all obligations are per date of issue):■■Parent company guarantees to group companies: NOK 80.7 billion (NOK 37.3 billion in <strong>2009</strong>)■■Indemnity guarantees for fulfilment of lease obligations: NOK 260 million (same as in <strong>2009</strong>)■■Counter guarantees for bank/surety bonds: NOK 7.1 billion (NOK 7.3 billion in <strong>2009</strong>)For guarantee obligations on behalf of the jointly controlled entity Aker DOF Deepwater AS see note 25Investments in associated companies and jointly controlled entities.Gearing and interest coverage ratiosAmounts in NOK million <strong>2010</strong> <strong>2009</strong>Gearing ratioGross debt 8 224 7 515EBITDA 4 300 4 368Gross debt/EBITDA 1 1.9 1.7Interest coverageEBITDA 4 300 4 368Net finance cost 453 470EBITDA/Net finance cost 9.5 9.31) Gearing ratio adjusted for restructuring costs is 1.9 in <strong>2010</strong> (1.6 in <strong>2009</strong>).Note 6Business combinations and acquisition of non-controlling interestsBusiness combinations in <strong>2010</strong>DerrickIn May <strong>2010</strong>, Aker Solutions entered into an asset purchase agreement with Derrick GmbH & Co. KGfor the purchase of a small workshop, including six employees. The acquired business refines andmodifies Derrick products to meet European standards, maintains its rental pool and provides services.The acquired business has been set up as a German branch of Step Offshore AS. The purchase pricewas NOK 28 million.Acquisition of non-controlling interest in <strong>2010</strong>First Interactive ASIn February <strong>2008</strong>, Aker Solutions acquired 60.2 percent of the shares in the company First InteractiveAS. The company is a provider of an IT simulation system that enables the oil companies to simulateinstallations and operations. In August <strong>2010</strong>, Aker Solutions acquired the remaining 39.8 percent of theshares and voting interests in First Interactive AS to increase the group’s operational control.NOK 14 million cash was paid to the selling shareholders at the acquisition date. An additional considerationwill be due in 2015. The final consideration will be based on the accumulated EBITDA for 2011to 2014 and is estimated to NOK 8 million, which represents the fair value at the acquisition date. Thetransaction resulted in a reduction of non-controlling interests of NOK 13 million.Note 7Disposal groups and discontinued operationsAker Marine Contractors - Held for saleOn 22 October <strong>2010</strong>, Aker Solutions entered into an agreement to sell its subsidiary Aker MarineContractors (AMC) to Singapore based Ezra Holdings Ltd (Ezra). In addition, 50 percent of AkerSolutions’ ownership in the Aker Connector installation vessel, which will be completed in early 2012,will be transferred to Ezra upon delivery of the vessel. The transaction was completed on 1 March 2011,see note 37 Subsequent events.As of 31 December <strong>2010</strong>, AMC is classified as disposal group held for sale, including allocated goodwillof NOK 270 million. AMC, which is part of Subsea business area, is not considered a separate majorline of business so it has not been accounted for as discontinued operations. Aker Connector installationvessel under construction is not classified as held for sale, as it does not meet the held for salecriteria since it is not ready for sale in its current condition.Process & Construction businesses - Discontinued operationsOn 22 December <strong>2010</strong>, Aker Solutions entered into a share purchase agreement whereby it has agreedto transfer principal operations within its Process and Construction business area to JacobsEngineering Group Inc., one of the world’s largest and most diverse providers of professional technicalservices. The transfer does not include the US EPC centre in Houston, nor the Union Constructionbusinesses located in the US and Canada. The transaction was completed on 1 February 2011, seenote 37 Subsequent events.As of 31 December <strong>2010</strong>, the P&C businesses that will be sold to Jacobs are classified as a disposalgroup held for sale, including allocated goodwill of NOK 1 020 million, and accounted for asdiscontinued operations.
34 Aker Solutions annual report <strong>2010</strong><strong>Annual</strong> accounts – groupDiscontinued operationsIncome statementAmounts in NOK million <strong>2010</strong> <strong>2009</strong>Disposal groups classified as held for sale as of 31 December <strong>2010</strong>Assets and liabilitiesAmounts in NOK million AMC P&C businesses TotalRevenue 4 500 4 221Operating expenses (3 995) (3 962)Financial items (24) (20)Profit before tax 481 239Tax (129) (94)Net profit from discontinued operations 1 352 1451) Net profit is all attributable to equity holders of Aker Solutions.Earnings per shareAmounts in NOK <strong>2010</strong> <strong>2009</strong>Basic earnings per share (NOK) from discontinued operations 1.31 0.54Diluted earnings per share (NOK) from discontinued operations 1.30 0.54Cash flowAmounts in NOK million <strong>2010</strong> <strong>2009</strong>Intangibles 270 1 020 1 290Deferred tax assets 22 46 68Properties, plant and equipment 148 156 304Other non-current assets 1 58 59Total current assets 550 865 1 415Assets held for sale 991 2 145 3 136Non-current liabilities 12 109 121Current liabilities 300 1 118 1 418Liabilities held for sale 312 1 227 1 539Other comprehensive incomeTranslation differences 13 (132) (119)The disposal groups held for sale also had receivables and liabilities to other Aker Solutions entities.These assets and liabilities have been eliminated in the group’s consolidated financial statements.Operating cash flow 331 67Investing cash flow (6) (51)Financing cash flow (255) (174)Net cash inflow (outflow) 70 (158)
36 Aker Solutions annual report <strong>2010</strong><strong>Annual</strong> accounts – groupThe Resource Group TRG ASOn the 24 November Aker Solutions AS sold its 50 percent shareholding in Aker Encore AS to TheResource Group TRG AS for a total cash consideration of NOK 17 million.Industrial transactions in <strong>2009</strong>On 1 April <strong>2009</strong>, Aker Solutions acquired several shareholdings from companies in the Aker group inorder to further strengthen its position in the offshore and energy sectors. The acquisitions establishbroader foundation for continued industrial development at the interface between energy, the environmentand maritime activities in industries with solid long-term growth potential. The transactions carriedout resulted in Aker Solutions AS acquiring or increasing its ownership interest in the following businesses:Aker Oilfield Services ASAker Solutions increased the ownership in Aker Oilfield Services from 32.3 to 100 percent. 46 percent ofthe shares were acquired from Aker Capital AS for a consideration of NOK 595 million.Midsund Bruk ASAker Solutions acquired 100 percent of the shares in Midsund Bruk from Aker Capital AS for a the totalconsideration of NOK 88 million.Aker DOF Deepwater ASAker Solutions acquired 50 percent of the shares in Aker DOF Deepwater from Aker Capital AS for NOK190 million. The remaining 50 percent is owned by DOF. The investment is accounted for as a jointlycontrolled entity.ODIM ASAAker Solutions acquired 33 percent of the shares in ODIM from Aker ASA (10.8 percent) and Aker InvestII KS (22.2 percent). The total consideration amounted to NOK 513 million. The shares were subsequentlysold in June <strong>2009</strong>.Aker Clean Carbon ASAker Solutions’ shareholding in Aker Clean Carbon was increased from 30 to 50 percent through anequity issue of NOK 43 million. The investment is accounted for as a jointly controlled entity.Note 9Operating segmentsAker Solutions has in <strong>2010</strong> had four reportable segments which are the strategic business units of thegroup. The strategic business units offer different products and services, and are managed separatelybecause they operate in different market segments and have different strategies for their projects, productsand services. The group’s CEO reviews each of the operating segments with the segment managementon a monthly basis. The review is based on monthly reporting from the subsidiaries in the operatingsegments.The following summary describes the operations in each of Aker Solutions’ reportable segments:Energy Development & ServicesEnergy Development & Services (ED&S) develops new oil and gas production facilities offshore and onland, as well as life cycle services for the operational phase of such installations. The business areadelivers the full value chain from studies, front-end design and detailed engineering, through procurement,project management, fabrication and hook-up, to installation, maintenance and modifications.SubseaSubsea is a global provider across the value chain of subsea and sub-surface technologies, solutionsand services. Subsea offerings cover all phases of the life of fields, from concept screening and designthrough manufacturing, installation and commissioning to operational support and maintenance services.Subsea’s ability as a provider of subsea production systems is backed by an extensive portfolioof additional capabilities such as well services, marine operations and geological services.Products & TechnologiesProducts & Technologies (P&T) is a leading global provider of specialised products and services to theupstream oil and gas industry, based on proprietary technology and know-how. Key deliverablesinclude advanced drilling equipment, systems and risers, upstream processing technology and mooringsystems, as well as loading and offloading technology.Process & ConstructionProcess & Construction (P&C) is a global provider of onshore engineering and construction services tothe natural resources and energy markets. P&C supplies niche process expertise with high-technologycontent and know-how for projects across chemicals, polymers, syngas and refining, mining and metals,onshore liquefied natural gas (LNG) receiving terminals, power generation, biofuels, carbon capture,acid plants, nuclear plants, and water treatment.In December <strong>2010</strong>, Aker Solutions entered into a share purchase agreement whereby it has agreed totransfer principal operations within its Process and Construction business area to Jacobs EngineeringGroup Inc. The transfer does not include the US EPC centre in Houston, nor the Union Constructionbusinesses located in the US and Canada. As of 31 December <strong>2010</strong>, businesses to be sold are classifiedas disposal group held for sale and discontinued operations, see note 7 Disposal groups and discontinuedoperations.Following the sale of P&C businesses and restructuring of the oil and gas business, a new reportingstructure will be implemented with effect from March 2011. <strong>Report</strong>ing of operating segments in <strong>2010</strong>follows the <strong>2010</strong> business area structure because the financial information has not yet been organisedto reflect the new structure and is currenctly not being reviewed by the chief operating decisionmaker.Measurement of segment performancePerformance is measured by segment operating profit before depreciation, amortisation and impairment(EBITDA) and operating profit (EBIT), as included in the internal management reports that arereviewed by the group’s CEO. Segment profit, together with key financial information as describedbelow, gives the CEO relevant information in evaluating the results of the operating segments and isrelevant in evaluating the results of the segments relative to other entities operating within these industries.Inter-segment pricing is determined on an arm’s length basis.There are varying levels of integration between ED&S, Subsea and P&T, which all deliver products andservices to customers within the oil and gas industry globally and where the group’s expertise andproducts can be exploited in interaction with each other. P&C has also used the group’s processes andexpertise when delivering their products and services to the process, metal and energy-sectors. Theaccounting policies of the reportable segments are the same as described in note 2 Basis of preparationand note 3 Accounting principles, except for hedge accounting. When contract revenues and contractcosts are denominated in a foreign currency, the subsidiary hedges the exposure against CorporateTreasury and hedge accounting is applied independently of whether the hedge qualify for hedgeaccounting in accordance with IFRS. The correction of the non-qualifying hedges to secure that theconsolidated financial statement is in accordance with IFRS is made as an adjustment at corporatelevel. This means that the group’s segment reporting reflect all hedges as qualifying even though theymay not qualify in accordance with IFRS.
Aker Solutions annual report <strong>2010</strong><strong>Annual</strong> accounts – group37<strong>2010</strong> - Operating segmentsAmounts in NOK million Note ED&S Subsea P&T P&CTotal operatingsegments Other Elim.DiscontinuedoperationsTotalExternal revenue and other incomeConstruction contracts 14 346 7 031 6 783 6 608 34 768 - - (3 419) 31 349Services revenue 5 443 4 247 2 163 1 929 13 782 111 - (950) 12 943Products - 376 1 014 44 1 434 - - (44) 1 390Other 575 97 (2) - 670 2 - - 672Total external revenue and other income 20 364 11 751 9 958 8 581 50 654 113 - (4 413) 46 354Inter-segment revenue 512 93 248 122 975 2 942 (3 917) (87) (87)Total operating revenue and other income 20 876 11 844 10 206 8 703 51 629 3 055 (3 917) (4 500) 46 267EBITDA 2 040 1 170 859 213 4 282 18 - (522) 3 778Depreciation, amortisation and impairment 22, 23 (134) (517) (129) (30) (810) (78) - 17 (871)EBIT 1 906 653 730 183 3 472 (60) - (505) 2 907Order intake (unaudited) 21 688 14 827 7 855 8 298 52 668 2 994 (3 785) (5 536) 46 341Order backlog (unaudited) 26 265 15 356 7 360 6 594 55 575 - (153) (4 647) 50 775Own employees (unaudited) 35 9 297 5 779 3 034 2 951 21 061 909 - (2 526) 19 444Note ED&S Subsea P&T P&CTotal operatingsegments Other Elim.Disposal groupsheld for saleTotalAssetsCurrent operating assets 4 565 5 539 4 806 3 536 18 446 445 (565) (1 384) 16 942Non-current operating assets 3 408 8 794 1 845 1 369 15 416 830 - (1 653) 14 593Operating assets 7 973 14 333 6 651 4 905 33 862 1 275 (565) (3 037) 31 535Tax-related assets 725Investment in associates 424Investments in other companies 157Cash and interest-bearing receivables 4 044Assets held for sale 3 136Total assets 40 021LiabilitiesCurrent operating liabilities (6 300) (4 981) (3 979) (3 530) (18 790) (737) 565 1 402 (17 560)Non-current operating liabilities (314) (95) (132) (57) (598) (118) - 69 (647)Operating liabilities (6 614) (5 076) (4 111) (3 587) (19 388) (855) 565 1 471 (18 207)Tax-related liabilities (944)Net interest-bearing borrowings (8 224)Other liabilities (753)Liabilities held for sale (1 539)Total liabilities (29 667)Net current operating assets 15 (1 735) 558 827 6 (344) (292) - 18 (618)Net capital employed 15 1 851 10 385 2 817 2 230 17 283 1 977 - (2 089) 17 171Cash flowCash flow from operating activities 2 723 32 793 (1 290) 2 258 (127) - 2 131Acquisition of property, plant and equipment 22 (48) (1 659) (205) (24) (1 936) (531) - (2 467)
38 Aker Solutions annual report <strong>2010</strong><strong>Annual</strong> accounts – group<strong>2009</strong> - Operating segmentsAmounts in NOK million Note ED&S Subsea P&T P&CTotal operatingsegments Other Elim.DiscontinuedoperationsTotalExternal revenue and other incomeConstruction contracts 10 702 8 126 8 874 7 579 35 281 (67) - (2 712) 32 502Services revenue 7 330 4 226 2 110 1 861 15 527 186 - (1 312) 14 401Products - 329 1 097 32 1 458 - - (32) 1 426Other 1 275 159 202 1 1 637 55 - (1) 1 691Total external revenue and other income 19 307 12 840 12 283 9 473 53 903 174 - (4 057) 50 020Inter-segment revenue 520 132 446 61 1 159 3 215 (4 374) (164) (164)Total operating revenue and other income 19 827 12 972 12 729 9 534 55 062 3 389 (4 374) (4 221) 49 856EBITDA 1 116 1 399 1 304 484 4 303 65 - (273) 4 095Depreciation, amortisation and impairment 22, 23 (176) (450) (171) (23) (820) (90) - 13 (897)EBIT 940 949 1 133 461 3 483 (25) - (260) 3 198Order intake (unaudited) 26 887 12 568 6 621 6 913 52 989 3 437 (4 426) (2 952) 49 048Order backlog (unaudited) 25 396 12 395 9 632 9 037 56 460 15 (199) (3 536) 52 740Own employees (unaudited) 35 9 535 5 276 3 027 3 343 21 181 952 - (2 718) 19 415Note ED&S Subsea P&T P&CTotal operatingsegments Other Elim. TotalAssetsCurrent operating assets 5 685 6 845 5 497 2 925 20 952 (179) (652) 20 121Non-current operating assets 3 554 7 577 1 764 1 357 14 252 699 - 14 951Operating assets 9 239 14 422 7 261 4 282 35 204 520 (652) 35 072Tax-related assets 486Investment in associates 423Investments in other companies 135Cash and interest-bearing receivables 3 810Total assets 39 926LiabilitiesCurrent operating liabilities (5 927) (6 594) (4 471) (4 014) (21 006) (230) 652 (20 584)Non-current operating liabilities (511) (89) (129) (51) (780) (130) - (910)Operating liabilities (6 438) (6 683) (4 600) (4 065) (21 786) (360) 652 (21 494)Tax-related liabilities (903)Net interest-bearing borrowings (7 515)Other liabilities (891)Total liabilities (30 803)Net current operating assets 15 (242) 251 1 026 (1 089) (54) (409) - (463)Net capital employed 15 3 081 8 457 2 838 1 213 15 589 1 258 - 16 847Material non cash itemsOther income (gain from business combinations) 1 - 159 170 - 329 - - 329Cash flowCash flow from operating activities 1 670 1 698 55 (131) 3 292 953 - 4 245Acquisition of property, plant and equipment 22 141 1 851 127 40 2 159 42 - 2 2011) Gain on remeasurement of previously held interests in Wirth GMBH and Aker Oilfield Services AS
Aker Solutions annual report <strong>2010</strong><strong>Annual</strong> accounts – group39Major customersRevenue from one customer of the segments ED&S and Subsea represents approximately NOK 10.2billion (NOK 10.2 billion in <strong>2009</strong>) of the group’s total revenue.Geographical informationGeographical segment revenue is presented on the geographical location of customers. Non-currentsegment assets and capital expenditures are based on the geographical location of the assets.OperatingrevenuesNon-currentsegment assetsCapitalexpenditureAmounts in NOK million <strong>2010</strong> <strong>2009</strong> <strong>2010</strong> <strong>2009</strong> <strong>2010</strong> <strong>2009</strong>Norway 17 099 20 586 10 935 9 985 1 869 1 536Europe 6 103 7 658 3 032 3 220 249 273North America 6 954 7 181 125 1 166 165 115Asia 11 308 11 168 771 825 70 184Other 4 803 3 263 441 330 114 93Total 46 267 49 856 15 304 15 526 2 467 2 201Note 10 Salaries, wages and social security costsAmounts in NOK million Note <strong>2010</strong> <strong>2009</strong>Salaries and wages including holiday allowance 10 474 10 169Social security tax/National insurance contribution 1 388 1 323Pension cost 30 352 648Other employee costs 392 371Salaries, wages and social security costs 12 606 12 511Loans to employees are shown in note 24 Interest-bearing receivables. No guarantees are granted toany employee.Share purchase programme for employeesApproximately 3 500 employees participate in a share purchase programme where each employeepurchases Aker Solutions shares for NOK 1 250 per month at market price. The employee pays NOK1 125, while the company contributes the remaining NOK 125. Employees who are still employed bythe company in September 2012 will receive one bonus share for every two shares bought under theprogramme and retained at that time. At the end of <strong>2010</strong> a total of 522 041 shares had been boughtunder programme 2 for a total of NOK 45.875 million. This can potentially give rise to 261 021 bonusshares in September 2012. Programme 2 was started in March <strong>2010</strong> and will end in February 2011. Forprogramme 1 started in March <strong>2009</strong> and ended February <strong>2010</strong>, a total of 1 016 738 shares were boughtand can potentially give rise to 508 369 bonus shares in September 2011. During <strong>2010</strong>, a total of 650301 shares (888 478 shares in <strong>2009</strong>) have been bought under the programmes. Invitations have beenissued for a new programme 3 for the period from March 2011 to February 2012 with bonus shares tobe issued in September 2013. The company’s contribution to the purchase of the shares as well as thevalue of the bonus shares are expensed as salary expenses.Directors and nomination committee’s annual feesThe board fees for <strong>2010</strong> were NOK 5 150 000, including NOK 400 000 transferred to the labour unioncovering occupational activities in the group. The board fee for Øyvind Eriksen includes fee for his roleas Executive Chairman after Simen Lieungh stepped down from his position as President & CEO inJune <strong>2010</strong>. Fees to the reward committee were NOK 75 000 (corresponding to <strong>2009</strong>). No fees werepaid to the audit committee in <strong>2010</strong>. The Board of Directors did not receive any other payments in <strong>2010</strong>or <strong>2009</strong>. The members of the Board of Directors have no agreements that entitle them to any extraordinaryremuneration.Fees paid to the nomination committee in <strong>2010</strong> for the previous year amounted to NOK 120 000, NOK30 000 per member (NOK 90 000 in <strong>2009</strong>).
40 Aker Solutions annual report <strong>2010</strong><strong>Annual</strong> accounts – groupBoard of directors 1<strong>2010</strong>Amounts in NOKBoardmeetingattendanceExtraordinaryboard meetingattendanceRewardcommitteeBoard feesØyvind Eriksen 2 13 of 13 4 of 4 25 000 2 900 000Lone Fønss Schrøder 13 of 13 4 of 4 250 000Ida Helliesen 13 of 13 4 of 4 250 000Vibeke Hammer Madsen 12 of 13 4 of 4 25 000 250 000Mikael Lilius 11 of 13 3 of 4 250 000Kjell Inge Røkke 2 10 of 13 3 of 4 25 000 250 000Atle Teigland 3 13 of 13 4 of 4 150 000Åsmund Knutsen 3 12 of 13 3 of 4 150 000Arild Håvik 3 12 of 13 4 of 4 150 000Arve Toft 3 11 of 13 4 of 4 150 000<strong>2009</strong>Amounts in NOKBoardmeetingattendanceExtraordinaryboard meetingattendanceRewardcommitteeBoard feesØyvind Eriksen 2, 4 7 of 7 10 of 10 300 000Martinus Brandal 2, 4 2 of 2 2 of 2 100 000Bjørn Flatgård 4 2 of 2 2 of 2 25 000 125 000Lone Fønss Schrøder 4 6 of 7 9 of 10 125 000Heidi M Petersen 4 1 of 2 2 of 2 62 500Ida Helliesen 4 6 of 6 7 of 7 145 833Vibeke Hammer Madsen 9 of 9 11 of 12 25 000 250 000Leif-Arne Langøy 2, 4 2 of 2 1 of 2 25 000 104 167Mikael Lilius 4 5 of 6 6 of 7 145 833Siri Fürst 4 2 of 2 1 of 2 62 500Kjell Inge Røkke 2, 4 6 of 7 9 of 10 187 500Atle Teigland 3 9 of 9 12 of 12 150 000Åsmund Knutsen 3 9 of 9 12 of 12 150 000Ingebrigt Forus 3, 4 2 of 2 2 of 2 37 500Arild Håvik 3, 4 6 of 7 9 of 10 112 500Arve Toft 3 9 of 9 12 of 12 150 0001) Members of the Board of Directors are elected for two years at the general meeting.2) According to policy in Aker, fees to directors employed in Aker companies will be paid to the Aker companies, not to thedirectors in person. The same policy is implemented for fees for the reward committee. Therefore, board fees and rewardcomittee fees for Øyvind Eriksen were paid to Aker ASA. Board fees and reward comittee fees for Kjell Inge Røkke were paid toThe Resource Group. The board fee for Øyvind Eriksen includes fee for his role as Executive Chairman after Simen Lieunghstepped down from his position as President & CEO in June <strong>2010</strong>. The board fee will be approved by the <strong>Annual</strong> GeneralMeeting on 6 May 2011.3) According to agreement with and initiative from the employees, NOK 100 000 (NOK 100 000 in <strong>2009</strong>) is transferred to the labourunion covering occupational activities in the group, for each board member elected from the employees.4) As of April <strong>2009</strong>, Øyvind Eriksen replaced Martinus Brandal as Chairman of the Board. As of April <strong>2009</strong> Heidi M Petersen, BjørnFlatgård, Siri Fürst and Ingebrigt Forus resigned as Directors of the Board. As of the same date Kjell Inge Røkke, Lone FønnsSchrøder and Arild Håvik entered as Directors of the Board. As of June <strong>2009</strong>, Leif-Arne Langøy resigned as Director of theBoard. As of the same date, Ida Helliesen and Mikael Lilius entered as Directors of the Board.The audit committeeAker Solutions has an audit committee comprising three of the directors, which held eight meetings in<strong>2010</strong>. Until 15 June <strong>2010</strong>, the audit committee comprised Ida Helliesen (Chairperson), Øyvind Eriksenand Atle Teigland. As of 15 June <strong>2010</strong>, the audit committee comprises Ida Helliesen (Chairperson), LoneFønns Schrøder and Atle Teigland.The nomination committeeThe Aker Solutions ASA nomination committee comprised the following individuals as of 31 December<strong>2010</strong>: Leif-Arne Langøy (Chairman), Gerhard Heiberg, Kjeld Rimberg and Mette Wikborg.The reward committeeThe reward committee has three members elected by and among the Board of Directors. As of 31December <strong>2010</strong> the members of the reward committee are Øyvind Eriksen (Chairman), Vibeke HammerMadsen and Kjell Inge Røkke.The reward committee ensures that the company’s reward policy serves the interest of the shareholdersand that the company has internally consistent and externally competitive remuneration of executives.Guidelines for remuneration to the President & CEO and the members of the executivemanagement teamThe main purpose of the executive reward programme is to encourage a strong and sustainable performance-basedculture, which supports growth in shareholder value. The total remuneration to executivesconsists of a market based salary, a few standard employee benefits and a variable pay programme.The President & CEO and the executive management team participate in the standard pension andinsurance schemes applicable to all employees. The company practice standard employment contractsand standard terms and conditions regarding notice period and severance pay for the President & CEOand the members of the executive management team. The company does not offer share option programmesto any managers or employees.The objective of the variable pay programme is to contribute to the company achieving good financialresults and management according to the company’s values and business ethics.The variable pay programme is based on the achievement of financial and personal performance targets,leadership performance in accordance with the company’s values and the development of thecompany’s share price compared to the development of the general stock index at Oslo stockexchange. The programme represents a potential for an additional variable pay up to the value of 94.5percent of base salary. Earnings are paid over three years. The first half of the variable pay is paid thefollowing year. The remaining amount is paid two years later with the addition of a retention elementprovided the executive is still employed by the company. The maximum payment in any calendar yearis one annual base salary. The actual reward for the executive management team for <strong>2010</strong> was accordingto the guidelines of the company. The variable pay in <strong>2010</strong> relates to amounts earned in <strong>2009</strong> and<strong>2007</strong>. In addition to the ordinary variable pay programme, a discretionary variable pay was introducedto the executive management team in <strong>2010</strong> with payment in February 2011. The accrued amount forthe discretionary variable pay is NOK 9.4 million as of 31 December <strong>2010</strong>.
Aker Solutions annual report <strong>2010</strong><strong>Annual</strong> accounts – group41Remuneration to members of the executive management teamTotal taxable remuneration of the executive management team for <strong>2010</strong> was NOK 36.1 million (NOK 25.9 million in <strong>2009</strong>). In addition, Aker Solutions also incurred NOK 792 518 in <strong>2010</strong> (NOK 780 572 in <strong>2009</strong>) in pensioncosts for the executive management team.<strong>2010</strong>Amounts in NOK Base salary 1 Variable pay 2 Other benefits 3 Total taxable remunerationPension benefit earned/cost to company 4Simen Lieungh 5,6 1 January - 16 June 2 470 596 2 938 675 8 157 5 417 428 93 004Leif Hejø Borge 1 January - 31 December 3 304 174 464 813 23 846 3 792 833 60 565Niels Didrich Buch 1 January - 31 December 2 048 676 753 831 23 845 2 826 352 108 691Geir Arne Drangeid 1 March - 31 December 1 484 359 - 4 404 1 488 763 49 544Mads Andersen 1 January - 31 December 2 641 946 1 892 018 23 730 4 557 694 101 856Karl Erik Kjelstad 1 January - 31 December 2 969 123 1 307 048 5 285 4 281 456 59 608Per Harald Kongelf 1 January - 31 December 2 329 490 1 765 141 24 308 4 118 939 109 714Gary Mandel 1 January - 31 December 3 284 003 1 645 224 - 4 929 227 62 926Jarle Tautra 1 January - 12 October 2 364 424 1 764 040 25 003 4 153 467 121 507Tore Sjursen 12 October - 31 December 529 630 - 1 688 531 318 25 103Total 23 426 421 12 530 790 140 266 36 097 477 792 518<strong>2009</strong>Amounts in NOK Base salary 1 Variable pay 2 Other benefits 3 Total taxable remunerationPension benefit earned/cost to company 4Simen Lieungh 5 1 January - 31 December 4 340 937 1 506 943 24 102 5 871 982 147 136Leif Hejø Borge 1 January - 31 December 2 599 744 122 923 23 767 2 746 434 57 925Niels Didrich Buch 1 January - 31 December 1 914 607 135 556 23 767 2 073 929 94 912Mads Andersen 1 January - 31 December 2 423 577 1 714 036 23 767 4 161 380 88 746Karl Erik Kjelstad 1 July - 31 December 1 366 731 - 2 552 1 369 283 28 544Per Harald Kongelf 1 January - 31 December 1 993 060 737 398 24 214 2 754 672 99 476Gary Mandel 1 February - 31 December 2 929 230 - - 2 929 230 124 764Jarle Tautra 1 January - 31 December 2 599 590 1 414 340 20 170 4 034 100 139 069Total 20 167 476 5 631 196 142 339 25 941 011 780 5721) Includes paid holiday allowances.2) The variable pay in <strong>2010</strong> are amounts earned in <strong>2009</strong> and <strong>2007</strong> in addition to holiday allowance on variable pay paid in <strong>2009</strong>.3) Other benefits include insurance agreements, which is membership in the standard employee scheme and an additional executive group life and disability insurance with a maximum cover of NOK 4 323 050.4) Pension benefits include the standard employee pension scheme, a pension compensation scheme related to the transfer from a benefit scheme to a pension contribution scheme and a disability pension scheme.5) Includes management pension rights where contributions stopped in 2002. The schemes were wound up following the merger between <strong>Kvaerner</strong> and Aker Maritime.6) In addition to the base salary, Simen Lieungh was paid NOK 2 250 498 in the six months notice period and holiday allowances of NOK 487 927 for <strong>2010</strong> was paid in January 2011. Simen Lieungh will be paid a 14 months severance pay from 1 January 2011 to 29 February2012 totalling NOK 5 251 168.
42 Aker Solutions annual report <strong>2010</strong><strong>Annual</strong> accounts – groupWith the exception of Geir Arne Drangeid who has 3 months of agreed period of notice, and ToreSjursen who does not have severance pay, all members of the executive management team has sixmonths of agreed period of notice and six months severance pay. All members also have standardemployee defined contribution plan as described in note 30 with the exception of Gary Mandel whohas a standard US employee defined contribution plan.There are no loans granted to members of the executive management team.Share-based paymentsIncluding the members of the executive management team, a total of 52 managers are entitled tovariable pay under the programme described on the previous page. The total accrual for variable payprogramme is NOK 128.5 million as of 31 December <strong>2010</strong> (NOK 40.5 million in <strong>2009</strong>). The developmentof the company’s share price is an element of the variable pay programme.Share-based element of variable payAmounts in NOK <strong>2010</strong> <strong>2009</strong>Paid in the year - -Expensed in the year 9 668 144 1 396 635Accrued at the end of the year 11 064 779 1 396 635Directors’ and executive management team’s shareholdingThe following number of shares were owned by the directors and the members of the executive managementteam (and their related parties) as of 31 December <strong>2010</strong>.SharesAtle Teigland, Director 1 981Åsmund Knutsen, Director 3 286Arild Håvik, Director 381Arve Toft, Director 381Leif Hejø Borge, executive vice president & CFO 20 381Niels Didrich Buch, executive vice president 381Mads Andersen, executive vice president 12 776Karl Erik Kjelstad, executive vice president 2 500Gary Mandel, executive vice president 1 601Tore Sjursen, executive vice president 252The overview includes only direct ownership of Aker Solutions shares and does not include Kjell IngeRøkke’s indirect ownership through his ownership in Aker ASA.Note 11 Operating leasesLeases as lesseeTotal non-cancellable operating lease commitments 1Amounts in NOK million <strong>2010</strong> <strong>2009</strong>Contracts due within one year 982 662Contracts running from one to five years 2 978 2 168Contracts running for more than five years 2 794 1 182Total 6 754 4 0121) Operating lease commitments do not include commitments related to disposal groups held for sale.Minimum sublease payment to be received in the future amount to NOK 28 million (NOK 371 million in<strong>2009</strong>), and relates mainly to sublease of buildings.Lease and sublease payments recognised in the income statement<strong>2010</strong>Amounts in NOK million Buildings VesselsPlant, equipmentand machinery Other TotalMinimum lease payments 627 638 224 40 1 529Contingent payments 1 - - - 1Sublease income (55) - - - (55)Total 573 638 224 40 1 475<strong>2009</strong>Amounts in NOK million Buildings VesselsPlant, equipmentand machinery Other TotalMinimum lease payments 659 355 191 46 1 251Contingent payments 1 - - - 1Sublease income (54) - - - (54)Total 606 355 191 46 1 198Operating lease costs for buildings relates to rental on a large number of locations worldwide. AkerSolutions has a twelve year leasing agreement with Norwegian Property for headquarters, Aker Hus, atFornebu, Bærum expiring in 2019 . Aker Solutions also has entered into a twelve year lease agreementwith Fornebu Gate 2 AS for a new office building at Fornebu. This agreement will start when the buildingis completed (estimated 2012).
Aker Solutions annual report <strong>2010</strong><strong>Annual</strong> accounts – group43Vessel lease costs relates to BOA Sub C and BOA Deep C which are operated by Aker Marine Contractorsand Skandi Aker, Skandi Santos and Wayfarer which are operating by Aker Oilfield Services.Other plant and machinery costs primarily include leasing of IT equipment, cars and inventory. Leasingof IT equipment is based on a three year agreement with Hewlett Packard International Bank PLC.Inventory and ICT equipment are leased from SG Finans. There is no option to purchase the equipmentand it cannot be sublet.None of the leases include significant contingent rent.Leases as lessorTotal non-cancellable operating lease payments receivableAmounts in NOK million <strong>2010</strong> <strong>2009</strong>Contracts due within one year 254 -Contracts running from one to five years 805 -Contracts running for more than five years - -Total 1 059 -Operating lease income relates to the vessel Skandi Santos which is on a five year charter agreementthat started in March <strong>2010</strong>. NOK 212 million was recognised as lease income in <strong>2010</strong>.Note 12 Other operating expensesOther operating expenses amount to NOK 5.0 billion in <strong>2010</strong> (NOK 5.3 billion in <strong>2009</strong>). The expensesinclude audit fees, operating lease costs (note 11 Operating leases) and other expenses mainly relatedto premises, electricity, maintenance, travelling, IT-equipment and insurance fees.Fees to KPMG 1AuditOther assuranceservicesTaxservicesOtherservicesAmounts in NOK million <strong>2010</strong> <strong>2009</strong> <strong>2010</strong> <strong>2009</strong> <strong>2010</strong> <strong>2009</strong> <strong>2010</strong> <strong>2009</strong>Aker Solutions ASA 3 4 - - - - - -Subsidiaries 27 33 7 3 9 9 4 3Total 30 37 7 3 9 9 4 3Note 13 Finance income and expensesRecognised in profit and lossAmounts in NOK million <strong>2010</strong> <strong>2009</strong>Net change in fair value of non-qualifying hedge instruments (84) 161Interest income on bank deposits measured at amortised cost 91 32Net foreign exchange gain 14 -Ineffective portion of changes in fair value of hedging instruments - (1)Other finance income (4) 32Finance income 101 63Interest expense on financial liabilities measured at amortised cost (554) (531)Interest expense on financial liabilities measured at fair value 1 (32) (68)Capitalisation of borrowing costs 2 49 61Net foreign exchange loss - (27)Finance expenses (537) (565)Net finance expenses recognised in profit and loss (520) (341)1) Interest on deferred and contingent payments, see note 29 Other non-current liabilities.2) See note 22 Property, plant and equipment.Some foreign exchange hedge transactions do not qualify for hedge accounting under IFRS, primarlybecause a large number of internal hedge transactions are grouped and netted before external hedgetransactions are established. The non-qualifying hedge instruments are mainly foreign exchange forwardcontracts. The corresponding contracts (hedged items) to the hedging derivatives are calculatedto have an equal, but opposite effect, and both the derivatives and the hedged items are reported asfinancial results. The net amount therefore reflects the difference in timing between the non-qualifyinghedging instrument and the future transaction (hedged item). The exposure from foreign currencyembedded derivatives is hedged, but cannot qualify for hedge accounting and is therefore included in‘Net foreign exchange gain/loss’. Hedge accounting and embedded derivatives are explained in note 21Derivative financial instruments.See note 33 Financial instruments for information of the finance income and expense generating items.1) Fee to auditors include audit fee in discontinued operations.
44 Aker Solutions annual report <strong>2010</strong><strong>Annual</strong> accounts – groupNote 14 TaxIncome tax expenseAmounts in NOK million <strong>2010</strong> <strong>2009</strong>Current tax expenseCurrent year 948 1 027Adjustments for prior years (214) (140)Total current tax expense 734 887Deferred tax expenseOrigination and reversal of temporary differences 98 12Benefit of recognised tax loss carry-forwards and timing differencesoriginated in previous periods (6) (22)Total deferred tax expense 92 (10)Total tax expense 826 877Attributable to continuing operations 697 783Attributable to discontinued operations 129 94Effective tax rateThe table below reconciles the reported income tax expense to the expected income tax expenseaccording to the corporate income tax rate of 28 percent in Norway.Amounts in NOK million <strong>2010</strong> <strong>2009</strong>Profit before tax, continuing operations 2 355 2 969Profit before tax, discontinued operations 481 239Profit before tax, total 2 836 3 208Expected income taxes (28 percent) of profit before tax 794 898Tax effects of:Prior year adjustments (current and deferred tax) 1 (42) (121)Effect of items booked against equity (7) -Permanent differences 2 6 (95)Effect of unrecognised timing differences and tax loss 76 105Change in tax rates (9) 23Differences in tax rates from 28 percent (30) 15Other 3 38 52Income tax expense, continuning and discontinued operations 826 877Effective tax rate 29% 27%Tax effect of differences 32 (21)1) Amount in <strong>2009</strong> relates mainly to US where recognised tax liabilities in prior years have been derecognised due to variousclarifications related to actual tax liabilities.2) Amount in <strong>2009</strong> includes acquisition gains related to remeasurement of previously held interests at fair value and gain from saleof shares in ODIM.3) Relates mainly to withholding tax.
Aker Solutions annual report <strong>2010</strong><strong>Annual</strong> accounts – group45Recognised deferred tax assets and liabilitiesAssets (Liabilities) NetAmounts in NOK million <strong>2010</strong> <strong>2009</strong> <strong>2010</strong> <strong>2009</strong> <strong>2010</strong> <strong>2009</strong>Property, plant and equipment (14) (5) (107) (120) (121) (125)Pensions 97 84 49 101 146 185Projects under construction (236) (490) (1 319) (1 438) (1 555) (1 928)Tax loss carry-forwards 160 337 711 1 044 871 1 381Other 548 463 (205) (279) 343 184Total 555 389 (871) (692) (316) (303)Attributable to continuing operations 487 (829) (342)Attributable to disposal groups heldfor sale 68 (42) 26Change in net recognised deferred tax assets and liabilitiesProperty,plant andAmounts in NOK millionequipment PensionsProjectsunder constructionTax losscarryforwardsOther TotalBalance as of 1 January <strong>2009</strong> (144) 137 (1 786) 1 375 106 (312)Recognised in profit and loss 58 48 (141) 35 12 12Recognised in equity - - - - 6 6Additions through businesscombinations (58) - (6) (6) 87 17Currency translation differences 19 - 5 (23) (27) (26)Balance as of 31 December <strong>2009</strong> (125) 185 (1 928) 1 381 184 (303)Prior year adjustments(current and deferred tax) 1 (40) (39) 378 (507) 115 (93)Recognised in equity (2) (1) 2 2 1Additions through businesscombinations - 2 - (3) 26 25Disposal of subsidiaries 41 - - 2 43Currency translation differences 1 - (4) (3) 16 10Balance as of 31 December <strong>2010</strong> (123) 146 (1 555) 872 343 (317)Tax loss carry-forwardsAmounts in NOK millionNorwayEuropeotherNorthAmericaSouthAmericaAsiaPacific Other Total2011 1 - - 5 - - - 52016 and later - 298 603 - 443 - 1 344Indefinite 2 252 96 - - 11 - 2 359Total tax loss carry-forwards 2 252 394 608 - 454 - 3 708Unrecognised tax loss carryforwards1 298 32 - 434 - 7651) There are no tax loss carry-forwards that expires in the period 2012 until 2015.2) Mainly expiry date more than 5 years.Geographical overview of tax positions<strong>2010</strong>Amounts in NOK millionCurrent taxexpenseDeferred taxexpenseTotal taxexpenseNet deferredtax liabilityNet payabletax liabilityNorway 65 207 271 (593) (13)Europe 181 (1) 179 (91) (33)North America (114) (17) (131) 251 159South America 113 (46) 70 79 (23)Asia 1 491 (49) 442 35 48Other countries (2) (2) (5) 3 (1)Total 734 92 826 (316) 137<strong>2009</strong>Amounts in NOK millionCurrent taxexpenseDeferred taxexpenseTotal taxexpenseNet deferredtax liabilityNet payabletax liabilityNorway 2 48 50 (492) 14Europe 274 2 276 (88) (93)North America 123 (55) 68 230 (55)South America 74 11 85 32 44Asia 1 410 (16) 394 15 (23)Other countries 4 - 4 - (1)Total 887 (10) 877 (303) (114)1) Tax related to Aker Solutions’ activity in Kazakhstan is reported under Asia.
46 Aker Solutions annual report <strong>2010</strong><strong>Annual</strong> accounts – groupNote 15 Net capital employedNote 16 Trade and other receivablesAmounts in NOK million Note <strong>2010</strong> <strong>2009</strong>Amounts in NOK million Note <strong>2010</strong> <strong>2009</strong>Inventories 17 1 686 1 417Trade and other receivables 16 14 870 18 332Provisions 20 (1 039) (869)Trade and other payables 19 (16 278) (19 370)Derivative financial instruments, net 21 143 27Net current operating assets (618) (463)Employee benefit assets 30 95 167Other non-current operating assets 221 338Intangible assets 23 6 783 7 915Property, plant and equipment 22 7 494 6 531Employee benefits obligations 30 (647) (910)Interest-bearing receivables 24 846 624Investments 25, 27 581 558Cash excl. cash pool arrangement 2 416 2 087Total 17 171 16 847Trade receivables 1, 2, 3 5 941 6 791Less provision for impairment of receivables (115) (201)Trade receivables, net 5 826 6 590Advances to suppliers 440 732Work in progress 18 4 753 6 456Other receivables 1 3 851 4 554Total 14 870 18 3321) Trade receivables include NOK 205 million due after one year (NOK 297 million in <strong>2009</strong>). Book value of trade and otherreceivables is approximately equal to fair value.2) Trade receivables are financial instruments and an impairment loss of NOK 23 million (NOK 21 million in <strong>2009</strong>) was recognised incost of sales.3) Receivables from related parties at the end of <strong>2010</strong> is NOK 95 million (NOK 160 million in <strong>2009</strong>).Aging of trade receivablesAmounts in NOK million <strong>2010</strong> <strong>2009</strong>Current 3 942 4 172Past due 0-30 days 715 1 023Past due 31-90 days 334 479Past due 91 days to one year 745 820Past due more than one year 205 297Total 5 941 6 791Note 17 InventoriesAmounts in NOK million <strong>2010</strong> <strong>2009</strong>Stock of raw materials 936 1 007Goods under production 360 -Finished goods 390 410Total 1 686 1 417Inventories carried at fair value less cost to sell 61 303Write-down of inventories in the period 12 28
Aker Solutions annual report <strong>2010</strong><strong>Annual</strong> accounts – group47Note 18 Construction contractsNote 19 Trade and other payablesAmounts in NOK million Note <strong>2010</strong> <strong>2009</strong>Amounts in NOK million <strong>2010</strong> <strong>2009</strong>Value of work performed on uncompleted contracts 79 358 97 751Invoiced 74 605 91 295Work in progress to be invoiced 4 753 6 456Trade receivables, net 16 5 826 6 590Recoverable on construction contracts 10 579 13 046Advances from customers 19 4 315 5 575Largest projects in progress at year end <strong>2010</strong> (unaudited)Project Business segment Customer Estimated deliverySkarv ED&S BP 2011Statfjord Latelife ED&S Statoil 2011Oseberg B Drilling upgrade ED&S Statoil 2013Kollsnes ED&S Statoil 2011Mongstad Test Centre ED&S Aker Clean Carbon 2011Kashagan HUC ED&S Agip 2011Sakhalin 1 ED&S Exxon 2012Gudrun Jacket ED&S Statoil 2011Ekofisk 2/4L Jacket ED&S ConocoPhillips 2012MMO frame agreement ED&S Statoil 2014Nordsee Ost ED&S Essent wind 2012Clair Ridge ED&S BP 2013Sleipner SPORT ED&S Statoil 2013TMT2 P&T Daewoo 2011Songa Eclipse P&T Jurong 2011CNOOC P&T CNOOC 2011Odebrecht 3 P&T Daewoo 2012Petroserve 2 P&T Daewoo 2012Gorgon P&T Chevron 2015Spectra P&T Spectra 2011Trym/Oselvar Subsea Dong 2011Ormen Lange SCS Pilot Subsea Statoil 2011Goliat Subsea ENI 2014Åsgard Compression Subsea Statoil 201445 Trees Subsea Petrobras 2012Iara/Guara Subsea Petrobras 2013Longview Power Project P&C Longview Power 2011Gulf LNG P&C Gulf LNG Energy 2011Trade creditors 1, 2 2 945 3 891Advances from customers 4 315 5 575Accrued operating and financial costs 6 003 7 790Other current liabilities 3 3 015 2 114Total 16 278 19 3701) Trade creditors include NOK 16 million due after one year (NOK 325 million in <strong>2009</strong>). Book value of trade creditors and othercurrent liabilities is approximately equal to fair value.2) Trade creditors include NOK 2 million to related parties at the end of <strong>2010</strong> (0 in <strong>2009</strong>).3) Other current liabilities includes NOK 451 million related to deferred and contingent considerations assumed in businesscombinations. See note 29 Other non-current liabilities for further description.Note 20 ProvisionsAmounts in NOK million Warranties Other TotalBalance as of 1 January <strong>2010</strong> 573 296 869Provisions made during the year 406 236 642Provisions used during the year (177) (91) (268)Provisions reversed during the year (73) (43) (116)Currency translation differences 5 12 17Reclassification to liabilities held for sale (62) (43) (105)Balance as of 31 December <strong>2010</strong> 672 367 1 039Expected timing of paymentNon-current 382 48 430Current 290 319 609672 367 1 039WarrantiesThe provision for warranties relates mainly to the possibility that Aker Solutions, based on contractualagreements, needs to perform guarantee work related to products and services delivered to customers.See note 4 Accounting estimates and judgements for further description.OtherOther includes mainly provisions for loss contracts. Provisions for loss contract are deducted from thevalue of the same contracts in work in progress or, to the extent they exceed this value, disclosed asprovisions.
48 Aker Solutions annual report <strong>2010</strong><strong>Annual</strong> accounts – groupNote 21 Derivative financial instrumentsThe Aker Solutions group uses derivative financial instruments to hedge foreign exchange and interest rate exposures. In addition, there are embedded foreign exchange forward derivatives separated from ordinarycommercial contracts. Further information regarding risk management policies in the group is available in note 5 Financial risk management and exposures.The table below presents the fair value of the derivative financial instruments and a maturity analysis of the derivative’s undiscounted cashflows. Given the Aker Solutions group hedging policy and the assumption thatthe projects are cash neutral, this table also indicates when the cash flows related to project expenses are expected to impact profit and loss. The majority of project revenues are recognised in accordance with IAS 11using the percentage of completion method. This may result in different timing of cash flows related to project revenues and revenue recognition.<strong>2010</strong>Amounts in NOK millionAssets atfair valueLiabilities atfair valueNetfair valueTotal undiscountedcash flow 1 6 mths or less 6-12 mths 1-2 years 2-5 years 2Forward foreign exchange contractsCash flow hedges 57 (92) (35) (77) 3 (27) (30) (23)Fair value hedges 134 - 134 134 134 - - -Embedded derivatives included in ordinary commercial contracts (163) 8 (155) (245) (112) (56) (65) (12)Not hedge accounted 289 (121) 168 243 122 45 62 14Interest rate swapsOption contracts 8 (7) 1 1 1 - - -Cash flow and fair value hedges 61 (31) 30 30 (6) (10) 46 -Total 386 (243) 143 86 142 (48) 13 (21)<strong>2009</strong>Amounts in NOK millionAssets at fairvalueLiabilities at fairvalueNet fair valueTotal undiscountedcash flow 1 6 mths or less 6-12 mths 1-2 years 2-5 years 2Forward foreign exchange contractsCash flow hedges 140 (58) 82 66 53 11 2 -Fair value hedges 41 (19) 22 27 30 (2) (1) -Embedded derivatives included in ordinary commercial contracts 11 (4) 7 (105) (28) (36) (26) (15)Not hedge accounted 173 (230) (57) 38 (69) 70 23 14Interest rate swapsOption contracts 1 (2) (1) (1) (1) - - -Cash flow and fair value hedges 2 (28) (26) (28) (3) (3) (7) (15)Not hedge accounted 4 (4) - - - - - -Total 372 (345) 27 (3) (18) 40 (9) (16)1) Undiscounted cash flows are translated to NOK using the exchange rates on the balance sheet date.2) No derivative financial instruments mature after 5 years.
Aker Solutions annual report <strong>2010</strong><strong>Annual</strong> accounts – group49Derivative financial instruments are classified as current assets or liabilities. The full fair value of a hedgingderivative is classified as a non-current asset or liability if the remaining maturity of the hedged itemis more than 12 months, and as a current asset or liability if the maturity of the hedged item is less than12 months. If the hedged item is related to projects, such as work in progress or trade receivables, thehedging derivative is always classified as a current asset or liability.Foreign exchange derivativesCorporate Treasury hedge the group’s future transactions in foreign currencies with external banks.Approximately 80 percent of the exposure to foreign exchange variations in future cash flows are relatedto a few large projects. The currency exposure in these projects have been hedged back-to-back inorder to meet the requirements for hedge accounting. They are either subject to hedge accounting orseparated embedded derivatives. All other hedges are not designated as IAS 39 hedges and will havean effect on profit or loss. Most hedges qualifying for hedge accounting are classified as cash flowhedges (hedges of highly probable future revenues and/or expenses). Some hedges that will clearlyqualify as hedges of firm commitments are classified as fair value hedges.Embedded derivatives are foreign exchange derivatives separated from construction contracts. Themain reason for separation is that the agreed payment is in a currency different from any of the majorcontract parties’ own functional currency. The embedded derivatives represent currency exposures,which is hedged against external banks. Since the embedded derivatives are measured and classifiedin the same way as their hedging derivatives, they will have an almost equal, opposite effect to profitand loss. In the table above, the derivatives hedging the embedded derivatives are included in Forwardforeign exchange contracts - not hedge accounted.The hedged transactions in foreign currency that are subject to cash flow hedge accounting are highlyprobable future transactions expected to occur at various dates during the next one to four years,depending on progress in the projects. Gains and losses on forward foreign exchange contracts arerecognised in comprehensive income and reported as hedging reserve in equity until it will be recognisedin the income statement in the period or periods during which the hedged transactions affect theincome statement. This is generally within 12 months from the balance sheet date unless the gain orloss is over the life of the asset.The purpose of the hedging instrument is to secure a situation where the hedged item and the hedginginstrument together represent a predetermined value independent of fluctuations of exchange rates.Revenue and expense on the underlying construction contracts are recognised in the income statementin accordance with progress. Consequently, NOK negative 31 million of the value of the forward contractshave already affected the income statement indirectly as revenues and expenses are recognisedbased on updated forecasts and progress. The NOK negative 4 million that are currently recordeddirectly in the hedging reserve, will be reclassified to income statement over approximately the nextthree years.Interest rate swapsAs of 31 December <strong>2010</strong>, Aker Solutions has one bond of NOK 150 million with a fixed interest rate of6 percent and one bond of NOK 1 913 million with a fixed interest rate of 8.7 percent. At year end, therewere interest rate swaps with floating interest with a notional value of NOK 1 100 hedging the fixedinterest bonds. In addition, Aker Solutions has three bonds totalling NOK 1 056 million at floatinginterest rates and NOK 400 million are swapped to fixed interest. NOK 1 300 million of drawings undercommitted facilities are swapped to 12 months fixed rate from 15 January <strong>2010</strong>. A credit facility of NOK750 million with floating interest was established in <strong>2009</strong> where NOK 375 million are swapped to fixedinterest. Floating interest is mainly tied to NIBOR and LIBOR.Hedge accounting is applied using the cash flow hedge accounting model which means that gains andlosses on interest rate swap from floating to fixed interest rates as of 31 December <strong>2010</strong> are recognisedin the hedging reserve in equity and will be continuously released to the income statement until thebank borrowings are repaid. Fair value hedge accounting is applied for hedging of the fixed interestbonds, see note 28 Borrowings.The fair value amounts of the outstanding interest rate swap contracts as of 31 December <strong>2010</strong> wereNOK 30 million (negative NOK 26 million in <strong>2009</strong>).The following table shows the unsettled cash flow hedges’ impact on profit and loss and equity (notadjusted for tax).<strong>2010</strong>Amounts in NOK millionFair value of allhedging instrumentsRecognised inprofit and lossDeferred in equity(the hedging reserve)Interest rate swaps 1 (22) - (22)Forward exchange contracts (35) (31) (4)Total (57) (31) (26)<strong>2009</strong>Amounts in NOK millionFair value of allhedging instrumentsRecognised inprofit and lossDeferred in equity(the hedging reserve)Interest rate swaps 1 (11) - (11)Forward exchange contracts 82 40 42Total 71 40 311) The value of the interest swaps is attributable to changes in the interest swap curve for Norwegian kroner during the period frominception of the hedge to the balance sheet date.
50 Aker Solutions annual report <strong>2010</strong><strong>Annual</strong> accounts – groupNote 22 Property, plant and equipmentAmounts in NOK millionBuildingsand sitesMachinery,equipmentand softwareUnderconstructionHistorical costBalance as of 1 January <strong>2009</strong> 1 951 5 285 671 7 907Additions through business combinations 1 333 71 524 928Additions 2 130 847 1 224 2 201Disposals (64) (170) (55) (289)Currency translation differences (115) (281) (27) (423)Balance as of 31 December <strong>2009</strong> 2 235 5 752 2 337 10 324Additions through business combinations - 8 - 8Additions 2 228 1 553 686 2 467Disposals (313) (193) (133) (639)Currency translation differences 38 (11) 6 33Reclassification to assets held for sale (162) (220) (133) (515)Balance as of 31 December <strong>2010</strong> 2 026 6 889 2 763 11 678Accumulated depreciationBalance as of 1 January <strong>2009</strong> (806) (2 491) - (3 297)Depreciation for the year 3 (82) (721) - (803)Impairment loss - (48) - (48)Disposals 98 129 - 227Currency translation differences 10 118 - 128Balance as of 31 December <strong>2009</strong> (780) (3 013) - (3 793)Depreciation for the year 3 (107) (723) - (830)Impairment loss - (2) - (2)Disposals 104 141 - 245Currency translation differences (9) (5) - (14)Reclassification to assets held for sale 42 168 - 210Balance as of 31 December <strong>2010</strong> (750) (3 434) - (4 184)TotalAdditionsApproximately 28 percent of additions in <strong>2010</strong> are related to the investment programme in Aker OilfieldServices AS (50 percent in <strong>2009</strong>) and 20 percent in the buildings at Fornebu and Hinna.CommitmentsBy the end of December <strong>2010</strong> Aker Solutions has entered into contractual commitments for theacquisition of property, plant and equipment amounting to NOK 876 million, mainly related to theinvestment programme in K2 Hotellbygg AS, Jattåvågen AS and Aker Oilfield Services AS. Thecommitments will to a large extent become payable in 2011.DisposalsIn December <strong>2010</strong> Aker Solutions sold shares in a building project related to the construction of a newbuilding at Fornebu to K2 Eiendom AS. As Aker Solutions is responsible for the completion of thefacilities within specific timeframes and budgets, the accounting gain will be booked in 2012 when thebuildings are completed. The deferred income related to the 25 percent ownership in K2 Eiendom AShas been deducted directly from the investment, see note 25 Investments in associated companies andjointly controlled entities. The remaning deferred income is recognised in Other non-current liabilities,see note 29 Other non-current liabilities.DepreciationAssets are mainly depreciated on a straight-line basis over their expected economic lives as follows:Machinery, equipment and software 3 - 15 yearsBuildings8 - 30 yearsSitesNo depreciationEstimates for residual values are reviewed annually.SecuritySee note 28 Borrowings for information about bank borrowings which are secured by property, plantand equipment.Book valueas of 31 December <strong>2009</strong> 1 455 2 739 2 337 6 531as of 31 December <strong>2010</strong> 1 276 3 455 2 763 7 494Of which financial leasesas of 31 December <strong>2009</strong> 4 199 - 203as of 31 December <strong>2010</strong> - 160 - 1601) Additions through business combinations relate mainly to the acquisition of Aker Oilfield Services AS, Aker Wirth GmbH,Midsund Bruk AS and Fornebu Gate 2 AS in <strong>2009</strong>.2) NOK 49 million of borrowing costs have been capitalised in <strong>2010</strong> and are included in the amount (NOK 61 million in <strong>2009</strong>).3) NOK 16 million relates to discontinued operations (NOK 13 million in <strong>2009</strong>).
Aker Solutions annual report <strong>2010</strong><strong>Annual</strong> accounts – group51Note 23 Intangible assetsAmounts in NOK millionIntangibleassets excl.goodwill Goodwill TotalGoodwillThe increase in goodwill in <strong>2009</strong> is caused by the acquisitions of Aker Oilfield Services AS, Aker WirthGmbH and Midsund Bruk AS.The adjustment in <strong>2010</strong> relates mainly to increase of goodwill related to the acquisition of Aker QservLtd in <strong>2008</strong> due to a change in the estimated deferred and contingent consideration.Balance as of 1 January <strong>2009</strong> 160 6 959 7 119Additions 177 - 177Additions through business combinations 1 220 1 260 1 480Adjustment - (338) (338)Disposals - (112) (112)Amortisation for the year (38) - (38)Impairment loss - (21) (21)Currency translation differences (24) (328) (352)Balance as of 31 December <strong>2009</strong> 495 7 420 7 915Additions 172 - 172Adjustment - 95 95Amortisation for the year (57) - (57)Currency translation differences (6) (45) (51)Reclassification to assets held for sale (2) (1 289) (1 291)Balance as of 31 December <strong>2010</strong> 602 6 181 6 7831) The increase in other intangible assets in <strong>2009</strong> of NOK 220 million relates mainly to customer contracts (NOK 160 million) andpatents and trademarks (NOK 45 million).Research and development costsNOK 172 million have been capitalised in <strong>2010</strong> related to development activities. In addition, researchand development costs of NOK 157 million have been expensed during the year because the criteria forcapitalisation was not met (NOK 164 million in <strong>2009</strong>). In addition, research and development costs paidby customers totalled NOK 110 million in <strong>2010</strong> (NOK 22 million in <strong>2009</strong>).Intangible assets with finite useful lives are amortised over the expected economic life, ranging between5-10 years.Allocation of goodwill by operating segmentsAmounts in NOK million <strong>2010</strong> <strong>2009</strong>Energy Development & Services 2 318 2 317Subsea 2 776 2 687Products & Technologies 1 119 1 157Process & Construction 1 125 1 123Other 132 136Total 7 470 7 420Reclassification to assets held for sale (1 289) -Total continuing operations 6 181 7 420Impairment testing for cash-generating units containing goodwillGoodwill originates from a number of acquisitions. Management monitors goodwill impairment at thebusiness segment level which is also considered the cash-generating unit (CGU) due to the level of integrationwithin the CGUs.Recoverable amounts are based on value in use calculations. The calculations use cash flow projectionsbased on the future cash flow, budgets and strategic forecasts for the periods 2011-2013 and anannual growth of 2.5 percent for subsequent periods.WACC assumptions for impairment testing Post tax WACC Pre tax WACCEnergy Development & Services 10.4% 13.4%Subsea 10.4% 12.9%Products & Technologies 10.4% 13.2%Process & Construction 9.2% 13.3%For all business areas, the recoverable amounts are higher than the carrying amounts and consequentlythe analysis indicates that no impairment is required. Cash flow estimates are sensitive to the ability tomaintain volume and margin assumptions. As a sensitivity analysis, recoverable amount has been calculatedusing discount rates up to 16 percent after tax, without effect on the conclusions. Also, sensitivityanalysis of other estimates with a reasonable change in assumptions does not give grounds forimpairment charges.
52 Aker Solutions annual report <strong>2010</strong><strong>Annual</strong> accounts – groupNote 24 Interest-bearing receivablesCurrent interest-bearing receivablesCurrent interest-bearing receivables were NOK 621 million (NOK 440 million in <strong>2009</strong>). Aker InsuranceAS had a portfolio of obligations, certificates and shares as of 31 December <strong>2010</strong> amounting to NOK420 million (NOK 424 million in <strong>2009</strong>) and Aker Powergas Pvt Ltd had investments in a mutual fund ofNOK 198 million (NOK 13 million in <strong>2009</strong>).Non-current interest-bearing receivablesNote 25 Investments in associated companies and jointly controlled entitiesJointly controlled entities are accounted for using the equity method.Associated companies and jointly controlled entities are defined as related parties to Aker Solutions.See note 8 Related parties for overview of transactions and balances between Aker Solutions and theassociated companies and joint ventures.Investments in associated companies and jointly controlled entitiesAmounts in NOK million <strong>2010</strong> <strong>2009</strong>Loans to employees 1 5 6Loans to related parties 2 218 176Other 2 2Total 225 1841) Average interest rate for loans to employees was 2.46 percent in <strong>2010</strong> (3.58 percent in <strong>2009</strong>).2) Aker DOF Deepwater AS and Caspian Sea Solutions BV (Aker DOF Deepwater AS and Aker Clean Carbon AS in <strong>2009</strong>), see note8 Related parties.See note 5 Financial risk management and exposures for information regarding credit risk managementin the Aker Solutions group.<strong>2010</strong>Amounts in NOK millionBook value asof 1.1.<strong>2010</strong>Additions/Disposals/PaymentsProfit(loss) 5Currencyand otheradjustmentsBook value asof 31.12.<strong>2010</strong>Aker Clean Carbon AS 1 49 52 (23) - 78Aker DOF Deepwater 190 - (8) - 182Aker Caspian BV 82 18 (11) - 89K2 Eiendom AS 2 - 55 - (55) -Other companies 102 (42) 17 (2) 75Total 423 83 (25) (57) 424<strong>2009</strong>Amounts in NOK millionBook value asof 1.1.<strong>2009</strong>Additions/Disposals/PaymentsProfit(loss) 5Currencyand otheradjustmentsBook value asof 31.12.<strong>2009</strong>Aker Oilfield Services AS 3 260 (256) (4) - -Aker Clean Carbon AS 1 19 43 (13) - 49Aker DOF Deepwater - 190 - - 190ODIM ASA 4 - (109) 109 - -Other companies 165 15 22 (18) 184Total 444 (117) 114 (18) 4231) Associate until 1 April <strong>2009</strong>, thereafter jointly controlled entity.2) In December <strong>2010</strong> Aker Solutions sold the office part of its new building at Fornebu to K2 Eiendom AS and at the same timeacquired 25 percent ownership in the company. The investment has been reduced by the gain related to the 25 percentownership. See note 22 Property, plant and equipment for further description of the transaction.3) Subsidiary from 1 April <strong>2009</strong>.4) 33 percent of ODIM ASA was acquired on 1 April <strong>2009</strong> and sold on 29 June <strong>2009</strong>. Profit after tax includes dividends of NOK 15million paid out in May <strong>2009</strong> and sales gain of NOK 94 million.5) NOK 7 million is recognised in Other income in <strong>2010</strong>. NOK 2 million in <strong>2009</strong> relates to discontinued operations.
Aker Solutions annual report <strong>2010</strong><strong>Annual</strong> accounts – group53Summary of financial information for significant associated companies and jointly controlled entities (100 percent basis)<strong>2010</strong>Amounts in NOK millionBusiness officePercentage ofvoting rightsPercentageheld Assets Liabilities Equity Revenues Net profit (loss)Aker Clean Carbon AS 1 Oslo, Norway 50.0% 50.0% 223 86 137 263 (45)Aker DOF Deepwater AS 1 Storebø, Norway 50.0% 50.0% 887 733 154 37 90Aker Caspian BV 1 Zoetermeer, Netherlands 50.0% 50.0% 207 33 174 - (18)K2 Eiendom AS 2 Oslo, Norway 25.0% 25.0% 733 532 201 - (2)Power Maintenance and Constructors, LLC 2 Hammond, USA 49.0% 49.0% 70 28 41 569 1Nippon Pusnes Co Ltd 2, 3 Tokyo, Japan 28.0% 28.0% 244 161 84 617 28K-WAC Ltd 1 Brentford, UK 33.0% 30.0% 166 84 82 516 44<strong>2009</strong>Amounts in NOK millionBusiness officePercentage ofvoting rightsPercentageheld Assets Liabilities Equity Revenues Net profit (loss)Aker Clean Carbon AS 1 Oslo, Norway 50.0% 50.0% 205 124 81 210 (36)Aker DOF Deepwater AS 1 Storebø, Norway 50.0% 50.0% 393 329 64 4 4Power Maintenance and Constructors, LLC 2 Hammond, USA 49.0% 49.0% 71 31 40 848 1Nippon Pusnes Co Ltd 2, 3 Tokyo, Japan 28.0% 28.0% 199 155 44 149 8K-WAC Ltd 1 Brentford, UK 33.0% 30.0% 345 271 74 660 561) Jointly controlled entity. Assets and liabilities are mainly non-current.2) Associated company.3) <strong>Report</strong>ing date is 31 March.Guarantee obligationsAker Solutions ASA has issued payment guarantees to STX Singapore Offshore Pte Ltd for 50 percent of all amounts payable by Aker DOF Deepwater AS under the contract to construct four vessels. Aker Solutionsremaining commitments amount to NOK 450 million as of 31 December <strong>2010</strong> provided Aker DOF Deepwater enters into long-term financing agreements of 70 percent of contract value.In addition, Aker Solutions ASA has issued financial guarantees in favor of Eksportfinans/BNP Paribas under ECA loans granted Aker DOF Deepwater AS related to financing of two vessels. Liability is capped at 50percent of drawn amount (USD 46.5 million as of 31 December <strong>2010</strong>).
54 Aker Solutions annual report <strong>2010</strong><strong>Annual</strong> accounts – groupNote 26 Jointly controlled operationsThe group has interests in several jointly controlled operations whose principal activities are constructioncontracts. The group’s share of assets, liabilities, income and expenses of jointly controlled operationsare included in the consolidated financial statements. The material agreements and entities arelisted below.Jointly controlled operations are defined as related parties to Aker Solutions. See note 8 Related partiesfor overview of transactions and balances between Aker Solutions and jointly controlled operations.Percentage share <strong>2010</strong> <strong>2009</strong>Note 27 Investments in other companiesAmounts in NOK million <strong>2010</strong> <strong>2009</strong>Balance as of 1 January 135 123Additions 22 12Balance as of 31 December 157 135Investments in other companies mainly relate to investments in Aker Pensjonskasse. The investment isheld at book value as fair value cannot be reliably measured.ASC-ERSAI Consortium 50% 50%AET-Varisal 50% 50%KAC - Kiewit and Aker Contractors 50% -Halton Hills Power Partners Joint Venture 50% 50%AK/IHI Gulf 50% 50%Cameron LNG (Sempra) 50% 50%JV Yansab 50% 50%ASO/IHI 50% 50%Aker <strong>Kvaerner</strong> Clough Murray & Robertsen Joint Venture 1 - 61%AKTIV Joint Venture 1 - 40%Anglian Water 4 Joint Venture 1 - 50%KAT Nuclear 1 - 45%1) Reclassified as as disposal groups and discontinued operations in <strong>2010</strong>, see note 7 Disposal groups and discontinuedoperations.
Aker Solutions annual report <strong>2010</strong><strong>Annual</strong> accounts – group55Note 28 BorrowingsThis note provides information about the contractual terms of group’s interest-bearing loans and borrowings which are measured at amortised cost. For more information about the the group’s exposure to interest rates,foreign currency and liquidity risk, see note 5 Financial risk management and exposures.<strong>2010</strong>Amounts in millionCurrencyNominalFixedcurrency value Book value Interest rate 4 interest margin Interest coupon Maturity date Interest termsISIN NO 0010341324 NOK 572 572 2.51% 1.05% 3.56% 01.12.2011 Floating, 3 monthsISIN NO 0010341332 NOK 300 299 2.51% 1.35% 3.86% 01.12.2013 Floating, 3 monthsISIN NO 0010342587 NOK 150 150 6.00% 6.00% 01.12.2013 Fixed, annualISIN NO 001050461.6 NOK 1 913 1 988 8.70% 8.70% 26.06.2014 Fixed, annualISIN NO 001050460.8 NOK 187 185 2.62% 4.75% 7.37% 26.06.2014 Floating, 3 monthsTotal bonds 1 3 194Revolving credit facility EUR 750 2 792 2.40% 0.73% 3.13% 25.10.2012 LIBOR + Margin 2Revolving credit facility NOK 2 000 - 2.00% 19.12.2011 LIBOR + Margin 3Total credit facility 2 792Term loan NOK 750 755 2.58% 2.00% 4.58% 01.10.2014 NIBOR, 3 monthsBrazilian Development Bank EXIM loan BRL 155 548 4.50% 08.10.2012 FixedBrazilian Development Bank EXIM loan BRL 233 817 4.50% 23.12.2013 FixedOther loans 118Total borrowings 8 224Current borrowings 716Non-current borrowings 7 508Total 8 224
56 Aker Solutions annual report <strong>2010</strong><strong>Annual</strong> accounts – group<strong>2009</strong>Amounts in millionCurrencyNominalFixedcurrency value Book value Interest rate 4 interest margin Interest coupon Maturity date Interest termsISIN NO 0010341324 NOK 572 570 2.01% 1.05% 3.06% 01.12.2011 Floating, 3 monthsISIN NO 0010341332 NOK 300 297 2.01% 1.35% 3.36% 01.12.2013 Floating, 3 monthsISIN NO 0010342587 NOK 150 149 6.00% 6.00% 01.12.2013 Fixed, annualISIN NO 001050461.6 NOK 1 913 1 953 8.70% 8.70% 26.06.2014 Fixed, annualISIN NO 001050460.8 NOK 187 185 2.13% 4.75% 6.88% 26.06.2014 Floating, 3 monthsTotal bonds 1 3 154Revolving credit facility EUR 750 2 886 0.83% 25.10.2012 LIBOR + Margin 2Revolving credit facility NOK 2 000 - 1.75-2.50% 19.12.2011 LIBOR + Margin 3Total credit facility 2 886Term loan NOK 750 753 2.00% 2.00% 4.00% 01.10.2014 NIBOR, 3 monthsBrazilian Development Bank EXIM loan BRL 155 519 4.50% 08.10.2012 FixedOther loans 203Total borrowings 7 515Current borrowings 180Non-current borrowings 7 335Total 7 5151) The book value is calculated by reducing the nominal value of NOK 3 122 million by total issue costs related to the new financing of NOK 32 million (NOK 12 million in <strong>2009</strong>). Accrued interest and issue costs related to the bonds are included.2) The margin applicable to the facility is decided by a price grid based on the gearing ratio. Commitment fee is 40 percent of the margin.3) The margin applicable to the facility is decided by a price grid based on the gearing ratio. Commitment fee is 50 percent of the margin.4) The interest rate applicable for the floating rate loans are the interest rate fixed over year end.Norwegian bondsAker Solutions has issued five bonds which mature in one, three (two loans) and four years (two loans). Thebonds which matures in one and three years were issued on 1 December 2006, while the other two bondswere issued on 26 June <strong>2009</strong>. The bonds are denominated in Norwegian kroner and are issued in the Norwegianbond market. Three of the bonds are issued based on a floating interest rate plus a predefined margin.The bonds with notional value of NOK 150 million and NOK 1 913 million have a fixed interest rates of6.0 and 8.7 percent respectively.The bonds are issued with Norsk Tillitsmann as trustee and the loan agreements are based on Norsk Tillitsmann’sstandard loan agreement for such bonds. The bonds are unsecured on a negative pledge basisand include no dividend restrictions.The bonds issued in 2006 are listed on the Oslo Stock Exchange.Bank debtThe bank debt consists of a revolving credit facility of NOK 2 000 million maturing in December 2011 and arevolving credit facility of EUR 750 million maturing in October 2012. The facilities are provided by a syndicateof high quality Nordic and international banks. The EUR 750 million facility was drawn by NOK 2 800million at end of year <strong>2010</strong> whilst the NOK 2 000 million facility remained undrawn. A term loan of NOK 750million maturing in October 2014, established in <strong>2009</strong>, was fully drawn at end of year <strong>2010</strong>. The terms andconditions include restrictions which are customary for these kinds of facilities, including inter alia negativepledge provisions and restrictions for acquisitions, disposals and mergers. There are also certain provisionsof change of control included in the agreements. There are no restrictions for dividend payments – bothrevolving credit facilities and the term loan are unsecured.The financial covenants are based on two sets of key financial ratios; a gearing ratio based on gross debt/EBITDA and an interest coverage ratio based on EBITDA/net finance costs. The financial covenants aretested on a quarterly basis. The margin applicable to the facility is based on a price grid determined by thegearing ratio. See note 5 Financial risk management and exposures for more information regarding capitalrisk in the group.Aker Solutions strategy is to have between 30-50 percent of borrowings at fixed interest rates. To theextent that this is not reflected in the loan agreements, swap transactions are entered into. The revolvingfacility is hedged to fixed rate through an interest rate swap for NOK 1 300 million.
Aker Solutions annual report <strong>2010</strong><strong>Annual</strong> accounts – group57Financial liabilities and the period in which they mature<strong>2010</strong>Amounts in NOK millionBook valueTotal undiscountedcash flow 6 mths and less 6-12 mths 1-2 years 2-5 yearsMore than5 yearsISIN NO 0010341324 (572) (572) - (572) - - -ISIN NO 0010341332 (299) (300) - - - (300) -ISIN NO 0010342587 (150) (150) - - - (150) -ISIN NO 001050461.6 (1 988) (1 913) - - - (1 913) -ISIN NO 001050460.8 (185) (187) - - - (187) -Interest on bonds (955) (226) (50) (236) (443) -Total (3 194) (4 077) (226) (622) (236) (2 993) -Revolving credit facility (EUR 750 million) 1 (2 792) (2 800) - - (2 800) - -Revolving credit facility (NOK 2 000 million) - - - - - - -Total credit facility (2 792) (2 800) - - (2 800) - -Term loan (NOK 750 million) (755) (750) - - - (750) -Brazilian Development Bank EXIM loan (1 365) (1 365) - - (548) (817) -Other loans (118) (118) (28) (26) (44) (8) (12)Interest on revolving credit facility and other bank debt (657) (98) (114) (208) (236) (1)Total borrowings (8 224) (9 767) (352) (762) (3 836) (4 804) (13)<strong>2009</strong>Amounts in NOK millionBook valueTotal undiscountedcash flow 6 mths and less 6-12 mths 1-2 years 2-5 yearsMore than5 yearsISIN NO 0010341324 (570) (572) - - (572) - -ISIN NO 0010341332 (297) (300) - - - (300) -ISIN NO 0010342587 (149) (150) - - - (150) -ISIN NO 001050461.6 (1 953) (1 913) - - - (1 913) -ISIN NO 001050460.8 (185) (187) - - - (187) -Interest on bonds (834) (187) (29) (216) (402) -Total (3 154) (3 956) (187) (29) (788) (2 952) -Revolving credit facility (EUR 750 million) (2 886) (2 900) - - - (2 900) -Revolving credit facility (NOK 2 000 million) - - - - - - -Total credit facility (2 886) (2 900) - - - (2 900) -Term loan (NOK 750 million) (753) (750) - - - (750) -Brazilian Development Bank EXIM loan (519) (516) - - - (516) -Other loans (203) (203) (10) (66) (95) (17) (15)Interest on revolving credit facility and other bank debt (634) (80) (99) (194) (259) (2)Total borrowings (7 515) (8 959) (277) (194) (1 077) (7 394) (17)1) Cash from the sale of principal Process & Construction operations was used to repay all of the EUR 750 million revolving credit as per February 2011. See note 37 Subsequent events for information about the sale.
58 Aker Solutions annual report <strong>2010</strong><strong>Annual</strong> accounts – groupMortgages and guarantee liabilitiesThe group has NOK 26 million in mortgage liabilities (NOK 29 million in <strong>2009</strong>), which are secured bypledges on property, plant and equipment with book values of NOK 26 million.Note 29 Other non-current liabilitiesAmounts in NOK million <strong>2010</strong> <strong>2009</strong>Deferred and contingent considerations 293 676Deferred income 182 -Other 278 215Total 753 891Deferred and contingent considerationsAker Solutions has acquired subsidiaries and non-controlling interest where final consideration isdeferred and to a certain degree dependent on future earnings in the acquired companies. The totalestimated consideration is measured at fair value using a discount rate equal to market rates forborrowings. The discount rate is based on market rates on the acquisition dates and varies between 5and 6.5 percent. Deferred considerations to be paid during 2011 amount to NOK 451 million and arereported as current liabilities, see note 19 Trade and other payables. The deferred and contingentconsiderations reported in other non-current liabilities as of 31 December <strong>2010</strong> relates mainly to theacquisition of Aker Wirth (<strong>2009</strong>), Step Offshore (<strong>2009</strong>), First Interactive (<strong>2010</strong>) and TH GLobal (2006).Deferred incomeDeferred income relates to the estimated gain from disposal of the office building at K2 Eiendom AS. AsAker Solutions is responsible for the completion of the facilities within specific timeframes and budgets,the accounting gain will be booked in 2012 when the buildings are completed. The deferred incomerelated to the 25 percent ownership in K2 Eiendom AS has been deducted directly from the book valueof the investment, see note 25 Investments in associated companies and jointly controlled entities.OtherOther liabilities are mainly liabilities in Aker Insurance AS. Actuary estimated insurance provisions forreported injuries and incurred but not reported injuries amounts to NOK 176 million (NOK 165 million in<strong>2009</strong>).Note 30 Employee benefits - pensionThe group’s pension costs represent the future pension entitlement earned by employees in the financialyear. In a defined contribution plan the company is responsible for paying an agreed contribution to theemployee’s pension assets. In such a plan this annual contribution is also the cost. In a defined benefitplan it is the company’s responsibility to provide a certain pension. The measurement of the cost and thepension liability for such arrangements are subject to actuarial valuations. Aker Solutions has over a longtime period gradually moved from defined benefit arrangements to defined contribution plans. Consequently,the impact of the remaining defined benefit plans is gradually reduced.Pension plans in NorwayThe main pension arrangement in Norway is a general pension plan organised by the Norwegian State.This arrangement provides the main general pension entitlement of all Norwegians. All pension arrangementsby employers, consequently represent limited additional pension entitlements.Norwegian employers are obliged to provide an employment pension plan, which can be organised as adefined benefit plan or as a defined contribution plan. The Norwegian companies have closed the earlierdefined benefit plans in <strong>2008</strong> and are now providing defined contribution plans for all of their employeesunder 60 years of age. Employees who where 58 or more in <strong>2008</strong>, when the change took place, are still inthe defined benefit plan. This is a funded plan and represent most of the funded pension liability reportedin the tables below.In <strong>2008</strong> paid up policies were set up for accrued rights for employees who were moved to the newdefined contribution plan. These paid up policies were provided based on actuarial demographicassumptions required to be used in Norway at the time. It was known that these assumptions would haveto be adjusted and a provision was set up for the anticipated cost of NOK 65 million for this. It has subsequentlybeen appreciated that this cost is being absorbed by the pension fund and the provision isnow released to income statement in <strong>2010</strong>.The annual contribution expensed for the new defined contribution plan was NOK 258 million (NOK 244million in <strong>2009</strong>). Aker Solutions contributions to this plan are at the maixmum level accepted byNorwegian tax legislation.To ensure that the employees were treated fairly on the change over to the new plan the company hasintroduced a compensation plan. The basis for deciding the compensation amount is the differencebetween calculated pension capital in the defined benefit plan and the value of the defined benefit plan atthe age of 67 years. The compensation amount will be adjusted annually in accordance with the adjustmentof the employees’ pensionable income, and accrued interest according to market interest. If theemployee leaves the company voluntarily before the age of 67 years, the compensation amount will bereduced.AFP is an early retirement arrangement organised by Norwegian employers the main Labour Unionorganisation in Norway (LO) and the Norwegian State. The “old AFP” arrangement was established toprovide pension between the age of 62 to 67 for employees who retired before the general retirement ageof 67. In a recent pension reform individual employees are given a choice of retirement age, but withlower pension with earlier retirement. The old AFP arrangement has been stopped and the remainingrecognised obligation of NOK 266 million has been released to the income statement in <strong>2010</strong>. Thisrelease was net of a provision of NOK 74 million to cover underfinancing of current liabilities in “old AFP”.A “new AFP” plan is being established from 2011 to provide additional life long pensions to employeesthat retire early to compensate for the reduction in the ordinary pension entitlements. The NorwegianAccounting Standards Board have issued a comment concluding that the “new AFP” plan is a multiemployerdefined benefit plan. The “new AFP” plan exposes the participating entities to actuarial riskassociated with employees of other entities with the result that there is no consistent and reliable basisfor allocating the obligation, plan assets and costs to individual participating entities. Sufficient informationis not available to use defined benefit accounting and the “new AFP” plan is accounted for as adefined contribution plan.
Aker Solutions annual report <strong>2010</strong><strong>Annual</strong> accounts – group59Pension plans outside NorwayPensions plans outside Norway are predominatly defined contribution plans.Net periodic pension cost (return)Amounts in NOK million <strong>2010</strong> <strong>2009</strong>Defined benefit plansService cost 189 189Interest on projected benefit obligation 113 127Expected return on plan assets (112) (123)Net amortisations and deferrals 105 125Curtailments and settlements (335) -Administration cost 19 14Social security tax 24 29Pension cost defined benefit plans 3 361Pension cost defined contribution plans 417 369Total pension cost 420 730Attributable to continuing operations 352 648Attributable to discontinued operations 68 82Status of pension plans reconciled with the balance sheet<strong>2010</strong>Amounts in NOK million Funded Un funded TotalDefined benefit plansAccumulated benefit obligation 1 906 649 2 555Effect of projected future compensation levels 91 6 97Projected benefit obligation (PBO) 1 997 655 2 652Social security tax on plan assets in excess of (less than) PBO 22 74 96Plan assets at fair value 1 884 3 1 887Plan assets in excess of (less than) PBO (135) (726) (861)Unrecognised net (gain) loss 275 22 297Net employee benefit assets (employee benefit obligations) 140 (704) (564)Reclassified to disposal groups held for sale 41 (53) (12)Total 99 (651) (552)Employee benefit assets 95 - 95Employee benefit obligations 4 (651) (647)Total 99 (651) (552)<strong>2009</strong>Amounts in NOK million Funded Un funded TotalDefined benefit plansAccumulated benefit obligation 2 034 730 2 764Effect of projected future compensation levels 93 99 192Projected benefit obligation (PBO) 2 127 829 2 956Social security tax on plan assets in excess of (less than) PBO 33 106 139Plan assets at fair value 1 825 - 1 825Plan assets in excess of (less than) PBO (335) (935) (1 270)Unrecognised net (gain) loss 409 118 527Net employee benefit assets (employee benefit obligations) 74 (817) (743)Reclassified to disposal groups held for sale - - -Total 74 (817) (743)Employee benefit assets 167 - 167Employee benefit obligations (93) (817) (910)Total 74 (817) (743)Economic assumptionsNorwegian plans <strong>2010</strong> <strong>2009</strong>Discount rate 4.00% 4.40%Asset return 5.40% 6.40%Salary progression 3.75-4.00% 4.00-4.25%Pension indexation 2.50% 3.00%The discount rate is based on the Norwegian ten-year government bond rate. The asset return isexpected to be higher than the discount rate because the assets are invested in instruments with ahigher risk than government bonds. Experience has shown that the rate of return on pension assets hasbeen about 1-2 percent higher than discount rate over an extended period of time.Generally, a one percent increase in the discount rate will lead to approximately 10-15 percent decreasein service cost/projected benefit obligation. This is lower than an expected effect of approximately 20percent as the benefit obligation in Aker Solutions consist mainly of pensioners and employees over 60.Plans outside NorwayBasis for the Canadian plans are a discount rate of 6.25 percent (7.5 percent in <strong>2009</strong>), an expected rateof return on assets of 7.25 percent (7.25 percent in <strong>2009</strong>) and an expected salary increase of 3.5percent (3.5 percent in <strong>2009</strong>).Basis for the German plan is a discount rate of 4.5 percent (5.0 percent in <strong>2009</strong>) and an expected salaryincrease of 2.0 percent (same as in <strong>2009</strong>).
60 Aker Solutions annual report <strong>2010</strong><strong>Annual</strong> accounts – groupMovement in pension obligation and plan asset 1Analyses of the plan assets (Norwegian plans)Amounts in NOK million <strong>2010</strong> <strong>2009</strong>Major categories of plan assets in percent of total plan assets <strong>2010</strong> <strong>2009</strong>Projected benefit obligation as of 1 January 2 956 2 813Service cost incl. cost related to the compensation plan 189 189Interest on projected benefit obligation 113 127Benefits paid by the plan (112) (252)Curtailment and settlement 25 5Acquisition and disposal (352) 11Change in unrecognised (gain) loss (180) 71Currency translation differences 13 (8)Projected benefit obligation as of 31 December 2 652 2 956Plan assets at fair value as of 1 January 1 825 1 872Expected return on plan assets 112 123Contributions paid into the plan 101 99Benefits paid by the plan (73) (254)Curtailment and settlement (4) -Change in unrecognised gain (loss) (58) -Administration costs (19) (15)Currency translation differences 3 -Plan assets at fair value as of 31 December 1 887 1 825Equity instruments 6.0% 4.4%Debt instruments 92.4% 93.9%Other assets 1.6% 1.7%Plan assets 100.0% 100.0%Overview of net pension obligationAmounts in NOK million <strong>2010</strong> <strong>2009</strong> <strong>2008</strong> <strong>2007</strong> 2006Projected benefit obligation 2 652 2 973 2 813 4 350 4 034Plan assets at fair value 1 887 1 826 1 872 2 662 2 438Net pension obligation (765) (1 147) (941) (1 688) (1 596)Change in unrecognised (gain)loss projected benefit obligation (180) 71 18 (40) 615Change in unrecognised gain(loss) plans assets (58) - (159) (199) 1011) Includes disposal groups held for sale and discontinued operations
Aker Solutions annual report <strong>2010</strong><strong>Annual</strong> accounts – group61Note 31 Capital and reservesShare capitalAker Solutions ASA has one class of shares, ordinary shares, with equal rights for all shares. The holdersof ordinary shares are entitled to receive dividends and are entitled to one vote per share at GeneralMeetings. Total outstanding shares are 274 000 000 at par value NOK 2 per share, same as in <strong>2009</strong>. Allissued shares are fully paid.Share buy-backAt the <strong>2007</strong> <strong>Annual</strong> General Meeting authorisation was given to repurchase up to 27.4 million shares,representing 10 percent of the share capital of Aker Solutions ASA. Aker Solutions ASA reduced theshareholdings with 20 067 treasury shares in <strong>2010</strong> and as of 31 December <strong>2010</strong> Aker Solutions ASAholds 4 590 978 treasury shares representing 1.68 percent of total outstanding shares.Summary of purchase and sale of treasury sharesAmounts in NOK million Number of shares ConsiderationTreasury shares as of 1 January <strong>2009</strong> 4 966 830 686Purchase 436 200 20Sale (832 119) (45)Treasury shares as of 31 December <strong>2009</strong> 4 570 911 661Purchase 680 000 57Sale (659 933) (56)Treasury shares as of 31 December <strong>2010</strong> 4 590 978 662The group purchases treasury shares to meet the obligation under the employee share purchase programme.Dividends<strong>2010</strong> <strong>2009</strong>Paid dividend per share (NOK) 2.60 1.60Total dividend paid (NOK million) 700 431Ordinary dividend per share proposed by the Board of Directors (NOK) 2.75 2.60Hedging reserveThe hedging reserve relates to cash flow hedges of future revenues and expenses against exchangerate fluctuations. The income statement effects of such instruments are recognised in accordance withthe progress of the underlying construction contract as part of revenues or expenses as appropriate.The hedging reserve represents the value of such hedging instruments that are not yet recognised in theincome statement. The underlying nature of a hedge is that a positive value on a hedging instrumentexists to cover a negative value on the hedged position, see note 13 Financial income and expenses.Note 32 Earnings per shareAker Solutions ASA holds 4 590 978 treasury shares at year end <strong>2010</strong> (4 570 911 in <strong>2009</strong>). Treasuryshares are not included in the weighted average number of ordinary or diluted shares.Basic earnings per shareThe calculation of basic earnings per share as of 31 December <strong>2010</strong> was based on the profit attributableto ordinary shareholders and a weighted average number of ordinary shares outstanding.<strong>2010</strong> <strong>2009</strong>Profit attributable to ordinary shares (NOK million) 1 957 2 260Profit attributable to ordinary shares from continuing operations(NOK million) 1 605 2 115Issued ordinary shares as of 1 January 274 000 000 274 000 000Weighted average number of issued ordinary shares for the yearadjusted for treasury shares 269 267 952 269 138 497Basic earnings per share (NOK) 7.27 8.40Basic earnings per share for continuing operations (NOK) 5.96 7.86Diluted earnings per shareThe calculation of diluted earnings per share as of 31 December <strong>2010</strong> is based on profit attributable toordinary shareholders and a weighted average number of ordinary shares outstanding after adjustmentfor the effect of rights to receive bonus shares in connection with the employee share purchase programmeand all dilutive potential ordinary shares.<strong>2010</strong> <strong>2009</strong>Profit attributable to ordinary shares (NOK million) 1 957 2 260Profit attributable to ordinary shares from continuing operations(NOK million) 1 605 2 115Weighted average number of issued ordinary shares for the yearadjusted for treasury shares 269 267 952 269 138 497Expected effect of right to receive bonus shares 564 701 175 278Weighted average number of ordinary shares outstanding (diluted)for the year 269 832 653 269 313 775Diluted earnings per share (NOK) 7.25 8.39Diluted earnings per share for continuing operations (NOK) 5.95 7.85Currency translation reserveThe currency translation reserve includes exchange differences arising from the translation of the netinvestment in foreign operations, and foreign exchange gain or loss on loans defined as hedges on netinvestments, see note 13 Financial income and expenses.Net investments have been hedged in <strong>2010</strong> with a gain of NOK 68 million. Accumulated gain on netinvestment hedges from 2005 is NOK 217 million. The net investment hedge in <strong>2010</strong> relates mainly toinvestments in the United States, see note 5 Financial risk management and exposures.
62 Aker Solutions annual report <strong>2010</strong><strong>Annual</strong> accounts – groupNote 33 Financial instrumentsThis note summarises each class of financial instruments and gives an overview of book and fair valueof the group’s financial instruments and the accounting treatment of these instruments. The table belowalso shows on what level in the measurement hierarchy the group’s financial instruments measured atfair value are considered to be in regard to how objective the measuring method is.Assets as of 31 December <strong>2010</strong>Amounts in NOK million Note Level 1 Level 2 Level 3AmortisedcostTotalcarryingamountCash and cash equivalents 3 198 - - - 3 198Investments in other companies 27 - - 157 - 157Derivative financial instruments 21 - 386 - - 386Non-current interest-bearing receivables 24 - - - 225 225Other non-current operating assets - - - 221 221Trade and other receivables 16 - - - 14 870 14 870Current interest-bearing receivables 24 317 300 - 4 621Total loans and receivables 317 300 - 15 320 15 937Total assets classified as financialinstruments 3 515 686 157 15 320 19 678Current assets 3 515 686 - 14 874 19 075Non-current assets - - 157 446 603Total assets 3 515 686 157 15 320 19 678Liabilities as of 31 December <strong>2010</strong>Amounts in NOK million Note Level 1 Level 2 Level 3AmortisedcostTotalcarryingamountDerivative financial instruments 21 - (243) - - (243)Non-current borrowings 28 - - - (7 508) (7 508)Other non-current liabilities 29 - - - (753) (753)Trade and other payables 19 - - - (16 278) (16 278)Current borrowings 28 - - - (716) (716)Total financial liabilities - - - (25 255) (25 255)Total liabilities classified as financialinstruments - (243) - (25 255) (25 498)Current liabilities - (243) - (16 994) (17 237)Non-current liabilities - - - (8 261) (8 261)Total liabilities - (243) - (25 255) (25 498)Assets as of 31 December <strong>2009</strong>Amounts in NOK million Note Level 1 Level 2 Level 3AmortisedcostTotalcarryingamountCash and cash equivalents 3 186 - - - 3 186Investments in other companies 27 - - 135 - 135Derivative financial instruments 21 - 372 - - 372Non-current interest-bearing receivables 24 - - - 184 184Other non-current operating assets - - - 338 338Trade and other receivables 16 - - - 18 332 18 332Current interest-bearing receivables 24 218 206 - 16 440Total loans and receivables 218 206 - 18 870 19 294Total assets classified as financialinstruments 3 404 578 135 18 870 22 987Current assets 3 404 578 - 18 348 22 330Non-current assets - - 135 522 657Total assets 3 404 578 135 18 870 22 987
Aker Solutions annual report <strong>2010</strong><strong>Annual</strong> accounts – group63Liabilities as of 31 December <strong>2009</strong>Amounts in NOK million Note Level 1 Level 2 Level 3AmortisedcostTotalcarryingamountDerivative financial instruments 21 - (345) - - (345)Non-current borrowings 28 - - - (7 335) (7 335)Other non-current liabilities 29 - - - (891) (891)Trade and other payables 19 - - - (19 370) (19 370)Current borrowings 28 - - - (180) (180)Total financial liabilities - - - (27 776) (27 776)Total liabilities classified as financialinstruments - (345) - (27 776) (28 121)Current liabilities - (345) - (19 550) (19 895)Non-current liabilities - - - (8 226) (8 226)Total liabilities - (345) - (27 776) (28 121)The first level in the above table, fair value based on prices quoted in an active market for identicalassets or liabilities, includes cash and financial instruments that are calculated based on observableprices on identical instruments.The second level in the above table, fair value based on price inputs, other than quoted prices, whichare derived from observable market transactions in an active market for identical assets or liabilities,includes currency or interest derivatives and interest bonds. These will typically be when the group usesforward prices on foreign exchange rates or interest rates as inputs to valuation models.The third level in the above table, fair value based on unobservable inputs, includes financial instrumentsfor which fair values are calculated on the basis of input and assumptions that are not fromobservable market transactions. This is typically investments in other companies and pension fund. Thefair value presented in this category are mainly based on internal assumptions. The internal assumptionsare only used in the absence of quoted prices from an active market or other observable priceinputs for the financial instruments subject to the valuation.Loans and receivables and financial liabilitiesLoans and receivables and financial liabilities are measured at amortised cost. Due to the short-termnature, the carrying amount is a reasonable approximation of fair values, with the exception of financialborrowings, which are detailed in the table below.<strong>2010</strong> <strong>2009</strong>Amounts in NOK million Carrying amount Fair value Carrying amount Fair valueBonds 1 3 194 3 236 3 154 3 064Other borrowings 2 5 030 5 033 4 361 4 369Total borrowings 8 224 8 269 7 515 7 4331) Fair value is quoted prices for the bonds noted on the Oslo Stock Exchange. Notional amount is best approximation for the newbonds.2) Credit facilities have floating interest and the notional amount is a reasonable approximation of fair values. Notional values ofother loans are also expected to be a good approximation of fair values.Note 34 Contingent eventsLegal proceedingsGiven the scope of the group’s worldwide operations, group companies are inevitably involved in legaldisputes in the course of their activities. Provisions have been made to cover the expected outcome ofthe disputes in so far as negative outcomes are likely and reliable estimates can be made. However, thefinal outcome of these cases will always be subject to uncertainties, and resulting liabilities may exceedrecorded provisions.Blind FaithAker Solutions has delivered a semi-submersible hull for Chevron Corporation’s Blind Faith platform.The platform has been installed in the Gulf of Mexico, and production started in November <strong>2008</strong>. AkerSolutions has initiated arbitration proceedings regarding compensation for various changes to the workand associated acceleration work. Chevron Corporation has presented various warranty claims andother claims against Aker Solutions and initiated a separate arbitration process in Houston. The disputesrelate to both the contract for the construction and delivery of the hull and the separate contractfor the tow and installation of the platform. Hearings in the two cases are to commence in the first andsecond quarter of 2011 respectively and should be completed in the second or third quarter of 2011. Afinal award is expected in the third quarter of 2011. Although there can be no assurance regarding theoutcome, the expectation is that this will not have a material impact on Aker Solutions’ financial positionor results.
64 Aker Solutions annual report <strong>2010</strong><strong>Annual</strong> accounts – groupNote 35 Number of employees (unaudited)Company Location CountryOwnership(percent) 1<strong>2010</strong> 1 <strong>2009</strong>Energy Development & Services 9 297 9 535Subsea 5 779 5 276Products & Technologies 3 034 3 027Process & Construction 425 3 343Other 909 952Total Aker Solutions employees 19 444 22 133Contract staff 5 370 7 804Total 24 814 29 937Employees in Norway 10 972 11 189Employees outside Norway 8 472 10 944Total Aker Solutions employees 19 444 22 1331) Employees in <strong>2010</strong> is for continuing operations only.Note 36 Group companies as of 31 December <strong>2010</strong>Company Location CountryOwnership(percent) 1Aker Solutions ASA Fornebu Norway 100Aker Advantage Pty Ltd Melbourne Australia 100Aker Marine Contractors Pty Ltd Perth Australia 100Aker Process Systems Pty Ltd Welshpool Australia 100Aker Solutions Australia Pty Ltd Melbourne Australia 100Aker Solutions Oil & Gas Australia Pty Ltd Melbourne Australia 100Aker Subsea Pty Ltd Melbourne Australia 100Aker Wirth Australia Pty Argenton Australia 100Aker Solutions Belgium NV/SA Antwerp Belgium 100Aker Oilfeld Services Ltda Rio de Janeiro Brazil 100Aker Solutions do Brasil Ltda Curitiba Brazil 100Aker Chemetics Offshore Services Inc Vancouver Canada 100Aker Construction Canada Ltd Ontario Canada 100Aker Solutions Canada Inc Vancouver Canada 100Aker Solutions Newfoundland Ltd 2 Newfoundland Canada 100Aker Solutions Oilfield Services Canada Inc Newfoundland Canada 100Aker Solutions Chile S.A. Santiago Chile 100Aker Cool Sorption (Beijing) Technology Co Ltd Beijing China 100Aker E&T (Shanghai) Co Ltd 3 Shanghai China 100Aker Projects (Shanghai) Co Ltd Shanghai China 100Aker Global Employment Ltd Limasol Cyprus 100Aker Solutions Cyprus Ltd Limasol Cyprus 100Aker Cool Sorption AS Glostrup Denmark 100Aker Operations APS Glostrup Denmark 100Aker Offshore OY Pori Finland 100Aker Process Systems SAS Vincennes Cedex France 100Aker Process GmbH Lagenfeld Germany 100Aker Wirth GmbH Erkelenz Germany 100Aker MH (India) Pvt Ltd 7 Mumbai India 100Aker Powergas Pvt Ltd 2 Mumbai India 64Aker Powergas Subsea Pvt Ltd Mumbai India 64PT Aker Solutions E & C Indonesia Snd Bhd Jakarta Indonesia 100PT Aker Solutions Indonesia Jakarta Indonesia 100Aker Engineering International Sdn Bhd Kuala Lumpur Malaysia 100Aker Engineering Malaysia Snd Bhd Kuala Lumpur Malaysia 90Aker Process Systems Asia Pacific Sdn Bhd Shah Akam Malaysia 100Aker Solutions India Snd Bhd Kuala Lumpur Malaysia 100Aker Solutions Malaysia Snd Bhd Kuala Lumpur Malaysia 100Phoenix Polymers Malaysia Ltd Kuala Lumpur Malaysia 100Aker Solutions Asia Pacific Snd Bhd Kuala Lumpur Malaysia 100Aker Solutions (Mauritius) Ltd Port Louis Mauritius 100Aker Solutions SA de CV Lomas de Chaputtepec Mexico 100Aker Advantage BV Gravenhage Netherlands 100Aker Oilfield Services BV Amsterdam Netherlands 100Aker Process BV Zoetermeer Netherlands 100Aker Process Engineering Services BV Maastrichts Netherlands 100Aker Solutions BV Zoetermeer Netherlands 100Aker Solutions Nigeria Ltd Lagos State Nigeria 100Aker Advantage AS Bergen Norway 100Aker Advantage Group AS 4 Fornebu Norway 100Aker Business Services AS Fornebu Norway 100Aker Contracting Russia AS Fornebu Norway 100Aker Egersund AS Egersund Norway 100Aker Elektro AS Stord Norway 100Aker Engineering & Technology AS Fornebu Norway 100Aker Geo AS Stavanger Norway 100Aker Installation FP AS Fornebu Norway 100Aker Insurance AS Fornebu Norway 100Aker Insurance Services AS Fornebu Norway 100Aker Jacket Technology AS Verdal Norway 100Aker Kværner Contracting International (Spain) AS Fornebu Norway 100
Aker Solutions annual report <strong>2010</strong><strong>Annual</strong> accounts – groupCompany Location Country(percent) 1 Company Location Country (percent) 165OwnershipOwnershipAker Kværner Contracting Italy AS Fornebu Norway 100Aker Marine Contractors AS Fornebu Norway 100Aker MH AS Kristiansand Norway 100Aker Midsund Bruk AS 5 Midsund Norway 100Aker O&G Group AS Fornebu Norway 100Aker Offshore Partner AS Stavanger Norway 100Aker Oilfield Services AS Oslo Norway 100Aker Oilfield Services Operations AS Oslo Norway 100Aker Oilfield Services Shipholding AS Oslo Norway 100Aker Operations AS Stavanger Norway 100Aker P&C Americas AS Fornebu Norway 100Aker P&C Europe AS Fornebu Norway 100Aker P&C Group AS Fornebu Norway 100Aker Piping Tecnology AS Verdal Norway 100Aker Porsgrunn AS Porsgrunn Norway 100Aker Process System International AS Fornebu Norway 100Aker Process Systems AS Fornebu Norway 100Aker Pusnes AS Arendal Norway 100Aker Sakkyndig Virksomhet AS Verdal Norway 100Aker Solutions AS Fornebu Norway 100Aker Solutions Contracting AS Lysaker Norway 100Aker Solutions Contracting Kazakhstan AS 2 Fornebu Norway 100Aker Stord AS Stord Norway 100Aker Subsea AS Fornebu Norway 100Aker Subsea Russia AS Fornebu Norway 100Aker Verdal AS Verdal Norway 100Aker Well Service AS Stavanger Norway 100AKOFS 1 AS Oslo Norway 100AKOFS 2 AS Oslo Norway 100AKOFS Angola AS Oslo Norway 100AKOFS Wayfarer AS 2 Fornebu Norway 100AMC Connector AS 6 Oslo Norway 100Dovre Maling AS 2 Verdal Norway 100Drilltech AS Kristiansand S Norway 100First Interactive AS 8 Stavanger Norway 100Hinna Base AS 2 Stavanger Norway 100Jåttåvågen AS Stavanger Norway 93K2 Hotellbygg AS 2 Fornebu Norway 93KB eDesign AS Oslo Norway 100Kværner Engineering AS Abu Dhabi Branch Fornebu Norway 100Kværner Eureka AS Tranby Norway 100Maritime Promeco AS Kristiansand S Norway 100Norwegian Contractors AS Fornebu Norway 100Step Offshore AS Hvalstad Norway 100Subsea Africa AS 2 Oslo Norway 100Vind Sammenstilling AS 2 Verdal Norway 100Aker Solutions Peru SA San Isidro Peru 100Aker <strong>Kvaerner</strong> Caribe LLP San Juan Puerto Rico 98Aker <strong>Kvaerner</strong> Gotech LLC Al-Khobar Saudi Arabia 51Aker Process Gulf Ltd Al-Khobar Saudi Arabia 100Aker MH (Singapore) Pte Ltd Singapore Singapore 100Aker Solutions (Services) Pte Ltd Singapore Singapore 100Aker Solutions Singapore Pte Ltd Singapore Singapore 100Aker Wirth SCS Singapore Pty Singapore Singapore 100Wirth CC Südafrica Germiston South Africa 100Wirth Mining Service Pty Ltd Middelburg South Africa 100Aker Pusnes Korea Co Ltd Busan South Korea 80Pusnes Korea Industries Co Ltd 2 Busan South Korea 100<strong>Kvaerner</strong> Water AB Ørnskjøldsvik Sweden 100Aker Cool Sorption Siam Ltd Rayong Thailand 99Aker Cool Sorption Thailand Ltd Rayong Thailand 100Aker <strong>Kvaerner</strong> (Thailand) Ltd Bangkok Thailand 100Aker <strong>Kvaerner</strong> E&C (Thailand) Ltd Bangkok Thailand 100Aker <strong>Kvaerner</strong> E&C Holdings (Thailand) Ltd Bangkok Thailand 100Aker Advantage Ltd London UK 100Aker Business Services Ltd London UK 100Aker Engineering & Technology Ltd London UK 100Aker MH UK Ltd Aberdeen UK 100Aker Offshore Partner Ltd London UK 100Aker Process Ltd London UK 100Aker Process Systems Ltd Aberdeen UK 100Aker Qserv Ltd Aberdeen UK 100Aker Solutions Angola Ltd Maidenhead UK 100Aker Solutions DC Trustees Ltd London UK 100Aker Solutions E & C International Ltd London UK 100Aker Solutions E&C Ltd Stockton on Tees UK 100Aker Solutions India Ltd Cardiff UK 100Aker Subsea Ltd Maidenhead UK 100Aker Well Services Ltd Aberdeen UK 100Phoenix Polymers International Ltd Aberdeen UK 100Qserv Pipeline & Process Ltd London UK 100Woodfield Systems Co Ltd Kent UK 100Aker <strong>Kvaerner</strong> Well Service LLC Muscat The Emirates 70Aker MH FZE Dubai The Emirates 100
66 Aker Solutions annual report <strong>2010</strong><strong>Annual</strong> accounts – groupCompany Location CountryOwnership(percent) 1Aker Advantage Inc Houston USA 100Aker Business Services Inc Houston USA 100Aker Construction Inc Pensylvania USA 100Aker Field Development Inc Houston USA 100Aker Industrial Constructors Inc Pennsylvania USA 100Aker <strong>Kvaerner</strong> Pharmaceuticals LLC Houston USA 100Aker <strong>Kvaerner</strong> Power Inc Charlotte USA 100Aker <strong>Kvaerner</strong> Process Systems US Inc Houston USA 100Aker <strong>Kvaerner</strong> US LLP Houston USA 100Aker <strong>Kvaerner</strong> Willfab Inc Williamsport USA 100Aker Marine Contractors US Inc Houston USA 100Aker Maritime US Inc Delaware USA 100Aker Metals Inc Tuscon USA 100Aker MH Inc Katy USA 100Aker Michigan Inc Michigan USA 100Aker Oil & Gas US LLC Houston USA 100Aker P&C Inc Houston USA 100Aker P&C US Inc Houston USA 100Aker Solutions Americas Inc Wilmington USA 100Aker Solutions Chile Corporation Houston USA 100Aker Solutions USA Corporation Houston USA 100Aker Strategic Operations Inc Washington USA 100Aker Subsea Inc Houston USA 100Aker US Holdings Inc Houston USA 100Aker Well Services Inc Houston USA 100Aker Wirth International LP Houston USA 90Aker Wirth Management Inc Dover USA 100DSI Constructors Houston USA 100<strong>Kvaerner</strong> Process Services Inc Houston USA 100RIG Specialities Inc Houston USA 100Wirth Service Inc North Charleston USA 100Note 37: Subsequent eventsDividendThe Board of Directors of Aker Solutions will propose an ordinary dividend of NOK 2.75 per share.Completion of sale of its principal Process and Construction businessesAker Solutions has on 1 February 2011 completed the sale of the principal operations within its Processand Construction business area to Jacobs Engineering Group Inc. (Jacobs). As disclosed on 22December <strong>2010</strong>, the transaction does not include the US EPC centre in Houston, and the UnionConstruction business located in the US and Canada. Aker Solutions retains Aker Projects (Shanghai)Company Limited until such time as the requisite regulatory clearances in China have been obtained.The transaction value is estimated to be approximately NOK 5.5 billion (USD 913 million), subject toclosing adjustments Net gain for Aker Solutions compared to book value of the businesses is estimatedto be a total of NOK 2.4 billion (USD 400 million). The purchase price as determined prior to any adjustmentsbased on the closing date balance sheet has been paid in cash, of which USD 30 million to anescrow account pending China regulatory clearance for the sale of Aker Projects (Shanghai) CompanyLimited to Jacobs.Hitachi–Council Bluffs power plantIn February 2011 the rulings from Phase 2 hearings were announced related to the 2003 contract withHitachi America Ltd. Hitachi was awarded damages but the conclusion did not have a material effect onthe financial statements of Aker Solutions.Completion of sale of Aker Marine ContractorsAker Solutions has on 1 March 2011 completed the transfer of ownership of subsidiary Aker MarineContractors (AMC) to Singapore listed Ezra Holdings Ltd. In the transaction, AMC is valued at USD 250million. Ezra has settled the transaction by paying Aker Solutions USD 50 million in cash, USD 100million in shares in Ezra Holdings Ltd, and USD 50 million in a convertible bond with maturity after 36months. The share instruments have been valued on weighted average price per share over the last 30days preceding signing. The final USD 50 million plus interest will be settled in cash on and subsequentto delivery of the AMC Connector vessel. Upon delivery of AMC Connector, Ezra will take 50 percentownership in the vessel owning company. The other half will remain under Aker Solutions ownership.1) Ownership equaling the percentage of voting shares.2) New companies in <strong>2010</strong>3) Changed name from Aker E&C (Shanghai) Co Ltd4) Changed name from Kogas AS5) Changed name from Midsund Bruk AS6) Changed name from AKOFS 4 AS7) Increased ownership from 51 percent in <strong>2009</strong>8) Increased ownership from 60 percent in <strong>2009</strong>
Aker Solutions annual report <strong>2010</strong><strong>Annual</strong> accounts – Aker Solutions ASA67Aker Solutions ASAIncome statement 1.1 – 31.12Aker Solutions ASABalance sheet 1.1 – 31.12Amounts in NOK million Note <strong>2010</strong> <strong>2009</strong>Operating revenue 48 18Operating expenses 2 (237) (113)Operating loss (189) (95)Income from investments in subsidiaries 3 018 900Net financial items 3 384 307Profit before tax 3 213 1 112Income tax expense 4 (60) (60)Profit for the period 3 153 1 052Profit for the period distributed as follows:Proposed dividends 741 701Other equity 2 412 351Profit for the period 3 153 1 052Group contribution against investment in shares 187 260Amounts in NOK million Note <strong>2010</strong> <strong>2009</strong>AssetsDeferred tax asset 4 37 16Investments in group companies 5 7 256 7 071Non-current interest-bearing receivables from group companies 7 8 000 13 993Other non-current interest-bearing receivables 8 220 178Total non-current assets 15 513 21 258Current interest-bearing receivables from group companies 7 10 791 3 770Non-interest bearing receivables from group companies 7 3 310 1 469Other current receivables 9 486 326Cash in cash pool system 7 298 1 100Total current assets 14 885 6 665Total assets 30 398 27 923Equity and liabilitiesIssued capital 548 548Treasury shares (9) (9)Share premium reserve 4 279 4 279Other equity 5 911 3 509Total equity 6 10 729 8 327Non-current borrowings 10 6 169 6 689Total non-current borrowings 6 169 6 689Current borrowings 10 572 104Current borrowings from group companies 7 11 111 10 918Provision for dividend 6 741 701Non interest-bearing liabilities from group companies 7 730 821Other current liabilities 9 346 363Total current liabilities 13 500 12 907Total liabilities and equity 30 398 27 923Fornebu, 9 March 2011Board of Directors and President & CFO of Aker Solutions ASAØyvind Eriksen Lone Fønns Schrøder Kjell Inge Røkke Vibeke Hammer Madsen Mikael Lilius Ida HelliesenChairmanAtle Teigland Åsmund Knutsen Arild Håvik Arve Toft Leif Hejø BorgePresident & CFO
68 Aker Solutions annual report <strong>2010</strong><strong>Annual</strong> accounts – Aker Solutions ASAAker Solutions ASAStatement of cash flow 1.1 – 31.12Aker Solutions ASANotes to the financial statementsAmounts in NOK million <strong>2010</strong> <strong>2009</strong>Note 1Accounting principlesProfit before tax 3 213 1 112Changes in other net operating assets (3 685) (525)Net cash from operating activities (472) 587Proceeds from borrowings - 2 850Repayment of borrowings (100) (2 480)Changes in net borrowings from group companies 470 (856)Proceeds from employees share purchase program 56 46Repurchase of treasury shares (56) (20)Dividends to shareholders (700) (431)Net cash from financing activities (330) (891)Net increase (decrease) in cash and bank deposits (802) (304)Cash in cash pool system at the beginning of the period 1 100 1 404Cash in cash pool system at the end of the period 1 298 1 1001) Unused credit facilities in NOK and EUR amounted to NOK 5.1 billion as described in note 10 borrowings.Aker Solutions ASA is a company domiciled in Norway. The accounts are presented in conformity withNorwegian legislations and Norwegian generally accepted accounting principles.Investment in subsidiaries and associatesInvestments in subsidiaries and associates are accounted for using the cost method in the parent companyaccounts. The investments are valued at cost less impairment losses. Write-down to fair value areaccording to good accounting practice recognised when the impairment is considered not to be temporaryand reversed if the basis for the write-down is no longer present.Dividends and other distributions are recognised as income the same year as they are appropriated inthe subsidiary. If the dividend exceeds accumulated profits in the subsidiary after the day of acquisitionthe payment is treated as a reduction of the carrying value of the investment.Classification and valuation of balance sheet itemsCurrent assets and current liabilities include items due within one year or items that are part of theoperating cycle. The rest is classified as fixed assets/non-current debt.Current assets are valued at the lowest of cost and fair value. Current debt is valued at nominal value atthe time of recognition.Fixed assets are valued at cost less accumulated depreciation, but are written down to fair value ifimpairment is not expected to be temporary. Non-current debts are initially valued at transaction valueless attribute transaction cost. Subsequent to initial recognition, interest-bearing long-term debt isstated at amortised cost with any difference between cost and redemption value being recognised inthe income statement over the period of the borrowing on an effective interest basis.Trade receivables and other receivables are recognised at nominal value less provision for expectedlosses. Provision for expected losses is considered on an individual basis.The cash flow statement is established according to the indirect method. Cash in cash pool system isthe parent company’s cash as well as net deposits from subsidiaries in the group cash pooling systemsowned by the parent company. Correspondingly, the parent company’s current debt to group companieswill include the same net deposits in the group’s cash pooling system.Costs for purchase of own shares including transaction costs are accounted for directly against equity.Sale of own shares are done according to stock- exchange quotations at the time of award andaccounted for as increase in equity.Foreign currency and interest swapsCash, receivables and foreign currency debt are valued at the exchange rate at the end of the fiscalyear. Subsidiaries have entered into agreements with the parent company to hedge their foreignexchange exposure. In the parent company, this risk is hedged in the external financial markets. Allagreements are booked at fair value with any gains or losses booked against the income statement.In order to reduce the financial market exposure, interest swap agreements are entered. The marketvalue of interest rate swaps classified as cash flow hedging (from floating to fixed interest) is accountedfor directly against equity and reflected in the profit and loss in line with the future interest. The value of
Aker Solutions annual report <strong>2010</strong><strong>Annual</strong> accounts – Aker Solutions ASA69interest rate swaps classified as fair value hedging (from fixed to floating interest) is accounted forthrough profit and loss. At the same time is a corresponding adjustment to the carrying value of theborrowing accounted for.TaxTax expense in the income statement comprises current tax and changes in deferred tax. Deferred taxis calculated as 28 percent of temporary differences between accounting and tax values as well as anytax losses carry forward at the year end. Net deferred tax assets are recognised only to the extent it isprobable that they will be utilised against future taxable profits.Note 2Operating expensesThere are no employees in Aker Solutions ASA and hence no salary or pension related costs and alsono loan or guarantees related to the executive management team. Group management and corporatestaff are employed by other Aker Solutions companies and costs for their services as well as other parentcompany costs are charged to Aker Solutions ASA. Remuneration to and shareholding of actingmanaging director Leif Hejø Borge, is described in note 10 Salaries, wages and social security costs inthe consolidated accounts.Fees to KPMG for statutory audit of the parent company amounted to NOK 3 million and fees for otherassurance services amounted to NOK 1.4 million excluding VAT.Note 3Net financial itemsNote 4 TaxAmounts in NOK million <strong>2010</strong> <strong>2009</strong>Calculation of taxable incomeProfit before tax 3 213 1 112Group contribution without tax (3 000) (900)Permanent differences 1 -Change in timing differences 57 439Transferred to (utilisation of) tax loss carried forward - (289)Taxable income 271 362Positive and (negative) timing differencesWrite down on current interest-bearing receivables from group companies (197) (12)Unrealised gain(loss) on forward exchange contracts 93 (35)Interest rate swaps (27) (11)Basis for deferred tax (131) (58)Deferred tax in income statement 29 13Deferred tax in equity 8 3Deferred tax asset 37 16Amounts in NOK million <strong>2010</strong> <strong>2009</strong>Interest income from group companies 926 845Interest expense to group companies (144) (137)Net interest group companies 782 708Interest income from external companies 10 7Interest expense to external (417) (415)Net interest external (407) (408)Tax expenseOrigination and reversal of temporary differences in income statement 16 122Benefit of tax losses recognised - (80)Payable tax (73) (101)Withholding tax paid (3) (1)Total tax expense in income statement (60) (60)Write-down on financial fixed assets (185) (12)Other financial income 4 4Other financial expense (57) -Net foreign exchange gain 247 15Net other financial items 194 19Net financial items 384 307
70 Aker Solutions annual report <strong>2010</strong><strong>Annual</strong> accounts – Aker Solutions ASANote 5Investments in group companiesNote 6Shareholders’ equityAmounts in NOK millionRegisteredofficeSharecapitalNumber ofsharesheldBookvaluePercentageowner-/voting shareAker P&C Group AS Fornebu, Norway 500 500 000 1 067 100%Aker O&G Group AS Fornebu, Norway 1 110 1 110 000 5 870 100%Aker Oilfield Services AS 1 Oslo, Norway 321 10 379 470 319 32.29%Total investments in group companies 7 2561) The remaining 67,71 percent of the shares in Aker Oilfield Services AS are held by Aker Solutions AS meaning that AkerSolutions ASA direct and indirect owns 100 percent of the shares.Aker Solutions ASA has in <strong>2010</strong> given group contributions with tax to tier-subsidiaries. The equity valueof these are booked against the shares in the subsidiaries holding these tier-subsidiaries. Thereby thevalue of the shares in Aker O&G Group AS are increased by NOK 138 million and the shares in AkerOilfield Services AS are increased by NOK 49 million.Amounts in NOK millionSharecapitalOwnsharesSharepremiumOtherequityEquity as of 1 January <strong>2009</strong> 548 (10) 4 279 3 105 7 922Change in <strong>2008</strong> dividend (1) (1)Shares issued to employees troughshare program 2 44 46Share buy back (1) (19) (20)Profit for the period 1 052 1 052Proposed dividend (701) (701)Cash flow hedge 1 29 29Equity as of 31 December <strong>2009</strong> 548 (9) 4 279 3 509 8 327Change in <strong>2009</strong> dividend 1 1Shares issued to employees throughshare program 2 1 55 56Share buy back 3 (1) (55) (56)Profit for the period 3 153 3 153Proposed dividend (741) (741)Cash flow hedge 1 (11) (11)Equity as of 31 December <strong>2010</strong> 548 (9) 4 279 5 911 10 729Total1) The value of interest swap agreements changing interest from floating to fixed interest is recognised directly in equity and will bereleased to income together with the corresponding interest expense.2) The Board of Directors of Aker Solutions ASA has approved a share purchase program for employees . Employees participatingin the program are committed to a monthly saving and the number of shares awarded are dependent of the share price at thetime of award. Participants still holding the shares at the date for award of bonus shares will receive one share for every twoshares bought under the program. The costs of the program are covered by each company.Bonus share award for the March <strong>2009</strong> to February <strong>2010</strong> program will take place in September 2011. The number of participartare 4 034 with 1 016 570 shares bought under the program still held by end of <strong>2010</strong> thereby giving right to 508 285 bonusshares. Bonus share award for the March <strong>2010</strong> to February 2011 program will take place in September 2012. The number ofparticipants are 3 685 with 475 314 shares bought under the program still held by end of <strong>2010</strong> thereby giving right to 237 657bonus shares.3) During <strong>2010</strong> a total of 680 000 own shares have been acquired in the market. The number of own shares held by end of <strong>2010</strong>were 4 590 978 and are held for the purpose of being used for future awards under the share saving program for employees, assettlement in future corporate acquisitions or for other purpose as decided by the Board of Directors.Proposed dividend exclude dividend on owns shares held as of 31 December.The share capital of Aker Solutions ASA is divided into 274 000 000 shares with a nominal value of NOK2. The shares can be freely traded. An overview of the company’s largest shareholders is to be found inpage 78 Share and shareholder information.
Aker Solutions annual report <strong>2010</strong><strong>Annual</strong> accounts – Aker Solutions ASA71Note 7Receivables and borrowings from group companiesNote 8Other non-current interest-bearing receivablesAmounts in NOK million <strong>2010</strong> <strong>2009</strong>Amounts in NOK million <strong>2010</strong> <strong>2009</strong>Group companies deposits in the cash pool system 8 687 9 076Group companies borrowings in the cash pool system (138) (213)Aker Solutions ASA's net borrowings in the cash pool system (8 251) (7 763)Cash in cash pool system 298 1 100Current interest-bearing receivables from group companies 10 791 3 770Non-current interest-bearing receivables from group companies 8 000 13 993Current borrowings from group companies (11 111) (10 918)Other net interest-bearing receivables from group companies 7 680 6 845Non interest-bearing receivables from group companies 3 310 1 469Current non interest-bearing borrowings from group companies (730) (821)Net non interest-bearing receivables from group companies 2 580 648Total net receivables from group companies 10 558 8 593All current receivables/borrowings are due within one year.Aker Solutions ASA is the owner of the cash pool system arrangements with DnBNOR, Nordea, TheRoyal Bank of Scotland and Banc Itau. The cash pool systems cover a majority of the group geographicallyand assure good control and access to the group’s cash. Group companies’ participation in thecash pool systems are decided by each company’s Board of Directors and confirmed by a statement ofparticipation. The participants in the cash pool system are joint and several liable and it is thereforeimportant that Aker Solutions as a group is financially viable and can repay deposits and carry outtransactions. Any debit balance on a sub account can be set-off against any credit balance. A debitbalance does hence represent a claim on Aker Solutions ASA and a credit balance a borrowing fromAker Solutions ASA.Other non-current interest-bearing receivables 220 178Total other non-current interest-bearing receivables 220 178Other interest-bearing receivables consist of loans to the two jointly controlled companies, Caspian SeaSolutions BV of NOK 8 million and Aker Dof Deepwater AS of NOK 210 million. In addition to this theycomprise a deposit in Stiftelsen Aker Solutions Kompensasjonsording of NOK 2 million.Note 9Other current receivables and current liabilitiesAmounts in NOK million <strong>2010</strong> <strong>2009</strong>Other current receivables 486 326Other current liabilities (346) (363)Net other current receivables and liabilities excluding tax and dividend 140 (37)Dividend (741) (701)Deferred tax assets 37 16Deferred tax liabilities - -Net other current liabilities (564) (722)Other current receivables and other current liabilities include unrealised forward exchange contractswith external counterparts as well as unrealised receivables and losses related to interest rate swapsand accrued costs as described in note 12 Financial risk management and financial instruments.The cash pool systems were showing a net balance of NOK 298 million per 31 December. This amountis reported in Aker Solutions ASA’s accounts as short term borrowings from group companies and ascash in cash pool system.Aker Solutions ASA is the group’s central treasury function and enters into borrowings and depositagreements with group companies. Deposits and borrowings are done at market terms and aredependent of the group companies’ credit rating and the duration of the borrowings.Other current receivables and other current liabilities include unrealised forward exchange contractswith group companies as described in note 12 Financial risk management and financial instruments aswell as receivables and liabilities related to NOK 3 018 million in group contributions received and NOK258 million in group contributions paid and other short term group receivables/liabilities.
72 Aker Solutions annual report <strong>2010</strong><strong>Annual</strong> accounts – Aker Solutions ASANote 10 BorrowingsContractual terms of group’s interest-bearing loans and borrowings which are measured at amortised cost. For more information about the the group’s exposure to interest rates, foreign currency and liquidity risk, seenote 12 Financial risk management and financial instruments.<strong>2010</strong>Amounts in million Currency Nominal currency value Book value Interest rate 4 Fixed interest margin Interest coupon Maturity date Interest termsISIN NO 0010341324 NOK 572 572 2.51% 1.05% 3.56% 01.12.2011 Floating, 3 monthsISIN NO 0010341332 NOK 300 299 2.51% 1.35% 3.86% 01.12.2013 Floating, 3 monthsISIN NO 0010342587 NOK 150 150 6.00% 6.00% 01.12.2013 Fixed, annualISIN NO 001050461.6 NOK 1 913 1 988 8.70% 8.70% 26.06.2014 Fixed, annualISIN NO 001050460.8 NOK 187 185 2.62% 4.75% 7.37% 26.06.2014 Floating, 3 monthsTotal bonds 1 3 194Revolving credit facility EUR 750 2 792 2.40% 0.73% 25.10.2012 LIBOR + Margin 2Revolving credit facility NOK 2 000 - 1.75-2.50% 19.12.2011 LIBOR + Margin 3Total credit facility 2 792Term loan NOK 750 755 2.58% 2.00% 4.58% 01.10.2014 NIBOR, 3 monthsTotal borrowings 6 741Current borrowings 572Non-current borrowings 6 169Total 6 741<strong>2009</strong>Amounts in million Currency Nominal currency value Book value Interest rate 4 Fixed interest margin Interest coupon Maturity date Interest termsISIN NO 0010341324 NOK 572 570 2.01% 1.05% 3.06% 01.12.2011 Floating, 3 monthsISIN NO 0010341332 NOK 300 297 2.01% 1.35% 3.36% 01.12.2013 Floating, 3 monthsISIN NO 0010342587 NOK 150 149 6.00% 6.00% 01.12.2013 Fixed, annualISIN NO 001050461.6 NOK 1 913 1 953 8.70% 8.70% 26.06.2014 Fixed, annualISIN NO 001050460.8 NOK 187 185 2.13% 4.75% 6.88% 26.06.2014 Floating, 3 monthsTotal bonds 1 3 154Revolving credit facility EUR 750 2 886 0.83% 25.10.2012 LIBOR + Margin 2Revolving credit facility NOK 2 000 - 1.75-2.50% 19.12.2011 LIBOR + Margin 3Total credit facility 2 886Term loan NOK 750 753 2.00% 2.00% 4.00% 01.10.2014 NIBOR, 3 monthsTotal borrowings 6 793Current borrowings 104Non-current borrowings 6 689Total 6 7931) The book value is calculated by reducing the nominal value of NOK 3 122 million by total issue costs related to the new financing of NOK 32 million (NOK 12 million in <strong>2009</strong>). Accrued interest and issue costs related to the bonds is included.2) The margin applicable to the facility is decided by a price grid based on the gearing ratio. Commitment fee is 40 percent of the margin.3) The margin applicable to the facility is decided by a price grid based on the gearing ratio. Commitment fee is 50 percent of the margin.4) The interest rate applicable for the floating rate loans are the interest rate fixed over year end.
Aker Solutions annual report <strong>2010</strong><strong>Annual</strong> accounts – Aker Solutions ASA73Norwegian bondsAker Solutions has issued five bonds which mature in one,three (two loans) and four years (two loans). The bondswhich matures in one and three years were issued on 1December 2006, while the other two bonds were issuedon 26 June <strong>2009</strong>. The bonds are denominated inNorwegian kroner and are issued in the Norwegian bondmarket. Three of the bonds are issued based on a floatinginterest rate plus a predefined margin. The bonds withnotional value of NOK 150 million and NOK 1 913 millionhave a fixed interest rates of 6.0 and 8.7 percentrespectively.The bonds are issued with Norsk Tillitsmann as trusteeand the loan agreements are based on Norsk Tillitsmann’sstandard loan agreement for such bonds. The bonds areunsecured on a negative pledge basis and include nodividend restrictions.The bonds issued in 2006 are listed on the Oslo StockExchange.Bank debtThe bank debt consists of two revolving credit facilities ofEUR 750 million with initial maturity in October 2012 andNOK 2 000 million maturing in December 2011. The facilitiesare provided by a bank syndicate consisting of Nordicand high quality international banks. The EUR 750 millionfacility was drawn to NOK 2 800 million at year end <strong>2010</strong>and the NOK 2 000 million facility was undrawn. In addition,a credit facility of NOK 750 million with initial maturityin October 2014 was established in <strong>2009</strong> and was fullydrawn at December <strong>2010</strong>. The terms and conditionsinclude restrictions which are customary for this kind offacility, including inter alia negative pledge provisions andrestrictions on acquisitions, disposals and mergers. Thereare also certain changes of control provisions included.The facility includes no dividend restrictions and is unsecured.The financial covenants are based on two sets of keyfinancial ratios; a gearing ratio based on gross debt/EBITDA and an interest coverage ratio based on EBITDA/net finance costs. The financial covenants are tested on aquarterly basis. The margin applicable to the facility isbased on a price grid determined by the gearing ratio. Seenote 5 Financial risk management and exposures to theconsolidated accounts for more information regardingcapital risk in the group.Aker Solutions strategy is to have between 30-50 percentof borrowings at fixed interest rates. To the extent that thisis not reflected in the loan agreements, swap transactionsare entered into. The revolving facility is hedged to fixedrate through an interest rate swap for NOK 1 300 million.Financial liabilities and the period in which they mature<strong>2010</strong>Amounts in NOK millionBook valueTotal undiscountedcash flow6 mthsand lessISIN NO 0010341324 (572) (572) - (572) -ISIN NO 0010341332 (299) (300) - - - (300)ISIN NO 0010342587 (150) (150) - - - (150)ISIN NO 001050461.6 (1 988) (1 913) - - - (1 913)ISIN NO 001050460.8 (185) (187) (187)Interest on bonds (955) (226) (50) (236) (443)Total (3 194) (4 077) (226) (622) (236) (2 993)Revolving credit facility (EUR 750 million) 1 (2 792) (2 800) - - (2 800)Revolving credit facility (NOK 2 000 million) - - - - - -Total credit facility (2 792) (2 800) - - (2 800) -Term loan (NOK 750 million) (755) (750) - - - (750)Interest on revolving credit facility and other bank debt (513) (68) (81) (150) (214)Total borrowings (6 741) (8 140) (294) (703) (3 186) (3 957)<strong>2009</strong>Amounts in NOK millionBook valueTotal undiscountedcash flow6 mthsand lessISIN NO 0010341324 (570) (572) - - (572) -ISIN NO 0010341332 (297) (300) - - - (300)ISIN NO 0010342587 (149) (150) - - - (150)ISIN NO 001050461.6 (1 953) (1 913) - - - (1 913)ISIN NO 001050460.8 (185) (187) (187)Interest on bonds (834) (187) (29) (216) (402)Total (3 154) (3 956) (187) (29) (788) (2 952)Revolving credit facility (EUR 750 million) (2 886) (2 900) - - - (2 900)Revolving credit facility (NOK 2 000 million) - - - - - -Total credit facility (2 886) (2 900) - - - (2 900)Term loan (NOK 750 million) (753) (750) - - - (750)Interest on revolving credit facility and other bank debt (550) (66) (80) (166) (238)Total borrowings (6 793) (8 156) (253) (109) (954) (6 840)1) Cash from the sale of the Process & Construction business was used to repay all of the EUR 750 million revolving credit as per February 2011. Se note 7 Disposal groups anddiscontinued operations to the consolidated accounts for information about sale.6-12mths6-12mths1-2years1-2years2-5years2-5years
74 Aker Solutions annual report <strong>2010</strong><strong>Annual</strong> accounts – Aker Solutions ASANote 11 GuaranteesAmounts in NOK million <strong>2010</strong> <strong>2009</strong>Parent company guarantees to group companies 1 80 912 37 341Counter guarantees for bank/surety bonds 2 7 672 7 284Total 88 584 44 6251) Parent Company Guarantees to support subsidiaries in contractual obligations towards clients.2) Bank guarantees and surety bonds are issued on behalf of Aker Solutions subsidiaries, and counter indemnified by AkerSolutions ASA.Note 12 Financial risk management and financial instrumentsCurrency risk and balance sheet hedging<strong>2010</strong> <strong>2009</strong>Amounts in NOK million Assets Liabilities Assets LiabilitiesOptions 8 (7) 1 (2)Forward exchange contracts with group companies 244 (378) 353 (370)Forward exchange contracts with external counterparts 419 (187) 274 (290)Total 671 (572) 628 (662)Aker Solutions ASA enters into approximately 10 000 currency hedging contracts with subsidiaries ayear at a total value of about NOK 59 billion. Large contracts are hedged back-to-back with externalbanks, while minor contracts are hedged after internal netting. Contracts that are hedged directlyrepresents about 80% of the total exposure but only a small number of the total contracts. The treasuryfunction within Aker Solutions ASA has a mandate to hold small positions in the currency and interestmarkets. The mandate has limits that are strictly defined and is operated under a strict stop-lossregime. Open positions are continuously monitored at a market to market basis. All instruments arebooked at fair value as per 31 December.Equity investments in foreign subsidiaries are normally not hedged.Interest rate risk<strong>2010</strong> <strong>2009</strong>Amounts in NOK million Assets Liabilities Assets LiabilitiesInterest rate swaps - cash flow and fair value hedge 61 (31) 2 (28)Interest rate swaps not subject to hedge accounting - - 4 (4)Total 61 (31) 6 (32)According to internal policy should about 30-50 percent of the company’s gross external borrowing beat fixed interest rates with duration according to the remaining duration of the borrowing. As per yearend about 31% of the external borrowings were at fixed interest. Hedge accounting is applied throughboth cash flow and fair value hedging. As of 31 December <strong>2010</strong>, Aker Solutions group had one bond ofNOK 150 million with fixed interest rates at 6 percent and one bond of NOK 1 913 million with fixedinterest rate of 8.7 percent. At year end, there were interest rate swaps with floating interest hedgingNOK 1 100 million of the fixed interest bonds. In addition, Aker Solutions had three bonds totalling NOK1 056 million at floating interest rates and hereof NOK 400 million were swapped to fixed interest. NOK1 300 million of drawings under committed facilities are swapped to 12 months fixed rate from 15 January<strong>2010</strong>. A credit facility of NOK 750 million with floating interest was established in <strong>2009</strong> where NOK375 million are swapped to fixed interest.Floating interest is mainly tied to NIBOR and LIBOR. Hedge accounting is applied using the cash flowhedge accounting model which means that gains and losses on interest rate swap from floating to fixedinterest rates as of 31 December <strong>2010</strong> are recognised in the hedging reserve in equity and will be continuouslyreleased to the income statement until the repayment of the bank borrowings. The value ofinterest rate swaps classified as fair value hedging (from fixed to floating interest) is accounted forthrough profit and loss. At the same time is a corresponding adjustment to the carrying value of theborrowing accounted for.Credit riskCredit risk relates to loans to subsidiaries and associated companies, overdraft in the group cash pool,hedging contracts, guarantees to subsidiaries and deposits with external banks. Loans to subsidiariesare assessed by the internal credit committee. Loss provisions are made in situations of negative equityand were the company is not expected to be able to fulfil it’s loan obligations from future earnings.External deposits and forward contracts are done according to a list of approved banks and primarilywith banks were the company also have a borrowing relation. The existence of netting agreementsbetween Aker Solutions ASA and the relations banks reduces the credit risk.Liquidity riskLiquidity risk relates to the risk that the company will not be able to meet its debt and guarantee obligationsand are managed through maintaining sufficient cash and available credit facilities. The developmentin the groups and thereby Aker Solutions ASA available liquidity is continuously monitoredthrough weekly and monthly cash forecasts, annual budgets and long term planning.Note 13 Related partiesAker Solutions ASA’s contract with Intellectual Property Holding AS and agreement with Aker ASAregarding pension obligation in US are described in note 8 Related parties to the consolidatedaccounts.Note 14 ShareholdersAs of 31 December <strong>2010</strong>Shareholders with more than 1 percent shareholdingCompany Nominee Number of shares held OwershipAker Holding AS 110 333 615 40.27%Folketrygdfondet 10 802 522 3.94%State Street Bank & Trust Co x 10 568 829 3.86%JPMorgan Chase Bank x 8 110 997 2.96%Bank of New York Mellon x 7 348 640 2.68%The Nortern Trust C.O. x 4 951 919 1.81%State Street Bank & Trust Co x 4 830 832 1.76%JPMorgan Chase Bank x 4 773 864 1.74%Aker Solutions ASA 4 590 978 1.68%Fidility Fund-Europ.Growth 4 382 723 1.60%Clearstream Banking x 4 124 671 1.51%
Aker Solutions annual report <strong>2010</strong>Auditor’s report75
76 Aker Solutions annual report <strong>2010</strong>Share and shareholder informationShare and shareholder informationAker Solutions is committed to maintaining an open and direct dialogue with itsinvestors, analysts and the financial market in general.One goal is that the share price will reflectthe company’s underlying value by makingall share price-relevant informationavailable to the market at the right time.Weight is also given to equal treatment ofthe various players in the financial marketconcerning access to such information.Aker Solutions’ objective is that its shareholderswill achieve a competitive return ontheir shares over time through a combinationof dividend, share buy-backs and therise in the share price.The Aker Solutions share is listed on theOslo Stock Exchange’s main OBX list(ticker: AKSO), and is registered in theNorwegian Central Securities Depositorywith DnB NOR Bank as registrar. ItsShareholdersBy geographical areaas of 31 Dec. <strong>2010</strong>Luxembourg 5.9%Others 5.2%Aker Holding 40.3%Aker Solutions 1.7%Norway other 17.9%US 18.2%UK 10.9%securities registration number is ISINNO0010215684. Aker Solutions ASA waslisted on the Oslo Stock Exchange on2 April 2004.The share in <strong>2010</strong>The closing share price as of 31 December<strong>2010</strong> was NOK 99.25, which gave the companya total market capitalisation of NOK27.2 billion (20.7 billion as of year end<strong>2009</strong>). A total of 502.3 million AkerSolutions shares were traded during <strong>2010</strong>,representing 3.1 times the company’s freelytradable stock. The latter amounted to59.73 percent of total issued shares in<strong>2009</strong>, with the remaining 40.27 percentowned by Aker Holding AS. The share wastraded on all the 252 possible trading days.The average daily volume traded was 2.0million shares, which represents a turnoverrate of 183.3 percent.Shares and share capitalAker Solutions ASA has 274 000 000ordinary shares with a par value of NOK 2(see the consolidated financial statementson page 23). Aker Solutions has a singleshare class and each share carries one vote.The company owned 4 590 978 of its own(treasury) shares at 31 December <strong>2010</strong>, or1.7 percent of the total. No shares wereissued in <strong>2010</strong>.Indexed share price development in NOK■ Aker Solutions ■ Oslo Børs benchmark index2502001501005001 Jan20061 July20061 Jan<strong>2007</strong>1 July<strong>2007</strong>1 Jan<strong>2008</strong>1 July<strong>2008</strong>Key figures for the Aker Solutions share <strong>2010</strong>1 Jan<strong>2009</strong>1 July<strong>2009</strong>1 Jan<strong>2010</strong>31 Dec<strong>2010</strong><strong>2010</strong> <strong>2009</strong>Highest closing share price NOK 104.4 77.2Lowest closing share price NOK 68.9 29.40Average closing share price NOK 85.8 53.09Closing price as of 31 Dec. NOK 99.25 75.45Market capitalisation as of 31 Dec. NOK million 27 194 20 673Daily turnover No. of shares 1 993 282 2 380 833Turnover ratio Percent 183.3 218.1Own (treasury) shares as of 31 Dec. No. of shares 4 590 978 4 643 285Shares issued and outstanding as of 31 Dec. No. of shares 274 000 000 274 000 000Basic earnings per share NOK 8.40Earnings per share continuing operations NOK 8.39Credit rating Fitch BBB- BBB-Non-Norwegian shareholders Percent 43.5 45.0Source: Norwegian Central SecuritiesDepository (VPS)
Aker Solutions annual report <strong>2010</strong>Share and shareholder information77Shareholder structureAker Solutions had 10 584 shareholders asof 31 December <strong>2010</strong>, of whom 1 470 (13.9percent) were non-Norwegian. At year end43.5 percent of the shares were owned byforeign investors, a slight decrease from 45percent the year before. 70.8 percent of theshare capital was owned by the company’s20 largest shareholders at year end <strong>2010</strong>.The largest shareholder in Aker Solutions isAker Holding AS, which owned 40.27percent of the shares as of 31 December<strong>2010</strong>. Aker ASA holds a controlling 60percent stake in Aker Holding. TheNorwegian Government owns 30 percent ofAker Holding’s shares and Swedishcompanies SAAB AB and Investor AB hold7.5 percent and 2.5 percent respectively.For more information on the principalshareholder, see the chapter concerningcorporate governance on page 82.Dividend policyThe company’s goal is that the averagedividend over time should amount to 30-50percent of the Aker Solutions group’s netprofit through cash payments and/or sharebuy-backs. The size of the dividend isassessed in relation to alternative uses forthe funds and the desire to continuestrengthening the financial structure. TheBoard will propose to the <strong>Annual</strong> GeneralMeeting that a total dividend of NOK 2.75per share be paid for <strong>2010</strong>, correspondingto 38 percent of the net annual profit pershare. The dividend will be paid out toshareholders of record on the date of the<strong>Annual</strong> General Meeting.The following table shows the dividendsper share paid by Aker Solutions for theperiod <strong>2007</strong>–<strong>2010</strong>:YearDividend<strong>2007</strong> NOK 3.00<strong>2008</strong> NOK 1.60<strong>2009</strong> NOK 2.60<strong>2010</strong> – Proposed NOK 2.75Current board mandatesThe <strong>Annual</strong> General Meeting of AkerSolutions held on 8 April <strong>2010</strong> mandatedthe board of directors to acquire the company’sown shares up to a total par value ofNOK 54 800 000. This mandate also coversthe use of treasury shares as security. Thelowest price per share to be paid under thismandate is NOK 1, the highest is NOK 300.The board is otherwise free to determinethe way in which treasury shares should bebought or sold. The mandate is valid untilthe 2011 <strong>Annual</strong> General Meeting or until30 June 2011, whichever occures first.Acquisition of own sharesThe company’s share buy-back programmecontinued under the board mandategranted by the <strong>2010</strong> <strong>Annual</strong> GeneralMeeting. The board has authorised thecompany’s management to buy back up tofive percent of the outstanding shares. Thisprogramme runs until the next <strong>Annual</strong>General Meeting on 6 May 2011. As of 31December <strong>2010</strong>, 680 000 shares had beenacquired under the mandate. The board ofAker Solutions will propose that themandate be extended from the date of the<strong>Annual</strong> General Meeting’s decision until thenext <strong>Annual</strong> General Meeting.Geographic distribution of ownership as of 31 December <strong>2010</strong>Nationality Number of shares Ownership (in %)Non-Norwegian shareholders 123 267 264 43.47Norwegian shareholders 150 732 736 56.53Total 274 000 000 100Ownership structure by size of shareholding as of 31 December <strong>2010</strong>Shares held Number of shareholders Percent of share capital1-100 1 559 0.03101-1 000 7 404 0.991 001-10 000 1 151 1.3010 001-100 000 287 3.91100 001-500 000 121 9.44More than 500 000 62 84.33Total 10 584 100
78 Aker Solutions annual report <strong>2010</strong>Share and shareholder informationShare purchase programme foremployeesThe share purchase programme foremployees that was established in January<strong>2009</strong> was re-launched in <strong>2010</strong>. Around17 200 employees were invited to participatein January <strong>2010</strong>, of these 3 759 signedup. They were offered the opportunity topurchase shares in Aker Solutions up to aceiling of NOK 15 000 per employee and ata discount of up to NOK 1 500 peremployee over the 12-month duration(March <strong>2010</strong> to February 2011) of theprogramme. The price per share was calculatedon the basis of the average volumeweightedshare price on the Oslo StockExchange the day before the shares wereallocated. Employees who retain theirshares until 3 September 2012 and whoremain continuously employed by AkerSolutions throughout the period, will beentitled to receive free bonus shares at therate of one bonus share for every twoshares purchased under the programme. Atotal of 3 500 employees bought a total of525 077 shares through the programme in<strong>2010</strong>. It has been resolved to continue theprogramme on the same terms in 2011.Around 14 000 employees in Norway, theUK, the US and Canada were invited toparticipate in January 2011. 3 690 signedup.Stock option programmeAker Solutions ASA had no stock optionprogrammes as of 31 December <strong>2010</strong>.Nomination committeePursuant to its articles of association, AkerSolutions has a nomination committee withat least three members. Its compositionmust reflect the interests of shareholders,and the members must be independent.The nomination committee has thefollowing members:■ ■ Leif-Arne Langøy (chairman),<strong>2009</strong>-2011■ ■ Gerhard Heiberg, <strong>2010</strong>-2012■ ■ Kjeld Rimberg, <strong>2009</strong>-2011■ ■ Mette Wikborg, <strong>2009</strong>-2011The deadline for submitting proposals forboard and nomination committee candidatesfor the upcoming term is at the endof November the year prior to the <strong>Annual</strong>General Meeting. Shareholders who wish tocontact Aker Solutions ASA’s nominationcommittee may do so using the followinge-mail address: ir@akersolutions.com.<strong>Annual</strong> General MeetingThe <strong>Annual</strong> General Meeting is normallyheld in April. Written notice is sent to allshareholders individually or to their custodianbank. The Articles of Association ofthe company stipulate that documentspertaining to matters to be deliberated bythe General Meeting shall only be madeavailable on the company’s website, andnot normally be sent physically by post tothe shareholders unless required by statute.Shareholders or their proxies must bephysically present at the General Meeting inorder to vote, in accordance with theinstructions found on the company’s websiteand in the meeting notice. For moreinformation on the <strong>Annual</strong> General Meeting,see the chapter concerning corporategovernance on page 83.20 largest shareholders as of 31 December <strong>2010</strong>NameNomineeNumber ofshares heldOwnership(in %)Aker Holding AS 110 333 615 40.27Folketrygdfondet 10 802 522 3.94State Street Bank x 10 574 461 3.86JPMorgan Chase Bank x 8 110 997 2.96Bank of New York Mellon x 7 423 928 2.71State Street Bank & Trust CO. x 5 472 873 2.00The Northern Trust C.O. x 4 948 119 1.81JPMorgan Chase Bank x 4 773 864 1.74Aker Solutions ASA 4 590 978 1.68Fidelity Funds Europe 4 382 723 1.60Clearstream Banking x 4 124 671 1.51Goldman Sachs & CO x 2 484 301 0.91Vital Forsikring ASA 2 389 996 0.87JPMorgan Chase Bank x 2 373 379 0.87JPMorgan Chase Bank x 2 055 177 0.75DnB NOR Bank ASA 1 902 186 0.69The Northern Trust x 1 855 138 0.68State Street Bank x 1 808 643 0.66Bank of New York Mellon x 1 793 856 0.65Bank of New York Mellon x 1 696 296 0.62Total, 20 largest shareholders 193 897 723 70.78Other shareholders 80 102 277 29.22Total 274 000 000 100Source: Norwegian Central Securities Depository (VPS)
Aker Solutions annual report <strong>2010</strong>Share and shareholder information79Investor relationsAker Solutions wants to maintain a goodand open dialogue with shareholders,financial analysts and the financial marketsin general. In addition to meetings withanalysts and investors, the companystages regular presentations in importantEuropean and US financial centres. Thecompany’s website at www.akersolutions.com provides the opportunity to subscribeto news about Aker Solutions via e-mail. Allpress releases, including archived material,are available on the site. That also appliesto interim and annual reports, prospectuses,presentations, the company’s articles ofassociation, financial calendar, investorrelations and corporate governance policies,and other information. Aker Solutions holdsan annual capital markets day open to allstakeholders, where key executives provideupdated information about the businessand market conditions. Shareholders cancontact the company at ir@akersolutions.com. Aker Solutions has been awarded theinformation and English symbols presentedby the Oslo Stock Exchange to companieswhich satisfy its recommendations oninforming the stock market. For details, seewww.oslobors.no.RegistrarShareholders can contact Aker Solutions’registrar if they have any questionsconcerning their holding:DnB NOR Bank ASASecurities serviceStranden 21NO-0021 OsloNorwayTelephone: +47 22 48 27 70Telefax: +47 22 48 11 71www.dnbnor.comFinancial calendar 20116 May 2011 <strong>Annual</strong> General Meeting6 May 2011 1st quarter results 201112 August 2011 2nd quarter results 20113 November 2011 3rd quarter results 20118 December 2011 Capital markets day 2011AnalystsThe following research analysts provide analytic coverage of Aker Solutions(as of 31 December <strong>2010</strong>):Company Name PhoneABG Sundal Collier Anders Hagen +4722016048Arctic Securities Kjetil Garstad +4748403224Bank of America Merrill Lynch Fiona Mclean +442079956099Barclays Mick Pickup +442031346695CA Cheuvreux Geoffroy Stern +33141897379Carnegie Chr. Frederik Lunde +472<strong>2009</strong>379Danske Bank Endre Storløkken +4785407071Deutsche Bank Christyan F. Malek +442075458249DnBNOR Lars-Daniel Westby +4722948983Fearnley Fonds Truls Olsen +4722936393First Securities Pål H. Dahl +4723238198Fondsfinans Petter Narvestad +4723113040Goldman Sachs Henry Tarr +442075525981Handelsbanken Haakon Amundsen +4722940995HSBC David Phillips +442079912344JP Morgan Andrew Dobbing +442071556134Nordea Anne S. Ulriksen +4722486867Terra Eglé Domataité +37052461919Pareto Andreas Stubsrud +4724132116Royal Bank of Scotland Phillip Lindsay +442076785486RS Platou Markets Terje Mauer +4790970424SEB Enskilda Terje Fatnes +4721008538UBS Amy Wong +442075681235Unicredit David Thomas +442078267895
80 Aker Solutions annual report <strong>2010</strong>Share and shareholder informationAnalytical information(Continuing operations)Amounts in NOK million <strong>2010</strong> <strong>2009</strong>Order backlog 31 December 50 775 52 740Order intake 46 341 49 048Revenue 46 267 49 856EBITDA 3 778 4 095EBITDA-margin 8.2% 8.2%Profit before tax 2 355 2 969Rate of taxation 29.6% 26.4%Net profit from continuing operations 1 658 2 186Basic earnings per share 5.96 7.86Cash flow from operating activities 2 131 4 245Cash flow from investing activities (2 109) (3 927)Cash flow from financing activities (121) (278)Cash flow per share 0.04 (2.34)Total capital 40 021 39 926Borrowings 8 224 7 515Equity ratio 25.9% 22.8%Liquidity ratio 1 121.1% 113.7%Gearing ratio 67.3% 72.2%Return on total capital 7.4% 8.6%Return on equity 17.3% 25.5%Return on capital employed 2 12.1% 14.4%1) Includes assets classified as held for sale of NOK 3 136 million and liabilities classified as held for sale of NOK 1 539 million2) Including discontinuing operationsRevenueAmounts in NOK50 00040 00030 00020 00010 0000<strong>2009</strong><strong>2010</strong>Return on capital employed15%12%9%6%3%0<strong>2009</strong><strong>2010</strong>EBITDA margin10%8%6%4%2%864200<strong>2009</strong>Earnings per shareAmounts in NOK<strong>2009</strong><strong>2010</strong><strong>2010</strong>
Aker Solutions annual report <strong>2010</strong>Corporate governance81Corporate governanceAker Solutions aims to ensure that the maximum possible value is created for itsshareholders over time. Good corporate governance shall ensure an appropriatedistribution of roles between the owners, the board of directors and theleadership group, and also contribute to reducing risk and ensuring sustainablevalue creation.The corporate governance principles of thegroup are laid down by the board ofdirectors of Aker Solutions. The principlesare based on the Norwegian Code of Practicefor Corporate Governance, dated 21October <strong>2010</strong> (the «Code of Practice»).Below follows an account outlining howAker Solutions has implemented the Codeof Practice. This account follows the samestructure as the Code of Practice andcovers all sections thereof. Deviations fromthe Code of Practice are discussed underthe relevant section.Section 1: Implementation andreporting on corporate governanceGood corporate governance shall ensurethat appropriate goals and strategies areadopted, that the adopted strategies areimplemented in practice, and that theresults achieved are subject to measurementand follow-up. The principles shallalso contribute to ensuring that the activitiesof the group are subject to adequatecontrols. An appropriate distribution ofroles and adequate controls shall contributeto the largest possible value creationover time, for the benefit of the owners andother stakeholders.Basic corporate values and ethicalguidelinesAker Solutions wishes to contribute tosustainable social development throughresponsible business practices. The boardof directors has defined a set of basiccorporate values for the group to ensurethis. The ethical guidelines and other policydocuments of the company have beendrafted on the basis of these basic corporatevalues. Aker Solutions has a total of 20policies, which provide, inter alia, businesspractice guidance within a number of keyareas. These policy documents express theposition of the company with regard to,inter alia, corporate responsibility, whilst atthe same time providing operational guidelinesthat apply to individual employees,thus ensuring compliance within thevarious functions operated by the company.All policies are updated and revisedin <strong>2010</strong>. In <strong>2009</strong>, Aker Solutions developedand implemented its own «Code ofConduct» for the group, which was appliedin <strong>2010</strong> and which also will be applied2011. It summarises the corporate responsibilityprinciples adopted by Aker Solutionsand other key requirements governing thebusiness practices of the company. TheCode of Conduct is a brief summary of keyprinciples laid down in the group’s guidelines,annual reports and corporate responsibilityreports. Discussion and clarificationof the basic corporate values adopted bythe group, as well as its ethical guidelinesand corporate social responsibility principles,are available on the Aker Solutionswebsite www.akersolutions.com/CR.The company has implemented proceduresto ensure that Aker Solutions’ projectsglobally are conducted in compliance withthe company’s own guidelines. For keyareas like HSE, anti-corruption and humanrights, the controls are effected throughinternal procedures, some of which areelaborate. In case of doubt, issues may bereferred for deliberation at group level,where they are examined by the groupfunction enterprise risk. As far as the mainprojects of the company are concerned, thecomplex extended effects and risks arereviewed by a committee with a broadrepresentation, which makes recommendationson whether to pursue with therelevant projects.Section 2: BusinessThe objectives of the company, as definedin its articles of association, are «to own orcarry out industrial- and other associatedbusinesses, management of capital andother functions for the Group, and to participatein or acquire other businesses». Theprincipal strategies of the group are presentedin the annual report. Each year, theboard of directors evaluates the strategy,goals and guidelines of the companythrough designated strategy processes.Information concerning the financial positionand principal strategies of the company,and any changes thereto, is disclosedto the market in the context of the company’squarterly reporting and in designated marketpresentations.Section 3: Equity and dividendsThe book equity of the group as per 31December <strong>2010</strong> is NOK 10 354 million,which represents an equity ratio of 25.6percent. The dividend policy of AkerSolutions is set out in the Share and ShareholderInformation chapter on page 77 ofthe annual report. The dividend policy isone of the factors that were taken intoaccount when the board of directorsprepared its proposal for the allocation ofthe profit for the year <strong>2010</strong>.Authorisations for the board of directorsProposals from the board of directors forfuture authorisations shall be restricted todefined purposes and shall remain in effectuntil the next annual general meeting.Existing authorisations for the board ofdirectors to acquire own shares aredescribed in the Share and ShareholderInformation chapter on page 77 of theannual report. As of year-end, there are noauthorisations for board of directors toincrease the share capital of the company.Share purchase programme for employeesAker Solutions wants its employees to beable to participate in Aker Solutions asowners, and to benefit from any increase inthe value of the company, and therebycontribute to an even closer relationshipbetween the employees and the company,as well as to enhance interest in the
82 Aker Solutions annual report <strong>2010</strong>Corporate governancecreation of value within the company. Ashare purchase programme for employeeswas therefore introduced in <strong>2009</strong>, and ithas subsequently been resolved to extendthis into both <strong>2010</strong> and 2011. The contentsof the share purchase programme aredescribed in more detail in Note 10Salaries, wages and social security costs,to the consolidated financial statements.The sale of shares to employees pursuantto the programme is realised from the ownshares held at any given time, or byacquiring additional treasury sharespursuant to existing authorisations for theboard of directors.Section 4: Equal treatment ofshareholders and transactions withclose associatesThe company has only one class of shares,and all shares carry equal rights. Existingshareholders shall have pre-emptive rightsto subscribe for shares in the event ofshare capital increases, unless otherwiseindicated by special circumstances. If thepre-emptive rights of existing shareholdersare waived in respect of a share capitalincrease, the reasons for such waiver shallbe explained by the board of directors.Transactions in own shares are effected viathe Oslo Stock Exchange.In the event of any material transactionsbetween the company and shareholders,directors, senior executives or close associatesthereof, which do not form part ofongoing projects pursued in the ordinarycourse of the company’s business, theboard of directors shall arrange for an independentassessment. The same shall,generally speaking, apply to the relationshipbetween Aker Solutions and the AkerGroup. Any cooperation projects with e.g.Aker Clean Carbon AS, in which AkerSolutions holds a 50 percent ownershipinterest, and any contracts in the ordinarycourse of the company’s business withother listed companies in which Aker ASAholds ownership interests, will neverthelessnormally be negotiated and concluded atarm’s length without any independentassessment necessarily being arranged for.Aker Solutions has prepared guidelinesensuring that directors and senior executivesnotify the board of directors if theyhave any material direct or indirect personalinterest in any agreement concluded by thegroup. The rules of procedure for the boardof directors of Aker Solutions stipulate thatthe directors and the chief executive officershall not participate in the preparation,deliberation or resolution of any mattersthat are of such special importance tothemselves, or any of their close as sociates,that they must be deemed to have aprominent personal or financial interest insuch matters. The relevant director and thechief executive officer shall raise the issueof his or her competence whenever theremay be cause to question it.The chairman of the board of directors,Øyvind Eriksen, and one other director, KjellInge Røkke, are indirect shareholders ofboth Aker ASA and Aker Solutions. Sincetheir relative indirect ownership interests inAker ASA exceed their ownership interestsin Aker Solutions, the said directors will notparticipate in the board of directors’ deliberationof matters that concern commercialrelationships between Aker Solutionsand Aker ASA. The same principle isapplied if Aker Solutions contracts withother companies in which the said directorshold direct or indirect ownership intereststhat exceed, in relative terms, their ownershipinterests in Aker Solutions.If incompetence is concluded, the relevantdirector will not be granted access to anydocumentation, etc., prepared to the boardof directors prior to the deliberation of therelevant matter either.In general, Aker Solutions applies a strictnorm as far as competence assessmentsare concerned. In cases where the chairmanof the board of directors does notparticipate in the deliberations, the deputychairman of the board of directors chairsthe meeting.As far as the other officers and employeesof Aker Solutions are concerned, transactionswith close associates are comprehensivelyaddressed and regulated in thegroup’s rules of ethics.Principal shareholderAker ASA holds 60 percent of the shares ofAker Holding AS, which held 40.27 percentof the shares of Aker Solutions as per 31December <strong>2010</strong>. Proposition No. 88 (2006–<strong>2007</strong>) to the Storting (parliament) containsmore detailed information concerning theestablishment of Aker Holding AS and theagreement between Aker ASA and theother shareholders of Aker Holding AS. Theboard of directors is of the view that it ispositive for Aker Solutions that Aker ASAassumes the role of an active owner and isactively involved in matters of major importanceto the group and to all shareholders.The cooperation with Aker ASA offers AkerSolutions, inter alia, access to specialknowhow and resources within strategy,transactions and funding. Moreover, AkerASA offers network and negotiationresources from which Aker Solutions benefitsin various contexts. This complementsand strengthens Aker Solutions withoutcurtailing the autonomy of the group. It maybe necessary to offer Aker ASA specialaccess to commercial information inconnection with such cooperation. Anyinformation disclosed to Aker’s representativesin such a context will be disclosed incompliance with the laws and regulationsgoverning the stock exchange and thesecurities market. Aker Solutions is notdeemed, within the meaning of the PublicLimited Companies Act, to be a close associateof Aker ASA, or any company in whichAker ASA holds ownership interests, butthe board of directors and the executivemanagement team of Aker Solutions arenevertheless very conscious that allrelations with other Aker companies shallbe premised on commercial terms andstructured in line with the arm’s lengthprinciple. Transactions are made public inaccordance with the rules and regulationsgoverning companies listed on the OsloStock Exchange. Furthermore, transactionsof a certain magnitude between AkerSolutions and companies within the AkerASA group will be handled in accordancewith the procedures in Section 3-8 of thePublic Limited Companies Act. See alsothe discussion of transactions with closeassociates in Note 8 Related parties, to theconsolidated financial statements.Section 5: Freely negotiable sharesThe shares are listed on the Oslo StockExchange and are freely transferable. Notransferability restrictions are laid down inthe articles of association.
Aker Solutions annual report <strong>2010</strong>Corporate governance83Section 6: General meetingsThe company encourages shareholders toattend the general meeting. It is a priorityfor the company to hold the general meetingas soon as possible after year end.Notices convening general meetings,including comprehensive documentationrelating to the items on the agenda, hereunderthe recommendation of the nominationcommittee, are made available on anongoing basis on the company’s websiteno later than 21 days prior to the generalmeeting. The articles of association of thecompany stipulate that documents pertainingto matters to be deliberated by thegeneral meeting shall only be madeavailable on the company’s website, andnot normally be sent physically by post tothe shareholders unless required by statute.The deadline for registering intendedattendance is as close to the general meetingas possible. Shareholders who areunable to attend may vote by proxy.Moreover, information concerning both theregistration procedure and the filing ofproxies is included in the notice conveningthe general meeting and on the registrationform. The company also aims to structure,to the extent practicable, the proxy formsuch as to enable the shareholders to voteon each individual item on the agenda. Thearticles of association stipulate that thegeneral meetings shall be chaired by thechairman of the board of directors or aperson appointed by said chairman.It is intended for the board of directors, thechairman of the nomination committee andthe company’s auditor to attend the generalmeeting.It is a priority for the nomination committeethat the board of directors shall work in thebest possible manner as a team, and thatthe background and competence of thedirectors shall complement each other. Asa consequence, the board of directors willpropose that the shareholders are invited tovote on the full board composition proposedby the nomination committee as agroup, and not on each member separately.As it is a priority for the general meeting tobe conducted in a sound manner, with allshareholder votes to be cast, to the extentpossible, on the basis of the same information,the company has thus far not deemedit advisable to recommend either the introductionof an electronic attendance. Thecompany will contemplate the introductionof such arrangements on an ongoing basisin view of, inter alia, the security and easeof use offered by available systems.The board of directors will however proposefor the annual general meeting for<strong>2010</strong> to vote for an amendment of AkerSolutions’ articles of association to allowfor advance voting options at future generalmeetings.Minutes of general meetings will bepublished as soon as practicable on theannouncement system of the Oslo StockExchange, www.newsweb.no (ticker:AKSO), and on the company’s ownwebsite, www.akersolutions.com, in theInvestor section.Section 7: Nomination committeeThe articles of association stipulate that thecompany shall have a nomination committee.The nomination committee shall haveno less than three members, who shallnormally serve for a term of two years. Thecurrent members of the nomination committeeare Leif-Arne Langøy (chairman),Gerhard Heiberg, Kjeld Rimberg and MetteWikborg. The terms of Leif-Arne Langøy,Kjeld Rimberg and Mette Wikborg expire in2011.A majority of the members of the nominationcommittee are independent of theboard of directors and the executivemanagement of the company. The articlesof association charge the nominationcommittee with proposing candidates forappointment as directors. The nominationcommittee shall also propose the fee payableto the directors.The composition of the nominationcommittee shall reflect the interests of allshareholders, in addition to its members’independence from the board of directorsand the executive management. The membersand the chairman of the nominationcommittee are appointed by the generalmeeting, which also determines the rewardof the committee. The annual generalmeeting for <strong>2010</strong> will, in accordance withthe Code of Practice, be presented withguidelines governing duties of thenomination committee, for approval.Information concerning the nominationcommittee and deadlines for makingsuggestions or proposing candidates fordirectorships are available on the com pany’sown website, www.akersolutions.com, inthe Investor section.Section 8: Corporate assembly andboard of directors: Composition andindependenceIt has been agreed with the employees thatthe company shall have no corporateassembly. The right of the employees to berepresented and participate in decisionmaking is safeguarded through, inter alia,expanded employee representation on theboard of directors. The articles of asso ciationstipulate that the board of directorsshall comprise six to ten persons, one thirdof whom shall be elected by and amongstthe employees of the group. In addition, upto three shareholder-appointed alternatesmay be appointed.The proposal of the nomination committeewill normally include a proposed candidatefor appointment as chairman of the boardof directors, which appointment is made bythe shareholders in the general meeting.The board of directors appoints its owndeputy chairman. According to the PublicLimited Companies Act, the directors areappointed for a term of two years at a timeunless otherwise stated in the company’sarticles of association.The board ofdirectors will however propose for theannual general meeting for <strong>2010</strong> to vote foran amendment of Aker Solutions’ articles toallow for the flexibility for appointingdirectors for terms of minimum one yearand maximum three years.The board of directors comprised tendirectors as of 31 December <strong>2010</strong>, six ofwhom were elected by the shareholdersand four of whom were elected by andamong the employees. The current compositionof the board of directors is describedon page 88 of the annual report, whereinformation about the background andaffiliations of the directors can also befound. The company encourages thedirectors to hold shares of the company.The shareholdings of the directors as of 31December <strong>2010</strong> are set out in Note 10
84 Aker Solutions annual report <strong>2010</strong>Corporate governanceSalaries, wages and social security costs,to the consolidated annual statements. Amajority of the directors elected by theshareholders are independent of the executivepersonnel and important businessassociates. None of the executivepersonnel of the company are directorsthereof.The composition of the board of directorsaims to ensure that the interests of allshareholders are attended to and that thecompany has the knowhow, resources anddiversity it needs at its disposal. At leasthalf of the directors elected by the shareholdersare independent from the principalshareholder of the company.The terms of all directors expire in 2011.The reasoned proposals of the nominationcommittee for candidates to becomeshareholder-appointed directors will bepublished on the company’s website andon the Oslo Stock Exchange, via www.newsweb.no, as soon as available. Theappointment of employee representativesto the board of directors will be conductedas prescribed by the Public LimitedCompanies Act and the RepresentationRegulations. The board of directors hasappointed a designated appointmentcommittee charged with implementing theappointment of such employee representatives,which committee comprises representativesof the employees and of theexecutive management team.Section 9: The work of the board ofdirectorsThe board of directors adopts an annualplan for its work, with an emphasis ongoals, strategy and implementation.Furthermore, there are rules of procedurefor the board of directors, which governareas of responsibility, duties and thedistribution of roles between the board ofdirectors, the chairman of the board ofdirectors and the chief executive officer.The rules of procedure for the board ofdirectors also include provisions onconvening and chairing board meetings, ondecision making, on the duty and right ofthe chief executive officer to discloseinformation to the board of directors, on theduty of confidentiality, as well as oncompetence, etc.In June <strong>2010</strong>, President & CEO SimenLieungh left the company. Since then, chieffinancial officer Leif H. Borge has beenacting president of Aker Solutions ASA,while Øyvind Eriksen in his capacity asexecutive chairman has taken on the roleas CEO for the group. The board is veryfocused on attracting the correct CEOcandidate, and the recruitement prosesswas still ongoing as per the publishing ofthis statement.The board of directors has held 13 ordinaryboard meetings in <strong>2010</strong>, which have beenattended by an average of 9.2 directors (outof a total of 10), with all directors havingbeen in attendance at 6 of the meetings(46%). In addition, 4 extraordinary boardmeetings have been held, which have beenattended by an average of 9.3 directors (outof a total of 10), with all directors attendingthe same extraordinary meeting in 1 ofthese meetings (25%).The need for extraordinary board meetingsmay typically arise because the internalauthorisation structure of the companyrequires the board of directors to deliberateand approve material tenders to be submittedby the company, whilst the deadlinesfor such submission often change,thus potentially making it difficult to fit thisinto the calendar of ordinary boardmeetings.An overview of current directors’ participationin ordinary and extraordinary boardmeetings in <strong>2010</strong> is provided in Note 10Salaries, wages and social security costs,to the consolidated financial statements ofthe group. The chief executive officer (or inthe absence thereof, the acting president incooperation with the executive chairman),prepares cases for deliberation by theboard of directors, in consultation with thechairman of the board of directors. Weightis attached to having matters prepared andpresented in such a way that the board ofdirectors is provided with an adequatebasis for its deliberations. The board ofdirectors has overall responsibility for themanagement of Aker Solutions and shall,through the chief executive officer, ensurethat its activities are organised in a soundmanner. The board of directors shall, interalia, adopt plans and budgets for the business,and keep itself informed of the financialposition of, and development within,Aker Solutions. This encompasses theannual planning process of Aker Solutions,with the adoption of overall goals andstrategic choices for the group, as well asfinancial plans, budgets and forecasts forthe group and the business areas. Theboard of directors performs annual evaluationsof its work and its knowhow inaccordance with the rules of procedure forthe board of directors.Audit committeeAker Solutions has an audit committeecomprising three of the directors, whichheld eight meetings in <strong>2010</strong>. Until 15 June<strong>2010</strong>, the audit committee comprised IdaHelliesen (chairperson), Øyvind Eriksen andAtle Teigland. As from 15 June <strong>2010</strong>, theaudit committee comprises Ida Helliesen(chairperson), Lone Fønns Schrøder andAtle Teigland.Generally speaking, at least one of themembers of the committee shall have relevantaccounting or auditing qualifications.The audit committee has a mandate and aworking method that complies with statutoryrequirements. The committee willparticipate, on behalf of the board of directors,in the quality assurance of guidelines,policies and other governing instrumentspertaining to Aker Solutions ASA. The auditcommittee performs a qualitative review ofthe quarterly and annual reports of AkerSolutions, which include the group reports.Reward committeeThe board of directors of Aker Solutionshas a reward committee comprising threeof the directors, which normally holds atleast four meetings a year. The currentmembers of the committee are ØyvindEriksen, Kjell Inge Røkke and VibekeHammer-Madsen.The committee prepares and recommendsproposals for the board of directors relatingto the salary and terms of the chief executiveofficer, as well as the guidelines andprinciples governing the reward of executivepersonnel within the group at anygiven time. The reward committee alsoapproves, based on the recommendationof the chief executive officer, the salary andterms of those who report directly to thechief executive officer.
Aker Solutions annual report <strong>2010</strong>Corporate governance85Section 10: Risk management andinternal controlAker Solutions manages risk through aninternal framework comprising guidelines,procedures, standards and process toolsintended to ensure good business operationsand provide unified and reliable financialreporting. The framework is anchoredin the various group functions. The grouphas defined risk into four main areas:■ ■ Financial and strategic: Market andcustomer developments may influencethe earnings and future prospects of thecompany■ ■ Operational and project-related: Deliveryand quality risk in the implementationof projects and in the production ofproducts and services■ ■ Reputational: Events that may affect thereputation of Aker Solutions amongstcustomers, government authorities,the general public, suppliers and otherstakeholders■ ■ Mergers and acquisitions: Risk relatingto the divestment, acquisition orrestructuring of businessesThe managerial and organisational model ofthe company implies that individual groupfunctions have a global responsibility forfollowing up on their respective areas ofspecialisation and the frameworks associatedtherewith. Such responsibilityincludes risk management. This appliesirrespective of how one has chosen toorganise the businesses, and involves, interalia, a close dialog within the corporate riskcommittee and the investment committeeof the company, as well as monthly meetingsrelating to financial and operationalreporting from the business areas. Individualgroup functions follow up on their areaof responsibility, also outside these forums,through a direct dialog with the businesses,both in connection with specific projectsand as part of knowhow development toenhance risk management. The overall riskmanagement effort is primarily handled bythe following group functions, in closecooperation with the business areas:■ ■ Enterprise risk coordinates themanagement of risk outside thetraditional project and financial areas,and has overall responsibility forthe development of the company’sframework, basic corporate values,corporate responsibility policy, anticorruptioneffort and ethical guidelines■ ■ Project and operational supportassists in connection with projectassessments in the tender phase andthe implementation phase. The unitchairs the corporate risk committeewhich is responsible for assessing riskand giving advice to the group executivemanagement team in respect of all majortenders that the group contemplates forsubmission■ ■ Accounting and control is responsiblefor the financial reporting and financialassessments made in relation thereto.In addition, the unit chairs the group’sinvestment committee. The investmentcommittee shall give advice to thegroup executive management teamconcerning risk exposure in majorcapital investments■ ■ Treasury is responsible for financialmarket risk and the group’s exposure infinancial markets, and is a permanentmember of the investment committee ofthe group■ ■ Insurance is charged with theprocurement of the group’s insuranceprogramme and assists with theinsurance-related follow-up of projects,as well as the operation of the group’scaptive underwriter■ ■ Legal assists all of the abovementionedfunctions in their handling of risks by,inter alia, being a permanent memberof the project risk committee and theinvestment committee, and is alsoresponsible for the contractual andlegal follow-up of projects, partners,agreements, disputes and therelationship with the governmentalframework■ ■ Tax handles the various tax risks of thegroup, relating to, inter alia, transactions,operational activities, tax returns and thepreparation of financial statementsIn addition to the said group functions, thebusiness areas have their own managementteams and finance/staff functionstailored to their organisations and activities.As a supplement to the group functions’own control of risks and procedures, theinternal control unit has independentresponsibility for auditing the units’ establishmentand implementation of necessarysystems and procedures within both thefinancial and the operational processes.This unit performs regular controls of theunits, with subsequent reporting of anyimprovement measures. The leadershipgroup is provided with a summary of allaudits carried out on the businesses.Each business has independent responsibilityfor adherence to the internal frameworkof the group and compliance withexternal laws and regulations at any giventime. This involves close cooperationbetween the staff functions and the businessareas with a view to identifying, monitoring,reporting and handling risk for theentire group in conformity with, inter alia,the requirements laid down by the auditcommittee and the board of directors.Moreover, all businesses within the groupevaluate, on an ongoing basis, their ownadherence to the framework and whetherestablished control activities work appropriately.This is done by using, inter alia, astandard form with a number of verificationquestions relating to the company’s guidelinesand procedures. The audit committeeof the board of directors assists the boardof directors with ensuring that the companyhas internal procedures and systems thatensure good corporate governance, effectiveinternal controls and good riskmanage ment – particularly in relation tofinancial reporting. The audit committeeholds regular meetings with the chief financialofficer and the responsible groupfunctions in this regard.The group’s businesses report monthly onthe financial, operational and market statuswithin their respective areas, includingmatters relating to important projects. Thereports are reviewed in physical meetingswith the chief executive officer and thechief financial officer before the board ofdirectors receives its monthly report on thefinancial performance of the company, aswell as a description of the status concerningthe most important projects of the company.The business areas are responsiblefor monthly financial follow-up and reporting.Page 10 of the annual report contains amore detailed description of the company’shandling of the operational and financialrisk associated with the business activities.
86 Aker Solutions annual report <strong>2010</strong>Corporate governanceSection 11: Reward of the board ofdirectorsThe reward of the board of directorsreflects its responsibilities, knowhow andtime commitment, as well as the complexityof the business. The reward is proposedby the nomination committee, and is notperformance-related or linked to options inAker Solutions. More detailed informationabout the reward of individual directors in<strong>2010</strong> is provided in Note 10 Salaries,wages and social security costs, to theconsolidated financial statements for thegroup. Neither should the directors, norcompanies with which they are affiliated,accept specific paid duties for AkerSolutions beyond their directorships. If theynevertheless do so, the board of directorsshall be informed and the reward shall beapproved by the board of directors. Noreward shall be accepted from anyoneother than the company or the relevantgroup company in connection with suchduties.Section 12: Reward of executivepersonnelThe board of directors has adopted designatedguidelines for the reward of executivemanagement pursuant to the provisions ofSection 6-16a of the Public Limited CompaniesAct. Aker Solutions has no optionschemes or programmes for the allotmentof shares to employees for 2011, but ashare purchase programme was introducedfor <strong>2009</strong>, and it has subsequently beendecided to extend this to both <strong>2010</strong> and2011. Additional details pertaining theretoare available on page 39 in Note 10Salaries, wages and social security costs,to the consolidated financial statements.Details pertaining to the reward for <strong>2010</strong> forindividual executives are provided in Note10 to the consolidated financial statementsfor the group. The executive reward guidelinesof the company are set out in Note 10,and will consequently be submitted to thegeneral meeting. The reward committeeprepares and recommends proposals tothe board of directors on the reward of thechief executive officer. The chief executiveofficer determines the reward of executivemanagement on the basis of the guidelineslaid down by the board of directors, seealso the discussion on the reward committeeof the board of directors in Section 9.All performance-related reward within thegroup has been made subject to a cap.Section 13: Information andcommunicationsAker Solutions has prepared a designatedIR policy, which is available on the company’swebsite. The company’s reporting offinancial and other information is based onopenness and the equal treatment of allsecurities market players. The long-termpurpose of the IR function is to ensureaccess for the company to capital oncompetitive terms, whilst at the same timeensuring that the shareholders are providedwith the most correct pricing of the sharesthat can be achieved. This shall take placethrough the correct and timely distributionof price-sensitive information, whilst ensuring,at the same time, that the company isin compliance with applicable rules andmarket practices. Reference is also madeto the above discussion concerning theflow of information between Aker Solutionsand Aker ASA in connection with theircooperation within, inter alia, strategy,transactions and funding.All stock exchange announcements andpress releases are made available on theBusiness processesOperationsPeopleStrategyValuesand leadership approachPoliciesBusinessmanagement meetingsExecutive meetingsMonthly operating reviewsQuarterly business reviewsOperating Managers’ ConferenceOrganisationCorporate staffBusiness areasBusiness unitsGlobal networks
Aker Solutions annual report <strong>2010</strong>Corporate governance87company’s website, www.akersolutions.com, and stock exchange announcementsare also available on www.newsweb.no. Allinformation sent to the shareholders isposted on the company’s website at thesame point of time. The company holdsopen presentations in connection with thereporting of financial performance, andthese presentations are broadcast live viathe internet. A capital markets day is alsohosted annually, and is open to all interestedparties. The financial calendar of thecompany is available on page 79 of theannual report and on the company’swebsite.Section 14: Take-oversAker ASA has undertaken to retain controlof Aker Holding AS for a minimum of tenyears from June <strong>2007</strong>. The board of directorshas not deemed it appropriate to adoptspecific guidelines for takeover situationsfor as long as the ownership cooperationcontext within Aker Holding AS remainsintact.attendance. Moreover, the board of directorswill as from 2011 hold a minimum ofone annual meeting with the auditors withoutthe chief executive officer or othermembers of the group executive managementteam being in attendance. The Auditcommittee stipulates guidelines on thescope for using the auditors for other servicesthan auditing, and makes recommendationsto the board of directors concerningthe appointment of external auditorsand the approval of the auditors’ fees. Feespayable to the auditors, separated intothose relating to auditing and those relatingto other services, is specified in Note 12Other operating expenses, to the consolidatedfinancial statements for the group.Section 15: AuditorsThe auditors annually present a plan for theimplementation of the audit work to theaudit committee. In addittion, the auditorshave provided the board of directors with awritten confirmation to the effect that theindependence requirement is met. Theauditors attend the meeting in the auditcommittee that deliberates the consolidatedfinancial statements, and the auditorshave reviewed any material changes tothe accounting principles of the company,or to the internal controls of the company,with the audit committee. The board ofdirectors may meet with the auditors withoutthe chief executive officer or othermembers of the leadership group being in
88 Aker Solutions annual report <strong>2010</strong>Corporate governanceBoard of directorsØyvind EriksenExecutive chairmanMikael LiliusDeputy chairmanVibeke HammerMadsenDirectorIda HelliesenDirectorKjell Inge RøkkeDirectorØyvind Eriksen is President &CEO of Aker ASA. He has alaw degree from the Universityof Oslo. And in 1990 he joinedthe Norwegian law firmBA-HR. In 1996 he became apartner, in 2003 a board memberand chairman. At BA-HR,Mr Eriksen worked closely withAker and Aker‘s main shareholder,Kjell Inge Røkke.Mr Eriksen is chairman of theboard of Aker Holding AS, aboard member of ReitangruppenAS, Aker CleanCarbon AS, The ResourceGroup TRG AS, TRG HoldingAS and other companies. Asof 31 December <strong>2010</strong> he holdsno shares in the company andhas no stock options.Mr Eriksen is a Norwegiancitizen. He has been electedfor the period <strong>2009</strong>-2011.Mikael Lilius was Presidentand CEO of Fortum Corporationfrom 2000 to May <strong>2009</strong>.From 1990, Mr Lilius was chiefexecutive of Sweden’sIncentive AB, a pharmaceuticalscompany whichchanged its name to GambroAB in 1998. Mr Lilius is chairmanof the board of the Finnishcompany Huhtamäki Oyjand a member of the board ofWärtsilä Oyj Abp and EvliPankki Oyj. He is also chairmanof the board of EastOffice of Finnish Industries.Mr Lilius is a graduate of theSwedish School of Economicsand Business Administration inHelsinki. As of 31 December<strong>2010</strong> he holds no shares in thecompany and has no stockoptions. Mr Lilius is a Finnishcitizen. He has been electedfor the period <strong>2009</strong>-2011.Vibeke Hammer Madsen hasbeen CEO of HSH (The Federationof Norwegian Commercialand Service Enterprises)since 2002. Prior to this, shewas a partner in the PAConsulting Group. From 1993to 1999 Ms Hammer Madsenwas a vice president holdingvarious positions in Statoil.Today Ms Hammer Madsen, agraduate of the NorwegianSchool of Radiography, holdsa range of board positions. Asof 31 December <strong>2010</strong>, sheholds no shares in the company,and has no stockoptions. Ms Hammer Madsenis a Norwegian citizen. Shehas been elected for theperiod <strong>2009</strong>-2011.Ida Helliesen joined NorskHydro in 1980, where she helda number of leading positions;including chief financial officerfor the last eight years beforeher retirement in <strong>2007</strong>. From<strong>2007</strong> until the spring of <strong>2009</strong>,she assisted Hydro on a numberof issues, including thecompletion of the mergerbetween Hydro’s oil andenergy business and Statoil.Ms Helliesen is a director ofthe executive board of Norway’sCentral Bank, StatisticsNorway and Skagerak EnergiAS. She has an MSc in businesseconomics from theNorwegian School of Economicsand Business Administration.As of 31 December <strong>2010</strong>,she holds no shares in thecompany, and has no stockoptions. Ms Helliesen is a Norwegiancitizen. She has beenelected for the period <strong>2009</strong>-2011.Entrepreneur and industrialistKjell Inge Røkke, Aker ASA’smain owner, has been a drivingforce in the development ofAker since the 1990s. Mr Røkkelaunched his business careerwith the purchase of a 69-foottrawler in the United States in1982, and gradually built aleading worldwide fisheriesbusiness, harvesting white fishand processing it at sea. In1996, Mr Røkke purchasedenough Aker shares tobecome Aker’s largest shareholderand owns today 67.8%of Aker ASA through TheResource Group TRG AS,which he owns together withhis wife. Mr Røkke is chairmanof the board of Aker ASA, AkerBioMarine ASA and Det norskeOljeselskap ASA. As of 31December <strong>2010</strong> he holds noshares in the company andhas no stock options.Mr Røkke is a Norwegiancitizen. He has been electedfor the period <strong>2009</strong>-2011.
Aker Solutions annual report <strong>2010</strong>Corporate governance89Lone Fønss SchrøderDirectorAtle TeiglandDirectorÅsmund KnutsenDirectorArild HåvikDirectorArve ToftDirectorLone Fønss Schrøder has alaw degree from the Universityof Copenhagen and a Masterof Economics from Copenhagenbusiness school. MsFønss Schrøder has broadinternational experienceacquired during 21 years insenior management, includingboard positions at A.P. Møller-Maersk A/S. She is amongothers chairperson for theaudit committee at Volvo, deputychairman of the Board ofAker ASA, a non-executivedirector of Volvo PV in Swedenand NKT A/S in Denmark, aswell as non-executive directorand member of the audit committeeat Vattenfall AB andSvenska Handelsbanken AB inSweden. As of 31 December<strong>2010</strong> she holds no shares inthe company and has no stockoptions. Ms Fønss Schrøder isa Danish citizen. She has beenelected for the period <strong>2009</strong>-2011.Atle Teigland was elected bythe employees of AkerSolutions to the board ofdirectors in October 2004. Healso served on the boards ofAker and Aker RGI for severalyears. Mr Teigland is a groupunion represen tative for AkerSolutions on a full-time basisand has been employed byAker Elektro AS since 1978.Mr Teigland is a certifiedelectrician. As of 31 December<strong>2010</strong> he holds 1 981 shares inthe company, and has nostock options. Mr Teigland is aNorwegian citizen. He hasbeen elected for the period<strong>2009</strong>-2011.Åsmund Knutsen was electedby the employees of AkerSolutions to the board ofdirectors in October 2004.Since 1991 he has heldvarious positions in AkerEngineering & Techno logy ASand is now a group unionrepresentative for white-collaremployees on a full-time basis.Mr Knutsen holds an MSc inhydro dynamics from OsloUniversity. As of 31 December<strong>2010</strong>, he holds 3 286 shares inthe company, and has nostock options. Mr Knutsen is aNorwegian citizen. He hasbeen elected for the period<strong>2009</strong>-2011.Arild Håvik was elected by theemployees of Aker Solutionsto the board of directors inMarch <strong>2009</strong>. Mr Håvik hasbeen employed by AkerSolutions since 1990 and hasbeen a local union representativefor Aker Offshore PartnerAS on a full-time basis for thelast four years. Mr Håvik is ascaffolder and sheet metalworker and holds a certificateof apprenticeship in the twodisciplines. As of 31 December<strong>2010</strong>, he holds 381 shares inthe company, and has nostock options. Mr Håvik is aNorwegian citizen. He hasbeen elected for the period<strong>2009</strong>-2011.Arve Toft was elected by theemployees of Aker Solutionsto the board of directors inMarch <strong>2007</strong>. Mr Toft is a groupunion representative for AkerSolutions on a full-time basisand has been employed by thecompany since 1983. Mr Toftis a certified mechanic andscaffolder and has been amain safety delegate at AkerStord AS for five years. As of31 December <strong>2010</strong>, he holds381 shares in the company,and has no stock options.Mr Toft is a Norwegian citizen.He has been elected for theperiod <strong>2009</strong>-2011.
90 Aker Solutions annual report <strong>2010</strong>Corporate governanceExecutive chairman andPresidentBusiness managementØyvind EriksenExecutive chairmanLeif BorgePresident & Chief FinancialOfficerMads AndersenHead of SubseaMichael HamblyHead of Process SystemsLeif HaukomHead of Mooring and LoadingSystemsØyvind Eriksen is President &CEO of Aker ASA. In hiscapacity as Executive Chairmanin Aker Solutions ASA hetook on the CEO role in June<strong>2010</strong> until a new President andCEO is appointed. Mr Eriksenhas a law degree from theUniversity of Oslo. And in 1990he joined the Norwegian lawfirm BA-HR. In 1996 hebecame a partner, and in 2003a board member and chairman.At BA-HR, Mr Eriksenworked closely with Aker andAker‘s main shareholder, KjellInge Røkke. Mr Eriksen ischairman of the board of AkerHolding AS and a board memberof Reitangruppen AS, AkerClean Carbon AS, TheResource Group TRG AS, TRGHolding AS and other companies.As of 31 December <strong>2010</strong>he holds no shares in the companyand has no stockoptions. Mr Eriksen is aNorwegian citizen.Leif Borge joined AkerSolutions in <strong>2008</strong>. Previouslyhe has been CFO of AkerYards ASA since 2002, afterserving as CFO of Zenitel NV,Stento ASA and Vitana, asubsidiary of Rieber & SønASA in the Czech Republic.Mr Borge is a graduate of thePacific Lutheran University inWashington State. As of 31December <strong>2010</strong>, he holds,through a privately ownedcompany, 20 381 shares in thecompany, and has no stockoptions. Mr Borge is aNorwegian citizen.Mads Andersen joined AkerSolutions in 2000 and hasbeen an EVP since 2003. Hehas more than 20 years experiencein the upstream oil andgas industry. Mr Andersen hasheld a range of technical andmanagerial positions in oilfieldservice and oil companiesincluding Schlumberger andSaga Petroleum (now Statoil).Mr Andersen is a graduatefrom the University of Glasgowand the Norwegian School ofManagement. As of 31December <strong>2010</strong>, he holds12 776 shares in the companyand has no stock options.Mr Andersen is a Norwegiancitizen.Michael Hambly joined AkerSolutions in 2005 and hasbeen President of the AkerProcess Systems Group sinceOctober <strong>2008</strong>. Mr Hambly wasappointed Head of ProcessSystems in March 2011.Mr Hambly has 14 years ofexperience in the oil and gasindustry and has held severalbusiness leadership positionsin Canadian and Americanoilfield service companies.Prior to joining the oil and gasbusiness, Mr Hambly servedas an officer in the CanadianArmed Forces for over 14years. Mr Hambly holds a BScin Mechanical Engineeringfrom the Royal Military Collegeof Canada. As of 31 December<strong>2010</strong>, he holds 381 shares inthe company and has no stockoptions. Mr Hambly is aCanadian and British citizen.Leif Haukom joined AkerSolutions in 1981 and has 30years of experience from theoffshore industry. Mr Haukomhas held a number of variouspositions within technical andproject/company management.Mr Haukom has actedas company president since1997, and managed AkerPusnes the last 8 years.Mr Haukom is appointed Headof Mooring and Loadingsystems from March 2011.Mr Haukom holds a BSc inmechanical engineering fromthe University of Agder, withadditional training in economicsand management skills. Asof 31 December <strong>2010</strong> he holds381 shares in the companyand has no stock options.Mr Haukom is a Norwegiancitizen.
Aker Solutions annual report <strong>2010</strong>Corporate governance91Thor Arne HåverstadHead of Drilling TechnologiesKarl Erik KjelstadHead of Oilfield Services &Marine AssetsValborg LundegaardHead of EngineeringWolfgang PuennelHead of Well InterventionServicesTore SjursenHead of Maintenance,Modifications and OperationsThor Arne Håverstad joinedAker Solutions in 1989. He hasclose to thirty years experiencefrom the oil and gasindustry. Mr Håverstad wasappointed EVP in January2011. From <strong>2009</strong>-<strong>2010</strong> he waspresident of Aker Solutions’drilling business in Kristiansandand he has also held arange of technical and managerialpositions within thecompany. Prior to this,Mr Håverstad held variouspositions within project andengineering management,technical safety and advisorywork for the offshore industryas well as seven years ofresearch for SINTEF, Norway.Mr Håverstad holds a PhDfrom the Norwegian Universityof Science and Technology. Asof 31 December <strong>2010</strong> he holds5 752 shares in the companyand has no stock options.Mr Håverstad is a Norwegiancitizen.Karl Erik Kjelstad joined AkerSolutions as EVP in July <strong>2009</strong>from the position of SeniorPartner & President, MaritimeTechnologies at Aker ASA.Mr Kjestad has been with theAker group since 1998 andwas President & CEO of AkerYards ASA from January 2003- June <strong>2007</strong>. Prior to joiningAker, Mr Kjelstad was seniorconsultant at PA ConsultingGroup and from 1992-1996held various managementpositions in the TTS Group.Mr Kjelstad holds a MSc inmarine engineering from theNorwegian University ofScience and Technology. As of31 December 2011,Mr Kjelstad holds, through aprivately owned company,2 500 shares in the companyand has no stock options.Mr Kjelstad is a Norwegiancitizen.Valborg Lundegaard wasappointed Head of theEngineering business area inFebruary 2011. Ms Lundegaardhas more than 20 yearsexperience from the oil andgas industry and has held anumber of key positions inAker Solutions, includingcorporate and projectmanage ment. From <strong>2008</strong>Ms Lundegaard was presidentof Aker Engineering andTech nology. Ms Lundegaard isa member of the board ofSimtronics ASA and SongaOffshore SE. Ms Lundegaardholds a degree in chemicalengineering from the NorwegianUniversity of Science andTechnology. As of 31 December<strong>2010</strong>, she holds no sharesin the company and has nostock options. Ms Lundegaardis a Norwegian citizen.Wolfgang Puennel wasappointed Head of WellServices business area, comprisingof the operating entitiesAker Geo, Aker Well Servicesand Aker Qserv, in February2011. Mr Puennel has morethan 25 years experience inthe upstream oil and gasindustry. Mr Puennel has helda range of senior managementpositions in oilfield service andoil companies includingWeatherford and Maurel &Prom. Mr Puennel holds aMSc in petroleum engineeringand a BSc in mining engineeringfrom the Technical Universityof Clausthal, Germany. Asof 31 December <strong>2010</strong>, heholds no shares in thecompany and has no stockoptions. Mr Puennel is aGerman citizen.Tore Sjursen was appointedEVP of the MMO businessarea in October <strong>2010</strong>.Mr Sjursen has been with AkerSolutions for 24 years in differentpositions in field developmentand MMO. From <strong>2009</strong>-<strong>2010</strong> Mr Sjursen was head ofAker Solutions Energy Developmentand Services (ED&S)International in Australia.Mr Sjursen holds a MSc inmechanical engineering fromNorwegian University ofScience and Technology and aMSc in management fromBoston University. As of 31December <strong>2010</strong>, he holds 252shares in the company andhas no stock options.Mr Sjursen is a Norwegiancitizen.
92 Aker Solutions annual report <strong>2010</strong>Corporate governanceCorporate centre functionsNiels Didrich BuchChief of StaffÅsmund BøeChief Technology OfficerPer Harald KongelfChief Operating OfficerActing CEO of Aker ContractorsSissel LindlandChief HR OfficerMark RidingChief Strategic MarketingNiels Didrich Buch joined AkerSolutions in 1999 and wasappointed Chief of Staff & EVPin <strong>2008</strong>. From 2005 Mr Buchwas head of corporatebusiness development in AkerSolutions and previously heheld various other positions inthe company, in corporatelegal. Before this Mr Buchworked ten years with theNorwegian Foreign Service,including six of them abroad inAsia and Europe. Mr Buchholds a law degree from theUniversity of Oslo. As of 31December <strong>2010</strong>, he holds 381shares in the company andhas no stock options. Mr Buchis a Norwegian citizen.Åsmund Bøe was appointedChief Technology Officer &EVP in June <strong>2010</strong>. Mr Bøe isresponsible for the overallcorporate technology portfolioof Aker Solutions. Beforejoining Aker Solutions, Mr Bøeworked 15 years for Schlumbergeron international assignmentsin varied seniorpositions. Mr Bøe brings withhim experience from upstreamoil & gas operations, personneland strategic businessdevelop ment. Mr Bøe holds aBSc (Hons – first class) in offshoremechanical engineeringfrom the Herriot-Watt University,UK. As of 31 December<strong>2010</strong>, he holds no shares inthe company and has no stockoptions. Mr Bøe is aNorwegian citizen.Per Harald Kongelf wasappointed EVP of the EnergyDevelopment & Services businessarea in October <strong>2010</strong>.Mr Kongelf has 25 years’experience in the oil and gasindustry. Mr Kongelf was previouslyEVP of the Products &Technologies business areaand president of AkerSolutions’ process systemsbusiness unit. Before that MrKongelf worked as an investmentmanager in the StatkraftGroup and in Aker Solutions.Mr Kongelf holds an MSc fromthe Norwegian University ofScience and Technology. As of31 December <strong>2010</strong>, he holdsno shares in the company andhas no stock options.Mr Kongelf is a Norwegiancitizen.Sissel A. Lindland returned toAker Solutions in <strong>2008</strong> afterhaving served as SVP HumanResources and acting Chief ofStaff in Aker Yards ASA andSTX Europe since 2006. With abackground in humanresources, organisational andbusiness development, MsLindland has held variousadvisory and managementposition within the Aker groupsince 1984. In 2005-2006 MsLindland was President of AkerBusiness Services. As of 31December <strong>2010</strong>, she has 381shares in the company, andhas no stock options.Ms Lindland is a Norwegiancitizen.Mark Riding was appointedEVP of corporate strategicmarketing in February 2011.Mr Riding will co-ordinate contactand relationship with keycustomers, country strategiesand corporate M&A opportunities.Mr Riding is an oil andgas industry professional withover 28 years experience invaried senior roles and overseasassignments. In his mostrecent position, Mr Riding wasresponsible for deepwatercorporate strategic planning,sales, and technology developmentworldwide at Schlumbergerheadquarters in Paris.Mr Riding holds a BSc (Hons– first class) in mining engineeringfrom the University ofBirmingham, UK. As of 31December <strong>2010</strong>, he holds noshares in the company andhas no stock options.Mr Riding is a British citizen.
Aker Solutions annual report <strong>2010</strong>Corporate governance93Company information<strong>Report</strong>s via the InternetAker Solutions ASASnarøyveien 361364 FornebuPostal address:P.O. Box 169NO-1325 LysakerTelephone: +47 67 51 30 00Telefax: +47 67 51 30 10E-mail: ir@akersolutions.comWeb: www.akersolutions.comThe quarterly and annual reports ofAker Solutions are available via theInternet. Aker Solutions encouragesits shareholders to subscribe tothe company’s annual reports viathe electronic delivery system ofthe Norwegian Central SecuritiesDepository (VPS). Please note thatVPS services (VPS Investortjenester)are designed primarily for Norwegianshareholders. Subscribers to thisservice receive annual reports in PDFformat by email. VPS distributiontakes place at the same time asdistribution of the printed versionof Aker Solutions’ annual report toshareholders who have requested it.Quarterly reports, which are generallyonly distributed electronically, areavailable from the company’s websiteand other sources. Shareholders whoare unable to receive the electronicversion of interim reports, maysubscribe to the printed version bycontacting Aker Solutions’ investorrelations staff.Design:Haugvar Communication & DesignPhotos and illustrations:Aker SolutionsXvisionCOPYRIGHT AND LEGAL NOTICE Copyright in all published material including photographs, drawings and images in this publicationremains vested in Aker Solutions and third party contributors to this publication as appropriate. Accordingly, neither the whole nor any partof this publication can be reproduced in any form without express prior permission. Articles and opinions appearing in this publication do notnecessarily represent the views of Aker Solutions. While all steps have been taken to ensure the accuracy of the published contents, AkerSolutions does not accept any responsibility for any errors or resulting loss or damage whatsoever caused and readers have the responsibilityto thoroughly check these aspects for themselves. Enquiries about reproduction of content from this publication should be directed to AkerSolutions ASA.Translation:Hansen & EngedalLayout:Bolt Communication ASPrint:RKGrafisk AS
© 2011 Aker SolutionsAll rights reservedwww.akersolutions.com
<strong>Annual</strong> report <strong>2009</strong>
ContentsAbout us3 Who we are and what we do4 Highlights <strong>2009</strong>5 Key figures <strong>2009</strong>7 Goals and strategies8 Vision and values10 CEO letterOur business12 Business areas14 Energy Development & Services16 Subsea18 Products & Technologies20 Process & Construction22 Health, safety and environment24 People and performance26 Corporate responsibility28 Aker Solutions and the UN Global CompactOur performance32 Board of Directors’ report50 <strong>Annual</strong> accounts – group104 <strong>Annual</strong> accounts – parent company115 Auditor’s report116 Share and shareholder information120 Analytical informationOur organisation and governance124 Corporate governance130 Board of Directors132 Executive management team134 Company information
About usHistorical factsWho we are andwhat we doAker Solutions delivers engineering, construction,manufacturing, technology products, maintenanceand other specialised services, often as total solutionsfor complete projects.Global scaleAker Solutions has annual revenues totalling NOK 54 billion andapproximately 30 000 people including approximately 8 000contract staff. We have offices in around 30 countries.Markets and customersAker Solutions delivers products, services and solutions tocustomers worldwide in the oil and gas, refining and chemicals,mining and metals, power generation, onshore LNG, biofuels,carbon capture, acid plants, nuclear and water treatmentindustries.Our deliveries enable our customers to build, efficiently operateand effectively maintain their facilities. Examples includecomplete offshore platforms, drilling equipment packages andsubsea systems for oil and gas developments, and major miningand metals production facilities.OwnershipAker Solutions is listed on the Oslo Stock Exchange with theticker “AKSO”. Aker Solutions’ largest shareholder is AkerHolding AS, with a 40.27 percent stake in the company. AkerHolding AS is owned by Aker ASA (60 percent), the NorwegianGovernment (30 percent), SAAB AB (7.5 percent) and Investor AB(2.5 percent).The companies brought togetherto create Aker Solutions wereestablished in the first half ofthe 19th century, during theIndustrial Revolution. Cuttingedgetechnology and engineeringproviders from the very beginning,they delivered products includingsteam engines for rail and marineuse and a range of industrialironworks.Over the next 100 years, thebusinesses grew significantly. In themid-1900s, both Aker and <strong>Kvaerner</strong>were international corporations withactivities in ship building, hydropower, wood processing and otherprocess operations, mechanicalworkshops and other industries.Through the 1970s, 80s and 90s,they developed their capabilitiesand experience as suppliers ofcomplete solutions to offshoreand onshore oil and gas andprocessing projects. They eachgrew - organically and throughinternational acquisitions - to beleaders in their markets.On 11 March 2002, the former<strong>Kvaerner</strong> group and the AkerMaritime group (comprising the oiland gas activities of the wider Akergroup) were merged, and started tooperate as one company under thename <strong>Kvaerner</strong>. On 29 March 2004,following a restructuring of bothAker and <strong>Kvaerner</strong>, Aker <strong>Kvaerner</strong>was established. On 2 April it waslisted on the Oslo Stock Exchange.Four years later, on 3 April <strong>2008</strong>Aker <strong>Kvaerner</strong> changed its name toAker Solutions.Aker Solutions annual report <strong>2009</strong> 3
About usHighlightsHighlights <strong>2009</strong>Achievements■■Successful project deliveries and completions:- Adriatic LNG (ED&S)- Aker H-6e (ED&S)- Reliance KG-D6 (Subsea)- Boddington gold mine expansion (P&C)- Sempra LNG’s Cameron LNG project (P&C)- Yansab polyolefins (P&C)- Ten of ten drilling packages (P&T)- First oil delivered at Eni’s Oyo field developmentoffshore Nigeria (Subsea)Major contract awardsTo learn more about Aker Solutions pleaserefer to Powered to perform <strong>2010</strong> availablefrom www.akersolutions.com■■■■■■■■■■■■■■■■Goliat, subsea EPC (NOK 2.3 billion)TransCanada, natural gas power plant(CAD 400 million)Sakhalin 1, GBS (USD 600 million)Kollsnes, EPC (NOK 1.5 billion)Trym and Oselvar, subsea EPC(NOK 400+350 million)Kashagan, field hook-up (USD 1.6 billion)Shtokman, development FEED and concept(Euro 25 million)Oseberg B, drilling upgrade (NOK 1.3 billion)AcquisitionsPowered to perform <strong>2010</strong>Financial calendar <strong>2010</strong>8 April <strong>Annual</strong> General Meeting <strong>2010</strong>23 April 1st quarter results <strong>2010</strong>12 August 2nd quarter results <strong>2010</strong>22 October 3rd quarter results <strong>2010</strong>2 December Capital Markets Day■■■■■■Strengthened position within deepwater light wellintervention by acquiring the remaining 68 percentof the shares in Aker Oilfield ServicesTechnology products portfolio expanded byacquiring 100 percent of the shares in MidsundBruk and the remaining 50 percent of Wirth GmbH,both leading technology, equipment andmanufacturing companies serving the energysector for oil and gas drilling products as well asmining and civil construction productsAker and Aker Solutions have agreed to becomeequal partners in Aker Clean Carbon; AkerSolutions’ shareholding was increased from 30 to50 percent through an equity issue4Aker Solutions annual report <strong>2009</strong>
About usKey figuresKey figures <strong>2009</strong> 1<strong>2009</strong> <strong>2008</strong> <strong>2007</strong> 2006 2005Orders and resultsOrder backlog 31 December NOK mill 56 276 58 016 58 261 59 695 48 522Order intake NOK mill 52 000 55 590 57 942 62 271 51 937Operating revenues NOK mill 54 077 58 252 57 957 50 592 36 940EBITDA NOK mill 4 368 3 382 3 913 2 872 1 816EBITDA-margin Percent 8.1% 5.8% 6.8% 5.7% 4.9%Net profit NOK mill 2 331 1 513 2 464 1 294 1 052Cash flowCash flow from operational activities NOK mill 4 245 (868) 2 675 2 636 3 674Balance sheetBorrowings NOK mill 7 515 6 716 1 615 1 568 5 279Equity ratio Percent 22.8% 20.1% 25.5% 25.8% 16.5%Return on equity Percent 27.2% 20.0% 33.1% 21.1% 34.8%Return on captial employed Percent 14.4% 13.9% 26.0% 22.4% 10.1%ShareShare price 31 December NOK 75.45 45.00 144.50 155.60 82.90Dividend per share 2 NOK 2.60 1.60 3.00 2.00 1.00Basic earnings per share (NOK) NOK 8.40 5.34 8.84 4.53 3.78Diluted earnings per share (NOK) NOK 8.39 5.34 8.84 4.53 3.78EmployeesEmployees 31 December Full time equivalents 22 133 23 360 21 298 19 230 18 324HSELost time incident frequency Per million worked hours 0.90 0.93 0.68 1.06 1.27Sick leave rate Percent of worked hours 2.18 2.27 2.41 2.28 2.741) Continuing operations only.2) Proposed dividends for <strong>2009</strong>.Operating revenuesAmounts in NOK millionP&C 9 534EBITDAAmounts in NOK millionP&C 484Order intakeAmounts in NOK millionP&C 6 913Order backlogAmounts in NOK millionP&C 9 037ED&S 19 827ED&S 1 116ED&S 26 887ED&S 25 396Subsea 1 399Subsea 12 972P&T 12 729P&T 1 304Subsea 12 568Subsea 12 395P&T 6 621P&T 9 632Aker Solutions annual report <strong>2009</strong> 5
About usROV panel on a subsea tree – Aker Solutions has deployed morethan 600 subsea trees around the world6Aker Solutions annual report <strong>2009</strong>
About usGoals and strategiesGoals and strategiesAker Solutions shall be the preferred partner for solutions in theenergy and process industries through:Maintaining an uncompromising emphasis onhealth, safety and the environment (HSE)■■■■■■Continue to reinforce and develop our Just Care HSE cultureFurther develop as a responsible corporate citizenEnhance reputation as the preferred employer in our selected marketsBeing the world leader in deep waters andharsh environments■■■■■■Integrated subsea systems and drilling packages for deep andultra-deep watersFloaters and concrete marine structures, field developments,maintenance and modifications work and mining & metals facilities inharsh environments and challenging climatesEnvironmentally-friendly solutions in vulnerable areasUtilising and developing unique technologiesand know-how■■■■■■Ongoing development of leading drilling, subsea and well interventionproducts and technologiesOutstanding global experience in harsh environment oilfielddevelopments, mining and metals and petrochemicals processingNovel solutions for carbon capture, power construction andenvironmental improvement projectsGrowing lifecycle services■■■■■■Customer partnership throughout life of fieldProduct- and technology-based oilfield and well servicesPredictable performance through long-term lifecycle servicesContinuously improving cost competitiveness■■■■■■Flexible cost baseOptimised organisation and delivery modelsEfficiency improvements to create further added value for our customersAker Solutions annual report <strong>2009</strong> 7
About usVision and valuesAker Solutions employees at work in our Port Klangworkshop in Malaysia8Aker Solutions annual report <strong>2009</strong>
About usVision and valuesVision and valuesOur vision is to be the preferred partner for solutionsin the energy and process industries through livingour values. Our values are essential for building trust– in each other, in our partners, in our customers andwith society. Our corporate values lend support andguidance in day-to-day priorities and decisionmaking.The success of our business is directly related to our values. They are the principlesthat guide all our policies, operations and, ultimately, our behaviour. Our values areour compass. They help us to navigate through our working day. Acting inaccordance with our values promotes sound actions and reinforces Aker Solutions’long term relationships with our many and varied stakeholders.Our people’s dedication and know-how allow Aker Solutions to deliver on itscommitments to customers, employees, and the communities in which we work. Aneffective corporate culture must remain dynamic and responsive. Solid values are thefoundation that enables Aker Solutions to achieve sustainable, long term industrialdevelopment.“Our values are thecompass that guides ourpolicies and operations and,ultimately, our behaviour”After all, withoutcustomer trustand satisfaction,the rest doesn’tmatter. Goodcustomerreferences build ourreputation – and theonly way to achievethis is by consistent andpredictable performance. Our customerswill recognise us for our global executionexcellence. We find new ways, alwayslinked to real customer needs and businesspriorities.All incidents can beprevented. We strivecontinuously forzero accidents topersonnel, materialand non-materialassets. We focus onemployee health and oncontinuously improvingthe work environment.We conduct our operations through efficient useof materials and energy, with minimum waste anddamage to the environment. We design productsand services to have no undue environmentalimpact, to be safe and to be efficient in consumingenergy and natural resources. We seek to ensurethat our products can be recycled or disposed ofsafely.”We take personal responsibility for HSE becausewe care about people, the environment and ourcompany.”Just CareIn the end, it comesdown to the talent andmotivation of you andme. Delivering strongresults is impossiblewithout a highly capableworkforce. We learnon the job, throughchallenging tasks,coaching and training.Development of people and teams in ourcompany has one purpose – to create afoundation for long-term sustainable valuecreation through efficient project execution anda sound business operation. We respect andencourage diversity and build strong, energisedand effective teams – and we have fun together,making us even better.Our goal is to be the preferred employer in ourindustry.We listen hard and talkstraight: no sugarcoating, no filters.We value early,accurate and reliablecommunication – afterall, the first problem weencounter is usually theeasiest one to cope with.We challenge each other. Thebest decisions are made when different opinionsand different cultures meet in open and directdialogue. We expect the highest standards ofethical behaviour and integrity – from all of us,everywhere.Once decisions aremade we combineall our efforts andfocus all our energieson execution. Weare accountable andsolutions-oriented,focusing on the rightdetails at the right time.We follow through and ensureaccountability. We believe in empoweringpeople close to the action to take responsibility.Hands-on does not mean hands-in. We stimulateentrepreneurship and challenge bureaucracy,complicated hierarchies and ‘silo’ mentalities.We are a single company.When doing a job, weunderstand boththe risks and theopportunities involvedand know how tomanage them. Wetake pride in deliveringas we promise. Makingmoney creates newopportunities and theresources for going forward, both for us and forour customers and partners. Commercial edgebenefits us all. We reward performance - whatyou achieve; and alignment with our values –how you behave.Aker Solutions annual report <strong>2009</strong> 9
About usCEO letter”We will continue to focus on improving ourmargins, on further developing the structure ofour business, and on increasing our operationalefficiency and cost competitiveness”10Aker Solutions annual report <strong>2009</strong>
About usCEO letterStrengthening our performanceDespite <strong>2009</strong> being a challenging year, it has been a time of importantachievements. We have delivered major projects such as the H-6e drillingrigs, Adriatic LNG, Boddington gold mine and several others. We have atthe same time restructured our business, invested strategically toposition the company for further growth and adjusted our currentcapacity to adapt to the new reality in our markets.Our focus on HSE continues through ourJust Care culture. Our incidentfrequencies and sick leave numbers areall going down compared to <strong>2008</strong>. Wealso see the seriousness of injuries beingreduced. Further serious incidentreduction through the Just Rulescampaign and increasing our focus on theenvironment are two of our currentpriorities. With this increasedenvironmental awareness we expect toinitiate and drive through furtherimprovements in <strong>2010</strong>.Despite our continuous work andstrong focus on HSE and reducingserious incidents, most regrettably wehad three fatalities during <strong>2009</strong>. Oneemployee died in a helicopter accidentand two others died as the result ofaccidental falls. These tragic incidentshave each been investigated in order toidentify the lessons that can be learnedfrom them. We must do all we can toreduce the risk of similar eventshappening again.Strategic directionAgainst the backdrop of a globaleconomic downturn, I am very proud tosee that our efforts to secure ourcompetitiveness have paid off. We havemanaged to win several key projects thatfit well with our strategy, and which havestrengthened the quality of our orderbacklog. Together with an increasedshare of our revenue coming fromservices, the high quality backlogincreases the predictability of our overallperformance.Our strategic direction remains firm.We will focus on growth and performanceimprovement along three main axes: inthe deep water and harsh environmentsegments; within our services offering;and finally through a continued focus oncost competitiveness.Although the ongoing financial turmoilhas led to several of the more capitalintensivedeepwater projects beingpostponed, we are convinced that thetrend towards deeper waters will continue.As one third of all undiscoveredhydrocarbon resources are believed to bein areas with cold or otherwise harshenvironments, we also remain committedto this element of our strategy. Deepwaters and harsh environments are bothhigh growth, high margin markets. Theyare also markets in which Aker Solutionshas clear competitive advantages and astrong global track record.Positioning for growthOver the past three years we haveacquired businesses like Wirth GmbH andQserv Ltd - now Aker Wirth and AkerQserv. Our most recent major acquisitionin <strong>2009</strong> was of the remaining shares inAker Oilfield Services. Each of theseacquisitions complements andstrengthens our service and technologyportfolio and will work to drive futuregrowth in our service revenues.Through consistent excellence ofexecution, our service offering typicallydelivers substantial added value for ourcustomers as well as providing highermargin opportunities for us. This business,to an increasing extent delivered on ourown, growing installed base, secures amore stable source of revenue over time.Cost competitivenessLast but not least, we continue to strivefor operational efficiency and costcompetitiveness in everything that we do.We have cut our underlying cost byaround NOK 1 billion over the past yearand at the same time reduced our directcosts. Constantly focusing on costcompetitiveness is vital if we are tomaintain our market position and securethe long-term relationships we need tobecome the preferred lifecycle partner forour present and future customers.Summing up, the overall goal of ourstrategy is to deliver strengthenedperformance. We will continue to focus onimproving our margins, on furtherdeveloping the structure of our business,and on increasing our operationalefficiency and cost competitiveness.We have a strong belief in the future, andwe have a healthy order backlog. At thesame time, we need to win more work,and we have a list of opportunities, wherewe will be aiming for a good hit rate. Thekey factor in succeeding with our strategyis really our people. Our plans are great,but if we are not able to put the rightpeople in the right place, and to developthe right performance culture, we will fail.Culture means people working together.People build culture. To further strengthenour performance culture is a key action in<strong>2010</strong>, and beyond.Simen LieunghPresident & CEOAker Solutions ASAAker Solutions annual report <strong>2009</strong> 11
Our businessClose up of the PowerTrac® Cone Crusher which wonthe OTC Spotlight on New Technology Award in <strong>2007</strong>12Aker Solutions annual report <strong>2009</strong>
Our businessBusiness areasBusiness areasEnergyDevelopment &ServicesSubseaProducts &TechnologiesProcess &ConstructionAker Solutions’ EnergyDevelopment & Services businessarea (ED&S) develops new oil andgas production facilities, bothoffshore and onshore, and deliversoperational services for the entirelifecycle of such facilities. Wedeliver the full value chain fromstudies, front-end design anddetailed engineering, throughprocurement, project management,fabrication and hook-up, toinstallation, maintenance andmodifications.Aker Solutions’ Subsea businessarea (Subsea) is an establishedprovider of subsea productionsystems and technologies. Wecombine these offerings withreservoir evaluation services,installation of subsea equipment,maintenance services on subseaproducts, well intervention servicesand decommissioning. Ourability as a complete life of fieldsubsea partner is unrivalled in themarketplace.Aker Solutions’ Products &Technologies business area (P&T)provides innovative drilling andtopside solutions to the upstreamoil and gas industry, based onproprietary technology and knowhow.Our key deliverables includeadvanced drilling equipment,systems and risers, upstreamprocessing technologies andmooring systems, as wellas loading and offloadingtechnologies.Aker Solutions’ Process &Construction business area (P&C)is a global provider of onshoreengineering and constructionservices to the natural resourcesand energy markets. We supplyniche process expertise with hightechnology and know-how contentfor projects across chemicals,polymers, gas processing andrefining; mining and metals;onshore liquefied natural gas (LNG)receiving terminals and storagetanks; power generation; biofuels;carbon capture and storage;acid plants; nuclear; and watertreatment.Page 14 Page 16 Page 18 Page 20Aker Solutions annual report <strong>2009</strong> 13
Our businessEnergy Development & ServicesThe Gjøa semisubmersible production platform offshoreAker Solutions’ yard at Stord, Norway14Aker Solutions annual report <strong>2009</strong>
Our businessEnergy Development & ServicesWell positionedin key marketsAker Solutions’ Energy Development & Services business area (ED&S)develops new oil and gas production facilities, both offshore andonshore, and delivers operational services for the entire lifecycle of suchfacilities.Highlights <strong>2009</strong>■■■■■■■■■■■■■■Successful delivery of the processand utility barge project for oilproduction on the giant Kashaganoilfield in the north Caspian Sea,offshore KazakhstanDelivery of two Aker H-6e drilling rigs(Aker Barents and Aker Spitsbergen)to Aker DrillingAwarded significant contracts fromAgip KCO for hook-up work of PhaseI on the Kashagan field, in partnershipwith SaipemHigh activity and strong order intakein maintenance and modifications,including work on 50 installations inthe North SeaAwarded first significant engineering,procurement, construction andinstallation (EPCI) contract forupgrading the drilling facilities of theOseberg B platform in the North Seafor StatoilAwarded contracts from ExxonNeftegas for the design, constructionand delivery of the Arkutun-Dagigravity base structure (GBS) for theSakhalin 1 projectIn partnership with Technip Franceand SBM Offshore, awarded acontract for the concept definition andFEED of the floating production unitfor the Shtokman Gas & CondensateField Phase I projectWith experience from more than 20percent of the designs of floating oil andgas-related facilities in the world, few ifany contractors can match our wideportfolio of innovative solutions andservices.We are the market leader in the NorthSea. Within maintenance andmodifications, Aker Solutions is the onlymajor contractor with a presence in boththe Norwegian and the UK markets.Over the years we have achieved astrong position in the northern Caspianregion through our presence inKazakhstan where, since 2004, we haveplayed a significant role in developing thegiant Kashagan field.Our key goals are to retain our numberone position in our home market and toestablish a basis for further internationalgrowth through targeting projects whereour key deepwater and arctic technologiesare in demand.High activityIn <strong>2009</strong>, Aker Solutions completed thedelivery of six process modules to theKashagan field for Agip KCO; two H-6erigs (Aker Barents and Aker Spitsbergen)to Aker Drilling; and the Adriatic LNGterminal for ExxonMobil, offshore Italy.In addition we continued to carry outmaintenance and modifications work on50 installations in the North Sea, includinga key role in Statoil’s Statfjord late lifeproject.ED&S had annual revenues of NOK19 827 million, 9 500 employees and2 700 contract staff at year end <strong>2009</strong>.Within new-build projects, our frontenddesign hub in Oslo is a world-classinnovation centre. Our three constructionyards at Egersund, Stord and Verdal inNorway operate as centres for differentconstruction specialties. We offer highvalue engineering through our operationsin India and Malaysia. We provide addedvalue engineering and fabrication optionsthrough a range of internationalpartnerships.Within maintenance and modifications,our engineering centres in Stavanger andAberdeen and our highly skilled offshoreoperators deliver innovative solutions thatoffer lower costs, faster deliveries andenhanced long-term value for ourcustomers in the North Sea.Well positionedWe anticipate a good, stable maintenanceand modifications market, with hightendering activity in <strong>2010</strong>. Low pressureproduction, tie-ins, safety and extendedlifetime upgrades are all examples ofprojects within our maintenance andmodifications portfolio aimed at extendingfields’ production lifetimes.We expect some delays in new buildactivities. However, the long-term outlookfor strategic new build activity is stillpromising. We are well positioned in allour target markets.Development EBITDANOK million2 000Key figures ED&S <strong>2009</strong> <strong>2008</strong> <strong>2007</strong>1 5001 0005000-500<strong>2007</strong><strong>2008</strong><strong>2009</strong>Operating revenue NOK million 19 827 23 074 25 167EBITDA NOK million 1 116 (329) 1 505EBITDA margin Percent 5.6% (1.4%) 6.0%Order intake NOK million 26 887 16 937 20 159Order backlog (as of 31 December) NOK million 25 396 18 625 24 644Number of employees (as of 31 December) Man years 9 535 9 861 9 420Aker Solutions annual report <strong>2009</strong> 15
Our businessSubseaThe heart of a subsea production system: a subsea treeat our manufacturing facility in Tranby, Norway16Aker Solutions annual report <strong>2009</strong>
Our businessSubseaThe preferred subseapartnerAker Solutions’ Subsea business area (Subsea) is one of the world’s topfour providers of subsea systems and related services. We aim to be apreferred partner throughout the value chain of subsea and sub-surfacetechnologies, solutions and services for the oil and gas industry.Highlights <strong>2009</strong>■■■■■■■■■■■■Successful restructuringof Subsea has resulted inreduced cost base as well asimproved competitiveness andorganisational efficiencySolid project win rate in achallenging marketAwarded three EPC contractson Norwegian Continental Shelf:NOK 2.3 billion Goliat subseafrom Eni Norge AS; and DongEnergy’s Trym and OselvarprojectsAcquisition and integrationof Aker Oilfield Services, anddelivery of installation vesselSkandi Santos to PetrobrasExpanded important long-termwell service agreements onNorwegian and UK continentalshelvesContinued strong growth inBrazilOur offerings cover all phases of the life offield, from concept screening and designthrough manufacturing, fabrication,installation and commissioning tooperational support, maintenance andservices. Our portfolio of products andservices includes:■■■■■■■■■■■■■■■■■■■■■■■■reservoir evaluation servicessubsea production systemssubsea treessubsea control systemssubsea manifolds and templatessteel tube umbilicals and subseapower cablessubsea processing and boostingtie-in and connection systemssurface and subsea wellheadsmarine operations and subseainstallation services (SURF)lifecycle service supportwell intervention technologies andservicesMain project deliveriesWe have successfully completeddeliveries of subsea production systemsto, and seen the first hydrocarbonsproduced from, a number of ourcustomers’ fields in <strong>2009</strong>. In April,Reliance Industries produced first gasfrom its giant D1/D3 field developmentoffshore India. Italian oil company Enibrought the Longhorn gas field in the USGulf of Mexico on stream in Novemberand the Oyo field offshore Nigeriaproduced first oil in December.We have successfully installed theThunder Hawk floating production unit inthe US Gulf of Mexico, utilising ourflagship deepwater construction vesselBOA Sub C.The raw seawater injection pumpsystem for Statoil’s Tyrihans field wassuccessfully installed subsea in <strong>2009</strong>. Thesystem is expected to becomeoperational in <strong>2010</strong>, increasing oilrecovery by up to 10 percent.In <strong>2009</strong>, Subsea had operatingrevenues of NOK 12 972 million, aroundthe same level as in <strong>2008</strong>. This has beenpositively influenced by strong growth inthe lifecycle services segment, butnegatively impacted by low vesselutilisation.The business area employsapproximately 6 400 skilled anddedicated people, including 1 100contract staff, based in 27 locationsaround the world.Outlook for <strong>2010</strong>Due to lower oil and gas prices as well ascapital restraints in the market, a largenumber of subsea field developmentswere postponed or cancelled in <strong>2009</strong>.While some of these projects will beawarded in <strong>2010</strong>, the timing of others isstill uncertain. Nevertheless, AkerSolutions expects some growth in subseainfrastructure spending in <strong>2010</strong> andbeyond - driven in particular by fielddevelopments in Brazil, the North Sea,West Africa and South East Asia.Development EBITDANOK million2 000Key figures Subsea <strong>2009</strong> <strong>2008</strong> <strong>2007</strong>1 5001 0005000<strong>2007</strong><strong>2008</strong><strong>2009</strong>Operating revenue NOK million 12 972 13 731 12 050EBITDA NOK million 1 399 1 709 1 176EBITDA margin Percent 10.8% 12.4% 9.8%Order intake NOK million 12 568 10 537 15 077Order backlog (as of 31 December) NOK million 12 395 11 204 13 204Number of employees (as of 31 December) Man years 5 276 5 251 4 377Aker Solutions annual report <strong>2009</strong> 17
Our businessProducts & TechnologiesAker Solutions’ CLIP Riser TM joint assembled with buoyancy atour manufacturing facility in Rio das Ostras, Brazil18Aker Solutions annual report <strong>2009</strong>
Our businessProducts & TechnologiesWell positioned; growinglifecycle servicesAker Solutions’ Products & Technologies business area (P&T) providesinnovative drilling and topside solutions to the upstream oil and gasindustry. These solutions are delivered to two main segments: deepwaterand harsh environment drilling, and floating production.Highlights <strong>2009</strong>■■■■■■■■■■■■■■On-schedule delivery of tentopside drilling packagesThree deepwater CLIP Risersare now operationalSignificant growth in thelifecycle services business;revenue up 50 percentcompared to last yearSuccessful delivery of 185 setsof deck machinery during <strong>2009</strong>and on-schedule delivery of thefirst large drilling rig mooringsystem to ChinaDelivery of the first two bowloading systems to be used inthe Gulf of MexicoLaunched game-changingmodular top drive: the MHMDDM 1000 ACEntered into agreements topurchase the remaining sharesin Aker Wirth GmbH and STEPOffshore ASPresent in all major oil and gas regionsworldwide, we provide engineering,procurement, fabrication and operationalsupport for key deliverables including:■■Advanced drilling equipment, solutionsand CLIP Risers for deepwaterapplications■■■■■■Upstream processing technologies,including monoethylene glycol (MEG)systemsMooring systemsLoading and offloading technologiesOur increasing installed base providessignificant support opportunities. We offer24/7 support to our customers includingthe world’s largest oil companies,contractors and shipyards.In <strong>2009</strong>, we had operating revenues ofNOK 12 729 million with 3 000 employeesand 800 contract staff contributing to ourinternational business in around 30locations worldwide.Main deliveriesOur main project deliveries in <strong>2009</strong>included on-schedule delivery of ten totaldrilling equipment packages. Our drillingrisers business has successfully deliveredfive drilling risers for Aker Drilling, Maerskand Queiroz Galvao Óleo e Gás.P&T’s process systems businesssuccessfully delivered many oil, gas andvolatile organic compounds (VOC)process modules including major modularsystem deliveries in hydrate inhibition,water injection, vapour recovery andheavy oil.During <strong>2009</strong> we successfully delivered185 sets of deck machinery and the firstlarge drilling rig mooring system to China.In addition, the first two bow loadingsystems to be used in the Gulf of Mexicowere delivered.Outlook for <strong>2010</strong>Aker Solutions benefits from a high qualitydrilling equipment backlog extending into2011 and beyond. In <strong>2010</strong> six majordrilling equipment deliveries arescheduled of which several havesynergies with previous deliveries. Wehave also secured a major drillingupgrade order on the NorwegianContinental Shelf for Oseberg B.Significant investments have beenmade in developing a wide range oflifecycle services, including simulatorbasedtraining and other state-of-the-art“eServices”. We have also investedsignificantly in service bases both in Riodas Ostras, Brazil and Houston, USA tosecure the highest level of service to ourcustomers.The long-term fundamentals are strongfor new builds as industry analystsestimate approximately 100 new drillingfloaters will be needed by 2020. We alsoforesee considerable movement in theBrazilian market where we already have astrong and increasing presence.Development EBITDANOK million1 500Key figures P&T <strong>2009</strong> <strong>2008</strong> <strong>2007</strong>1 <strong>2009</strong>006003000<strong>2007</strong><strong>2008</strong><strong>2009</strong>Operating revenue NOK million 12 729 11 691 10 154EBITDA NOK million 1 304 967 744EBITDA margin Percent 10.2% 8.3% 7.3%Order intake NOK million 6 621 17 050 8 033Order backlog (as of 31 December) NOK million 9 632 15 377 9 268Number of employees (as of 31 December) Man years 3 027 2 860 1 962Aker Solutions annual report <strong>2009</strong> 19
Our businessProcess & ConstructionProcess & Construction: sustainable solutions for theenergy and resource industries20Aker Solutions annual report <strong>2009</strong>
Our businessProcess & ConstructionPositioning for achanging worldAker Solutions’ Process & Construction business area (P&C) is a global providerof onshore engineering, procurement, construction and commissioningservices to the natural resources and energy markets.Highlights <strong>2009</strong>■■■■■■■■■■■■Awarded another major contracton a gas-fired power projectin Canada for TransCanadaEnergy’s GTA South projectCompleted the detailedengineering, procurement,and construction management(EPCM) Boddington gold mineproject in Western Australia, oneof the largest gold processingfacilities in the worldAwarded the EPCM servicescontract on the ToromochoProject for Minera Chinalco PeruSA; Toromocho will becomePeru’s largest copper mine in2012The Aker Solutions andIHI partnership completedall performance tests andreceived Notice of SubstantialCompletion for Sempra LNG’sCameron LNG receiving terminalin Louisiana, USADelivered the YANBU NationalPetrochemical Company(YANSAB) polyolefins plant inSaudi Arabia, with joint venturepartner SinopecOpened new state-of-the-artfabrication facility in Ontario,Canada, to manufactureAker Solutions’ proprietaryequipment for acid plants,pulping, and oil and gas andchemical processing facilitiesWe supply niche process expertise withhigh technology and know-how content forprojects across chemicals, polymers, gasprocessing and refining; mining and metals;onshore LNG terminals and storage tanks;power generation; biofuels; carbon captureand storage; acid plants; nuclear; and watertreatment.Our 28 major operations provideservices across all continents, spanningproject management, technology, design,procurement, construction and otherservices. Our customers are facingincreasing challenges in finding sustainablesolutions to the huge demands for energyresources. Our technology portfolio,strategic partnerships, global resourcesand proven project execution excellenceare focused on helping to address thesechallenges and ensuring our effectivenessas a partner in sustainability.■■■■■■Mining and metalsWe possess strong capabilities in fastgrowingsegments like copper, gold,nickel, uranium, iron ore and steelmaking, and particular regional strengthand experience in the Americas andAustralia. We are currently number onein South America and number twoglobally in terms of market share.Energy and environmentalWe provide services in marketsspanning power plants, nuclear, carboncapture, renewable energy, biofuels andwater management.Oil, gas and processOur LNG regasification terminal positionis particularly strong in North America,where we are ranked number one interms of the number and value ofcontracts. We possess niche technologyand know-how within chemicals andpetrochemicals and also serve thegasification, onshore oil and gasprocessing and refining sectors.In <strong>2009</strong>, P&C had annual revenues of NOK9 534 million, 3 300 employees and aflexible resource base of 3 000 contractstaff.Capitalising on leading positions<strong>2009</strong> saw further strengthening of ourservice offering and customer focus, withcontinued efforts to build upon our globalexecution capabilities and our technologycontent in promising areas.We have a very strong position in miningand metals, particularly in South Americawhere we are currently executing six worldscale projects. In oil, gas and process in<strong>2009</strong> we continued to build on our strategicpartnerships, allowing us to differentiate withkey technology positions and know-how.In the US and UK we are currentlyexecuting four large power plant projects.Biofuels are also an important part of ourgrowing energy and environmental portfolioand, in <strong>2009</strong>, Aker Solutions signed an EPCcontract to build the world’s most advancedCO 2 (carbon capture) test facility in Norway.We also have a solid position in providingniche nuclear decommissioning and wastehandling for over 40 years in the UK.Outlook for <strong>2010</strong>We will capitalise on our current strongpositions in mining and metals, and oil, gasand process, as well as further penetratingfuture growth markets in energy andenvironmental.Development EBITDANOK million8007006005004003002001000<strong>2007</strong><strong>2008</strong><strong>2009</strong>Key figures P&C <strong>2009</strong> <strong>2008</strong> <strong>2007</strong>Operating revenue NOK million 9 534 10 313 11 351EBITDA NOK million 484 759 661EBITDA margin Percent 5.1% 7.4% 5.8%Order intake NOK million 6 913 10 951 14 683Order backlog (as of 31 December) NOK million 9 037 12 988 12 712Number of employees (as of 31 December) Man years 3 343 4 098 4 259Aker Solutions annual report <strong>2009</strong> 21
Our businessHealth, safety and environmentTaking personal responsibility for HSEOne dangerous incident is one too many. Aker Solutions’guiding principle is that all incidents are preventable.Taking care of health, safety and theenvironment (HSE) is a core value in AkerSolutions. It commits each and every oneof our people to promoting better HSEperformance in their daily life.In Aker Solutions the core HSE value isexpressed in our HSE Mindset:■■All incidents can be prevented. Westrive continuously for zero harm topersonnel, material and non-materialassets.■■■■We focus on employee health and oncontinuously improving the workenvironment.We conduct our operations throughefficient use of materials and energy,with minimum waste and damage tothe environment.■■We design products and services tohave no undue environmental impact,to be safe and to be efficient inconsuming energy and naturalresources. We seek to ensure that ourproducts can be recycled or disposedof safely.Just Care Just Care - our HSE mindsetRisk observationsPer employee per year3.5Near missesPer employee per year0.203.02.52.00.150.101.520052006<strong>2007</strong><strong>2008</strong><strong>2009</strong>0.0520052006<strong>2007</strong><strong>2008</strong><strong>2009</strong>Task risk analysesPer employee per yearInspectionsPer employee per yearHSE trainingPercent of worked hours124.02.03.510863.02.52.01.51.01.51.0420052006<strong>2007</strong><strong>2008</strong><strong>2009</strong>0.520052006<strong>2007</strong><strong>2008</strong><strong>2009</strong>0.520052006<strong>2007</strong><strong>2008</strong><strong>2009</strong>Leading indicatorsSome of the key activities that contribute ot improved HSE performance and prevention of incidents aremeasured and encouraged through a set of leading indicators.22Aker Solutions annual report <strong>2009</strong>
Our businessHealth, safety and environmentDriven by careOur Just Care programme has helped engage our employees aroundthe world through a simple message: we take personal responsibility forHSE, based on caring for people, the environment, and the company.LTIF 1Per mill. worked hours, incl. subcontr.2.52.01.5As an organisation we work systematicallyto ensure continuous improvement in ourHSE performance. The HSE Policydefines our high expectations and theHSE operating system helps ourorganisation to move continually towardsattaining higher goals.We know some particular types ofwork activity account for many of theserious incidents in our industry. Todirectly target those incidents we haveintroduced a series of specific safetymeasures that we call our Just Rules. Thepurpose of these rules is to preventinjuries and save lives. Our Just Rules aremandatory for all Aker Solutionsoperations.The health and wellbeing of our peopleis fundamental to our Just Care culture.We believe that providing people with theright challenges and a positive, flexibleworking environment is essential tosustaining a motivated, high performanceculture.In Aker Solutions we have an importantrole in sustainable development. We mustalways work to minimise any negativeimpact our operations may have on theenvironment. At the same time we have todevelop solutions that help our customersimprove their environmental performance.The right people with the right attitudesare absolutely vital to success in HSE.Our tools and systems are worthlesswithout the competence and behavioursthat make them work. If we cannot do ajob safely, without harm to people or theenvironment, we will not do the job. Thisis the leadership that Just Caredemands.1.00.52003200420052006<strong>2007</strong><strong>2008</strong><strong>2009</strong>TRIF 2Per mill. worked hours, incl. subcontr.87654324.02003200420052006<strong>2007</strong>Sick leave ratePercent of worked hours<strong>2008</strong><strong>2009</strong>3.5<strong>2009</strong> <strong>2008</strong>3.0Energy (MWH) 588 206 623 0492.5Energy intensity (MWH per million worked hours) 5 966 6 560CO 2 emissions (tonnes) 136 797 146 6542.02003200420052006<strong>2007</strong><strong>2008</strong><strong>2009</strong>CO 2 emissions intensity (tonnes per million worked hours) 1 387 1 544Recycled waste (tonnes) 34 494 22 021Total waste (tonnes) 45 744 35 756Recycling factor (%) 75.4 61.6Hazardous waste (tonnes) 2 769 2 200Serious injuries■ <strong>2007</strong> ■ <strong>2008</strong> ■ <strong>2009</strong>242016128“Taking personal responsibility for the people andenviroments we influence is crucial to our future”40FatalitiesDisablinginjuriesOther seriousinjuriesSimen Lieungh, President & CEO, Aker Solutions1) Lost time incident frequency2) Total recordable incident frequencyAker Solutions annual report <strong>2009</strong> 23
Our businessPeople and performancePeople - our mostvaluable assetAker Solutions’ achievements and profitability are generated by ourpeople - people who take on challenges and deliver solutions.Teamwork, know-how and skills are thedriving forces for enhanced performanceand continual business development. Ourvalues guide the development of ourpeople and the company. They are thecore of our common culture.We are committed to our people and toestablishing a working environment that issafe, tolerant, and fair.Continuous personal and professionaldevelopment is vital to the competitivenessof Aker Solutions. The power of thecompany’s collective know-how reinforcescustomer confidence and enhances ourability to win new contracts and executethem profitably. We seek to give ourpeople challenging assignments andample opportunities for development andgrowth.Creating people advantage throughtimes of economic instabilityDuring <strong>2009</strong> Aker Solutions has focusedon reducing costs and increasingflexibility through restructuring andworkforce reductions. Throughout thisprocess we have worked to maintain theright balance of employees and contractstaff.At year-end <strong>2009</strong> the total workforcewas 29 937, reduced by approximately4 000 people. To mitigate short-term jobinsecurity, in some locations voluntary,temporary lay-off programmes have beenimplemented. Employee turnover in <strong>2009</strong>averaged 6.7 percentAt the same time we have beenpositioning the organisation for the futurerecovery of our markets through theretention and continuing development ofkey skills and talents.In <strong>2009</strong> we recruited 1 771 newemployees. Of these 24 percent werefemale and 76 percent male.Aker Solutions is strongly committed toleadership and expertise development as acompetitive advantage. The Aker Academyoffers programmes in importantprofessional subject areas such asleadership, project execution, commercialmanagement and HSE. In <strong>2009</strong> theseprogrammes had a total of 1 184participants from right across the company.With more than 118 000 online coursescompleted so far, including 26 000 in <strong>2009</strong>,eLearning has become an effective way ofenhancing expertise for our people. Weoffer a large number of courses throughour eLearning portal, which is used activelyby the entire business. A number of thecourses are mandatory, and the localbusiness units can track the progress oftheir own people. Such documentation isimportant, not least for ISO certification ofthe businesses. Employees can takecourses via their own home PCs, wheneverthey want and regardless of theirgeographical location. Compared withclassroom-based teaching, eLearningsubstantially increases flexibility, reducesthe cost of travel and minimises the use ofother resources.24Aker Solutions annual report <strong>2009</strong>
Our businessPeople and performanceAker Solutions trainees volunteer withthe Red Cross in Oslo, NorwayTotal workforceRegional distributionAfrica & Middle East 1.1%Europe ex. Norway 14.7%Norway 48.2%EmployeesRegional distributionAfrica & Middle East 1.2%Europe ex. Norway 16.0%Norway 52.2%Contract staff (including crafts)Regional distributionAfrica & Middle East 0.7%Europe ex. Norway 11.2%Norway 36.8%Americas 21.6%Asia Pasific 14.4%Americas 16.6%Asia Pasific 14.0%Americas 35.7%Asia Pasific 15.7%Recuitment of employeesRegional distributionEurope ex. Norway 31.8%Norway 26.1%eLearningCompleted courses by end of <strong>2009</strong>BA/BU specific (6 572)Other (7 540)HSE (76 742)Leadership programmesParticipants, Aker Academy <strong>2009</strong>Commercial awareness programme (27)Cross culture connectors training (121)Becoming a leader programme (403)Americas 29.5%Asia Pasific 12.0%Africa & Middle East 0.5%PEM (13 365)IT (14 420)Developing yourleadership programme (84)Business leadership programme (21)Expanding your leadership programme (28)Aker Solutions annual report <strong>2009</strong> 25
Our businessCorporate responsibilityCorporate responsibility:sustainable value creationAs a Norwegian company with a stronginternational presence, and as a supplierto the global energy and processindustries, we influence the prosperity,environment and lives of peopleworldwide. Such a position carriesresponsibility – the responsibility toestablish and comply with the highestpossible standards, to be an enterprisethat lives by its values and to act as agood corporate citizen. Our goal is tocreate long-term value for our owners andfor society through efficient commercialoperations based on principles forsustainable development.Our history and values, combined withinternational norms such as the UN GlobalCompact and the OECD guidelines, formthe basis of our CR principles and of theway we report in this area.CR covers a number of areas. Today,each of our CR principles - caring aboutpeople, environment, integrity andcommunity - presents both risks andopportunities.Caring about peopleA competent and motivated workforce,driving toward the same goals, is vital toour success. With thousands ofemployees around the world representingmany cultures, religions and ethnicgroups, our focus is on helping eachemployee to realise his or her potentialand to look after his or her own healthand safety. All our efforts are guided by acommitment to protecting the humanrights of our employees and of thestakeholders we influence.Training of Angolan engineersIn connection with our activities inAngola, locally recruited engineers arebrought to our facilities in Norway and theUK for specialist training. Returning homewith their newly gained expertise, they goon to share their knowledge, making asignificant contribution to thedevelopment of the Angolan oil and gasindustry. Aker Solutions also cooperateswith a number of Angolan educationalinstitutions to develop specific trainingprogrammes for engineers andtechnicians. For more informationregarding this, please refer to Powered toperform <strong>2010</strong> available onwww.akersolutions.com.Caring about environmentThe environment depends on thecontribution made by companies like oursto its positive development. We thereforework to minimise negative impact on theenvironment by continuously developingtechnologies, practices and businessopportunities which are compatible withsustainable development.Developing new technologies isimportant. So is combining existingsolutions in smarter and more efficientways. Our product innovation goes furtherand includes the full life cycle – not justtechnology but also product design,manufacturing, operation anddecommissioning. We maintain anenvironmental focus in our ownoperations.Environmental reportingWe are responsible for reportingenvironmental incidents and the followingenvironmental data in accordance withour health, safety and environment (HSE)policy:■■■■Energy use- electricity (reported by location)- non-renewable fuels- renewable fuelsWaste disposalFor more detailed information about ourHSE performance, please refer to page 22.Carbon captureAker Clean Carbon has recently signed acontract with Aker Solutions to build oneof the two carbon capture plants at theEuropean CO 2 Technology Centre atMongstad in Norway.Aker Solutions and Aker Clean Carbonare also part of the consortium, led byScottish Power, which recently qualified asan entrant to the UK government’scompetition to develop the UK’s firstcommercial scale carbon capture andstorage (CCS) project.For more information about our carboncapture activities, and otherenvironmentally-focused initiatives, pleaserefer to Powered to perform <strong>2010</strong>,available on www.akersolutions.com.Caring about integrityWe depend on a reliable, predictablebusiness environment. We therefore striveto maintain high ethical standards. Webuild a culture which values honesty,integrity and transparency, and weencourage the same behaviour amongour partners.Code of conductAn important goal for <strong>2009</strong> was to finaliseAker Solutions’ code of conduct. Thissummarises our CR principles and isbased on material which already exists inour policy system, guidelines, annual andCR reports. Training programmes arebeing pursued to strengthenunderstanding of, and ensure compliancewith, our rules. Our code of conduct isavailable at www.akersolutions.com/CR.WhistleblowingOur whistleblowing tool was released andcommunicated to our people in February<strong>2009</strong>. This tool makes it possible for ourpeople to report any breaches they mayobserve in law, ethical behaviour orcompany rules. The routines involvedensure appropriate confidentiality and arespecified in our People Policy. Theyaccord with the provisions of theNorwegian Working Environment Act.Communicating integrity in corporateresponsibilityWe have rolled out an eLearning courseto help our people understand how theycan live up to our CR principles. Thecourse currently addresses conflicts ofinterest, sponsorship, human rights andfacilitation payments. Completing the26Aker Solutions annual report <strong>2009</strong>
Our businessCorporate responsibilitycourse is mandatory for all our newemployees. CR seminars and workshopsalso help to increase awareness of risksand opportunities in this area.Articles published worldwide on ourcorporate intranet frequently address CRissues relevant to our business. CR wasalso one of the major topics at our annualoperating managers’ conference (OMC) in<strong>2009</strong>. Outcomes from the OMC are highpriority topics for both one-to-one and “allemployee” communications throughoutthe organisation.Risk managementAlong with safety, the integrity of ouroperations is of the utmost importance.We devote significant effort to managingthe risks associated with integrity,including the integrity of our partnerships.Our framework for assessing partnersand other business contacts was furtherstrengthened in <strong>2009</strong>. One of the mostimportant changes was an additionalrequirement for external integrity checks.Caring about communityAs a large company we are a significantpart of the societies in which we operate,both locally and globally. We believe inplaying our part in the community throughinvesting in the building of a healthy, safeand stable society.Through our international presence andcontributions to local value creation, wecontribute to economic development bycreating jobs and transferring skills andexperience. By making the fullest possibleuse of local content in our deliveries, wehelp to enhance expertise, create betterframe conditions for local industry andopen up economic opportunities, directlyreducing poverty.Much of our effort in CR is pursued withinternational non-governmentalorganisations (NGOs) dedicated to a moresustainable development of the businesssector.The Red CrossAker Solutions signed a three-year globalpartnership agreement with theNorwegian Red Cross in December <strong>2007</strong>.The agreement encompasses financialsupport, volunteering and the exchangeof knowledge, expertise and bestpractice. <strong>2009</strong> was another active andsuccessful year in this strategicpartnership, with many of our peoplethroughout the company informed about,and engaged in, the Red Cross’ activities.After creating awareness about theagreement among employees in Norway,the focus has now shifted to doing thesame in our international locations.Contact has already been establishedbetween some of our locations abroadand national Red Cross societies.BrazilIn Brazil, Aker Solutions supports a broadrange of cultural, social andenvironmental activities.For more information about the RedCross partnership and our activities inBrazil, please see Powered to perform<strong>2010</strong>, available onwww.akersolutions.com.UN Global CompactAker Solutions became a member of theUN Global Compact in <strong>2008</strong>. Bothglobally and locally, membership opensup opportunities for dialogue andcollaboration with other businesses,NGOs, labour organisations, andgovernments on a range of critical issues.Aker Solutions annual report <strong>2009</strong> 27
Our businessAker Solutions and the UN Global CompactAker Solutions and theUN Global CompactAker Solutions became a member of the United Nations Global Compact (UNGC) in <strong>2008</strong> and continues efforts to strengthen and enforceits ten principles throughout the organisation. The index below gives a brief overview of how the ten UNGC principles have beenimplemented, with references to more detailed information in the <strong>Annual</strong> <strong>Report</strong> <strong>2009</strong> and elsewhere on Aker Solutions’ intranet, eNet, andits internet site (see www.akersolutions.com/CR).UNGC principle Approach ResponseHuman rights1 Businesses should supportand respect the protection ofinternationally proclaimed humanrights.Aker Solutions’ code of conduct was finalised in <strong>2009</strong>,based on material which already existed in the company’spolicy system, guidelines, annual and CR reports. Itaccentuates the company’s support of the principles setforth in the UNGC.Code of conduct2 Businesses should ensure that theyare not complicit in human rightsabuses.Aker Solutions has committed itself to ensuring all itsbusiness activities are conducted in line with applicablelabour standards and fundamental human rights norms asdescribed in the Universal Declaration of Human Rights.Code of conductLabour standards3 Businesses should uphold thefreedom of association and theeffective recognition of the right tocollective bargaining.Aker Solutions has committed itself to dialogue withemployees and their unions, and respects collectiveagreements at all levels.Aker ASA’s frame agreement with Norway’s UnitedFederation of Trade Unions and the InternationalMetalworkers Federation commits Aker Solutions toworking for good labour relations and to respecting humanand workers’ rights in the communities in which it operates.Code of conduct4 Businesses should uphold theelimination of all forms of forcedand compulsory labour.Aker Solutions’ code of conduct accentuates thecompany’s stance against all forms of forced andcompulsory labour.Code of conduct5 Businesses should uphold theeffective abolition of child labour.Aker Solutions has committed itself to ensuring all itsbusiness activities are conducted in line with applicablelabour standards and fundamental human rights norms asdescribed in the Universal Declaration of Human Rights.Code of conduct6 Businesses should uphold theelimination of discriminationin respect of employment andoccupation.Aker Solutions has committed itself not to tolerate any formof discrimination or harassment in its Code of conduct.Code of conduct28Aker Solutions annual report <strong>2009</strong>
Our businessAker Solutions and the UN Global CompactUNGC principle Approach ResponseEnvironment7 Businesses should supporta precautionary approach toenvironmental challenges.Aker Solutions has committed itself to minimising theenvironmental impact of its operations in its code ofconduct, and the Just Care mindset which call onpersonal responsibility based on care.Code of conductJust Care mindset8 Businesses should undertakeinitiatives to promote greaterenvironmental responsibility.Aker Solutions has developed and implemented a widerange of schemes serving to promote environmentalresponsibility, competence and awareness – both internallyand externally.Code of conductISO 14001 certificates9 Businesses should encouragethe development and diffusionof environmentally friendlytechnologies.Aker Solutions has developed and made available to themarket innovative technologies, solutions and productsto have less harmful impact on the environment for bothourselves and our customers.Powered to perform <strong>2010</strong><strong>Annual</strong> report <strong>2009</strong>Anti-corruption10 Businesses should work againstall forms of corruption, includingextortion and bribery.Aker Solutions has committed itself not to offer or acceptgifts or any other remuneration to obtain any improperadvantage in representing the company’s interest. In <strong>2009</strong>,Aker Solutions strengthened its work on CR, in part bygiving it stronger representation in corporate managementthrough the creation of its enterprise risk function. Theenterprise risk function coordinates and supports AkerSolutions’ global compliance work, while operationalresponsibility remains with line management and thebusiness areas. The function also manages Aker Solutions’formal whistleblowing process.Code of conductBusiness ethics policyAker Solutions annual report <strong>2009</strong> 29
Our performanceSteel forgings used for manufacture ofsubsea trees30Aker Solutions annual report <strong>2009</strong>
Our performanceOur performanceContents32 Board of Directors’ report47 Declaration by the Board of Directors and the President & CEOFinancial statements and notesAker Solutions Group50 Consolidated income statement51 Consolidated statement of comprehensive income52 Consolidated balance sheet53 Consolidated statement of changes in equity54 Consolidated statement of cash flow55 Notes to consolidated financial statementsAker Solutions ASA104 Parent company income statement105 Parent company statement balance sheet106 Parent company statement of cash flow107 Notes to parent company financial statements115 Auditor’s report116 Share and shareholder information120 Analytical informationAker Solutions annual report <strong>2009</strong> 31
Our performanceBoard of Directors’ reportSolid platform for continuedprofitable growthAker Solutions had operating revenues totalling NOK 54 077 million in <strong>2009</strong>, a decline of 7.2 percent from theyear before. Earnings before interest, taxes, depreciation and amortisation (EBITDA) increased by 29.2 percentto NOK 4 368 million, while the EBITDA margin rose from 5.8 to 8.1 percent. Working capital was reduced duringthe year through purposeful efforts, but will fluctuate over time. An ordinary dividend of NOK 2.60 per share isproposed by the Board for fiscal year <strong>2009</strong>, corresponding to NOK 712 million.The general downturn in Aker Solutions’principal markets had differing impacts onrevenues and results in the businessareas. ED&S had high levels of activityduring <strong>2009</strong> in connection with thecallenging completion of Aker Barentsand Aker Spitsbergen, and considerablework on the Gjøa and Kashagan hook-upprojects. P&T maintained a high level ofactivity through the delivery of ten drillingequipment packages. Subsea delivered acomplete subsea production system toReliance Industries Ltd’s KG-D6 field offeastern India, which started production inApril. Lifecycle services are growing asboth Subsea and P&T maintained theirlong-standing commitment to the sale oflifecycle services related to previousdeliveries of technologies and solutions.High activity was also experienced in wellintervention services on the NorwegianContinental Shelf (NCS). The picture inP&C is complex. Necessary adjustmentshave been made in certain areas toaddress excess capacity, while the levelof activity in Mining & Metals was highthroughout. Major deliveries in <strong>2009</strong>included the completion of Sempra LNG’sreceiving terminal for Cameron LNG inLouisiana, USA.Activity is expected to remain lower in<strong>2010</strong> for Aker Solutions’ main markets.Consequently, Subsea, P&T and P&C allexpect a decline in turnover for thepresent year. Aker Solutions is preparedto meet this challenge throughrestructuring of the business in <strong>2008</strong>-<strong>2009</strong> and cost reductions.Aker Solutions also took structuralsteps in the spring of <strong>2009</strong> to securefuture profitable growth throughacquisitions and strategic part-ownershipof innovative companies in high-marginsegments. Following these acquisitions,Aker Solutions now owns 100 percent ofthe shares in Aker Oilfield Services andMidsund Bruk as well as 50 percent ofAker DOF Deepwater (previously AkerDOF Supply). The group also increased itsholding in Aker Clean Carbon from 30 to50 percent through a rights issue. Theseacquisitions have strengthened thegroup’s position in well interventionservices and offshore marine operations,and its technology portfolio has beenexpanded.Although the market in <strong>2009</strong> wascharacterised by fewer contract awards,Aker Solutions secured a number of largerstrategically important contracts during theyear. Order intake for <strong>2009</strong> was NOK 52000 million (NOK 55 590 million in <strong>2008</strong>).As of 31 December, the group still had asolid order backlog of NOK 56 276 million(NOK 58 016 million in <strong>2008</strong>). Thecustomer portfolio is dominated by leadingnational and international players. Theincreased share of revenues from servicingand lifecycle services, phasing-out ofturnkey lump-sum contracts, andimproved risk assessment and projectfollow-up, reduce the overall risk profile ofthe order backlog and the project portfolio.While the level of activity in <strong>2010</strong> isexpected to be lower in parts of AkerSolutions’ principal markets, the longtermmarket outlook is good. The group’scustomers will have to invest in order tomaintain oil and gas production. A largeproportion of oil reserves are found indeep water and harsh environmentregions. Aker Solutions has made aparticular commitment to these areas,and will be strongly placed through itsexpertise and product and technologyoffering when activity recovers.In <strong>2009</strong>, health, safety and theenviroment (HSE) continued to be onfocus, with a decline in both sick leaveand the total injury frequencies from theyear before.The group’s capital position is good,and no material debt items requirerefinancing before 2012.The businessPrincipal operationsAker Solutions is a leading global supplierof engineering services, fabrication,technology products, maintenance,specialised services and total solutionsfor the energy and process industries. Itsmain operations embrace deliveries to oil,gas and petrochemical facilities. Thegroup also delivers to projects for gasandcoal-fired power stations, metalsprocessing plants and other selectedindustries.The business is organised in thefollowing four business areas andreporting segments:■■■■■■■■Energy Development & Services(ED&S)SubseaProducts & Technologies (P&T)Process & Construction (P&C)The group had 22 133 employees as of 31December <strong>2009</strong>, including 11 189 inNorway, plus 7 804 contract staff. AkerSolutions has operations in roughly 30countries. Its head office is in Norway, atFornebu outside Oslo.The parent company Aker SolutionsASA is listed on the Oslo Stock Exchangewith ticker code AKSO. The largestshareholder is Aker Holding AS, with40.27 percent ownership.Strategic target areasAker Solutions’ vision is to be thepreferred partner for projects, productsand services in the energy and processindustries. This vision applies to allbusiness areas in the group.Its people have leading-edge expertisein a number of areas, and the groupenjoys a reputation as an attractivebusiness partner and employer. AkerSolutions occupies a strong marketposition, which will be consolidated and32Aker Solutions annual report <strong>2009</strong>
Our performanceBoard of Directors’ reportfurther developed. That calls for asignificant commitment and substantialresources. Expectations from investors,customers and employees, and from thecommunity and the market in general, willbe met by ensuring responsible andprofitable operation over time.The long-term strategy for realising thevision remains unchanged. It involves aparticular commitment to strengtheningthe group’s performance and competitivenessalong three principal axes:■■■■■■harsh environments and deep watersthe service marketa competitive cost base and executionmodelTo reach these goals, it will also beimportant to maintain focus on applyingand developing technology. A continuingcommitment to HSE will also be highlysignificant, both for securing goodperformance and for enhancingcompetitiveness.Harsh environments and deep watersAker Solutions is one of the world’sleading suppliers of solutions for energyand process facilities in harsh environmentregions, both offshore and on land.A large proportion of the oil and gasresources which have yet to be exploitedare expected to lie in such areas. Thegroup has an extensive list of projectreferences in concrete technology,floating deepwater platforms, subseatechnology and land-based plants suitedfor harsh environment conditions in arcticareas or for deep and ultra-deep waters.Aker Solutions occupies a strong positionin these markets as one of the fewsuppliers to combine advancedtechnology with the ability to delivercomplete solutions. That makes the groupan attractive partner for customers withdemanding projects.The service marketAker Solutions is a leading supplier ofcomplete production facilities for theenergy and process sectors and oftechnology products and solutions forsubsea installations and drilling systems.The group’s specialised expertise andinstalled base provide the basis foroffering efficient models for deliveringmaintenance services, upgrades andmodifications. During recent years, AkerSolutions has substantially increaseddeliveries of its systems and products. Itscommitment to services over the life-offieldof those deliveries, together withlifecycle services for components,increases the value of the customer’sinvestment. That contributes in turn toattractive margins in these markets.Lifecycle services represent a growingproportion of the group’s turnover. Whilenew development projects, product orsystem deliveries usually last betweenone and four years, an installation mustbe maintained over several decades. Themarket for lifecycle services is accordinglyalso very long-term and less cyclical thanthe market for new projects.Competitive cost base and execution modelAker Solutions has implemented aprogramme of cost savings since <strong>2007</strong>.The goal is to reduce the cost base inorder to strengthen competitiveness andprofitability. This strong focus on costshelped to achieve annual savings inindirect expenses of about NOK 1 billionduring <strong>2009</strong>. In addition to enhancingcompetitiveness, a lower cost base will beimportant in times to come for ensuringthat the group is sufficiently robust towithstand periods of lower market activity.The work has meant a downsizing byabout 4 000 people over the past year, ofwhom around two-thirds were contractstaff.Efforts to secure competitiveness are acontinuous process. An importantelement in this work is optimisation of theorganisation and delivery models. ED&Sand Subsea were restructured in <strong>2008</strong>,while work on restructuring P&C, P&T andthe group’s shared services was pursuedin <strong>2009</strong>. Attention is also given toexploiting Aker Solutions’ engineering andproduction resources in low-costcountries like China, India, Brazil,Malaysia, Indonesia and Eastern Europe.Applying and developing unique technologyand know-howThe commitment to developing leadingtechnologies for drilling, subsea and wellintervention products is being maintained.In line with the strategy, a continuedcommitment will also be made totechnology development based on AkerSolutions’ extensive experience in miningand metals projects; solutions for thepetrochemicals industry; and oilfielddevelopments in harsh environments.Other important priority areas fortechnological progress include newsolutions for carbon capture and storageand power generation.Continued commitment to HSEThe long-term commitment to establishingAker Solutions’ Just Care culture hasyielded results. This work will bemaintained with undiminished vigour inorder to secure a high standard of HSE inall projects and for all products delivered.Through this commitment, Aker Solutionswill strengthen its position as a corporateresponsible player while also furtherdeveloping its status as the preferredemployer and supplier in its markets.MarketsAfter a number of years with goodprogress and high demand, AkerSolutions’ principal markets wereAker Solutions annual report <strong>2009</strong> 33
Our performanceBoard of directors’ reportcharacterised in <strong>2009</strong> by lower demandand the postponement of contract awardsin the wake of the global financial crisis.Market prospects are regarded asgood in the longer term. The world’senergy consumption is expected tocontinue growing, driven in part by themarkets in India and China. Combinedwith declining reserves and reduced oiland gas production in the world, this isexpected to generate a persistent needfor new developments.The oil price influences oil companies’priorities for, and choices between, newdevelopments, upgrades to existingfacilities or commitments to improvingrecovery from producing fields. Oil pricesthereby affect activity in a number of AkerSolutions’ main markets. The group’sshare of new deliveries compared withlifecycle services may accordingly varyover time in line with oil price trends.The level of activity at many oilcompanies is closely related todevelopments in their cash flow, whichmeans that some operators will postponelarge new developments in times withlower earnings. Often these will bereplaced by an increased focus onupgrading existing installations, whichcan help to reduce costs per unitproduced. In the short term, therefore,uncertainty continues to prevail overwhen contracts will be awarded and howhigh a level of activity can be expected inthe new build market. However, themarkets for service and maintenancecontracts are expected to show arelatively high level of activity.Marginal costs per unit producedrepresent an important factor when oilcompanies assess upgrading existingfacilities or investing in improved recoveryfrom producing oil and gas fields.Developments in recent years havedemonstrated important technologybreakthroughs in this area. Moreautomated operations have cut costs, forinstance, while the recovery factor on anumber of fields has increasedsubstantially, far exceeding the levelspreviously considered feasible. Given thisprogress, operators of a great manyproducing fields around the world regardinvestment in upgrades and improvedrecovery as ever more interesting. AkerSolutions has solid experience andproprietary technology in this area, whichmeans that the group is well positioned.Oil and gas production has historicallybeen concentrated in areas which arerelatively easy to access. The bulk of theworld’s oil and gas production still comesfrom facilities on land or in limited waterdepths. Although investment continues tobe made in such regions, in part toimprove recovery factors, decliningproduction from these fields musteventually be replaced by newdiscoveries. As a result, over the past 15years fields have gradually beendeveloped in more demanding areas,often in deep waters. A significantproportion of the world’s undevelopedreserves are thought to lie in ultra-deepwaters and in areas characterised by acold, tough climate. A number of oilcompanies have displayed great interestin these areas, and specific plans alsoexist for development. But the costsassociated with such projects aregenerally substantial, and oil prices mustalso lie at a relatively high level before itbecomes economically interesting topursue them. The uncertainty whichcontinues to prevail about the worldeconomy and thereby about short-termoil price trends means that it is unclearwhen development decisions will betaken for a number of prospects. As theoutlook improves, these fields willgradually begin to be developed to meetenergy requirements. Aker Solutions, withits history, experience, expertise andtechnology, will then be well prepared tohold its own in the competition.Risk managementAs a group with a strong internationalpresence, and as a supplier to the globalenergy and process industries, AkerSolutions influences the economicposition, environment and lives of peopleworldwide. Such a position carries aresponsibility towards the communitiesand environments exposed to the group’soperations, and calls for good riskmanagement. An overview of the group’sefforts within corporate responsibility canbe found on page 45 of this Board ofDirectors’ report.Aker Solutions seeks to ensure thesystematic and conscious managementof risk in all parts of its business. This isessential for the creation of long-termvalue for shareholders, employees andsociety. The group works systematicallyon risk management through definedguidelines and procedures in all itsbusiness areas to ensure a thoroughassessment of its various activities. Riskmanagement and awareness areimportant elements in the group’sorganisational culture and educationalactivities.Overall risk management is primarilyhandled by the following corporatefunctions, in close cooperation with thebusiness areas:■■■■Enterprise risk coordinates riskmanagement outside the traditionalproject and financial areasInternal compliance audits andsecures operations according to theframework■■Project and operational supportprovides assistance with projectassessments in the tendering andexecution phases, and chairs thegroup’s corporate risk committee■■Treasury is responsible for the group’sexposure to financial markets, and is apermanent member of the group’sinvestment committee■■Corporate tax handles tax risk relatedto transactions, operations, tax returnsand audit, and is a permanent memberof the group’s investment committee■■■■Insurance handles the purchase of thegroup’s insurance programme andprovides insurance-related support forprojects, as well as operating as thegroup’s captive underwriterCorporate legal supports all thesefunctions in their management of riskand is a permanent member of thegroup’s corporate risk and investmentcommittees. It also handlescontractual and legal issues related toprojects, partners, contracts anddisputes, and follows up on thecompany’s compliance with applicableregulatory and legal requirements.Enterprise riskThe enterprise risk function is responsiblefor ensuring that the group’s ownframework and management tools –including its principles, procedures,policies, instructions and standards – arein place and regularly updated. Thisincludes group wide principles,procedures and instructions for the wayvarious types of risk are to be identified,reported and managed. The frameworkalso embraces the group’s authorisation34Aker Solutions annual report <strong>2009</strong>
Our performanceBoard of directors’ reportmatrix which defines what decisions canbe taken at various levels in the group –including those which must be reachedby the Board of Directors.Evaluation of country risk is anintegrated part of the group’s decisionmakingprocesses. The enterprise riskfunction, together with other stafffunctions, arranges analysis of relevantcountries. These assessments focusprimarily on ethical, political andreputational risks. In addition, the projectand operational support functionconducts a detailed assessment ofexecution risk related to relevantcountries for significant projects.Attention is paid to integrity in AkerSolutions’ operations, and significanteffort is devoted to risk management inthis area – not least in relation to partnersand other business relations. A summaryof the most important principles andpolicies is established in the group’s codeof conduct, which was published in theautumn of <strong>2009</strong>. Targeted trainingprogrammes strengthen understanding of,and help to ensure compliance with, thegroup’s policies.The group’s whistleblowing policyprovides for the notification, throughseveral channels, of any failure to complywith our code of conduct. The centralwhistleblowing function is assigned to theenterprise risk function. The proceduresinvolved are specified in the group’sPeople Policy, and are consistent with theprovisions of the Norwegian WorkingEnvironment Act.Internal complianceThe internal audit function assistscorporate management in verifying thegroup’s principles, procedures andinstructions are implemented in all itsoperations, and undertakes assessmentsand analyses to ensure effective internalcontrol routines. It also evaluates whetherinternal requirements are implementedand followed; that fixed assets areadequately secured; and that reportedoperational and financial information isreliable. The annual internal reviewprogramme is drawn up in cooperationwith the business areas. Previous reviewsare followed up to check thatrecommended improvements have beenmade.Project and operational supportThis function supports projects withevaluation and control of risk during thetendering and execution phases.Assessments of the risk related tocontracts, both potential (tenders) andawarded, are conducted continuously.The business areas are responsible formaintaining an overview of their riskexposure and of potential opportunities,and for implementing the necessarymeasures. Project risk includes the abilityto deliver contracts at the agreed timeand to the agreed quality, functionalityand price. There is also a risk related tothe customer’s ability to fulfil itscommitments under the contract.Delivering projects and equipmentaccording to the contract and within theanticipated cost framework is critical tothe group’s results. This implies thatunderstanding of, and control over, therisks associated with actual projectexecution is an important priority for AkerSolutions.Project and operational support isresponsible for a central risk managementtool known as Aker Solutions’ ProjectExecution Model (PEM). This modelis used by all the group’s business areasto ensure uniform execution andfollow-up of projects and deliveries inevery phase – evaluation, tendering,decision, execution and completion. ThePEM allows for each business area’sdiffering types of projects and deliveries,while securing a unified approach andproviding opportunities for crossorganisationaldeliveries. Project reviewsrelated to project milestones help toensure that quality, functionality, time andcost requirements are in place beforeentering the next phase. Project andoperational support participates in anumber of these reviews together withthe business areas.TreasuryThe corporate treasury function isresponsible for managing financial marketrisk and the group’s exposure to financialmarkets.Aker Solutions has defined proceduresand routines for managing the group’sfinancial market exposure. Financial riskincludes currency, interest rate, counterpartyand liquidity risk. Guarantees arealso issued to customers in connectionwith the group’s activities.■■■■■■■■Currency risk: operating units in AkerSolutions identify their own foreigncurrency exposure and mitigate thisvia corporate treasury when contractsare awarded. Such cover is providedin the operating unit’s functionalcurrency. All major contracts arefurthermore hedged in the externalmarket and documented to qualify forhedge accounting. More than 80percent of project related currency riskexposure either qualify for hedgeaccounting or are embeddedderivatives. Corporate treasury alsohas a mandate to participate activelythrough positions in the currency andinterest rate markets within clearlydefined limits and with strict stop-lossrestrictions. All open positions aresubject to continuous marketassessment. This activity deliveredearnings of NOK 18.9 million in <strong>2009</strong>.Interest rate risk: it has been decidedthat 30–50 percent of the group’sgross debt will have fixed interest rateswith durations related to theoutstanding debt at any given timeFloating and fixed interest rate loansare combined with interest rate swaps.46 percent of the borrowings had fixedinterest rate at the balance sheet dayCounterparty risk: assessments aremade of major contractual counterpartiesand sub-contractors. Risk isreduced through bank and parentcompany guarantees and/orstructuring of payment terms.Where bank risk and the placementrisk for surplus liquidity are concerned,specific maximum levels have beenset for the group’s exposure to eachfinancial institution. A special debtor listis signed annually by the group’s CFO.Liquidity risk: the group’s policy is tomaintain satisfactory liquidity at thecorporate level. This liquidity buffer isexpressed as the sum of undrawn bankcredit facilities and available cash andbank deposits. Working capital will varyover time, depending on thecomposition of revenues in the varioussegments – and good liquidity isimportant. Aker Solutions ASA issued afive-year bond loan of NOK 2.1 billionin the Norwegian market in June. Anew five-year bank loan of NOK 750million was established in October. Theliquidity buffer amounted as of 31December <strong>2009</strong> to NOK 8 514 millionAker Solutions annual report <strong>2009</strong> 35
Our performanceBoard of Directors’ report■■and corresponded to roughly 16percent of <strong>2009</strong> revenues. NOK 2 087million of this amount was related toprojects or placed in countries where itwas not available to the corporatetreasury at short notice. The averageweighted duration of existingoutstanding debt and committed creditfacilities is 3.08 years. Aker Solutions isin compliance with all the financialcovenants in its loan agreements (seealso note 27 to the consolidatedaccounts on borrowings).Guarantee risk: a significant proportionof business area contracts aresupported by bank and/or insuranceguarantees. These are largely ondemand, which means that they canfall due for payment at short notice.Careful assessments are made beforeproviding such guarantees, withinsurance policies to protect againstunfriendly claims. Bank/insuranceguarantees totalling NOK 7 284 millionhad been issued under the group’sguarantee agreements with financialinstitutions as of 31 December,including guarantees worth NOK 2 742million issued during <strong>2009</strong>. Parentcompany guarantees worth NOK57 070 million had been issued onbehalf of the group by 31 December.This is the contract value at the date ofaward, with no account taken of thereduction in liability due to contractprogression. Further details aboutuncertainties and contingent eventsare presented in note 32 to theconsolidated accounts describingcontingent events.Corporate taxCorporate tax manages tax-related risk inthe following areas:■■Transaction risk is managed bysubjecting all transactions (bothexternal and internal) to specialapproval procedures. In connectionwith internal transactions, the grouphas established guidelines to ensurethe preparation of documentationwhich satisfies local transfer pricingregulations.■■Operational risk is identified andmanaged through the use of varioustax standards established by thegroup. Deviations from thesestandards must be approved by■■corporate tax. Corporate tax is alsoinvolved in all tenders which crossborders. A special centre of expertise(the international assignment centre)manages employee-related tax risk inconnection with the transfer ofpersonnel between countries.Various risks associated withcompleting and submitting tax returnsfor companies in the group aremanaged through internal guidelines.All subsequent communication withthe tax authorities is conducted inclose cooperation with corporate tax.Aker Insurance Services andAker InsuranceThe Aker Insurance Services ASinsurance intermediary is the group’sinternal centre of insurance expertise. It isresponsible for establishing and followingup the group’s global insuranceprogramme as well as defined countryspecificpolicies. This work includes acontinuous assessment of the group’sinsurance needs, taking account ofcontractual requirements, the nature andscope of the business, and theavailability of optimum insuranceproducts in the market.In addition, Aker Insurance Servicessupports the business areas and othercorporate functions in evaluatinginsurance-related risk in contracts,primarily during the tendering phase. Thisincludes assessing the need to purchaseproject-specific policies and evaluatingpolicies established by customers. Theseactivities also embrace responsibility forensuring that local expertise is availableto the business areas.Aker Insurance AS is the group’scaptive underwriter. It is licensed toprovide the group’s non-life insurance,both directly and as a re-insurer. As ageneral rule, Aker Insurance AS will beused to provide insurance if this can bedone on more advantageous terms thanthose offered in the external underwritingmarket.Corporate legalCorporate legal collaborates closely withall other corporate functions to secureand implement the best possible overallrisk management. It is also a permanentmember of the corporate risk andinvestment committees and routinelyparticipates in assessing and managingvarious aspects within the purview of theenterprise risk function.Corporate legal also provides directsupport for tendering organisations inconnection with assessing and managingthe contractual and legal risks related toinquiries and tenders. In addition, it helpsto ensure that tenders and contracts takeaccount at all times of statutes, statutoryregulations and rules which apply in therelevant jurisdictions where projects areexecuted.Through the development,administration and continuousimprovement of business norms, bestpractice guidelines and various standarddocuments, the group seeks – throughcorporate legal in collaboration with othercorporate functions – to help minimisethe scope of unknown and uncontrollablerisks. This risk management is supportedby various types of training andeducation for project and contractmanagers.In connection with the acquisition ordisposal of businesses, corporate legalalso conducts company reviews,prepares contracts and checkscompliance with legislation and statutoryregulations in the relevant jurisdictions.A company of the size of AkerSolutions will find itself, from time to time,in disputes during the lifetimes ofprojects. In close collaboration with theproject and operational support function,corporate legal supports projectorganisations with contractual and riskmanagement, both to avoid disputes andto enhance the predictability of outcomesto a possible dispute. Corporate legalfollows up ongoing disputes closely, andis responsible for ensuring that the grouphas the best possible control of the latentfinancial risk represented by such actions.More detailed information can be found innote 32 to the corporate accountsdescribing contingent events.Corporate committeesThe group has various levels of evaluationand decision-making fora for both projectdelivery and investment.Corporate risk committeeThe corporate risk committee reviews andassesses the tenders that must beapproved by the President & CEO or theBoard of Directors, pursuant to theauthorisation matrix. With members36Aker Solutions annual report <strong>2009</strong>
Our performanceBoard of Directors’ reportconsisting of experienced projectmanagers and participants fromcorporate functions, the committeereviews the opportunities and risksassociated with entering into andexecuting projects. The results of thesereviews are submitted to the businessareas’ management and decision-makerswith relevant recommendations.Project and operational supportadministers and chairs the corporate riskcommittee. In <strong>2009</strong> they reviewed 60 ofthe largest tenders.Corporate investment committeeThe corporate investment committeereviews all proposals to acquire or divestsubstantial operations, and majorinvestments in fixed assets (real estate,machinery or equipment) before they aresubmitted to the executive managementor the Board of Directors for approval.The committee, which represents relevantstaff functions, is involved in investmentprocesses at an early stage and providesthorough assessments of this type ofdecisions and checks that theinvestments satisfy the group’s requiredrate of return. The committee oftenprovides guidance on future work in thebusiness and checks that investmentsmade are followed up including postinvestment reviews.The year <strong>2009</strong>Restructuring secures futurecompetitivenessAker Solutions has worked purposefullysince <strong>2007</strong> on reducing its level of costs,and was accordingly well prepared tomeet the challenges presented by theinternational financial crisis in the autumnof <strong>2008</strong>. These efforts were maintained in<strong>2009</strong>, with a number of importantrestructuring measures to adjust costsand capacity. Results of this work includea downsizing by about 4 000 employeesand contract staff over the year. Theannual cost savings achieved during<strong>2009</strong> was about NOK 1 billion, while oneoffcosts related to the restructuringamounted to NOK 343 million.Industrial acquisitionsAker Solutions took important steps inApril <strong>2009</strong> to further strengthen itsposition in the offshore and energysectors. Acquisitions and tighterintegration of holdings in forward-lookingcompanies in high-margin segments wereimplemented to enhance the potential forprofitable growth.Aker Solutions acquired shares in fourproduct and technology companies fromAker and DOF. These companiesrepresent industrial building blocks whichexpand Aker Solutions’ foundation forprofitable growth in the offshore andenergy sectors.The transactions involved theacquisition of 46 percent and 21 percentof the shares in Aker Oilfield Servicesfrom Aker Capital AS and DOF OilfieldServices AS respectively, 50 percent ofAker DOF Deepwater (previously AkerDOF Supply), 33 percent of the listedtechnology company ODIM and 100percent of product company MidsundBruk. The shares in ODIM weresubsequently sold to Rolls Royce for again of NOK 109 million. In addition, AkerSolutions increased its holding in AkerClean Carbon from 30 to 50 percentthrough a rights issue. These transactionshave strengthened the group’s position inwell intervention and offshore marineoperations, and its technology portfoliohas been expanded. The acquisition ofAker Oilfield Services is regarded asparticularly important in terms of thegroup’s strategy for making a commitmentto well intervention in deep waters.InvestmentsThe above-mentioned industrialtransactions in <strong>2009</strong> represented a totalinvestment of some NOK 2 billion for AkerSolutions, with the redemption ofshareholder loans accounting for aboutNOK 250 million of this sum. At the dateof acquisition, the companies acquiredhad an investment programme for thenext few years of just over NOK 2.5billion. Aker Solutions financed therelevant transactions and futureinvestments through a new bond loan ofNOK 2.1 billion.Other investments totalling aroundNOK 1.1 billion were also made. Thisspending was again in line with thegroup’s strategy and, and wasconcentrated to a significant extent in theSubsea and P&T product areas. Acommitment has been made, for instance,to building up a global serviceorganisation to meet the local needs ofcustomers.The build-up of a rental tool poolcontinued during <strong>2009</strong>. This developmentis consistent with the Subsea businessarea’s strategy for offering equipmenthire – relating to installation, forinstance – in addition to traditionalservices. Following an investment of NOK120 million in <strong>2009</strong>, the rental tool pool isnow worth some NOK 800 million. USD17 million has also been invested inmachines, equipment and premises toachieve a substantial modernisation andexpansion of the production facilities forsurface trees and wellheads at Batam inIndonesia. This expansion forms part ofAker Solutions’ long-term strategy toincrease its presence in the fast-growingoil and gas markets of the Asia-Pacificregion.An investment is being made in anexpanded and upgraded service base fordrilling equipment in Brazil, whichincludes facilities such as an educationcentre, offices, workshop and warehouse.Brazil is an important growth market forAker Solutions, and local content as wellas closeness to customer installations areessential requirements there.During the fourth quarter of <strong>2009</strong>, AkerSolutions purchased a site in Stavangerand another near Oslo to meet existingand future space requirements in Norway.The site at Fornebu, just outside thecapital, is in walking distance of Aker Hus,the corporate head office. A contract tobuild a combined hotel and office blockon this land was awarded to aconstruction company in January <strong>2010</strong>.The building is expected to be ready foroccupation in early 2012, and AkerSolutions will lease the office space.Plans at Hinna in Stavanger call for anoffice building to bring together the ED&Soperations in this part of Norway, whichare currently spread over four differentsites. The timetable for this project liessome months after the Fornebudevelopment, with occupation due in thethird quarter of 2012.In <strong>2007</strong> Aker Solutions decided toinvest in a new office building in Mumbai,India in order to consolidate thePowergas engineering business at asingle site. Completed in <strong>2009</strong>, thesepremises feature an environmentallyfriendlydesign, a training centre, as wellas the latest IT and communicationsolutions. They have been speciallyoutfitted to allow large project teams towork as efficiently as possible.Aker Solutions annual report <strong>2009</strong> 37
Our performanceBoard of Directors’ reportPresentation of the accountsAker Solutions presents its accounts inaccordance with the InternationalFinancial <strong>Report</strong>ing Standards (IFRS) asadopted by the EU. Unless otherwisespecified, figures in brackets presentcomparative data for the correspondingaccounting period or balance sheet date.Income statementConsolidated operating revenues for<strong>2009</strong> declined by 7.2 percent to NOK54 077 million (NOK 58 252 million in<strong>2008</strong>). This was in line with expectationsof reduced activity communicated in thedirectors’ report for <strong>2008</strong> as a result ofthe financial crisis. The effects of lowermarket activity were offset to some extentby the solid order backlog and, given thedemanding market conditions the Boardis satisfied with the level of revenues for<strong>2009</strong>.Earnings before interest, tax,depreciation and amortisation (EBITDA)amounted to NOK 4 368 million (NOK3 382 million in <strong>2008</strong>), an increase of 29.2percent from <strong>2008</strong>. This is marginallyweaker than the expectation of an EBITDAlevel of NOK 4 500 million communicatedin the directors’ report for <strong>2008</strong>.The EBITDA margin strengthenedduring <strong>2009</strong> to 8.1 percent (5.8 percent in<strong>2008</strong>), primarily as a consequence ofextensive cost cuts, the growth in theservice business and generally positiveoperations.Depreciation, impairment charges andamortisation totalled NOK 910 million (NOK615 million in <strong>2008</strong>). This increase reflectedrelatively high investment during <strong>2009</strong>.Consolidated earnings before interestand taxes (EBIT) were NOK 3 485 million(NOK 2 767 million in <strong>2008</strong>).Net financial expenses amounted toNOK 411 million (NOK 225 million in <strong>2008</strong>).The group hedges currency risk for allproject exposures in accordance withwell-established practice. Although thisprovides a full currency hedge, parts ofthe hedging (about 20 percent) do notmeet the requirements for hedgeaccounting specified in IFRS. This meansthat fluctuations in the value of theassociated hedging instruments arerecognised with full effect as a financialitem in the accounts. The accountingeffect appears as an income of NOK 161million (expense of NOK 439 million in<strong>2008</strong>) in a separate line under financialitems. The underlying projects hedged bythe unqualified hedging instruments havehad a negative accounting effect of NOK81 million, which is recognised as anordinary operating expense.Profit from associated companies andjoint ventures was NOK 114 million (lossof NOK 21 million in <strong>2008</strong>). The <strong>2009</strong>figure includes a gain of NOK 109 millionon the sale of the holding in ODIM ASA.Tax expense was NOK 877 million (NOK590 million in <strong>2008</strong>). This correspondedto an effective tax rate of 27.3 percent(28 percent in <strong>2008</strong>).Consolidated net profit for <strong>2009</strong> wasNOK 2 331 million (NOK 1 513 million in<strong>2008</strong>). This represented earnings pershare of NOK 8.40 (NOK 5.34 in <strong>2008</strong>).Cash flowConsolidated cash flow from operatingactivities depends on a number of factors,including progress with and delivery ofprojects, changes in working capital andpre-payments from customers. Net cashflow from operations was NOK 4 245million (negative NOK 868 million in <strong>2008</strong>).The increase reflects a purposefulcommitment to a reduction in workingcapital.Net cash flow from investmentactivities in <strong>2009</strong> was negative NOK 3 927million, of which around NOK 1 400million related to the industrialacquisitions carried out in April. Furtherdetails of these transactions are providedin the section on investments. Net cashflow from investment activities in <strong>2008</strong>was negative at NOK 3 732 million.Net cash flow from financing activitieswas negative NOK 278 million (NOK4 150 million in <strong>2008</strong>), with dividends forthe year of NOK 431 million.Balance sheet and liquidityConsolidated interest-bearing debtamounted to NOK 7.5 billion (NOK 6.7billion in <strong>2008</strong>) as of 31 December <strong>2009</strong>.Long-term debt comprised of fivebond loans in the Norwegian market.These loans included one of NOK 572million maturing in 2011, two of NOK 150million and NOK 300 million respectivelywhich mature in 2013, and two of NOK1 913 million and NOK 187 millionrespectively maturing in 2014. They havefloating interest rates with the exceptionof the ones for NOK 150 million maturingin 2013 and for NOK 1 913 millionmaturing in 2014, which have a fixed rate.Parts of the loans with floating rates havebeen converted to fixed rates throughinterest swap agreements, and parts ofthe loans with fixed rates have beenconverted to floating rates. 43 percent ofthe total bond loans accordingly havefixed rates. The average remaining termto maturity for these loans is just underfour years.In addition, a syndicated bank facilityof EUR 750 million (corresponding toNOK 6 598 million) was established inOctober 2006, maturing in October 2012.NOK 2 900 million of this facility had beendrawn down as of 31 December <strong>2009</strong>.A new credit facility of NOK 2 000million was established by the group inDecember <strong>2008</strong> with a term of 18 monthsand an option to extend this period by afurther 18 months to a total of three years.No drawings had been made on thisfacility as of 31 December.As an alternative to utilising the bankfacility, use was made of the Norwegiancertificate market during <strong>2009</strong>.A new term loan of NOK 750 millionwith a maturity of five years was raisedon the international market during thefourth quarter of <strong>2009</strong> to strengthen thegroup’s financial platform even further.This loan matures on 1 October 2014.As of 31 December <strong>2009</strong>, a total ofNOK 3 650 million had been drawn downunder the group’s credit facilities. Fixedinterest agreements entered into for <strong>2010</strong>on that date covered 46 percent of thetotal debt.Consolidated current assets totalledNOK 20 121 million (NOK 25 217 millionin <strong>2008</strong>) as of 31 December.Consolidated non-current assetstotalled NOK 16 082 million (NOK 13 150million in <strong>2008</strong>) as of 31 December, ofwhich goodwill amounted to NOK 7 420million (NOK 6 959 million in <strong>2008</strong>). Thisgoodwill relates primarily to theacquisition of Trafalgar House in 1996,the merger with Aker Maritime in 2001,the acquisition of Qserv Ltd (now AkerQserv Ltd) and Aker Marine ContactorsAS in <strong>2008</strong>, and the acquisition of WirthGmbH (now Aker Wirth GmbH) and AkerOilfield Services in <strong>2009</strong>.Net interest-bearing liabilities totalledNOK 3 705 million (NOK 2 311 million in<strong>2008</strong>) as of 31 December. The increasereflected acquisitions and investments.The group’s total current liabilities were38Aker Solutions annual report <strong>2009</strong>
Our performanceBoard of Directors’ reportNOK 20 584 million (NOK 24 367 millionin <strong>2008</strong>) as of 31 December, andconsisted primarily of trade and otherpayables.Book equity including non-controllinginterests totalled NOK 9 123 million (NOK8 606 million in <strong>2008</strong>) as of 31 December.Non-controlling interests amounted toNOK 147 million (NOK 156 million in<strong>2008</strong>). The group’s equity ratio was 22.8percent (20.1 percent in <strong>2008</strong>) of the totalbalance sheet as of 31 December.Consolidated capital adequacy andliquidity are good, and help to ensure thatthe group is well equipped to meet thechallenges and opportunities faced overthe next few years.Business areasEnergy Development & Services is theresult of a merger between the formerField Development (FD) and Maintenance,Modifications and Operations (MMO)business areas.The business area enjoyed a high levelof activity in the North Sea maintenance,modifications and operations (MMO)market during <strong>2009</strong>, but internationalprojects and new North Seadevelopments also contributed to a goodworkload through the year. Operatingrevenues totalled to NOK 19 827 million(NOK 23 074 million in <strong>2008</strong>).Major projects completed during <strong>2009</strong>included the two advanced Aker H-6edrilling rigs for Aker Drilling, the ePFproject for six process modules for AgipKCO on the Kashagan field, and theAdriatic LNG terminal project in Italy forExxonMobil. MMO work was alsopursued during the year on 70 North Seainstallations. Activity was high on Statoil’sGjøa project, a strategically importantassignment for Aker Solutions which willbe delivered in <strong>2010</strong>.EBITDA was NOK 1 116 million(negative NOK 329 million in <strong>2008</strong>). TheEBITDA margin was 5.6 percent andprofitability improved sharply from <strong>2008</strong>,when operational challenges yielded anegative EBITDA margin of 1.4 percent.The improvement partly reflected goodcontract formats in the order backlog andimproved operational deliveries.A number of important contracts werewon during <strong>2009</strong>. The hook-up job forAgip KCO’s Kashagan project and thecontract to design, build and deliver theconcrete structure for ExxonMobil’sSakhalin 1 development underlined AkerSolutions’ strong position in the Caspianand Russian regions. Several FEEDcontracts were also awarded during theyear, including the floating production unitfor phase I of the Shtokman project andthe second phase of the Kashagan fullfielddevelopment in Kazakhstan. Ordervolume also increased through theexpansion of existing contracts. The orderbacklog as of 31 December <strong>2009</strong> wasNOK 25 396 million (NOK 18 625 millionin <strong>2008</strong>).New development projects areexpected to be awarded during <strong>2010</strong>,both in the North Sea and internationally.In the longer term, a solid number of fielddevelopments are still expected on theNCS but fewer very large projects. Theoutlook for the MMO market is regardedas good, with demand expected to behigh in <strong>2010</strong>. ED&S holds a number oflong-term frame agreements in thissegment with the largest operators.The goal for ED&S is to maintain itsshare of the traditional MMO market onthe Norwegian and UK continentalshelves. A commitment willsimultaneously be made to expandactivities in international markets througha particular concentration on the CaspianSea and selected harsh environment anddeep water regions where Aker Solutions’core competence and technologies are indemand.Subsea has been established as theindustry’s most complete supplier ofproducts for advanced sub-surfacesolutions, which allows the business areato offer delivery models sought by themarket in an effective way.Activity in Subsea was affected during<strong>2009</strong> by fewer contract awards for capitalexpenditure (capex) projects, while workrelated to operational expenditure (opex)was less affected by the contraction inthe market.The business area achieved goodresults in a demanding market. Totaloperating revenues declined by 5.5percent over the year to NOK 12 972million (NOK 13 732 million in <strong>2008</strong>).Revenues were positively affected bygrowth in the lifecycle services segment,while low capacity utilisation for the BOASub C and BOA Deep C installationvessels had a negative impact. Thesuccessful restructuring of the businessarea also contributed to a lower cost base,enhanced competitiveness and a moreefficient organisation. EBITDA was NOK1 399 million (NOK 1 709 million in <strong>2008</strong>).A solid share of contracts were wonduring the year, despite demandingmarket conditions. Three EPC contractswith a combined value of just over NOK 3billion were awarded on the NCS – Goliatsubsea for Eni Norge AS, Dong Energy’sTrym and Oselvar projects. The Goliat jobembraces the delivery of a completesubsea production system, includingeight overtrawlable templates, 24 subseatrees, control systems, 20 kilometres ofsteel tube umbilicals, interventionequipment and a connection system.Contracts have also been secured fromStatoil for the delivery of additionalsubsea trees for the Visund and Trollfields. A number of important well servicecontracts were awarded on the NCS andUKCS. The level of activity for wellservices on the NCS set a new record in<strong>2009</strong>.A series of successful subseaproduction system deliveries wereexecuted during the year, and productionis now under way from a number ofcustomer installations. Reliance Industriesbegan producing gas in April from itshuge D1/D3 field off eastern India. Italy’sEni brought Longhorn in the Gulf ofMexico on stream in November, while theOyo development off Nigeria producedfirst oil in December. Pump systems wereinstalled on Statoil’s Tyrihans field to injectseawater into the reservoirs in order toimprove production and recovery. Thissystem is expected to be operational in<strong>2010</strong>, and will enhance recovery from thefield by up to ten percent.Markets for Subsea are expected to beuncertain in the immediate future, butpositive in the longer term. The orderbacklog as of 31 December <strong>2009</strong> wasNOK 12 395 million (NOK 11 204 millionin <strong>2008</strong>).Lower price levels for oil and gas aswell as more difficult access to capital inthe market meant that many developmentprojects for new subsea fields werepostponed in <strong>2009</strong>. Some will be awardedduring <strong>2010</strong>, whilst others have a moreuncertain time frame for awards. AkerSolutions nevertheless expectsinvestment in subsea infrastructure togrow in <strong>2010</strong> and the years to come,driven particularly by developments in theAker Solutions annual report <strong>2009</strong> 39
Our performanceBoard of Directors’ reportNorth Sea and off Brazil, South-East Asiaand West Africa.Products & Technologies experiencedgood activity during <strong>2009</strong>. Operatingrevenues rose by nine percent from theyear before to reach NOK 12 729 million(NOK 11 691 million in <strong>2008</strong>) as a result ofincreased sales of drilling risers and theacquisition of the remaining 50 percent ofAker Wirth GmbH.A total of ten drilling equipmentpackages were completed and deliveredon schedule to various customers duringthe year. Three deepwater CLIP risersare operational, and revenues fromlifecycle services rose during <strong>2009</strong>. While185 sets of deck machinery weredelivered, the first large delivery of rigmooring systems to China was executed.EBITDA for <strong>2009</strong> came to NOK 1 304million (NOK 967 million in <strong>2008</strong>), andprofitability strengthened further with anEBITDA margin of 10.2 percent (8.3percent in <strong>2008</strong>). This improvement inprofitability partly reflects the growth inlifecycle services, good project executionand the copy effect for drilling equipmentdeliveries.The market for lifecycle services isgrowing steadily in line with the risingnumber of installations, and this trendshould continue with the latest deliveriesin the order backlog. Demand for drillingequipment upgrades and maintenancehas been high and is expected to remainso, both in the North Sea and in otherregions.Order intake was low in <strong>2009</strong> but thebacklog is of good quality, with contractsfor drilling equipment packages through<strong>2010</strong>, 2011 and beyond. Six large drillingequipment packages are to be deliveredin <strong>2010</strong>, and these will benefit from thecopy effect after earlier deliveries. A majorupgrade project has also been awardedon Oseberg B, as well as a FEED forupgrading drilling equipment on GullfaksA. The order backlog as of 31 Decemberwas NOK 9 632 million (NOK 15 377million in <strong>2008</strong>).The long-term market outlook is good.Substantial growth is expected in Brazil,where Aker Solutions already occupies astrong position and is further expandingits production and service capacity. Thegoal is to secure at least 50 percent ofthe Brazilian market for deepwater drillingequipment. Combined with otherequipment deliveries to rigs and floatingproduction, storage and offloading(FPSO) units, this will represent the mainpriority areas for P&T.Process & Construction has takenimportant steps to adapt to changedmarket conditions. Both cost andcapacity levels have been substantiallyreduced. The workforce was downsizedfrom about 9 000 people to roughly 6 400during the year, with considerablerestructuring costs recognised in the<strong>2009</strong> accounts. Operating revenues fellby 7.6 percent to NOK 9 534 million (NOK10 313 million in <strong>2008</strong>).Combined with demanding marketconditions, restructuring costscomplicated efforts to strengthenprofitability. EBITDA came to NOK 484million (NOK 759 million in <strong>2008</strong>). TheEBITDA margin fell to 5.1 percent (7.4percent in <strong>2008</strong>).A number of major projects werecompleted during the year, including apolyolefins plant (the Yansab project) forSaudi Basic Industries Corporation inSaudi Arabia and the expansion of theBoddington gold mine in WesternAustralia, one of the world’s largest goldprocessing facilities. Aker Solutionscompleted quality testing of SempraLNG’s Cameron LNG receiving terminal inLouisiana, USA, in partnership with IHI,and received a Notice of SubstantialCompletion. Activity was also high inpower station construction projects suchas Longview and GTA West in the US.The order intake was negativelyaffected by the difficult climate in theworld economy, with few large, capitalintensiveprojects initiated in <strong>2009</strong>.Orders received during the year consistedprimarily of small and medium-sizedprojects as well as growth in existingcontracts. Large projects secured includeTransCanada Energy’s GTA South powerstation development in the US and theToromocho copper project in Peru. Theorder backlog declined from NOK 12 988million at 1 January <strong>2009</strong> to NOK 9 037million as of 31 December.A solid order backlog and a goodmarket position were maintained by theMining & Metals business. The marketoutlook is positive in South America,where the company occupies a leadingposition. Weight will be given toexpanding in Australia and SouthAmerica, where the largest mineralreserves lie and a number of majorcopper projects are planned for the nextfew years.Aker Solutions has a strong positionwithin regasification of LNG in NorthAmerica, where it ranks as the marketleader in terms of both the number ofcontracts held and their value. For powerstation construction, the companyoccupies a strong position in nichesegments – particularly in the US and theUK. Tendering activity is beginning to riseagain in both areas.The downstream petrochemicalsmarket has been hit hard by the financialcrisis, and activity was low in <strong>2009</strong>. Asplanned, converting from lump-sum EPCcontacts to reimbursable EPCMcontracts has contributed to somewhatlower revenues but better margins andreduced risk. Aker Solutions occupies agood position in the Chinese and Indianpetrochemical sectors. Uncertaintypersists over the level of activity relatedto investment by western customers inthese markets.The main strategy for the time to comewill be to exploit strong existing marketpositions while making a commitment toimportant growth markets, with the focuson the three main segments of Mining &Metals, Energy & Environmental, and Oil,Gas & Process. The emphasis in Mining &Metals will be on offering engineering andother EPCM services. At the same time, acommitment will be made to developingnew sustainable niches such as carboncapture and storage, bioenergy and otherrenewable energy technologies, with theemphasis on strengthening the group’sposition in the important growth marketsin the energy and environmental sectors.Research and developmentThe ability to develop new technologyand products represents an importantsuccess factor in efforts to create futurecompetitive advantages in Aker Solutions’main priority areas.Research and development work inthe group is market-driven and costeffective.It is pursued in closecooperation with business partners andcustomers worldwide. Aker Solutions haslarge engineering teams with a high levelof expertise in important priority areas,and first-hand knowledge of thetechnology challenges and requirements40Aker Solutions annual report <strong>2009</strong>
Our performanceBoard of Directors’ reportfacing customers. The interactionbetween Aker Solutions, its businesspartners and its customers createsinnovative technology solutions whichcontribute to high value creation forcustomers.One of the important developmentsbeing pursued by the group is its solutionfor injecting unprocessed seawater inStatoil’s Tyrihans field, which wasinstalled in <strong>2009</strong>. This project hasestablished new records both for thedistance between pumping system andplatform, as of 31 kilometres, and pumpoutput, at 2.7 megawatts.The Ormen Lange pilot installation forsubsea gas compression reached theassembly and integration phase in <strong>2009</strong>and will be ready for positioning in a testfacility at Aukra during <strong>2010</strong>. This projecthas contributed to developing, qualifyingand thoroughly testing a number of newtechnologies for electric control systems,compact gas compressors and highcapacitypower transmission andconversion systems.One of the projects in the commitmentto deep water is the first Aker OilfieldServices vessel for installing subseaequipment, built in <strong>2009</strong> and delivered toPetrobras in early <strong>2010</strong>. The second ofthese vessels – a total concept forinstallation, completion and interventionby a monohull unit – is due to becompleted and ready for operation during<strong>2010</strong>.Development projects are also beingpursued with advanced drillingequipment. One is the construction inSouth Korea of the Titanium Explorer drillshipfor DSME, intended to work in waterdepths right down to 12 000 feet (about3 650 metres). This delivery includes themost powerful hoisting system ever builtfor a commercial drillship, with a hookload of 1 250 short tons (more than 1 100tonnes).Aker Solutions has achieved a leadingposition in deepwater technology throughpurposeful development work, withproducts offering unique performancecreated in the various parts of the group.These form the components in a systemconsisting of the GH 6001 drawworks,the drilling derrick, the CMC 1500/2800as the world’s most powerful topmountedmotion compensator, and theMDDM 1250 as the world’s mostadvanced top drive. This package willmake it possible to secure a leadingposition in the deepwater market.Deliveries to the yard are expected to becompleted during the second quarter of<strong>2010</strong>.NOK 164 million was invested by AkerSolutions during <strong>2009</strong> (NOK 188 million)in research and development throughselected projects. In addition cametechnology development financed ascustomer projects. The group alsoreceived NOK 22 million in funds fortechnology development from customersand government (NOK 21 million).Events after the balance sheet dateIt was announced in January <strong>2010</strong> thatthe share purchase programme foremployees would be continued on thesame terms as in <strong>2009</strong>. 3 759 employeesin Norway, the Netherlands, the UK, Chile,Canada and the US have signed up forthe new programme.Towards the end of January, AkerSolutions awarded a contract to the Hentconstruction company to erect acombined office and hotel building on theK2 site at Fornebu, which was acquiredin the fourth quarter of <strong>2009</strong>. Thesepremises are due to be ready foroccupancy in early 2012, and AkerSolutions will lease the office section.Aker Solutions was awarded a GBP115 million contract in early February byRWE for the design, supply, construction,installation and commissioning of a newbiomass renewable energy plant near Fifein the UK. This will be the largest plant ofits kind in Scotland.In mid-February Statoil awarded AkerSolutions an EPC contract ofapproximately NOK 450 million for thejacket to the Gudrun project in the NorthSea. The contract will be executed byAker Solutions’ yard in Verdal, andincludes engineering, procurement,construction, load-out and sea-fasteningof the steel jacket and associated piles.Share and share capitalA share purchase scheme for employeeswas established in January <strong>2009</strong>. Thisprogramme embraced some 19 000 of itsemployees in Norway, the Netherlands,the UK, Chile, Canada and the US 1 . Theywere offered the opportunity to purchaseshares in Aker Solutions up to a ceiling ofNOK 15 000 per employee and at adiscount of up to NOK 1 500 peremployee over the 12-month duration(March <strong>2009</strong> to February <strong>2010</strong>) of theprogramme. The price per share wascalculated on the basis of the averagevolume-weighted share price on the OsloStock Exchange the day before theshares were allocated. Employees whoretain their shares until 1 September 2011and who remain continuously employedby Aker Solutions throughout the periodwill be entitled to receive free bonusshares at the rate of one bonus share forevery two shares purchased under theprogramme. A total of 4 031 employeesbought a total of 832 119 shares throughthe programme in <strong>2009</strong>. It has beenresolved to continue the programme onthe same terms in <strong>2010</strong>. Around 17 200employees were invited to participate inJanuary <strong>2010</strong>. 3 759 signed up.In connection with the share purchaseprogramme, the Board was mandated bythe <strong>Annual</strong> General Meeting on 3 April<strong>2009</strong> to buy back shares up to a totalnominal value of NOK 54 800 000,corresponding to about ten percent of theissued shares. The Board has mandatedthe administration to purchase up to fivepercent. Repurchases above thatpercentage but within the AGM’smandate must be considered by theBoard. The mandate applies until the next<strong>Annual</strong> General Meeting, which is due totake place on 8 April <strong>2010</strong>. As of 31December, Aker Solutions had boughtback 436 200 of its own shares with avalue of NOK 20 140 582, correspondingto 0.16 percent of the issued total. As of28 February <strong>2009</strong>, 436 200 shares hadbeen acquired under the mandate.The Board will propose an extension ofthe mandate for 12 months from the dateof the AGM’s decision. New terms willthen be set for the buy-back programme.The Board was not mandated in <strong>2009</strong> toincrease the share capital.During <strong>2009</strong>, the price of thecompany’s shares rose by 67.7 percent.The closing price as of 31 December wasNOK 75.45. Aker Solutions is included inhe OBX index of the 25 most liquidshares listed on the Oslo Stock Exchange.This index rose by 60 percent over thesame period. No changes occurred in theproportion of the shares owned by the1) Employees in the US were only able to participate afterall formal approvals had been secured. They joined theprogramme in August, and accordingly participated forjust seven months, compared with 12 for personnel in theother countries.Aker Solutions annual report <strong>2009</strong> 41
Our performanceBoard of Directors’ reportprincipal shareholder in <strong>2009</strong>. Furtherinformation on the share and shareholderscan be found on page 116 of this annualreportGoing concernBased on the group’s financial results andposition, the Board affirms that the annualaccounts for <strong>2009</strong> have been prepared onthe assumption that the company is agoing concern.Dividend policyThe parent company’s dividend policyinvolves an intention to pay shareholdersan annual dividend of 30-50 percent ofnet profit. The dividend will be paid incash and/or through share buy-backs.The Board will propose a total dividend ofNOK 2.60 per share for <strong>2009</strong> to the AGM.Shareholders will then have receivedabout 30 percent of net profit in the formof share buy-backs and dividend for thefiscal year.Parent company accounts andallocation of net profitParent company Aker Solutions ASA hada net profit of NOK 1 052 million for <strong>2009</strong>(NOK 205 million in <strong>2008</strong>).Pursuant to the company’s dividendpolicy, the Board proposes that anordinary dividend of NOK 2.60 per sharebe paid. This amounts to NOK 712 millionor about 30 percent of the net profit.The Board thereby proposes thefollowing allocation of net profit:Dividend 1Other equityTotal allocated1) Excluding dividend on own sharesNOK 701 millionNOK 348 millionNOK 1 049 millionUnrestricted equity after the proposeddividend payment amounts to NOK 3 493million.Health, safety and the environmentConcern for health, safety and theenvironment (HSE) is one of AkerSolutions’ core values. The fundamentalprinciple and attitude is that all incidentscan be prevented. On that basis, AkerSolutions works continuously to preventincidents which could cause harm topersonnel or to material or non-materialassets.Driven by careThe Just Care concept is used as asymbol and brand for the group’s HSEculture and work. A key element is thateach person accepts personalresponsibility for HSE, based on care forpeople and the environment. ThroughJust Care, the HSE message reachesthe individual employee more effectively.Managers as role models and a strongcommitment to communication andtraining create attitudes which integrateHSE in everyday work. This contributes togood projects and better HSE results.A common HSE cultureEducation occupies a central place inAker Solutions’ HSE programme. Since itwas introduced in 2005, a tailored HSEleadership programme developed inhousehas been completed by more than2 700 leaders. This programme equipsmanagers with the competence requiredto become better role models and to driveHSE improvements. To reach out to allemployees in an efficient way, the grouphas also developed its own eLearningprogrammes for important areas. Theseinclude the Just Care culture and HSEas a core value, as well as more specifictopics on mastering stress and protectingthe environment. More than 77 000eLearning sessions have been completedsince these programmes were introduced.Clear expectationsA common HSE operating system for thewhole company sets standards for themost important elements in HSEmanagement and leadership. Regularaudits uncover possible gaps in relationto expectations, and the necessarycountermeasures are identified andinitiated. This system also functions as aframework for cross-organisationalsharing and learning.Learning from incidentsOn the basis of an analysis of incidents inrecent years and exchange of experiencein the industry, Aker Solutions hasdeveloped and adopted a newcomponent in its HSE programme.Entitled Just Rules, this is a set of simplebut specific safety regulations forparticular work operations which arejudged on the basis of experience to posehigher risks. These rules wereimplemented throughout the group during<strong>2008</strong> and <strong>2009</strong>. More than 32 000employees, contract staff and subcontractorpersonnel have participated inpresentations of Just Rules as part oftheir extensive roll-out. By making themost important preventative measuresmandatory, clear and simple, Just Rulesessentially contributes to preventingserious incidents.Despite continuous efforts to avoidserious incidents, Aker Solutionsregrettably suffered three fatalities at workduring <strong>2009</strong>. One employee was killed ina helicopter accident off Newfoundland inCanada. Another died following anaccidental fall on a rig in Singapore, andthe third passed away after severalmonths in a coma following a fall from alorry on the Longview project in the US.The number of incidents causingserious personal injury rose from 18 in<strong>2008</strong> to 21. Of these 21 incidents, fiveinvolved working at height, five werecaused by crushing, four occurred duringlifting operations, four were due to sliping,two involved tools and one was ahelicopter accident. The total injuryfrequency per million working hours fellfrom 3.6 in <strong>2008</strong> to 2.7. The lost-timeincident frequency per million workinghours declined from 0.93 in <strong>2008</strong> to 0.90.These figures also include Aker Solutions’sub-contractors. All serious incidents andnear misses are investigated and thelessons from them implemented with theaim of preventing similar incidents in thefuture.Sick leaveSick leave amounted to 2.2 percent oftotal working hours in <strong>2009</strong>, comparedwith 2.3 percent the year before. Thetrend is for sick leave to remain stable ata low level after a clear decline in 2003-2006. However, it should be noted thatdifferences in local regulations complicatea direct comparison of sick leave betweendifferent countries.EnvironmentThe Board takes the view that AkerSolutions’ activities pose only a limiteddirect burden on the environment. Nounintentional discharges or emissions tothe surrounding environment wererecorded in <strong>2009</strong>. Total energyconsumption by the business in <strong>2009</strong>,based on recorded use of oil, gas andelectricity, amounted to 588 20642Aker Solutions annual report <strong>2009</strong>
Our performanceBoard of Directors’ reportmegawatt-hours. Carbon emissionsrelated to this usage are estimated at136 797 tonnes (the methodology usedderives from the Greenhouse GasProtocol – GHG). Waste recorded inconnection with the business totalled45 744 tonnes, of which 75 percent wasrecycled. <strong>Report</strong>ing processes forenvironmental parameters have beenimproved, and the figures above arebeing reported since <strong>2008</strong> with greateraccuracy than before.21 of the group’s business units arenow certified to the ISO 14001environmental standard. An eLearningprogramme with a particular focus on theenvironment was introduced during <strong>2008</strong>,and 15 000 employees have so farcompleted it. The above-mentioned HSEleadership development initiatives,eLearning and the management systemalso incorporate clear components whichfocus attention on the environment.Collectively, these contribute tocontinuous improvements inenvironmental awareness and attitudesamong managers and other employees.This inspires the organisation to achievefurther gains in environmentalperformance in Aker Solutions’ ownactivities, and to assist customers inmaking environmental improvementsthrough the products developed by thegroup. Examples can be found in suchareas as carbon capture, drilling rigs witha strong environmental performance inarctic conditions, treatment of volatileorganic compounds, treatment of sulphurand ammonia discharges, installationequipment and support structures forwind turbines, as well as the nextgeneration of biofuels.People and organisationPeople are Aker Solutions’ mostimportant resource. Developing theperformance of our people is one of thekey success factors in securing long-termand sustainable value creation throughefficient project execution and solidcommercial operations. The attentionpaid by the group to employeedevelopment is regarded as an importantcompetitive advantage. Aker Academyserves as the internal arena for know-howbuilding and employee developmentthroughout the group. It offersprogrammes in important professionalsubject areas such as leadership (atvarious levels), project execution,commercial management and HSE.In addition, there are online andremote “eLearning” programmes, with atotal of 24 000 active users in more than30 countries. More than 118 000eLearning courses have been completedby Aker Solutions’ people since 2005.The group’s global eLearning portal offersmore than 30 tailored programmescovering areas including projectexecution, HSE, corporate responsibilityand more company-specific, operationaltopics. Aker Solutions is an internationalgroup with high standards of quality in allits internal and external communication.The corporate language is British English,and English language teaching is amongthe courses available to employees. Aglobal agreement for the delivery ofEnglish courses was entered into in <strong>2009</strong>.This delivery comprises teacher-directedclassroom lessons combined with online,interactive learning which can be pursuedwhenever it suits the individual student.The commitment to eLearning gives allemployees access to a cost-effective andaccessible range of courses. In additionto boosting professional expertise in keyareas, these courses make a strongcontribution to building a commoncorporate culture, as well as providingopportunities for mandatory certificationin specific areas. Corporate programmesoffered across the group aresupplemented by courses organised bylocal units, while delivered under theumbrella of the Aker Academy.Leadership development is given ahigh priority by Aker Solutions. A newprogramme, “expanding your leadership”,was introduced by the Aker Academy in<strong>2009</strong>. This programme aims to securegrowth in future management resourcesand ensure that its participants developthe expertise needed for occupying keypositions in the group in future. Launchedin November, the programme runs untilSeptember <strong>2010</strong> with a total of 27participants. They are exposed tooperational and other leadershipchallenges as well as receiving one-toonecareer support through mentoring,coaching and interactions with the CEOand business area leaders, throughouttheir time on the programme.Aker Solutions’ establishedinternational trainee programme has beenimportant in attracting talented personnelin the group’s strategic growth areas.Nine trainees, including four women, fromMalaysia, China, Brazil and Russiacompleted the two-year programme in<strong>2009</strong>. All were offered, and acceptedpositions with Aker Solutions. A total of17 trainees, including seven women, haveso far graduated from the programme.Aker Solutions is becoming steadilymore international, and the importance ofenhanced cultural understandingbetween its people was anotherimportant priority in <strong>2009</strong>. Culturaldiversity in the organisation represents aclear competitive advantage. A newinitiative was introduced in <strong>2009</strong> to trainthe group’s people from various parts ofthe world to serve as “cross-culturalconnectors”. This programme has beencompleted by a total of 122 people,including 57 women from 14 differentcountries.OrganisationCost-cutting measures were implementedduring <strong>2009</strong> with the immediate aim ofadapting to the global economicuncertainty and, in the longer term, tosecuring the group’s competitiveness andgrowth. This work required a capacityadjustment in the workforce to achievegreater flexibility for the future. The goalis that the group’s total resources at anygiven time will have a balancedcomposition of employees and contractstaff. As of 31 December <strong>2009</strong>, theoverall workforce comprised 29 937people, including 22 133 employeddirectly and 7 804 on contract. Thatrepresents a capacity adjustment ofabout 4 000 from the end of <strong>2008</strong>. Of theemployees, 52.2 percent worked inNorway, 16.6 percent in the Americas, 14percent in the Asia Pasific region, 16percent in Europe excluding Norway and1.2 percent in Africa and the Middle East.Workforce turnover in <strong>2009</strong> averaged 6.7percent, a decline of 1.6 percent from theyear before. More than 51 000 applicantsfrom over 30 countries were registered inthe group’s recruitment system during theyear. A total of 1 771 new employeeswere recruited from this base, withwomen accounting for 24 percent andmen for 76 percent.Board and management changesA new Board of Directors was elected bythe <strong>Annual</strong> General Meeting on 2 AprilAker Solutions annual report <strong>2009</strong> 43
Our performanceBoard of Directors’ report<strong>2009</strong>, with the following shareholderelectedDirectors: Øyvind Eriksen(Chairman), Kjell Inge Røkke, Leif-ArneLangøy, Lone Fønss Schrøder, VibekeHammer Madsen and Heidi M. Petersen.The Board was elected for a period of twoyears. Petersen announced in April thatshe wished to resign as a Director.Langøy tendered his resignation in June,and an Extraordinary General Meeting on8 June elected Ida Helliesen and MikaelLilius as new Directors for the period upto the <strong>Annual</strong> General Meeting in 2011.In January <strong>2009</strong>, Jarle Tautra wasappointed Executive Vice President forthe ED&S business area with effect from1 February. He was previously head of theP&C business area. Gary Mandel wasappointed executive vice president forP&C in succession to Tautra in January<strong>2009</strong>. He came from the post of CEO atAker American Shipping and had beenexecutive vice president for the former Oil,Gas, Process & Energy business areafrom 2002-<strong>2007</strong>. Karl Erik Kjelstad wasappointed executive vice president forthe oil service and marine operationssegment on 1 July. He has been with Akersince 1998, and was President & CEO ofAker Yards (now STX Europe) fromJanuary 2003 to June <strong>2007</strong>. BetweenJune <strong>2007</strong> and June <strong>2009</strong>, he was seniorpartner and president for maritimetechnology in Aker ASA.Equal opportunities and diversityAker Solutions is enriched by being aglobal organisation which embracespeople from many cultures, religions andethnic groups. Equal opportunities foreveryone is therefore an establishedprinciple for the group. That applies toboth potential and existing employees,regardless of race, colour, religion, gender,age, national origin or disability. Withoperations in roughly 30 countries and onevery continent, diversity is essential inorder to manoeuvre as effectively aspossible within both local and globalconditions and frameworks.The group is subject to a three-partyframe agreement between Aker ASA,Norway’s United Federation of TradeUnions and the InternationalMetalworkers Union, in which thesignatories undertake to promote goodworking conditions for employees. Thisagreement covers major issues includingdiscrimination, working hours and generalemployment terms. The agreement is aformal part of Aker Solutions’ governingframework, with its implementation in thevarious regions tailored to each country’slegal system. The agreement is reviewedannually to ensure that the parties fulfiltheir commitments. The annual review for<strong>2009</strong> was conducted during November incooperation with Aker’s European WorksCouncil. In addition, a global standard forwhistleblowing has been adopted toensure that all employees, regardless oftheir location, have the opportunity toreport irregularities.Aker Solutions is concerned that itsemployees maintain a good balancebetween work and private life.Companies in the group are encouragedto focus on a work pattern which suitsboth employees and company. Aminimum requirement is that such workpatterns must accord with locallegislation, and that no differences shouldexist between genders or ethnic groups.Examples of these work patterns includeflexible working hours, remote or homeworking and compressed working weeks.These benefits are regarded as importantelements in ensuring equal opportunities.The group’s remuneration policy is thatthe same pay will be given for the samework, and that good performance will berewarded. Key factors in determining payare the scope and level of responsibility,job requirements, levels of expertise andcommitment, results achieved, and localpay levels. Average pay in the group issomewhat higher for men than forwomen. This reflects the fact that, onaverage, male employees have greaterpay seniority than women. Aker Solutionshas two main categories of employees:skilled workers and operators (28.9percent) and white collar people (71.1percent).Requirements are set for diversity inrecruitment and leadership development.A total of 1 771 new employees weretaken on in <strong>2009</strong>, of whom 24 percentwere women. The share of womenrecruited in <strong>2009</strong> declined marginallyfrom <strong>2008</strong>.Management development makes animportant contribution to getting womeninto senior posts. Six women areparticipating in the new “expanding yourleadership” development programme,which embraces 27 candidates underconsideration for senior executivepositions in the group. Two femalemanagers have also participated inMcKinsey’s Centred LeadershipProgramme, an external managementand networking scheme for senior femaleexecutives.26 percent of participants in themanagement development programmesdelivered by the Aker Academy in <strong>2009</strong>were women. Aker Solutionsconcentrated in <strong>2009</strong> on enhancingcultural understanding in order to ensurethat its diversity helps to promote ratherthan constrain the group’s development.The 122 employees trained as crossculturalconnectors included 14 differentnationalities and 57 women. AkerSolutions is also deliberately working toattract talented new people, and womenaccount for 41 percent of the participantsin Aker Solutions’ international traineeprogramme. Three of Aker Solutions’ sixshareholder-elected Directors are women(or 50 percent). All the employee-electeddirectors are men. This is in accordancewith legal requirements, since womenaccount for less than 20 percent of theoverall workforce. The corporatemanagement team had no femalemembers as of 31 December <strong>2009</strong>.Performance culture and employeerewardsAker Solutions increased the attentionpaid to the group’s performance culturein <strong>2009</strong>. Clarifying responsibilities and afocus on achieving objectives at bothcompany and individual levels areimportant drivers for the furtherdevelopment of a competitiveorganisation and in the achievement ofgood commercial results. Performancedialogues between managers and theirpeople assess objectives met and setnew objectives for commercial resultsand personal development. Objectives formanagers and other employees aredetermined on the basis of strategies andbudgets in each unit. At least once a year,an evaluation of the results achieved bythe employee is conducted. Thisassessment is based both on the resultsachieved and on the way the group’svalues are observed in day-to-dayworking. The evaluation provides thebasis for recognition, rewards and careeropportunities, and gives direction forpotensial individual performanceimprovements.44Aker Solutions annual report <strong>2009</strong>
Our performanceBoard of Directors’ reportAker Solutions rewards managers andemployees in accordance with the resultsachieved. This is ensured by thedetermination of individual basic pay forgroups of employees and byremuneration systems which pay anannual variable amount to managers andother employees. Different variable payprogrammes are utilised by AkerSolutions’ businesses to make resultbasedpay an attractive part of the totalremuneration paid to employees. <strong>Annual</strong>variable pay is given to employees on thebasis of the commercial results achievedby the relevant business unit or project.Managers earn variable pay on the basisof the commercial results for the unitsthey influence and the extent to whichthey comply with the group’s values.Variable pay for senior executives isspread over several years to encouragelong-term achievement of results and alasting employee relationship. Furtherdetails of the remuneration of seniorexecutives are otherwise provided inNote 9 to the consolidated accounts onsalaries, wages and social security costs.Corporate governanceAker Solutions’ corporate governanceprinciples build on the applicableNorwegian code of practice for corporategovernance, which also largelyharmonises with applicable internationalrecommendations. The annual statementon the way Aker Solutions observes thecode of practice issued by the NorwegianCorporate Governance Board (NCGB)can be found on page 124 of this annualreport.Corporate responsibilityAs a Norwegian group with a stronginternational presence and as a supplierto the global energy and processindustries, Aker Solutions affects theeconomy, the environment and the livesof people worldwide. Such a positioncarries a responsibility – the responsibilityto establish and comply with highstandards, to be a business driven by itsvalues and to act as a good corporatecitizen.The group’s history and values, as wellas international norms such as the UNGlobal Compact, the Global <strong>Report</strong>ingInitiative and the OECD guidelines, formthe basis of Aker Solutions’ corporateresponsibility (CR) principles and of theway it reports in this area.The group strengthened its work onCR in <strong>2009</strong>, in part by giving it strongerrepresentation in corporate managementthrough the creation of the enterprise riskfunction. This function has overallresponsibility for CR, while operationalresponsibility rests with line managementand the business areas. Ethics,whistleblowing and combating financialcrime were key issues for the enterpriserisk team in <strong>2009</strong>.An important goal for <strong>2009</strong> was todevelop and implement a code ofconduct for Aker Solutions. Thissummarises the group’s CR principles, isbased on pre-existing material and issafeguarded in the group’s policies,annual and CR reports. Targeted trainingprogrammes help to strengthenunderstanding of, and ensure compliancewith Aker Solutions’ rules. The code ofconduct is available on the group’swebsite at www.akersolutions.com/CR.The group’s whistleblowing policy wasapproved and initially communicated inFebruary <strong>2009</strong>. The policy provides fornotification through several channels. Thecentral whistleblowing managementfunction is assigned to enterprise risk.The routines involved are specified inAker Solutions’ People Policy, and accordwith the provisions of the NorwegianWorking Environment Act.Great attention is paid to the integrityof Aker Solutions’ operations, withsignificant effort devoted to riskmanagement in this area, includingrelations with partners and other businesscontacts. The group’s framework forassessing partners and other businesscontacts was further tightened in <strong>2009</strong>,with the requirement for an externalintegrity check of such connections asone of the most important changes.As part of its work in CR, AkerSolutions has engaged with a number ofinternational organisations dedicated to amore sustainable development of thebusiness sector. The group became amember of the UN’s Global Compact in<strong>2008</strong>. Both globally and locally, thisopens up opportunities for dialogue andcollaboration with other enterprises,voluntary organisations, unions andgovernmental authorities on a range ofcrucial issues.Aker ASA’s frame agreement withNorway’s United Federation of TradeUnions and the InternationalMetalworkers Federation commits AkerSolutions to working for good labourrelations and to respecting human andworkers’ rights in the communities inwhich it operates.Aker Solutions can report <strong>2009</strong> asanother active and successful year in itsthree-year partnership with theNorwegian Red Cross, which was startedin December <strong>2009</strong>. This collaborationincorporates financial support,exchanges of knowledge and voluntarycontributions. A number of the group’sNorwegian employees are now engagedin activities with the Norwegian RedCross. The second phase of thepartnership will see the collaborationexpanded to encompass Aker Solutionsoffices worldwide. More informationabout the group’s partnership with theNorwegian Red Cross can be found onpage 27.Customer relationsMany of Aker Solutions’ customers areleading players in their sectors on theworld stage. Their common denominatoris the execution of large, demandingprojects where failure to meet agreedprogress, budget, quality and efficiencymilestones can have majorconsequences.Aker Solutions depends on the trust itinspires in its customers. The mostimportant success factor for achievingthat trust is to deliver predictably on eachof those milestones. Customers haveshown trust in Aker Solutions over theyears by awarding it important projects.Preserving and continuing to develop theasset that this represents is vital.Good customer relations also involveadapting to customer’s needs. AkerSolutions has a reputation for offeringsolutions which create added value for itscustomers. Great weight is given tofinding the best, most effective solutionsfor each of them. This is done bycombining an understanding of thecustomer’s specific challenges with AkerSolutions’ expertise, experience,technology and products - and not leastwith the aid of its recognised and wellprovenmodel for project execution. Thegroup took important steps in <strong>2009</strong> toadapt its organisation even further tocustomer requirements, while taking arange of measures to meet customers’Aker Solutions annual report <strong>2009</strong> 45
Our performanceBoard of Directors’ reportexpectations of lower prices.Contact with customers is pursued atvarious levels - between senior executives,through to business areas and projectmanagement, in addition to closecollaboration between teams of experts.Corporate and other managers havedefined roles in ensuring the best possiblefollow-up for each customer. Contact atseveral levels ensures a good overviewand understanding of the customer’srequirements, both in the short term andover a longer perspective.In addition to direct contacts, AkerSolutions utilises external market analysesand surveys of customer satisfaction astools to ensure that it is meeting itscustomers’ expectations and needs.The group serves industries where thenumber of customers in each niche isrelatively small. However, most of theserepresent a broad and long-term potentialfor collaboration. The goal is to establishgood, long-term relationships withcustomers, based on the group’sperformance and on competitivetendering.Mutual trust, built up through businessrelationships extending over many years,often helps to create new opportunities.These could involve new contracts witheven better reward models, for instance,or the development of innovative solutionsand technologies in close collaborationwith the customer. Trust is also valuablewhen assessing developments in newregions. It will often be easier to managerisk, for instance, when the customer hasan established relationship with AkerSolutions.OutlookThe Board would like to point out thatassessments of future conditions aresubject to uncertainty.Since <strong>2007</strong>, Aker Solutions has workedto reduce its cost levels, and wastherefore well prepared to meet thechallenges which have accompanied theinternational financial crisis. This workcontinued in <strong>2009</strong>, with a number ofimportant restructuring measures to adaptcosts and capacity. The group iscontinuing to work systematically onoptimising its cost base, providingemployees at all levels with further training,and implementing the effects ofimprovement programmes which arebeing pursued continuously.Although market activity is expected tobe lower in the immediate future, the longtermbasis for further growth in AkerSolutions’ markets is regarded as good.Oil and gas fields currently in productionwill be unable to meet demand in thelonger term. The replacement of oil andgas production with new reserves isinadequate. A substantial proportion offuture developments are expected tooccur in deep waters and harshenvironments. These are areas where AkerSolutions has broad experience and astrong competitive advantage.High levels of tendering activity areexpected in <strong>2010</strong>, but it remains uncertainwhen contracts will be awarded. AkerSolutions has ambitions to enhance thestability of its revenues through anincreased commitment to servicing andlifecycle services.Aker Solutions is well positioned forfurther profitable growth. The adjustmentsmade in <strong>2008</strong> and <strong>2009</strong> mean that thegroup is well adapted to both marketdevelopments and customer requirements.Efforts to create a smaller, more flexiblecost base will continue.The long-term strategy remainsunchanged, and continues to focus ongrowth in deep water and harshenvironment areas, in addition toexploiting the strong MMO market in theNorth Sea. A further commitment will bemade to well and reservoir services whilethe subsea business will concentrate oncontinued growth in lifecycle services. Thelong-term outlook for P&T is also positive,with lifecycle services growing in line withthe products’ installed base. Substantialgrowth is also expected in Brazil, whereAker Solutions already occupies a strongposition, well-placed to secure futurecontracts. For the onshore process andmetals processing facilities delivered byP&C, the level of activity will depend ondevelopments in the world economy.Aker Solutions has a solid orderbacklog, and adjustments to theorganisation and cost structure willmaintain good levels of competitiveness.Capital levels are good, and the liquidityposition is sufficiently robust toaccommodate future investment plans.The Board takes the view that AkerSolutions is well equipped to meetfluctuations in market activity.The Board extends its thanks to themanagement and workforce for thecommitment displayed in <strong>2009</strong>. Thequality and expertise built up in AkerSolutions will make importantcontributions to enhancing the group’scompetitive advantage in a demandingmarket.Fornebu, 3 March <strong>2010</strong>The Board of Directors of Aker Solutions ASAØyvind EriksenChairmanLone Fønss Schrøder Kjell Inge Røkke Vibeke HammerMadsenMikael LiliusIda HelliesenAtle Teigland Åsmund Knutsen Arild Håvik Arve Toft Simen LieunghPresident & CEO46Aker Solutions annual report <strong>2009</strong>
Our performanceDeclaration by the Board of Directors and the President & CEODeclaration by the Board of Directorsand the President & CEOThe Board and the President & CEO have today considered and approved the annual report and financial statements for the AkerSolutions group and its parent company Aker Solutions ASA for the <strong>2009</strong> calendar year ended on 31 December <strong>2009</strong>.The Board has based this declaration on reports and statements from the group’s President & CEO, on the results of thecompany’s activities, and on other information that is essential to assess the company’s position, provided to the Board of Directorsof the parent company under obligation by the group’s administration and subsidiaries.To the best of our knowledge:■■the <strong>2009</strong> financial statements for the group and parent company have been prepared in accordance with all applicable accountingstandards■■the information provided in the financial statements gives a true and fair portrayal of the group and parent company’s assets,liabilities, profit and overall financial position as of 31 December <strong>2009</strong>■■the annual report provides a true and fair overview of:– the development, profit and financial position of the group and parent company– the most significant risks and uncertainties facing the group and the parent companyFornebu, 3 March <strong>2010</strong>The Board of Directors and the President & CEO of Aker Solutions ASAØyvind EriksenChairmanLone Fønss Schrøder Kjell Inge Røkke Vibeke HammerMadsenMikael LiliusIda HelliesenAtle Teigland Åsmund Knutsen Arild Håvik Arve Toft Simen LieunghPresident & CEOAker Solutions annual report <strong>2009</strong> 47
Our performance48Aker Solutions annual report <strong>2009</strong>
Our performanceContents: Financial statements and notesAker Solutions group50 Consolidated income statement51 Consolidated statement of comprehensive income52 Consolidated balance sheet53 Consolidated statement of changes in equity54 Consolidated statement of cash flowNotes to consolidated financial statements55 Note 1 General information55 Note 2 Basis of preparation56 Note 3 Accounting principles61 Note 4 Accounting estimates and judgements62 Note 5 Financial risk management and exposures66 Note 6 Acquisitions of subsidiaries and non-controlling interests68 Note 7 Related parties70 Note 8 Operating segments74 Note 9 Salaries, wages and social security costs78 Note 10 Operating leases78 Note 11 Other operating expenses79 Note 12 Finance income and expenses80 Note 13 Tax82 Note 14 Net capital employed82 Note 15 Trade and other receivables82 Note 16 Inventories83 Note 17 Contracts84 Note 18 Trade and other payables85 Note 19 Provisions85 Note 20 Derivative financial instruments87 Note 21 Property, plant and equipment88 Note 22 Intangible assets89 Note 23 Interest-bearing receivables89 Note 24 Investments in associated companies and jointly controlled entities90 Note 25 Jointly controlled operations90 Note 26 Investments in other companies91 Note 27 Borrowings93 Note 28 Other non-current liabilities93 Note 29 Employee benefits – pension96 Note 30 Earnings per share97 Note 31 Financial instruments99 Note 32 Contingent events100 Note 33 Number of employees100 Note 34 Group companies as of 31 December <strong>2009</strong>103 Note 35 Subsequent eventsAker Solutions ASA104 Parent company income statement105 Parent company balance sheet106 Parent company statement of cash flowNotes to parent company financial statements107 Note 1 Accounting principles107 Note 2 Operating expenses108 Note 3 Net financial items108 Note 4 Tax109 Note 5 Investment in group companies109 Note 6 Shareholders’ equity110 Note 7 Receivables and liabilities from group companies110 Note 8 Other non-current interest-bearing receivables111 Note 9 Other current receivables and current liabilities111 Note 10 Borrowings113 Note 11 Guarantees114 Note 12 Financial risk management and financial instruments114 Note 13 Related partiesAker Solutions annual report <strong>2009</strong> 49
Our performance<strong>Annual</strong> accountsAker Solutions group:Consolidated income statement 1.1 – 31.12Amounts in NOK million Note <strong>2009</strong> <strong>2008</strong> <strong>2007</strong>Operating revenue 53 748 58 252 57 957Other income 6 329 - -Total revenue and other income 8 54 077 58 252 57 957Materials, goods and services (28 986) (34 891) (36 405)Salaries, wages and social security costs 9 (14 359) (13 122) (12 197)Other operating expenses 11 (6 364) (6 857) (5 442)Total operating expenses (49 709) (54 870) (54 044)Operating profit before depreciation, amortisation and impairment 4 368 3 382 3 913Depreciation, amortisation and impairment 21, 22 (910) (615) (431)Operating profit 3 458 2 767 3 482Finance income 12 27 175 105Finance expenses 12 (552) (379) (209)Profit (loss) from associated companies and jointly controlled entities 24 114 (21) (2)Profit (loss) on foreign currency forward contracts 1 12 161 (439) 162Profit before tax 3 208 2 103 3 538Income tax expense 13 (877) (590) (1 074)Profit for the period 2 331 1 513 2 464Profit for the period attributable to:Equity holders of the parent company 2 260 1 438 2 401Non-controlling interests 71 75 63Profit for the period 2 331 1 513 2 464Basic earnings per share (NOK) 30 8.40 5.34 8.84Diluted earnings per share (NOK) 30 8.39 5.34 8.841) Profit or loss on foreign currency hedging instruments that do not qualify for hedge accounting.50Aker Solutions annual report <strong>2009</strong>
Our performance<strong>Annual</strong> accountsAker Solutions group:Consolidated statement of comprehensiveincome 1.1 – 31.12Amounts in NOK million <strong>2009</strong> <strong>2008</strong> <strong>2007</strong>Profit for the period 2 331 1 513 2 464Other comprehensive income:Cash flow hedges, effective portion of changes in fair value (761) (241) 788Cash flow hedges, reclassification to income statement 397 373 (633)Cash flow hedges, deferred tax 102 (37) (43)Total cash flow hedges (262) 95 112Translation differences (989) 702 (434)Total comprehensive income for the period 1 080 2 310 2 142Attributable to:Equity holders of Aker Solutions ASA 1 027 2 228 2 081Non-controlling interests 53 82 61Total comprehensive income for the period 1 080 2 310 2 142Aker Solutions annual report <strong>2009</strong> 51
Our performance<strong>Annual</strong> accountsAker Solutions group:Consolidated balance sheet as of 31 DecemberAmounts in NOK million Note <strong>2009</strong> <strong>2008</strong>AssetsNon-current assetsProperty, plant and equipment 21 6 531 4 610Deferred tax assets 13 389 519Intangible assets 22 7 915 7 119Employee benefit assets 29 167 234Non-current interest-bearing receivables 23 184 97Other non-current operating assets 338 4Investments in associated companies and jointly controlled entities 24 423 444Investments in other companies 26 135 123Total non-current assets 16 082 13 150Current assetsCurrent tax assets 13 97 49Inventories 16 1 417 1 321Trade and other receivables 15 18 332 20 796Derivative financial instruments 20 372 3 100Current interest-bearing receivables 23 440 480Cash and cash equivalents 3 186 3 828Total current assets 23 844 29 574Total assets 39 926 42 724Liabilities and shareholders' equityEquityIssued capital 548 548Treasury shares (9) (10)Other capital paid in 1 534 1 534Other equity 6 903 6 378Total equity attributable to the equity holders in Aker Solutions ASA 8 976 8 450Non-controlling interests 147 156Total equity 9 123 8 606LiabilitiesNon-current borrowings 27 7 335 6 163Employee benefits obligations 29 910 758Deferred tax liabilities 13 692 831Other non-current liabilities 28 891 1 194Total non-current liabilities 9 828 8 946Current borrowings 27 180 553Current tax liabilities 13 211 252Provisions 19 869 912Trade and other payables 18 19 370 21 052Derivative financial instruments 20 345 2 403Total current liabilities 20 975 25 172Total liabilities 30 803 34 118Total liabilities and equity 39 926 42 724Fornebu, 3 March <strong>2010</strong>Board of Directors of Aker Solutions ASAØyvind EriksenChairmanLone Fønss Schrøder Kjell Inge Røkke Vibeke HammerMadsenMikael LiliusIda HelliesenAtle Teigland Åsmund Knutsen Arild Håvik Arve Toft Simen LieunghPresident & CEO52Aker Solutions annual report <strong>2009</strong>
Our performance<strong>Annual</strong> accountsAker Solutions group:Consolidated statement of changes in equity 1.1 – 31.12Amounts in NOK millionShare Treasurycapital sharesOthercapitalpaid inRetainedearnings andother reservesHedgingreserve 2TotalattributableCurrency to parenttranslation companyreserve 2 equity holdersNoncontrollinginterestsTotalequityEquity as of 1 January <strong>2008</strong> 548 (9) 1 534 5 306 315 (595) 7 099 168 7 267Profit for the period 1 438 1 438 75 1 513Other comprehensive incomeCash flow hedges 95 95 95Translation differences 695 695 7 702Total other comprehensive income 95 695 790 7 797Total comprehensive income 1 438 95 695 2 228 82 2 310Transactions with equity holdersDividend - - - (807) (807) (22) (829)Share buy-back - (1) - (69) - - (70) (70)Change in non-controlling interests - - - - - - - (72) (72)Total transactions with equity holders - (1) - (876) - - (877) (94) (971)Equity as of 31 December <strong>2008</strong> 548 (10) 1 534 5 868 410 100 8 450 156 8 606Profit for the period 2 260 2 260 71 2 331Other comprehensive incomeCash flow hedges (262) (262) (262)Translation differences (971) (971) (18) (989)Total other comprehensive income - - - - (262) (971) (1 233) (18) (1 251)Total comprehensive income - - - 2 260 (262) (971) 1 027 53 1 080Business combination (14) 14 - -Transactions with equity holdersDividend - - - (431) - - (431) (20) (451)Share buy-back - (1) - (19) - - (20) (20)Employee share purchase programme 1 - 2 - 44 - - 46 46Change in non-controlling interests - - - (96) - - (96) (42) (138)Total transactions with equity holders - 1 - (502) - - (501) (62) (563)Equity as of 31 December <strong>2009</strong> 548 (9) 1 534 7 612 162 (871) 8 976 147 9 1231) See note 9 Salary, wages and social security costs.2) See note 12 Financial income and financial expenses.Share capitalAker Solutions ASA has one class of shares, ordinary shares, with equal rights for all shares. The holders of ordinary shares are entitled to receive dividends andare entitled to one vote per share at General Meetings. Total outstanding shares are 274 000 000 at par value NOK 2 per share. All issued shares are fully paid.Share buy-backAt the <strong>2007</strong> <strong>Annual</strong> General Meeting authorisation was given to repurchase up to 27.4 million shares, representing 10 percent of the share capital of AkerSolutions ASA. Aker Solutions ASA reduced the shareholdings with 395 919 treasury shares in <strong>2009</strong> and as of 31 December <strong>2009</strong> Aker Solutions ASA holds4 570 911 treasury shares representing 1.67 percent of total outstanding shares.Non-controlling interestsAt 31 December <strong>2009</strong> NOK 112 million (NOK 99 million in <strong>2008</strong>) of the non-controlling interests relates to Aker Solutions Powergas Pvt Ltd in which AkerSolutions owns 64 percent. The change in non-controlling interests in <strong>2009</strong> is primarily due to the acquisition of 49 percent in Step Offshore AS which gives AkerSolutions full control of the company.Dividends <strong>2009</strong> <strong>2008</strong>Paid dividend per share (NOK) 1.60 3.00Total dividend paid (NOK million) 431 807Ordinary dividend per share proposed by the Board of Directors (NOK) 2.60 1.60Aker Solutions annual report <strong>2009</strong> 53
Our performance<strong>Annual</strong> accountsAker Solutions group:Consolidated statement of cash flow 1.1 – 31.12Amounts in NOK million Note <strong>2009</strong> <strong>2008</strong>Cash flow from operating activitiesProfit for the period 2 331 1 513Adjusted for:Income tax expense 13 877 590Net interest cost 411 225(Profit) loss on foreign currency forward contracts 12 (161) 439Depreciation, amortisation and impairment 21, 22 910 615(Profit) loss on disposals and non-cash effects 1 (332) (23)(Profit) loss from associated companies and jointly controlled entities 24 (114) 21Interest paid (308) (295)Interest received 27 132Income taxes paid (1 008) (472)Changes in other net operating assets 1 612 (3 613)Net cash from operating activities 4 245 (868)Cash flow from investing activitiesAcquisition of subsidiaries, net of cash acquired 2 6 (1 117) (1 817)Acquisition of property, plant and equipment 21 (2 201) (1 572)Proceeds from sale of property, plant and equipment 40 34Proceeds from sale of associate 622 -Acquisition of shares in associates and other investments (1 271) (377)Net cash from investing activities (3 927) (3 732)Cash flow from financing activitiesProceeds from borrowings 3, 4 3 341 4 956Repayment of borrowings 4 (3 116) (24)Acquisition of non-controlling interests (78) -Proceeds from issue of share capital from non-controlling interests - 72Repurchase of treasury shares (20) (70)Proceeds from employees share purchase programme 46 -Dividends paid to non-controlling interests (20) (22)Dividends to shareholders in Aker Solutions (431) (807)Net cash from financing activities (278) 4 105Effect of exchange rate changes on cash and bank deposits (682) 799Net increase (decrease) in cash and bank deposits (642) 304Cash and cash equivalents at the beginning of the period 3 828 3 524Cash and cash equivalents at the end of the period 5 3 186 3 828Of which is restricted cash 6 380 9761) Includes gain on acquisitions related to remeasurement of previously held interests and gain or loss on disposals of property, plant and equipment.2) Acquisition of non-controlling interests is included in cash from investing activities in <strong>2008</strong> and cash from financing activities in <strong>2009</strong>. The change in principle is due to the implementation ofIFRS 3 Business Combinations (<strong>2008</strong>) and IAS 27 Consolidation and Separate Financial Statements (<strong>2008</strong>) as of 1 January <strong>2009</strong>.3) Includes NOK 1 000 million of borrowings from Aker, which was used to purchase businesses from Aker.4) Includes NOK 425 million of proceeds from lenders used to repurchase old bonds from the same lenders.5) Additional undrawn committed non-current bank revolving credit facilities amounted to NOK 5.3 billion, and is together with cash and cash equivalents giving a total liquidity buffer of NOK 8.5billion.6) Restricted cash includes inter alia cash in joint ventures where the partners must agree before use of cash in business units which is not owned 100 percent by Aker Solutions.54Aker Solutions annual report <strong>2009</strong>
Our performanceNotes to the accountsAker Solutions group:NotesNote 1: General informationAker Solutions ASA (the company) is a limited liability company incorporated and domiciled at Fornebu in Bærum, Norway. The consolidated financialstatements of Aker Solutions ASA incorporate the financial statements of the company and its subsidiaries (referred to collectively as “the group” andseparately as group companies) and the group’s interest in associates and jointly controlled entities and jointly controlled assets. Aker Solutions is aleading global supplier of engineering services, fabrication, technology products, maintenance, specialised services, and total solutions for the energy andprocess industries.The company is listed on the Oslo Stock Exchange under the ticker AKSO.Note 2: Basis for preparationStatement of complianceThe consolidated financial statements havebeen prepared in accordance with InternationalFinancial <strong>Report</strong>ing Standards (IFRS) asapproved by the European Union, theirinterpretations adopted by the InternationalAccounting Standards Board (IASB) and theadditional requirements of the NorwegianAccounting Act as of 31 December <strong>2009</strong>.The consolidated financial statementswere approved by the Board of Directors andPresident & CEO as shown on the dated andsigned balance sheet. The consolidated financialstatements will be authorised by the <strong>Annual</strong>General Meeting on 8 April <strong>2010</strong>. Until the latterdate the Board of Directors have the authority toamend the financial statements.Functional and presentation currencyThese consolidated financial statements arepresented in NOK, which is Aker Solution ASA’sfunctional currency.Use of estimates and judgementsThe preparation of financial statements inconformity with IFRS requires management tomake judgements, estimates and assumptionsthat affect the application of policies andreported amounts of assets and liabilities,income and expenses. Although managementbelieves these assumptions to be reasonable,given historical experience, actual amounts andresults could differ from these estimates. Theitems involving a higher degree of judgementor complexity, and items where assumptionsand estimates are material to the consolidatedfinancial statements are disclosed in note 4Accounting estimates and judgements.The estimates and underlying assumptionsare reviewed on an ongoing basis. Revisionsto accounting estimates are recognised in theperiod in which the estimate is revised, if therevision affects only that period, or in the periodof the revision and future periods, if the revisionaffects both current and future periods.Changes in accounting policiesAs of 1 January <strong>2009</strong> the group has changed itsaccounting policies in the following areas:■■Accounting for business combinations■■Accounting for acquisitions of noncontrollinginterests■■Accounting for borrowing costs■■Presentation of jointly controlled entities■■Presentation of operating segments■■Presentation of financial statementsAccounting for business combinationsThe group has early adopted IFRS 3 BusinessCombinations (<strong>2008</strong>) and IAS 27 Consolidationand Separate Financial Statements (<strong>2008</strong>) for allbusiness combinations occurring in the financialyear starting 1 January <strong>2009</strong>. The change inaccounting policy is applied prospectivelyand has affected earnings per share positivelyby NOK 1.03, which primarily reflectsremeasurement of previously held interests inthe companies that have been acquired in <strong>2009</strong>,see note 6 Acquisitions of subsidiaries and noncontrollinginterests for further description.Revised IFRS 3 Business Combinationsincorporates the following changes that arerelevant to the group’s financial statements:■■Contingent consideration is measured at fairvalue, with subsequent changes recognisedin the income statement.■■Transaction costs, other than share and debtissue costs, are expensed as incurred.■■■■Any pre-existing interest in the acquiree willbe measured at fair value with the gain orloss recognised in the income statement,Any non-controlling interest is measuredat either fair value, or at its proportionateinterest in the identifiable assets andliabilities of the acquiree, on a transactionby-transactionbasis.Accounting for acquisitions of non-controllinginterestsThe early adoption of IFRS 3 BusinessCombinations (<strong>2008</strong>) and IAS 27 Consolidationand Separate Financial Statements (<strong>2008</strong>) haveeffect for all acquisitions of non-controllinginterests occurring in the financial year starting1 January <strong>2009</strong>.Under the new accounting policy, acquisitionsof non-controlling interest are accounted for astransactions with equity holders in their capacityas equity holders and therefore no goodwill isrecognised as a result of such transactions.Previously, goodwill was recognised arising onthe acquisition of a non-controlling interest ina subsidiary. Goodwill represented the excesscost in the additional investment over thecarrying amount of the interest in the net assetsacquired at the date of exchange.The change in accounting policy was appliedprospectively and had no material impact onearnings per share.Accounting for borrowing costsIn respect of borrowing costs relating toqualifying assets for which the commencementdate for capitalisation is on or after 1 January<strong>2009</strong>, the group capitalises borrowingcosts directly attributable to the acquisition,construction or production of a qualifying assetas part of the cost of that asset. Previously thegroup immediately recognised all borrowingcosts as an expense, except when the effectswere very significant and there were separatefinancing arrangements in place.The change in accounting policy results fromthe adoption of IAS 23 Borrowing Costs (<strong>2007</strong>)in accordance with the transitional provisions ofthe standard and the comparative figures havenot been restated. The change in accounting policyhad no material impact on earnings per share.The group has capitalised borrowing costswith respect to property, plant and equipmentunder construction, see note 21 Property, plantand equipment.Investments in jointly controlled entitiesAs of 1 January <strong>2009</strong>, jointly controlled entitiesare accounted for using the equity method.Previously these investments where accountedfor by including the group’s proportionate shareof the entities’ assets, liabilities, revenues andexpenses with items of a similar nature on aline by line basis. The composition of the jointlycontrolled entities has changed substantiallyduring <strong>2009</strong>, resulting in a revised assessmentof the accounting method. This assessment,coupled with expected forthcoming changesin accounting standards applicable to jointlycontrolled entities, has resulted in the decisionto change the accounting method to the equitymethod.The change in accounting policy had noimpact on earnings per share and no materialimpact on total assets and liabilities in thebalance sheet. Comparative information has notbeen restated since the effects are not materialto the group’s financial statements.Aker Solutions annual report <strong>2009</strong> 55
Our performanceNotes to the accountsPresentation of operating segmentsAs of 1 January <strong>2009</strong> the group presentsoperating segments based on the informationthat internally is provided to the President& CEO, who is the group’s chief operatingdecision maker. The change in accounting policyis due to the adoption of IFRS 8 OperatingSegments. Determination of the group’soperating segments has not been impacted bythe adoption of IFRS 8 Operating Segments.Comparative segment information has beenre-presented in conformity with the transitionalrequirements of the standard. Since the changein accounting policy only impacts presentationand disclosure, there is no impact on earningsper share.Presentation of financial statementsThe group applies revised IAS 1 Presentationof Financial Statements (<strong>2007</strong>), which becameeffective on 1 January <strong>2009</strong>. As a result, thegroup presents in the consolidated statement ofchanges in equity all owner changes in equity,whereas all non-owner changes in equity arepresented in the consolidated statement ofcomprehensive income.Comparative information has been representedso that it too is in conformity withthe revised standard. Since the change inaccounting policy only affects presentationaspects, there is no impact on earnings pershare.Note 3: Accounting principlesSummary of significant accounting policiesThe principal accounting policies applied inthe preparation of these consolidated financialstatements are set out below. These policieshave been consistently applied to all the yearspresented, unless otherwise stated.ConsolidationSubsidiariesSubsidiaries are entities controlled by thecompany. Control exists when the companyhas the power, directly or indirectly, to governthe financial and operating policies of an entityso as to obtain benefits from its activities.When assessing control, voting rights thatare exercisable or convertible are takeninto account. The financial statements ofsubsidiaries are included in the consolidatedfinancial statements from the date that controlcommences until the date that control ceases.Investments in associates and jointly controlledentitiesAssociates are those entities in which the grouphas significant influence, but not control, overthe financial and operating policies. Significantinfluence is presumed to exist when the groupholds between 20 and 50 percent of the votingpower of another entity. Joint ventures are thoseentities over whose activities the group has jointcontrol, established by contractual agreementand requiring unanimous consent of theventurers for strategic financial and operatingdecisions.Investments in associates and jointlycontrolled entities are accounted for using theequity method and are recognised initially atcost. The group’s investment includes goodwillidentified on acquisition, net of any accumulatedimpairment losses. As of 1 January <strong>2009</strong>, theaccounting policy for investments in jointlycontrolled entities changed from proportionateconsolidation method to the equity method asoutlined in note 2 Basis for preparation.The consolidated financial statements includethe group’s share of the income and expensesand equity movements of equity-accountedinvestees from the date that significant influenceor joint control commences until the date thatsignificant influence or joint control ceases.When the group’s share of losses exceeds itsinterest in an equity-accounted investee, thecarrying amount of that interest, including anylong-term investments, is reduced to nil, andfurther losses are not recognised except to theextent that the group has funding commitmentsor has made payments on behalf of the investee.Jointly controlled operationsA jointly controlled operation is a joint venturecarried by each venturer using its own assets inpursuit of the joint operation. The consolidatedfinancial statements include the assets that thegroup controls and the liabilities that it incurs inthe course of pursuing the joint operations andthe expenses that the group incurs and its shareof the income earned from the joint operation.Transaction eliminated on consolidationIntra-group balances and any unrealised gainsand losses or income and expenses arisingfrom intra-group transactions are eliminated inpreparing the consolidated financial statements.Unrealised gains arising from transactions withassociates and jointly controlled entities areeliminated to the extent of the group’s interest inthe entity. Unrealised losses are eliminated in thesame way as unrealised gains, but only to theextent that there is no evidence of impairment.The accounting policies of some subsidiaries,associates and joint ventures do not conformto the accounting policies of the group. Whereappropriate, adjustments are made in order topresent the consolidated financial statements ona consistent basis.Non-current assets held for sale anddiscontinued operationsA discontinued operation is a component ofthe group’s business that represents a separatemajor line of business or geographical area ofoperations that has been disposed of, is held forsale or is a subsidiary acquired exclusively witha view to resale.Classification as a discontinued operationoccurs upon disposal or when the operationmeets the criteria to be classified as held forsale, if earlier. A disposal group that is to beabandoned may also qualify.Upon classification of a business as adiscontinued operation, the historical incomestatements are restated. A single line on theincome statement reports the results of thediscontinued operation. On the balance sheetno reclassifications are made for years priorto the year a business is first classified as adiscontinued operation.Segment reportingAn operating segment is a component ofthe group that engages in business activitiesfrom which it may earn revenues and incurexpenses, including revenue and expensesrelated to transactions with any of the group’sother components. All operating segments’operating results are reviewed regularly by thegroup’s President & CEO to make decisionsabout resources to be allocated to the segmentand assess its performance, for which discretefinancial information is available.Revenue recognitionConstruction contractsEngineering and construction contract revenuesare recognised using the percentage ofcompletion method, based primarily on contractcosts incurred to date compared to estimatedtotal contract costs. When the final outcome ofa contract cannot be reliably estimated, contractrevenue is recognised only to the extent of costsincurred that are expected to be recoverable.Losses on contracts are fully recognised whenidentified.Contract revenues include variation ordersand incentive bonuses when it is probable thatthey will result in revenue that can be measuredreliably. Disputed amounts are recognisedwhen their realisation is reasonably certainand measurable. Contract costs include coststhat relate directly to the specific contract andallocated costs that are attributable to generalcontract activity. Costs that cannot be attributedto contract activity are expensed. Bidding costsare capitalised when it is probable that thecompany will be the preferred bidder. All otherbidding costs are expensed as incurred.Goods sold and services renderedRevenue from the sale of goods is recognisedin the income statement when the significantrisks and rewards of ownership have beentransferred to the buyer. Revenue from servicesrendered is recognised in the income statementin proportion to the stage of completion ofthe transaction at the balance sheet date.The stage of completion is normally assessedbased on the proportion costs incurred for workperformed to date compared to the estimatedtotal contract costs. No revenue is recognisedif there is significant uncertainty regardingrecovery of consideration due.Other incomeGains and losses resulting from acquisitionsand disposal of businesses which do notrepresent discontinued operations are includedin other income. Such gains may result fromthe remeasurement of previously held interestin the acquired entity. Changes in the fair valueof the deferred consideration from acquisitionof a subsidiary or non-controlling interestfor transactions after 1 January <strong>2009</strong> will berecognised in other income as gains or losses.Such changes will continue to be adjustedagainst goodwill for transactions consummatedprior to 1 January <strong>2009</strong>.56Aker Solutions annual report <strong>2009</strong>
Our performanceNotes to the accountsExpensesOperating lease paymentsPayments made under operating leases arerecognised in the income statement on astraight-line basis over the term of the leasewhen there are variations in the contractuallease payments due. Lease incentives receivedare recognised in the income statement as anintegral part of the total lease expense.Finance lease paymentsMinimum lease payments are apportionedbetween the finance charge and the reductionof the outstanding liability. The finance charge isallocated to each period during the lease termso as to produce a constant periodic rate ofinterest on the remaining balance of the liability.Share purchase programme for employeesAker Solutions employees participate in a sharepurchase programme whereby an employeecan buy Aker Solutions shares at a discount. Anemployee who is still employed by the groupand has retained the shares in September 2011will receive one bonus share for each two sharesbought under the programme. The cost of thecontribution towards the purchase of the sharesis expensed as salary costs immediately. Thevalue of the bonus shares is expensed overthe vesting period based on the value of eachmonthly share purchase.Financial income and expenseFinancial income and expense comprisesinterest payable on borrowings calculatedusing the effective interest rate method, interestreceivable on funds invested, dividend income,foreign exchange gains and losses, and gainsand losses on hedging instruments recognisedin the income statement (see Hedgingactivities). Interest income is recognised inthe income statement as it accrues, using theeffective interest method. The interest expensecomponent of finance lease payments isrecognised in the income statement using theeffective interest rate method.Changes in the fair value of the financialassets at fair value through profit or losscategory are presented in the income statementwithin net financial items. Dividend income fromfinancial assets at fair value through profit orloss is recognised in the income statement aspart of net financial items when the group’s rightto receive payments is established.Changes in the fair value of monetarysecurities denominated in a foreign currencyand classified as available for sale are analysedbetween translation differences resulting fromchanges in amortised cost of the security andother changes in the carrying amount of thesecurity. The translation differences on monetarysecurities are recognised in the incomestatement; translation differences in nonmonetarysecurities are recognised in equity.Changes in the fair value of non-monetarysecurities classified as available for sale arerecognised in equity.When securities classified as available for saleare sold or impaired, the accumulated fair valueadjustments recognised in equity are included inthe income statement as gains and losses frominvestment securities.Interest on available-for-sale securitiescalculated using the effective interest methodis recognised in the income statement as partof net financial items when the group’s right toreceive payments is established.Trade and other receivablesTrade and other receivables are carried at theoriginal invoice amount, less an allowance madefor doubtful receivables. Provision is made whenthere is objective evidence that the group will beunable to recover balances in full. Balances arewritten off when the probability of recovery isassessed as being remote.Construction work in progressConstruction work in progress representsthe value of construction work performedless payments by customers. The value ofconstruction work performed is measuredat revenue recognised to date. Payments bycustomers are deducted from the value of thesame contract or, to the extent they exceed thisvalue, disclosed as advances from customers(see Revenue recognition).InventoriesInventories are stated at the lower of cost ornet realisable value. Net realisable value is theestimated selling price in the ordinary course ofbusiness, less the estimated costs of completionand selling expenses.The cost of inventories is based on the firstinfirst-out principle and includes expendituresincurred in acquiring the inventories andbringing them to their existing location andcondition. In the case of manufacturedinventories and work in progress, cost includesan appropriate share of overheads based onnormal operating capacity.Property, plant and equipmentOwned assetsProperty, plant and equipment are statedat cost less accumulated depreciation (seeDepreciations) and impairment losses (seeImpairment). The cost of self-constructed assetsincludes the cost of materials, direct labour, thecost for interest on qualifying assets effectivefrom 1 January <strong>2009</strong>, and, where relevant, theestimated costs of dismantling and removingthe items and restoring the site on which theyare located, and an appropriate proportion ofproduction overheads.Where components of property, plant andequipment have different useful lives, they areaccounted for as separate components.Leased assetsLeases where the group assumes substantiallyall the risks and rewards of ownership areclassified as finance leases. Assets acquired byway of finance leases are stated at an amountequal to the lower of the asset’s fair value or thepresent value of the minimum lease paymentsat inception of the lease, less accumulateddepreciation and impairment losses.Subsequent costsThe group capitalises the cost of a replacementpart or a component of property, plant andequipment when that cost is incurred if it isprobable that the future economic benefitsembodied with the item will flow to the groupand the cost of the item can be measuredreliably. All other costs are expensed asincurred.DepreciationDepreciation is normally recognised on astraight-line basis over the estimated usefullives of property, plant and equipment. Theproduction unit method is used for depreciationin limited circumstances when appropriate.Intangible assetsGoodwillAll business combinations are accountedfor using the acquisition method. Goodwillrepresents the excess of the cost of anacquisition over the fair value of the group’sshare of the net identifiable assets of acquiredbusinesses or interest in associates or jointventures that are businesses at the dateof acquisition. Goodwill on acquisitions ofsubsidiaries is included in intangible assets.Goodwill on acquisitions of associates andjoint ventures is included in the investmentbalance and is tested for impairment as partof the overall balance. Goodwill is carried atcost less accumulated impairment losses (seeImpairment). Gains and losses on the disposalof an entity or an interest in an entity includethe carrying amount of goodwill relating tothe ownership interest sold. In the unusualcircumstances where the fair value of netassets acquired exceeds consideration paid,the resulting gain arising on an acquisition isrecognised directly in the income statement.Goodwill is assumed to have an indefiniteuseful life because there is no foreseeable limitto the period over which the asset is expectedto generate net cash inflows for the entity. Theacquisition of a company is based upon itsstrategic fit and anticipated profitability of thatcompany over a long time period.Goodwill is allocated to cash-generatingunits for the purpose of impairment testing. Theallocation is made to those cash-generatingunits or groups of cash-generating units thatare expected to benefit from the businesscombination in which goodwill arose.Research and developmentExpenditures on research activities undertakenwith the prospect of obtaining new scientificor technical knowledge and understandingis recognised in the income statement as anexpense as incurred.Expenditures on development activities,whereby research findings are applied to aplan or design for the production of new orsubstantially improved products and processes,is capitalised if the product or process istechnically and commercially feasible aswell as being a separable asset. Capitalisedcosts include the cost of materials, externalcontractors, direct labour and capitalisedinterest on qualifying assets arising after 1January <strong>2009</strong>. Other development expendituresare recognised in the income statementas an expense as incurred. Capitaliseddevelopment expenditures are stated at costless accumulated amortisation and impairmentlosses.Other intangible assetsOther intangible assets that are acquired bythe group are stated at cost less accumulatedamortisation and impairment losses.Subsequent expendituresSubsequent expenditures on capitalisedintangible assets are capitalised only whenthey increase the future economic benefitsembodied in the specific asset to which theyrelate. All other expenditures are expensed asincurred.Aker Solutions annual report <strong>2009</strong> 57
Our performanceNotes to the accountsAmortisationAmortisation is charged to the income statementon a straight-line basis over the estimated usefullives of intangible assets unless such lives areindefinite. Intangible assets are amortised fromthe date they are available for use.ImpairmentThe carrying amounts of the group’s assets,other than inventories (see Inventories) anddeferred tax assets (see Income tax), arereviewed at the end of each reporting periodto determine whether there is any indication ofimpairment. If any such indication exists, theasset’s recoverable amount is estimated (seeCalculation of recoverable amount).For goodwill, assets that have an indefiniteuseful life and intangible assets that are not yetavailable for use, the recoverable amount isestimated annually.An impairment loss is recognised wheneverthe carrying amount of an asset or its cashgeneratingunit exceeds its recoverable amount.Impairment losses are recognised in the incomestatement.Impairment losses recognised in respectof cash-generating units are allocated first toreduce the carrying amount of any goodwillallocated to cash-generating units (group ofunits) and then, to reduce the carrying amountof the other assets in the unit (group of units) ona pro rata basis.When a decline in the fair value of anavailable-for-sale financial asset has beenrecognised directly in equity and there isobjective evidence that the asset is impaired,the cumulative loss that had been recogniseddirectly in equity is recognised in profit or losseven though the financial asset has not beenderecognised. The amount of the cumulativeloss recognised in profit or loss is the differencebetween the acquisition cost and current fairvalue, less any impairment loss on that financialasset previously recognised in profit or loss.Calculation of recoverable amountThe recoverable amount of the group’sinvestments in held-to-maturity securitiesand receivables carried at amortised cost iscalculated as the present value of estimatedfuture cash flows, discounted at the originaleffective interest rate (i.e. the effective interestrate computed at initial recognition of thesefinancial assets). Receivables with a shortduration are not discounted.The recoverable amount of other assets isthe greater of their net selling price and valuein use. In assessing value in use, the estimatedfuture cash flows are discounted to their presentvalue using a pre-tax discount rate that reflectscurrent market assessments of the time valueof money and the risks specific to the asset.For an asset that does not generate largelyindependent cash inflows, the recoverableamount is determined for the cash-generatingunit to which the asset belongs.Reversals of impairmentAn impairment loss on a held-to-maturity securityor receivable carried at amortised cost is reversedif the subsequent increase in recoverable amountcan be related objectively to an event occurringafter the impairment loss was recognised. Animpairment loss on goodwill is not reversed. Animpairment loss on other assets is reversed ifthere has been a change in the estimates used todetermine the recoverable amount.An impairment loss is reversed only to theextent that the asset’s carrying amount doesnot exceed the carrying amount that wouldhave been determined, net of depreciation oramortisation, if no impairment loss had beenrecognised.ProvisionsA provision is recognised in the balance sheetwhen the group has a present obligation as aresult of a past event and it is probable that thegroup will be required to settle the obligation. Ifthe effect is material, provisions are determinedby discounting the expected future cash flows ata market based pre-tax rate that reflects currentmarket assessments of the time value of moneyand, where appropriate, the liability-specific risks.WarrantiesA provision for warranties is recognised whenthe underlying products or services are sold.The provision is based on historical warrantydata and a weighting of all possible outcomesagainst their associated probabilities.RestructuringA provision for restructuring is recognised whenthe group has approved a detailed and formalrestructuring plan, and the restructuring has eithercommenced or has been announced publicly.Future operating costs are not provided for.Site restorationIn accordance with the group’s legalrequirements, a provision for site restorationin respect of contaminated land is recognisedwhen the land is contaminated.Onerous contractsA provision for onerous contracts is recognisedwhen the expected benefits to be derived bythe group from a contract are lower than theunavoidable cost of meeting the obligationsunder the contract.Employee benefitsDefined contribution plansObligations for contributions to definedcontribution pension plans are recognisedas an expense in the income statement asincurred.Defined benefit plansThe group’s net obligation in respect of definedbenefit pension plans is calculated separatelyfor each plan by estimating the amount offuture benefit that employees have earned inreturn for their service in the current and priorperiods; that benefit is discounted to determineits present value, and the fair value of any planassets is deducted. The discount rate is theyield at the balance sheet date on governmentbonds or high-quality corporate bonds withmaturities consistent with the terms of theobligations. The calculation is performed by aqualified actuary using the projected unit creditmethod.When the benefits of a plan to employeesare increased, the portion of the increasedbenefit relating to past service by employeesis recognised as an expense in the incomestatement on a straight-line basis over theaverage period until the benefits becomevested. To the extent that the benefits vestimmediately, an expense is recognisedimmediately in the income statement.To the extent that any subsequent cumulativeunrecognised actuarial gain or loss exceeds 10percent of the greater of the present value ofthe defined benefit obligation and the fair valueof plan assets, that portion is recognised in theincome statement over the expected averageremaining working lives of the employeesparticipating in the plan. Otherwise, the actuarialgain or loss is not recognised.When the actual calculation results in abenefit to the group, the recognised asset islimited to the net total of any unrecognisedactuarial losses and past service costs and thepresent value of any future refunds from the planor reductions in future contributions to the plan.Long-term service benefitsThe group’s net obligation for long-term servicebenefits, other than pension plans, is theamount of future benefit that employees haveearned in return for their service in the currentand prior periods. The obligation is calculatedusing the projected unit credit method and isdiscounted to its present value and the fair valueof any related assets is deducted. The discountrate is the yield at the balance sheet date ongovernment bonds or high-quality corporatebonds with maturities consistent with the termsof the obligations.Share-based payment transactionsFor cash-settled share-based payments, aliability equal to the portion of the goods orservices received is recognised at the currentfair value determined at each balance sheetdate.Cash and cash equivalentsCash and cash equivalents include cash onhand, demand deposits held at banks and othershort-term highly liquid investments with originalmaturity of three months or less. Restricted cashis mainly cash tied up in projects through jointventures with external parties. The amountsfluctuate with the projects’ life cycle and areusually released when the project is delivered orclose to delivery.Derivative financial instrumentsThe group uses derivative financial instrumentsto hedge its exposure to foreign exchangeand interest rate risks arising from operational,financial and investment activities. Thegroup also has embedded foreign exchangederivatives which have been separated fromtheir ordinary commercial contracts. Derivativesthat do not qualify for hedge accounting areaccounted for as trading instruments.An embedded derivative is any contractembedded in a host contract which meetsthe definition of a derivate. In Aker Solutionsgroup this normally occurs when a commercialcontract is agreed to be settled in a foreigncurrency. Under certain conditions theembedded derivative must be separated fromits host contract and the derivative is then to betreated as any other derivative in the FinancialStatement. The most usual condition in AkerSolutions group is when the settlement isdenominated in a currency different from any ofthe contract parties’ own functional currency.Typically this can happen with deliveries tocountries that does not have an internationalconvertible currency, but also in other countrieswhere some clients may wish to use foreigncurrency settlements as part of their ownhedging strategy.Derivatives are initially recognised at fair value58Aker Solutions annual report <strong>2009</strong>
Our performanceNotes to the accountson the date a derivative contract is enteredinto and are subsequently measured at theirfair value. Fair values are assessed based onquoted exchange rates and swap interest ratesat the balance sheet date. The gain or losson measurement to fair value is recognisedimmediately in the income statement. Wherederivatives qualify for hedge accounting,recognition of any resultant gain or loss dependson the nature of the item being hedged (seeHedging activities).The fair value of interest rate swaps is theestimated amount that the group would receiveor pay to terminate or eliminate the swap at thebalance sheet date, taking into account currentinterest rates and the current creditworthinessof the swap counterparties. The fair value offorward exchange contracts is their quotedmarket price at the balance sheet date.Embedded derivatives represent a currencyrisk which is being hedged in the same way asany other currency risk in the group. However,since the separated embedded derivative istaken to the income statement immediately, itwill match the hedging instrument throughoutthe hedging period and hedge accounting istherefore not necessary. Both the embeddedderivative and the hedging instrument are takento finance income and expense in the financialstatements.The fair values of various derivativeinstruments used for hedging purposes aredisclosed in note 20 Derivative financialinstruments. Movements on the hedging reservein shareholders’ equity are shown in note 12Finance income and finance expense. The fullfair value of a hedging derivative is classifiedas a non-current asset or liability when theremaining hedged item is classified as noncurrentasset or liability. With the exception ofitems related to trade receivables and work inprogress, this is when the remaining maturity ismore than 12 months; it is classified as a currentasset or liability when the remaining maturityof the hedged item is less than 12 months orwhen it is related to trade receivables and workin progress. Trading derivatives are classified ascurrent asset or liability.Interest-bearing borrowingsInterest-bearing borrowings are recognisedinitially at fair value less attributable transactioncosts. Subsequent to initial recognition,interest-bearing borrowings are stated atamortised cost with any difference betweencost and redemption value being recognisedin the income statement over the period of theborrowings on an effective interest basis.Income taxIncome tax on the income statement for the yearcomprises current and deferred tax. Income taxis recognised in the income statement exceptto the extent that it relates to items recogniseddirectly in equity, in which case it is recognisedin equity.Current tax is the expected tax payable onthe taxable income for the year, using tax ratesenacted or substantially enacted at the balancesheet date, and any adjustment to tax payablefor previous years.Deferred tax is provided for using the balancesheet liability method, taking into accounttemporary differences between the carryingamounts of assets and liabilities for financialreporting purposes and the values used fortaxation purposes. The following temporarydifferences are not provided for:■■Goodwill not deductible for tax purposes.■■The initial recognition of assets or liabilitiesthat affect neither accounting nor taxableprofit.■■Differences relating to investments insubsidiaries to the extent that they will notreverse in the foreseeable future.The amount of deferred tax provided is basedon the expected manner of realisation orsettlement of the carrying amount of assetsand liabilities, using tax rates enacted orsubstantively enacted at the balance sheet date.A deferred tax asset is recognised only tothe extent that it is probable that future taxableprofits will be available against which the assetcan be utilised. Deferred tax assets are reducedto the extent that it is no longer probable thatthe related tax benefit will be realised.Additional income taxes that arise from thedistribution of dividends are recognised at thesame time as the liability to pay the relateddividend.Share capitalOrdinary sharesOrdinary shares are classified as equity.Incremental costs directly attributable to theissue of new shares or options are shown inequity as a deduction, net of tax, from theproceeds.Repurchase of share capitalWhen share capital recognised as equity isrepurchased, the amount of the considerationpaid, including directly attributable costs, isrecognised as a change in equity. Repurchaseof share capital is recognised as a reduction inequity and is classified as treasury shares.Financial instrumentsFinancial instruments in the Aker Solutionsgroup consists of cash and cash equivalents,investments in other companies, derivativefinancial instruments, non-current interestbearingreceivables, trade and other receivables/payables and non-current borrowings.The group classifies its financial assets in thefollowing categories: at fair value through profitor loss, loans and receivables, and available forsale. The classification depends on the purposefor which the financial assets were acquired.Management determines the classification of itsfinancial assets at initial recognition.Financial assets at fair value through profit or lossFinancial assets at fair value through profitand loss are financial assets held for trading.A financial asset is classified in this category ifacquired principally for the purpose of sellingin the short term. Derivatives are classified asheld for trading unless they are designated ashedges. Assets in this category are classified asderivative financial instruments.Loans and receivablesLoans and receivables are non-derivativefinancial assets with fixed or determinablepayments that are not quoted in an activemarket. They are included in current assets astrade and other receivables and interest-bearingreceivables, except for maturities greater than12 months after the balance sheet date. Theseare included in non-current assets as loans andreceivables and interest-bearing receivables inthe balance sheet.Available-for-sale financial assetsAvailable-for-sale financial assets are nonderivativesthat are either designated inthis category or not classified in any othercategories. They are included in non-currentassets as investments in other companies,unless management intends to dispose of theinvestment within 12 months of the balancesheet date. They will then be included in currentassets as other investments.Regular purchases and sales of financialassets are recognised on the trade date – thedate on which the group commits to purchaseor sell the asset. Investments are initiallyrecognised at fair value plus transaction costsfor all financial assets not carried at fair valuethrough profit or loss. Financial assets carriedat fair value through profit or loss are initiallyrecognised at fair value, and transactioncosts are expensed in the income statement.Available-for-sale financial assets and financialassets at fair value through profit and loss aresubsequently carried at fair value. Loans andreceivables are carried at amortised cost usingthe effective interest method.Financial assets are derecognised whenthe rights to receive cash flows from theinvestments have expired or have beentransferred and the group has transferredsubstantially all risks and rewards of ownership.The fair values of quoted investments arebased on current bid prices. If the market fora financial asset is not active (and in the caseof unlisted securities), the group establishesfair value by using valuation techniques.These include the use of recent arm’s lengthtransactions, reference to other instruments thatare substantially the same, discounted cashflow analysis and option pricing models, makingmaximum use of market inputs and relyingas little as possible on entity-specific inputs.Impairment of financial instruments is describedunder the impairment section above.Foreign currencyForeign currency transactions and balancesTransactions in foreign currencies aretranslated at the exchange rate at the dateof the transaction. Monetary assets andliabilities denominated in foreign currencies atthe balance sheet date are translated to thefunctional currency at the exchange rate onthat date. Foreign exchange differences arisingon translation are recognised in the incomestatement. Non-monetary assets and liabilitiesmeasured in terms of historical cost in a foreigncurrency are translated using the exchange rateon the date of the transaction. Non-monetaryassets and liabilities denominated in foreigncurrencies that are stated at fair value aretranslated to the functional currency at theexchange rates on the date the fair value wasdetermined.Net investment in foreign operationsItems included in the financial statementsof each of the group’s entities are measuredusing the currency of the primary economicenvironment in which the entity operates. Theresults and financial position of all the groupentities (none of which has the currency ofa hyperinflationary economy) that have afunctional currency different from the group’spresentation currency are translated into thepresentation currency as follows:■■Assets and liabilities, including goodwill andfair value adjustments, for each balanceAker Solutions annual report <strong>2009</strong> 59
Our performanceNotes to the accounts■■sheet presented are translated at the closingrate on the date of that balance sheet.Income and expenses for each incomestatement are translated at averageexchange rates for the year, calculated onthe basis of 12 monthly rates.Exchange differences arising from thetranslation of the net investment in foreignoperations, and of related hedges, are includedin comprehensive income as a translationreserve. These translation differences arereclassified to the income statement upondisposal of the related operations.Hedging activitiesDerivates are either:a) Hedges of the fair value of assets or liabilities(fair value hedge)b) Hedges of a particular risk associated witha recognised liability or a highly probableforecast transaction (cash flow hedge)c) Hedges of a net investment in a foreignoperation (net investment hedge)Fair value hedgesThe change in fair value of the hedginginstrument is recognised in the consolidatedincome statement. The change in fair value ofthe hedged item attributable to the risk hedgedis recorded as part of the carrying value ofthe hedged item. When an unrecognised firmcommitment is designated as a hedged item,the subsequent cumulative change in fair valueof the firm commitment attributable to thehedged risk is recognised as an asset or liabilitywith corresponding gain or loss recognised inthe consolidated income statement.Cash flow hedgesThe effective portion of changes in the fair valueof derivatives that are designated and qualifyingas cash flow hedges is recognised in equity. Thegain or loss relating to the ineffective portion ofderivative hedging instruments is recognisedimmediately in the income statement within netfinancial items.Amounts accumulated in equity arereclassified to the income statement in theperiods when the hedged item is recognisedin the income statement. However, when theforecast transaction that is hedged results in therecognition of a non-financial asset or a nonfinancialliability, the gains and losses previouslydeferred in equity are transferred from equityand included in the initial measurement of thecost of the asset or liability.Hedge accounting is discontinued whenthe group revokes the hedging relationship,or when the hedging instrument expires or issold, terminated, or exercised, or no longerqualifies for hedge accounting. Any cumulativegain or loss deferred in equity at that timeremains in equity and is recognised when theforecast transaction is ultimately recognisedin the income statement. When a forecasttransaction is no longer expected to occur, thecumulative gain or loss that was deferred inequity is recognised immediately in the incomestatement.Net investment hedgeHedges of net investments in foreign operationsare accounted for similarly to cash flow hedges.Any gain or loss on the hedging instrumentrelating to the effective portion of the hedge isrecognised in equity. The ineffective portion isrecognised immediately in the income statementwithin net financial items.Gains and losses accumulated in equity areincluded in the income statement when theforeign operation is partially disposed of or sold.New standards and interpretations not yetadoptedOther than those adopted early, see note2 Basis for preparation, a number of newstandards and interpretations are not yeteffective for the year ended 31 December <strong>2009</strong>,and have not been applied in preparing theseconsolidated financial statements. None ofthese are expected to have significant effect onthe consolidated financial statements.Revised IAS 24 Related Party Disclosure isapplicable effective 1 January 2011 if adoptedby the EU. The impact for the group is currentlyunder evaluation, but is not expected to havea have a significant effect on the consolidatedfinancial statements.60Aker Solutions annual report <strong>2009</strong>
Our performanceNotes to the accountsNote 4: Accounting estimates and judgementsEstimates and judgements are continuallyreviewed and are based on historicalexperiences and expectations of future events.The resulting accounting estimates will, bydefinition, seldom accurately match actualresults, but are based on the best estimate atthe time. Estimates and assumptions that havea significant risk of causing material adjustmentsto the carrying amounts of assets and liabilitieswithin the next financial year are discussedbelow.Revenue recognitionThe percentage-of-completion method isused to account for construction contracts.This method requires estimates of the finalrevenue and costs of the contract, as well asmeasurement of progress achieved to date as aproportion of the total work to be performed.The main uncertainty of contract revenue isrelated to recoverable amounts from variationorders, claims and incentive payments whichare recognised when, in the group’s judgement,it is probable that they will result in revenue andare measurable. This assessment is adjustedupon management’s evaluation of liquidateddamages to be imposed by customers typicallyrelating to contractual delivery terms. In manyprojects there are frequent changes in scope ofwork resulting in a number of variation orders.Normally the contracts with customers includeprocedures for presentation of and agreementof variation orders. At any point in time, therewill be unapproved variation orders and claimsincluded in the project revenue. Even thoughmanagement has extensive experience inassessing the outcome of such negotiations,uncertainties exist.Cost to complete depends on productivityfactors and the cost of inputs. Weatherconditions, the subcontractors and otherswith an impact on schedules, commodityprices and currency rates can all affectcost estimates, claims and variation orderssignificantly. Experience, systematic use of theproject execution model and focus on corecompetencies reduces but does not eliminatethis risk.Progress measurement based on costs hasan inherent risk related to the cost estimateas described above. In situations where costis not seen to properly reflect actual progress,alternative measures such as hours or planprogress are used to achieve more preciserevenue recognition. The estimation uncertaintyduring the early stages of a contract is mitigatedby a policy of normally not recognising revenuein excess of costs on large projects before thecontract reaches 20 percent completion.WarrantiesAt the end of each contract, a provision ismade for expected warranty expenditures.The warranty period is normally two years.The provision is often set at one percent ofthe contract value, but can also be a higher orlower amount following a specific evaluationof the actual circumstances for each contract.Both the general one percent provision and theevaluation of project specific circumstancesare based on experience from earlier projects.Factors that could affect the estimated claiminformation include the group’s quality initiativesand project execution model. Reference is madeto note 19 Provisions, for further informationabout provisions.Property, plant and equipment and intangibleassetsAt every balance sheet date, the groupconsiders whether there are indications ofimpairment on the book values of long-termassets. If such indications exist, a valuation isperformed to assess whether or not the assetshould be written down for impairment, and if sothe amount of the impairment. Such valuationswill often have to be based on estimatesof future results for a number of cash flowgenerating units. References are made to note21 Property, plant and equipment and note 22Intangible assets.GoodwillIn accordance with the stated accounting policy,the group tests annually whether goodwill hassuffered any impairment, or more frequentlyif impairment indicators are identified. Therecoverable amounts of cash-generating unitshave been determined based on value-in-usecalculations. These calculations require the useof estimates and are consistent with the marketvaluation of the group. Further details aboutgoodwill and impairment reviews are included innote 22 Intangible assets.Income taxesThe group is subject to income taxes innumerous jurisdictions. Significant judgement isrequired to determine the worldwide provisionfor income taxes. There are many transactionsand calculations for which the ultimate taxdetermination is uncertain during the ordinarycourse of business. Provisions for anticipatedtax audit issues are based on estimates ofeventual additional taxes. Tax assets arisefollowing tax losses that can be broughtforward to reduce the income tax on a futureyear’s taxable profits. The recognition of sucha tax asset depends on there being sufficientevidence of the future taxable profit which isnecessary for the brought-forward loss to beused. Such judgements are reasonably easy incountries with significant group activities, butmay be more difficult in other tax jurisdictions.Where the final tax outcome of these mattersis different from the amounts that were initiallyrecorded, such differences will impact theincome tax and deferred tax provisions in theperiod in which such determination is made.Reference is made to note 13 Tax for furtherinformation about income taxes.Pension benefitsThe present value of the pension obligationsdepends on a number of factors determinedon the basis of actuarial assumptions. Theseassumptions include financial factors suchas the discount rate, expected salary growth,inflation and return on assets as well asdemographical factors concerning mortality,employee turnover, disability and earlyretirement. Assumptions about all these factorsare based on the situation at the time theassessment is made. However, it is reasonablycertain that such factors will change over thevery long periods for which pension calculationsare made. Any changes in these assumptionswill affect the calculated pension obligations.The effect on the accounts of such changes is,however, spread over relatively long time periodsby the use of the corridor approach, wherechanges are amortised over many years. Furtherinformation about the pension obligations andthe assumptions used are included in note 29Employee benefits – pension.Aker Solutions annual report <strong>2009</strong> 61
Our performanceNotes to the accountsNote 5: Financial risk management and exposuresFinancial risksThe group is exposed to a variety of financial risks: currency risk, interest rate risk, price risk, credit risk, liquidity risk and capital risk. The market risks affectthe group’s income or the value of financial instruments held. The objective of financial risk management is to manage and control financial risk exposuresand thereby increase the predictability and minimise potential adverse effects on the group’s financial performance. The Aker Solutions group uses derivativefinancial instruments to hedge certain risk exposures and seeks to apply hedge accounting in order to reduce volatility in the income statement.Risk management is present in every project and is the responsibility of the project managers in cooperation with the central treasury department (CorporateTreasury) to identify, evaluate and hedge financial risks under policies approved by the Board of Directors. The group has well-established principles for overallrisk management, as well as policies for the use of derivatives and financial investments. There have been no changes in these policies during the year.Currency riskThe group operates internationally and is exposed to currency risk on commercial transactions, recognised assets and liabilities and net investmentsin foreign operations. Commercial transactions and recognised assets and liabilities are subject to currency risk when payments are denominated in acurrency other than the respective functional currency of the group company. The group’s exposure to currency risk is primarily to USD, EUR and GBP butis also exposed to several other currencies on a smaller scale.The Aker Solutions policy requires group companies to hedge their entire currency risk exposure in any project using forward contracts and currencyoptions. The group’s Corporate Treasury department manages internal exposures by entering into forward contracts or currency options with the financialmarket place. The Aker Solutions group has a large number of contracts involving foreign currency exposures and the currency risk policy has been wellestablishedfor many years. See note 20 Derivative financial instruments.Currency exposure from foreign currency investments are not hedged. Dividend or return on capital invested is hedged when decisions are made to makepayments.For segment reporting purposes, each business unit designates all currency hedge contracts with Corporate Treasury as fair value hedges or cash flowhedges, as appropriate. External foreign exchange contracts are designated at the group level as hedges of currency risk on a gross basis, and more than80 percent of these hedges are done back-to-back and either they qualify for hedge accounting or they are embedded derivatives. When hedges do notqualify for hedge accounting in the external reporting, a correction is performed at group level and is included in the ”unallocated” part of the segmentreporting. See note 20 Derivative financial instruments for information regarding the accounting treatment of hedging and embedded derivatives.The principal and interest amounts of the group’s non-current borrowings are denominated in currencies that match the cash flows generated by the groupcompanies holding the loans, primarily NOK, but also GBP and USD. This provides an economic hedge without entering into any derivatives.The group’s exposure to the main foreign currencies<strong>2009</strong> <strong>2008</strong>Amounts in million USD EUR GBP USD EUR GBPBank (376) (52) (57) (324) (70) (26)Intercompany loans 197 43 36 145 25 86External funding - - - (100) - -Balance sheet exposure (179) (9) (21) (279) (45) 60Estimated forecast receipts from customers 1 932 113 98 2 450 115 28Estimated forecast payments to vendors (539) (266) (202) (536) (413) (104)Cash flow exposure 1 393 (153) (104) 1 914 (298) (76)Forward exchange contracts (1 212) 154 124 (1 633) 344 14Net exposure 2 (8) (1) 2 1 (2)Estimated forecasted receipts and payments in the table above are calculated based on the group’s hedge transactions through the Corporate Treasurydepartment. These are considered to be the best estimate of the currency exposure given that all currency exposure is hedged, in accordance with thegroup’s policy. The net exposure is managed by the Corporate Treasury department that is allowed to hold positions within an approved trading mandate.This mandate is closely monitored and reported on a daily basis to the management.A foreign currency sensitivity analysis indicates that changes in the foreign currency rates have only minor effects on equity and profit and loss. A 10percent weakening of the NOK against the currencies listed on the next page at 31 December would have increased (decreased) equity and profit and lossby the amounts shown. The selected rate of 10 percent reflects the recent years’ changes in currency rates. Changes in currency rates change the valuesof hedging derivatives. Hedges that qualify for hedge-accounting are reported in the profit and loss according to the progress of projects. The deferredvalue of the hedging derivative is reported as equity reserve. Any changes to currency rates will therefore affect equity.The value of hedging derivatives that does not qualify for hedge-accounting can not be deferred from profit and loss. Changes in profit and loss are basedon changes in fair values of the hedges that does not qualify for hedge-accounting and any ineffectiveness in hedges that are hedge-accounted. Theanalysis includes only project-related items and assumes that all other variables, in particular interest rates, remain constant. Calculations are based onamounts and foreign currency exchange rates as of 31 December. The analysis is performed on the same basis for <strong>2008</strong>.Although hedge accounting is not applied to all foreign exchange contracts, these contracts are still ”economically” hedged. The effect on profit and lossunder financial items in the table on the next page, will have an opposite effect on future operating income or expense as progress on projects increases.Equity in the table on the next page is the hedge reserve that follows from the cash flow hedges.62Aker Solutions annual report <strong>2009</strong>
Our performanceNotes to the accountsAmounts in NOK million<strong>2009</strong> <strong>2008</strong>ProfitProfitbefore tax Equity 1 before tax Equity 1USD 2 (106) (36) 9EUR 38 45 (12) 234GBP 133 1 7 81) The effects to equity that follow directly from the effects to profit and loss are not included.A 10 percent weakening of the NOK against the above currencies at 31 December would have had the equal but opposite effect on the above amounts,on the basis that all other variables remain constant. The sensitivity analysis does not include effects on the consolidated result and equity from changedexchange rates used for consolidation of foreign subsidiaries.The primary currency-related risk is the risk of reduced competitiveness abroad in the case of a strengthened NOK. This risk relates to future commercialcontracts and is not included in the sensitivity analysis above.Translation exposureTranslation exposure occurs when foreign operations are translated for inclusion in the financial statements of the Aker Solutions group.The group has several investments in foreign operations, whose net assets are exposed to foreign currency translation risk. Currency exposure arisingfrom the net assets of the group’s foreign operations is normally only hedged to the extent of agreed future payments.Significant exchange rates applied for group consolidationAverage rateClosing rateCurrency <strong>2009</strong> <strong>2008</strong> <strong>2009</strong> <strong>2008</strong>USD 6.306 5.649 5.778 7.024EUR 8.797 8.285 8.304 9.881GBP 9.750 10.356 9.292 10.145The next table illustrates Aker Solutions exposure to translation risk. If the norwegian currency had been 10 percent depreciated during <strong>2009</strong>, theconsolidated statement would be affected with the changes in the table. The sensitivity analysis is only a translation sensitivity and does not reflectchanges in competetiveness, derivatives or other effects from currency fluctuations.10% depreciation of NOK ChangeAmounts in NOK million Revenue EBITDA Equity Revenue EBITDA Equity Revenue EBITDA EquityUSD 11 890 316 2 306 13 079 348 2 537 1 189 32 231EUR 2 035 (49) 1 039 2 238 (54) 1 143 203 (5) 104GBP 6 634 791 2 690 7 297 870 2 959 663 79 269BRL 1 521 157 231 1 673 173 254 152 16 23CAD 1 581 261 619 1 739 287 681 158 26 62NOK 26 307 2 319 945 26 307 2 319 945 - - -Other 4 109 573 1 146 4 521 630 1 260 412 57 114Total 54 077 4 368 8 976 56 854 4 573 9 779 2 777 205 803Interest rate riskThe group’s interest rate risk arises from non-current borrowings. Borrowings issued at variable rates expose the group to cash flow interest rate risk.Borrowings issued at fixed rates expose the group to fair value interest rate risk. However, as these borrowings are measured at amortised cost, interestrate variations do not affect profit and loss. Group policy is to maintain approximately 30-50 percent of its borrowings in fixed rate instruments usinginterest rate swaps to achieve this when necessary.As the group has no significant interest-bearing operating assets, operating income and operating cash flows are substantially independent of changesin market interest rates. At the year end, 47 percent of NOK 3 122 million in bonds was fixed for the duration of the bonds through interest rate swaps. Inaddition we have entered into a NOK 1 100 million fixed rate swap as hedge for drawings on the Revolving Credit Facilities and a NOK 375 million floatingrate swap for a NOK 750 million term loan.An increase of 100 basis points in interest rates during <strong>2009</strong> would have increased (decreased) equity and profit and loss by the amounts shown on thenext page. This analysis assumes that all other variables, in particular foreign currency rates, remain constant. The analysis is performed on the same basisas for <strong>2008</strong>.Aker Solutions annual report <strong>2009</strong> 63
Our performanceNotes to the accountsAmounts in NOK million<strong>2009</strong> <strong>2008</strong>ProfitProfitbefore tax Equity 1 before tax Equity 1Cash and cash equivalents 29 - 38 -Interest rate swap 66 41 35 27Non-current interest-bearing receivables 1 - 1 -Current interest-bearing receivables 5 - 5 -Borrowings (70) - (67) -Cash flow sensitivity (net) 31 41 12 271) Not including tax effect on hedge reserve or effects to equity that follow directly from the effects to profit and loss.A decrease of 100 basis points in interest rates during <strong>2009</strong> would have had the equal but opposite effect on the above amounts, on the basis that allother variables remain constant.Price riskThe group is exposed to fluctuations in market prices both in the investment portfolio and in the operating businesses related to individual contracts.The investment portfolio is limited and does not include shareholdings in listed companies.The businesses may be exposed to changes in market price for raw materials, equipment and development in wages. This is managed in the bid processby locking in committed prices from vendors as basis for offers to customers or through escalation clauses with customers.Credit riskCredit risk is the risk of financial losses to the group if the customer or counterparty to financial investments/instruments fails to meet its contractualobligations, and arises principally from investment securities and group receivables. Investment securities and derivatives are only traded againstapproved banks. All approved banks are participants in the Aker Solutions loan syndicate and have the highest rating at Moody’s and S&P. Credit riskrelated to investment securities and derivatives is therefore considered to be insignificant.Assessment of credit risk related to customers and subcontractors is an important requirement in the bid phase and throughout the contract period. Suchassessments are based on credit ratings, income statement and balance sheet reviews and using credit assessment tools available (e.g. Dun & Bradstreetand Credit Watch). Sales to customers are settled in cash.Based on estimates of incurred losses in respect of trade and other receivables, the group establishes a provision for impairment. Provisions for loss ondebtors are based on individual assessments. Provisions for loss on receivables are low (NOK 201 million in <strong>2009</strong> and NOK 116 million in <strong>2008</strong>), and higherthan the historical losses (NOK 21 million in <strong>2009</strong> and NOK 5 million in <strong>2008</strong>). Revenues are mainly related to large and long-term projects closely followedup in terms of payments up front and in accordance with agreed milestones. Normally, lack of payments are due to disagreements related to projectdeliveries and are solved together with the client or escalated to the local juristiction, see note 32 Contingent events. The customers are mainly large andhighly reputable oil companies with a low credit risk, which reduces the credit risk significantly. Based on the above the group’s credit risk is considered tobe insignificant.At the balance sheet date, there were no significant concentrations of credit risk. The maximum exposure to credit risk at the reporting date equals thebook value of each category of financial assets, see note 31 Financial instruments. The group does not hold collateral as security.Aker Solutions ASA provides parent company guarantees to group companies. For further information, see note 11 Guarantees in the Aker Solutions ASA’saccounts.Liquidity riskLiquidity risk represents the risk that the group will not be able to meet its financial obligations as they fall due. The group’s approach to managing liquidityis to ensure, as far as possible, that it will always have sufficient liquidity reserves to meet its liabilities when due.Prudent liquidity risk management includes maintaining sufficient cash, the availability of funding from an adequate amount of committed credit facilitiesand the ability to close out market positions. Due to the dynamic nature of the underlying businesses, Corporate Treasury maintains flexibility in funding bymaintaining availability under committed credit lines, see note 27 Borrowings.Management monitors rolling weekly and monthly forecasts of the group’s liquidity reserve on the basis of expected cash flow. For information regardingcapital expenditures and net operating assets, see note 8 Segment information.64Aker Solutions annual report <strong>2009</strong>
Our performanceNotes to the accountsFinancial liabilities and the period in which they are mature<strong>2009</strong>Amounts in NOK millionNoteBookvalueTotalundiscountedcash flow 16 mthsand less6-12mths1-2years2-5yearsMore than5 yearsBorrowings 27 (7 515) (8 959) (277) (194) (1 077) (7 394) (17)Other non-current liabilities 28 (891) (1 031) (14) (24) (444) (407) (142)Net derivative financial instruments 20 27 (3) (18) 40 (9) (16) -Trade and other payables 18 (19 370) (19 370) (18 982) (63) (325) - -Total (27 749) (29 363) (19 291) (241) (1 855) (7 817) (159)<strong>2008</strong>Amounts in NOK millionNoteBookvalueTotalundiscountedcash flow 16 mthsand less6-12mths1-2years2-5yearsMore than5 yearsBorrowings 27 (6 716) (7 766) (291) (637) (228) (6 610) -Other non-current liabilities 28 (1 194) (1 194) (126) (126) (126) (816) -Net derivative financial instruments 20 697 519 56 221 224 22 (4)Trade and other payables 18 (21 052) (21 052) (21 019) - (33) - -Total (28 265) (29 493) (21 380) (542) (163) (7 404) (4)1) Nominal currency value including interest.The group policy for the purpose of optimising availability and flexibility of cash within the group is to operate a centrally managed cash poolingarrangement. Such arrangements are either organised with a bank as a service provider, or as a part of the operation of the internal treasury function. Animportant condition for the participants (business units) in such cash pooling arrangements is that the group as an owner of such pools is financially viableand is able to prove its capability to service its obligations concerning repayment of any net deposits made by business units.Capital riskThe group’s objective for managing capital is to safeguard the group’s ability to continue as a going concern in order to provide returns for shareholdersand benefits for other stakeholders while maintaining an optimal capital structure to reduce the cost of capital.In order to maintain or adjust the capital structure, the group may adjust the amount of dividends paid to shareholders, return capital to shareholders,issue new shares or sell assets to reduce debt. From time to time, the group purchases its treasury shares in the market; the timing of these purchases isdependent on market prices.In the first quarter of <strong>2007</strong> Aker Solutions announced a buy-back of treasury shares, and in connection with the <strong>Annual</strong> General Meeting it was decidedto cancel parts of the treasury shares. There were additional share buy-backs in <strong>2008</strong> and <strong>2009</strong> and sales related to the share purchase programmefor employees. At year end, the group holds 1.67 percent of outstanding shares. The consolidated statement of changes to equity provides furtherdetails.The group monitors capital on the basis of a gearing ratio (gross debt/EBITDA) and interest coverage ratio (EBITDA/net finance cost). The ratios arecalculated from gross debt, including all interest-bearing liabilities as shown in note 31 Financial instruments, EBITDA (earnings before interest, tax,depreciation and amortisation) and finance cost. The reported ratios are within the requirements in the loan agreements.Gearing and interest coverage ratiosAmounts in NOK million <strong>2009</strong> <strong>2008</strong>Gearing ratioGross debt 7 515 6 716EBITDA 4 368 3 382Gross debt/EBITDA 1 1.7 2.0Interest coverageEBITDA 4 368 3 382Net finance cost 470 263EBITDA/Net finance cost 9.3 12.91) Gearing ratio adjusted for restructuring costs is 1.6 in <strong>2009</strong>.Aker Solutions annual report <strong>2009</strong> 65
Our performanceNotes to the accountsNote 6: Acquisitions of subsidiaries and non-controlling interestsAcquisitions of subsidiaries in <strong>2009</strong>The group has early adopted IFRS 3 Business Combinations (<strong>2008</strong>) and IAS 27 Consolidation and Separate Financial Statements (<strong>2008</strong>) for all businesscombinations occurring in the financial year starting 1 January <strong>2009</strong>. The change in accounting policy is applied prospectively, see note 2 Basis forpreparation.Wirth GmbH (renamed to Aker Wirth GmbH)In <strong>2007</strong> Aker Solutions acquired 50 percent of the shares in the company Wirth GmbH. The company is a German provider of drilling machines andpumps, and Aker Solutions had cooperated with the company for more than 20 years. In January <strong>2009</strong>, an agreement was reached for Aker Solutionsto acquire the 50 percent outstanding shares in Wirth GmbH over a five-year period. The acquisition will enable Aker Solutions to accelerate and furtherstrengthen the ability to realise the synergies between the companies, and gives greater flexibility to execute Aker Solutions growth strategy for the drillingequipment market.Aker Solutions has included a liability of EUR 55 million as deferred consideration for the outstanding 50 percent of the shares, payable over the period<strong>2009</strong>-2013. The consideration represents the fair value at the acquisition date, and includes EUR 4 million which is contingent on profit before tax for theperiod <strong>2009</strong>-2013.Aker Wirth is consolidated in Aker Solutions financial statements from 1 January <strong>2009</strong>. The investment was previously proportionally consolidated. A gainof NOK 170 million has been recognised in other income in the Products & Technologies business area relating to remeasurement of the previously heldinterest in the company to fair value. The gain includes NOK 27 million revaluation of inventories that has been expensed in the period. Goodwill resultingfrom the transaction is mainly attributable to the expected synergies and the value of the assembled workforce.Aker Oilfield Services ASIn April <strong>2009</strong> Aker Solutions increased the ownership in Aker Oilfield Services from 32.3 percent to 100 percent. The shares were purchased from AkerCapital AS (46 percent) and DOF Oilfield Services AS (21 percent). The acquisition is part of a strategy to give Aker Solutions a leading role in subsea wellintervention through an integrated model for service delivery.The consideration amounts to NOK 868 million, which was paid in full as of 31 December <strong>2009</strong>.Aker Oilfield Services has been consolidated in Aker Solutions’ financial statements from 1 April <strong>2009</strong>. The investment was previously recognised asan associated company. A gain of NOK 159 million has been recognised in other income in the Subsea business area relating to remeasurement of thepreviously held interest in the company to fair value. Transaction costs of NOK 24 million related to the acquisition have been expensed in the period.Goodwill resulting from the transaction is mainly attributable to the expected synergies and the value of the assembled workforce. The current analysis andallocation of fair value is provisional.Midsund Bruk ASIn April <strong>2009</strong>, Aker Solutions acquired a 100 percent stake in Midsund Bruk to facilitate a closer collaboration and to expand Aker Solutions’ technologyand product portefolio. The shares were purchased from Aker Capital AS.The consideration transferred to the selling shareholders was NOK 89 million, which was paid in full as of 31 December <strong>2009</strong>.The company has been consolidated in Aker Solutions’ financial statements from 1 April <strong>2009</strong>. Goodwill resulting from the transaction is mainlyattributable to the expected synergies and the value of the assembled workforce. The current analysis and allocation of fair value is provisional.Fornebu Gate 2 ASAker Solutions acquired in December <strong>2009</strong> the company Fornebu Gate 2 for NOK 127 million. In January <strong>2010</strong>, Aker Solutions entered into a contract withthe construction company HENT to build a new combined office and hotel building at the K2 site at Fornebu. The contracting party is Fornebu Gate 2, theowner of the property at Fornebu.66Aker Solutions annual report <strong>2009</strong>
Our performanceNotes to the accountsValues at time of acquisitionAmounts in NOK millionAkerWirthAker OilfieldServicesMidsundBrukFornebuGate 2TotalProperty, plant and equipment 57 515 68 288 928Intangible assets 96 115 9 - 220Other non-current assets 28 87 1 - 116Current operating assets 1 253 22 61 5 1 341Cash and cash equivalents 273 155 19 - 447Other non-current liabilities (126) (27) (10) (45) (208)Borrowings (154) (297) (31) (122) (604)Current operating liabilities (819) (37) (56) - (912)Net assets acquired at fair value 608 533 61 126 1 328Goodwill on acquisition 484 749 27 - 1 260Fair value acquired 1 092 1 282 88 126 2 588Percentage acquired 50% 68% 100% 100%Total consideration 546 868 88 126 1 628Deferred and contingent consideration (364) (334) - (23) (721)Cash paid 1 182 534 88 103 907Cash and cash equivalents acquired (136) 2 (155) (19) - (310)Net cash paid 46 379 69 103 597Gain on remeasurement of previously held interests 170 159 - - 329Operating revenue in acquired subsidiaries 3 1 782 2 91 - 1 875Profit for the period in acquired subsidiaries 3 222 (27) 9 - 2041) Cash paid during the quarter the acquisitions took place. In addition, NOK 334 million was paid in <strong>2009</strong> in quarters after the acquisitions took place and NOK 186 million was paid in <strong>2009</strong>relating to earlier acquisitions.2) 50 percent of the cash and cash equivalents at acquisition date.3) Amounts relate to the period after acquisition. Pro forma financial figures have not been prepared for Midsund Bruk, Aker Oilfield Services and Fornebu Gate 2 as the acquired subsidiaries arenot considerered to be material based on historical results. Aker Wirth is consolidated from 1 January <strong>2009</strong>.Acquisition of non-controlling interest in <strong>2009</strong>Step Offshore ASIn December <strong>2009</strong>, Aker Solutions acquired the remaining 49 percent of the shares and voting interests in Step Offshore to increase the group’soperational control. Step Offshore offer products and services related to drilling fluid management.NOK 78 million cash was paid to the selling shareholders at the acquisition date. Up to NOK 130 million additional consideration will be due in 2016,based on the accumulated EBITDA for <strong>2010</strong> to 2015. Aker Solutions has included NOK 59 million as contingent consideration, which represents the fairvalue at the acquisition date.The transaction resulted in a reduction of non-controlling interests of NOK 60 million.Acquisitions of subsidiaries in <strong>2008</strong>Qserv Ltd (renamed to Aker Qserv Ltd)Aker Solutions acquired 100 percent of the shares in the company in July <strong>2008</strong>. The company is a well service provider in Aberdeen, UK.Aker Solutions paid GBP 99 million in cash for the shares. In addition, Aker Solutions have agreed to pay the selling shareholders additional considerationdepending on accumulated EBITDA for the period of <strong>2008</strong>-<strong>2010</strong>. Minimum deferred payment under to the agreement is GBP 15 million. Aker Solutionsincluded GBP 51 million as contingent consideration in <strong>2008</strong>, which represented the fair value at the acquisition date. During <strong>2009</strong> the estimate fordeferred consideration was revised owing to adjusted EBITDA-expectations. The recognised consideration amounts to GBP 21 million as of 31 December<strong>2010</strong>, representing its fair value. Goodwill has been changed accordingly.Aker Qserv has been consolidated in Aker Solutions financial statements from 1 July <strong>2008</strong>. Transaction costs amount to NOK 8 million. Goodwill resultingfrom the transaction is mainly attributable to the expected synergies and the value of the assembled workforce.Other acquisitions in <strong>2008</strong>Aker Solutions acquired the following entities in <strong>2008</strong> that were not material for the group: First Interactive AS (60.2 percent), Aker Offshore Oy (74 percent,Aker Solutions holding 100 percent of the shares after the transaction), Aker Installation Floating Production AS (100 percent) and Aker Well ServicesPartners LLC (100 percent).Aker Solutions annual report <strong>2009</strong> 67
Our performanceNotes to the accountsTotal acquisition costs amount to NOK 1 629 million including acquisition of non-controlling interests and transaction costs of NOK 10 millionValues at time of acquisition 4Amounts in NOK millionTotalPlant and equipment 648Intangible assets 95Other non-current assets 7Current operating assets 305Cash and cash equivalents 46Non-controlling interests (5)Deferred tax liabilities (116)Other non-current liabilities (84)Borrowings (153)Current operating liabilities (402)Net assets acquired at fair value 341Goodwill on acquisition 1 288Fair value acquired 1 629Total consideration 1 629Deferred and contingent consideration (510)Cash paid as of 31 December <strong>2008</strong> 1 119Cash and cash equivalents acquired (46)Net cash paid 1 073Operating revenue in acquired subsidiaries after acquisition 460Profit for the period in acquired subsidiaries after acquisition 464) Values at time of acquisition relate mainly to the acquisition of Aker Qserv Ltd.Acquisition of non-controlling interest in <strong>2008</strong>Aker Marine Contractors ASAker Solutions acquired an additional 30 percent of the shares in Aker Marine Contractors from Taubåtkompaniet AS in July <strong>2008</strong>. In October <strong>2008</strong> anadditional 10 percent of the shares were acquired. Aker Solutions now holds 100 percent of the shares in the company. The total price for the 40 percentacquired in <strong>2008</strong> was NOK 744 million (NOK 559 million and NOK 185 million respectively) including NOK 2 million in transaction costs. The transactionresulted in a reduction of non-controlling interests of NOK 75 million, and an increase of NOK 595 million in goodwill.Note 7: Related partiesThe group has several related party relationships between parents and subsidiaries, see note 34 Group companies as of 31 December <strong>2009</strong>, associatesand joint ventures, see note 24 Investments in associates and jointly controlled entities and note 25 Jointly controlled operations and with its directors andexecutive officers, see note 9 Salaries, wages and social security costs.The largest shareholder Aker Holding AS is controlled by Aker ASA (60 percent) which is controlled by Kjell Inge Røkke through The Resource Group AS.All entities which Kjell Inge Røkke controls (Aker) or has significant influence in are considered related parties to Aker Solutions. These entities are belowreferred to as entities controlled by Aker in this note.All transactions with related parties have been based on arm’s length terms. Below is a summary of transactions and loan balances between Aker Solutionsand related parties.<strong>2009</strong>Amounts in NOK millionEntitiescontrolledby Aker 1AssociatedcompaniesJointventures 2TotalOperating revenues 320 55 613 988Operating costs (7) - - (7)Net financial items (25) - - (25)Net interest-bearing items 176 - (36) 140Other assets 477 - - 47768Aker Solutions annual report <strong>2009</strong>
Our performanceNotes to the accounts<strong>2008</strong>Amounts in NOK millionEntitiescontrolledby Aker 1AssociatedcompaniesJointventures 2TotalOperating revenues 2 375 61 592 3 028Operating costs (11) - - (11)Net interest-bearing items 88 8 (12) 84Other assets 35 - - 35Other liabilities (43) - - (43)<strong>2007</strong>Amounts in NOK millionEntitiescontrolledby AkerAssociatedcompaniesJointventures 2TotalOperating revenues 4 200 13 437 4 650Operating costs (10) - - (10)Net financial items 1 - - 11) Includes the jointly controlled entity Aker Clean Carbon.2) Includes transaction and balances to external parties in the joint ventures (amounts that are not eliminated in the consolidation)Associated companies and joint venturesAker Solutions operates in a market where it is common to establish associated companies and joint ventures to deliver large and complex projectsto customers. In such arrangements two or more suppliers have responsibility for parts of a project. Aker Solutions holds stakes in several associatedcompanies and joint ventures related to significant projects in the portfolio.Entities controlled by AkerIndustrial transactions in <strong>2009</strong>On 1 April <strong>2009</strong>, Aker Solutions acquired several shareholdings from companies in the Aker group in order to further strengthen its position in the offshoreand energy sectors. The acquisitions establish broader foundation for continued industrial development at the interface between energy, the environmentand maritime activities in industries with solid long-term growth potential.The transactions carried out resulted in Aker Solutions AS acquiring or increasing its ownership interest in the following businesses:Aker Oilfield Services ASAker Solutions increased the ownership in Aker Oilfield Services from 32.3 to 100 percent. 46 percent of the shares were acquired from Aker Capital ASfor a consideration of NOK 595 million. The acquisition is part of the implementation of a strategy to give Aker Solutions a leading role in subsea wellintervention through an integrated model for service delivery.Midsund Bruk ASAker Solutions acquired 100 percent of the shares in Midsund Bruk from Aker Capital AS for a the total consideration of NOK 88 million. A closercollaboration with Midsund Bruk will expand Aker Solutions’ technology and product portfolio.Aker DOF Deepwater ASAker Solutions acquired 50 percent of the shares in Aker DOF Deepwater from Aker Capital AS for NOK 190 million. Aker DOF Deepwater has six anchorhandling ships under construction. The remaining 50 percent is owned by DOF. The transaction will strengthen the partnership with DOF as a marineoperator. The investment is accounted for as a jointly controlled entity.ODIM ASAAker Solutions acquired 33 percent of the shares in ODIM from Aker ASA (10.8 percent) and Aker Invest II KS (22.2 percent). The total considerationamounted to NOK 513 million. The shares were subsequently sold in June <strong>2009</strong>. According to the share purchase agreement the profit should be shared(50/50) with Aker if the shares were resold during the following year. Aker Solutions share of profit amounted to NOK 109 million including dividends paidout in May <strong>2009</strong>, and is included in profit of associated companies and jointly controlled entities.Aker Clean Carbon ASAker Solutions’ shareholding in Aker Clean Carbon was increased from 30 to 50 percent through an equity issue of NOK 43 million. Following thetransaction Aker Clean Carbon is jointly controlled by Aker Solutions and Aker. Together they have developed the specialist carbon capture company AkerClean Carbon at the interface between energy and the environment. The company’s strategy is to be a supplier of turn-key carbon capture plants to theworld’s power plants and heavy industries, which together constitute the largest CO 2 emitters. The company’s ambition is to attain a leading position in themarket for CO 2 handling solutions, which is expected to develop into a significant and important industry. Among other projects, Aker Clean Carbon is dueto build part of the carbon capture facility at Mongstad near Bergen in Norway in a joint venture with Aker Solutions.The transactions described above were partly financed by new bond issues of NOK 2.1 billion, in which Aker participated with NOK 1 billion.Further description of the transactions related to the acquisitions of Aker Oilfield Services and Midsund Bruk is provided in note 6 Acquisitions ofsubsidiaries and non-controlling interests. Further description of the transactions related to Aker Clean Carbon, Aker DOF Deepwater and ODIM isprovided in note 24 Investments in associates and jointly controlled entities. A comprehensive presentation of the transactions’ key elements and relateddecision making processes was provided in the first-quarter results report for <strong>2009</strong>.Aker Solutions annual report <strong>2009</strong> 69
Our performanceNotes to the accountsAker Drilling ASAIn 2005, Aker Drilling and Aker Solutions entered into a contract for the turn-key delivery of two sixth-generation deepwater drilling semi-submersibles.The drilling rigs are equipped with Aker Solutions Dual RamRig drilling equipment. The contract value was approximately NOK 7.8 billion. Later, acontract for building of risers was entered into, as well as several variation orders for agreed additional work. The construction of the two H-6e drilling rigs,Aker Spitsbergen and Aker Barents was delayed by technical challenges, however, the rigs were delivered in <strong>2009</strong>. The standard warranty period of 24months has commenced.Aker Floating Production ASAker Floating Production (AFP) signed a contract for delivery and installation of a floating production storage and offloading (FPSO) vessel with RelianceIndustries Ltd, India in <strong>2007</strong>. The installation contract was executed through Aker Installation Floating Production (AIFP), a subsidiary of AFP that wasacquired by Aker Solutions in December <strong>2008</strong>. Aker Solutions managed the marine installation of the FPSO vessel to be leased out by Aker FloatingProduction. This installation contract had an initial contract value of USD 263 million at award. By the end of the contract the value had increased to USD343 million. The second phase of the installation contract was related to subsea equipment. This phase of the installation contract had an initial contractvalue of USD 235 million at award. By the end of the contract the value had increased to USD 242 million. The installation was completed in May <strong>2009</strong>.The contract for the second phase of the installation was between Aker Solutions and Reliance Industries Ltd.Intellectual Property Holding ASAker Solutions has an agreement with Intellectual Property Holding which holds all rights, titles and interests in and to registered trademarks and domainnames containing ”Aker”. IPH acts as a joint branding tool where the companies in Aker join forces in selected initiatives.Aker Asset ManagementAker Insurance receives investment management services from Aker Asset Management. The annual fee is based on average total capital.Aker PensjonskasseAker Pensjonskasse was established by Aker ASA to manage the Aker Solutions retirement plan for employees, retirees and related companies. The totalpaid-in equity was NOK 103 million at the end of <strong>2009</strong>, as in <strong>2008</strong>. Aker Solutions holds 93.4 percent of the shares in the Aker Pensjonskasse.Aker ASAAker Subsea Inc and Aker <strong>Kvaerner</strong> Wilfab Inc, which are subsidiaries of Aker Solutions, are sponsoring employers of the US pension plan <strong>Kvaerner</strong>Consolidated Retirement Plan. The principal sponsor for the plan is <strong>Kvaerner</strong> U.S. Inc, a subsidiary of TH Global plc. Aker has provided a guarantee to theplan in the event that Aker Solutions becomes liable for more than one third of the underfunded element of the plan.Aker Shiplease ASIn the first quarter of <strong>2009</strong>, Aker Marine Contractors International AS, a company in the Aker Solutions group, signed a 10-year leasing contract for anadvanced construction ship. The equipment is specifically designed for the group’s particular needs and a lease prepayment of NOK 310 million has beenpaid. The amount is included in other non-current operating assets in the balance sheet.Note 8: Operating segmentsAker Solutions has four reportable segments, as described below, which are the strategic business units of the group. The strategic business units offerdifferent products and services, and are managed separately because they operate in different market segments and have different strategies for theirprojects, products and services. The group’s CEO reviews each of the operating segments with the segment management on a monthly basis. The reviewis based on monthly reporting from the subsidiaries in the operating segments.The following summary describes the operations in each of Aker Solutions’ reportable segments:Energy Development & Services (ED&S) develops new oil and gas production facilities offshore and on land, as well as life cycle services for theoperational phase of such installations. The business area delivers the full value chain from studies, front-end design and detailed engineering, throughprocurement, project management, fabrication and hook-up, to installation, maintenance and modifications.Subsea is a global provider across the value chain of subsea and sub-surface technologies, solutions and services. Subsea offerings cover all phasesof the life of fields, from concept screening and design through manufacturing, installation and commissioning to operational support and maintenanceservices. Subsea’s ability as a provider of subsea production systems is backed by an extensive portfolio of additional capabilities such as well services,marine operations and geological services.Products & Technologies (P&T) is a leading global provider of specialised products and services to the upstream oil and gas industry, based on proprietarytechnology and know-how. Key deliverables include advanced drilling equipment, systems and risers, upstream processing technology and mooringsystems, as well as loading and offloading technology.Process & Construction (P&C) is a global provider of onshore engineering and construction services to the natural resources and energy markets. P&Csupplies niche process expertise with high-technology content and know-how for projects across chemicals, polymers, syngas and refining, mining andmetals, onshore liquefied natural gas (LNG) receiving terminals, power generation, biofuels, carbon capture, acid plants, nuclear, and water treatment.There are varying levels of integration between ED&S, Subsea and P&T, which all delivers products and services to customers within the oil and gasindustry globally and where the group’s expertise and products can be exploited in interaction with each other. P&C has also used the group’s processesand expertise when delivering their products and services to the process, metal and energy-sectors. The accounting policies of the reportable segmentsare the same as described in note 2 Basis of preparation and note 3 Accounting principles.Information regarding the results of each reportable segment is included on the next page. Performance is measured by segment operating profit beforedepreciation, amortisation and impairment (EBITDA) and operating profit (EBIT), as included in the internal management reports that are reviewed by thegroup’s CEO. Segment profit, together with key financial information as described on the next page, gives the CEO relevant information in evaluating theresults of the operating segments and is relevant in evaluating the results of the segments relative to other entities operating within these industries. Intersegmentpricing is determined on an arm’s length basis.Owing to the transfer of Aker Powergas Pvt Ltd to ED&S from P&C and the <strong>2009</strong> restructuring of the Subsea business area and P&T segments, historicalAker Solutions’ numbers were restated to reflect the new structure.70Aker Solutions annual report <strong>2009</strong>
Our performanceNotes to the accounts<strong>2009</strong> - Operating segmentsAmounts in NOK million Note ED&S Subsea P&T P&CTotaloperatingsegments Other Elim ConsolidatedExternal revenue and other incomeConstruction contracts 8 361 8 126 8 874 7 579 32 940 (67) - 32 873Services revenue 7 330 4 226 2 110 1 861 15 527 186 - 15 713Products - 329 1 097 32 1 458 - - 1 458Other 3 616 159 202 1 3 978 55 - 4 033Total external revenue and other income 19 307 12 840 12 283 9 473 53 903 174 - 54 077Inter-segment revenue 520 132 446 61 1 159 3 215 (4 374) -Total operating revenue and other income 19 827 12 972 12 729 9 534 55 062 3 389 (4 374) 54 077EBITDA 1 116 1 399 1 304 484 4 303 65 - 4 368Depreciation, amortisation and impairment 21, 22 (176) (450) (171) (23) (820) (90) - (910)EBIT 940 949 1 133 461 3 483 (25) - 3 458Material non cash itemsOther income (gain from business combinations) 6 - 159 170 - 329 - - 329Cash flowCash flow from operating activities 1 670 1 698 55 (131) 3 292 953 - 4 245Acquisition of property, plant and equipment 21 141 1 851 127 40 2 159 42 - 2 201AssetsCurrent operating assets 5 685 6 845 5 497 2 925 20 952 (179) (652) 20 121Non-current operating assets 3 554 7 577 1 764 1 357 14 252 699 - 14 951Operating assets 9 239 14 422 7 261 4 282 35 204 520 (652) 35 072Tax-related assets 486Investment in associates 423Investments in other companies 135Cash and interest bearing receivables 3 810Total assets 39 926LiabilitiesCurrent operating liabilities (5 927) (6 594) (4 471) (4 014) (21 006) (230) 652 (20 584)Non-current operating liabilities (511) (89) (129) (51) (780) (130) - (910)Operating liabilities (6 438) (6 683) (4 600) (4 065) (21 786) (360) 652 (21 494)Tax-related liabilities (903)Net interest-bearing items (7 515)Other liabilities (891)Total liabilities (30 803)Net current operating assets 14 (242) 251 1 026 (1 089) (54) (409) - (463)Net capital employed 14 3 081 8 457 2 838 1 213 15 589 1 258 - 16 847Order intake (unaudited) 26 887 12 568 6 621 6 913 52 989 3 437 (4 426) 52 000Order backlog (unaudited) 25 396 12 395 9 632 9 037 56 460 15 (199) 56 276Own employees (unaudited) 9 535 5 276 3 027 3 343 21 181 952 - 22 133Aker Solutions annual report <strong>2009</strong> 71
Our performanceNotes to the accounts<strong>2008</strong> - Operating segmentsAmounts in NOK million Note ED&S Subsea P&T P&CTotaloperatingsegments Other Elim ConsolidatedExternal revenue and other incomeConstruction contracts 13 824 8 542 9 138 6 384 37 888 293 - 38 181Services revenue 6 863 3 316 1 398 3 576 15 153 943 - 16 096Products - 959 865 144 1 968 - - 1 968Other 1 746 - 17 165 1 928 79 - 2 007Total external revenue and other income 22 433 12 817 11 418 10 269 56 937 1 315 - 58 252Inter-segment revenue 641 915 273 44 1 873 3 968 (5 841) -Total operating revenue and other income 23 074 13 732 11 691 10 313 58 810 5 283 (5 841) 58 252EBITDA (329) 1 709 967 759 3 106 276 - 3 382Depreciation, amortisation and impairment 21, 22 (103) (284) (67) (17) (471) (144) - (615)EBIT (432) 1 425 900 742 2 635 132 - 2 767Cash flowCash flow from operating activities (2 363) 528 1 122 599 (114) (754) - (868)Acquisition of property, plant and equipment 21 388 775 158 114 1 435 137 - 1 572AssetsCurrent operating assets 6 469 7 716 7 692 3 682 25 559 542 (884) 25 217Non-current operating assets 3 676 4 398 1 902 1 470 11 446 521 - 11 967Operating assets 10 145 12 114 9 594 5 152 37 005 1 063 (884) 37 184Tax-related assets 568Investment in associates 444Investments in other companies 123Cash and interest bearing receivables 4 405Total assets 42 724LiabilitiesCurrent operating liabilities (5 655) (6 319) (7 258) (5 490) (24 722) (529) 884 (24 367)Non-current operating liabilities (424) (64) (89) (54) (631) (127) - (758)Operating liabilities (6 079) (6 383) (7 347) (5 544) (25 353) (656) 884 (25 125)Tax-related liabilities (1 083)Net interest-bearing items (6 716)Other liabilities (1 194)Total liabilities (34 118)Net current operating assets 14 814 1 397 434 (1 808) 837 (13) - 850Net capital employed 14 4 386 6 519 2 525 799 14 229 1 480 - 15 709Order intake (unaudited) 16 937 10 537 17 050 10 951 55 475 4 990 (4 875) 55 590Order backlog (unaudited) 18 625 11 204 15 377 12 988 58 194 33 (211) 58 016Own employees (unaudited) 9 861 5 251 2 860 4 098 22 070 1 290 - 23 36072Aker Solutions annual report <strong>2009</strong>
Our performanceNotes to the accounts<strong>2007</strong> - Operating segmentsAmounts in NOK million ED&S Subsea P&T P&CTotaloperatingsegments Other Elim ConsolidatedExternal revenue and other incomeConstruction contracts 17 658 8 369 7 998 7 744 41 769 (103) - 41 666Services revenue 6 541 2 177 985 2 948 12 651 1 021 - 13 672Products - 1 000 487 87 1 574 - - 1 574Other 896 1 31 105 1 033 12 - 1 045Total external revenue and other income 25 095 11 547 9 501 10 884 57 027 930 - 57 957Inter-segment revenue 72 503 653 467 1 695 3 422 (5 117) -Total operating revenue and other income 25 167 12 050 10 154 11 351 58 722 4 352 (5 117) 57 957EBITDA 1 505 1 176 744 661 4 086 (173) - 3 913Depreciation, amortisation and impairment (138) (157) (29) (13) (337) (94) - (431)EBIT 1 367 1 019 715 648 3 749 (267) - 3 482Order intake (unaudited) 20 159 15 077 8 033 14 683 57 952 2 196 (2 206) 57 942Order backlog (unaudited) 24 644 13 204 9 268 12 712 59 828 (2 686) 1 119 58 261Own employees (unaudited) 9 420 4 377 1 962 4 259 20 018 1 280 - 21 298Major customersRevenue from one customer of the segments ED&S and Subsea represents approximately NOK 10.2 billion (NOK 10.7 billion in <strong>2008</strong> and NOK 9.2 billionin <strong>2007</strong>) of the group’s total revenue.Geographical informationGeographical segment revenue is presented on the geographical location of customers. Non-current segment assets and capital expenditure are based onthe geographical location of the assets.Operating revenuesNon-currentsegment assetsCapital expenditureAmounts in NOK million <strong>2009</strong> <strong>2008</strong> <strong>2007</strong> <strong>2009</strong> <strong>2008</strong> <strong>2009</strong> <strong>2008</strong>Norway 20 615 21 180 23 396 9 985 6 618 1 536 584Europe 8 412 8 704 8 628 3 220 3 310 273 470North America 8 559 8 597 9 243 1 166 1 378 115 148Asia 11 653 13 939 11 336 825 852 184 317Other 4 838 5 832 5 354 330 239 93 53Total 54 077 58 252 57 957 15 526 12 397 2 201 1 572Aker Solutions annual report <strong>2009</strong> 73
Our performanceNotes to the accountsNote 9: Salaries, wages and social security costsAmounts in NOK million Note <strong>2009</strong> <strong>2008</strong> <strong>2007</strong>Salaries and wages including holiday allowance 11 723 11 140 9 741Social security tax/National insurance contribution 1 460 1 328 1 373Pension cost 29 731 322 543Other employee costs 445 332 540Salaries, wages and social security costs 14 359 13 122 12 197Loans to employees are shown in note 23 Interest-bearing receivables. No guarantees are granted to any employee.Share purchase programme for employeesApproximately 4 000 employees participate in a share purchase programme where each employee purchases Aker Solutions shares for NOK 1 250 permonth at market price. The employee pays NOK 1 125, while the company contributes the remaining NOK 125. Employees who are still employed by thecompany in September 2011 will receive one bonus share for every two shares bought under the programme and retained at that time. At the end of <strong>2009</strong>a total of 832 119 shares had been bought under the programme for a total of NOK 45.4 million. This can potentially give rise to 407 653 bonus shares inSeptember 2011. The current programme was started in March <strong>2009</strong> and will end in February <strong>2010</strong>. Invitations have been issued for a new programmefor the period from March <strong>2010</strong> to February 2011 with bonus shares to be issued in September 2012. The company’s contribution to the purchase of theshares as well as the value of the bonus shares are expensed as salary expenses.Directors and nomination committee’s annual feesThe board fees for <strong>2009</strong> were NOK 2 608 333, including NOK 400 000 transferred to the labour union covering occupational activities in the group. Inaddition, fees to the reward committee were NOK 75 000 (corresponding to <strong>2008</strong>). The Board of Directors did not receive any other payments in <strong>2008</strong> or<strong>2009</strong>. The members of the Board of Directors have no agreements that entitle them to any extraordinary remuneration.Fees paid to the nomination committee in <strong>2009</strong> for the previous year amounted to NOK 90 000, NOK 30 000 per member (corresponding to <strong>2008</strong>).Board of directors 1<strong>2009</strong>Amounts in NOKBoard meetingattendanceExtraordinaryboard meetingattendance Reward committee Board feesØyvind Eriksen 2,4 7 of 7 10 of 10 300 000Martinus Brandal 2,4 2 of 2 2 of 2 100 000Bjørn Flatgård 4 2 of 2 2 of 2 25 000 125 000Lone Fønss Schrøder 4 6 of 7 9 of 10 125 000Heidi M Petersen 4 1 of 2 2 of 2 62 500Ida Helliesen 4 6 of 6 7 of 7 145 833Vibeke Hammer Madsen 9 of 9 11 of 12 25 000 250 000Leif-Arne Langøy 2, 4 2 of 2 1 of 2 25 000 104 167Mikael Lilius 4 5 of 6 6 of 7 145 833Siri Fürst 4 2 of 2 1 of 2 62 500Kjell Inge Røkke 2, 4 6 of 7 9 of 10 187 500Atle Teigland 3 9 of 9 12 of 12 150 000Åsmund Knutsen 3 9 of 9 12 of 12 150 000Ingebrigt Forus 3, 4 2 of 2 2 of 2 37 500Arild Håvik 3, 4 6 of 7 9 of 10 112 500Arve Toft 3 9 of 9 12 of 12 150 00074Aker Solutions annual report <strong>2009</strong>
Our performanceNotes to the accounts<strong>2008</strong>Amounts in NOK Reward committee Board feesLeif-Arne Langøy 2, 4 25 000 325 000Martinus Brandal 2, 4 300 000Bjørn Flatgård 25 000 350 000Heidi Marie Petersen 300 000Vibeke Hammer Madsen 25 000 300 000Karl Erik Kjelstad 2, 4 75 000Siri Fürst 300 000Atle Teigland 3 150 000Åsmund Knutsen 3 150 000Arve Toft 3 150 000Ingebreth Forus 3 150 0001) Members of the Board of Directors are elected for two years at the general meeting.2) According to policy in Aker, fees to board members employed in Aker companies will be paid to the Aker companies, not to the board member in person. The same policy is implemented forfees for the reward committee. Therefore, board fees for Øyvind Eriksen and Martinus Brandal and board fees and reward comittee fees for Leif-Arne Langøy were paid to Aker ASA. Board feesfor Kjell Inge Røkke were paid to The Resource Group. For <strong>2008</strong> the same board fees for Martinus Brandal, Leif-Arne Langøy and Karl Erik Kjelstad were paid to Aker ASA.3) According to agreement with and initiative from the employees, NOK 100 000 (NOK 150 000 in <strong>2008</strong>) is transferred to the labour union covering occupational activities in the group, for eachDirector elected by the employees.4) As of April <strong>2009</strong>, Øyvind Eriksen replaced Martinus Brandal as Chairman of the Board. As of April <strong>2009</strong> Heidi M. Petersen, Bjørn Flatgård, Siri Fürst and Ingebrigt Forus resigned as Directors ofthe Board. As of the same date Kjell Inge Røkke, Lone Fønns Schrøder and Arild Håvik entered as Directors of the Board. As of June <strong>2009</strong> Leif-Arne Langøy resigned as Director of the Board.As of the same date Ida Helliesen and Mikael Lilius entered as Directors of the Board.The nomination committeeThe Aker Solutions ASA nomination committee comprised the following members as of 31 December <strong>2009</strong>: Leif-Arne Langøy (Chairman),Gerhard Heiberg, Kjeld Rimberg and Mette Wikborg.The reward committeeThe reward committee has three members elected by and among the Board of Directors. As of 31 December <strong>2009</strong> the members of the reward committeeare Øyvind Eriksen (Chairman), Kjell Inge Røkke and Vibeke Hammer Madsen.The reward committee ensures that the company’s reward policy serves the interest of the shareholders and that the company has internally consistentand externally competitive remuneration of executives.Guidelines for remuneration to the President & CEO and the members of the executive management teamThe main purpose of the executive reward programme is to encourage a strong and sustainable performance-based culture, which supports growthin shareholder value. The total remuneration to executives consists of a market based salary, a few standard employee benefits and a variable payprogramme.The President & CEO and the executive management team participate in the standard pension and insurance schemes applicable to all employees. Thecompany practice standard employment contracts and standard terms and conditions regarding notice period and severance pay for the President & CEOand the members of the executive management team. The company does not offer share option programmes to any managers or employees.The objective of the variable pay programme is to contribute to the company achieving good financial results and management according to thecompany’s values and business ethics.The variable pay programme is based on the achievement of financial and personal performance targets, leadership performance in accordance with thecompany’s values and the development of the company’s share price. The programme represents a potential for an additional variable pay up to the valueof 94,5 percent of base salary. Earnings are paid over three years. The first half of the variable pay is paid the following year. The remaining amount is paidtwo years later with the addition of a retention element provided the executive is still employed by the company. The actual reward for leaders for <strong>2009</strong>was according to the guidelines of the company. The variable pay in <strong>2009</strong> relates to amounts earned in <strong>2008</strong> and 2006.Aker Solutions annual report <strong>2009</strong> 75
Our performanceNotes to the accountsRemuneration to members of the executive management teamMembers of the executive management team as of 31 December <strong>2009</strong> are: Simen Lieungh, Leif Hejø Borge, Niels Didrich Buch, Mads Andersen, PerHarald Kongelf, Gary Mandel, Karl Erik Kjelstad and Jarle Tautra. As of 1 February <strong>2009</strong> Jarle Tautra entered as Executive Vice President of ED&S andGary Mandel replaced Jarle Tautra as Executive Vice President of P&C. As of 1 July <strong>2009</strong> Karl Erik Kjelstad entered the executive management team.Total taxable remuneration of the executive management team for <strong>2009</strong> was NOK 25 941 011 (NOK 38 073 460 in <strong>2008</strong>). In addition, Aker Solutions alsoincurred NOK 780 572 in <strong>2009</strong> (NOK 848 021 in <strong>2008</strong>) in pension costs for the executive management team.<strong>2009</strong>Amounts in NOKBase salary 1 Variable pay 2 benfits 3OtherTotal taxableremunertionPension benefitearned/cost tocompanySimen Lieungh January - December 4 340 937 1 506 943 24 102 5 871 982 147 136 4Leif Hejø Borge January - December 2 599 744 122 923 23 767 2 746 434 57 925Niels Didrich Buch January - December 1 914 607 135 556 23 767 2 073 929 94 912Mads Andersen January - December 2 423 577 1 714 036 23 767 4 161 380 88 746Karl Erik Kjelstad July - December 1 366 731 - 2 552 1 369 283 28 544Per Harald Kongelf January - December 1 993 060 737 398 24 214 2 754 672 99 476Gary Mandel February - December 2 929 230 - - 2 929 230 124 764Jarle Tautra January - December 2 599 590 1 414 340 20 170 4 034 100 139 069Total 20 167 477 5 631 196 142 339 25 941 011 780 572<strong>2008</strong>Amounts in NOKBase salary 1 Variable pay 2 benfits 3OtherTotal taxableremunertionPension benefitearned/cost tocompanySimen Lieungh March - December 3 456 219 755 051 21 182 4 232 452 106 186 4Martinus Brandal January - February 1 212 235 722 953 - 1 935 188 36 584 4Leif Hejø Borge April - December 1 702 151 2 500 000 20 618 4 222 769 36 328Bjørn Erik Næss January - February 892 684 3 123 251 - 4 015 935 15 988Niels Didrich Buch March - December 1 396 465 316 057 21 969 1 734 491 77 843Nils A. Hatleskog April - December 1 265 527 444 807 16 219 1 726 553 60 250Mads Andersen January - December 2 279 657 2 507 561 21 969 4 809 187 54 330Torleif Gram January - April 617 817 1 379 013 113 192 2 110 022 206 299 4, 5Raymond Carlsen January - September 2 256 456 5 178 746 20 788 7 455 990 104 066 4Per Harald Kongelf October - December 499 160 - 12 678 511 838 36 328Jarle Tautra January - December 2 374 805 2 922 261 21 969 5 319 035 113 819Total 17 953 176 19 849 700 270 584 38 073 460 848 0211) Includes holiday allowance.2) The variable pay in <strong>2009</strong> are amounts earned in <strong>2008</strong> and 2006 in addition to holiday allowance on variable pay paid in <strong>2008</strong>. .3) Other benefits include insurance agreements, which is membership in the standard employee scheme and an additional executive group life and disability insurance with a maximum cover ofNOK 4 402 320.4) Includes management pension rights where contributions stopped in 2002. The schemes were wound up following the merger between <strong>Kvaerner</strong> and Aker Maritime.5) Car and housing allowance are included with NOK 103 455 in other benefits.There are no loans granted to members of the executive management team.76Aker Solutions annual report <strong>2009</strong>
Our performanceNotes to the accountsPeriod of notice, severance pay and pension benefits for each member of the current executive management teamName/Title Agreed period of notice Severance pay Pension benefitsPresident & CEO 6 months 12 months Standard employee defined benefit plan as described in note 29.Simen LieunghIn addition vested company pension rights (see description previous page).Executive Vice President & CFO 6 months 6 months Standard employee defined benefit plan as described in note 29.Leif Hejø BorgeExecutive Vice President 6 months 6 months Standard employee defined benefit plan as described in note 29.Niels Didrich BuchExecutive Vice President 6 months 6 months Standard employee defined benefit plan as described in note 29.Geir Arne DrangeidExecutive Vice President 6 months 6 months Standard employee defined benefit plan as described in note 29.Mads AndersenExecutive Vice President 6 months 6 months Standard US employee defined benefit plan for managersGary Mandeland employees.Executive Vice President 6 months 6 months Standard employee defined benefit plan as described in note 29.Karl Erik KjelstadExecutive Vice President 6 months 6 months Standard employee defined benefit plan as described in note 29.Per Harald KongelfExecutive Vice President 6 months 6 months Standard employee defined benefit plan as described in note 29.Jarle TautraShare-based paymentsIncluding the members of the executive management team, a total of 50 managers are entitled to variable pay under the programme described on theprevious page. The total accrual for variable pay programme is NOK 90.5 million as of 31 December <strong>2009</strong>. The development of the company’s share priceis an element of the variable pay programme.Amounts in NOK <strong>2009</strong> <strong>2008</strong> <strong>2007</strong>Paid in the year - 11 665 450 115 419 678Expensed in the year 1 396 635 (9 381 273) -Accrued at the end of the year 1 396 635 - 21 046 724Directors’ and executive management team’s shareholdingThe following number of shares were owned by the directors and the members of the executive management team (and their related parties) as of31 December <strong>2009</strong>.SharesAtle Teigland, Director 1 806Åsmund Knutsen, Director 3 111Arild Håvik, Director 206Arve Toft, Director 206Simen Lieungh, Precident & CEO 15 014Leif Hejø Borge, Executive Vice President & CFO 20 206Niels Didrich Buch, Executive Vice President 206Mads Andersen, Executive Vice President 12 601Karl Erik Kjelstad, Executive Vice President 2 500Gary Mandel, Executive Vice President 1 426The overview includes only direct ownership of Aker Solutions shares and does not include Kjell Inge Røkke’s indirect ownership through his ownershipin Aker ASA.Aker Solutions annual report <strong>2009</strong> 77
Our performanceNotes to the accountsNote 10: Operating leasesTotal non-cancellable operating lease commitmentsAmounts in NOK million <strong>2009</strong> <strong>2008</strong>Contracts due within one year 738 392Contracts running from one to five years 3 417 3 420Contracts running for more than five years 1 202 1 634Total 5 357 5 446Lease and sublease payments recognised in the income statement<strong>2009</strong>Amounts in NOK millionBuildingsConstructionequipmentOther plant andmachinery Other TotalMinimum lease payments 748 6 185 406 1 345Contingent payments 1 - - - 1Sublease payments (56) - - - (56)Total 693 6 185 406 1 290<strong>2008</strong>Amounts in NOK millionBuildingsConstructionequipmentOther plant andmachinery Other TotalMinimum lease payments 736 34 208 245 1 223Contingent payments 31 - 2 9 42Sublease payments (8) - - - (8)Total 759 34 210 254 1 257The major part of the operating lease costs and commitments relates to rental on a large number of locations worldwide. Aker Solutions has a twelve yearleasing agreement with Norwegian Property for headquarters, Aker Hus, at Fornebu, Bærum expiring in 2019.Other plant and machinery costs primarily include leasing of IT equipment, cars, inventory and lease of the vessels BOA Sub C and BOA Deep C whichare operated by Aker Marine Contractors. Leasing of IT equipment is based on a three year agreement with Hewlett Packard International Bank PLC. FromJanuary <strong>2008</strong>, inventory and ICT equipment are leased from SG Finans. There is no option to purchase the equipment and it cannot be sublet.None of the leases include significant contingent rent.Note 11: Other operating expensesOther operating expenses amount to NOK 6.4 billion in <strong>2009</strong> (NOK 6.9 billion in <strong>2008</strong> and NOK 5.4 billion in <strong>2007</strong>). The expenses include audit fees,operating lease costs, see note 10 Operating leases, research and development costs and other expenses regarding premises, electricity, maintenance,travelling, IT-equipment and insurance fees. Restructuring costs amount to NOK 343 million in <strong>2009</strong>.Fees to auditorsAuditOther assuranceservicesTaxservicesOtherservicesAmounts in NOK million <strong>2009</strong> <strong>2008</strong> <strong>2009</strong> <strong>2008</strong> <strong>2009</strong> <strong>2008</strong> <strong>2009</strong> <strong>2008</strong>Aker Solutions ASA 4 4 - - - - - -Subsidiaries 33 26 3 2 9 4 3 5Total 37 30 3 2 9 4 3 578Aker Solutions annual report <strong>2009</strong>
Our performanceNotes to the accountsNote 12: Finance income and expensesRecognised in profit and lossAmounts in NOK million <strong>2009</strong> <strong>2008</strong> <strong>2007</strong>Net change in fair value of non-qualifying hedge instruments 161 (439) 162Interest income on bank deposits measured at amortised cost 24 116 85Net foreign exchange gain - 31 18Ineffective portion of changes in fair value of hedging instruments (1) (6) -Other finance income 4 34 2Finance income 27 175 105Interest expense on financial liabilities measured at amortised cost (494) (379) (209)Interest expense on financial liabilities measured at fair value 1 (68) - -Capitalisation of borrowing costs 2 61 - -Net foreign exchange loss (51) - -Finance expenses (552) (379) (209)Net finance expenses recognised in profit and loss (364) (643) 581) Interest on deferred and contingent payments, see note 28 Other non-current liabilities.2) See note 21 Property, plant and equipment.Some foreign exchange hedge transactions do not qualify for hedge accounting under IFRS, primarly because a large number of internal hedgetransactions are grouped and netted before external hedge transactions are established. The non-qualifying hedge instruments are mainly foreignexchange forward contracts and their fair value changes have been recorded in the income statement as financial items. The change in value of foreignexchange hedge transactions and interest swap transactions classified as fair value hedges were NOK 351 million (negative NOK 231 million in <strong>2008</strong>). Thecorresponding contracts and loans (hedged items) to the hedging derivatives are calculated to have an equal, but opposite effect, and both the derivativesand the hedged items are reported in the financial results. Hedges of foreign exchange embedded derivatives are not subject to hedge accounting and areincluded in ’Net foreign exchange gain/loss’. Hedge accounting and embedded derivatives are explained in note 20 Derivative financial instruments.See note 31 Financial instruments for information of the finance income and expense generating items.Trade receivables are financial instruments and an impairment loss of NOK 21 million (NOK 5 million in <strong>2008</strong> and NOK 4 million in <strong>2007</strong>) was recognised incost of sales, see note 15 Trade and other receivables.Recognised directly in equityHedging reserveThe hedging reserve relates to cash flow hedges of future revenues and expenses against exchange rate fluctuations. The income statement effects of such instrumentsare recognised in accordance with the progress of the underlying construction contract as part of revenues or expenses as appropriate. The hedging reserve representsthe value of such hedging instruments that are not yet recognised in the income statement. The underlying nature of a hedge is that a positive value on a hedginginstrument exists to cover a negative value on the hedged position, see note 12 Financial income and expenses.Amounts in NOK million <strong>2009</strong> <strong>2008</strong> <strong>2007</strong>Balance as of 1 January 410 315 203Cash flow hedges, reclassification to income statement 397 373 (633)Cash flow hedges, effective portion of changes in fair value (761) (241) 788Cash flow hedges, deferred tax 102 (37) (43)Change in cash flow hedges (262) 95 112Addition from business combination 14 - -Balance as of 31 December 162 410 315Currency translation reserveThe currency translation reserve includes exchange differences arising from the translation of the net investment in foreign operations, and foreign exchange gainor loss on loans defined as hedges or net investments, see note 12 Financial income and expenses.Amounts in NOK million <strong>2009</strong> <strong>2008</strong> <strong>2007</strong>Balance as of 1 January 100 (595) (161)Effective portion of change in fair value of net investment hedge - - 120Foreign currency translation differences for foreign operations (971) 695 (554)Change in translation differences (971) 695 (434)Balance as of 31 December (871) 100 (595)Aker Solutions annual report <strong>2009</strong> 79
Our performanceNotes to the accountsNote 13: TaxIncome tax expenseAmounts in NOK million <strong>2009</strong> <strong>2008</strong> <strong>2007</strong>Current tax expenseCurrent year 1 027 484 548Adjustments for prior years (140) (36) 9Total current tax expense 887 448 557Deferred tax expenseOrigination and reversal of temporary differences 12 189 550Benefit of recognised tax loss carry-forwards and timing differences originated in previous periods (22) (47) (33)Total deferred tax expense (10) 142 517Total tax expense 877 590 1 074Effective tax rateThe table below reconciles the reported income tax expense to the expected income tax expense according to the corporate income tax rate of28 percent in Norway.Amounts in NOK million <strong>2009</strong> <strong>2008</strong> <strong>2007</strong>Profit before tax 3 208 2 103 3 538Expected income taxes (28 percent) of profit before tax 898 589 991Tax effects of:Prior year adjustments (121) 1 (37) (12)Effect of items booked against equity - 4 -Permanent differences (95) 2 21 23Tax losses and other timing differences not included in the period incurred 105 3 (47) (33)Change in tax rates 23 37 15Differences in tax rates from 28 percent 4 15 38 90Other 5 52 (15) -Income tax expense 877 590 1 074Effective tax rate 27% 28% 30%Tax effect of differences (21) 1 831) Relates mainly to US where recognised tax liabilities in prior year have been derecognised due to various clarifications related to actual tax liabilities.2) The amount includes acquisition gains related to remeasurement of previously held interests at fair value and gain from sale of shares in ODIM.3) Relates mainly to tax losses in the Netherlands, where no deferred tax asset has been recognised.4) Relates mainly to US where tax rate is in average 35 percent.5) Relates mainly to withholding tax.Recognised deferred tax assets and liabilitiesAssets Liabilities (-) NetAmounts in NOK million <strong>2009</strong> <strong>2008</strong> <strong>2009</strong> <strong>2008</strong> <strong>2009</strong> <strong>2008</strong>Property, plant and equipment (5) 16 (120) (160) (125) (144)Pensions 84 137 101 - 185 137Projects under construction (490) (64) (1 438) (1 722) (1 928) (1 786)Tax loss carry-forwards 337 31 1 044 1 344 1 381 1 375Other 463 399 (279) (293) 184 106Total 389 519 (692) (831) (303) (312)80Aker Solutions annual report <strong>2009</strong>
Our performanceNotes to the accountsChange in net recognised deferred tax assets and liabilitiesAmounts in NOK millionProperty, plantand equipmentPensionsProjects underconstructionTax losscarry-forwards Other TotalBalance as of 1 January <strong>2008</strong> (22) 246 (1 340) 1 458 (474) (132)Recognised in profit and loss (74) (109) (452) (103) 597 (142)Recognised in equity - - - - (4) (4)Additions through business combinations (35) - - - (81) (116)Currency translation differences (13) - 6 20 68 82Balance as of 31 December <strong>2008</strong> (144) 137 (1 786) 1 375 106 (312)Recognised in profit and loss 58 48 (141) 35 12 12Recognised in equity - - - - 6 6Additions through business combinations (58) - (6) (6) 87 17Currency translation differences 19 - 5 (23) (27) (26)Balance as of 31 December <strong>2009</strong> (125) 185 (1 928) 1 381 184 (303)Tax loss carry-forwardsAmounts in NOK millionNorwayEuropeotherNorthAmericaSouthAmericaAsiaPacific Other Total<strong>2010</strong> 6 - - 6 - - - 62015 and later - 347 376 - 5 - 728Indefinite 4 365 141 - 11 7 16 4 540Total tax loss carry-forwards 4 365 488 382 11 12 16 5 274Unrecognised tax loss carry-forwards 7 - 356 31 11 5 16 4196) There are no tax loss carry-forwardd that expires in the period 2011 until 2015.7) Tax losses are recognised in the balance sheet to the extent that forecasts and realistic expectations about results show that Aker Solutions will be able to use the tax losses before they expire.Geographical overview of tax positions<strong>2009</strong>Amounts in NOK millionCurrenttaxexpenseDeferredtaxexpenseTotaltaxexpenseNetdeferredtax liabilityNetpayabletax liabilityNorway 2 48 50 (492) 14Europe 274 2 276 (88) (93)North America 123 (55) 68 230 (55)South America 74 11 85 32 44Asia 8 410 (16) 394 15 (23)Other countries 4 - 4 - (1)Total 887 (10) 877 (303) (114)Tax asset 389 97Tax liability (692) (211)<strong>2008</strong>Amounts in NOK millionCurrenttaxexpenseDeferredtaxexpenseTotaltaxexpenseNetdeferredtax liabilityNetpayabletax liabilityNorway 13 (20) (7) (489) (18)Europe 65 47 112 (71) (42)North America 93 114 207 212 46South America 41 (3) 38 22 (48)Asia 8 234 2 236 (1) (121)Other countries 2 2 4 15 (24)Total 448 142 590 (312) (207)Tax asset 519 49Tax liability (831) (256)8) Tax related to Aker Solutions’ activity in Kazakhstan is reported under Asia.Aker Solutions annual report <strong>2009</strong> 81
Our performanceNotes to the accountsNote 14: Net capital employedAmounts in NOK million Note <strong>2009</strong> <strong>2008</strong>Inventories 16 1 417 1 321Trade and other receivables 15 18 332 20 796Provisions 19 (869) (912)Trade and other payables 18 (19 370) (21 052)Derivative financial instruments, net 20 27 697Net current operating assets (463) 850Employee benefit assets 29 167 234Other non-current operating assets 338 4Intangible assets 22 7 915 7 119Property, plant and equipment 21 6 531 4 610Employee benefits obligations 29 (910) (758)Interest-bearing receivables 23 624 577Investments 24, 26 558 567Cash excl. cash pool arrangement 2 087 2 506Total 16 847 15 709Note 15: Trade and other receivableAmounts in NOK million Note <strong>2009</strong> <strong>2008</strong>Trade receivables 1, 2 6 791 9 039Less provision for impairment of receivables (201) (116)Trade receivables, net 6 590 8 923Advances to suppliers 732 717Work in progress 17 6 456 6 868Other receivables 1 4 554 4 288Total 18 332 20 7961) Trade receiveables include NOK 333 million due after one year (NOK 135 million in <strong>2008</strong>). Book value of trade and other receivables is approximately equal to fair value.2) Receivables from related parties at the end of <strong>2009</strong> is NOK 160 million (NOK 35 million in <strong>2008</strong>).Ageing of loans and receivablesAmounts in NOK million <strong>2009</strong> <strong>2008</strong>Current 4 172 4 738Past due 0-30 days 1 023 2 276Past due 31-90 days 479 1 052Past due 91 days to one year 820 844Past due more than one year 297 129Total 6 791 9 039Note 16: InventoriesAmounts in NOK million <strong>2009</strong> <strong>2008</strong>Stock of raw materials 1 007 1 006Finished goods 410 315Total 1 417 1 321Inventories carried at fair value less cost to sell 303 205Write-down of inventories 28 282Aker Solutions annual report <strong>2009</strong>
Our performanceNotes to the accountsNote 17: ContractsAmounts in NOK million Note <strong>2009</strong> <strong>2008</strong>Value of work performed 97 751 105 409Invoiced 91 295 98 541Work in progress to be invoiced 6 456 6 868Trade receivables net 15 6 590 8 923Recoverable on contracts 13 046 15 791Advances from customers 18 5 575 6 860Order intake (unaudited)Amounts in NOK million <strong>2009</strong> <strong>2008</strong>Energy Development & Services 26 887 16 937Subsea 12 568 10 537Products & Technologies 6 621 17 050Process & Construction 6 913 10 951Other 3 437 4 990Eliminations (4 426) (4 875)Total 52 000 55 590Order backlog (unaudited)Amounts in NOK million <strong>2009</strong> <strong>2008</strong>Energy Development & Services 25 396 18 625Subsea 12 395 11 204Products & Technologies 9 632 15 377Process & Construction 9 037 12 988Other 15 33Eliminations (199) (211)Total 56 276 58 016Aker Solutions annual report <strong>2009</strong> 83
Our performanceNotes to the accountsLargest projects in progress at year end <strong>2009</strong> (unaudited)Project Business segment Customer Estimated deliverySkarv ED&S BP 2011Gjøa ED&S Statoil <strong>2010</strong>Statfjord Latelife ED&S Statoil 2011Frigg Cessation ED&S Total <strong>2010</strong>Tampen ED&S Statoil 2011Oseberg B Drilling upgrade ED&S Statoil 2013Kollsnes ED&S Statoil 2011Mongstad Test Centre ED&S Aker Clean Carbon 2011Kashagan HUC ED&S Agip 2011Sakhalin 1 ED&S Exxon 2012Frigstad P&T Frigstad Discoverer Invest <strong>2010</strong>CNOOC P&T CNOOC <strong>2010</strong>PetroRig P&T Jurong Shipyard <strong>2010</strong>Seadrill P&T Jurong Shipyard 2011Sevan P&T Sevan Drilling 2012TMT P&T Daewoo Shipbuilding & Marine Engineering 2011Odebrecht P&T Daewoo Shipyard 2011Gorgon P&T Chevron 2015Star risers P&T Queiroz Galvao <strong>2010</strong>Grupo R P&T Daewoo Shipyard 2012Maersk 1-3 P&T Maersk Drilling <strong>2010</strong>Atwood 1-2 P&T Atwood 2011Morvin Subsea Statoil <strong>2010</strong>Trym/Oselvar Subsea Dong 2011Ormen Lange SCS Pilot Subsea Statoil 2011Goliat Subsea ENI 2014Longview Power Project P&C Longview Power 2011Gulf LNG P&C Gulf LNG Energy 2011GTA West P&C TransCanada Energy <strong>2010</strong>GTA Southwest P&C TransCanada Energy 2013Note 18: Trade and other payablesAmounts in NOK million <strong>2009</strong> <strong>2008</strong>Trade creditors 1, 2 3 891 4 482Advances from customers 5 575 6 860Accrued operating and financial costs 7 790 7 972Other current liabilities 2 2 114 1 738Total 19 370 21 0521) Trade creditors include NOK 325 million due after one year (NOK 33 million in <strong>2008</strong>). Book value of trade creditors and other current liabilities is approximately equal to fair value.2) Trade creditors and other current liabilities included NOK 43 million to related parties at the end of <strong>2008</strong>.84Aker Solutions annual report <strong>2009</strong>
Our performanceNotes to the accountsNote 19: ProvisionsAmounts in NOK million Warranties Other TotalBalance as of 1 January <strong>2009</strong> 557 355 912Provisions made during the year 217 191 408Provisions used during the year (87) (138) (225)Provisions reversed during the year (113) (84) (197)Additions through business combinations 30 - 30Currency translation differences (31) (28) (59)Balance as of 31 December <strong>2009</strong> 573 296 869Expected timing of paymentNon-current 296 64 360Current 277 232 509Total 573 296 869See note 4 Accounting estimates and judgements and note 32 Contingent events.WarrantiesThe provision for warranties relates mainly to the possibility that Aker Solutions, based on contractual agreements, needs to perform guarantee workrelated to products and services delivered to customers. The provision is based on estimates of liabilities arising from existing contracts and the cost ofthe guarantee work. The warranty period is normally two years and any cash effects will arise in this period.OtherOther includes mainly restructuring provisions, provision for onerous leases and provisions for loss contracts. Provisions for loss contracts are partlyrecorded as reduction of projects under construction in the balance sheet, and partly as current provisions in the balance sheet, depending on the amountrecorded as project under construction for each project.Note 20: Derivative financial instrumentsThe Aker Solutions group uses derivative financial instruments to hedge foreign exchange and interest rate exposures. In addition, there are embeddedforeign exchange forward derivatives separated from ordinary commercial contracts. Further information regarding risk management policies in the groupis available in note 5 Financial risk management and exposures.The table below presents the fair value of the derivative financial instruments and a maturity analysis of the derivative’s undiscounted cashflows. Given theAker Solutions group hedging policy and the assumption that the projects are cash neutral, this table also indicates when the cash flows related to projectrevenues and expenses are expected to impact profit and loss.<strong>2009</strong>Amounts in NOK millionAssets at fairvalueLiabilities atfair valueNet fairvalueTotalundiscountedcash flow 16 mths orless6-12mths1-2years2-5yearsMorethan 5yearsForward foreign exchange contractsCash flow hedges 140 (58) 82 66 53 11 2 - -Fair value hedges 41 (19) 22 27 30 (2) (1) - -Embedded derivatives included inordinary commercial contracts 11 (4) 7 (105) (28) (36) (26) (15) -Not hedge accounted 173 (230) (57) 38 (69) 70 23 14 -Interest rate swapsOption contracts 1 (2) (1) (1) (1)Cash flow and fair value hedges 2 (28) (26) (28) (3) (3) (7) (15) -Not hedge accounted 4 (4) - - - - - - -Total 372 (345) 27 (3) (18) 40 (9) (16) -Aker Solutions annual report <strong>2009</strong> 85
Our performanceNotes to the accounts<strong>2008</strong>Amounts in NOK millionAssets at fairvalueLiabilities atfair valueNet fairvalueTotalundiscountedcash flow 16 mths orless6-12mths1-2years2-5yearsMorethan 5yearsForward foreign exchange contractsCash flow hedges 979 (115) 864 863 148 274 349 92 -Fair value hedges 27 (303) (276) (275) (84) (44) (107) (40) -Embedded derivatives included inordinary commercial contracts 1 933 (30) 1 903 1 903 496 456 762 189 -Not hedge accounted 154 (1 895) (1 741) (1 911) (498) (459) (765) (189) -Interest rate swapsCash flow and fair value hedges - (52) (52) (60) (6) (6) (14) (30) (4)Not hedge accounted 7 (8) (1) (1) - - (1) - -Total 3 100 (2 403) 697 519 56 221 224 22 (4)1) Undiscounted cash flows are translated to NOK using the exchange rates on the balance sheet date.The ineffective portion recognised in the profit and loss that arises from qualifying hedges amounts to a loss of NOK 0.5 million (loss of NOK 6 million in <strong>2008</strong>).Derivative financial instruments are classified as current assets or liabilities. The full fair value of a hedging derivative is classified as a non-current asset or liabilityif the remaining maturity of the hedged item is more than 12 months, and as a current asset or liability if the maturity of the hedged item is less than 12 months. Ifthe hedged item is related to projects, such as work in progress or trade receivables, the hedging derivative is always classified as a current asset or liability.Foreign exchange derivativesCorporate Treasury hedge the group’s future transactions in foreign currencies against external banks. More than 80 percent of the exposure to foreignexchange variations in future cash flows are related to a few large projects. These projects have been hedged as one-to-one contracts in order to meet therequirements for hedge accounting. They are either subject to hedge accounting or separated embedded derivatives. All other hedges are not designatedas IAS 39 hedges and will have an effect on profit or loss. Most hedges qualifying for hedge accounting are classified as cash flow hedges (hedgesof highly probable future revenues and/or expenses). Some hedges that will clearly qualify as hedges of firm commitments are classified as fair valuehedges.Embedded derivatives are foreign exchange derivatives separated from construction contracts. The main reason for separation is that the agreed paymentis in a currency different from any of the major contract parties’ own functional currency. The embedded derivatives represent currency exposures, whichis hedged against external banks. Since the embedded derivatives are measured and classified in the same way as their hedging derivatives, they will havean almost equal, opposite effect to profit and loss. In the table above, the derivatives hedging the embedded derivatives are included in Forward foreignexchange contracts - not hedge accounted.The hedged transactions in foreign currency are highly probable future transactions expected to occur at various dates during the next one to four years,depending on progress in the projects. Gains and losses on forward foreign exchange contracts are recognised in comprehensive income and reportedas hedging reserve in equity until it will be recognised in the income statement in the period or periods during which the hedged transactions affect theincome statement. This is generally within 12 months from the balance sheet date unless the gain or loss is over the life of the asset.The following table shows the unsettled cash flow hedges’ impact on profit and loss and equity (not adjusted for tax).Amounts in NOK millionFair valueof all hedginginstruments<strong>2009</strong> <strong>2008</strong>Recognised Deferred in Fair value Recognisedin profit equity (the of all hedgingin profitand loss hedging reserve) instruments and lossDeferred inequity (thehedging reserve)Interest rate swaps 1 (11) - (11) (52) - (52)Forward exchange contracts 82 40 42 864 157 707Total 71 40 31 812 157 6551) The value of the interest swaps is attributable to changes in the interest swap curve for Norwegian kroner during the period from inception of the hedge to the balance sheet date.The purpose of the hedging instrument is to secure a situation where the hedged item and the hedging instrument together represent a predeterminedvalue independent of fluctuations of exchange rates. Revenue and expense on the underlying construction contracts are recognised in the incomestatement in accordance with progress. Consequently, NOK 40 million of the value of the forward contracts have already affected the income statementindirectly as revenues and expenses are recognised based on updated forecasts and progress. The NOK 42 million that are currently recorded directly inthe hedging reserve, will be reclassified to income statement over approximately the next three years.Interest rate swapsAs of 31 December <strong>2009</strong>, Aker Solutions group has one bond of NOK 150 million with a fixed interest rate of 6 percent and one bond of NOK 1 913 millionwith a fixed interest rate of 8.7 percent. At year end, there were interest rate swaps with floating interest with a notional value of NOK 1 100 hedging thefixed interest bonds. In addition, Aker Solutions has three bonds totalling NOK 1 059 million at floating interest rates and NOK 400 million are swappedto fixed interest. NOK 2 000 million of drawings under committed facilities are swapped to 12 months fixed rate from 15 January <strong>2009</strong>. As of 15 January<strong>2010</strong>, these interest swaps are replaced with new 12 months fixed rate interest swaps of NOK 1 100 million. A credit facility of NOK 750 million withfloating interest was established in <strong>2009</strong> where NOK 375 million are swapped to fixed interest. Floating interest is mainly tied to NIBOR and LIBOR. Hedgeaccounting is applied using the cash flow hedge accounting model which means that gains and losses on interest rate swap from floating to fixed interestrates as of 31 December <strong>2009</strong> are recognised in the hedging reserve in equity and will be continuously released to the income statement until the bankborrowings are repaid. Fair value hedge accounting is applied for hedging of the fixed interest bonds, see note 27 Borrowings.The fair value amounts of the outstanding interest rate swap contracts as of 31 December <strong>2009</strong> were negative NOK 26 million (negative NOK 53 million in <strong>2008</strong>).86Aker Solutions annual report <strong>2009</strong>
Our performanceNotes to the accountsNote 21: Property, plant and equipmentAmounts in NOK millionNoteBuildingsand sitesMachinery,equipment andsoftwareUnderconstructionTotalHistorical costBalance as of 1 January <strong>2008</strong> 1 435 3 706 302 5 443Additions 397 798 377 1 572Additions through business combinations 1 6 - 648 - 648Disposals - (87) 3 (84)Currency translation differences 119 220 (11) 328Balance as of 31 December <strong>2008</strong> 1 951 5 285 671 7 907Additions 2 130 847 1 224 2 201Additions through business combinations 1 6 333 71 524 928Disposals (64) (170) (55) (289)Currency translation differences (115) (281) (27) (423)Balance as of 31 December <strong>2009</strong> 2 235 5 752 2 337 10 324Accumulated depreciationBalance as of 1 January <strong>2008</strong> (616) (2 011) (1) (2 628)Depreciation for the year (189) (376) - (565)Impairment loss - (43) - (43)Disposals 8 48 - 56Currency translation differences (9) (109) 1 (117)Balance as of 31 December <strong>2008</strong> (806) (2 491) - (3 297)Depreciation for the year (82) (721) - (803)Impairment loss - (48) - (48)Disposals 98 129 - 227Currency translation differences 10 118 - 128Balance as of 31 December <strong>2009</strong> (780) (3 013) - (3 793)Book valueas of 31 December <strong>2008</strong> 1 145 2 794 671 4 610as of 31 December <strong>2009</strong> 1 455 2 739 2 337 6 531Of which financial leasesas of 31 December <strong>2008</strong> 5 245 - 250as of 31 December <strong>2009</strong> 4 199 - 2031) Additions through business combinations relate mainly to the acquisition of Aker Oilfield Services AS, Aker Wirth GmbH, Midsund Bruk AS and Fornebu Gate 2 AS in <strong>2009</strong> and Aker Qserv Ltdin <strong>2008</strong>.2) NOK 61 million of borrowing costs have been capitalised in <strong>2009</strong> and are included in the amount. This is a consequence of implementation of IAS 23 Loan expenses (<strong>2007</strong>).Additions property, plant and equipmentApproximately 50 percent of additions are related to the investment programme in Aker Oilfield Services AS.By the end of December <strong>2009</strong> Aker Solutions has entered contractual commitments for the acquisition of property, plant and equipment amounting toNOK 2.7 billion, mainly related to the investment programme in Aker Oilfield Services AS and new offices at Fornebu. The commitments will to a largeextent become payable in <strong>2010</strong>.DepreciationsAssets are depreciated on a straight-line basis over their expected economic lives as follows:Machinery and equipment 3 - 15 yearsBuildings8 - 30 yearsSitesNo depreciationEstimates for residual values are reviewed annually.SecuritySee note 27 Borrowings for information about bank borrowings which are secured by property, plant and equipment.Aker Solutions annual report <strong>2009</strong> 87
Our performanceNotes to the accountsNote 22: Intangible assetsAmounts in NOK millionNoteIntangible assetsexcl. goodwill Goodwill TotalBook value as of 1 January <strong>2008</strong> 57 4 938 4 995Additions 12 - 12Additions through business combinations 6 95 1 883 1 978Disposals (7) - (7)Amortisation for the year (7) - (7)Currency translation differences 10 138 148Book value as of 31 December <strong>2008</strong> 160 6 959 7 119Additions 177 - 177Additions through business combinations 6 220 1 260 1 480Adjustment - (338) (338)Disposals - (112) (112)Amortisation for the year (38) - (38)Impairment loss - (21) (21)Currency translation differences (24) (328) (352)Book value as of 31 December <strong>2009</strong> 495 7 420 7 915Intangible assets excl. goodwillResearch and development costsNOK 177 million have been capitalised in <strong>2009</strong> related to development activities. Most of the costs for research and development in Aker Solutions arerelated to projects and are booked as contract costs. In addition, research and development costs of NOK 164 million have been expensed during theyear because the criteria for capitalisation was not met (NOK 188 million in <strong>2008</strong>). In addition, research and development costs paid by customers totalledNOK 22 million in <strong>2009</strong> (NOK 21 million in <strong>2008</strong>).Additions through business combinationsThe increase in other intangible assets of NOK 220 million through business combinations in <strong>2009</strong> relates mainly customer contracts (NOK 160 million) andpatents and trademarks (NOK 45 million). The increase in <strong>2008</strong> of NOK 95 million relates mainly customer contracts (NOK 70 million).GoodwillThe increase in goodwill in <strong>2009</strong> is caused by the acquisitions of Aker Oilfield Services AS, Aker Wirth GmbH and Midsund Bruk AS. Goodwill ofNOK 112 million was recognised on acquisition of the first 50 percent of Aker Wirth GMBH in <strong>2007</strong>. The increase in goodwill in <strong>2008</strong> is mainly caused bythe acquisitions of Aker Qserv Ltd and Aker Marine Contractors AS.The adjustment in <strong>2009</strong> relates to the reduction of goodwill related to the acquisition of Aker Qserv Ltd in <strong>2008</strong> due to a change in the estimated deferredpayment. See note 6 Acquisitions of subsidiaries and non-controlling interest for further description of goodwill.Allocation of goodwill by operating segments 1Amounts in NOK million <strong>2009</strong> <strong>2008</strong>Energy Development & Services 2 317 2 320Subsea 2 687 2 346Products & Technologies 1 157 862Process & Construction 1 123 1 268Other 136 163Total 7 420 6 9591) In the first quarter <strong>2009</strong> Aker Solutions reorganised its segments. Prior year numbers are restated, see note 8 Operating segments. Decrease in goodwill is related to currency translationeffects.Impairment testing for cash-generating units containing goodwillGoodwill originates from a number of acquisitions. Management monitors goodwill impairment at the business segment level which is also considered thecash-generating unit (CGU) due to the level of integration within the CGUs.Recoverable amounts are based on value in use calculations. The calculations use cash flow projections based on the future cash flow, budgets andstrategic forecasts for the periods <strong>2010</strong>-2017 and an annual growth of 2.5 percent for subsequent periods. A discount rate (WACC) of 12.4 percent aftertax (17.2 percent before tax) has been used for discounted cash flows.For all business areas, the recoverable amounts are higher than the carrying amounts and consequently the analysis indicates that no impairment isrequired. Cash flow estimates are sensitive to the abilitiy to maintain volume and margin assumptions. The sensitivity of the estimates, even with areasonable change in assumptions, does not give grounds for impairment charges.88Aker Solutions annual report <strong>2009</strong>
Our performanceNotes to the accountsNote 23: Interest-bearing receivablesCurrent interest-bearing receivablesCurrent interest-bearing receivables were NOK 440 million (NOK 480 million in <strong>2008</strong>). Aker Insurance AS had a portfolio of obligations, certificates andshares as of 31 December amounting to NOK 424 million (NOK 458 million in <strong>2008</strong>).Non-current interest-bearing receivablesAmounts in NOK million <strong>2009</strong> <strong>2008</strong>Loans to employees 1 6 6Loans to related parties 2 176 88Other 2 3Non-current interest-bearing receivables 184 971) Average interest rate for loans to employees was 3.58 percent in <strong>2009</strong>, and 5.79 percent in <strong>2008</strong>.2) Aker DOF Deepwater AS and Aker Clean Carbon AS, see note 7 Related parties.See note 5 Financial risk management and exposures for information regarding credit risk management in the Aker Solutions group.Note 24: Investments in associated companies and jointly controlled entitiesAs of 1 January <strong>2009</strong>, jointly controlled entities are accounted for using the equity method. Previously these investments were accounted for by includingthe group’s proportionate share of the entities’ assets, liabilities, revenues and expenses with items of a similar nature on a line-by-line basis. Comparativeinformation has not been restated as effects are not material to the group’s financial statements. See note 2 Basis for preparation for further description ofchange in accounting principle.Associated companies and jointly controlled entities are defined as related parties to Aker Solutions. See note 7 Related parties for overview oftransactions and balances between Aker Solutions and the associated companies and joint ventures.Investments in associated companies and jointly controlled entities<strong>2009</strong> Book valueas ofAmounts in NOK million1.1.<strong>2009</strong>Additions/Disposals/PaymentsProfitand otheradjustmentsCurrencyand otheradjustmentsBook valueas of31.12.<strong>2009</strong>Aker Oilfield Services AS 1 260 (256) (4) - -Aker Clean Carbon AS 2 19 43 (13) - 49Aker DOF Deepwater - 190 - - 190ODIM ASA 3 - (109) 109 - -Other companies 165 15 22 (18) 184Total 444 (117) 114 (18) 423<strong>2008</strong> Book valueas ofAmounts in NOK million1.1.<strong>2008</strong>Additions/Disposals/PaymentsProfitand otheradjustmentsCurrencyand otheradjustmentsBook valueas of31.12.<strong>2008</strong>Aker Oilfield Services AS - 269 (9) - 260Aker Clean Carbon AS - 32 (13) - 19Other companies 121 23 1 20 165Total 121 324 (21) 20 4441) Subsidiary from 1 April <strong>2009</strong>.2) Joint venture from 1 April <strong>2009</strong>.3) 33 percent of ODIM ASA was acquired on 1 April <strong>2009</strong> and sold on 29 June <strong>2009</strong>. Profit after tax includes dividends of NOK 15 million paid in May <strong>2009</strong> and sales gain of NOK 94 million.Aker Solutions annual report <strong>2009</strong> 89
Our performanceNotes to the accountsSummary of financial information for significant associated companies and jointly controlled entities (100 percent basis)<strong>2009</strong> PercentageAmounts in NOK millionBusiness office of voting rightsPercetageheld Assets Liabilities Equity RevenuesNetprofit/lossPower Maintenance and Constructors, LLC Hammond, USA 49.0% 49.0% 71 31 40 848 1Nippon Pusnes Co Ltd Tokyo, Japan 28.0% 28.0% 199 155 44 149 8K-WAC Ltd Brentford, UK 33.0% 30.0% 345 271 74 660 56Aker Clean Carbon AS Oslo, Norway 50.0% 50.0% 205 124 81 210 (36)Aker DOF Deepwater AS Storebø, Norway 50.0% 50.0% 393 329 64 4 4<strong>2008</strong> PercentageAmounts in NOK millionBusiness office of voting rightsPercetageheld Assets Liabilities Equity RevenuesNetprofit/lossPower Maintenance and Constructors, LLC Hammond, USA 49.0% 49.0% 118 70 48 625 -Nippon Pusnes Co Ltd Tokyo, Japan 28.0% 28.0% 198 162 36 334 6K-WAC Ltd Brentford, UK 33.0% 30.0% - - - - -Aker Oilfield Services AS Oslo, Norway 32.3% 32.3% 726 270 456 - (24)Aker Clean Carbon AS Oslo, Norway 30.0% 30.0% 140 75 65 8 (44)Payment guaranteesAker Solutions ASA has issued payment guarantees to STX Singapore Offshore Pte Ltd for 50 percent of all amounts payable by Aker DOFDeepwater AS under the contract to construct six vessels. Aker Solutions remaining commitments amounts to NOK 829 million as of 31 December <strong>2009</strong>.Aker DOF Deepwater AS has entered into long term financing agreements of 70 percent of contact value for the first two vessels, and similar financingarrangements are planned for the remaining four vessels.Note 25: Jointly controlled operationsThe group has interests in several jointly controlled operations whose principal activities are construction contracts. The group’s share of assets, liabilities, incomeand expenses of the jointly controlled operations are included in the consolidated financial statements. The material agreements and entities are listed below.Jointly controlled operations are defined as related parties to Aker Solutions. See note 7 Related parties for overview of transactions and balancesbetween Aker Solutions and jointly controlled operations.Percentage share <strong>2009</strong> <strong>2008</strong>Aker <strong>Kvaerner</strong> Clough Murray & Robertsen Joint Venture 61% 61%AKTIV Joint Venture 40% 40%ASC-ERSAI Consortium 50% 50%AET-Varisal 50% -Angel - 50%Anglian Water 4 Joint Venture 50% 50%Cameron LNG (Sempra) 50% 50%JV Yansab 50% 50%O&G Solutions Joint Venture 50% 50%Halton Hills Power Partners Joint Venture 50% 50%AK/IHI Gulf 50% 50%ASO/IHI 50% 50%KAT Nuclear 45% 45%Note 26: Investments in other companiesAmounts in NOK million <strong>2009</strong> <strong>2008</strong>Balance as of 1 January 123 133Additions 12 66Disposals 1 - (76)Balance as of 31 December 135 1231) Disposals in <strong>2008</strong> were mainly related to additional investments in Aker Oilfield Services AS which was reclassified to an associate.90Aker Solutions annual report <strong>2009</strong>
Our performanceNotes to the accountsNote 27: BorrowingsContractual terms of group’s interest-bearing loans and borrowings which are measured at amortised cost. For more information about the the group’sexposure to interest rates, foreign currency and liquidity risk, see note 5 Financial risk management and exposures.<strong>2009</strong>Amounts in millionCurrencyNominalcurrencyvalueBookvalueInterestrateFixedinterestmarginInterestcouponMaturity dateInteresttermsISIN NO 0010341324 NOK 572 570 2.01% 1.05% 3.06% 01.12.2011 Floating, 3 mthsISIN NO 0010341332 NOK 300 297 2.01% 1.35% 3.36% 01.12.2013 Floating, 3 mthsISIN NO 0010342587 NOK 150 149 6.00% 6.00% 01.12.2013 Fixed, annualISIN NO 001050461.6 NOK 1913 1 953 8.70% 8.70% 26.06.2014 Fixed, annualISIN NO 001050460.8 NOK 187 185 2.13% 4.75% 6.88% 26.06.2014 Floating, 3 mthsTotal bonds 1 3 154Revolving credit facility EUR 750 2 886 0.83% 25.10.2012 LIBOR + Margin 2Revolving credit facility NOK 2 000 - 1.75-2.50% 19.12.2011 LIBOR + Margin 3Revolving credit facility NOK 750 753 2.00% 2.00% 4.00% 01.10.2014 NIBOR, 3 mthsTotal credit facility 3 639Brazilian Development Bank EXIM loan BRL 155 519 4.50% 08.10.2012 FixedOther loans 203Total borrowings 7 515Current borrowings 180Non-current borrowings 7 335Total 7 515<strong>2008</strong>Amounts in millionCurrencyNominalcurrencyvalueBookvalueInterestrateFixedinterestmarginInterestcouponMaturity dateInteresttermsISIN NO 0010341316 NOK 500 494 5.93% 0.70% 6.63% 01.12.<strong>2009</strong> Floating, 3 mthsISIN NO 0010341324 NOK 650 643 5.93% 1.05% 6.98% 01.12.2011 Floating, 3 mthsISIN NO 0010341332 NOK 300 297 5.93% 1.35% 7.28% 01.12.2013 Floating, 3 mthsISIN NO 0010342587 NOK 150 148 6.00% 6.00% 01.12.2013 FixedTotal bonds 1 1 582Revolving credit facility EUR 750 4 776 0.50% 25.10.2012 LIBOR + Margin 2Revolving credit facility NOK 2 000 - 1.75-2.50% 19.12.2011 LIBOR + Margin 3Total credit facility 4 776Other loans 358Total borrowings 6 716Current borrowings 553Non-current borrowings 6 163Total 6 7161) The book value is calculated by reducing the nominal value of NOK 3 122 million by total issue costs related to the new financing of NOK 12 million (NOK 28 million in <strong>2008</strong>). Accrued interestand issue costs related to the bonds are included.2) The margin applicable to the facility is decided by a price grid based on the gearing ratio. Commitment fee is 40 percent of the margin.3) The margin applicable to the facility is decided by a price grid based on the gearing ratio. Commitment fee is 50 percent of the margin.Aker Solutions annual report <strong>2009</strong> 91
Our performanceNotes to the accountsNorwegian bondsAker Solutions has issued five bonds which mature in two, four (two loans) and five years (two loans). The bonds which mature in two and four years wereissued on 1 December 2006, while two new bond issues were made on 26 June <strong>2009</strong>. The bonds are denominated in Norwegian kroner and are issuedin the Norwegian bond market. Three of the bonds are issued based on a floating interest rate plus a predefined margin. The bonds with notional value ofNOK 150 million and NOK 1 913 million have fixed interest rates of 6.0 and 8.7 percent respectively.The bonds are issued with Norsk Tillitsmann as trustee and the loan agreements are based on Norsk Tillitsmann’s standard loan agreement for suchbonds. The bonds are unsecured on a negative pledge basis and include no dividend restrictions.The bonds issued in 2006 are listed on the Oslo Stock Exchange.Bank debtThe bank debt consists of two revolving credit facilities of EUR 750 million with initial maturity in October 2012 and NOK 2 000 million maturing inDecember 2011. The facilities are provided by a bank syndicate consisting of Nordic and high quality international banks. The EUR 750 million facility wasdrawn to NOK 2 900 million at year end <strong>2009</strong> and the NOK 2 000 million facility was undrawn. In addition, a new credit facility of NOK 750 million withinitial maturity in October 2014 was established during <strong>2009</strong> and was fully drawn at the balance-sheet date. The terms and conditions include restrictionswhich are customary for this kind of facility, including inter alia negative pledge provisions and restrictions on acquisitions, disposals and mergers. Thereare also certain changes of control provisions included. The facility includes no dividend restrictions and is unsecured.The financial covenants are based on two sets of key financial ratios; a gearing ratio based on gross debt/EBITDA and an interest coverage ratio based onEBITDA/net finance costs. The financial covenants are tested on a quarterly basis. The margin applicable to the facility is based on a price grid determinedby the gearing ratio. See note 5 Financial risk management and exposures for more information regarding capital risk in the group.Aker Solutions strategy is to have between 30-50 percent of borrowings at fixed interest rates. To the extent that this is not reflected in the loanagreements, swap transactions are entered into. The revolving facility is hedged to fixed rate through an interest rate swap for NOK 1 100 million through<strong>2010</strong>.Financial liabilities and the period in which they mature<strong>2009</strong>Amounts in NOK millionBookvalueTotalundiscountedcash flow6 mthsand less6-12mths1-2years2-5yearsMore than5 yearsISIN NO 0010341324 (570) (572) - - (572) - -ISIN NO 0010341332 (297) (300) - - - (300) -ISIN NO 0010342587 (149) (150) - - - (150) -ISIN NO 001050461.6 (1 953) (1 913) - - - (1 913) -ISIN NO 001050460.8 (185) (187) - - - (187) -Interest on bonds (834) (187) (29) (216) (402) -Total bonds (3 154) (3 956) (187) (29) (788) (2 952) -Revolving credit facility (EUR 750 million) (2 886) (2 900) - - - (2 900) -Revolving credit facility (NOK 2 000 million) - - - - - - -Revolving credit facility (NOK 750 million) (753) (750) - - - (750) -Total credit facility (3 639) (3 650) - - - (4 166) -Brazilian Development Bank EXIM loan (519) (516) - - - (516) -Other loans (203) (203) (10) (66) (95) (17) (15)Interest on revolving credit facility and other bank debt (634) (80) (99) (194) (259) (2)Total borrowings (7 515) (8 959) (277) (194) (1 077) (7 394) (17)92Aker Solutions annual report <strong>2009</strong>
Our performanceNotes to the accounts<strong>2008</strong>Amounts in NOK millionBookvalueTotalundiscountedcash flow6 mthsand less6-12mths1-2years2-5yearsMore than5 yearsISIN NO 0010341316 (494) (500) - (500) - - -ISIN NO 0010341324 (643) (650) - - - (650) -ISIN NO 0010341332 (297) (300) - - - (300) -ISIN NO 0010342587 (148) (150) - - - (150) -Interest on bonds (233) (42) (37) (45) (109) -Total bonds 1 (1 582) (1 833) (42) (537) (45) (1 209) -Revolving credit facility (EUR 750 million) (4 776) (5 523) (100) (100) (183) (5 140) -Revolving credit facility (NOK 2 000 million) - - - - - - -Total credit facility (4 776) (5 523) (100) (100) (183) (5 140) -Other loans and interest (358) (410) (149) - - (261) -Total borrowings (6 716) (7 766) (291) (637) (228) (6 610) -Mortgages and guarantee liabilitiesThe group has NOK 29 million in mortgage liabilities, which is secured by pledges on property, plant and equipment with book values of NOK 29 million.The group has no guarantee liabilities as of 31 December <strong>2009</strong>, except for guarantees related to contracts.Note 28: Other non-current liabilitiesAmounts in NOK million <strong>2009</strong> <strong>2008</strong>Deferred and contingent considerations 676 970Other 215 224Total 891 1 194Aker Solutions has acquired subsidiaries and non-controlling interests where final consideration is deferred and to a certain degree dependent on futureearnings in the acquired companies. The total estimated consideration is measured at fair value using a discount rate equal to market rates for borrowings.The discount rate is based on market rates on the acquisition dates and varies between 4.5 and 6.5 percent. Deferred consideration to be paid in <strong>2010</strong> isreported as current liabilities. See note 6 Acquisitions of subsidiaries and non-controlling interests for additional information about deferred and contingentconsiderations related to acquisitions.Other liabilities are mainly liabilities in Aker Insurance AS. Actuary estimated insurance provisions for reported injuries and incurred but not reported injuriesamounts to NOK 165 million (NOK 173 million in <strong>2008</strong>).Note 29: Employee benefits – pensionThe group’s pension costs show the future pension entitlement earned by employees in the financial year. In a defined contribution plan the companyis responsible for paying an agreed contribution to the employee’s pension assets. The employee bears the risk related to the investment return on thepension assets. In a defined benefit plan, the company is responsible for paying an agreed pension to the employee based on his or her final pay.Pension plans in NorwayThe Norwegian companies in the group are obligated to follow the Act on Mandatory company pensions and these companies’ pension schemes followthe requirements as set in the Act of 1 July <strong>2008</strong>. All the Norwegian companies in Aker Solutions changed from a defined benefit plan to a definedcontribution plan in which the company is responsible for paying an agreed contribution to the employee’s pension assets. Employees over 58 years at thetime of transition remain in the defined benefit plan.To ensure that the employees were treated fairly on the change over to the new plan the company has introduced a compensation plan. The basis for decidingthe compensation amount is the difference between calculated pension capital in the defined benefit plan and the value of the defined benefit plan at the ageof 67 years. The compensation amount will be adjusted annually in accordance with the adjustment of the employees’ pensionable income, and accruedinterest according to market interest. If the employee leaves the company voluntarily before the age of 67 years, the compensation amount will be reduced.The defined benefit plan is covered by the Aker Pension Fund. Aker Solutions participates in a multi-employer plan called AFP together with the Norwegianstate and other employers. The participating employers pay a contribution to the plan independent of the company’s use of it. The employers also pay 25percent of the pension paid to own pensioners. The Norwegian state pays a contribution of 40 percent of paid pensions. The figures regarding definedbenefit below include Aker Solutions’ cost and liability related to the AFP-plan. See note 35 Subsequent events for information about change in the AFPmangementas of 1 January <strong>2009</strong>.Defined benefit plans in Norway largely consist of a defined benefit plan for employees over 58 years at the time the plan was changed to a definedcontribution plan on 1 July <strong>2008</strong>, special pension schemes financed through company operations and contractual early retirement (AFP) schemes. Inaddition the net pension liability will include the accrued liabilities in the compensation plan.Aker Solutions annual report <strong>2009</strong> 93
Our performanceNotes to the accountsPension plans outside NorwayGroup companies in Canada and Germany have defined benefit plans. The benefit plan in Canada was closed to new members as of 1 September <strong>2008</strong>.Most companies in other countries have defined contribution plans where the employer only contributes an agreed amount that is separately administered.Net periodic pension cost (return)Amounts in NOK million <strong>2009</strong> <strong>2008</strong> <strong>2007</strong>Defined benefit plansService cost 189 244 263Interest on projected benefit obligation 127 171 180Expected return on plan assets (123) (150) (138)Net amortisations and deferrals 125 33 68Curtailments and settlements - (296) -Administration cost 14 19 9Social security tax 29 10 53Pension cost defined benefit plans 362 31 435Pension cost defined contribution plans 369 291 108Total pension cost 731 322 543Status of pension plans reconciled with the balance sheet<strong>2009</strong> <strong>2008</strong>Amounts in NOK million Funded Unfunded Total Funded Unfunded TotalDefined benefit plansAccumulated benefit obligation 2 034 730 2 764 1 918 582 2 500Effect of projected future compensation levels 93 99 192 225 98 323Projected benefit obligation (PBO) 2 127 829 2 956 2 143 680 2 823Social security tax on plan assets in excess of (less than) PBO 33 106 139 46 88 134Plan assets at fair value 1 825 - 1 825 1 872 - 1 872Plan assets in excess of (less than) PBO (335) (935) (1 270) (317) (768) (1 085)Unrecognised net (gain) loss 409 118 527 452 109 561Net employee benefit assets (employee benefit obligations) 74 (817) (743) 135 (659) (524)As presented in the balance sheetEmployee benefit assets 167 - 167 234 - 234Employee benefit obligations (93) (817) (910) (99) (659) (758)Total 74 (817) (743) 135 (659) (524)NOK 38 million of the pension prepayment at the end of <strong>2009</strong> relates to group companies in Canada (NOK 26 million in <strong>2008</strong>). NOK 47 million andNOK 59 million of the accrued pension liability at the end of <strong>2009</strong> relates to group companies in Canada and Germany respectively (NOK 49 million andNOK 33 million in <strong>2008</strong>).Economic assumptionsNorwegian plans <strong>2009</strong> <strong>2008</strong>Discount rate 4.40% 4.50%Asset return 6.40% 6.50%Salary progression 4.00-4.25% 4.25%Pension indexation 3.00% 3.00%The discount rate is based on the Norwegian ten-year government bond rate. The asset return is expected to be higher than the discount rate becausethe assets are invested in instruments with a higher risk than government bonds. Experience has shown that the rate of return on pension assets has beenabout 1-2 percent higher than the discount rate over an extended period of time.Generally, a one percent increase in the discount rate will lead to approximately 20 percent decrease in service cost/projected benefit obligation.Outside NorwayBasis for the Canadian plans are a discount rate of 7.5 percent (7.5 percent in <strong>2008</strong>), an expected rate of return on assets of 7.25 percent (7.25 percentin <strong>2008</strong>) and an expected salary increase of 3.5 percent (3.5 percent in <strong>2008</strong>). The pension liabilties in Germany are based on a discount rate of 5 percent(5.5 percent in <strong>2008</strong>) and an annual salary-growth of 2 percent (3 percent in <strong>2008</strong>)94Aker Solutions annual report <strong>2009</strong>
Our performanceNotes to the accountsMovement in pension obligation and plan assetAmounts in NOK million <strong>2009</strong> <strong>2008</strong>Projected benefit obligation as of 1 January 2 813 4 350Service cost incl. cost related to the compensation plan 189 300Interest on projected benefit obligation 127 171Benefits paid by the plan (252) (109)Curtailment and settlement 5 (1 926)Acquisition and disposal 11 -Change in unrecognised (gain) loss 71 18Currency translation differences 9 9Projected benefit obligation as of 31 December 2 973 2 813Plan assets at fair value as of 1 January 1 872 2 662Expected return on plan assets 123 150Contributions paid into the plan 99 350Benefits paid by the plan (254) (79)Curtailment and settlement - (1 041)Change in unrecognised gain (loss) - (159)Administration costs (14) (19)Currency translation differences - 8Plan assets at fair value as of 31 December 1 826 1 872Analyses of the plan assetsMajor categories of plan assets in percent of total plan assets (Norwegian plans) <strong>2009</strong> <strong>2008</strong>Equity instruments 4.4% 3.6%Debt instruments 93.9% 94.7%Other assets 1.7% 1.7%Plan assets 100.0% 100.0%Overview of net pension obligationAmounts in NOK million <strong>2009</strong> <strong>2008</strong> <strong>2007</strong> 2006 2005Projected benefit obligation 2 973 2 813 4 350 4 034 3 339Plan assets at fair value 1 826 1 872 2 662 2 438 2 073Net pension obligation (1 147) (941) (1 688) (1 596) (1 266)Change in unrecognised (gain) loss projected benefit obligation 71 18 (40) 615 112Change in unrecognised gain (loss) plans assets - (159) (199) 101 4Aker Solutions annual report <strong>2009</strong> 95
Our performanceNotes to the accountsNote 30: Earnings per shareAker Solutions ASA holds 4 570 911 treasury shares at year end <strong>2009</strong> (4 966 830 in <strong>2008</strong>). Treasury shares are not included in the weighted averagenumber of ordinary or diluted shares.Basic earnings per shareThe calculation of basic earnings per share as of 31 December <strong>2009</strong> was based on the profit attributable to ordinary shareholders and a weighted averagenumber of ordinary shares outstanding.<strong>2009</strong> <strong>2008</strong> <strong>2007</strong>Profit attributable to ordinary shares (NOK million) 2 260 1 438 2 401Issued ordinary shares as of 1 January 274 000 000 274 000 000 274 000 000Weighted average number of issued ordinary shares for the year adjusted for treasury shares 269 138 497 269 056 995 271 741 367Basic earnings per share (NOK) 8.40 5.34 8.84Diluted earnings per shareThe calculation of diluted earnings per share as of 31 December <strong>2009</strong> was based on profit attributable to ordinary shareholders and a weighted averagenumber of ordinary shares outstanding after adjustment for the effect of rights to receive bonus shares in connection with the employee share purchaseprogramme and all dilutive potential ordinary shares.<strong>2009</strong> <strong>2008</strong> <strong>2007</strong>Profit attributable to ordinary shares (NOK million) 2 260 1 438 2 401Weighted average number of issued ordinary shares for the year adjusted for treasury shares 269 138 497 269 056 995 271 741 367Expected effect of right to receive bonus shares 175 278 - -Weighted average number of ordinary shares outstanding (diluted) for the year 269 313 775 269 056 995 271 741 367Diluted earnings per share (NOK) 8.39 5.34 8.84Summary of purchase and sale of treasury sharesAmounts in NOK million Number of shares ConsiderationShareholding as of 1 January <strong>2008</strong> 4 371 830 616Purchase <strong>2008</strong> 595 000 70Shareholding as of 31 December <strong>2008</strong> 4 966 830 686Purchase <strong>2009</strong> 436 200 20Sale <strong>2009</strong> (832 119) (45)Shareholding as of 31 December <strong>2009</strong> 4 570 911 661The group purchases treasury shares to meet the obligation under the employee share purchase programme.96Aker Solutions annual report <strong>2009</strong>
Our performanceNotes to the accountsNote 31: Financial instrumentsThe table below analyses financial instruments by valuation method.Source of inputs used to derive the fair value of the financial instruments are either:Level 1 - quoted prices (unadjusted) in active markets for identical assets or liabilitiesLevel 2 - inputs other than quoted prices included within level 1 that are observables for the asset or liability, either directly (i.e. as prices) or indirectly(i.e., derived from prices)Level 3 - inputs for the asset or liability that are not based on observable market data (unobservable inputs)<strong>2009</strong>AssetsAmounts in NOK million Note Level 1 Level 2 Level 3 Amortised cost TotalCash and cash equivalents 3 186 - - - 3 186Investments in other companies 26 - - 135 - 135Derivative financial instruments 20 - 372 - - 372Non-current interest-bearing receivables 23 - - - 184 184Non-current loans and receivables - - - 338 338Trade and other receivables 15 - - - 18 332 18 332Current interest-bearing receivables 23 218 206 - 16 440Total loans and receivables 218 206 - 18 870 19 294Total assets classified as financial instruments 3 404 578 135 18 870 22 987Current assets 3 404 578 - 18 348 22 330Non-current - - 135 522 657Total assets 3 404 578 135 18 870 22 987LiabilitiesAmounts in NOK million Note Level 1 Level 2 Level 3 Amortised cost TotalDerivative financial instruments 20 - (345) - - (345)Non-current borrowings 27 - - - (7 335) (7 335)Other non-current liabilities 28 - - - (891) (891)Trade and other payables 18 - - - (19 370) (19 370)Current interest-bearing liabilities 27 - - - (180) (180)Total financial liabilities - - - (27 776) (27 776)Total liabilities classified as financial instruments - (345) - (27 776) (28 121)Current liabilities - (345) - (19 550) (19 895)Non-current liabilities - - - (8 226) (8 226)Total liabilities - (345) - (27 776) (28 121)Aker Solutions annual report <strong>2009</strong> 97
Our performanceNotes to the accounts<strong>2008</strong>AssetsAmounts in NOK million Note Level 1 Level 2 Level 3 Amortised cost TotalCash and cash equivalents 3 828 - - - 3 828Investments in other companies 26 - - 123 - 123Derivative financial instruments 20 - 3 100 - - 3 100Non-current interest-bearing receivables 23 - - - 97 97Non-current loans and receivables - - - 4 4Trade and other receivables 15 - - - 20 796 20 796Current interest-bearing receivables 23 178 280 - 22 480Total loans and receivables 178 280 - 20 919 21 377Total assets classified as financial instruments 4 006 3 380 123 20 919 28 428Current assets 4 006 3 380 - 20 818 28 204Non-current - - 123 101 224Total assets 4 006 3 380 123 20 919 28 428LiabilitiesAmounts in NOK million Note Level 1 Level 2 Level 3 Amortised cost TotalDerivative financial instruments 20 - (2 403) - - (2 403)Non-current borrowings 27 - - - (6 163) (6 163)Other non-current liabilities 28 - - - (1 194) (1 194)Trade and other payables 18 - - - (21 052) (21 052)Current interest-bearing liabilities 27 - - - (553) (553)Total financial liabilities - - - (28 962) (28 962)Total liabilities classified as financial instruments - (2 403) - (28 962) (31 365)Current liabilities - (2 403) - - (24 008)Non-current liabilities - - - - (7 357)Total liabilities - (2 403) - - (31 365)Basis for determining fair values and fair values versus carrying amountsCash and cash equivalentsThe carrying amount is a reasonable approximation of fair values for cash and cash equivalents.Investments in other companiesInvestments in other companies are non-current available-for-sale financial assets and they are measured at fair value. Fair values are estimated usingmarket-based pricing techniques.Derivative financial instrumentsDerivative financial instruments are current financial assets and liabilities through profit or loss and they are measured at fair value. There are activemarkets for trading the derivative financial instruments. Because of differences in maturities and volume between the active markets and Aker Solutions’position of derivative financial instruments, fair values are calculated in the Treasury department based on quoted market prices of interest rates andexchange rates.Loans and receivables and financial liabilitiesLoans and receivables and financial liabilities are measured at amortised cost. Due to the short term nature, the carrying amount is a reasonableapproximation of fair values, with the exception of financial borrowings, which are detailed in the table below.<strong>2009</strong> <strong>2008</strong>Amounts in NOK million Carrying amount Fair value Carrying amount Fair valueBonds 1 3 154 3 064 1 582 1 600Other borrowings 2 4 361 4 369 5 134 5 160Total borrowings 7 515 7 433 6 716 6 7601) Fair value is quoted prices for the bonds noted on the Oslo Stock Exchange. Notional amounts is best approximation for the new bonds.2) Credit facilities have floating interest and the notional amount is a reasonable approximation of fair values. Notional values of other loans is also expected to be a good approximation of fairvalues.98Aker Solutions annual report <strong>2009</strong>
Our performanceNotes to the accountsNote 32: Contingent eventsProject risks and uncertaintiesMany of the group’s projects are long-term contracts awarded through competitive bidding. Failure to meet schedule or performance guarantees orincreases in contract costs may result in non-recoverable costs, which could exceed the revenues realised from a project. Where a project is identifiedas loss-making, provisions for future losses are made, see note 19 Provisions. The accounting treatment is based on management’s best estimate at thetime. Inevitably, such circumstances and information may be subject to changes in subsequent periods and thus the eventual outcome may be better orworse than estimated.In the group’s view, the following project is subject to estimation uncertainty, the outcome of which could have a material impact on the consolidatedfinancial statements:Sempra–LNG regasification facilityCameron LNG LLC (ultimately Sempra LNG–Sempra) and Aker Solutions US Inc/IHI Inc have entered into an agreement for engineering, procurement,construction and commissioning services of an LNG regasification facility located on the south coast of Louisiana in the United States. The originalvalue of the contract was USD 470 million. From the start of the construction in 2005 until completion, the project was affected by several force majeureevents, including hurricanes, and significant client-requested changes to the initial project scope. These events and scope changes resulted in significantincreases in project cost and delayed the original scheduled completion date. In August <strong>2009</strong>, all outstanding claims with Sempra were settled and paid.Insurance claims relating to a hurricane and a subcontractor claim remain open, since Aker Solutions is seeking insurance recoveries and settlement withthe subcontractor. Although some uncertainty surrounds the final outcome, the expectation is that it will not have a material impact on Aker Solutions’financial position or results.Legal proceedingsGiven the scope of the group’s worldwide operations, group companies are inevitably involved in legal disputes in the course of their activities. Provisionshave been made to cover the expected outcome of the disputes in so far as negative outcomes are likely and reliable estimates can be made. However,the final outcome of these cases will always be subject to uncertainties, and resulting liabilities may exceed recorded provisions.Blind FaithAker Solutions has delivered a semi-submersible hull for Chevron Corporation’s Blind Faith platform. The platform has been installed in the Gulf of Mexico,and production started in November <strong>2008</strong>. Aker Solutions has initiated arbitration proceedings regarding compensation for various changes to the workand associated acceleration work. Chevron Corporation has presented various guarantee claims against Aker Solutions and initiated a separate arbitrationprocess in Houston. The disputes relate to both the contract for the construction and delivery of the hull and the separate contract for the tow andinstallation of the platform. Hearings in both cases are to commence in the first quarter of <strong>2010</strong> and should be completed in the second or third quarter of<strong>2010</strong>. A final award is expected in the third quarter of <strong>2010</strong>. Although there can be no assurance regarding the outcome, the expectation is that this will nothave a material impact on Aker Solutions’ financial position or results.Hitachi–Council Bluffs power plantIn 2003, Hitachi America, Ltd (Hitachi) entered into a contract with Aker Construction, Inc (ACI) for the engineering, underground work, structuralerection, boiler, turbine, Air Quality Control System (AQCS) and ancillary work for a 790-megawatt pulverized coal-fired power plant to be delivered to theMidAmerican Energy Company in Council Bluffs, Iowa. The original value of the contract was USD 331 million.Both ACI’s subcontractor AZCO Inc (AZCO) and Hitachi have filed various claims against ACI. ACI has disputed these claims and filed counterclaimsagainst Hitachi and AZCO in late <strong>2007</strong>. The disputes between Hitachi and ACI and ACI and AZCO were consolidated into a single arbitration case, whichis ongoing in Chicago, Illinois. The arbitration proceedings have been divided in two phases. Phase one hearings were completed in June <strong>2009</strong>, includingall matters concerning AZCO. Both AZCO and ACI were successful in these hearings and were awarded damages and legal fees against Hitachi for therelated claims. The awards have been paid. Hearings on all remaining issues are to commence in March <strong>2010</strong>, and a final award is expected in the thirdquarter of <strong>2010</strong>. Although there can be no assurance with regards to the final arbitration award, the expectation is that this will not have a material impacton Aker Solutions’ financial position or results.Aker Solutions annual report <strong>2009</strong> 99
Our performanceNotes to the accountsNote 33: Number of employees (unaudited)<strong>2009</strong> <strong>2008</strong>Energy Development & Services 9 535 9 861Subsea 5 276 5 251Products & Technologies 3 027 2 860Process & Construction 3 343 4 098Other 952 1 290Total Aker Solutions employees 22 133 23 360Contract staff 7 804 10 601Total 29 937 33 961Employees in Norway 11 189 11 464Employees outside Norway 10 944 11 896Total Aker Solutions employees 22 133 23 360In the first quarter <strong>2009</strong>, Aker Solutions reorganised its segments. Prior year numbers are restated, see note 8 Operating segments.Note 34: Group companies as of 31 December <strong>2009</strong>Company Location Ownership (percent) 1Aker Solutions ASA Fornebu, Norway 100Aker Advantage Pty Ltd Melbourne, Australia 100Aker Marine Contractors Pty Ltd Perth, Australia 100Aker Process Systems Pty Ltd Welshpool, Australia 100Aker Solutions Australia Pty Ltd Melbourne, Australia 100Aker Solutions Oil & Gas Australia Pty Øltd Melbourne, Australia 100Aker Subsea Pty Ltd Melbourne, Australia 100Aker Wirth Australia Pty Argenton, Australia 75Aker Solutions Belgium NV/SA Antwerp, Belgium 100Aker Oilfeld Services Ltda Rio de Janeiro, Brazil 100Aker Solutions do Brasil Ltda Curitiba, Brazil 100Aker Chemetics Offshore Services Inc Vancouver, Canada 100Aker Construction Canada Ltd Ontario, Canada 100Aker Solutions Canada Inc Vancouver, Canada 100Aker Solutions Oilfield Services Canada Inc St. John’s Newfoundland, Canada 100Aker Solutions Chile S.A. Santiago, Chile 100Aker Cool Sorption (Beijing) Technology co Ltd Beijing, China 100Aker E&C (Shanghai) Co Ltd Shanghai, China 100Aker Projects (Shanghai) Co Ltd Shanghai, China 100Aker Global Employment Ltd Limasol, Cyprus 100Aker Solutions Cyprus Ltd Limasol, Cyprus 100Aker Cool Sorption AS Glostrup, Denmark 100Aker Operations APS Glostrup, Denmark 100Aker Offshore OY Pori, Finland 100Aker Process Systems SAS Vincennes Cedex, France 100Aker Process GmbH Lagenfeld, Germany 100Aker Wirth GmbH Erkelenz, Germany 75Aker MH (India) Pvt Ltd Mumbai, India 51Aker Powergas Pvt Ltd Mumbai, India 64PT Aker Solutions E & C Indonesia Snd Bhd Jakarta, Indonesia 100PT Aker Solutions Indonesia Jakarta, Indonesia 100<strong>Kvaerner</strong> (Ireland) Ltd Dublin, Irelandt 100DOS Marine LLP Aktau, Kazakhstan 100TNT Company LLP Aktau, Kazakhstan 100Aker Engineering International Sdn Bhd Kuala Lumpur, Malaysia 100100Aker Solutions annual report <strong>2009</strong>
Our performanceNotes to the accountsCompany Location Ownership (percent) 1Aker Engineering Malaysia Snd Bhd Kuala Lumpur, Malaysia 90Aker Process Systems Asia Pacific Sdn Bhd Shah Akam, Malaysia 100Aker Solutions India Snd Bhd Kuala Lumpur, Malaysia 100Aker Solutions Malaysia Snd Bhd Kuala Lumpur, Malaysia 100Phoenix Polymers Malaysia Ltd Kuala Lumpur, Malaysia 100Aker Solutions Asia Pacific Snd Bhd Kuala Lumpur, Malaysia 100Aker Solutions (Mauritius) Ltd Port Louis, Mauritius 100Aker Solutions SA de CV Lomas de Chaputtepec, Mexico 100Aker Advantage BV Gravenhage, Netherlands 100Aker Oilfield Services BV Amsterdam, Netherlands 100Aker Process BV Zoetermeer, Netherlands 100Aker Process Engineering Services BV Maastrichts, Netherlands 100Aker Solutions BV Zoetermeer, Netherlands 100Caspian Sea Solutions BV Zoetermeer, Netherlands 100Aker Solutions Nigeria Ltd Lagos State, Nigeria 100Aker Academy AS Fornebu, Norway 100Aker Advantage AS Bergen, Norway 100Aker Business Services AS Fornebu, Norway 100Aker Carbon AS Lysaker, Norway 100Aker Contracting Russia AS Fornebu, Norway 100Aker Egersund AS Egersund, Norway 100Aker Elektro AS Stord, Norway 100Aker Engineering & Technology AS Fornebu, Norway 100Aker Geo AS Stavanger, Norway 100Aker Installation FP AS Fornebu, Norway 100Aker Insurance AS Fornebu, Norway 100Aker Insurance Services AS Fornebu, Norway 100Aker Jacket Technology AS Verdal, Norway 100Aker Kværner Contracting International (Spain) AS Fornebu, Norway 100Aker Kværner Contracting Italy AS Fornebu, Norway 100Aker Marine Contractors AS Fornebu, Norway 100Aker Marine Contractors International AS Fornebu, Norway 100Aker MH AS Kristiansand, Norway 100Aker O&G Group AS Fornebu, Norway 100Aker Offshore Partner AS Stavanger, Norway 100Aker Oilfield Services AS Oslo, Norway 100Aker Oilfield Services Operations AS Oslo, Norway 100Aker Oilfield Services Shipholding AS Oslo, Norway 100Aker Operations AS Stavanger, Norway 100Aker P&C Americas AS Fornebu, Norway 100Aker P&C Europe AS Fornebu, Norway 100Aker P&C Group AS Fornebu, Norway 100Aker Piping Tecnology AS Verdal, Norway 100Aker Porsgrunn AS Porsgrunn, Norway 100Aker Process System International AS Fornebu, Norway 100Aker Process Systems AS Fornebu, Norway 100Aker Pusnes AS Arendal, Norway 100Aker Sakkyndig Virksomhet AS Verdal, Norway 100Aker Solutions AS Fornebu, Norway 100Aker Solutions Contracting AS Lysaker, Norway 100Aker Stord AS Stord, Norway 100Aker Subsea AS Fornebu, Norway 100Aker Subsea Russia AS Fornebu, Norway 100Aker Valves AS Stord, Norway 100Aker Verdal AS Verdal, Norway 100Aker Well Service AS Stavanger, Norway 100AKOFS 1 AS Oslo, Norway 100AKOFS 2 AS Oslo, Norway 100AKOFS 4 AS Oslo, Norway 100AKOFS Angola AS Oslo, Norway 100Aker Solutions annual report <strong>2009</strong> 101
Our performanceNotes to the accountsCompany Location Ownership (percent) 1Drilltech AS Kristiansand S, Norway 100First Interactive AS Stavanger, Norway 60Fornebu Gate 2 AS Fornebu, Norway 100Jåttåvågen AS Stavanger, Norway 100KB eDesign AS Oslo, Norway 100Kogas AS Fornebu, Norway 100Kværner Engineering AS Abu Dhabi Branch Fornebu, Norway 100Kværner Eureka AS Tranby, Norway 100Maritime Promeco AS Kristiansand S, Norway 100Midsund Bruk AS Midsund, Norway 100Norwegian Contractors AS Fornebu, Norway 100Step Offshore AS Hvalstad, Norway 100Stord Montasje AS Stord, Norway 100Stord Verft AS Stord, Norway 100Subsea Africa AS Oslo, Norway 100Aker Solutions Peru SA San Isidro, Peru 100Aker <strong>Kvaerner</strong> Caribe LLP San Juan, Puerto Rico 98Aker <strong>Kvaerner</strong> Gotech LLC Al-Khobar, Saudi Arabia 51Aker Process Gulf Ltd Al-Khobar, Saudi Arabia 100Aker MH (Singapore) Pte Ltd Singapore, Singapore 100Aker Solutions (Services) Pte Ltd Singapore, Singapore 100Aker Solutions Singapore Pte Ltd Singapore, Singapore 100Aker Wirth SCS Singaprore Pty Singapore, Singapore 75Wirth CC Südafrica Germiston, South Africa 75Wirth Mining Service Pty Ltd Middelburg, South Africa 75Aker Pusnes Korea Co Ltd Pusan, South Korea 80<strong>Kvaerner</strong> Pulping SL Barcelona, Spain 100<strong>Kvaerner</strong> Water AB Ørnskjøldsvik, Sweden 100Aker Cool Sorption Siam Ltd Rayong, Thailand 99Aker Cool Sorption Thailand Ltd Rayong, Thailand 100Aker <strong>Kvaerner</strong> (Thailand) Ltd Bangkok, Thailand 100Aker <strong>Kvaerner</strong> E&C (Thailand) Ltd Bangkok, Thailand 100Aker <strong>Kvaerner</strong> E&C Holdings (Thailand) Ltd Bangkok, Thailand 100Aker Advantage Ltd London, UK 100Aker Business Services Ltd London, UK 100Aker Engineering & Technology Ltd London, UK 100Aker MH UK Ltd Aberdeen, UK 100Aker Offshore Partner Ltd London, UK 100Aker Process Ltd London, UK 100Aker Process Systems Ltd Aberdeen, UK 100Aker Qserv Ltd Aberdeen, UK 100Aker Solutions Angola Ltd Maidenhead, UK 100Aker Solutions DC Trustees Ltd London, UK 100Aker Solutions E & C International Ltd London, UK 100Aker Solutions E&C Ltd Stockton on Tees, UK 100Aker Solutions India Ltd Cardiff, UK 100Aker Subsea Ltd Maidenhead, UK 100Aker Well Services Ltd Aberdeen, UK 100Phoenix Polymers International Ltd Aberdeen, UK 100Qserv Pipeline & Process Ltd London, UK 100Woodfield Systems Co Ltd Kent, UK 100Aker <strong>Kvaerner</strong> Well Service LLC Muscat, United Arab Emirates 70Aker MH FZE Dubai, United Arab Emirates 100Aker Advantage Inc Houston, USA 100Aker Business Services Inc Houston, USA 100Aker Construction Inc Houston, USA 100Aker Field Development Inc Houston, USA 100Aker Industrial Constructors Inc Pennsylvania, USA 100Aker <strong>Kvaerner</strong> Pharmaceuticals LLC Houston, USA 100Aker <strong>Kvaerner</strong> Power Inc Charlotte, USA 100102Aker Solutions annual report <strong>2009</strong>
Our performanceNotes to the accountsCompany Location Ownership (percent) 1Aker <strong>Kvaerner</strong> Process Systems US Inc Houston, USA 100Aker <strong>Kvaerner</strong> US LLP Houston, USA 100Aker <strong>Kvaerner</strong> Willfab Inc Williamsport, USA 100Aker Marine Contractors US Inc Houston, USA 100Aker Metals Inc Tuscon, USA 100Aker MH Inc Katy, USA 100Aker Michigan Inc Michigan, USA 100Aker Oil & Gas US LLC Houston, USA 100Aker P&C Inc Houston, USA 100Aker P&C US Inc Houston, USA 100Aker Plant Services Group Inc Houston, USA 100Aker Solutions Americas Inc Wilmington, USA 100Aker Solutions Chile Corporation Houston, USA 100Aker Solutions US Inc Houston, USA 100Aker Solutions USA Corporation Houston, USA 100Aker Strategic Operations Inc Washington, USA 100Aker Subsea Inc Houston, USA 100Aker US Holdings Inc Houston, USA 100Aker Well Services Inc Houston, USA 100Aker Wirth International LLP Houston, USA 68Aker Wirth Management Inc Dover, USA 75DSI Constructors Houston, USA 100<strong>Kvaerner</strong> Process Services Inc Houston, USA 100RIG Specialities Inc Houston, USA 100Wirth Service Inc North Charleston, USA 751) Ownership corresponding to the percentage of voting shares.Note 35: Subsequent eventsDividendThe Board of Directors of Aker Solutions will propose an ordinary dividend of NOK 2.60 per share.AFP (Contractual early retirement scheme)Due to a change in legislation, the existing AFP pension plan related to early retirement benefits will be curtailed for Norwegian employees born after31 December 1948. For effected employees, the deferred actuarial gains and losses will be recognized in the first quarter <strong>2010</strong>. The existing AFP plan hasbeen replaced by a multi-employer plan which is expected to be treated as a defined contribution plan. Aker Solutions is currently assessing the impact onthe financial statements but believes it will recognise a gain from this change.Aker Solutions annual report <strong>2009</strong> 103
Our performance<strong>Annual</strong> accountsAker Solutions ASA:Income statement 1.1 – 31.12Amounts in NOK million Note <strong>2009</strong> <strong>2008</strong>Operating revenues 18 22Operating expenses 2 (113) (212)Operating loss (95) (190)Income from investments in subsidiaries 900 -Net financial items 3 307 472Profit before tax 1 112 282Tax 4 (60) (77)Profit for the period 1 052 205Distributed as follows:Proposed dividends 701 430Other equity 351 (225)Profit for the period 1 052 205Group contribution 260 -104Aker Solutions annual report <strong>2009</strong>
Our performance<strong>Annual</strong> accountsAker Solutions ASA:Balance sheet as of 31.12Amounts in NOK million Note <strong>2009</strong> <strong>2008</strong>ASSETSDeferred tax asset 4 16 -Investments in group companies 5 7 071 6 744Investments in associates - 270Non-current interest-bearing receivables from group companies 7 13 993 -Other non-current interest-bearing receivables 8 178 90Total non-current assets 21 258 7 104Current interest-bearing receivables from group companies 7 3 770 14 996Non-interest bearing receivables from group companies 7 1 469 2 764Other current receivables 9 326 1 168Cash and cash equivalents 7 1 100 1 404Total current assets 6 665 20 332Total assets 27 923 27 436LIABILITIES AND SHAREHOLDERS' EQUITYIssued capital 548 548Treasury shares (9) (10)Share premium reserve 4 279 4 279Other equity 3 509 3 105Total equity 6 8 327 7 922Non-current borrowings 10 6 689 6 373Deferred tax liability 4 - 14Total non-current borrowings 6 689 6 387Current borrowings 104 -Current borrowing from group companies 7 10 918 9 006Provision for dividend 6 701 430Non interest-bearing liabilities from group companies 7 821 1 284Other current liabilities 9 363 2 407Total current liabilities 12 907 13 127Total liabilities and shareholders' equity 27 923 27 436Fornebu, 3 March <strong>2010</strong>Board of Directors of Aker Solutions ASAØyvind EriksenChairmanLone Fønss Schrøder Kjell Inge Røkke Vibeke HammerMadsenMikael LiliusIda HelliesenAtle Teigland Åsmund Knutsen Arild Håvik Arve Toft Simen LieunghPresident & CEOAker Solutions annual report <strong>2009</strong> 105
Our performance<strong>Annual</strong> accountsAker Solutions ASA:Statement of cash flow 1.1 – 31.12Amounts in NOK million <strong>2009</strong> <strong>2008</strong>Profit before tax 1 112 282Changes in other net operating assets (525) 1 742Net cash from operating activities 587 2 024Acquisition of businesses - (167)Disposal of businesses - 112Net cash from investing activities - (55)Proceeds from borrowings 2 850 4 802Repayment of borrowings (2 480) -Changes in net borrowings from group companies (856) (6 345)Proceeds from employees share purchase programme 46 -Buy-back of treasury shares (20) (70)Dividends to shareholders (431) (807)Net cash from financing activities (891) (2 420)Net increase (decrease) in cash and bank deposits (304) (451)Cash and cash equivalent at the beginning of the period 1 404 1 855Cash and cash equivalent at the end of the period 1 1 100 1 4041) Unused credit facilities in NOK and EUR amounted to NOK 5.3 billion as described in note 10 Borrowings.106Aker Solutions annual report <strong>2009</strong>
Our performanceNotes to the accountsAker Solutions ASA:NotesNote 1: Accounting principlesAker Solutions ASA is a company domiciled in Norway. The accounts are presented in conformity with Norwegian legislations and Norwegian generallyaccepted accounting principles.Investment in subsidiaries and associatesInvestments in subsidiaries and associates are accounted for using the cost method in the parent company accounts. The investments are valued atcost less impairment losses. Write-down to fair value are according to good accounting practice recognised when the impairment is considered not to betemporary and reversed if the basis for the write-down is no longer present.Dividends and other distributions are recognised as income the same year as it is appropriated in the subsidiary. If the dividend exceeds accumulatedprofits in the subsidiary after the day of acquisition the payment is treated as a reduction of the carrying value of the investment.Classification and valuation of balance-sheet itemsCurrent assets and current liabilities includes items due within one year or items that are part of the operating cycle. The rest is classified as fixed assets/non-current debt.Current assets are valued at the lowest of cost and fair value. Current debt is valued at nominal value at the time of recognition.Fixed assets are valued at cost less accumulated depreciation, but are written down to fair value if impairment is not expected to be temporary. Noncurrentdebts are initially valued at transaction value less attribute transaction cost. Subsequent to initial recognition, interest-bearing long-term deptis stated at amortised cost with any difference between cost and redemption value being recognised in the income statement over the period of theborrowing on an effective interest basis.Trade receivables and other receivables are recognised at nominal value less provision for expected losses. Provision for expected losses is considered onan individual basis.The cash flow statement is established according to the indirect method. Cash and cash equivalents is the parent company’s cash as well as net depositsfrom subsidiaries in the group cash pooling systems owned by the parent company. Correspondingly the parent company’s current debt to groupcompanies will include the same net deposits in the group’s cash pooling system.Costs for purchase of treasury shares including transactional costs are accounted for directly against equity. Sale of treasury shares are done according tostock exchange quotations at the time of award and accounted for as increase in equity.Foreign currency and interest swapsCash, receivables and foreign currency debt are valued at the exchange rate at the end of the fiscal year. Subsidiaries have entered into agreements withthe parent company to hedge their foreign exchange exposure. In the parent company, this risk is hedged in the external financial markets. All agreementsare booked at fair value with any gains or losses booked against the income statement.In order to reduce the financial market exposure, interest swap agreements are entered. The market value of interest rate swaps classified as cash flowhedging (from floating to fixed interest) is accounted for directly against equity and reflected in the profit and loss in line with the future interest. Thevalue of interest rate swaps classified as fair value hedging (from fixed to floating interest) is accounted for through profit and loss. At the same time is acorresponding adjustment to the carrying value of the borrowing accounted for.TaxTax expense in the income statement comprises current tax and changes in deferred tax. Deferred tax is calculated as 28 percent of temporary differencesbetween accounting and tax values as well as any tax losses carry forward at the year end. Net deferred tax assets is recognised only to the extent it isprobable that it will be utilised against future taxable profitsNote 2: Operating expensesThere are no employees in Aker Solutions ASA and hence no salary or pension related costs and also no loan or guarantees related to the executivemanagement team. Group management and corporate staff are employed by other Aker Solutions companies and costs for their services as well as otherparent company costs are charged to Aker Solutions ASA. Remuneration to and shareholding of directors and senior management, Simen Lieungh andLeif Hejø Borge, are described in note 9 Salaries, wages and social security costs in the consolidated accounts.Fees to KPMG for statutory audit of the parent company and consolidated accounts amounted to NOK 3.7 million and fees for other assurance servicesamounted to NOK 0.3 million excluding VAT.Aker Solutions annual report <strong>2009</strong> 107
Our performanceNotes to the accountsNote 3: Net financial itemsAmounts in NOK million <strong>2009</strong> <strong>2008</strong>Profit from investments in other companies - 31Interest income from group companies 845 1 044Interest expense to group companies (137) (362)Net interest group companies 708 682Interest income from external companies 7 6Interest expense to external (415) (315)Net interest external (408) (309)Write-down on financial fixed assets (12) -Other financial income 4 -Net foreign exchange gain 15 68Net other financial items 19 68Net financial items 307 472Note 4: TaxAmounts in NOK million <strong>2009</strong> <strong>2008</strong>Calculation of taxable incomeProfit before tax 1 112 282Group contribution without tax (900) -Changes in non-current assets - (31)Permanent differences - 11Change in timing differences 439 (484)Transferred to (utilisation of) tax loss carried forward (289) 222Taxable income 362 -Positive and (negative) timing differencesCurrent assets (58) 339Tax loss carry forward - (289)Basis for deferred tax (58) 50Deferred tax 16 (14)Tax expenseOrigination and reversal of temporary differences 122 (135)Benefit of tax losses recognised (80) 62Payable tax (101) -Withholding tax (1) (4)Total tax expense in income statement (60) (77)108Aker Solutions annual report <strong>2009</strong>
Our performanceNotes to the accountsNote 5: Investments in group companiesAmounts in NOK million Registered office Share capitalNumber ofshares heldBook valuePercentageowner-/voting shareAker P&C Group AS Fornebu, Norway 500 500 000 1 068 100%Aker O&G Group AS Fornebu, Norway 1 110 1 110 000 5 733 100%Aker Oilfield Services AS 1 Oslo, Norway 321 10 379 470 270 32.29%Total investments in subsidiaries 7 0711) The remaining 67,71 percent of the shares in Aker Oilfield Services AS are held by Aker Solutions AS meaning that Aker Solutions ASA direct and indirect owns 100 percent of the shares.Aker Solutions ASA has in <strong>2009</strong> given group contributions with tax to tier-subsidiaries and also received group contributions without tax that exceedsretained earnings during Aker Solutions ownership period. The equity value of these are booked against the shares in the subsidiaries holding these tiersubsidiariesthereby decreasing the value of the shares in Aker P&C Group AS by NOK 121 million and increasing the shares in Aker O&G Group AS byNOK 178 million.Note 6: Shareholders’ equityAmounts in NOK millionSharecapitalTreasurysharesSharepremiumOtherequityTotalEquity as of 1 January <strong>2008</strong> 548 (9) 4 279 3 447 8 265Dividend from shares held by Aker Solutions ASA 2 2Share buy back (1) (69) (70)Profit for the period 205 205Proposed dividend (430) (430)Cash flow hedge 1 (50) (50)Equity as of 31 December <strong>2008</strong> 548 (10) 4 279 3 105 7 922Change in <strong>2008</strong> dividend (1) (1)Shares issued to employees through share program 2 44 46Share buy back (1) (19) (20)Profit for the period 1 052 1 052Proposed dividend (701) (701)Cash flow hedge 1 29 29Equity as of 31 December <strong>2009</strong> 548 (9) 4 279 3 509 8 3271) The value of interest swap agreements changing interest from floating to fixed interest is recognised directly in equity and will bereleased to income together with the corresponding interestexpense.2) The Board of Directors of Aker Solutions ASA has approved a share purchase program for employees starting from March <strong>2009</strong> and ending February <strong>2010</strong>. A corresponding program is offeredfor <strong>2010</strong>. Employees participating in the program are committed to a monthly saving and the number of shares awarded are dependant of the share price at the time of award. Participants stillholding the shares in September 2011 will receive one bonus share for every two shares bought under the program. At the end of <strong>2009</strong> a total of 831 951 shares had been bought under theprogram, the number of participants were 4 031 giving rise to 407 653 bonus shares if all current participants fulfils the criteria for bonus shares by September 2011. The costs of the programare covered by each company.3) During <strong>2009</strong> a total of 436 200 treasury shares have been acquired in the market. The number of treasury shares held by end of <strong>2009</strong> were 4 570 911 and are held for the purpose of beingused for future awards under the share saving program for employees, as settlement in future corporate acquisitions or for other purpose as decided by the Board of Directors.Proposed dividend exclude dividend on owns shares held as of 31 December.The share capital of Aker Solutions ASA is divided into 274 000 000 shares with a nominal value of NOK 2. The shares can be freely traded. An overview ofthe company’s largest shareholders is to be found on page 119 Share and shareholder information. .Aker Solutions annual report <strong>2009</strong> 109
Our performanceNotes to the accountsNote 7: Receivables and liabilities from group companiesAmounts in NOK million <strong>2009</strong> <strong>2008</strong>Group companies deposits in the cash pool system 9 076 7 964Group companies borrowing in the cash pool system (213) (1 402)Aker Solutions ASAs net borrowing in the cash pool system (7 763) (5 158)Cash and cash equivalents 1 100 1 404Current interest-bearing receivables from group companies 3 770 14 996Non-current interest-bearing receivables from group companies 13 993 -Current borrowings from group companies (10 918) (9 006)Other net interest-bearing receivables from group companies 6 845 5 990Non interest-bearing receivables from group companies 1 469 2 764Current non interest-bearing liabilities from group companies (821) (1 284)Net non interest-bearing receivables from group companies 648 1 480Total net receivables from group companies 8 593 8 874All current receivables and borrowing are due within one year.Aker Solutions ASA is the owner of the cash pool system arrangements with DnBNOR, Nordea, The Royal Bank of Scotland and Banc Itau. The cashpool systems cover a majority of the group geographically and assure good control and access to the group’s cash. Group companies’ participation inthe cash pool systems are decided by each company’s Board of Directors and confirmed by a statement of participation. The participants in the cashpool system are joint and several liable and it is therefore important that Aker Solutions as a group is financially viable and can repay deposits and carryout transactions. Any debit balance on a sub account can be set-off against any credit balance. A debit balance does hence represent a claim on AkerSolutions ASA and a credit balance a borrowing from Aker Solutions ASA.The cash pool systems were showing a net balance of NOK 1.1 billion per 31 December <strong>2009</strong>. This amount is reported in Aker Solutions ASA’s accountsas short term borrowing from group companies and as cash and cash equivalents.Aker Solutions ASA is the group’s central treasury function and enters into borrowing and deposit agreements with group companies. Deposits andborrowing are done at market terms and are dependant of the group companies’ credit rating and the duration of the borrowings.Other current receivables and other current liabilities includes unrealised forward exchange contracts with group companies as described in note 12Financial risk management and financial instruments as well as receivables and liabilities related to NOK 1.1 billion in group contributions received andNOK 362 million in group contributions paid and other short term group receivables and liabilities.Note 8: Other non-current interest-bearing receivablesAmounts in NOK million <strong>2009</strong> <strong>2008</strong>Other non-current interest-bearing receivables 178 90Total other non-current interest-bearing receivables 178 90Other interest-bearing receivables consist of loans to the two jointly controlled companies Aker Clean Carbon NOK 36 million (5,0 percent interest) andAker Dof Deepwater AS NOK 140 million (4,0 percent interest). I addition to this it comprises a deposit in Stiftelsen Aker Solutions Kompensasjonsordingat NOK 2 million.110Aker Solutions annual report <strong>2009</strong>
Our performanceNotes to the accountsNote 9: Other current receivables and current liabilitiesAmounts in NOK million <strong>2009</strong> <strong>2008</strong>Other current receivables 326 1 168Other current liabilities (363) (2 407)Net other current liabilities excluding tax and dividend (37) (1 239)Dividend (701) (430)Deferred tax assets 16 -Deferred tax liabilities - (14)Net other current liabilities (722) (1 683)Other current receivables and other current liabilities includes unrealised forward exchange contracts with external counterparts as well as unrealisedreceivables and losses related to interest rate swaps and accrued costs as described in note 12 Financial risk management and financial instrument.Note 10: BorrowingsThis note provides information about the contractual terms of the group’s interest-bearing loans and borrowings which are measured at amortised cost.For more information about the the group’s exposure to interest rates, foreign currency and liquidity risk, see note 12 Financial risk management andfinancial instruments.<strong>2009</strong>Amounts in millionCurrencyNominalcurrencyvalueBookvalueInterestrateFixedinterestmarginInterestcouponMaturitydateInterest termsISIN NO 0010341324 NOK 572 570 2.01% 1.05% 3.06% 01.12.2011 Floating, 3 mthsISIN NO 0010341332 NOK 300 297 2.01% 1.35% 3.36% 01.12.2013 Floating, 3 mthsISIN NO 0010342587 NOK 150 149 6.00% 6.00% 01.12.2013 Fixed, annualISIN NO 001050461.6 NOK 1 913 1 953 8.70% 8.70% 26.06.2014 Fixed, annualISIN NO 001050460.8 NOK 187 185 2.13% 4.75% 6.88% 26.06.2014 Floating, 3 mthsTotal bonds 1 3 154Revolving credit facility EUR 750 2 886 0.83% 25.10.2012 LIBOR + Margin 2Revolving credit facility NOK 2 000 - 1.75-2.50% 19.12.2011 LIBOR + Margin 3Revolving credit facility NOK 750 753 2.00% 2.00% 4.00% 01.10.2014 NIBOR, 3 mthsTotal credit facility 3 639Total borrowings 6 793Current borrowings 104Non-current borrowings 6 689Total borrowings 6 793Aker Solutions annual report <strong>2009</strong> 111
Our performanceNotes to the accounts<strong>2008</strong>Amounts in millionCurrencyNominalcurrencyvalueBookvalueInterestrateFixedinterestmarginInterestcouponMaturitydateInterest termsISIN NO 0010341316 NOK 500 494 5.93% 0.70% 6.63% 01.12.<strong>2009</strong> Floating, 3 mthsISIN NO 0010341324 NOK 650 643 5.93% 1.05% 6.98% 01.12.2011 Floating, 3 mthsISIN NO 0010341332 NOK 300 297 5.93% 1.35% 7.28% 01.12.2013 Floating, 3 mthsISIN NO 0010342587 NOK 150 148 6.00% 6.00% 01.12.2013 FixedTotal bonds 1 1 582Revolving credit facility EUR 750 4 791 0.50% 25.10.2012 LIBOR + Margin 2Revolving credit facility NOK 2 000 - 1.75-2.50% 19.12.2011 LIBOR + Margin 3Total credit facility 4 791Total borrowings 6 3731) The book value is calculated by reducing the nominal value of NOK 3 122 million by total issue costs related to the new financing of NOK 12 million (NOK 28 million in <strong>2008</strong>). It also comprisesaccrued interest and issue costs related to the bonds.2) The margin applicable to the facility is decided by a price grid based on the gearing ratio. Commitment fee is 40 percent of the margin.3) The margin applicable to the facility is decided by a price grid based on the gearing ratio. Commitment fee is 50 percent of the margin.Norwegian bondsAker Solutions has issued five bonds which mature in two, four (two loans) and five years (two loans). The bonds which mature in two and four years wereissued on 1 December 2006, while two new bond issues were made on 26 June <strong>2009</strong>. The bonds are denominated in Norwegian kroner and are issuedin the Norwegian bond market. Three of the bonds are issued based on a floating interest rate plus a predefined margin. The bonds with notional value ofNOK 150 million and NOK 1 913 million have fixed interest rates of 6.0 and 8.7 percent respectively.The bonds are issued with Norsk Tillitsmann as trustee and the loan agreements are based on Norsk Tillitsmann’s standard loan agreement for suchbonds. The bonds are unsecured on a negative pledge basis and include no dividend restrictions.The bonds issued in 2006 are listed on the Oslo Stock Exchange.Bank debtThe bank debt consists of two revolving credit facilities of EUR 750 million with initial maturity in October 2012 and NOK 2 000 million maturing inDecember 2011. The facilities are provided by a bank syndicate consisting of Nordic and high quality international banks. The EUR 750 million facility wasdrawn to NOK 2 900 million at year end <strong>2009</strong> and the NOK 2 000 million facility was undrawn. In addition, a new credit facility of NOK 750 million withinitial maturity in October 2014 was established during <strong>2009</strong> and was fully drawn at the balance-sheet date. The terms and conditions include restrictionswhich are customary for this kind of facility, including inter alia negative pledge provisions and restrictions on acquisitions, disposals and mergers. Thereare also certain changes of control provisions included. The facility includes no dividend restrictions and is unsecured.The financial covenants are based on two sets of key financial ratios; a gearing ratio based on gross debt/EBITDA and an interest coverage ratio based onEBITDA/net finance costs. The financial covenants are tested on a quarterly basis. The margin applicable to the facility is based on a price grid determinedby the gearing ratio. See note 5 Financial risk management and exposures for more information regarding capital risk in the group.Aker Solutions strategy is to have between 30-50 percent of borrowings at fixed interest rates. To the extent that this is not reflected in the loanagreements, swap transactions are entered into. The revolving facility is hedged to fixed rate through an interest rate swap for NOK 1 100 million through<strong>2010</strong>.112Aker Solutions annual report <strong>2009</strong>
Our performanceNotes to the accountsFinancial liabilities and the period in which they are mature<strong>2009</strong>Amounts in NOK millionBookvalueTotalundiscountedcash flow6 mthsand less6-12mths1-2years2-5yearsMore than5 yearsISIN NO 0010341324 (570) (572) - - (572) - -ISIN NO 0010341332 (297) (300) - - - (300) -ISIN NO 0010342587 (149) (150) - - - (150) -ISIN NO 001050461.6 (1 953) (1 913) - - - (1 913) -ISIN NO 001050460.8 (185) (187) - - - (187) -Interest on bonds (834) (187) (29) (216) (402) -Total bonds (3 154) (3 956) (187) (29) (788) (2 952) -Revolving credit facility (EUR 750 million) (2 886) (2 900) - - - (2 900) -Revolving credit facility (NOK 750 million) (753) (750) - - - (750) -Total credit facility (3 691) (3 650) - - - (3 650) -Interest on revolving credit facility and other bank debt (550) (66) (80) (166) (238) -Total borrowings (6 793) (8 156) (253) (109) (954) (6 840) -<strong>2008</strong>Amounts in NOK millionBookvalueTotalundiscountedcash flow6 mthsand less6-12mths1-2years2-5yearsMore than5 yearsISIN NO 0010341316 (494) (500) - (500) - - -ISIN NO 0010341324 (643) (650) - - - (650) -ISIN NO 0010341332 (297) (300) - - - (300) -ISIN NO 0010342587 (148) (150) - - - (150) -Interest on bonds (233) (42) (37) (45) (109) -Total bonds 1 (1 582) (1 833) (42) (537) (45) (1 209) -Revolving credit facility (EUR 750 million) (4 776) (5 523) (100) (100) (183) (5 140) -Total borrowings (6 358) (7 356) (142) (637) (228) (6 349) -Note 11: GuaranteesAmounts in NOK million <strong>2009</strong> <strong>2008</strong>Parent company guarantees to group companies 1 37 341 44 594Counter guarantees for bank/surety bonds 2 7 284 7 855Total guarantee liabilities 44 625 52 4491) Parent Company Guarantees to support subsidiaries in contractual obligations towards clients.2) Bank guarantees and surety bonds are issued on behalf of Aker Solutions subsidiaries, and counter indemnified by Aker Solutions ASA.Aker Solutions annual report <strong>2009</strong> 113
Our performanceNotes to the accountsNote 12: Financial risk management and financial instrumentsCurrency risk and balance sheet hedgingAmounts in NOK million Assets Liabilities<strong>2009</strong>Options 1 (2)Forward exchange contracts with group companies 353 (370)Forward exchange contracts with external counterparts 274 (290)Total 628 (662)Aker Solutions ASA enters into approximately 10 000 currency hedging contracts with subsidiaries a year at a total value of about NOK 51 billion. Largecontracts are hedged back-to-back with external banks, while minor contracts are hedged after internal netting. Contracts that are hedged directlyrepresents about 80 percent of the total exposure but only a small number of the total contracts. The treasury function within Aker Solutions ASA has amandate to hold small positions in the currency and interest markets. The mandate has limits that are strictly defined and is operated under a strict stoplossregime. Open positions are continuously monitored at a market to market basis. All instruments are booked at fair value as per 31 December.Equity investments in foreign subsidiaries are normally not hedged.Interest rate risk<strong>2009</strong>Amounts in NOK million Assets LiabilitiesInterest rate swaps - cash flow and fair value hedge 2 (28)Interest rate swaps not subject to hedge accounting 4 (4)Total 6 (32)According to internal policy, about 30-50 percent of the company’s gross external borrowing should be at fixed interest rates with duration according tothe remaining duration of the borrowing. As per year end about 40 percent of the external borrowings were at fixed interest. Hedge accounting is appliedthrough both cash flow and fair value hedging.As of 31 December <strong>2009</strong>, Aker Solutions group had one bond of NOK 150 million with fixed interest rates of 6 percent and one bond of NOK 1 913 millionwith a fixed interest rate of 8.7 percent. At year end, there were interest rate swaps with floating interest hedging NOK 1 100 million of the fixed interestbonds. In addition, Aker Solutions had three bonds totalling NOK 1 059 million at floating interest rates and hereof NOK 400 million were swapped tofixed interest. NOK 2 000 million of drawings under committed facilities are swapped to 12 months fixed rate from 15 January <strong>2009</strong>. As of 15 January<strong>2010</strong>, these interest swaps are replaced with new 12 months fixed rate interest swaps of NOK 1 100 million. A credit facility of NOK 750 million withfloating interest was established in <strong>2009</strong> where NOK 375 million are swapped to fixed interest. Floating interest is mainly tied to NIBOR and LIBOR.Hedge accounting is applied using the cash flow hedge accounting model which means that gains and losses on interest rate swap from floating to fixedinterest rates as of 31 December <strong>2009</strong> are recognised in the hedging reserve in equity and will be continuously released to the income statement until therepayment of the bank borrowings. The value of interest rate swaps classified as fair value hedging (from fixed to floating interest) is accounted for throughprofit and loss. At the same time is a corresponding adjustment to the carrying value of the borrowing accounted for. Fair value of open interest rate swapwere negative NOK 26 million as of 31 December (negative NOK 52 million in <strong>2008</strong>).Credit riskCredit risk relates to loans to subsidiaries and associated companies, overdraft in the group cash pool, hedging contracts, guarantees to subsidiariesand deposits with external banks. Loans to subsidiaries are assessed by the internal credit committee. Loss provisions are made in situations of negativeequity and were the company is not expected to be able to fulfil it’s loan obligations from future earnings. External deposits and forward contracts are doneaccording to a list of approved banks and primarily with banks were the company also have a borrowing relation. The existence of netting agreementsbetween Aker Solutions ASA and the relations banks reduces the credit risk.Liquidity riskLiquidity risk relates to the risk that the company will not be able to meet its debt and guarantee obligations and are managed through maintainingsufficient cash and available credit facilities. The development in the groups and thereby Aker Solutions ASA available liquidity is continuously monitoredthrough weekly and monthly cash forecasts, annual budgets and long term planning.Note 13: Related partiesAker Solutions ASA’s contract with Intellectual Property Holding AS and agreement with Aker ASA regarding pension obligation in US are described innote 7 Related parties to the consolidated accounts.114Aker Solutions annual report <strong>2009</strong>
Our performanceAuditor’s reportAker Solutions annual report <strong>2009</strong> 115
Our performanceShare and shareholder informationOpen and direct dialogueAker Solutions is committed to maintaining an open and direct dialoguewith its investors, analysts and the financial market in general.One goal is that the share price will reflectthe company’s underlying value bymaking all share price-relevantinformation available to the market at theright time. Weight is also given to equaltreatment of the various players in thefinancial market concerning access tosuch information. Aker Solutions’objective is that its shareholders willachieve a competitive return on theirshares over time through a combinationof dividend, share buy-backs and the risein the share price.Dividend policyThe company’s goal is that the averagedividend over time should amount to 30-50 percent of the Aker Solutions group’snet profit through cash payments and/orshare buy-backs. The size of the dividendis assessed in relation to alternative usesfor the funds and the desire to continuestrengthening the financial structure. TheBoard will propose to the <strong>Annual</strong> GeneralMeeting that a total dividend of NOK 2.60per share be paid for <strong>2009</strong>, correspondingto 30 percent of the net annual profit pershare.The following table shows thedividends paid by Aker Solutions for theperiod 2006–<strong>2009</strong>:YearDividend2006 NOK 22006 – extraordinary NOK 6<strong>2007</strong> NOK 3<strong>2008</strong> NOK 1.60<strong>2009</strong> – proposed NOK 2.60Shares and share capitalAker Solutions ASA has 274 000 000ordinary shares with a par value of NOK 2(see the consolidated accounts on page53). It had 9 704 shareholders as of 31December <strong>2009</strong>, of whom 1 226 (12.3percent) were non-Norwegian. AkerSolutions has a single share class. Eachshare carries one vote. The companyowned 4 570 911 of its own (treasury)shares at 31 December <strong>2009</strong>, or 1.7percent of the total. No shares wereissued in <strong>2009</strong>.Stock exchange listingThe Aker Solutions share is listed on theOslo Stock Exchange’s main OBX list(ticker: AKSO), and is registered in theNorwegian Central Securities Depositorywith DnB NOR as registrar. Its securitiesregistration number is ISINNO0010215684. Aker Solutions ASA waslisted on the Oslo stock exchange on 2April 2004.Principal shareholderAker Holding ASAker ASAAker Solutions ASAAker ASA: 60%The Norwegian Government: 30%SAAB AB: 7.5%Investor AB: 2.5%Aker Holding AS: 40.27%The largest shareholder in Aker Solutionsis Aker Holding AS, which owned 40.27percent of the shares as of 31 December<strong>2009</strong>. Aker ASA holds a controlling 60percent stake in Aker Holding. TheNorwegian Government owns 30 percentof Aker Holding’s shares and Swedishcompanies SAAB AB and Investor ABhold 7.5 percent and 2.5 percentrespectively.For more information on the principalshareholder, see the chapter concerningcorporate governance on page 124.Current board mandatesThe <strong>Annual</strong> General Meeting of AkerSolutions held on 2 April <strong>2009</strong> mandatedthe Board of Directors to acquire thecompany’s own shares up to a total parvalue of NOK 54 800 000. This mandatealso covers the use of treasury shares assecurity. The lowest price per share to bepaid under this mandate is NOK 1, thehighest is NOK 300. The Board isotherwise free to determine the way inwhich treasury shares should be boughtor sold. The mandate is valid until the<strong>2010</strong> <strong>Annual</strong> General Meeting or until 30June <strong>2010</strong>, whichever occures first.Acquisition of own sharesThe company’s share buy-backprogramme continued under the Boardmandate granted by the <strong>2009</strong> <strong>Annual</strong>General Meeting. The Board hasauthorised the company’s management tobuy back up to five percent of the outstandingshares. This programme runsuntil the next <strong>Annual</strong> General Meeting on8 April <strong>2010</strong>. As of 28 February <strong>2010</strong>,436 200 shares had been acquired underthe mandate. The Board of Aker Solutionswill propose that the mandate beextended from the date of the <strong>Annual</strong>General Meeting’s decision until the next<strong>Annual</strong> General Meeting.Stock option programmeAker Solutions ASA had no stock optionprogrammes as of 31 December <strong>2009</strong>.Share purchase programme foremployeesAker Solutions announced in January<strong>2009</strong> that it would offer some 19 000 ofits employees in Norway, the Netherlands,the UK, Chile, Canada and the US 1 theopportunity to buy shares in the companyat a discount. This discount has been setat NOK 1 500 per employee, and the totalamount each employee could spend wasNOK 15 000 for the 12 month programme,which started in March <strong>2009</strong>. The purchaseprice per share is equal to the average(volume weighted) price of the AkerSolutions ASA share on the Oslo StockExchange on the final trading day beforethe shares are allocated. Employees whokeep their shares until 1 September 2011and who are continuously employed byAker Solutions throughout the time theyhold their shares, will be entitled to theaward of free bonus shares at the rate ofone bonus share for every two AkerSolutions ASA shares held under theprogramme.The share purchase programme will becontinued on the same terms in <strong>2010</strong>.Approximately 17 200 employees wereinvited to participate in the continued1) Employees in the US were only able to participateafter all formal approvals had been secured. Theyjoined the programme in August, and accordinglyparticipated for just seven months, compared with12 months for employees in the other countries.116Aker Solutions annual report <strong>2009</strong>
Our performanceShare and shareholder informationprgramme in January <strong>2010</strong>. 3 759 signedup.Investor relationsAker Solutions wants to maintain a goodand open dialogue with shareholders,financial analysts and the financialmarkets in general. In addition tomeetings with analysts and investors, thecompany stages regular presentations inimportant European and US financialcentres. The company’s website atwww.akersolutions.com provides theopportunity to subscribe to news aboutAker Solutions via e-mail. All pressreleases, including archived material, areavailable on the site. That also applies tointerim and annual reports, prospectuses,presentations, the company’s articles ofassociation, its financial calendar, investorrelations and corporate governancepolicies, and other information. AkerSolutions holds an annual capital marketsday open to all stakeholders, where keyexecutives provide updated informationabout the business and market conditions.Shareholders can contact the company atir@akersolutions.com. Aker Solutions hasbeen awarded the information andEnglish symbols presented by the OsloStock Exchange to companies whichsatisfy its recommendations on informingthe stock market. For details, seewww.oslobors.no.Electronic annual and interimreportsAker Solutions urges everyone who isable to receive its annual reportselectronically to subscribe to the VPSInvestor service. <strong>Annual</strong> reports will thenbe sent by e-mail in PDF format. Thisservice is intended primarily forNorwegian shareholders. The electronicversion is distributed at the same time asthe printed version to those shareholderswho have requested it. Interim reports aredistributed only in electronic form, and areavailable from the company’s website andother sources. Shareholders unable toreceive interim reports in electronic formcan subscribe to the printed version bycontacting the IR staff at Aker Solutions.Indexed share price development in NOK■ Aker Solutions ■ Oslo Børs benchmark index6005004003002001000Jan2005July2005<strong>2009</strong> share dataJan2006July2006Jan<strong>2007</strong><strong>2009</strong> <strong>2008</strong>Highest closing share price NOK 77.20 157.00Lowest closing share price NOK 29.40 26.15Average closing share price NOK 53.09 101.80Closing price as of 31 December NOK 75.45 45.00Own (treasury) shares as of 31 Dec. Number of shares 4 570 911 4 966 830Shares issued and outstanding as of 31 Dec. Number of shares 274 000 000 274 000 000Market capitalisation as of 31 Dec. NOK million 20 673 12 330Daily turnover Million shares 2 380 833 2 173 788Turnover ratio Percent 218.10 200.90Earnings per share NOK 8.40 5.34Geographical distribution of ownershipAs of 22 February <strong>2010</strong>Nationality Number of shares OwnershipNon-Norwegian shareholders 123 267 264 44.98%Norwegian shareholders 150 732 736 55.02%Total 274 000 000 100%Ownership structure by number of shares heldAs of 22 February <strong>2010</strong>Shares held Number of shareholders Share capitalJuly<strong>2007</strong>1 – 100 1 310 0.03%101 – 1000 6 788 0.83%1001 – 10 000 1 095 1.21%10 001 – 100 000 243 3.38%100 001 – 500 000 112 9.46%More than 500 000 58 85.10%Total 9 606 100%Jan<strong>2008</strong>July<strong>2008</strong>Jan<strong>2009</strong>July<strong>2009</strong>Feb<strong>2010</strong>Change in share capitalDateChange inshare capitalShare capitalin NOKNumber ofsharesPar valuein NOK31 December 2006 550 292 340 55 029 234 10.00Change in <strong>2007</strong> (2 292 340) 218 970 76631 December <strong>2007</strong> 548 000 000 274 000 000 2.0031 December <strong>2008</strong> 548 000 000 274 000 000 2.0031 December <strong>2009</strong> 548 000 000 274 000 000 2.00Aker Solutions annual report <strong>2009</strong> 117
Our performanceShare and shareholder informationNomination committeePursuant to its articles of association,Aker Solutions has a nominationcommittee with at least three members.Its composition must reflect the interestsof shareholders, and the members mustbe independent. The nominationcommittee has the following members:■■Leif-Arne Langøy (Chairman),<strong>2008</strong>-<strong>2010</strong>■■Gerhard Heiberg, <strong>2008</strong>-<strong>2010</strong>■■Kjeld Rimberg, <strong>2009</strong>-2011■■Mette Wikborg, <strong>2009</strong>-2001<strong>Annual</strong> General MeetingThe <strong>Annual</strong> General Meeting is normallyheld in late March or early April. Writtennotice is sent to all shareholdersindividually or to their custodian bank. Allrelevant information about the <strong>Annual</strong>General Meeting is also available on thecompany’s website. Shareholders or theirproxies must be physically present at theGeneral Meeting in order to vote, inaccordance with the instructions found onthe company’s website and in themeeting notice. For more information onthe <strong>Annual</strong> General Meeting, see thechapter concerning corporate governanceon page 124.The share in <strong>2009</strong>The closing share price as of 31December <strong>2009</strong> was NOK 75.45, whichgave the company a total marketcapitalisation of NOK 20 673 million. Atotal of 597 589 000 Aker Solutionsshares were traded during <strong>2009</strong>,representing 3.7 times the company’sfreely tradable stock. The latter amountedto 59.73 percent of total issued shares in<strong>2009</strong>, with the remaining 40.27 percentowned by Aker Holding AS. The sharewas traded on all the 251 possible tradingdays. The average daily volume tradedwas 2 380 833 shares, which represents aturnover rate of 218.1 percent.AnalystsThe following securities brokers provide analytical coverage of Aker Solutions (as of 22 February <strong>2010</strong>):Company Name PhoneABG Sundal Collier Anders Hagen +4722016048Arctic Securities Kjetil Garstad +4748403224Barclays Mick Pickup +442031346695CA Cheuvreux Julien Bourdier +33141897329Carnegie Chr. Frederik Lunde +472<strong>2009</strong>379Citigroup Dave Thomas +442079864030Danske Bank Endre Storløkken +4785407071Deutsche Bank Christyan F. Malek +442075458249DnBNOR Lars-Daniel Westby +4722948983Fearnley Fonds Truls Olsen +4722936393First Securities Pål H. Dahl +4723238198Goldman Sachs Henry Tarr +442075525981Handelsbanken Haakon Amundsen +4722940995HSBC David Phillips +442079912344JP Morgan Amy Wong +442073259460Bank of America Merrill Lynch Fiona Maclean +442079956099Nordea Anne S. Ulriksen +4722486867Normura Iqbal Nasim +442071023977Orion Securities Eglé Domataité +37052461919Pareto Andreas Stubsrud +4724132116Royal Bank of Scotland Phillip Lindsay +442076785486RS Platou Markets Terje Mauer +4790970424SEB Enskilda Terje Fatnes +4721008538UBS Alex Brooks +442075675804Financial calendar <strong>2010</strong>8 April <strong>Annual</strong> General Meeting <strong>2010</strong>23 April 1st quarter results <strong>2010</strong>12 August 2nd quarter results <strong>2010</strong>22 October 3rd quarter results <strong>2010</strong>2 December Capital Markets DayRegistrarShareholders can contact Aker Solutions’registrar if they have any questionsconcerning their holding:DnB NOR ASASecurities serviceStranden 21NO-0021 Oslo, NorwayTelephone: +47 22 48 27 70Telefax: +47 22 48 11 71www.dnbnor.com118Aker Solutions annual report <strong>2009</strong>
Our performanceShare and shareholder information20 largest shareholdersAs of 22 February <strong>2010</strong>Company Nominee Number of shares held OwnershipAker Holding AS 110 333 615 40.27%JPMorgan Chase Bank x 11 585 494 4.23%State Street Bank x 8 150 795 2.97%Bank of New York Mellon x 7 601 179 2.77%Folketrygdfondet 6 292 800 2.30%State Street Bank & Trust CO. x 5 718 535 2.09%JPMorgan Chase Bank x 5 442 891 1.99%Clearstream Banking CID Dept. x 5 038 134 1.84%Citibank N.A. New York Branch x 4 600 000 1.68%Aker Solutions ASA 4 450 510 1.62%Bank of New York Mellon 4 073 950 1.49%JPMorgan Chase Bank x 3 778 200 1.38%The Northern Trust C.O. x 3 465 168 1.26%Governor & the Company x 3 286 845 1.20%Bank of New York Mellon x 2 738 237 1.00%RBC Dexia Investor Services Trust x 2 317 700 0.85%Skandinaviska Enskilda Banken x 2 258 258 0.82%The Northern Trust C.O. x 2 174 151 0.79%The Northern Trust Company Sub x 2 000 000 0.73%Vital Forsikring ASA 1 900 667 0.69%Total, 20 largest shareholders 197 207 129 71.97%Other shareholders 76 792 871 28.03%Total 274 000 000 100%Aker Solutions annual report <strong>2009</strong> 119
Our performanceAnalytical informationAnalytical information Aker Solutions 1Amounts in NOK million <strong>2009</strong> <strong>2008</strong> <strong>2007</strong> 2006 2005Order backlog 31 December 56 276 58 016 58 261 59 695 48 522Order intake 52 000 55 590 57 942 62 271 51 937Revenue 54 077 58 252 57 957 50 592 36 940EBITDA 4 368 3 382 3 913 2 872 1 816EBITDA margin 8.1% 5.8% 6.8% 5.7% 4.9%Profit before tax 3 208 2 103 3 538 1 869 740Rate of taxation 27.3% 28.1% 30.4% 30.8% (42.2%)Net profit from continuing operations 2 331 1 513 2 464 1 294 1 052Interest cover 6.85 7.76 17.16 2.52 3.59Basic earnings per share 8.40 5.34 8.84 4.53 4.47Cash flow from operating activities 4 245 (868) 2 675 2 636 3 674Cash flow from investing activities (3 927) (3 732) (1 576) 985 (443)Cash flow from financing activities (278) 4 105 (3 013) (4 688) (306)Cash flow per share (2.34) 1.11 (7.82) (3.93) 11.06Total capital 39 926 42 724 28 516 31 396 26 295Borrowings 7 515 6 716 1 615 1 568 5 279Equity ratio 22.8% 20.1% 25.5% 25.8% 16.5%Liquidity ratio 113.7% 117.5% 116.0% 120.0% 124.9%Gearing ratio 72.2% 73.6% 64.6% 59.9% 74.4%Return on total capital 9.0% 7.0% 12.5% 10.2% 5.0%Return on equity 27.2% 20.0% 33.1% 21.1% 34.8%Return on capital employed 14.4% 13.9% 26.0% 22.4% 10.1%1) Continuing operations only.RevenueAmounts in NOK million 1Q08 2Q08 3Q08 4Q08 <strong>2008</strong> 1Q09 2Q09 3Q09 4Q09 <strong>2009</strong>ED&S 5 940 6 774 5 623 4 737 23 074 5 479 5 020 5 030 4 298 19 827Subsea 3 391 3 072 3 160 4 108 13 731 3 640 3 959 2 623 2 750 12 972P&T 2 898 2 804 2 433 3 556 11 691 3 363 3 071 3 073 3 222 12 729P&C 2 136 2 561 2 514 3 102 10 313 2 660 2 526 2 143 2 205 9 534Other (148) (138) (223) (48) (557) (167) (252) (304) (262) (985)Total 14 217 15 073 13 507 15 455 58 252 14 975 14 324 12 565 12 213 54 077RevenueAmounts in NOK million60 00050 000EBITDA margin10%8%Return on capital employed30%25%40 0006%20%30 00020 00010 0000<strong>2007</strong><strong>2008</strong><strong>2009</strong>4%2%0%<strong>2007</strong><strong>2008</strong><strong>2009</strong>15%10%5%0%<strong>2007</strong><strong>2008</strong><strong>2009</strong>120Aker Solutions annual report <strong>2009</strong>
Our performanceAnalytical informationEBITDAAmounts in NOK million 1Q08 2Q08 3Q08 4Q08 <strong>2008</strong> 1Q09 2Q09 3Q09 4Q09 <strong>2009</strong>ED&S 348 326 251 (1 254) (329) 350 186 281 299 1 116Subsea 318 376 426 589 1 709 364 507 248 280 1 399P&T 255 225 195 292 967 240 403 302 359 1 304P&C 153 184 205 217 759 131 80 144 129 484Other (72) 15 74 259 276 39 16 33 (23) 65Total 1 002 1 126 1 151 103 3 382 1 124 1 192 1 008 1 044 4 368EBITAmounts in NOK million 1Q08 2Q08 3Q08 4Q08 <strong>2008</strong> 1Q09 2Q09 3Q09 4Q09 <strong>2009</strong>ED&S 327 306 214 (1 279) (432) 320 152 245 223 940Subsea 275 308 350 492 1 425 269 392 135 153 949P&T 244 211 181 264 900 208 351 264 310 1 133P&C 149 181 201 211 742 126 73 138 124 461Other (98) (10) 48 192 132 13 (5) 7 (40) (25)Total 897 996 994 (120) 2 767 936 963 789 770 3 458Order IntakeAmounts in NOK million 1Q08 2Q08 3Q08 4Q08 <strong>2008</strong> 1Q09 2Q09 3Q09 4Q09 <strong>2009</strong>ED&S 3 479 3 645 5 377 4 436 16 937 5 467 15 337 1 890 4 193 26 887Subsea 3 282 3 114 1 973 2 168 10 537 2 598 2 915 5 172 1 883 12 568P&T 2 450 4 019 6 351 4 230 17 050 1 836 1 414 1 367 2 004 6 621P&C 4 173 3 560 1 574 1 644 10 951 1 093 721 823 4 276 6 913Other (101) (342) 520 38 115 (262) (276) (234) (217) (989)Total 13 283 13 996 15 795 12 516 55 590 10 732 20 111 9 018 12 139 52 000Order BacklogAmounts in NOK million 1Q08 2Q08 3Q08 4Q08 <strong>2008</strong> 1Q09 2Q09 3Q09 4Q09 <strong>2009</strong>ED&S 22 023 18 853 18 741 18 625 18 625 18 335 28 816 25 481 25 396 25 396Subsea 12 868 13 073 13 162 11 204 11 204 9 429 11 431 13 249 12 395 12 395P&T 8 739 9 976 13 922 15 377 15 377 14 213 12 843 10 904 9 632 9 632P&C 11 911 12 730 12 775 12 988 12 988 10 604 9 130 7 046 9 037 9 037Other (1 059) (1 243) (397) (178) (178) (259) (296) (227) (184) (184)Total 54 482 53 389 58 203 58 016 58 016 52 322 61 924 56 453 56 276 56 276Earnings per shareAmounts in NOK108642Order intakeAmounts in NOK60 00050 00040 00030 00020 00010 000Order backlogAmounts in NOK60 00050 00040 00030 00020 00010 0000<strong>2007</strong><strong>2008</strong><strong>2009</strong>0<strong>2008</strong><strong>2009</strong>0<strong>2008</strong><strong>2009</strong>• ED&S • Subsea • P&T • P&C• ED&S • Subsea • P&T • P&CAker Solutions annual report <strong>2009</strong> 121
Our organisation and governanceClose up of a tooth rack trom an MH lower guiding arm TM122Aker Solutions annual report <strong>2009</strong>
Our organisation and governanceOur organisation andgovernanceContents124 Corporate governance130 Board of Directors132 Executive management team134 Company informationAker Solutions annual report <strong>2009</strong> 123
Our organisation and governanceCorporate governanceCorporate governanceAker Solutions’ goal is to ensure the greatest possible value creation for its shareholders over time. Goodcorporate governance will reduce risk and ensure sustainable value creation.The group’s principles for corporategovernance have been established by itsBoard of Directors, based on theNorwegian code of practice for corporategovernance, dated 21 October <strong>2009</strong> (“thecode”).There follows a description of how AkerSolutions has implemented the applicablesections of the code. This description isstructured in the same way as the code,and each section covers any potentialexceptions or deviations.Audit committeeSection 1 – implementation andreporting on corporate governanceGood corporate governance shouldensure that appropriate goals andstrategies are established, that thestrategies adopted are implemented, andthat the results achieved are subject tomeasurement and follow-up. Theprinciples will also help ensure that thegroup’s activities are subject toappropriate and effective control. Anappropriate division of roles andsatisfactory control will contribute to thegreatest possible value creation over time,to the benefit of the shareholders andother stakeholders.<strong>Annual</strong> General MeetingBoard of DirectorsCorporate managementCorporaterisk managementCorporate values and ethical guidelinesAker Solutions wishes to contribute tosustainable social development throughresponsible business operations. Toachieve this, the Board has adopted a setof values for the group. The ethicalguidelines and other policy documents forAker Solutions have been prepared inaccordance with these values. Animportant goal for <strong>2009</strong> was to developand implement a code of conduct for thegroup. The code of conduct summarisesExternal auditorAker Solutions’ principles for corporateresponsibility (CR). It is based on materialwhich already exists and is enshrined inthe group’s policies, annual reports andreports on CR. Further coverage of thegroup’s corporate values and ethicalguidelines can be found on the AkerSolutions website atwww.akersolutions.com/CR.Section 2 - businessThe business activities clause in AkerSolutions’ articles of association reads asfollows: “The objectives of the Companyare to own or carry out industrial- andother associated businesses,management of capital and otherfunctions for the Group, and to participatein or acquire other businesses.”The group’s main strategies arepresented in the Directors’ report. Thegroup’s strategy, goals and guidelines areassessed by the Board every year,through specific strategy processes.In connection with the group’squarterly reporting and special marketpresentations, information is provided tothe market about Aker Solutions’ financialposition and main strategies as well asabout possible changes to these.Section 3 – equity and dividendsThe group’s equity as of 31 December<strong>2009</strong> was NOK 9 123 million, whichcorresponds to an equity ratio of 22.8percent. Aker Solutions’ dividend policy isdiscussed in the section concerning theshare and shareholder information onpage 116 of this annual report. Thegroup’s dividend policy is one of thefactors taken into account in connectionwith the Board’s proposal for theallocation of net profit for <strong>2009</strong>.Board mandatesBoard proposals for future mandates willbe limited to defined issues and apply forthe period until the next <strong>Annual</strong> GeneralMeeting. Existing mandates for acquiringthe company’s own (treasury) shares arepresented in the section concerning shareand shareholder information on page 116of this annual report. No mandates for theBoard to increase the company’s sharecapital were in force as of 31 December.Share purchase programme for employeesAker Solutions wants its employees tohave the opportunity to be shareholdersin the company and to participate in itspossible value development. This willcontribute to an even closer relationshipbetween the employees and the companyas well as increasing interest in thedevelopment of the company’s value. Ashare purchase programme wasaccordingly introduced in <strong>2009</strong>, and thedecision has been taken to continue thisin <strong>2010</strong>. More details of the programmeare provided in the section concerning theshare and shareholder information onpage 116 of this annual report and in note9 on salaries, wages and social securitycosts to the annual accounts. The sale ofshares to employees through theprogramme is achieved with the aid of thetreasury shares held at any given time or124Aker Solutions annual report <strong>2009</strong>
Our organisation and governanceCorporate governancethrough the purchase of additionaltreasury shares pursuant to existingBoard mandates.Section 4 – equal treatment ofshareholders and transactions withrelated partiesAker Solutions has a single class ofshares, and all its shares confer the samerights. Existing shareholders have a preemptiveright to subscribe to shares in theevent of an increase in the share capital,unless special considerations dictateotherwise. The Board will justify anywaiving of the pre-emptive right ofexisting shareholders to subscribe toshares. Transactions in the company’sown (treasury) shares are conducted onthe Oslo Stock Exchange.In the event of not-immaterialtransactions between the company andshareholders, Directors, senior executivesor close associates of such parties, whichdo not form part of ongoing projects inthe company’s ordinary business, theBoard must obtain an independentvaluation. A corresponding generalprinciple also applies to the relationshipbetween Aker Solutions and the Akergroup. Possible collaboration projectswith Aker Clean Carbon AS, which isowned 50 percent by Aker Solutions, andcontracts in the company’s ordinarybusiness with other listed companies inwhich Aker is a shareholder, willnevertheless normally be negotiated andentered into at arm’s length without anindependent valuation necessarily beingobtained.Aker Solutions has prepared guidelinesdesigned to ensure that Directors andsenior executives notify the Board of anydirect or indirect material interest theymay have in agreements entered into bythe group.Pursuant to Aker Solutions’instructions for the Board of Directors,neither the Directors nor the President &CEO will participate in the preparation,consideration or determination of issueswhere the person concerned or anyrelated party of that person may beregarded as having a particular personalor financial interest in the issue. Each ofthe Directors and the President & CEO arepersonally responsible for declaring aconflict of interest wherever the possibilityof such a conflict exists.Where other elected employeerepresentatives and employees of AkerSolutions are concerned, the question oftransactions with related parties is dealtwith in detail and regulated by the group’sethical guidelines.Principal shareholderAker ASA owns 60 percent of the sharesin Aker Holding AS, which owned 40.27percent of the shares in Aker SolutionsASA as of 31 December <strong>2009</strong>. Propositionno 88 (2006–<strong>2007</strong>) to the NorwegianStorting (parliament) contains furtherinformation on the creation of AkerHolding and the agreement between AkerASA and the other shareholders in AkerHolding AS. The board considers itpositive for Aker Solutions that Aker ASAaccepts the role of an active owner andinvolves itself actively in issues of greatsignificance for the group and theshareholders. The collaboration with AkerASA gives Aker Solutions access, forinstance, to special expertise andcapacity in strategy, transactions andfinancing. In addition, Aker ASAcontributes networks and negotiatingresources which can benefit AkerSolutions in individual matters. Thissupplements and strengthens AkerSolutions without restricting the group’sautonomy. In connection with thiscollaboration, it may be necessary to giveAker ASA special insight into the business.Possible information given to Aker’srepresentatives in this context will beprovided in accordance with the legalprovisions and regulations which governthe Oslo Stock Exchange and securitiesmarket.Pursuant to the Norwegian Act onPublic Limited Liability Companies, AkerSolutions is not regarded as a relatedparty of Aker ASA or companies in whichAker ASA is a shareholder. Nevertheless,the Board and executive management ofAker Solutions are very conscious that allrelations with other Aker companies mustbe conducted on commercial terms andin accordance with the arm’s lengthprinciple.Transactions are made public inaccordance with the regulationsgoverning companies listed on the OsloStock Exchange. Furthermore,transactions of a certain size betweenAker Solutions and companies in the Akergroup will be conducted in accordancewith the procedures outlined in section3-8 of the Norwegian Act on PublicLimited Liability Companies. For furtherinformation, see note 7 to theconsolidated accounts on related parties.During <strong>2009</strong>, companies in the grouphave acquired companies andshareholdings in companies from the Akergroup as described in more detail in note7 to the consolidated accounts. Followingthese transactions, fewer commercialinterfaces will exist in the future betweenbusiness activities in the Aker group andin Aker Solutions. That should help toprovide greater clarity and predictability inthe market regarding the distinctionbetween Aker’s management of theprincipal shareholder’s ownershipinterests in the group and its othercommercial interests in relation to AkerSolutions.Section 5 – freely negotiable sharesAker Solutions shares are listed on theOslo Stock Exchange and are freelynegotiable. The company’s articles ofassociation impose no restrictions on thetransferability of its shares.Section 6 – <strong>Annual</strong> General MeetingsAker Solutions encourages shareholdersto attend its <strong>Annual</strong> General Meetings. Itgives priority to holding the <strong>Annual</strong>General Meeting as soon as possible afterthe end of the year. The notice of the<strong>Annual</strong> General Meeting with detailedsupporting documentation — includingthe recommendations of the nominationcommittee — is posted to the company’swebsite no later than 21 days before themeeting is to take place. Correspondingdocuments have previously been mailedto shareholders by the deadlinesspecified at any given time pursuant tothe Norwegian Act on Public LimitedLiability Companies. In connection withthe <strong>Annual</strong> General Meeting for <strong>2010</strong>, theBoard has proposed an amendment toAker Solutions annual report <strong>2009</strong> 125
Our organisation and governanceCorporate governancethe articles of association to ensure thatthe articles clearly reflect that deadlinesand formal requirements for giving noticeof an <strong>Annual</strong> General Meeting specified atany given time pursuant to the Act willapply, and that documents concerningitems on the agenda for the <strong>Annual</strong>General Meeting which have been madeavailable to shareholders on thecompany’s website will not normally bemailed to shareholders unless the Actprovides otherwise.The deadline for shareholders toregister their attendance is set as close tothe date of the meeting as possible.Shareholders who are unable to attendthe meeting in person may vote by proxy.Further information on procedures forregistration and proxy voting is providedin the notice of the meeting and on theregistration form. With effect from <strong>2010</strong>,the company will also observe the code’srecommendation on appointing anindependent party who can be nominatedby shareholders to act as their proxy. Thecompany’s goal is that the proxy form willbe formulated, as far as is practicable, insuch a way that the person giving theproxy can vote separately on each issueand for every candidate.Pursuant to the articles of association,the Chairman of the Board or the Board’sappointee chairs the <strong>Annual</strong> GeneralMeeting. The intention is that Directors,the Chairman of the nominationcommittee and the company’s auditor willattend <strong>Annual</strong> General Meetings. Thenomination committee gives weight in itswork to assembling a board whichfunctions as far as possible as a team,and to selecting Directors whoseexperience and qualificationscomplement each other. For that reason,although the company’s goal will be togive the <strong>Annual</strong> General Meeting theopportunity to vote on each candidate forboard membership, the <strong>Annual</strong> GeneralMeeting will nevertheless normally beinvited to vote for the Board as a whole.From a desire for the <strong>Annual</strong> GeneralMeeting to be conducted in anappropriate manner, and for shareholdersto take their decisions as far as possibleon the basis of the same information, thecompany has not so far found it advisableto recommend the adoption of an optionto attend and vote electronically or tovote in advance. The company willconstantly assess the introduction ofsuch arrangements, in part with regard tothe security offered by available systemsand their ease of use.Minutes of <strong>Annual</strong> General Meetingsare published as soon as is practicablevia the Oslo Stock Exchange’s messagingservice www.newsweb.no (ticker: AKSO)and on the company’s websitewww.akersolutions.com under the“Investors” tab.Section 7 – nomination committeeThe company has a nominationcommittee as specified in its articles ofassociation. This committee comprises aminimum of three members, whonormally serve for two years. Thecomposition of the nomination committeetakes account of the interests of theshareholders while also maintaining theindependence of its members from theBoard and executive management ofAker Solutions. The members andChairman of the nomination committeeare elected by the company’s <strong>Annual</strong>General Meeting, which also determinestheir remuneration and has theopportunity to adopt instructions for thecommittee’s work. The nominationcommittee had four members as of 31December <strong>2009</strong>, the majority of whomwere independent of the Board and theexecutive managementPursuant to the articles of association,the nomination committee recommendscandidates for election to the Board ofDirectors. The nomination committee alsomakes recommendations on theremuneration of Directors. Thecomposition of the nomination committeeis presented in the section concerningthe share and shareholder information inthis annual report.Information about the nominationcommittee and deadlines for suggestingor nominating candidates fordirectorships can be found under the”Investors” tab on the group’s website atwww.akersolutions.com.Section 8 – corporate assembly andBoard of Directors: compositionand independenceUnder an agreement with the employees,the company does not have a corporateassembly. Employee rights underNorwegian law to representation andparticipation in decision-making havebeen secured in part through extendedrepresentation on the Board of Directors.Pursuant to the company’s articles ofassociation, the Board comprises six toten Directors, of whom one-third are tobe elected by and from among AkerSolutions’ employees. Furthermore, up tothree alternate Directors may be electedby the shareholders. The nominationcommittee’s recommendations normallyinclude a proposal on the choice ofChairman, who is elected by theshareholders at the <strong>Annual</strong> GeneralMeeting. The Board elects its own DeputyChairman. Directors are elected for twoyearterms.The Board had ten members as of 31December <strong>2009</strong>, including six elected bythe shareholders and four by theemployees. The present composition ofthe Board is described on page 130 ofthis annual report, together with furtherdetails of the background and affiliationsof Directors. The company encourages itsDirectors to own shares in the company.Shares held by Directors as of 31December <strong>2009</strong> are specified in note 9 tothe consolidated annual accounts onsalaries, wages and social security costs.The majority of shareholder-electedDirectors are independent of theexecutive management and key businessassociates. No member of the executivemanagement sits on the Board.At the request of the company’slargest shareholder, Aker Holding AS, theBoard of Aker Solutions called anExtraordinary General Meeting on 8 June<strong>2009</strong>. Items on the agenda included theelection of a new Director to replace HeidiM. Petersen, who had resigned her post,and a new Director independent of Akerto replace Leif-Arne Langøy, who hadtendered his resignation.Ida Helliesen and Mikael Lilius wereelected to serve as Directors until thecompany’s <strong>Annual</strong> General Meeting in126Aker Solutions annual report <strong>2009</strong>
Our organisation and governanceCorporate governance2011. Following these changes, at leasthalf of the shareholder-elected Directorsare independent of the company’s largestshareholder.None of the shareholder-electedDirectors are up for election in <strong>2010</strong>.The nomination committee’srecommendations and accompanyingjustification are published on thecompany’s website and via the OsloStock Exchange’s messaging servicewww.newsweb.no as soon as theybecome available.Section 9 – the work of the Board ofDirectorsThe Board adopts an annual plan for itswork, emphasising goals, strategy, andexecution. Furthermore, there existsinstructions for the Board of Directorsadopted to regulate the areas ofresponsibility, tasks and division of rolesbetween the Board, the Chairman andthe President & CEO. The instructionsalso contain provisions on the Board’sschedule, notice and chairing of boardmeetings, decision-making, the President& CEO’s right and duty to keep the Boardinformed, the duty of confidentiality,conflicts of interest and other matters.The Board held nine ordinary meetingsduring <strong>2009</strong>, with an average attendanceof 9.4 Directors (95 percent) and fullattendance on six occasions (67 percent).Twelve extraordinary meetings were alsoheld, with an average attendance of nineDirectors (92 percent) and full attendanceon six occasions (50 percent).Extraordinary meetings were largelyoccasioned by the need, pursuant to thecompany’s authorisation matrix, foradvance Board consideration andapproval of significant tenders due to besubmitted by the group. An overview ofattendance by the present Directors atordinary and extraordinary boardmeetings during <strong>2009</strong> is provided in note 9to the consolidated annual accounts onsalaries, wages and social security costs.Matters to be considered by the Boardare prepared by the President & CEO inconsultation with the Chairman. Weight isgiven to preparing and presenting thesematters in such a way that the Board hasa satisfactory basis for considering them.The Board has overall responsibility formanaging Aker Solutions and is chargedwith ensuring an acceptable organisationof the business through the President &CEO. Among its other duties, the Boardwill determine plans and budgets for thebusiness and keep itself informed of thefinancial position and development ofAker Solutions. That includes the annualplanning process in Aker Solutions, withthe determination of overall goals andstrategic choices for the group as well asfinancial plans, budgets and forecasts forthe group and its business areas.Pursuant to its instructions, the Boardconducts an annual evaluation of its ownperformance and expertise.Audit committeeThe Board of Aker Solutions resolved inDecember <strong>2009</strong> to establish an auditcommittee, which will comprise up to fourDirectors and normally meet at least fourtimes a year. At least one of thecommittee’s members must have relevantaccounting or auditing expertise. Theaudit committee’s mandate and mode ofworking comply with legal requirements.On behalf of the Board, the committeewill participate in quality assurance ofguidelines, policies and other governingdocuments for Aker Solutions ASA. Itundertakes a qualitative review of thecompany’s interim and annual reports,which includes corporate reporting. In itsreview of the accounts, the committeeholds discussions with the management,the corporate audit function and theexternal auditor.Compensation committeeThe Board of Aker Solutions has acompensation committee comprisingthree Directors, which normally meets atleast four times a year. This committeeprepares and recommends proposals tothe Board concerning the pay andconditions of the President & CEO andthe guidelines and principles in force atany given time for remuneration of seniorexecutives in the group. Based onrecommendations from the President &CEO, the committee also approves thepay and conditions of personnel whoreport directly to the President & CEO.Section 10 – risk management andinternal controlAker Solutions has established acomprehensive set of internal controlprocedures and systems to ensureuniform and reliable financial reporting.Each of the group’s business units isrequired to conduct an annual evaluationof its internal financial reporting controlsystems. The group also conducts regularaudits of individual units’ compliance withsystems and procedures. The Boardreceives monthly reports on thecompany’s financial performance and thestatus of its most important individualprojects. The business areas areresponsible for monthly financialfollow-up and reporting.Work on overall risk management isconducted mainly by the followingcorporate functions, in close cooperationwith the business areas:■■■■■■■■■■the enterprise risk functioncoordinates risk management outsidethe traditional project and financialareas, and monitors the company’svalues and ethical guidelinesthe internal control function monitorsthat the units have established andimplemented the necessary systemsand routines for ensuring compliancewith both financial and operationalprocedures and systems within thegroup, and conducts regular visits toand checks of units with consequentreporting of possible improvementmeasuresthe project and operational supportfunction provides support for projectassessments in the tendering andexecution phases, and chairs thegroup’s corporate risk committeethe corporate treasury function isresponsible for financial market riskand the group’s exposure to financialmarkets, and is a permanent memberof the group’s investment committeethe corporate insurance functionhandles the purchase of the group’sinsurance programme and providesinsurance-related support for projects,as well as operating as the group’scaptive underwriterAker Solutions annual report <strong>2009</strong> 127
Our organisation and governanceCorporate governance■■■■the corporate legal function supportsall the above-mentioned functions intheir management of risk, in partthrough permanent membership of thecorporate risk and investmentcommittees, and is also responsiblefor contractual and legal follow-up ofprojects, partners, contracts, disputesand relations with the publicauthoritiesthe corporate tax function deals withtax-related transaction, operation, taxreturn and accounting risks.In addition to the above-mentionedcorporate functions, the business areashave their own management teams,accounting and staff functions tailored totheir organisations and businesses. Eachbusiness area and unit is responsible forensuring compliance at all times with thegroup’s procedures and systems and withall other applicable regulations and legalrequirements. The corporate staff and theBusiness processesStrategyPeopleOperationsValuesand leadership approachPoliciesBusinessmanagement meetingsEMT meetingsMonthly operating reviewsQuarterly business reviewsbusiness areas accordingly collaborateclosely in order to be able to identify,monitor, report on and manage risk forthe whole group in line both with therequirements of the audit committee andBoard and with internal and externalframe conditions and regulations.In accordance with the company’smanagement model and organisation,each corporate function has a globalresponsibility for following up itsrespective area and associatedframework. That applies regardless of theapproach adopted for organising thebusiness, and is pursued in part througha close dialogue with the company’scorporate risk and investmentcommittees and through monthlymeetings related to financial andoperational reporting by the businessareas. Each corporate function will alsofollow up its area of responsibility outsidethese fora in direct dialogue with thebusinesses, both in relation to specificOperating Managers’ ConferenceOrganisationCorporate staffBusiness areasGlobal networksprojects and as part of expertisedevelopment for good risk management.All parts of the group conduct anannual evaluation of the extent to whichthe established control activities functionappropriately.The Board’s audit committee will assistthe Board in checking that the companyhas internal procedures and systemswhich ensure good corporate governance,effective internal control and good riskmanagement – particularly in relation tofinancial reporting.Page 34 of the Directors’ reportprovides a more detailed description ofthe company’s management of businessrelatedoperational and financial risk.Section 11 – remuneration of theBoard of DirectorsRemuneration paid to Aker Solutions’Directors reflects the Board’sresponsibilities, expertise, time spent andthe complexity of the business.Remuneration is recommended by thenomination committee and is not profitdependentor related to options in AkerSolutions.Additional information about theremuneration paid to Directors in <strong>2009</strong> ispresented in note 9 to the consolidatedannual accounts on salaries, wages andsocial security costs.Directors or companies with whomthey are affiliated should not undertakespecially remunerated assignments forAker Solutions over and above theirdirectorship. Should they nevertheless doso, the Board must be informed and mustapprove the remuneration. Noremuneration related to suchassignments must be accepted fromanyone other than the company or therelevant group company.Business units128Aker Solutions annual report <strong>2009</strong>
Our organisation and governanceCorporate governanceSection 12 - remuneration ofexecutive managementThe Board has adopted guidelines for theremuneration of Aker Solutions’ executivemanagement pursuant to section 6-16a ofthe Norwegian Act on Public LimitedLiability Companies.Aker Solutions ASA does not havestock option schemes or otherarrangements for awarding shares toemployees for <strong>2010</strong>, but a share purchaseprogramme initiated in <strong>2009</strong> will beextended to <strong>2010</strong>. Further details areavailable in the section on page 116concerning the share and shareholderinformation. Further details on theremuneration of individual members ofAker Solutions’ executive managementare provided in note 9 to the consolidatedannual accounts on salaries, wages andsocial security costs. The company’sguidelines for remunerating executivemanagement are presented in note 9 andare accordingly submitted to the <strong>Annual</strong>General Meeting.Section 13 – information andcommunicationsAker Solutions has established an investorrelations (IR) policy which can be foundon the group’s website. The group’sreporting of financial and otherinformation is based on openness and onequal treatment of participants in thesecurities market.The long-term objective of the IRfunction is to secure access to capital forthe company on competitive terms whileensuring the most accurate possiblepricing of the share for shareholders.These goals will be accomplished throughcorrect and timely distribution ofinformation which could affect thecompany’s share price, while ensuring thatthe company complies with applicableregulations and market practice. See alsothe description above about the flow ofinformation between Aker Solutions andAker ASA in connection with theircollaboration in such areas as strategy,transactions and financing.All stock exchange notices and pressreleases are made available on thecompany’s website at www.akersolutions.com, while stock exchange notices arealso available from www.newsweb.no. Allinformation distributed to shareholders ispublished simultaneously on the AkerSolutions website. The company holdsopen presentations in connection with itsfinancial reporting, and thesepresentations are broadcast directly viathe internet. Aker Solutions’ financialcalendar can be found on page 118 ofthis annual report and on the company’swebsite.Section 14 – takeoversAker ASA has undertaken to maintain itscontrol of Aker Holding AS for a minimumof ten years from June <strong>2007</strong>. As long asthe shareholder collaboration in AkerHolding AS persists, the Board has notconsidered it appropriate to preparespecial guidelines for possible takeovers.Section 15 – auditorThe auditor presents an annual plan to theaudit committee for the conduct ofauditing work. Furthermore, the auditorhas provided the Board with writtenconfirmation that the requirement forindependence has been fulfilled.The auditor attends the Board meetingthat deals with the annual accounts, andhas reviewed possible significant changesto the company’s accounting principlesand internal controls with the Board. TheBoard of Directors is given opportunity tomeet the auditor without the President &CEO or other members of the executivemanagement being present. Moreover,with effect from <strong>2010</strong>, the auditcommittee will hold at least one meeting ayear with the auditor but without thePresident & CEO or other members of theexecutive management being present.The Board establishes guidelines onusing the auditor for services other thanauditing.A recommendation on the choice ofexternal auditor and approval of theauditor’s fee is submitted to the Board bythe audit committee.The auditor’s fee, broken downbetween auditing and other services, ispresented in note 11 to the consolidatedannual accounts under other operatingexpenses. This information is alsosubmitted to the <strong>Annual</strong> General Meeting.Aker Solutions annual report <strong>2009</strong> 129
Our organisation and governanceBoard of DirectorsBoard of DirectorsØyvind EriksenChairman of the BoardØyvind Eriksen is President & CEO of Aker ASA. He gained a law degree from Oslo Universityand, in 1990, joined Norwegian law firm BA-HR. In 1996 he became a partner there and, in2003, a board member and chairman. At BA-HR, Eriksen worked closely with Aker and Aker‘smain shareholder, Kjell Inge Røkke. Eriksen is chairman of the board of Aker Holding AS and aboard member of Reitangruppen AS, Aker Clean Carbon AS, The Resource Group TRG AS, TRGHolding AS and other companies. As of 31 December <strong>2009</strong> he holds no shares in the companyand has no stock options. Eriksen is a Norwegian citizen. He has been elected for the period<strong>2009</strong>-2011.Lone Fønss SchrøderDirectorLone Fønss Schrøder is president of Sweden’s Wallenius Lines AB. She has a law degreefrom the University of Copenhagen and a Master of Economics from Handelshøjskolen,Copenhagen. Fønss Schrøder has broad international experience acquired during 21 years insenior management, including board positions at A.P. Møller-Maersk A/S. She is currently a nonexecutivedirector and member of the audit committee at Yara International ASA and Sweden’sVattenfall AB, as well as non-executive director of Svenska Handelsbanken AB in Sweden. Asof 31 December <strong>2009</strong> she holds no shares in the company and has no stock options. FønssSchrøder is a Danish citizen. She has been elected for the period <strong>2009</strong>-2011.Mikael LiliusDirectorMikael Lilius was President and CEO of Fortum Corporation from 2000 to May <strong>2009</strong>. This Finnishcompany is one of the largest energy enterprises in the Nordic region, with substantial operationsin Russia and the Baltic states. From 1990, Lilius was chief executive of Sweden’s Incentive AB, apharmaceuticals company which changed its name to Gambro AB in 1998. Gambro is owned bySwedish investment company Investor AB. Lilius is chairman of the board of Finnish HuhtamakiCorporation and a member of the board of Hafslund ASA, a Norwegian energy utility. He is agraduate of the Swedish School of Economics and Business Administration in Helsinki. As of 31December <strong>2009</strong> he holds no shares in the company and has no stock options. Lilius is a Finnishcitizen. He has been elected for the period <strong>2009</strong> - 2011.Vibeke Hammer MadsenDirectorVibeke Hammer Madsen has been CEO of HSH (The Federation of Norwegian Commercial andService Enterprises) since 2002. Prior to this, she was a partner in the PA Consulting Group.From 1993 to 1999 Hammer Madsen was a vice president holding various positions in Statoil.Today Hammer Madsen, a graduate of the Norwegian School of Radiography, holds a rangeof board positions. As of 31 December <strong>2009</strong>, she holds no shares in the company, and has nostock options. Hammer Madsen is a Norwegian citizen. She has been elected for the period<strong>2009</strong>–2011.Ida HelliesenDirectorIda Helliesen joined Norsk Hydro in 1980, where she held a number of leading positions including,for the last eight years before her retirement in <strong>2007</strong>, chief financial officer. From <strong>2007</strong> until thespring of <strong>2009</strong>, she assisted Hydro on a number of issues including the completion of the mergerbetween Hydro’s oil and energy business and Statoil. Helliesen is a director of the executiveboard of Norway’s Central Bank, Statistics Norway and Skagerak Energi AS. She has an MSc inbusiness economics from the Norwegian School of Economics and Business Administration. Asof 31 December <strong>2009</strong>, she holds no shares in the company, and has no stock options. Helliesenis a Norwegian citizen. She has been elected for the period <strong>2009</strong>-2011.130Aker Solutions annual report <strong>2009</strong>
Our organisation and governanceBoard of DirectorsKjell Inge RøkkeDirectorEntrepreneur and industrialist Kjell Inge Røkke, Aker ASA’s main owner, has been a drivingforce in the development of Aker since the 1990s. Røkke launched his business career with thepurchase of a 69-foot trawler in the United States in 1982 and gradually built a leading worldwidefisheries business, harvesting white fish and processing it at sea. In 1996, Røkke purchasedenough Aker shares to become Aker’s largest shareholder. As of 31 December <strong>2009</strong> he holdsno shares in the company and has no stock options. Røkke is a Norwegian citizen. He has beenelected for the period <strong>2009</strong>-2011.Atle TeiglandDirectorAtle Teigland was elected by the employees of Aker Solutions to the Board of Directors inOctober 2004. He also served on the boards of Aker and Aker RGI for several years. Teigland isa group union representative for Aker Solutions on a full-time basis and has been employed byAker Elektro AS since 1978. Teigland is a certified electrician. As of 31 December <strong>2009</strong> he holds1 806 shares in the company, and has no stock options. Teigland is a Norwegian citizen. He hasbeen elected for the period <strong>2009</strong>–2011.Åsmund KnutsenDirectorÅsmund Knutsen was elected by the employees of Aker Solutions to the Board of Directorsin October 2004. Since 1991 he has held various positions in Aker Engineering & TechnologyAS and is now a group union representative for white-collar employees on a full-time basis.Knutsen holds an MSc in hydrodynamics. As of 31 December <strong>2009</strong>, he holds 3 111 shares in thecompany, and has no stock options. Knutsen is a Norwegian citizen. He has been elected for theperiod <strong>2009</strong>–2011.Arild HåvikDirectorArild Håvik was elected by the employees of Aker Solutions to the Board of Directors in March<strong>2009</strong>. Håvik has been employed by Aker Solutions since 1990 and has been a local unionrepresentative for Aker Offshore Partner AS on a full-time basis for the last 2 years. Håvik is ascaffolder and sheet metal worker and holds a certificate of apprenticeship in the two disciplines.As of 31 December <strong>2009</strong>, he holds 206 shares in the company, and has no stock options. Håvikis a Norwegian citizen. He has been elected for the period <strong>2009</strong>-2011.Arve ToftDirectorArve Toft was elected by the employees of Aker Solutions to the Board of Directors in March<strong>2007</strong>. Toft is a group union representative for Aker Solutions on a full-time basis and has beenemployed by the company since 1983. Toft is a certified mechanic and scaffolder and has been amain safety delegate at Aker Stord AS for 5 years. As of 31 December <strong>2009</strong>, he holds 206 sharesin the company, and has no stock options. Toft is a Norwegian citizen. He has been elected forthe period <strong>2009</strong>-2011.Aker Solutions annual report <strong>2009</strong> 131
Our organisation and governanceExecutive management teamExecutive management teamSimen LieunghPresident & CEOSimen Lieungh first joined Aker Solutions in 1988 and has been President & CEO since March<strong>2008</strong>. He has more than 20 years’ experience with large field development projects, covering allphases from conceptual studies to completion and delivery of complete installations. Prior to this,Lieungh was a research scientist with the Norwegian Defence Research Establishment and fromJuly <strong>2007</strong> to February <strong>2008</strong> he was Managing Director of Arne Blystad AS. Lieungh is a graduateof the Norwegian University of Science and Technology. As of 22 February <strong>2010</strong>, he holds,through a privately owned company, 15 014 shares in the company and has no stock options.Lieungh is a Norwegian citizen.Leif BorgeChief Financial Officer & EVPLeif Borge joined Aker Solutions in <strong>2008</strong>. Previously he had been CFO of Aker Yards ASA since2002, after serving as CFO of Zenitel NV, Stento ASA and Vitana (Rieber & Søn ASA). Borge isa graduate of the Pacific Lutheran University in Washington State. As of 22 February <strong>2010</strong>, heholds, through a privately owned company, 20 236 shares in the company, and has no stockoptions. Borge is a Norwegian citizen.Niels Didrich BuchChief of Staff & EVPNiels Didrich Buch joined Aker Solutions in 1999 from the Norwegian Foreign Service, where hespent 10 years in various positions in Norway, Indonesia and Switzerland. He has been Chiefof Staff & EVP since <strong>2008</strong>. From 2005 to <strong>2008</strong> he was SVP and head of corporate businessdevelopment in Aker Solutions and before that he held various positions within the company,including two years in Houston, USA as head of legal for the Subsea business area. Buch holdsa law degree from the University of Oslo. As of 22 February <strong>2010</strong>, he holds 2 360 shares in thecompany and has no stock options. Buch is a Norwegian citizen.Jarle Tautra 1EVP Energy Development & ServicesJarle Tautra has been an EVP with Aker Solutions since 2002. He has 27 years’ experience inoffshore-related activities. From 1997 to 2002 Tautra served as President of Aker Oil & Gas andas EVP of EPC Norway in Aker Maritime ASA. Prior to this, he held various positions in NorskHydro ASA. Tautra is a graduate of the Norwegian University of Science and Technology. Asof 22 February <strong>2010</strong>, he holds no shares in the company and has no stock options. Tautra is aNorwegian citizen.Mads AndersenEVP SubseaMads Andersen joined Aker Solutions in 2000 and has been an EVP since 2003. He has morethan 20 years’ experience in the upstream oil and gas industry. Andersen has held a range oftechnical and managerial positions in oilfield service and oil companies including Schlumbergerand Saga Petroleum (now Statoil). Andersen is a graduate of Glasgow University and theNorwegian School of Management. As of 22 February <strong>2010</strong>, he holds 12 631 shares in thecompany and has no stock options. Andersen is a Norwegian citizen.132Aker Solutions annual report <strong>2009</strong>
Our organisation and governanceExecutive management teamPer Harald KongelfEVP Products & TechnologiesPer Harald Kongelf was appointed EVP of the reorganised business area Products & Technologiesin October <strong>2008</strong>. He has more than 20 years’ experience within the oil and gas industry. For thepast five years he was president of Aker Solutions’ process systems business unit. Before that heworked as an investment manager in the Statkraft Group and in Aker Solutions. He holds an MScfrom the Norwegian University of Science and Technology. As of 22 February <strong>2010</strong>, he holds noshares in the company and has no stock options. Kongelf is a Norwegian citizen.Gary Mandel 2EVP Process & ConstructionGary Mandel first joined Aker Solutions in 1995. He has over 25 years of experience in the oil andgas industry, both upstream and downstream. Prior to Aker Solutions Mandel held the positionof Chairman & CEO at Aker American Shipping ASA and Vice Chairman of Aker PhiladelphiaShipyard ASA. Previously, he served as EVP for Aker Solutions between 2002 and <strong>2007</strong>. Mandelis an engineering graduate from the University of Nuevo Leon, Mexico. As of 22 February <strong>2010</strong>,he holds 1 441 shares in the company and has no stock options. Mandel is a US citizen.Karl Erik Kjelstad 3EVP Oilfield ServicesKarl Erik Kjelstad joined Aker Solutions in July <strong>2009</strong> from the position of Senior Partner &President, Maritime Technologies at Aker ASA. He has been with the Aker group since 1998and was President & CEO of Aker Yards ASA from January 2003-June <strong>2007</strong>. Prior to joiningAker, Kjelstad was senior consultant at PA Consulting Group and from 1992-1996 held variousmanagement positions in the TTS Group. He holds an MSc in Marine Engineering from theNorwegian University of Science and Technology. As of 22 February <strong>2010</strong>, Kjelstad holds,through a privately owned company, 2 500 shares in the company and has no stock options.Kjelstad is a Norwegian citizen.Geir Arne Drangeid 4EVP Corporate CommunicationsGeir Arne Drangeid has been responsible for communications and Investor Relations in AkerASA until March <strong>2010</strong>. He has a background from journalism. Drangeid has held variouscommunications related positions in Aker since 1990, when he joined Norwegian Contractors.In 1996 he became head of group communications in Aker Maritime, and since 2002 until 2004he has been group SVP Communications and Investor Relations in Aker Solutions. As of 22February <strong>2010</strong> Drangeid holds no shares in the company and has no stock options. Drangeid is aNorwegian citizen.1) Jarle Tautra replaced Nils Arne Hatleskog as EVP for Energy Development & Services in February <strong>2009</strong>. Hatleskog was EVP for Energy Development &Services from April <strong>2008</strong>.2) Gary Mandel replaced Jarle Tautra in February <strong>2009</strong>. Tautra is now heading the Energy Development & Services business area.3) Karl Erik Kjelstad was appointed EVP and member of the executive management team in July <strong>2009</strong>.4) Geir Arne Drangeid was appointed EVP and member of the executive management team in March <strong>2010</strong>.Aker Solutions annual report <strong>2009</strong> 133
Our organisation and governanceCompany informationAker Solutions ASASnarøyveien 361364 FornebuPostal address:P.O. Box 169NO-1325 LysakerTelephone: +47 67 51 30 00Telefax: +47 67 51 30 10E-mail: ir@akersolutions.comWeb: www.akersolutions.comCOPYRIGHT AND LEGAL NOTICE Copyright in all published material including photographs, drawings and images in this publicationremains vested in Aker Solutions and third party contributors to this publication as appropriate. Accordingly, neither the whole nor any partof this publication can be reproduced in any form without express prior permission. Articles and opinions appearing in this publication do notnecessarily represent the views of Aker Solutions. While all steps have been taken to ensure the accuracy of the published contents, AkerSolutions does not accept any responsibility for any errors or resulting loss or damage whatsoever caused and readers have the responsibilityto thoroughly check these aspects for themselves. Enquiries about reproduction of content from this publication should be directed to AkerSolutions ASA.134Aker Solutions annual report <strong>2009</strong>
<strong>Report</strong>s via the InternetThe quarterly and annual reports ofAker Solutions are available via theInternet. Aker Solutions encouragesits shareholders to subscribe tothe company’s annual reports viathe electronic delivery system ofthe Norwegian Central SecuritiesDepository (VPS). Please note thatVPS services (VPS Investortjenester)are designed primarily for Norwegianshareholders. Subscribers to thisservice receive annual reports in PDFformat by email. VPS distributiontakes place at the same time asdistribution of the printed versionof Aker Solutions’ annual report toshareholders who have requested it.Quarterly reports, which are generallyonly distributed electronically, areavailable from the company’s websiteand other sources. Shareholders whoare unable to receive the electronicversion of interim reports, maysubscribe to the printed version bycontacting Aker Solutions’ investorrelations staff.Layout design:Haugvar Communication & DesignConsulting:First House (editorial)Photos and illustrations:Aker SolutionsAnders J. SteensenBritish Nuclear GroupEivind RøhneGyro/StatoilJo MichaelKen TaylorKjetil AlsvikLongview Power, LLCPreben Stene LarsenRalf ReegerRolf EstensenSempra LNGStatoilTine PoppeTor ResserVivergo Fuels LtdXvisionTranslation:Rolf E. GooderhamProduction:Bolt Communication ASPrint:RKGrafisk AS
© <strong>2010</strong> Aker SolutionsAll rights reservedwww.akersolutions.comCover illustration by Xvision
About usHistorical factsWho we are and what we doAker Solutions delivers engineering, construction,manufacturing, technology products, maintenanceand other specialised services, often as total solutionsfor complete projects.Global scaleAker Solutions has annual revenues totallingNOK 58.3 billion and more than 23 000employees. We have offices in around 30countries worldwide.Markets and customersAker Solutions delivers products, servicesand solutions to customers worldwide inthe oil and gas, refining, chemicals, metalsand other process industries, includingmining, nuclear and power generation.Our deliveries enable our customers tobuild, efficiently operate and effectivelymaintain their facilities. Examples includecomplete offshoreplatforms for oil and gasprojects and onshore petrochemicalplants.OwnershipAker Solutions is part of Aker (www.myaker.net) and was listed on the Oslo StockExchange in 2004 under the name AkerKværner ASA. Aker Solutions’ largestshareholder is Aker Holding AS, with a40.27 percent stake in the company.Aker Holding AS is owned by Aker ASA(60 percent), the Norwegian Government(30 percent), SAAB AB (7.5 percent) andInvestor AB (2.5 percent).The companies brought together tocreate Aker Solutions were establishedin the first half of the 19thcentury, during the IndustrialRevolution. Cutting-edge technologyand engineering providers from thevery beginning, they deliveredproducts including steam enginesfor rail and marine use and arangeof industrial ironworks.Over the next 100 years, thebusinesses grew significantly. Inthemid-1900s, both Aker and <strong>Kvaerner</strong>were international corporations withactivities in ship building, hydropower, wood processing and otherprocess operations, mechanicalworkshops and other industries.Through the 1970s, 80s and 90s,they developed their capabilitiesand experience as suppliers ofcomplete solutions to offshore andonshore oil and gas and processingprojects. They each grew –organicallyand through internationalacquisitions –tobeleaders in theirmarkets.On 11 March 2002, the former<strong>Kvaerner</strong> group and the AkerMaritime group (comprising the oiland gas activities of the wider Akergroup) were merged, and started tooperate as one company under thename <strong>Kvaerner</strong>.On 29 March 2004, followingarestructuring of both Aker and<strong>Kvaerner</strong>, Aker <strong>Kvaerner</strong> wasestablished.On 3April <strong>2008</strong> Aker <strong>Kvaerner</strong>changed its name to Aker Solutions.Aker Solutions annual report <strong>2008</strong> 3
About usValue chainAn impressive portfolio of proven solutionsFew contractors can match our wide portfolio of solutions forthe oil, gas, energy and process industries. We have adecadeslongtrack record ofdeveloping and delivering completeprojects, and we are the world’s leading supplier with respectto market share for most of the individual solutions we offer.Aker Solutions covers the full value chainfor developing new projects, from conceptualand feasibility studies, front end designand detailed engineering through procurement,project management, fabrication, andhook-up to installation, commissioning, andlifecycle and decommissioning services.To our customers and other businesspartners, the benefit of our wide portfolio isour ability to assist in the selection of theconcept best suited to their particularneeds. This approach adds value to ourcustomers’ businesses, and is an importantpart of Aker Solutions’ competitive edge.1 Concrete structure ConGas, supporting LNGstorage and an LNG regasification plant2 Onshore liquefied natural gas (LNG) receivingterminals3 Power generation4 Mining and metals processing facilities5 Petrochemical/chemical processing plants6 Decommissioning, waste management andclean-up services for nuclear power facilities7 Water and wastewater treatment facilities8 Onshore gas receiving, processing andexport plant9 Marine deck machinery and steering gear10 Jacket structure for shallow waters, withdrilling and production facilities11 Tension leg platform for production and drilling12 Marine operations and subsea installationservices13 Semisubmersible production platform forextreme water depths, may include drillingfacilities14 Harsh environment CONDEEP MonoFloater,with production facilities and storage capacity15 Mooring, offshore bow loading and offloadingsystems16 Process systems offshore17 Aker H-6e, advanced semisubmersible drillingunit with RamRig18 Well intervention vessel19 Shallow water subsea production system20 Steel tube umbilicals21 Marine drilling risers22 Subsea processing and boosting23 Deepwater subsea production system24 Well services4Aker Solutions annual report <strong>2008</strong>
About usValue chain118231713124111415165109671982021222324Aker Solutions annual report <strong>2008</strong> 5
About usContents■■■About us7 Key figures <strong>2008</strong>9 Goals and strategy10 Vision and values12 President &CEO interview14 Clarity, innovation and driveOur business17 Business areas18 Energy Development &Services24 Subsea30 Products &Technologies36 Process &Construction42 Anticipating change44 Health, safety and environment48 People and development52 Corporate responsibilityOur performance56 Board ofDirectors’ report72 <strong>Annual</strong> accounts116 <strong>Annual</strong> accounts –parent company124 Auditor’s report126 Share and shareholder information130 Analytical information■Our organisation and governance132 Corporate governance136 Board ofDirectors138 Executive management team140 Company informationFinancial calendar <strong>2009</strong>24 February 4th quarter results <strong>2008</strong>/preliminary annual results <strong>2008</strong>2 April <strong>Annual</strong> General Meeting30 April 1st quarter results <strong>2009</strong>13 August 2nd quarter results <strong>2009</strong>22 October 3rd quarter results <strong>2009</strong>26 November Capital Markets Dayhighlights <strong>2008</strong>Achievements Subsea full field delivery to Reliance Adriatic LNG terminal delivered to ExxonMobil Five metals EPCM projects awarded inSouth America Four production facilities for the Kashagan field Seven drilling equipment packages to variouscustomersAcquisitions Aker Marine Contractors AS, an internationalprovider of marine operations and installationservices to the oil and gas industry Qserv Ltd, aleading provider of well, process andpipeline services in the North Sea and internationalmarketsFrom Aker <strong>Kvaerner</strong> to Aker Solutions Aker <strong>Kvaerner</strong> re-branded to Aker Solutions in April The new name represents asimplification andstrengthening of our corporate identity and outlinesour offering of comprehensive industrial solutions It identifies our connection with Aker, andcommunicates Aker’s long term committedownership of our companyMajor contract awards Modification contracts for StatoilHydro(NOK 3.2 billion) FEED for greater Ekofisk area contract forConocoPhillips (NOK 120 million) Refinery EPCM frame contract with Shell, Germany(EUR 100 million) LNG terminal contract for US Gulf LNG Energy JV(USD 680 million) Esperanza &Toromocho copper and goldcontracts in Chile and Peru (USD 50 million) Twelve drilling equipment contracts (USD 1.4 billion) Eight drilling risers system contracts(USD 335 million) 45 subsea trees contract for Petrobas, Brazil(USD 220 million)6Aker Solutions annual report <strong>2008</strong>
About uskey figures <strong>2008</strong>Orders and results <strong>2008</strong> <strong>2007</strong> 2006Order backlog 31.12 NOK mill 58 016 58 261 59 695Order intake NOK mill 55 590 57 942 62 271Operating revenues NOK mill 58 252 57 957 50 592EBITDA NOK mill 3382 3913 2872EBITDA margin Percent 5.8 6.8 5.7Net profit NOK mill 1513 2464 1294Cash flow <strong>2008</strong> <strong>2007</strong> 2006Cash flow from operating activities NOK mill -868 2675 2636Balance sheet <strong>2008</strong> <strong>2007</strong> 2006Interest-bearing debt NOK mill 6716 1615 1568Equity ratio Percent 20.1 25.5 25.8Return onequity Percent 17.6 33.9 46.7Return oncaptial employed Percent 8.8 17.0 12.5Share <strong>2008</strong> <strong>2007</strong> 2006Share price 31.12 NOK 45.00 144.50 155.60Dividend per share NOK 1.60 3.00 8.00Earnings per share NOK 5.34 8.84 4.53Employees <strong>2008</strong> <strong>2007</strong> 2006Employees 31.12 Full time equivalents 23 360 21 298 19 230HSE <strong>2008</strong> <strong>2007</strong> 2006Lost time incident frequency Per mill worked hours 0.93 0.68 1.00Sick leave rate Percent of work hours 2.27 2.41 2.281) Incl. subordinated loanOperating revenuesAmounts in NOK millionEBITDAAmounts in NOK millionOrder intakeAmounts in NOK millionOrder backlogAmounts in NOK millionED&S 22 684ED&S -475ED&S 16 681ED&S 18 315Subsea 11 206Subsea 1228Subsea 11 466Subsea 11 876P&T 14 216P&T 1448P&T 16 121P&T 14 705P&C 10 702P&C 904P&C 11 291P&C 13 300Aker Solutions annual report <strong>2008</strong> 7
About usThe preferredpartner8Aker Solutions annual report <strong>2008</strong>
About usGoals and strategyAker Solutions’ goalsand strategyAker Solutions’ vision is to be the preferred partnerfor solutions in the energy and process industriesthrough:Targeting selected areas and markets where wecan apply our unique skill sets in field development,operations and maintenance services Cold climates Harsh environments Deeper watersCreating the preferred subsea lifecycle partner Be closer to thecustomercore, move towardsthe well stream and reservoir Combine offerings and technology leadership throughout the subseavalue chain Achieve profitable growthDeveloping further unique technologies andknow-how Advanced drilling and subsea products Technologies for floating production Grow Process &Construction in Asia and South AmericaContinuing to grow our service business Product- and technology-based services Well intervention and processing services Lifecycle offering in partnership with the customerIncreasing the efficiency and flexibility of ourcost base Risk management and project execution Improvement programmes and cost consciousness Sound financial managementContinuing to enhance health, safety andenvironmental (HSE) performance Further develop our Just Care HSE culture Continue to improve our responsibilities as acorporate citizen Be apreferred employer in our marketsAker Solutions annual report <strong>2008</strong> 9
About usVision and valuesVision and valuesIn any organisation, values areessential for building trust –ineach other, inour partners, inour customers and with society.All the Aker companies shareacommon set of values –the compass that guides ourpolicies, our operations and,ultimately, our behaviour.HSE mindset Customer drive Delivering resultsWe take personal responsibility forHSE because we careAll incidents can beprevented. Westrivecontinuously for zeroaccidents to personnel,material and non-material assets. We focuson employee health and on continuouslyimproving the work environment.We conduct our operations throughefficient use of materials and energy, withminimum waste and damage to the environment.We design products and services tohave no undue environmental impact, tobe safe and to be efficient in consumingenergy and natural resources. We seek toensure that our products can be recycledor disposed of safely.“We take personal responsibility forHSE because we care about people, theenvironment and our company.”Just CareBuilding customer trust iskey toour businessAfter all, without customer trust and satisfaction,the rest doesn’t matter. Goodcustomer references build our reputation –and the only way to achieve this is byconsistent and predictable performance.Our customers will recognise us for ourglobal execution excellence. We find newways, always linked to real customer needsand business priorities.We deliver consistently and strive tobeat our goalsWhen doing ajob, weunderstand both therisks and the opportunities involved andknow how to manage them. We take pridein delivering as we promise.Making money creates new opportunitiesand the resources for going forward,both for us and for our customers and partners.Commercial edge benefits us all.We reward performance – what youachieve; and alignment with our values –how you behave.10Aker Solutions annual report <strong>2008</strong>
About usVision and valuesOur vision is to be the preferredpartner for solutions in theenergy and process industriesthrough living our values.Hands-on management Open and direct dialogue People and teamsWe know our business and getthings doneOnce decisions are made we combine allour efforts and focus all our energies onexecution.We are accountable and solutionsoriented,focusing on the right details atthe right time. We follow through andensure accountability.We believe in empowering people closeto the action to take responsibility. Handsondoes not mean hands-in.We stimulate entrepreneurship andchallenge bureaucracy, complicated hierarchiesand ‘silo’ mentalities. We are asingle company.We encourage early and honestcommunicationWe listen hard and talk straight: no sugarcoating, no filters.We value early, accurate and reliablecommunication –after all, the first problemwe encounter is usually the easiest one tocope with.We challenge each other. The bestdecisions aremade when different opinionsand different cultures meet in open anddirect dialogue.We expect the highest standards ofethical behaviour and integrity –from all ofus, everywhere.All our major achievements areteam effortsIn theend,itcomes down to thetalentandmotivation of youand me. Delivering strongresults is impossible without a highlycapable workforce. We learn onthe job,through challenging tasks, coaching andtraining.Development of people and teams inour company has one purpose –tocreateafoundation for long-term sustainable valuecreation through efficient project executionand asound business operation.We respect and encourage diversityand build strong, energised and effectiveteams –and we have fun together, makingus even better.Our goal is to be the preferred employerin our industry.Aker Solutions annual report <strong>2008</strong> 11
About usPresident &CEO interview12Aker Solutions annual report <strong>2008</strong>
About usPresident &CEO interviewCustomer drivenIn January <strong>2008</strong>, Simen Lieungh was appointed President &CEO ofAker Solutions. The former Aker <strong>Kvaerner</strong> executive vice president and20-year company veteran has spent his first year restructuring thecompany’s operations, positioning Aker Solutions to anticipate keymarket trends. We sat down with Lieungh to ask him about his thoughtslooking back at <strong>2008</strong>, and the way forward.How would you describe the company’sperformance in <strong>2008</strong>?“<strong>2008</strong> has been agood year for us. Iamvery satisfied with the way we continue toimprove our HSE performance. Incidentrates and sick leave remain low, and ourserious injuries are down comparedto <strong>2007</strong>. That proves our Just Careprogramme works, and is helping usimprove our business. In terms of majorachievements Iwould also like to highlightour full subsea field delivery to Reliance;the Adriatic LNG project delivered toExxonMobil; the award of five metalsEPCM projects in South America; thedelivery of four production facilities for theKashagan project; and the delivery ofseven drilling equipment packages. Withregards to our financial performance, weregrettably ended the year disappointingour investors. We failed to meet our ambitioustargets because of issues related totwo key projects in our portfolio. That said,we should not lose sight of the fact that theEBITDA result for <strong>2008</strong> is the second bestin our company’shistory.Weentered <strong>2009</strong>with asolid balance sheet, good liquidityand no additional financing requirements.We also remain confident that we willachieve the financial targets set for <strong>2009</strong>.”An important development in <strong>2008</strong> hasbeen the internal reorganisation of AkerSolutions’ business areas. Why did youdecide to merge the Field Developmentand Maintenance, Modifications andOperations (MMO) business areas intothe new Energy Development &Services(ED&S)?“Our customers are increasingly looking atthe development and maintenance of theirfields as one large, integrated operation.At the same time, offshore oil and gasdevelopments are moving towards deeperwaters and harsher environments. Webelieve that these new perspectives willgradually change our customers’ buyingpatterns. By merging our Field Developmentand MMO businesses into one, webelieve that we have created a uniquecombination of technologies, services andsolutions that will meet the developmentsin our customers’ demands better thanever before.”The second step involved arepositioningof Aker Solutions’ Subsea and Products& Technologies (P&T) business areas.What was the rationale behind that?“We decided to do this to reinforce ouroffering throughout the value chain ofsubsea technologies, products and services.Against the backdrop of a record orderbacklog and further opportunities in thedrilling market, we also resolved to alignour offering of drilling solutions, topsidetechnology products and services in arestructured P&T. Asaconsequence ourmarine operations, well service and geologicalconsultancy business units wereintegrated into our Subsea business area,while the drilling risers business wasreorganised into P&T.”<strong>2008</strong> seems to have been a year ofsignificant change in Aker Solutions.How would you describe the process?“I am very satisfied with how effectivelywe’ve managed to reorganise our business.It is inspiring to see how adaptive weare as an organisation, and it’s also astrength that we manage these changeswithout losing focus on what we deliverevery day. The best companies in ourindustries are the ones that are capable ofconstantly adapting to change, both intheir markets and the wider economy.”Considering the ongoing downturn inthe world economy, how do you look atthe future?“It is too early to say how the financial crisiswill impact our business and our markets,and it is still unclear how long it will last.But we have been through crises before,and the key changes we initiated in <strong>2008</strong>have given us ahead start in facing theglobal downturn. Early in the year we madefurther improvements to the flexibility ofour cost base as part of our effort tostrengthen our competitiveness and adaptto market developments. As aresult, whenthe crisis hit, we werealready implementingmeasures that would soon prove necessaryright across our industries –and identifyingfurther opportunities to reduce costs willcontinue to be an integral part of ouragenda in <strong>2009</strong>. We also won anumber ofsignificant contracts in <strong>2008</strong>, securing asolid foundation for the medium term. Iamconfident that, while short-term activitylevels might slow down, the fundamentaldrivers of demand in our markets will leadto long-term growth in our business.”Aker Solutions annual report <strong>2008</strong> 13
About usClarity, innovation and driveClarity, innovation and driveIn January <strong>2009</strong> Aker Solutions held its annual OperatingManagers’ Conference (OMC), bringing its executivemanagement team together with some 200 other leaders fromits international operations. At the OMC these leaders worktogether to share best practice, discuss opportunities andchallenges and get aligned for the year ahead.Aker Solutions entered <strong>2009</strong> with arestructured organisation, prepared fornew trends in its markets and in itscustomers’ behaviours, and set to respondeffectively to the increased uncertainties inthe global economy. The OMC providedthe opportunity for its new executivemanagement team –restructured like thecompany and with asimilar track recordoflong-term excellence –toset the directionfor all the leaders who, together, sharethe responsibility of delivering on thecompany’s vision: to be the preferredpartner.Focusing on what it takes to realisethat vision, the theme of this year’sconference was clarity, innovation anddrive.Our leaders’ ability to identify the needsof each of Aker Solutions’ individualcustomers –and the commercial edge tounderstand the opportunities those needscreate –isall about clarity. The capacityfor innovation is key to the continuousimprovement of our competitive position –to developing and commercialising noveltechnologies and new solutions to ourcustomers’ needs while ensuring that ourcompany performs better, day after day.Developing Aker Solutions and deliveringon our strategy requires drive – thecommitment that secures predictable,excellent performance meeting the expectationsof all our investors, customers,employees and other stakeholders.Clarity, innovation and drive are the“brand values” of Aker Solutions, encapsulatedin our new identity and endorsed byPresident &CEO Simen Lieungh and hisexecutive management team.The executive management team atAker Solutions’ Operating Managers’Conference <strong>2009</strong>.14Aker Solutions annual report <strong>2008</strong>
About usClarity, innovation and driveExecutive management teamAker Solutions ASASimen LieunghPresident &CEONiels Didrich BuchChief of Staff &EVPLeif BorgeCFO &EVPEnergy Development&ServicesJarle TautraEVPSubseaMads AndersenEVPProducts &TechnologiesPer Harald KongelfEVPProcess &ConstructionGary MandelEVPFor more information about theexecutive management team’sbackground, refer to page 138.Aker Solutions annual report <strong>2008</strong> 15
Our businessOur business16Aker Solutions annual report <strong>2008</strong>
Our businessBusiness areasbusiness areasEnergy Development &ServicesED&S develops new oil and gas production facilitiesoffshore and on land, as well as lifecycleservices for the operational phase of suchinstallations. The business area delivers the full valuechain from studies, front-end design and detailedengineering, through procurement, project management,fabrication and hook-up, to installation,maintenance and modifications.Page 18SubseaAglobal provider across the value chain of subseaand sub-surface technologies, solutions and services.Our offerings cover all phases of the life of fields, fromconcept screening and design through manufacturingand commissioning to operational support and maintenanceservices. Our ability as aprovider of subseaproduction systems is backed by an extensive portfolioof additional capabilities such as well services,marine operations including installation, and geologicalservices.Page 24Products &TechnologiesAleading global provider of specialised products andservices to the upstream oil and gas industry,based onproprietary technology and know-how.Key deliverablesinclude advanced drilling equipment, systems andrisers, upstream processing technology and mooringsystems, as well as loading and offloading technology.Page 30Process &ConstructionA global provider of management, design andconstruction of major projects across refining, petrochemicalprocessing and biorefinery,mining and metals,liquefied natural gas (LNG), gas- and coal-fired powergeneration, acid plants, nuclear cleanup services andwater treatment.Page 36Aker Solutions annual report <strong>2008</strong> 17
Our businessEnergy Development &ServicesEnergy Development&Services18Aker Solutions annual report <strong>2008</strong>
Our businessEnergy Development &ServicesPositioned for the futureThe Energy Development &Services (ED&S) business areadevelops new oil and gas production facilities, both offshore andonshore, and delivers operational services for the entire lifecycle ofsuch facilities.Highlights <strong>2008</strong> Successful delivery of theworld’s first offshore receivingand regasification terminal forliquefied natural gas -theAdriatic LNG project Construction of the world’smost advanced semisubmersibledrilling rigs, theAker Spitsbergen and AkerBarents of Aker H-6e design Long-term repeat business formaintenance and modificationswork in the North Sea Front-end engineering anddesign (FEED) contract forsubstantial work on the GreaterEkofisk Area, one of the majorupcoming redevelopments onthe Norwegian Continental Shelf Contract award injoint venturewith partners WorleyParsonsand Chicago Bridge &Iron(CB&I) for full field developmentFEED for the Kashagandevelopment Merger of two business areas tocreate Energy Development &Services, apowerful, focusedengineering and technology,fabrication and installation forcewith aflexible cost baseDevelopment EBITDANOK million1500Proven track recordWith experience from more than 20 percentof the oil and gas related floater designs inthe world, few if any contractors can matchour wide portfolio of solutions and servicesacross segments including floaters,concrete and arctic technologies. We have50 percent of our home market on theNorwegian Continental Shelf in both newbuild developments and maintenance andmodifications services. Within the maintenanceand modifications arena, AkerSolutions is the only major contractor thathas apresence in both the Norwegian andthe UK markets.Over the years we have achieved astrong position in the northern Caspianregion, most recently through our work onphase one of the giant Kashagan field offshoreKazakhstan.We are well positioned for upcomingfield developments in the Arctic region,including projects like the concrete gravitybase structure for Sakhalin Ionthe eastcoast of Russia; the large gas field development,Shtokman, in the Barents Sea; andfor developments in the deepwater regionof the Gulf of Mexico.Close toour customersThe business area maintains astrong basein Norway. Three main engineering andmanagement centres are located in Oslo,Stavanger and Bergen, while smalleroffices are kept close to our key customers’operational centres. Three fully-ownedconstruction yards on the coast of Norway,in Egersund, Stord and Verdal, are strategicallylocated on the doorstep of theNorth Sea market.Internationally, wehave afull fledgedservice base in Aberdeen in the UK andhave established local offices in Attyrauand Aktau in Kazhakstan. Remaining closeto our customers we also have engineeringoffices in Houston in the US, Perth inAustralia, St. Johns in Canada, KualaLumpur in Malaysia and Pori in Finland.The power to deliverED&S had an annual revenue of NOK22 684 million and 8 542 employees atyear end <strong>2008</strong>. This powerful resourceincludes 4000 engineers as well as avastpool of 3600 skilled operators. In <strong>2008</strong> wealso engaged an average of approximately4000 contract staff.Our three construction yards operateindividually as centres of excellence fordifferent construction tasks and, whencombined with our engineering andmanagement resources, are astrong EPCturnkey supplier for small and largeprojects.Changing with our customersIn March <strong>2008</strong>, Aker Solutions decidedto combine the strengths and streamlinethe operations of the previous businessareas Maintenance, Modifications andOperations (MMO) and Field Development(FD). The new business area, ED&S,became operational on 1September <strong>2008</strong>.Our large international organisationof skilled engineers, proven projectmanagers and experienced operatorsis recognised for its ability to seeopportunities, for adding value to customerbusinesses and for its predictabledeliveries. The new organisation is tailored1<strong>2009</strong>00600Key figures ED&S <strong>2008</strong> <strong>2007</strong> 20063000-300-6002006<strong>2007</strong><strong>2008</strong>Operating revenue NOK mill 22 684 24 921 24 594EBITDA NOK mill -475 1391 1244EBITDA margin Percent -2.1 5.6 5.1Order intake NOK mill 16 681 19 792 24 717Order backlog 31.12 NOK mill 18 315 24 317 29 764Number of employees 31.12 Man years 8542 8163 8493Aker Solutions annual report <strong>2008</strong> 19
Our businessEnergy Development &ServicesEntering the European windmillmarket. In <strong>2008</strong> Aker Solutionsdelivered six substructures for the firstGerman offshore test field “AlphaVentus”. The 700 tonne, 45 metresubstructures will be installed atawater depth of approximately 30metres.for increased international operationsand will leverage new build activities towin maintenance and modifications workon awider scale.Competitive advantagesDeepwater challenges, arctic conditionsand harsh environments are typical of ourhome market, making us apreferred partnerfor international developments withsimilar characteristics. Floating productiontechnologies, marine concrete structures,the gas value chain and particularlycomplex multidiscipline developments areall key areas of our expertise.This unique expertise is part of the basisfor our delivery of the Gjøa semisubmersibleproduction platform to StatoilHydro in<strong>2010</strong>.Ready for harsher environmentsOil companies are concentrating theirexploration activities and new develop-Long term repeat business in maintenance and modificationsHigh oil prices over the last fewyears have driven the developmentof the maintenance andmodifications market in the NorthSea. Where once the debate wasdominated by tail end production,cost saving programmes anddecommissioning, the focustoday is on developing existinginfrastructure through annualinvestments of up to NOK 100billion. Low pressure production,tie-ins, safety upgrades andextended lifetime upgrades areall examples of projects within themaintenance and modificationportfolio aimed at extendingfields’ production lifetimes by upto 30 years.With a50percent shareofthis marketin the North Sea, Aker Solutionsplays asignificant role. In <strong>2008</strong> wesucceeded in releasing options forrepeat work on two significantcontracts: Tampen and StatfjordLate Life.Ensuring high productivityon nine platforms in theTampen areaIn the Tampen area, outside midNorway, our scope of maintenanceand modification work now includesnine platforms in the Gullfaks, Snorre,Statfjordand Vigdis fields. We deliverapproximately 1.8 million manhourseach year and ensurehigh productivityand safe operations for these giantplatforms –all but one constructedby Aker Solutions over the last 30years. In July,options werereleasedby StatoilHydro toAker Solutionsextending the work to 2011. Thecontract for the whole area wasestablished in 2002 and, if all optionsaredeclared, will run to March 2013.Rebuilding Statfjord fromoil to gas productionThe Statfjord field, discovered in1974, has been one of the key oilproducers in the North Sea. Throughaseparate contract from April 2005,StatfjordLate Life, Aker Solutionshas taken on the challenge ofrebuilding the StatfjordBand Cplatforms from oil production to theproduction of gas. In December<strong>2008</strong>, options were released byStatoilHydrofor phase three of thecontract, extending the work to 2011.By exercising their options on thesetwo contracts, our customer,StatoilHydro, shows their satisfactionwith the services we provided in thefirst phases of the strategicallyimportant Statfjord Late Life andTampen projects.Long term contract.Our contract withStatoilHydro for theTampen area lasts untilMarch2011, with optionsto extend to March2013. This long terminvolvement creates thebasis for developing aclose alignmentbetween customer andcontractor.20Aker Solutions annual report <strong>2008</strong>
Our businessEnergy Development &Services“We are well positioned for themajor developments in our targetmarkets”ments in ever deeper waters and harsherenvironments. US Geological Survey anticipatesthat up to 25 percent of the world’sunproven reserves are tobefound in theArctic and surrounding regions. For us thisrepresents agreat opportunity, since fielddevelopments for arctic conditions,environmentally sensitive areas and deepwaters are our core competence.New achievements and repeatbusinessOur construction of the world’s mostadvanced semisubmersible drilling rigs,the Aker Spitsbergen and Aker Barents,and the construction and installation of theworld’s first offshore terminal for thereceiving and regasification of liquefiednatural gas, stand out in <strong>2008</strong>. Bothprojects rank as international milestones.In September, ConocoPhillips awardedus a front-end engineering and design(FEED) contract covering the first threephases of asignificant part of the GreaterEkofisk Area, including FEED work for twoplatform topsides, three jackets, bridgesand substructures.In the Caspian region we hold astrongposition in the ongoing phase one developmentof the giant Kashagan field offshoreKazakhstan. During <strong>2008</strong> we delivered fourtopsides and utility modules from our ownyards. We also mobilised for alarger role inthe hook-up phase of the field modules,employing more than 1400 people on theproject by the end of <strong>2008</strong>.In joint venture with CB&I and Worley-Parsons, we received aletter of intent fromAgip KCO in October, followed by acontract award in December for FEEDservices for phase two of the full-fielddevelopment of the Kashagan field. Thescope of work includes both onshore andoffshore facilities and pipelines. It alsoincludes options for further involvement infollowing phases as well as neighbouringfield developments.The maintenance and modificationsmarket has along term, steady level ofinvestment in order to maintain safe andefficient operations, increase recoveryrates and ensure compliance with localregulations. Activity within this market hasbeen high in <strong>2008</strong> with significant repeat,long term business. Our maintenance andmodifications contract at Tampen coversnine platforms and employs 500 engineers.StatoilHydro released two options underthis contract to Aker Solutions in July <strong>2008</strong>.In December <strong>2008</strong>, an option under theStatfjord Late Life project was exercised,extending work on the Statfjord Band Ctopsides to 2011.Goals and objectives for <strong>2009</strong>Our main emphasis is on growing the businessby maintaining our North Sea marketshare, expanding in the internationalmarket and strengthening our technologybase. We will secure our share ofthe: growing gas market field life extensions for North Seafacilities emerging floating LNG market growing deepwater market emerging opportunities in arctic areas stable North Sea development market expanding northern Caspian Seaactivities sustainable shallow water businessin South East AsiaStrong fundamentalsDue tothe global financial crisis evolvingin <strong>2008</strong>, weexpect to see some delays inawarding new build projects in <strong>2009</strong>. However,the long term outlook for strategicnew build activities is still promising andwe are well positioned for the majordevelopments in all our target markets. Weexpect continued high demand for maintenanceand modifications services in <strong>2009</strong>.Gjøa –anFPS with environmentalfocus. Our unique floating platformexpertise ispart ofthe basis for ourdelivery of the Gjøa platform toStatoilHydro in <strong>2010</strong>. Gjøa will be thesecond field off Norway tobepowered by hydroelectric powertransmitted via cable from land. Thiswill reduce carbon emissions.Developing the Kashagan field.We are playing asignificant part indeveloping one of the world’s largestoil fields, the Kashagan field intheCaspian Sea. In this demanding fielddevelopment wedemonstrate ourcompetitive strength inoffshore technologyinenvironmentally sensitiveareas and for harsh climaticconditions.Aker Solutions annual report <strong>2008</strong> 21
Our businessEnergy Development &ServicesApioneer project in LNGAker Solutions designed andmanaged the development of theAdriatic liquefied natural gas(LNG) facility, the world’s firstoffshore LNG receiving andregasification terminal, forExxonMobil. Our scope coveredthe entire terminal project includingengineering, procurement,construction management,assembly and hook-up, marineoperations and offshore completion.The terminal consists of aconcrete gravity base structure(GBS), two LNG tanks, topsidesfacilities and two concretemooring dolphins. Tenpercent ofItaly’s gas consumption will besupplied from this man-madeisland.The Adriatic LNG terminal is thefirst of its kind and represents aninternational milestone. All previousLNG terminals have been installedonshore. This pioneer project hasbeen made possible by combiningAker Solutions’ leading marine concretetechnology and regasificationexpertise with our broad offshoreexperience.The terminal was constructedand assembled in adry dock inPioneer project delivered in <strong>2008</strong>. The world’s first offshore receiving and regasificationterminal for LNG has been made possible by combining our worldleading marine concrete technology with our regasification expertise and broadoffshore experience.Algeciras, Spain. Then we relocatedthe entire structure, towing it to thefinal destination in the Adriatic Sea,17 km off the coast of Venice inItaly. The location was chosen withthe particular aim of ensuring theterminal is not visible from shore.Moving the completed terminalfrom Spain to Italy was amajormarine operation, carried out byAker Solutions. The 1700 nauticalmile trip to the Adriatic took threeweeks and used four large, oceangoingtugs.The project focus followinginstallation has been on the hookupand completion works for thetopsides. Initial operation of theterminal –LNG cool-down –isplanned for the first quarter of<strong>2009</strong>.The terminal will be owned andoperated by Adriatic LNG, ajointventurecomprising 45 percent QatarPetroleum, 45 percent ExxonMobiland ten percent Edison.Drilling into the futureAker Solutions’ assembly yard atStordinNorway dedicated mostof <strong>2008</strong> to completing the twoAker H-6e “extreme” drilling rigs,Aker Spitsbergen and Aker Barentsfor customer Aker Drilling. Theyare the biggest, most advancedsemisubmersible drilling rigs inthe world and can operate fordecades to come in the world’smost challenging waters.The Aker H-6e design is intendedboth for worldwide deepwater operationsand for harsh environments.It is configured for dynamic positioningin water depths of up to 3000metres. The designers’ environmentalgoals have been that therewill be no harmful discharges fromthe rigs to the sea and very lowemissions to the atmosphere. Therigs are designed to use so-called“green” chemicals, substanceswithout harmful effects on theenvironment, and are equippedwith state-of-the-art wastemanagement systems.The rigs are also fully winterised:their equipment and systems canoperate down to -20°C. Fully heatedand air-conditioned living quarters,with single bed cabins as well asdining and recreational facilities,make the working environmentonboard the rigs unique.With our new generation of drillingrigs, Aker Solutions enables the offshoredrillingindustry to operate in asafe and environmentally friendly wayin the most challenging surroundings.At the project’s peak, around4500 people from 40 nations wereinvolved in the assembly. With suchalarge, multinational work force,communication was areal challenge.To meet the challenge, the projectembraced four “official” languages:Norwegian, English, Polish andRussian.State-of-the-art drilling rigs. The Aker H-6e semisubmersible rigs are theworld’s most advanced drilling units, tailored to operate safely in harshenvironments and ultra deep waters.22Aker Solutions annual report <strong>2008</strong>
Our businessEnergy Development &Services1987263541 Tension leg platform for production and drilling2 Onshore gas receiving, processing and exportplant3 CO 2 capture plant offlue gas from el-powerproduction4 Jacket structure for shallow waters, with drillingand production facilities5 Harsh environment CONDEEP MonoFloater,with production facilities and storage capacity6 Concrete structure ConGas, supporting LNGstorage and an LNG regasification plant7 Wind turbinefoundations forshallow waterlocations8 Aker H-6e, the world’s largest and most advanceddrilling semisubmersible9 Semisubmersible production platform extremewater depths –may include drilling facilitiesAker Solutions annual report <strong>2008</strong> 23
Our businessSubseaSubsea24Aker Solutions annual report <strong>2008</strong>
Our businessSubseaSubsea lifecycle partnerAker Solutions is one of the world’s top four providers of subseasystems and related services. We aim to be apreferred partnerthroughout the value chain of subsea and sub-surfacetechnologies, solutions and services for the oil and gas industry.Highlights <strong>2008</strong> Record high activity andfinancial performance followingstrong market development Successful expansion andrestructuring of Subseabusiness area to reinforce ourposition throughout the valuechain of subsea and subsurfacetechnologies, solutionsand services First oil produced at RelianceIndustries’ MA-D6 field offshoreIndia Strengthened market position inBrazil through frame agreementwith Petrobras for 45 subseatrees plus first pre-salt layercontract for the Tupi field Long term subsea equipmentframe agreements signed withShell (Malaysia and UK), MurphyExploration &ProductionCompany (Gulf of Mexico) andBP (Angola and UK) Well Intervention Academyopened in Stavanger, Norway Key investment made throughacquisition of Qserv Ltd, aleadingwell service company operatingon the UK continental shelf Achieved 100 percentownership in Aker MarineContractors AS, and seconddeepwater construction vesselput into operationDevelopment EBITDANOK million1500Our offerings cover all phases of the life offield, from concept screening and designthrough manufacturing, fabrication, installationand commissioning to operationalsupport, maintenance and services. Ourcapabilities areavailable either as individualproducts and services or as completeengineering, procurement, constructionand installation (EPCI) deliveries. Our portfolioof products and services includes: reservoir evaluation services subsea field development subsea production systems subsea trees subsea control systems subsea manifolds and templates steel tube umbilicals and subseapower cables subsea processing and boostingtechnologies tie-in and connection systems surface and subsea wellheads marine operations and subseainstallation services (SURF) subsea lifecycle service support well intervention technologies andservicesThe restructured business area employsapproximately 6250 skilled and dedicatedpeople, including 1000 contract staff, basedin 26 locations around the world.Our headquarters are located in Oslo,Norway. Wehave regional sales and engineeringoffices, as well as manufacturingand service facilities, near all the key oil andgas hubs and deepwater regions in theworld, including the Gulf of Mexico, theNorth Sea, West Africa, Brazil and the AsiaPacific region –including India, Malaysiaand Australia.In <strong>2008</strong>, we had operating revenues ofNOK 11 206 million, an increase of 13.8percent compared to <strong>2007</strong>, and an EBITDAof NOK 1228 million, an increase of 27.9percent from <strong>2007</strong>.Lifecycle partnerOur ability as afull lifecycle provider forsubsea field developments is unrivalled inthe marketplace.An internal restructuring, announced inSeptember <strong>2008</strong>, combined all of AkerSolutions’ subsea production system technologies,marine installation capabilitiesand sub-surface know-how, technologiesand services, including well intervention,into one business area.One objective of this restructuring was tofacilitate the development of amore technology-drivenservice business, fuelled byour customers’ drive for increased oil recovery.With declining oil production ratesaround the globe, the drive for increased oilrecovery is moreimportant than ever.We have over the years developed astrong market position in subsea processingand boosting technologies. This has beenfurther highlighted this year through thecompletion of the subsea raw seawaterinjection pumps that will be installed atStatoilHydro’s Tyrihans field in theNorwegian Sea in <strong>2009</strong>. Once installed, thepumps are expected to increase the field’soil production by ten percent.Well intervention is another way toincrease oil recovery from existing fields.We have addressed this market actively formany years, but the acquisition of Qserv Ltd1200Key figures Subsea 1 <strong>2008</strong> <strong>2007</strong> 20069006003000Operating revenue NOK mill 11 206 9851 6941EBITDA NOK mill 1228 960 479EBITDA margin Percent 11.0 9.7 6.9Order intake NOK mill 11 466 12 377 11 747Order backlog 31.12 NOK mill 11 876 10 951 8775Number of employees 31.12 Man years 4108 3673 30282006<strong>2007</strong><strong>2008</strong>1) All numbers are based on old Subsea structure.Aker Solutions annual report <strong>2008</strong> 25
Our businessSubseaWork on asubsea tree at our manufacturingfacility in Curitiba, Brazil,which will see its manufacturingcapacity doubled by<strong>2010</strong> –ahead ofthe future wave of subsea developmentsinthe Brazilian pre-salt layer.–aprovider of well, process and pipelineservices –further expanded our offeringboth in terms of products, services andgeographical footprint.Our ability to install our own subseaequipment is another competitive advantage.That is why we acquired the remainingshares in Aker Marine Contractors AS in<strong>2008</strong>. This acquisition reflects our longterm strategy to expand our foothold andfurther strengthen our position across thevalue chain of marine operations andsubsea oilfield services.Record-breaking first oilWhen India’slargest private sectoroil company, Reliance Industries,produced first oil from its MA-D6field located in the Bay of Bengaloffshore India on 17 September<strong>2008</strong>, it marked aproud milestonefor Aker Solutions and the rest ofthe Aker family.The entire field development –from discovery to production of firstoil –happened within the space ofless than two and ahalf years.Never has asupplier delivered suchacomplex deepwater project soquickly, and never has afieldbeen developed in such ashorttime.The Aker family of companieswas responsible for the entireMA-D6 field development. Deliveringthis unique development has been atestament to the fast-track approachtaken with Reliance Industries andthe combination of strengths andknow-how brought by Aker.Aker Solutions manufacturedand delivered acomplete subseaproduction system, including steeltube umbilicals, and managed theinstallation of the subsea equipment.Aker Floating Production convertedand delivered the floating production,storage and offloading vessel (FPSO)Dhirubhai 1,while Aker Solutionsalso delivered process equipmentand amooring and offloadingsystem to the FPSO. Both thesubsea system and FPSO weredelivered in less than 16 months –atruly remarkable achievement.The subsea trees, manifold,control systems and steel tubeumbilicals for this project weremanufactured at our facilitiesacross the globe including inNorway, Malaysia and the UK.Long-term growth expectedThe subsea market continued to grow in<strong>2008</strong>. Over the next 20 years, the InternationalEnergy Agency (IEA) predicts that productionof oil and gas from deepwater fieldswill increase by seven percent per annum.Market analysts predict that investmentsin subsea equipment will continueto grow at an annual rate of approximatelyten percent in the coming three years,reaching acapex of USD 10 billion.The subsea umbilical market also remainsstrong. According to Quest Offshore, wewere in<strong>2008</strong> once again the leading globalmanufacturer of steel tube umbilicals, withamarket share of40percent.High activity<strong>2008</strong> was agood year, with record highrevenue and results.Among key contracts awarded in <strong>2008</strong>werethe USD 223 million frame agreementwith Petrobras for the delivery of 45 subseatrees, and the USD 235 million deal withReliance Industries for the installation andcommissioning of phase two of thecompany’s MA-D6 field development.The contracts to deliver asubsea productionsystem to Eni’s Oyo developmentoffshore Nigeria, and nine subsea treesand controls to Petrobras’ Tupi field offshoreBrazilwerealso important milestones.Several other frame agreements weresigned in <strong>2008</strong>: afive-year deal with ShellUK to supply subsea control systems to itsNorth Sea developments; aframe contractwith BP for delivery of subsea umbilicals toits PSVM ultra-deepwater field developmentoffshore Angola; a five-year supplyagreement with Shell Malaysia for supply ofsubsea production systems; and an agree-26Aker Solutions annual report <strong>2008</strong>
Our businessSubseaAftermeeting the <strong>2008</strong> salestargetsfor our RapidSolution well set programmeas early asApril, adecisionwas made to double the size oftheprogramme which offers fast-trackdeliveries of subsea well sets.ment with Murphy Exploration &ProductionCompany to provide subsea trees, controlsystems and umbilicals to the company’sGulf of Mexico programme.Long-term frame agreements with keycustomers underpin our ambition to be thepreferred subsea lifecycle partner. Suchagreements also offer acertain level of predictabilitywith regards to both order intakeand project execution, and play an importantpart in our growth strategy going forward.<strong>2008</strong> has also seen key investments intoour facilities around the world. At the end ofMay, we opened the Well InterventionAcademy, afacility in Stavanger, Norway,which aims to give new generations ofoffshoreoperators and engineers first-handexperience in critical well intervention activities.Anew operations base was opened inPerth, Australia, in June. In September thedecision was made to invest in our manufacturingplant for subsea trees in Curitiba, Brazil,to double its production capacity by <strong>2010</strong>.<strong>2009</strong> goalsOur ability to be our customers’ partnerthroughout the life of afield is unrivalled inthe market. We will ensureweare organisedto capitalise on the opportunities this offersthrough an efficient restructuring of ourresources.Increasing our service revenue –throughboth growth in installed base and amorecomplete offering of technology-driven servicessuch as well intervention –will be akeyfocus. Further investments into our servicefacilities worldwide and our rental tool businesswill be additional drivers to achieve this.We also have an objective of increasingour market share in subsea trees, whilecontinuing to be selective about theprojects we undertake.Exciting timesAn increasing number of subsea developmentswill move into deeper waters. Thistrend will continue to drive demand fornew technology and more subsea supportinfrastructure. Our technology portfolio andthe skill set of our people arewell suited tocapitalise on this opportunity.Despite some short term uncertainties,the medium- and long-term market outlookis very positive, and tendering activityremains high as aresult.Boosting production from TyrihansIncreasing oil recovery andproduction rates from their reservoirsis an appealing prospect forany oil operating company.That iswhy StatoilHydrowill be utilisingAker Solutions’ SeaBoosterpump system technology for itsTyrihans development in theNorwegian Sea.In June 2006, Aker Solutions signedaletter of intent with StatoilHydroto provide asubsea raw seawaterinjection (SRSWI) pump system tothe Tyrihans field. The task was todevelop technology that wouldincrease oil production from thefield by ten percent.At the end of <strong>2008</strong>, the manufactureofthe three pumps wascompleted and they were transportedfrom Aker Solutions’ facilityat Tranby, Norway, toHorten,Norway, where they underwentinstallation testing.At the heart of the SeaBoostersystem for Tyrihans will be twoLiquidBooster centrifugal pumps,adesign evolved from Aker Solutions’long-established proprietarypump technology for exportingcrude oil and pumping producedwater. The pump system will beinstalled in 270 metres water depthapproximately 31 kilometres fromthe Kristin platform. Both the testedpump duty of 2.7 megawatt and the31 kilometre step-out representnew records for subsea pumps.The pumps will draw in 14 000cubic metres of untreated seawatereach day,injecting it into the sea bedbetween the oil reservoirs TyrihansNorth and South. When this is combinedwith gas injection, optimalpressure support is obtained in thereservoir and ahigher degree of oilrecovery and production is achieved.It is expected that the pumps alonewill help increase production by 19million barrels of oil during the field’slifetime.Production from the Tyrihansfield is due to start in <strong>2009</strong>.In <strong>2007</strong>, the SeaBooster systemwas acknowledged with aprestigious“Spotlight on New TechnologyAward” at the Offshore TechnologyConference (OTC) in Houston.One ofthe TyrihansLiquidBooster pumpsduring installation testingin Horten, Norway.Aker Solutions annual report <strong>2008</strong> 27
Our businessSubseaDown in the ultra-deepAn increasing percentage of futuresubsea production is expected tooccur in ultra-deep waters. Suppliersto the world’soil and gascompanies continue to push thedevelopment of technologies tomake production moreeconomicwith less risk. Aker Solutions hasbeen in aleading position in thisevolving market for many years.One of the milestones in this areaof excellence for Aker Solutions isPetrobras’ Cascade &Chinookproject in the Gulf of Mexico. We aredelivering 65 kilometreofpower andcontrol umbilicals for this subseadevelopment in water depths of2700 metres. The medium-voltagepower umbilicals will be tied backto an FPSO at 2500 metres waterdepth, making these the deepestever dynamic power umbilicals.Traditional power umbilical designhas relied on steel reinforcement.At greater depths, steel becomescounter-productive as increasingweight causes unacceptable strainin the umbilical. At water depths ofmore than 2000 metres, new ideaswererequired. Our talented engineerscame up with the innovative idea ofusing carbon fibre reinforcementrods instead of steel. This met thechallenge of strengthening theumbilical with minimum addedweight, acrucial combination forultra-deep water umbilical design.Another challenge presented bythe Cascade &Chinook powerumbilicals is the connection to theFPSO, the first ever deployed in theGulf of Mexico. The power umbilicalsare designed to connect to abuoy mounted at the bottom of theFPSO. In the event of atropicalstorm, the buoy will detach fromthe FPSO and drop, along with theumbilicals, to apredeterminedwater depth, allowing the hostvessel to retreat to safety. Hereagain the role of the carbon fibrerods is important, as they make theumbilicals more capable ofhandling the load without beingdamaged.This innovative design has beenpatented by Aker Solutions. Thepower umbilicals are scheduled fordelivery to Petrobras in late <strong>2009</strong>.Marine operations –into the deepAker Solutions successfully executedtheir first major marineoperations contract in the Gulf ofMexico, the Blind Faith projectfor the Chevron group, in <strong>2008</strong>.The Blind Faith deepwaterdevelopment is asemisubmersibleplatform located in MississippiCanyon block 650, approximately162 miles south east of New Orleans,in 6500 feet (2 000 metres) waterdepth. The offshore facility, whichis Chevron’sdeepest, achieved firstoil on 11 November <strong>2008</strong> and isdesigned to produce 65 000barrels of crude oil and 55 millioncubic feet of gas per day.This complex delivery demonstratesour leadership on this newdeepwater frontier. The projectintroduced the BOA Sub Coffshoreconstruction vessel to the Gulf ofMexico in October <strong>2007</strong>, andtogether with BOA Deep C, the twostate-of-the-art multi-purposeoffshore construction vesselsworked in tandem to meet therequirements of this demandingproject.The scope of the project wasdivided into several phases,including five separate majormobilisations to gather vessels,equipment and personnel in portfor the different transport andinstallation marine operations. Thecomplete scope of work includedengineering, procurement and construction(EPC), delivery of the off-hullmooring components, transportationof the hull from Norway to Texas,and transportation of the topsidefacilities from Louisiana to Texas.The offshore installation includedsuction piles and mooring componentsand asubsea system,including subsea trees, manifold,umbilical jumpers, and flying leads.The semisubmersible platform wastowed from Ingleside, Texas, out tothe Gulf of Mexico for final mooringand hook-up, prior to the steelcatenary risers and umbilicals beinginstalled and tied in to the platformproduction system. Numerouscross-functional groups withinAker Solutions collaborated tosuccessfully deliver the project.Aker Solutionsstrengthened its subseainstallation capabilitiesthrough acquiring 100percent ownership of AkerMarine Contractors ASin<strong>2008</strong>. Two state-of-the-artdeepwater constructionvessels –BOA Deep CandBOA Sub C–are charteredby Aker Solutions.28Aker Solutions annual report <strong>2008</strong>
Our businessSubsea25163741 Well intervention vessel2 Marine operations and subsea installationservices3 Deepwater subsea production system4 Subsea processing and boosting5 Shallow water subsea production system6 Steel tube umbilicals7 Well servicesAker Solutions annual report <strong>2008</strong> 29
Our businessProducts &TechnologiesProducts &Technologies30Aker Solutions annual report <strong>2008</strong>
Our businessProducts &TechnologiesTechnology &lifecycle offeringAker Solutions’ business area Products &Technologies (P&T)delivers specialised products and services to the upstream oil andgas industry. Our business is driven by two main segments:deepwater and harsh environment drilling, and floating production.Highlights <strong>2008</strong> Strong growth in all businesssegments with record highEBITDA 12 drilling equipment contractsawarded worth approximatelyUSD 1.4 billion Maintained market share greaterthan 40 percent on drillingsolutions for deepwater drillingrigs. Seven drilling equipmentpackages delivered successfully Six drilling riser contractssigned worth approximatelyUSD 260 million Record high order backlog forthe marine segment Strong demand for upstreamprocess systems for FPSOconversions and new builds Steadily growing installed baseis driving astrong lifecyclemarket Acquisition of First InteractiveAS (60% ownership) Strengthened market position inBrazil through the opening ofnew drilling risers facility andreinforcement of local supportofficeDevelopment EBITDANOK millionKey deliverables for the business areainclude: advanced drilling equipment, solutionsand risers upstream processing technology mooring systems loading and offloading technologyOur customer base includes the world’slargest oil companies, contractors andshipyards. Our products and technologieswereinitially developed for and used in theNorth Sea market, but are now being usedextensively around the world as exportsmake up the bulk of our deliveries.After the restructure we have 2860employees and 900 contract staff contributingto our international business in morethan 27 locations worldwide. Our headquartersareinNorway and we have offices,service bases and production facilities inkey oil and gas producing regions all overthe world. Our increasing installed baseprovides significant lifecycle opportunities.In <strong>2008</strong>, we had operating revenues ofNOK 14 216 million, an increase of 15.1percent compared to <strong>2007</strong>.Deepwater and harsh environmentdrillingAker Solutions isaworld class provider ofdrilling solutions, equipment and risers.With our own engineering, procurement,fabrication and operational support teamsdelivering drilling and mud equipment,modules, RamRig and conventionalsolutions for the high-efficiency drillingmarket, we are well positioned for futuredemand. Aker Solutions is acomplete drillingrisers supplier including buoyancy,withproject support, execution and serviceteams being built up in Norway, the US,Malaysia and Brazil.FPSOs, upstream process andmarine equipmentThe upstream oil and gas market’s trendtowards new frontiers, deeper waters andincreased natural gas production willboost the demand for advanced floatingproduction and upstream processingsystems. Aker Solutions meets thisdemand by offering leading edge processequipment for the treatment of oil, gas,produced water and solids for theupstream oil and gas industry, offshoreand onshore. We are aworld leader in thedesign and supply of all types of deckmachinery and mooring systems formarine and offshore applications, as wellas oil and gas loading and offloadingsolutions.Aker Solutions has delivered strongresults and we have strategically positionedourselves as aglobal provider of specialisedproducts and services to the upstreamoil and gas industry. We realise our fullpotential within the drilling and topsidetechnology sector and strive to continuouslydevelop our international base.Capacity, competence and wellproventechnologyThe markets for our products and services,in particular the drilling equipment segmentfor deepwater rigs, experienced significantgrowth during <strong>2008</strong>. We have demon-15001200Key figures P&T 1 <strong>2008</strong> <strong>2007</strong> 20069006003000Operating revenue NOK mill 14 216 12 353 7572EBITDA NOK mill 1448 959 531EBITDA margin Percent 10.2 7.8 7.0Order intake NOK mill 16 121 10 733 12 997Order backlog 31.12 NOK mill 14 705 11 520 12 741Number of employees 31.12 Man years 4003 2666 21672006<strong>2007</strong><strong>2008</strong>1) All numbers are based on old P&T structure.Aker Solutions annual report <strong>2008</strong> 31
Our businessProducts &TechnologiesThe Maersk Resolute, ahighefficiency jack-up rig, was deliveredin <strong>2008</strong>.Market conditionsDuring <strong>2008</strong> the market has remainedstrong in all segments and high activitylevels have been maintained throughoutthe year. Contracts for twelve drillingequipment systems have been awarded,three seawater treatment/sulphate removalsystems were ordered and anumber ofoffloading system contracts were alsosecured. Strong growth in new builds ofdeepwater drilling units has resulted in ahigh order intake for our facilities in Braziland Malaysia. The order backlog goinginto <strong>2009</strong> is at arecord high, and moreimportantly is of high quality.The global financial crisis is predicted toresult in amarket slowdown in the shortterm, but will be partly offset by moreupgrades and service contracts. Our viewon the long term fundamentals for the P&Tbusiness area remains positive.strated our strong market position bywinning twelve complete drilling equipmentpackages and six drilling risercontracts in <strong>2008</strong>. We have proven ourability to execute advanced drilling equipmentprojects. A total of seven mobiledrilling rigs with Aker Solutions’ drillingpackages have been completed during<strong>2008</strong>. We also hold a major position inseveral upstream technology segmentsincluding advanced drilling equipmentsolutions, process systems and mooringand offloading systems. Our growinginstalled base in all our target segmentsyields asteadily growing lifecycle businessserviced by our established worldwidepresence.3D visualisation of drillingoperationsAker Solutions’ operator training simulatoris amajor breakthrough in operator trainingfor complete drilling crews. The simulatoris developed by First Interactive (60percent owned by Aker Solutions) and thesafety training is organised and facilitatedby Aker Solutions’ drilling equipment unit.Worldwide there is a requirement for8000–10 000 trained crew members. AkerSolutions’ new generation drilling simulatorincludes realistic 3D visualisation and realtimescenario building. The simulator willprimarily be used for training rig operators,but also enables significant reductions incommissioning costs for drilling rigscurrently under construction. The 3Dtechnology and competence can also beapplied to other parts of Aker Solutions’business including marine installation,subsea and well services.New facilities for riser productionand assembly inMalaysia and BrazilIn <strong>2008</strong>, Aker Solutions opened Brazil’ssole manufacturing centre for deepwaterdrilling risers. Located in Rio das Ostras,the unit is ideally positioned to serve thefast-growing Brazilian oil industry,with theability to deliver to other regions of theworld and to capitalise on the growth inthe global rig market. This further strengthensour service base, complementing ourfacility opened in Port Klang, Malaysia,in <strong>2007</strong>.Astate-of-the-art deepwatermarine drilling risersystem,including buoyancy.32Aker Solutions annual report <strong>2008</strong>
Our businessProducts &Technologies“Our combined capacity, competence and wellproven technology ensures continued growth andvalue creation for our stakeholders”Developments in <strong>2008</strong>Throughout <strong>2008</strong>, our positions in thedrilling and topside equipment-relatedindustries have been strengthened and oursignificant order backlog now stretches farinto 2012.<strong>2008</strong> proved to be avery successfulyear with records established for bothrevenues (NOK 14 216 million) and EBITDA(NOK 1 448 million, up from NOK 959million last year). Key developments in <strong>2008</strong>included an excellent order intake with theaward of two new drilling equipmentcontracts from the Jurong shipyard inSingapore with atotal value of USD 419million. In addition, acontract was signedwith Daewoo in Korea for the delivery ofdrilling equipment for two rigs for the enduser Odebrecht.At the beginning of <strong>2008</strong>, Aker Solutionsacquired a majority shareholding in theNorwegian company First Interactive AS.Using Aker Solutions’ First Interactivetechnology, we are now developing aservice-based drilling optimisation solutionwith full real-time 3D coverage for theentire drilling operation.In <strong>2007</strong>, Aker Solutions acquired 50percent of the shares in German companyWirth GmbH. During <strong>2008</strong>, there has beenan ongoing harmonisation processbetween Wirth and Aker Solutions’ drillingequipment unit. This process will continue,further optimising the excellent fit ofcomplementary technologies between theunits. In January <strong>2009</strong>, Aker Solutionsentered into an agreement to acquire theremaining 50 percent share ofWirth.Goals for <strong>2009</strong>We will continue to focus on two targetmarkets for the development of our business:deepwater drilling including topsidedrilling equipment and solutions, drillingrisers and mooring systems; and floatingproduction units (mooring and offloadingequipment and upstream processing technologies).In addition we will increase ourfocus on upgrades of drilling packages inthe North Sea as well as global sales ofdrilling equipment with attractive lifecyclepotential. We will continue to develop ourdeepwater drilling and floating productionoffering organically and through carefullyevaluated acquisitions. With a growinginstalled base of equipment and technologies,our aim is to increase serviceand lifecycle revenues. Our businessportfolio will also be strengthened by ourcustomers’ increased demand for simulatorbasedand conventional training andcondition-based monitoring.Moving forwardOur business has grown rapidly over thelast few years. Although the short-termmarket outlook is uncertain, we believe thefundamentals remain strong for mediumandlong term growth. Due to the strongorder situation our expected activity levelin <strong>2009</strong> will be comparable to previousyears within most of our segments. Lifecycleand service volumes are steadilyincreasing as the installed base grows,which we expect to continue. Moreover,the demand for upgrades and overhauls islikely to increase, both in the North Seaand elsewhere. At year end our order backlogamounted to NOK 14 705 million, withdeliveries through 2012 –forming asolidfoundation for our future.Strengthening products and topsidetechnologies offeringTo be in the forefront of key developmenttrends in our markets, Aker Solutionsdecided in <strong>2008</strong> to change the structure ofits Subsea and P&T business areas. Thesechanges would meet the developing needsof our customers, provide for strengthenedgrowth and take full advantage of the synergiesin our deep water drilling business.Bringing our drilling risers business into theP&T business area further enhanced ourdrilling solutions and topside technologiesoffering.Through the restructuring of the P&Tbusiness area we gain astronger globaldrilling and topside portfolio to betterposition ourselves for future growth andvalue creation. From this reorganisation wehave increased access to competence andtechnologies and we have strengthenedAker Solutions’ ability to mature projectsand pursue business opportunities.Arctic opportunitiesDuring <strong>2008</strong>, the offloading ofcrude oil from terminal to shuttletanker was successfully performedat the Varandey field in theBarents Sea. The offloading, fromthe Fixed Offshore Ice-ResistantOff-Loading Terminal (FOIROT)with the purpose-built, iceclassed shuttle tanker, VasilyDinkov, was the first of its kind.The FOIROT is owned by theRussian oil company Lukoil,which holds the operator licensefor the Varandey field, while theVasily Dinkov is owned bySovcomflot.Aker Solutions designed and deliveredthe Pusnes offshore loadingsystem installed on the VarandeyFOIROT. The system allows for thesafe and efficient offshore transferof crude oil onto highly sophisticatedice-classed shuttle tankers.These specialised loading systemsare developed for arctic conditionsand the protection of the arcticenvironment, which has the highestenvironmental standards.The Vasily Dinkov is equippedwith the Pusnes bow loadingsystem, as are all shuttle tankersoperating on the field. AkerSolutions has received orders forthe bow loading systems, whichinclude additional safety featuresfor the protection of the arcticenvironment, for atotal of 12 arcticshuttle tankers.The Varandey field has approximately245 days each year withtemperatures as low as -48 ºC,and an ice thickness of 1.25–1.8metres. The equipment developedfor the FOIROT by Aker Solutions isunique to this type of operation.It includes an advanced controlsystem for regulating the physicalinterface between the terminal andtanker during loading.Aker Solutions annual report <strong>2008</strong> 33
Our businessProducts &TechnologiesClearer outlookwith vapourrecoveryReduced emissions of volatileorganic compounds (VOCs)during oil loading operationsoffshore and onshore has increasinglybeen arequirement of theNorwegian Pollution ControlAuthority (SFT) and internationalenvironmental agreements. AkerSolutions delivered StatoilHydro’snew oil vapour recovery plant atMongstad, which meets therequirements set by the SFT.In June 2006, Aker Solutions signedacontract for the design and deliveryof aVOC unit to the Mongstadterminal. These systems reduce thedischarge of environmentally hazardoussubstances and significantlyreduce the loss of valuable energyresources through the vaporisationof oil. In addition, they reduce thesafety risks of distributing andhandling oil vapour.Delivery was achieved in June<strong>2008</strong>. The new VOC plant capturescrude oil vapours, which are thenpurified and piped back into theship’s hold as oil components inliquid form. The plant has recentlyencountered some regularity issuesin relation to the stability of itsoperations which are now beingovercome.The plant’s peak capacity is36 000 cubic metres of vapour perhour. Itrecovers at least 90 percentof the non-methane VOC emissionsthat were previously released toatmosphere, which reflectspositively on the environment. Theplant actively recovers vapoursfrom two jetties simultaneously.The RamWinch, an on-vessel mooring system, was developed in 1997 and isdesigned asanalternativeto conventional rotating winches. Several systems have been delivered for various floater applications.Well positioned drilling equipmentWest Taurus, adeepwater semisubmersible,was delivered toour customer Seadrill aweekahead of schedule in earlyNovember <strong>2008</strong>. The rig was builtat the Jurong Shipyard inSingapore and is now in Brazilwhereitisexpected to commencedrilling operations for Petrobas inFebruary <strong>2009</strong>.The first rig to commence drillingoperations in Brazil with the newgeneration Aker Solutions drillingpackage, West Taurus is contractedto Petrobas under asix year agreement.West Taurus represents amajor construction milestone for theJurong Shipyard, Aker Solutionsand the owner.The scope of work for AkerSolutions included acompletedrilling equipment packageincluding drilling equipment, stateof-the-artcontrol systems, blow outpreventer/marine riser system,management, engineering andcommissioning.In <strong>2008</strong> we successfully deliveredseven drilling equipment packagesincluding three jack-ups, threeconventional semisubmersibles andone RamRig. Our strong orderbacklog for drilling equipmentpackages includes 11 for delivery in<strong>2009</strong>, five for <strong>2010</strong> and afurthernine for 2011.West Taurus, an ultradeepwater semisubmersibledrillingplatform was the first rigto commence drillingoperations in Brazil.34Aker Solutions annual report <strong>2008</strong>
Our businessProducts &Technologies182346571 Conventional rig2 Process systems onshore3 Offshore bow loading and offloading system4 Process systems offshore5 Mooring systems6 RamRig7 Marine drilling risers8 Marine deck machinery and steering gearAker Solutions annual report <strong>2008</strong> 35
Our businessProcess &ConstructionProcess &Construction36Aker Solutions annual report <strong>2008</strong>
Our businessProcess &ConstructionAniche process power houseAker Solutions’ Process &Construction business area (P&C) is aglobalprovider of project management, design and construction of majorprojects on all continents. We supply niche process expertise with hightechnology know-how for projects across chemicals, polymers, syngasand refining; mining and metals; liquefied natural gas (LNG); powergeneration; acid plants; nuclear clean-up services; and water treatment.Highlights <strong>2008</strong> Delivering on strategy withexpansion in niches with growthand high margin potential Revenue development reflectingselective bidding and increasedreimbursable business Order backlog maintaineddespite impact on order intakefrom economic slowdown 17 percent EBITDA growth –EBITDA margin from 6.7 percentin <strong>2007</strong> to 8.4 percent in <strong>2008</strong> Strong cash flow from operatingactivities Five EPCM metals projectsawarded in South America Investment in new fabricationfacility in Canada New offices in Republic ofSouth Africa and Peru Established flexible cost baseand healthy project portfolioDevelopment EBITDANOK million1000With an ever-growing emphasis on creatingstrong sustainable solutions, we providethe full lifecycle of services –from initialconcept through technology development,process technology application, design,procurement, construction and commissioningto maintenance, decommissioningand lifecycle services.Strong position in niche segmentsWith 5417 employees and 4080 contractstaff globally wehave considerable workforceflexibility when positioning our businessto manage the cyclical workload ofour markets.Mining and metalsWithin mining and metals, we provide servicesfor processing plants in fast-growingsegments like copper, silver, nickel, goldand iron ore. We are currently number onein South America and number two globallyin terms of market share. We are thenumber one contractor to the copperindustry worldwide, with experience accumulatedover more than 50 projects.Chemicals, polymers, syngas and refiningIn petrochemicals, we have strong knowhowand expertise and have establishedsolid, long-term relationships over manyyears with licensors of select niche technologies.We also serve the refining andbiofuels markets.LNG regasificationOur LNG regasification position is particularlystrong in North America, where weareranked number one in terms of numberof contracts and value.NuclearWe arealso one of few companies with thenecessary expertise to create and deliversafe, sustainable and environmentallysoundsolutions to the challenges ofnuclear clean-up and waste management.Our current activities are focused on theUK nuclear industry.Power generationOur power plant activities arelargely directedat the North American market, whereweprovidegas- and coal-fired power plant newbuilds and environmental upgrade projects.ConstructionWe provide construction and global constructionmanagement for all the marketsegments we serve. Our major constructionoperation in North America ensures we arewell placed to build on our success in thisimportant market.Additional environmental expertiseOur environmental and technologycapability also spans water treatment,bleaching, chlor-alkali and acid plants,primarily in the UK and the Americas.Our acid recovery and concentrationtechnologies are helping customers in thenon-ferrous metallurgical, fertiliser andchemical industries treat sulphurous feedsand comply with emission regulations.Robust performance in <strong>2008</strong>Over the last few years, P&C has prioritisedmargin expansion ahead of top linegrowth. We have been selective in terms ofthe types of projects we bid for.800600Key figures P&C <strong>2008</strong> <strong>2007</strong> 200640020002006<strong>2007</strong><strong>2008</strong>Operating revenue NOK mill 10 702 11 597 13 215EBITDA NOK mill 904 776 641EBITDA margin Percent 8.4 6.7 4.9Order intake NOK mill 11 291 14 996 14 026Order backlog 31.12 NOK mill 13 300 12 519 10 855Number of employees 31.12 Man years 5417 5516 4522Aker Solutions annual report <strong>2008</strong> 37
Our businessProcess &ConstructionThe Boddington gold mine inAustralia –one of the world’s largestundeveloped gold projects. Uponcompletion, the plant will produceapproximately 850 000 ounces of goldand 200 000 tonnes ofcopperconcentrate per annum.In <strong>2008</strong>, we delivered robust growthwith an EBITDA increase of 17 percent andan order backlog at year end <strong>2008</strong> of NOK13.3 billion, increased six percent over theprevious year. Weachieved atotal of NOK10.7 billion in operating revenues in <strong>2008</strong>,compared to 11.6 billion in <strong>2007</strong>. Ourcontinued focus on improving profitabilityversus revenue growth over the last fouryears yielded an EBITDA margin of 8.4 percentin <strong>2008</strong>, up from 6.7 percent in <strong>2007</strong>.Key developments underpinninggrowthIn metals we have astrong order backlogand excellent market position. In SouthAmerica we further strengthened ournumber one position, winning five largeEPCM projects including Esperanza, theworld’s largest copper project. To deliverthese projects most effectively we havedoubled our resource base in Chile andestablished an office in Lima, Peru.Supporting our strategy to expand inAfrica, we opened anew office in SouthAfrica. This operation will provide the localcapability to service our global metals customersoperating in the region.In petrochemicals, we have graduallyconverted our project focus from EPClump sum to reimbursable EPCM services,resulting in a lower top line, but highermargins and alower risk profile. In the UK,with our partner Praj Industries, we aredelivering the largest bioethanol plant inEurope in an EPCM project for BP, DuPontand British Sugar.ElsewhereinEurope, wehave signed long-term engineeringservices agreements with BP and Shell. InSaudi Arabia we are providing extensivefront-end work for the Ras TanuraPetrochemical complex, a joint venturebetween The Dow Chemical Companyand Saudi Aramco.In China, our technology partnershipshave been instrumental in a number ofprojects, including the Fushun and Sichuanpolyolefins projects for PetroChina.Through asourcing hub in our Shanghaioffice, we have been able to further lowerour own and our customers procurementcosts. We plan to substantially grow thishub to further leverage our global sourcingcapability.With office expansions in <strong>2008</strong> and apool of some 1700 engineers, our Indianoperations continue as a high valueengineering centre both domestically andfor Aker Solutions worldwide. They deliverimportant input to many projects and weplan to continue to grow, and to increaseour utilisation of, this skilled resource basein Mumbai.We have agood position in our nichepower market, particularly in the US. TheLongview power plant project in WestVirginia is progressing well and, whencompleted, is expected to be one of thecleanest and most efficient coal-firedplants in the US.Goals for <strong>2009</strong>Our strategy is confirmed: we have plannedexpansion in niches that provide sustainablegrowth and high margin potential. Wecontinue to be astrong technology andknow-how player that is the preferredpartner for customers in our selected niches.We have worked to build arobust andsustainable revenue base, with abusinessmix balanced between mature and growingmarkets, based on strong customerrelationships and long-term contracts. Ourstrategy has been, and continues to be, toprioritise low risk and high margin potentialahead of top line growth.We continue to focus on deliveringenvironmentally-sound, value-adding solutionsthat support asustainable future.Market outlookStrong mining and metals positionOur emphasis in mining and metals will remainon Australia and the Americas, wherethe major global ore deposits are located.Our strategy has been to grow withincopper, where many new projects arebeing planned over the next five to tenyears. As the largest copper regions in theworld, Chile and Peru together account foralmost half of the reserves. In terms ofproduction capability, weare the marketleader in this sector and are well positionedto benefit from the huge investmentsplanned over the coming years. We also38Aker Solutions annual report <strong>2008</strong>
Our businessProcess &Construction“We have planned expansion in niches thatprovide sustainable growth and highmargin potential and we continue to be astrong technology and know-how player”Doe Run Peru,La Oroya Peru:Aproject for thepeople of La Oroyahave strong positions within other metalslike gold, nickel, silver and iron ore.Long term growth opportunitiesDespite some short-term market uncertainties,India has high ambitions for itschemicals sector and targets to more thandouble it from <strong>2008</strong> to 2015. We hold anexceptionally good position to serve thisgrowing market.We also see that the fundamentals arein place for future long-term growth inChina. We have agood order backlog for<strong>2009</strong> and are well positioned to capitalisewhen the market regains momentum. Ournext step will be to further broaden ouroffering within specialty and consumerchemicals in China, giving us access to aneven larger market.Reducing emissions. Aker Solutionshas more than 30years’ experiencedelivering proven sulphuric acid technologyand proprietary acid plant equipment tobase metals producers worldwide.Continued focus on nichesThough investment decisions are beingdeferred in the Middle East, we arestrengtheningour offering from our operations inSaudi Arabia. At the same time, in Europewe are looking to selectively expand ourfootprint into Russia and Kazakhstan.In mature regions like North Americaand Europe we will continue to serve theneeds of our key accounts, and focus onniches with growth potential. These includeservice and modification work, biofuels,power generation, nuclear decommissioningand construction. Whilst constructionin the US is not expected to grow in thedownstream sector,weare well positionedwithin the power sector with strong projectexecution experience.Over more than 45 years in nuclearservices in the UK we have accumulatedvaluable experience in waste managementand decommissioning. With our globalpresence we see opportunities in thelonger term to take this specialised expertiseto countries such as the US, SouthAfrica, China and India.Strong customer relationships. Underafive year framework contract withDeutsche BP AG, Aker Solutions isproviding engineering and constructionmanagement services attheErdöl-Raffinerie Emsland (BP -Lingen)production facility in Germany.Aker Solutions is providing thedetailed engineering and proprietaryequipment supply for DoeRun Peru’s copper line acid plantproject located in the Andean cityof La Oroya, 150 km east of Lima,Peru at an elevation of 3800metres. The project is part of aUSD 400 million investment byDoe Run Peru at La Oroya tomodernise its smelting operation.Amajor portion of this investmentis dedicated to HSE componentswhich, when complete in October<strong>2009</strong>, will bring the operations atLa Oroya into full compliancewith new environmental emissionstandards mandated by thePeruvian Government.Doe Run Peru’s operation at LaOroya is acustom smelterproducing commodity and preciousmetals (copper, lead, zinc, silverand gold). The city of La Oroya hasgrown up around this 70 year oldfacility. Doe Run has been steadilyinvesting in improving conditions atand around the site and in the localcommunity since it acquired thefacility ten years ago. The culminationof these efforts is the presentmodernisation project.The HSE components includeimprovements to the existing zincline acid plant and effluent treatmentfacilities; abrand new acid plant forits lead smelter and abrand newacid plant for its copper smelter.The copper line acid plant is thelargest of the three La Oroya acidplants at 1000 tonnes per day ofsulphuric acid production fromsmelter stack gases. It will comeonline in the third quarter of <strong>2009</strong>.With all three acid plants in operationDoe Run will be in full compliancewith government-mandatedrequirements; capturing more than80% of all sulphuric acid gas emissionsresulting from its operations.The copper line acid plant detaildesign was executed by AkerSolutions from our Vancouveroffice. It is astate-of-the-art doublecontact, double absorption acidplant incorporating our industryleadingtechnology and proprietaryequipment, manufactured at ourequipment division in Toronto,Ontario, Canada.In addition to detailed designand proprietary equipment,Aker Solutions is also providingon-site advisory services for plantconstruction, check-out andcommissioning through our officein Lima.Aker Solutions annual report <strong>2008</strong> 39
Our businessProcess &ConstructionNuclear decommissioning at Trawsfynydd –amodel for excellenceAker Solutions has been involvedin one of the UK’s major nucleardecommissioning projects since2006, having been selected byMagnox North as aframeworkpartner to undertake works inNorth Wales at the TrawsfynyddDecommissioning Site. The project,the Trawsfynydd StrategicIntegrated Framework (TSIF), wasestablished under aprocurementmodel designed to promoteinnovation and performanceimprovements in what is arelatively traditional industry.The three year contract that wasinitially awarded has now beenextended by two years, with apossibility for further extensionsif excellent performance ismaintained.Aker Solutions’ work involves theclean up of the nuclear wastes thatresulted from 30 years of nuclearpower generation at the site. Thisrequires us to design, construct,commission, and operate facilitiesthat retrieve and safely package thenuclear waste and finally to decontaminatethe associated facilities.This work is being delivered as, atany one time, six or more interrelatedprojects. At peak, atotal of12 decommissioning projects werebeing executed at site.Aker Solutions is partnering withthree other major contractors toundertake the works and, throughthis partnership arrangement, isdemonstrating the benefits ofcollaborative working in the nuclearindustry. Inrecognition of thesuccess of the TSIF approach, theproject was recently accepted as aDemonstration Project byConstructing Excellence Wales, across-industry body for improvingconstruction. This is the first time anuclear industry project has enteredthe Demonstration Projectprogramme, which is designed to:stimulate excellence in constructionproject delivery though the applicationof best practice and innovationthrough collaborative working.The importance of the collaborativeapproach has been fundamentalto the success of the project. Thissuccess has the potential tostrongly influence the design offuture procurement models acrossthe whole of the nuclear industry.Esperanza: sustainable solutions for the world’s largest copper projectIn <strong>2008</strong>, Aker Solutions wasawarded the engineering,procurement, and constructionmanagement (EPCM) contract todevelop the Esperanza coppergoldproject in northern Chile.Owned by Minera Esperanza, apartnership between AntofagastaMinerals plc. (70%) and MarubeniCorporation of Japan (30%), theproject is located northeast ofthe city of Antofagasta at anelevation of 2100 metres abovesea level. Esperanza is asulphidedeposit which will producecopper concentrate containinggold and silver by-productcredits through aconventionalmilling and flotation process.Having conducted the feasibilitystudy and early works studies, AkerSolutions’ EPCM scope includesthe design of the facilities for theproduction of copper concentrates,construction management of theglobal works from the ore extractedfrom the deposit, mine infrastructureand port facilities. Also in scope areasea water pipeline to feed theprocess plant, along distance orepipeline for copper concentratesand the processing plant toproduce 200 000 tonnes per year ofcopper concentrates.Sustainable designpracticesFrom the outset of the project,Esperanza has sought to be amodel mining project for the 21stcentury,considering all HSE aspects,from design to commissioning.Helping our customers reducethe environmental footprint of theiroperations is of increasing importanceto Aker Solutions. Usingsustainable design technology in thisproject means the facility will useonly sea water in its productionprocess, instead of valuable “desertwater” from the limited resources inthe area.On this project Aker Solutions isalso pioneering anew, environmentally-friendly,state-of-the-arttechnology for concentratedtailings. This technology avoidsheavy metals infiltration to undergrounddesert waters, dramaticallyreduces desert water consumptionand cuts dust emissions into theatmosphere. It is also expected tobring higher durability throughlifecycle structures and decommissioning.Currently the world’s largest copper project. Usingsustainable design technology inthis project means thefacility will use only sea water inits production process,instead ofvaluable “desert water” from the limitedresources inthe area.40Aker Solutions annual report <strong>2008</strong>
Our businessProcess &Construction1254361 Power generation2 Decommissioning, waste management andclean-up services for nuclear power facilities3 Mining and metals processing facilities4 Waterand wastewater treatmentfacilities5 Petrochemical/chemical processing plants6 Onshore liquefied natural gas (LNG) receivingterminalsAker Solutions annual report <strong>2008</strong> 41
Our businessAnticipating changeAker Solutions people atthe OrmenLange gas facility, which was deliveredto StatoilHydro in <strong>2007</strong>. OrmenLange came onstream on1October<strong>2007</strong>, and will be able to cover asmuch as 20 percent of Britain’s gasneeds, for upto40years 3 .carbon emissions, the world of 2030 willstill largely depend on fossil fuels for itsenergy supply.Anticipating changeFinancial turbulence and afalling oil price dominated theheadlines in <strong>2008</strong>, and have triggered some uncertainty about theshort-term outlook for both the process and energy industries.The fundamental drivers, however, remain positive and in thelonger term Aker Solutions is positioned to benefit from them.In the short term, thereisnodoubt that theoil and gas industry could experiencesome difficult times because of the financialcrisis and alower oil price, relative tothe extreme highs of <strong>2007</strong> and early <strong>2008</strong>.Achange in the economic climate couldlead to project delays. At the same time,there are still good reasons to be optimisticabout the industry’s outlook.“While market imbalances could temporarilycause prices to fall back, it is becomingincreasingly apparent that the era of cheapoil is over,” the International Energy Agency(IEA) writes in its annual energy outlook 1 .Prices will be supported by a risingglobal demand for energy, driven bycontinuing economic growth in Asiancountries. According to the IEA’s referencescenario, world energy demand will surgeby 45 percent in the period to 2030. This isequivalent to an average growth rate of 1.6percent per year, with countries fromoutside the OECD accounting for nearly 90percent of the increase. The IEA expectsIndia and China to be behind more thanhalf the increase in energy demand.While rapidly developing renewableenergy technologies will boost the supplyof alternative energy sources, the rise willnot be enough to cover surging demand.In the IEA’s reference scenario, fossil fuelswill account for 80 percent of the world’senergy demand in 2030. Even if newpolicies are introduced to reduce globalMeeting tomorrow’s demands todayTechnology improvements and increasedexploration activity have led to an increasein the average volume of oil discoveredeach year since 2000 being higher than inthe 1990s, according to the IEA. Yetthefields that are currently in production ordevelopment are not enough to meet theexpected demand in the next 20 or 30years. This means the oil companies haveto make even more new discoveries. Theindustry has already found the oil that iseasily available, onshore or in shallowwaters offthe coast. The “easy finds” havemore orless been developed –and thatmeans the oil companies are looking innew areas. These include deeper watersand harsher environments, where AkerSolutions is positioned to be the preferredpartner in the industry.This is not the future –itishappeningtoday. Itishappening in Kashagan; in themany new discoveries off the coast ofBrazil; it is happening in new developmentssuch as the Shtokman project; it ishappening in the Gulf of Mexico, the AsiaPacific region and offshore West Africa.Overall capital investment in offshoredevelopments is set to rise by 20 percentbetween now and 2012 2 .In Brazil, where some of the biggestdiscoveries since the turn ofthe centuryhave been made, Aker Solutions hasdelivered several deepwater subsea treesand is contracted to deliver more. We haveopened Brazil’s only manufacturing centrefor deepwater drilling risers. Our investmentin the Brazilian market continues,as the region becomes increasinglyimportant.42Aker Solutions annual report <strong>2008</strong>
Our businessAnticipating changeOil production and demand 1Million barrels per day1<strong>2010</strong>0OPEC spare capacityGlobal demand80604020ProductionDeclining productionDhirubhai 1. Aker Floating Production’sFPSO over the MA-D6 field.01980 1985 1990 1995 2000 2005 <strong>2010</strong> 2015 2020In India, Aker Solutions and sister companyAker Floating Production celebratedfirst oil from the country’s first offshorefield. Aker Solutions delivered the subsea,process control and mooring systems,delivering to both the field and the FPSODhirubhai 1,which is owned by Aker FloatingProduction. Oil demand in India is forecastto be the fastest growing in the world overthe coming two decades, and the countryis putting alot of effort into boosting itsown energy production, making it averyinteresting opportunity for Aker Solutions.Harsh environments: more presence,less impactAker Solutionsisaninternational companywith aglobal reach. We are taking the leadin arange of significant developments withone common denominator: harsh environmentsin cold climates.From Russia to Canada, northern areasare becoming increasingly important. InAker Solutions, with our vast experiencefrom the Norwegian Continental Shelf, weare used to thinking about tough weatherconditions when we plan projects and“Our goal remains tobe our customers’preferred partner bydelivering theproducts andservices they needthrough their entirelifecycle”create new structures. Agood example isthe pair of H-6e (or H-6 extreme) rigs thatAker Solutions is delivering to Aker Drillingin <strong>2009</strong>. They are the largest, mostadvanced drilling rigs in the world,designed and built especially to work inthe challenging conditions of the oceans’deep water and arctic regions.The design of the H-6e also highlightsanother very important trend: it is azeroemissions unit. As we move into these newterritories, it is vital that we strive to furtherminimise the impact of new developmentson their surroundings. We benefit from thisincreasing environmental focus becausewe are atechnology company -and theoperators of these fields want the verybest environmental technology.In addition to fuelling high explorationactivity, the need for more oil has alsodriven demand for increased oil recovery(IOR) technologies, to produce more fromexisting fields. We see no signs of thistrend diminishing.Meeting the changing needs ofourcustomersIn <strong>2008</strong> we further enhanced our portfolioof technology services and products boththrough restructuring and through completingaseries of strategically importantacquisitions. The integration of our marineoperations, well intervention and geologicalconsulting offerings into our Subseabusiness area, in combination with ourownership and cooperation with AkerOilfield Services, means we can offer amore focused portfolio of lifecycle andIOR products and services, including ourextensive well intervention offering – aunique one-stop-shop for subsea fields.In our Products &Technologies businessarea, we have consolidated our drillingrisers and equipment activities with topsidetechnology products and services.Together with an enhanced IOR offering,this will better service customers worldwidewith the equipment and services theyrequire, onshore and above the waterline.Our customers increasingly focus onthe development and maintenance of theirfields as one large, integrated operation.Therefore, in <strong>2008</strong> we brought togetherour existing Field Development andMaintenance, Modifications and Operationsbusiness areas to create EnergyDevelopment & Services, increasing ourcapacity to serve our customers through alarger and more flexible pool of engineers.We have also refocused our Process &Construction business area, bringingtogether Aker Solutions’ energy, processand related construction activities toachieve greater synergies and betterresource utilisation. We see continuedmarket potential in South America, Indiaand China with key global customers. Chinais expected to continue as the main driverfor petrochemical process investments andthe emphasis in metals and mining willremain on Australia and South America.Aker Solutions has made these organisationalchanges to reflect the changingdemands we see coming in the energy andprocess industries. We believe adapting tothese trends secures our medium- andlong-term outlook, in atime of short-termuncertainty.Our goal remains to be our customers’preferred partner by delivering the productsand services they need through theirentire lifecycle –from feasibility study tooperations and beyond.1) IEA <strong>2008</strong> World Energy Outlook2) Douglas-Westwood: the world offshore oil and gasproduction and spend forecast <strong>2008</strong>-20123) www.statoilhydro.comAker Solutions annual report <strong>2008</strong> 43
Our businessHealth, safety and environmentTaking personal responsibility for HSEOne dangerous incident is one too many. Aker Solutions’guiding principle is that all incidents are preventable.Taking care ofhealth, safety and the environment(HSE) is acore value among allAker companies. It commits each andevery employee to promoting better HSEperformance in their daily life.In Aker Solutions our core HSE value isexpressed in our HSE Mindset: All incidents can be prevented. Westrive continuously for zero harm topersonnel, material and non-materialassets We focus on employee health and oncontinuously improving the work environment We conduct our operations throughefficient use of materials and energy,with minimum waste and damage tothe environment We design products and services tohave no undue environmental impact,to be safe and to be efficient in consumingenergy and natural resources.We seek to ensure that our productscan be recycled or disposed of safelyLeading indicatorsSome of the key activities that contributeto improved HSE performance and preventionof incidents are measured and encouragedthrough a set of leadingindicators.Risk observationsPer employee per year3.53.02.5Near missesPer employee per year0.200.152.01.50.101.00.50.00.050.0020052006<strong>2007</strong><strong>2008</strong>20052006<strong>2007</strong><strong>2008</strong>Task risk analysesPer employee per yearInspectionsPer employee per yearHSE trainingPercent of worked hours123.02.01082.52.01.561.51.0421.00.50.500.00.020052006<strong>2007</strong><strong>2008</strong>20052006<strong>2007</strong><strong>2008</strong>20052006<strong>2007</strong><strong>2008</strong>44Aker Solutions annual report <strong>2008</strong>
Our businessHealth, safety and environmentDriven by careOur Just Care programme has helped engage our employeesaround the world through asimple message: we take personalresponsibility for HSE, based on caring for people, theenvironment, and the company.Through extensive communication, arangeof training programmes and, most importantly,the examples set by people frommanagement to the shop floor, our HSEmessage reaches every corner of theorganisation.By considering health, safety and environmentalissues in all our activities –inoffices, on construction sites or at home –we reinforce the right attitudes and achievebetter HSE and business results.Increased environmental focusThe role of companies like ours in relationto the environment is of increasing importance.We are motivated to be part of thesolution. We aim to continually improve ourproducts and services, play arole in newenergy sectors, and minimise the footprintof our own operations. We strive to designeach new product and service to be notjust technologically better, but to be saferand to have less harmful impact on theenvironment than the one before. Someexamples include our solutions for recoveringvolatile vapours, reducing sulphurand ammonia emissions and drilling rigswith minimised impact on arctic environments.We also contribute, with projectexecution and technology, tonew energysectors such as CO 2 capture, next generationbiofuels and wind power.During <strong>2008</strong> we have raised the bar onthe environmental footprint of our ownoperations. We have initiated anumber ofactivities to further increase our focus inthis area. The definition and reporting ofenvironmental parameters has beenimproved, and from <strong>2008</strong> energy consumption,greenhouse gas emissions andwaste disposal are being reported withgreater accuracy and in ways that betterenable our individual businesses to guidetheir improvements. To increase competenceand awareness across the organisation wehave introduced adedicated environmentaleLearning module intended for all employees.By year end, 9000 employees hadcompleted this module. Five additionalbusiness units were certified according tothe ISO 14001 environmental standard in<strong>2008</strong>, bringing the total to 19. Video conferencingfacilities are being improved andwe aim to utilise these to further reducetravel. These arejust some of the activitieswe expect will contribute to minimising ourenvironmental footprint.1LTIFPer mill. work hours, incl. subcontr.2.52.01.51.00.50.0876543210200320032004200420052TRIFPer mill. work hours, incl. subcontr.200520062006<strong>2007</strong><strong>2007</strong><strong>2008</strong><strong>2008</strong>Energy <strong>2008</strong>Energy consumption MWH 623 049Energy intensity MWH per mill. worked hours 6560Sick leave ratePercent of work hours54Emissions <strong>2008</strong>3CO 2 emissions Tonnes 146 654CO 2 emissions intensity Tonnes per mill. worked hours 154421Waste <strong>2008</strong>Recycled waste Tonnes 22 021Total waste Tonnes 35 756Recycling factor Percent 61.6Hazardous waste Tonnes 2200020032004200520061) Lost Time Incident Frequency2) Total Recordable Incident Frequency<strong>2007</strong><strong>2008</strong>Aker Solutions annual report <strong>2008</strong> 45
Our businessHealth, safety and environmentCompetence and complianceThrough developing competence, learning from experience and settinghigh standards, we increase the likelihood of preventing the next incident.Leaders in the driver’s seatMore than 2200 leaders had graduatedfrom our HSE leadership programme bythe end of <strong>2008</strong>. This programme has beenkey in further developing our HSE culture,enabling our leaders to be more effectiverole models and to drive HSE improvementsefficiently.Reaching outTo help deliver the important HSE messageseffectively across the organisation, wehave developed asuite of HSE eLearningprogrammes. To date, more than 57 000individual training sessions have beencompleted with the different HSE eLearningmodules. Additional training and awarenessraisingactivities take place on every worksite,and HSE considerations are alwayspart of the planning and execution oftasks.High expectationsWe maintain a common HSE operatingsystem to set expectations, assess gapsand implement improvements. Each operatingunit performs an annual assessmentagainst the expectations of the HSEoperating system. In addition anumber ofstrategic, in-depth HSE reviews areperformed for selected units across theorganisation. These reviews increase thetransparency of HSE performance throughoutour operations, and help to ensurethatpotential risks are avoided.Just RulesBased on an analysis of previous incidentsand industry best practice, aset of clear,simple safety rules for specific workactivities has been developed and rolledout across the organisation. Over 32 000employees, contract staffand subcontractoremployees had been through dedicated JustRules training sessions by year end <strong>2008</strong>.Therehas been asignificant decrease inthe number of serious injuries from <strong>2007</strong> to<strong>2008</strong>.Serious injuries■ <strong>2007</strong> ■ <strong>2008</strong>2520151050FatalitiesDisablinginjuriesOther seriousinjuries“From experience,we know thatcertain activitiesaccount for themajority of seriousincidents in ourwork. For theseactivities we havemade specific rulesto prevent injury orharm. These are ourJust Rules, part ofour Just Careprogramme.”-Simen Lieungh,President &CEOJust Rules training includeseducational videos.46Aker Solutions annual report <strong>2008</strong>
Our businessHealth, safety and environmentJust Care awardsTo recognise outstanding achievements within HSE and to reinforce thebehaviours that led to them, every year our President &CEO presentsfour Just Care awards: the President’s HSE award for the best overallHSE achievement, and one award each for achievements in health, safetyand the environment.President’s HSE awardThe Kashagan epF project received the President’s HSE award for their fabrication andassembly of seven process and utility modules, spanning over 12 million worked hourswith 35 nationalities at locations in Norway, Poland, Romania and Russia. Throughextensive efforts in training, communication and management visibility, coupled with theright performance incentives, the project successfully exported Aker Solutions’ HSEmindset and standards to sites that historically had aless mature HSE culture, achievingzero serious injuries over the project’s five years and leaving apositive legacy at allsubcontractor sites.Health awardAker Solutions in Verdal, Norway receivedthe Health award for their ’Multivago’welding automation. Developed by weldersin Verdal, the Multivago system enablesthe automated welding of long and largetubular weld seams, avoiding staticand unfavourable welding positions whileachieving increased efficiency and reducedhealth risks. Multivago was initiated for theproduction of a series of tripod windturbine foundations, and has now beenshared and is in use on other projects.Safety awardOur drilling equipment business receivedthe Safety award for their drilling equipmentsimulator. The simulator has beendeveloped by First Interactive AS (60 percentowned by Aker Solutions) and thesafety training is organised and facilitatedby our drilling equipment unit. The trainingenables safe and cost efficient trainingof drilling crews, improved safety foroperators on the historically dangerousdrill floor and, ultimately, improved andsafer drilling operations. The drilling equipmentsimulator has introduced a stepchange, bringing to the drilling industrywhat the flight simulator has brought to theaviation industry.Environmental awardThe Ekofisk tank cell cleaning projectreceived the Environmental award. Throughthe use of aspecially developed, remoteoperated cleaning tool, 99% of the oil andwax layer was removed from nine tankcells and re-injected into the Ekofisk reservoir.The project was executed within theagreed time frame, exceeding the customer’srequirement for oil and wax removal,and with an excellent HSE cultureresultingin zero spills to the environment and zeroinjuries.Aker Solutions annual report <strong>2008</strong> 47
Our businessPeople and developmentDriving performanceAker Solutions’ achievements and profitability are generated by ourpeople –people who take on challenges and deliver solutions.“Aker Solutions focusattention on achievingresults in both theshort and long term”Teamwork, know-how and skills are thedriving forces for enhanced performanceand continual business development. Ourvalues guide the development of our peopleand the company.Our commitmentAll Aker companies shareacommitment totheir people: to establish a workingenvironment that is safe, tolerant, and fair.Continuous personal and professionaldevelopment is vital to the competitivenessof Aker Solutions. The power of thecompany’scollective know-how reinforcescustomer confidence and enhances ourability to win new contracts and executethem profitably.Weseek to give our peoplechallenging assignments and ampleopportunities for development and growth.Performance management andrewardWe want our organisation and eachemployee to focus attention on achievingresults in both the short and long term.Processes for determining targets andmeasuring performance, and for rewardingemployees in relation to the resultsachieved, are important tools in thiscontext. Performance targets for managersand employees are determined on thebasis of strategies and budgets in eachunit. Targets are set on an annual basis,but are monitored and further developedas necessary throughout the year. Theannual target-setting processes embraceboth financial goals and the developmentand improvement of products, projectmanagement, customer service and the like.In addition, targets are established forhealth, safety and the environment and forthe personal development of the individualmanager and employee.To ensurethe development and optimumutilisation of our management resources,an annual evaluation of managers is conductedas input for determining plans formanagement development programmes,management mobility and the developmentof leadership talents.We want to reward managers andemployees in relation to the resultsachieved. This is achieved by differentiationof individual base pay and establishingprogrammes for variable annual paymentsto managers and employees.Our annual variable pay programmesreward employees on the basis of thecommercial results achieved in theindividual company or project. Managersearn variable pay on the basis ofcommercial results in the units in whichthey exercise influence and the extent towhich the manager lives our values. Seniormanagement have their variable payspread over several years to encouragelong-term performance and lasting commitment.Details of the remuneration of oursenior management are provided in note18 to the consolidated accounts on payand social costs.Unique skills createunique solutions.48Aker Solutions annual report <strong>2008</strong>
Our businessPeople and developmentPreferred employer in achallenging marketIt is our people that enable Aker Solutions to offer our customers aservice superior to our competitors. Our reputation in the employmentmarket is key to attracting the most talented people.In <strong>2008</strong> we started to see the effect of ourstreamlined, recruitment process, with over40 000 candidate applications from morethan 35 countries. The global recruitmentprocess, featuring hands-on recruitmentprinciples and supported by arecruitmentmanagement system, ensures transparencyacross our business. Together with acommon interview guide based on ourvalues, candidates wereexposed to ahighquality recruitment experience supportingour vision of being the preferred employer.It has been achallenging market, with ashortage of suitably skilled people enteringthe engineering industry generally, and theenergy sector in particular.Despite increasingcompetition for qualified resources, wesuccessfully managed to hire a total of4108 new employees in <strong>2008</strong>. Throughfocusing on retention activities we haveincreased the stability of our workforce,reducing turnover to below nine percent.Attracting new employeesFollowing a successful national recruitmentcampaign in Norway in late <strong>2007</strong>,similar campaigns wereconducted in otherregions in <strong>2008</strong>. Aker’s new recruitmentprogramme for the US market waslaunched in May in connection with theOffshore Technology Conference <strong>2008</strong> inHouston, Texas. The programme coversall the Aker companies with activities in theUS and is based on the employees‘ ownattitude and commitment. It also features aregional web site and even anew word–Akertude (see www.akertude.com).Our efforts in attracting employees arealso validated by our People Survey,wherethe top development area since the lastsurvey was “Weattract talented people”. Itshowed that avast majority of our peoplewould strongly recommend Aker Solutionsas an employer in our industry.Recruitment of employeesRegional distributionTotal workforceRegional distributionNorway 32.5%Americas 23.8%Africa &MiddleEast 0.6%Asia Pacific 18.2%Europe (ex. Norway) 24.2%Norway 49.7%Americas 20.4%Africa &MiddleEast 0.6%Asia Pacific13.7%Europe (ex. Norway) 15.2%Co-operation in focusIn Aker Solutions there isalongtradition of including employeesand their representatives indecision-making processes. Thisensures abroad basis for makinggood decisions, balancing theinterests of the many stakeholdergroups that any companyengages with –especially thoseinterests related to welfare andworking conditions. Thesetraditions are well established inNorway, though this is not yet thecase everywhere the companyoperates.Aker Solutions operates in acontext characterised by increasingglobalisation and fierce competition.This means we must makesignificant efforts to maintain ourcompetitiveness in all our markets.Employee representatives andmanagement must work together onan ongoing basis to seek solutionsthat promote socio-economicprogress in the regions in which weoperate, while ensuring the longtermperformance of our company.In October <strong>2008</strong>, Aker Solutions’major shareholder, Aker ASA, signedan international framework agreementwith the Norwegian UnitedFederation of Trades Unions andthe International MetalworkersFederation on behalf of all thecompanies that arepart of Aker.Theagreement commits all the partiesto work towards the developmentof good working relations.Aker, the Norwegian United Federation of Trades Unions andthe International Metalworkers Federation enter ajoint agreement.EmployeesRegional distributionContract staffRegional distributionNorway 49.7%Americas 17.2%Africa &MiddleEast 0.6%Asia Pacific14.6%Europe (ex. Norway) 17.5%Norway 49.6%Americas 27.4%Africa &MiddleEast 0.6%Asia Pacific11.7%Europe (ex. Norway) 10.2%Aker Solutions annual report <strong>2008</strong> 49
Our businessPeople and developmentAlearning arenaThe Aker Academy creates opportunities for people and teamsthroughout Aker Solutions. It delivers aligned, professional trainingand development activities founded on our values and corecompetence and strives to expand the competence of individualsand teams to improve our business performance.“Developing an evenhigher quality learningenvironment remainsour main focus in <strong>2009</strong>”In <strong>2008</strong>, eight different leadership programmes,totalling more than 60 sessions,werecompleted by over 1300 participants.Our leadership programmes have beenimplemented internationally.One major focus of the Academy in<strong>2008</strong> was to encourage cooperationacross business areas and to further alignour development activities. In an increasinglyglobal environment, cross-culturalawareness has moved up the agenda as akey factor in minimising risks in all ouractivities. Each one of our leadershipprogrammes includes modules designedto improve “cultural intelligence” withinAker Solutions. These efforts will be intensifiedin <strong>2009</strong>.Developing an even higher qualitylearning environment will be our mainfocus in <strong>2009</strong>. This means that still-closercooperation and active sharing betweenthe business areas will be promoted.In addition to cross-cultural awareness,the further development of our leadershipprogrammes; aligned concepts for coachingand mentoring across the businessareas; and aclear focus on commercialawareness have all been identified asfocus points for <strong>2009</strong>.Well intervention academyOn 29 May <strong>2008</strong>, Aker Solutions openedits new well intervention academy inStavanger, Norway. This facility will givenew generations of offshoreoperators andengineers first hand experience in criticalwell intervention activities. The centreconsists of an intervention tower, two testwells and state-of-the-art interventionequipment combined with high-tech 3Dsimulators to facilitate realistic andpractical training in an environment asclose to actual offshore conditions aspossible.Participants from all over the worldare brought together in our learningand development activities.Leadership programmesParticipants, Aker Academy <strong>2008</strong>Becoming aleader 572Develop your leadership 152Businessleadership 38Commercialawareness 54HSE leadership492Senior projectmanagement 2650Aker Solutions annual report <strong>2008</strong>
Our businessPeople and developmentAker international trainee programme<strong>2008</strong> was the thirdyear of the Aker international trainee programme.With the participation of Aker Solutions, Aker Floating Production,Aker Drilling and other Aker companies the programme hasprovided 66 assignments. Trainees have achance to work in ourkey markets including Norway, the US, UK and Malaysia.In September <strong>2008</strong>, the first team oftrainees graduated from the programmeand joined our pool of future leaders. Eachof the eight graduating trainees acceptedpermanent positions within Aker Solutionsin the US, Brazil, China, Malaysia andNorway, working in different businessareas and involved in business development,procurement, finance and businessmanagement.“During my two years as atrainee withinthe company, I have been exposed todifferent disciplines including qualificationsand clarifications for tenders, costestimates for projects, our Project ExecutionModel, and branch management issues.Ihave worked in the general organisationand also had afantastic opportunity to beon abig international project –Adriatic LNG.My experience on the project formed myfirm desire tobeapart of aproject teamagain. That is why Iamnow assigned tothe Sakhalin IArkutun-Dagi project, workingin procurement,” said Yulia Semenchenko,aRussian trainee who graduated in <strong>2008</strong>.In September <strong>2008</strong>, a third team oftrainees joined the programme. The teamconsists of ten recent graduates who wererecruited in the autumn of <strong>2007</strong> from India,Malaysia, Norway and Russia. The worldwiderecruitment campaign receivedan impressive 1500 applications for theTeam III visiting Egersund Yard inSeptember <strong>2008</strong>.ten positions. To address our businessneeds we recruited trainees with amixedbackground in both engineering and inbusiness.New programmesA number of new, specially-developedcourses werelaunched on the portal during<strong>2008</strong>. As asupplier to fossil fuel producers,it is important that we address climatechallenges and the need to reduce greeneLearningWith more than 80 000 courses completed so far, eLearninghas become an effective way of enhancing expertise for ouremployees.We offer alarge number of courses throughour eLearning portal, which is used activelyby all the business. More than 40 000programmes werecompleted in <strong>2008</strong> alone.A number of the courses are obligatory,and the local business units can documentthe progress of their employees forthemselves. Such documentation is important,not least for ISO certification of thebusinesses. Employees can take coursesvia their own home PCs, whenever theywant and regardless of their geographicallocation. Compared with classroom-basedteaching, eLearning substantially reducesthe cost of travel and use of resources.house gas emissions. Our new course on“the environment –our common responsibility”raises these issues and the way ouremployees can take personal responsibilityfor the environment.A number of courses have beenlaunched on key issues such as health,safety and the environment (HSE), corporateresponsibility (CR) and Aker Solutions’Project Execution Model (PEM).More than eLearningIn <strong>2008</strong>,our first classroom-basedcourseswere registered with the Academy. Thisrepresents an important step towards realisingthe vision of acommon educationportal for the whole of Aker Solutions, nomatter the medium used, and will reducethe cost of maintaining several differentsystems.Classroom teaching is also used incombination with eLearning.eLearningCompleted courses by end of <strong>2008</strong>Stress management 14 207Caring for the environment 8820Other HSE 18 637PEM 11 137Other and BA/BUspecific 11 207CR 1227Protect 2894Just Care 18 893Aker Solutions annual report <strong>2008</strong> 51
Our businessCorporate responsibilityDemonstrating corporate responsibilityAker Solutions’ overriding concern istoprovide products and servicesin an environmentally sound, ethical and socially responsible manner.The way in which we achieve growth andprofitability is as important as the achievementsthemselves.Finding environmentally and sociallyresponsible ways to meet the world’senergy needs has world scale impact –politically, ethically and environmentally.Our contribution to that impact dependson each and every one of us, every day,everywhere, taking personal responsibilityand caring for people, for the environment,for integrity and for our communities.Our history,our values and internationalnorms such as the UN Global Compact,the Global <strong>Report</strong>ing Initiative (GRI) andthe OECD guidelines are the basis of ourcorporate responsibility principles. We arecommitted to continually improving ourperformance against them.Our corporate responsibilityprinciples Caring about people: acompetent andmotivated workforce, driving toward thesame goals, is vital to our success. Withthousands of employees around theworld representing many cultures, religionsand ethnic groups, our focus is tohelp each individual employee realisehis or her potential and look after his orher own health and safety. All our effortsare guided by acommitment to protectingthe human rights of our employeesand the stakeholders we influence. Caring about environment: theenvironment depends on companieslike ours to contribute to its positivedevelopment. We therefore work tominimise negative impact on the environmentby continuously developingtechnologies, practices and businessopportunities compatible with sustainabledevelopment. Caring about integrity: we depend onareliable, predictable businessenvironment. We therefore strive tomaintain high ethical standards. Webuild aculture that values honesty,integrity and transparency, and weencourage the same behaviour amongour partners. Caring about community: as alargecompany we are asignificant part ofthe societies in which we operate, bothlocally and globally. Webelieve in playingour part in the community throughinvesting in the building of ahealthy,safe and stable society.Local contentWe are committed to building on localcapabilities in, and sharing our technologywith, the markets we enter. Wedraw onlocal resources to create jobs, customiseproduct strategies, and work with localgovernments. For example:Currently we employ approximately4 000 people in the Asia Pacific region,including around 600 located in Malaysia.Of those 600, most work at the high-techmanufacturing centre we established in<strong>2007</strong>. Nearly 100 of the engineers andtechnicians employed in the centre atPortKlang were trained at our Norwegian andBritish subsea facilities. The centre hasalso created opportunities for local vendorssupplying components and services.Our subsea operations in Brazil haveapproximately 500 people in an almostexclusively Brazilian workforce. 150 of thosewere hired in the 12 months to mid-<strong>2008</strong>and our plans for growth in the region areextensive. We expect to fill an additional130 vacancies by the end of <strong>2009</strong>.In Angola we have developed West Africa’smost advanced subsea base. Topromote the effective sharing of our knowhowin the region, an active trainingprogramme has brought employees fromAn international company with globalreach. Aker Solutions employees outsideour facility in Malaysia.the region to be trained at other AkerSolutions facilities. We are making similarefforts with local employees in severalother countries.CO 2 captureAker ASA and Aker Solutions have establishedthe company Aker Clean Carbon toaccelerate the commercialisation of CO 2capture technology. Aker Solutions willprovide the technology, engineering andproject management expertise for developmentssupported by Aker’s industrial andfinancial strength. Aker Clean Carbon’scoreCO 2 capture technology was originallydeveloped by Aker Solutions.Aker Solutions and Aker Clean Carbonare also part of the consortium, led byScottish Power,which recently qualified asan entrant to the UK government’s competitionto develop the UK’s first commercialscale carbon capture and storage (CCS)project.Global partnership with theNorwegian Red CrossAker Solutions signed a strategic threeyear partnership agreement with theNorwegian Red Cross on 19 December<strong>2007</strong>. The partnership encompassesfinancial support, exchanges of expertisebetween the organisations and volunteeractivities.52Aker Solutions annual report <strong>2008</strong>
Our businessCorporate responsibilityMembersofamedicalteam from theHunan ProvincialRedCrossSociety,treating apatientatatemporarymedical centre setupfor earthquake survivorsinShifang,Sichuan in <strong>2008</strong>.Thousands of people whosehomeswere flattened were living in tentsbythe side of theroad.Aker Solutions people in Chinawere also proactive insupporting thereliefefforts.Aker Solutions annual report <strong>2008</strong> 53
Our performanceOur performance54Aker Solutions annual report <strong>2008</strong>
Our performanceContents56 Board ofDirectors’ report<strong>Annual</strong> accounts Aker Solutions group72 Consolidated income statement73 Consolidated balance sheet74 Consolidated statement of cash flow75 Consolidated statement of changes to equity76 Notes to consolidated accounts<strong>Annual</strong> accounts Aker Solutions ASA116 Parent company income statement117 Parent company balance sheet118 Parent company statement of cash flow119 Notes to parent company accounts124 Auditor’s report126 Share and shareholder information130 Analytical information132 Corporate governance136 Board ofDirectors138 Executive management team140 Company informationAker Solutions annual report <strong>2008</strong> 55
Our performanceBoard ofDirectors’ reportWell prepared in an unpredictable marketAker Solutions had operating revenues of NOK 58 252 million in <strong>2008</strong>,on apar with the previous year. Cost overruns on the Frigg and AkerH-6e projects contributed to reduced earnings before interest, tax,depreciation and amortisation (EBITDA), down by 13.6 percent from<strong>2007</strong> to NOK 3382 million, while the EBITDA margin declined from 6.8to 5.8 percent. The group has asolid, high quality order backlog. Effortsto reduce costs are likely to have asignificant effect in <strong>2009</strong>, whenEBITDA is expected to exceed NOK 4500 million although some declinein the level of income is anticipated. An ordinary dividend of NOK 1.60per share isproposed by the Board for the fiscal year <strong>2008</strong>,corresponding to NOK 430 million.Although the high revenues recorded in<strong>2007</strong> were boosted by anumber of majorprojects completed in that year, AkerSolutions succeeded in maintaining thesame high level of income in <strong>2008</strong>. Growthin the Products &Technologies (P&T) andSubsea business areas contributed tothis performance. Activity in the EnergyDevelopment &Services (ED&S) and Process&Construction (P&C) business areas waslower than in <strong>2007</strong>.Anumber of important projects in thegroup’s portfolio were completed in <strong>2008</strong>.A complete subsea production systemwas delivered to Reliance Industries Ltdfor the MA-D6 field off India, and theworld’s first offshore liquefied natural gas(LNG) terminal was delivered to ExxonMobilin the Adriatic. Four production facilities forthe Kashagan project in the Caspian Seawerecompleted during the year,and sevencomplete drilling equipment packagessupplied in <strong>2008</strong> are inoperation on rigsfor various customers. The subsea waterinjection system for the Tyrihans field inthe Norwegian Sea was also ready fordelivery in late <strong>2008</strong>. This is a groundbreakingproject which strengthens thegroup’s position as asupplier of solutionsfor increased oil recovery (IOR) from existingfields. During the year, Aker Solutions wasalso awarded five engineering, procurementand construction management (EPCM) contractsfor metal projects in South America.The Subsea, P&C and P&T businessareas substantially improved their profitability,and delivered record margins andresults in <strong>2008</strong>. Creating the ED&S businessarea has strengthened the group’sposition as aleading supplier of completedevelopment solutions for demanding oiland gas projects. Operational challengesfaced on individual projects by ED&S during<strong>2008</strong> meant that its profitability did notstrengthen to the same extent as in theother three business areas.To reduce vulnerability to fluctuations inthe levels of activity in the various markets,efforts were made –particularly by Subseaand P&T –tobuild up bases and organisationsfor delivering services and productsto the group’s installed base of solutions.This forms part of the group’s long-termstrategy to strengthen its position in thelifecycle services market. This strategy isexpected to contribute to higher margins.An extensive cost-cutting programmewas launched in the second half of <strong>2007</strong>and continued throughout <strong>2008</strong>. The instabilityof the world economy means thathigh priority will continue to be given to thework of enhancing efficiency and flexibilityin the cost base.Aker Solutions has asolid order backlogwith aportfolio dominated by reputablenational and international companies. Thetotal order intake in <strong>2008</strong> came to NOK55 590 million, and the group’s order backlogat 31 December was NOK 58 016million. This backlog is of high quality, andoffers the potential to realise marginimprovements. The group has so far hadno significant cancellations of existingcontracts, but certain anticipated newawards have been postponed.In the short term, some uncertaintyprevails about the level of activity in AkerSolutions’ main markets. However, independentmarket analyses show that the oilcompanies must maintain ahigh level ofactivity within exploration for and developmentof oil and gas resources to replacedeclining production from existing fieldswhile also meeting the anticipated growthin world energy consumption. The longtermmarket foundation is accordinglyregarded as sound and interesting.The group has set ambitious targets forwork on health, safety and the environment(HSE). The various programmes in thisarea continued in <strong>2008</strong> to help the groupmeet its ambition of zero harm to people,material and non-material assets and theenvironment. These efforts are yieldinggood results, with adecline in both sickleave and the total injury frequencies in<strong>2008</strong> compared with the year before.The businessPrincipal operationsAker Solutions is a leading internationalsupplier of engineering services, fabrication,technology products, maintenance,specialised services and total solutions forthe energy and process industries. Its mainoperations embrace deliveries to oil, gasand petrochemical facilities. The group alsopursues substantial activities related todeliveries to projects for gas- and coal-firedpower stations, metal processing plantsand other selected industries.To achieve an organisation of the businesswhich better reflects customerrequirements, the group’s business areaswere restructured during <strong>2008</strong>.The Field Development (FD) and Maintenance,Modifications and Operations(MMO) business areas were merged tocreate ED&S with operational effect from1September <strong>2008</strong> and accounting effectfrom 1January <strong>2008</strong>.Structural changes were also implementedin Subsea and P&T in order tostreamline the technology, solutions andservices offered by the group to itscustomers and market segments.The business is thereafter organised inthe following four business areas andreporting segments: Energy Development &Services (ED&S) Subsea Products &Technologies (P&T) Process &Construction (P&C)The group had 23 360 employees at31 December <strong>2008</strong>, including 11 464 inNorway, plus 10 601 contract staff. Aker56Aker Solutions annual report <strong>2008</strong>
Our performanceBoard ofDirectors’ reportSolutions has operations in about 30 countries.Its head office is in Norway, atSnarøya outside Oslo.The parent company Aker SolutionsASA is listed on the Oslo Stock Exchangewith ticker code AKSO. The largest shareholderis Aker Holding AS, with 40.27percent of the shares.Strategic target areasAker Solutions’ vision is to be the preferredpartner for projects, products and servicesin the energy and process industries.Its employees represent leading-edgeexpertise in anumber of areas, and thegroup enjoys areputation as an attractivebusiness partner and employer.Aker Solutions occupies astrong marketposition, which will be consolidatedand further developed. That calls forsignificant commitment and substantialresources. Expectations from investors,customers and employees, and from thecommunity and the market in general, willbe met by delivering responsibly,profitablyand consistently.The group’s long-term strategy remainsunchanged, and defines the following targetareas for <strong>2009</strong> to help realise its vision.Commitment to solutions for harshenvironments and deeper watersAker Solutionsisone of theworld’s leadingsuppliers of solutions for energy andprocessing facilities in harsh environmentregions, both offshore and on land. Thegroup has an extensive list of project referencesin concrete technology, floatingdeepwater platforms, subsea technologyand land-based plants suited for harshweather conditions in arctic areas anddeep water. A large proportion of theremaining unexploited oil and gasresources are expected to lie in suchregions. The position of Aker Solutions asone of the few suppliers to combineadvanced technology with the ability todeliver complete solutions makes thegroup an attractive partner for customerswith demanding projects in deep watersand harsh environments.Solutions for well stream and reservoirsAlarge proportion of newoil and gas fieldshave high development costs. Making betteruse of existing oil and gas fields offerssignificant potential for many operators.Aker Solutions has specialised businesseswith expertise in reservoir analysis andoptimisation of well streams. That makes itpossible for oil and gas operators to improvethe recovery factor for existing fieldswhere they have already invested in installationsand other infrastructure.Other,smaller reservoirs aretobefoundin the vicinity of many large fields.Advanced drilling and well technologiesfrom Aker Solutions make it possible todrill new wells horizontally from existinginstallations to reach satellite reservoirs,permitting better utilisation of the installations’capacity. For fields where reservoirpressure has declined after anumber ofyears on stream, Aker Solutions deliverstechnology to increase pressure throughwater or gas injection. The group also hasadvanced solutions for maintaining andimproving oil and gas flows from existingfields. This IOR segment is expected tomake favourable progress.Grow service businessAker Solutions isamajor supplier of completeproduction facilities for the energyand process sectors. It also offers productsand systems such as subsea installationsand drilling solutions. The detailedknowledge of the plant or its products,gained when aproject is delivered, opensup opportunities to provide efficientmodels for later maintenance, upgradesand other services throughout the lifecycleof the product or installation. These modelsoften call for specialised expertise, whichgives suppliers with alarge installed basean interesting and long-term market.During recent years, Aker Solutions hassubstantially increased deliveries of itssystems and plants, and the market forservices throughout the lifecycle of itssolutions establishes abasis for attractivemargins.While a new development project,product or system delivery usually lasts oneto five years, an installation must be maintainedover several decades. The servicemarket is accordingly very long-term andrather less cyclical than the market for newprojects.Further development of strong position inthe growing MMO market in the NorthSea basinAker Solutions has delivered a largeproportion of the offshore installations inthe North Sea basin, particularly on theNorwegian Continental Shelf. The maintenancemarket embraces ongoing services,“Aker Solutions hasasolid order backlogwith aportfoliodominated byreputable nationaland internationalcompanies”major upgrades and efficiency improvements.The last of these segmentsdemands an in-depth understanding ofdoing work on installations in production,combined with expertise in executingmajor changes and delivering new componentsand modules to those installations.A number of the installations in theNorth Sea basin have been in operation formany years, and need extensive upgrades.Aker Solutions has an experienced andhighly competent organisation of engineersand operators which, combined withits fabrication capacity, will be utilised incompeting for major maintenance andupgrade assignments.Shifting P&C’s centre ofgravity towardsChina, India and South AmericaEfforts toexpand the activities of the processand metals businesses in Asia andSouth America will continue. Much of theirnew capacity will be concentrated in theseregions. In addition, moreemphasis will begiven to facilitating the transfer of technologyand expertise from Europe to this businessarea’soperations in other parts of theworld, particularly in growth markets suchas India and China.Increasing the efficiency and flexibility ofour cost baseAn extensive cost-cutting programme wasinitiatedinthe second half of <strong>2007</strong> and hascontinued through <strong>2008</strong>. Going forward,the key initiatives and programmes in thisarea will address risk management, projectexecution, cost consciousness and yardcapacity adjustments, in addition to theutilisation of low cost hubs in India, Braziland Malaysia.Continuing to enhance Health, Safetyand Environmental (HSE) performanceAker Solutions will continue to enhanceHSE and further develop the Just Careculture designed to strengthen the focusAker Solutions annual report <strong>2008</strong> 57
Our performanceBoard ofDirectors’ reporton HSE in every project and product delivered.The strong commitment to HSEeducation will continue throughout <strong>2009</strong>and the group will continue to develop itsresponsibilities as acorporate citizen.MarketsAker Solutions’ principal markets havelong been characterised by good progressand high demand. With reserves in existingfields contracting and their production indecline, afundamental need for many newdevelopments continues to exist in thelonger term. Following the internationalfinancial crisis, however, there is greatuncertainty about market prospects forthe next few years.It is still too early to judge how the turbulencein the world economy will affectmarkets, and it remains uncertain howlong the crisis will persist.In the short term, levels of activity inAker Solutions’ main markets are likely todecline. Demand is expected to recover inthe longer term, based on growing shortagesof oil, gas and important metals. As aresult, the fundamental basis for furthermarket growth probably exists in aratherlonger perspective.Oil prices affect activity in anumber ofAker Solutions’ main markets. Their levelalso influences oil company priorities for,and choices between, new developments,upgrading existing facilities and committingto improved recovery from producingfields. The group’s share ofnew deliveriescompared with service assignments mayaccordingly vary over time in line with oilprice trends.More difficult access to capital andproject finance reduces opportunities for anumber of customers to launch newprojects. The level of activity at many oilcompanies is closely related to developmentsin their cash flow, which means thatsome operators will postpone large newdevelopments. In anumber of cases, thesewill be replaced by an increased focus onupgrading existing installations which canhelp to reduce costs per unit produced.Oil company interest in upgrading existingfacilities or investing in improved recoveryfrom producing oil and gas fields isusually closely related to marginal costsper unit produced. In recent years, newtechnology has already yielded more automatedoperations and lower costs for anumber of installations, and the recoveryfactor on anumber of fields has exceededthe levels previously considered feasible.Nevertheless, operators of agreat manyproducing fields around the world considerit interesting to invest in substantialupgrading and improved recovery. AkerSolutions has solid experience andproprietary technologies which give it astrong position in this part of the market.The bulk of the world’s oil and gas productioncomes from facilities on land andin shallower waters offshore. These fieldswere developed early because theirreserves could be accessed with relativeease. Most of the installations on thesefields are now old and offer limited opportunitiesfor further production increases.Both recoverable reserves and output aredeclining on many of them. As aresult, anumber of discoveries have been developedin deeper water over the past 15years, and asignificant proportion of undevelopedreserves arethought to lie in deepwaters and harsh environments. Anumberof oil companies have substantial interestsin and fairly specific plans for suchdevelopments, but costs lie in many casesat alevel which requires arelatively high oilprice to make their realisation commerciallyinteresting. Current doubts about theworld economy and its possible effect onshort-term oil price trends mean that thetiming of development decisions is uncertainfor anumber of projects.It usually takes many years before amajor new project results in production.Despite the general market downturn,some customers with strong liquidityreport that they plan to maintain theirinvestment programmes. Their intention isto benefit from having new productioncapacity available when demand starts torise again.Most international industrial sectorshave experienced sharp price increasesfor materials and labour in recent years,while production capacity has also beenexploited to the full in many cases. Thecurrent economic downturn has eased thepressure onthe whole supplier chain, withthe result that customers increasinglyexpect lower prices. Pressure on pricesmust be expected to rise as competitionstiffens when spare capacity becomesavailable at agrowing number of suppliers.Aker Solutions will make active use of itsattractive technology, solid order backlogand strong financial position to competefor new assignments. The group intends tomaintain its strategy of selecting, winningand executing the projects in which itwould be appropriate to become involved,and thereby seek to avoid contracts whichfail to provide a basis for satisfactoryresults.Risk managementAker Solutions’ commercial operations willnormally involve risk. The group workssystematically with risk managementthrough extensive systems and proceduresin all its business areas. The aim is toensure a thorough assessment of bothnew and existing deliveries. Risk managementand risk awareness also representkey elements in educational activities andthe corporate culture. The goal is not toavoid all risk, but to understand, manageand be paid for accepting it. Thorough riskassessment is acore competence whichcan provide the group with competitiveadvantages.The group has a corporate treasuryfunction which comprises the operationalactivities and corporate functions involvedin managing financial risk. Risk also representsakey element and area of expertisefor other corporate staff departments,such as legal affairs and accounting. Inaddition, certain special departments haverisk as their particular focus area. Enterprise risk has been established tocoordinate group risk management notincluded in the traditional project andfinance areas. Internal audit inspect that policies,instructions and experience of best practiceareimplemented and followed up. Project and operational support assiststhe operational businesses andexecutive management with projectassessments.An extensive system of common principles,procedures and instructions has beenestablished to define how different types ofrisk aretobeidentified, reported and treated.This ensures that all the businesses in thegroup have well-entrenched guidelines tofollow for most relevant risk conditions.Advisory committees have been establishedat corporate level to undertakequality assurance on a wide range ofmatters before afinal decision is taken byexecutive management or the Board ofDirectors. The decision-making systemhas been developed as an authorisationstructure that defines which decisions can58Aker Solutions annual report <strong>2008</strong>
Our performanceBoard ofDirectors’ reportbe taken at different levels in the group.The following committees have been establishedat corporate level to evaluatematters before adecision by the executivemanagement or main BoardofDirectors: the corporate risk committee considersproject-specific risk the investment committee considersrisk associated with the acquisitionand sale of businesses as well as otherinvestment decisions the finance committee considersfinancial market risk.Operational project risk: responsibilityfor ongoing risk assessment rests with thevarious operational business areas. Typicalexamples of such risks are the ability todeliver existing contracts at the agreedtime, quality,functionality and price. Resultsalso depend on costs –both Aker Solutions’own and those charged by suppliers; interestexpenses; exchange rates; and the riskrelated to the customer’s ability to pay.Delivering projects and equipment inaccordance with the contract terms andwithin the anticipated cost framework representsasubstantial risk element, whichwill be among the most significant factorsaffecting the group’s results.Aker Solutions has acommon model forthe execution and follow-up of every phaseof adelivery including evaluation, tendering,decision making, execution and completion.This Project Execution Model(PEM) is common to all the businessareas for project execution and deliveries.The PEM allows for each business area’sdiffering types of projects and deliveries,while securing a unified approach andproviding opportunities for cross-organisationaldeliveries. The group has establisheddecision-making and evaluationbodies at various levels to deal with projectand equipment deliveries. At the pinnacleof this system sits the corporate risk committee,which assesses and recommendscontracts to the appropriate decisionmakingauthority (the President &CEO or theBoard). This committee, which typicallyassesses the largest and most extensivetenders, reviewed about 40 projects in <strong>2008</strong>.Acquisition/sale of businesses and otherinvestment decisions: major businessacquisitions or sales and substantialspending on fixed assets (property,machinery and equipment) are submittedto the investment committee for arecommendationbefore final approval by theexecutive management or the Board. Thecommittee becomes involved at an earlystage in such processes, and evaluationsfrom the relevant specialist staff functionsform an important part of the assessmentprocess. Such work provides proactivequality assurance that all necessary considerationshave been properly assessed,including the question of whether theinvestment satisfies the group’s requiredrate of return. The committee often providesguidance for further work by thebusiness areas on acquisitions and investments,and ensures that capital spendingis followed up with requirements forcalculations of the results achieved.Financial market risk: Aker Solutions hasestablished guidelines and systems tomanage its exposure infinancial markets.These cover currency, interest rate, counterpartyand liquidity risk. Significant bankguarantees have also been issued tocustomers in connection with the group’sactivities. Currency risk: operational units covertheir foreign currency positions via thecorporate treasury department whencontracts are awarded. In turn, thetreasury department covers these positionsdirectly against external banks.Operational units are required to covertheir currency positions against theirfunctional currency. All major contractsare hedged and documented in such away that they qualify for hedgeaccounting. Qualified hedges accountfor about 80 percent of the group’stotal currency exposure. The remaining20 percent is secured through net positionswhich do not qualify for hedgeaccounting under the relevant accountingstandards. The corporate treasurydepartment is also mandated to take alimited open position. This activityyielded earnings of NOK 37 million in<strong>2008</strong>. Total currency turnover for thecompany against external banks in<strong>2008</strong> was almost NOK 107 billion. Interest rate risk: the corporate goal isto have 30–50 percent of gross debton fixed interest rates for three to fiveyears. At 31 December, about 40 percentof the outstanding debt had fixedinterest rates. Counterparty risk: specific and continuousassessments are made of major“The group intends tomaintain its strategyof selecting, winningand executing theprojects in which itwould be appropriateto become involved”contractual counterparties, and effortsare made to cover risk through parentcompany guarantees, structuring ofpayment terms or bank guarantees.Where bank risk and the placementrisk for surplus liquidity are concerned,specific maximum levels have been setfor the group’s exposure toeach financialinstitution.Liquidity risk: in addition to seeking toensure that all projects have apositiveor neutral cash flow, the group’s policyis to maintain satisfactory liquidity atcorporate level. This liquidity buffer isexpressed as the sum of undrawn bankcredit facilities and available cash andbank deposits. Experience indicatesthat the buffer should correspond toabout three to four weeks of turnover orsix to eight percent of annual revenues.The working capital will vary over time,depending on the composition of revenuesin the various segments. Effortswill be made to ensurethat debt has anaverage remaining term of three to fiveyears. Anew bank credit facility of NOK2.0 billion with athree-year term wassecured in December <strong>2008</strong> to strengthenthe group’sliquidity buffer,whichamounted at 31 December to NOK8157 million or roughly 14 percent of<strong>2008</strong> revenues. The average weightedduration of existing outstanding debtand committed credit facilities is 3.21years. Aker Solutions is in compliancewith all the financial covenants in its loanagreements (see note 25.6 Borrowingsand other non-current liabilities to theconsolidated accounts).Guarantee portfolio: asignificantproportion of business area contractsare supported by bank or insuranceguarantees. On-demand guaranteesaccount for alarge share ofthese,particularly in ED&S, Subsea and P&T.This means that they can fall due forAker Solutions annual report <strong>2008</strong> 59
Our performanceBoard ofDirectors’ reportpayment at short notice. Carefulassessments are made before providingsuch on-demand guarantees, withinsurance policies taken out if necessaryto protect against unfriendlyclaims under the guarantees. Thegroup’s guarantee portfolio at 31December totalled NOK 7855 million.The increase from NOK 5500 million in<strong>2007</strong> reflects mainly exchange ratefluctuations. NOK 2624 million in newguarantees were provided during <strong>2008</strong>.Further details about uncertainties andcontingent events are presented innote 13 Contingent events to theconsolidated accounts.The year <strong>2008</strong>New nameThe Board’s proposal to change the companyname from Aker Kværner ASA toAker Solutions ASA was approved by the<strong>Annual</strong> General Meeting (AGM) on 3April<strong>2008</strong>. This change was aconsequence ofthe clarifications obtained in <strong>2007</strong> concerningthe company’sownership structure.The new Aker Solutions name representsthe culmination of an integration processbetween two historical competitors, AkerMaritime and <strong>Kvaerner</strong>, and describes anenterprise which develops completeindustrial solutions for its customers. Thenew name will symbolise clarity, innovationand progress while emphasising itsfamily affiliation and the commercial opportunitiescreated through collaboration withother Aker companies. In connection withthe name change, anew logo and visualidentity wereintroduced for Aker Solutions.Restructuring of the business areasIn order tostreamline the organisation ofthe business even further, aninternal processpursued in the course of <strong>2008</strong> led tothe merger of the FD and MMO businessareas, forming ED&S with operationaleffect from 1September <strong>2008</strong>. The goal ofthis new business area is to make betteruse of its specialist resources and leadingedgeexpertise. That creates opportunitiesfor cost savings and for exploiting synergiesbetween the development and servicing ofoil and gas installations. One aim for themerger is to contribute to asharpening ofthe group’s commercial and technologicalimage, and to expansion in existing andselected new markets.Structural changes were also made inSubsea and P&T with the goal of streamliningthe group’s offers of technology,solutions and services to customers ofthese two business areas. The changesmean that Aker Marine Contractors, AkerWell Service and Aker Geo business units,previously part of the P&T business area,arenow integrated in the Subsea businessarea, while the drilling risers have beenmoved from Subsea to P&T. Anoperationaladjustment began on 1October <strong>2008</strong>, andthe full effect in organisational and accountingterms applied from 1 January <strong>2009</strong>.The driving force behind the restructuringhas been to concentrate all the group’ssubsea and sub-surface activities in thesame business areas in order to improveopportunities to create and exploit commercialsynergies. The changes moreovermean that Subsea and P&T have furthertailored the solutions, technological productsand services they offer to marketrequirements.InvestmentsAs part of the strategy of complementingthe portfolio of products and solutions,some NOK 1.8 billion in total was devotedin <strong>2008</strong> to the acquisition of businesses.Other investments totalled about NOK 1.6billion. Conducted in line with the group’sstrategy, the investments were largelycarried out by Subsea and P&T to meetcustomer requirements. A commitmenthas been made, for instance, to buildingup aglobal service organisation to meetthe local needs of customers.British company Qserv Ltd, which specialisesin well intervention, was acquiredin July <strong>2008</strong>. Demand for products andservices able to enhance the efficiency ofexisting wells is growing sharply, and theacquisition strengthens Aker Solutions’position in the well intervention market.Qserv has almost 400 employees, including250 offshore, and had annual revenuesof NOK 711 million in <strong>2008</strong>.During the second half of <strong>2008</strong>, AkerSolutions acquired afurther 40 percent ofthe shares in Aker Marine Contractors ASand thereby converted this company into awholly-owned subsidiary. The acquisitionformed part of the long-term strategy ofstrengthening the group’s position alongthe value chain for marine operations andoil and gas services. Both Qserv and AkerMarine Contractors will form part of theSubsea business area.The Well Intervention Academy, atestand training centre for well services,opened in Stavanger during May. Its objectiveis to provide new generations of offshoreoperators and engineers with first-handexperience of activities in the well servicessegment. Investment was also made innew office buildings and a new servicebase for Subsea at Perth in Australia, andit was resolved in September <strong>2008</strong> toexpand the Brazilian production facility atCuritiba in order to double capacity formanufacturing subsea trees by <strong>2010</strong>.Acquiring amajority shareholding in FirstInteractive AS is highly significant for P&T.This company pursues three-dimensionalvisualisation and simulation of drillingoperations, in part for training customerdrilling personnel. The acquisition will helpto strengthen the group’s market positioneven further in this field. Aker Solutions alsohas an option to acquire the remainingshares in the company.In Canada, an investment was made inexpanding production facilities for AkerChemetics in Toronto. Construction of thisfacility increases manufacturing and liftingcapacity and permits further developmentof expertise in specialised welding, as wellas in working with stainless and high-alloysteels.Presentation of the accountsAker Solutions presents its accounts in accordancewith the International Financial<strong>Report</strong>ing Standards (IFRS).Income statementConsolidated operating revenues for <strong>2008</strong>were NOK 58 252 million, and the groupthereby met the goal of at least NOK 58billion communicated in the Board ofDirectors’ report for <strong>2007</strong> and on otheroccasions. This represented a0.5 percentincrease from NOK 57 957 million in <strong>2007</strong>.Considerable activity related to the completionof Ormen Lange and Snøhvitcontributed to the high level of revenues in<strong>2007</strong>. In these circumstances, the Boardissatisfied that the goal of maintaining thelevel of revenues was met.Earnings before interest, tax, depreciationand amortisation (EBITDA) amountedto NOK 3382 million, adecline of 13.6 percentfrom NOK 3913 million in <strong>2007</strong>. TheEBITDA margin was 5.8 percent as against6.8 percent in <strong>2007</strong>. The EBITDA decline isprimarily attributable to cost overruns inthe Frigg and Aker H-6e projects.Depreciation, impairment charges andamortisation totalled NOK 615 million,60Aker Solutions annual report <strong>2008</strong>
Our performanceBoard ofDirectors’ reportcompared with NOK 431 million in <strong>2007</strong>.Consolidated earnings before interest andtaxes (EBIT) were NOK 2767 million asagainst NOK 3482 million in <strong>2007</strong>.Net financial expenses amounted toNOK 225 million, compared with NOK 106million in <strong>2007</strong>.The group hedges currency risk for allproject exposures in accordance with wellestablishedpractice. Although this providesafull currency hedge, parts of thehedging (about 20 percent) fail to meet therequirements for hedge accounting specifiedin the IAS 39 international accountingstandard. Fluctuations in the value of theassociated hedging instruments are recognisedas afinancial item in the accounts.The accounting effect appears as anexpense of NOK 439 million in aseparateline under financial items for <strong>2008</strong>. The <strong>2007</strong>figurewas an income of NOK 162 million.The loss from associated companieswas NOK 21 million, compared with alossof NOK 2million in <strong>2007</strong>. Taxexpense wasNOK 590 million as against NOK 1074 millionthe year before. This corresponds toan effective tax rate of 28 percent, comparedwith 30 percent in <strong>2007</strong>.Consolidated net profit for <strong>2008</strong> wasNOK 1513 million, compared with NOK2464 million the year before. This representedearnings per share ofNOK 5.34,down from NOK 8.84 in <strong>2007</strong>.Cash flowNet cash flow from operations wasnegative NOK 868 million, comparedwith positive NOK 2675 million in <strong>2007</strong>.Consolidated cash flow from operatingactivities depends on anumber of factorsincluding progress with and delivery ofprojects and pre-payments from customerswhich lead to asignificant increase inworking capital during the period.Net cash flow from investment activitiesin <strong>2008</strong> was negative NOK 3732 million,primarily as aresult of investment in theSubsea and P&T business areas. The figurefor <strong>2007</strong> was negative NOK 1576 million.Net cash flow from financing activitieswas NOK 4 105 million, compared withnegative NOK 3013 million in <strong>2007</strong>. The<strong>2008</strong> figure includes NOK 807 million individend paid in <strong>2008</strong> and NOK 70 millionin buying back the company’s own shares.Balance sheet and liquidityConsolidated interest-bearing debt amountedto NOK 6.7 billion at 31 December, upfrom NOK 1.6 billion at the same date theyear before. Long-term debt comprisedfour bond loans in the Norwegian market.These loans were for NOK 500 million maturingin <strong>2009</strong>, NOK 650 million maturing in2011, and NOK 150 million and NOK 300million respectively, maturing in 2013. Theyhave floating interest rates with the exceptionof the loan for NOK 150 million maturingin 2013, which has afixed rate. Parts ofthe loans with floating rates have been convertedto fixed rates through interest swapagreements. Fifty percent of the total bondloans accordingly have fixed rates. Theaverage term to maturity for these loans isabout three years.Asyndicated bank facility of EUR 750million (corresponding to NOK 7410 750million at 31 December <strong>2008</strong>) was establishedon 25 October 2006, and has fouryears remaining to maturity.The bank facilityhad been drawn at 31 December <strong>2008</strong>.Anew credit facility of NOK 2000 millionwas established by the company in December<strong>2008</strong> with a term of 18 months tomaturity and an option to extend this termby afurther 18 months to atotal of threeyears. This facility had not been drawn at31 December <strong>2008</strong>.As an alternative to drawing on the bankfacility in <strong>2008</strong>, use was made of theNorwegian certificate market.Net interest-bearing debt amounted toNOK 2311 million at 31 December <strong>2008</strong>,compared with assets of NOK 2463 millionayear earlier. This reduction reflects acquisitions,investments, increased workingcapital and the payment of dividend.Current liabilities of NOK 25 172 millionat 31 December <strong>2008</strong> consisted primarily oftrade and other payables. The correspondingfigure in<strong>2007</strong> was NOK 17 127 million.Aker Solutions’ current assets totalledNOK 25 217 million at 31 December <strong>2008</strong>,compared with NOK 19 866 million ayearearlier.Consolidated non-current assets totalledNOK 13 150 million at 31 December, comparedwith NOK 8650 million ayear earlier.The largest item was goodwill, whichamounted to NOK 6959 million as againstNOK 4938 million. This goodwill relatesprimarily to the acquisition of TrafalgarHouse in 1996, the merger with Aker Maritimein 2001 and the acquisition of QservLtd and Aker Marine Contactors AS in <strong>2008</strong>.Book equity including minority intereststotalled NOK 8606 million at 31 December,compared with NOK 7267 million ayear“Conducted in linewith the group’sstrategy, theinvestments werelargely carried out bySubsea and P&T tomeet customerrequirements”earlier.Minority interests amounted to NOK156 million. The group’s equity ratio was20.1 percent of the total balance sheet at31 December,compared with 25.5 percenta year earlier. Financial adequacy andliquidity are good, and help to place thegroup in agood position to meet the challengesand opportunities presented overthe next few years.The business areasEnergy Development &Services resultsfrom amerger between the former FD andMMO business areas. With some 8500employees, ED&S ranks as asubstantialbusiness in its own right. An efficient mergerprocess was implemented in the summerof <strong>2008</strong> through good planning and positivecollaboration with the workforce.The business area maintained ahigh levelof revenues in <strong>2008</strong>. The year before wascharacterised by record revenues relatedin part to great activity on projects such asOrmen Lange and Snøhvit. Operatingrevenues came to NOK 22 684 million, comparedwith NOK 24 921 million in <strong>2007</strong>.Major projects pursued during <strong>2008</strong>included construction and delivery of theworld’s first offshore regasification terminalfor ExxonMobil’s Adriatic LNG project. Inthe course of <strong>2009</strong>, this facility will deliver10 percent of Italian gas consumption. Oneof Italy’s most extensive projects, thisdevelopment is regarded as an internationalmilestone. Another project whichcharacterised activities in <strong>2008</strong> was theconstruction of the world’smost advanceddrilling rigs, the Aker H-6e units AkerSpitsbergen and Aker Barents, for AkerDrilling. They are expected to be completedand delivered during the first half of<strong>2009</strong>.EBITDA for <strong>2008</strong> was negative atNOK 475 million, compared with apositiveAker Solutions annual report <strong>2008</strong> 61
Our performanceBoard ofDirectors’ reportNOK 1391 million in <strong>2007</strong>. The EBITDAmargin was negative at 2.1 percent asagainst a positive 5.6 percent in <strong>2007</strong>.Efforts to strengthen profitability in <strong>2008</strong>,in line with the group’s overall strategy,have been impacted both by the removalof the Frigg field’s platforms, which provedmore demanding and thereby more expensivethan expected, and by cost overrunsdriven by operational challenges related tothe Aker H-6e rig projectNew contracts weresecured in anumberof areas during <strong>2008</strong>. Long-term, ongoingframe agreements for operation and maintenancework in the North Sea basin wereconcluded, while an extensive front-endengineering and design (FEED) contract wasobtained for renewal work on the Ekofiskfield. Together with WorleyParsons andChicago Bridge &Iron(CB&I), Aker Solutionsalso won the FEED contract for the nextdevelopment phase on the Kashagan field inthe Caspian Sea. The order backlog at 1January<strong>2009</strong> was NOK 18 315 million, comparedwith NOK 24 317 million ayear earlier.The financial crisis is expected to contributeto some postponement of new buildactivity in <strong>2009</strong>, but the long-term marketoutlook for new builds is regarded as positive.Activity in the MMO market shouldremain at ahigh level in <strong>2009</strong>, since theplanned work makes asignificant contributionto maintaining and reinforcing efficientrunning of installations by their operators. Inthe operations and maintenance segment,ED&S holds anumber of long-term frameagreements with the biggest operators.The new business area’s combinedexpertise and capacity allows it to undertakeeven more and larger projects thanbefore inregions outside the North Seabasin. One ED&S goal is to maintain itsshareofthe traditional MMO and new buildmarkets on the Norwegian and UK continentalshelves. Acommitment will simultaneouslybe made to strengthening itsmarket position in such areas as Russia,the Barents Sea, the Caspian Sea, thedeepwater Gulf of Mexico and regionswherethe business has competitive advantagesin technological terms.Subsea underwent a successful expansionand restructuring in the autumn of<strong>2008</strong> with the aim of strengthening therange of subsea technologies, solutionsand services offered throughout the valuechain. As aresult, Aker Marine Contractors,Aker Well Service and Aker Geo businessunits were integrated in the businessarea, while the drilling riser business wastransferred to P&T. Aspart of its strategy,Aker Solutions also acquired Qserv in July<strong>2008</strong>, aleading well service company thatoperates on the UK Continental Shelf.Through these moves, Aker Solutionshas established its Subsea business areaas the industry’s most complete supplierfor advanced subsea solutions, with theability to serve as apartner throughout thefull lifecycle of asubsea field.The business area had ahigh level ofactivity in <strong>2008</strong>, making good operationaland financial progress, and the aftermarketsegment continued to grow throughout theyear. Total operating revenues rose by 13.8percent from <strong>2007</strong> to NOK 11 206 million.EBITDA was NOK 1228 million, comparedwith NOK 960 million in <strong>2007</strong>. Profitabilitystrengthened substantially in <strong>2008</strong>.The EBITDA margin improved from 9.7percent the year before to11percent as aresult of good progress for lifecycleservices and excellent project execution.In the North Sea basin, Subsea progressedwell with the execution of the Morvinand Ormen Lange projects for Statoil-Hydro. First oil was produced by RelianceIndustries from its MA-D6 field on theIndian Continental Shelf in September,only 16 months after awarding Aker Solutionsthe contract to deliver acompletesubsea production system. The group alsowon asubstantial contract in <strong>2008</strong> to installthe field’s second phase.Aker Solutions secured several othersubstantial assignments during the year. Aframe agreement was awarded in Brazilwith Petrobras for delivering 45 subseatrees. Long-term frame agreements forsubsea equipment were also signed withShell (Malaysia and the UK), MurphyExploration &Production Company (Gulfof Mexico) and BP (Angola and the UK).Markets areexpected to be uncertain inthe immediate future, but positive in thelonger term. The order backlog at 1January<strong>2009</strong> was NOK 11 876 million, comparedwith NOK 10 951 million ayear earlier.Subsea has continued the strategy ofinvesting in production and lifecycle capacityto achieve closeness to regional marketsand deepwater regions. The business areahas a very modern and well-developedproduction and lifecycle network, and iswell positioned for further growth. Acommitment will also be maintained totechnology development in selected areas,in part to improve recovery factors forproducing fields. This is a market whereAker Solutions already holds a leadingposition for both technological and maintenanceservices.Products &Technologies experienced ahigh level of activity in its market segmentsduring <strong>2008</strong>. Operating revenues rose by15.1 percent from the year before toreachNOK 14 216 million.Atotal of seven drilling equipment packageswere completed during the year andare operating on rigs for various customers.P&T also contributed important deliveriesto the Dhirubhai 1 floating production,storage and offloading (FPSO) unit forReliance Industries.EBITDA for <strong>2008</strong> came to NOK 1448million as against NOK 959 million the yearbefore. The EBITDA margin was significantlystrengthened, from 7.8 percent in<strong>2007</strong> to 10.2 percent. This improvement inprofitability reflects good project executionas well as the contribution from anexpanding service business.The market for drilling equipment continuedto grow. The strong market positionheld by Aker Solutions was confirmed bythe award ofcontracts to deliver 12 completedrilling equipment packages and sixdrilling riser contracts. Order intake wasgood in <strong>2008</strong>, and the backlog at 31 Decemberhad risen from NOK 11 520 million in<strong>2007</strong> to NOK 14 705 million.Through its successful acquisition ofimportant technology companies, AkerSolutions is well positioned to grow in themarket for drilling equipment. P&T has, formany years, received important componentsfor its drilling systems from WirthGmbH, aGermany-based drilling technologyspecialist. Acquiring this company isan example of complementing the mosthigh-tech sections of the value chain, whilealso expanding the customer base. WithWirth as awholly-owned subsidiary, AkerSolutions expects to be able to strengthendeliveries of complete drilling equipmentpackages. An investment has also beenmade in amanufacturing plant for deepwaterdrilling risers. Opened in <strong>2008</strong>, this facility isstrategically located in Rio das Ostras, Brazil,in order to serve both the fast-growing Brazilianoil industry and the global rig market.As areflection of the high level of activityin the oil and gas industry, over the lastthree years, drilling contractors haveordered alarge number of units for both62Aker Solutions annual report <strong>2008</strong>
Our performanceBoard ofDirectors’ reportdeep and shallow water. Following theaward ofmany new contracts, P&T hasexpanded its market share and ranks asone of the market leaders for advanceddeepwater drilling systems. Demand fornew rigs is expected to decline in the shortterm. This will be partly offset by anexpanding market for upgrades andincreased service activity. In the longerterm, market drivers are expected toensure acontinued high level of activityand demand for advanced drilling rigs andequipment deliveries to FPSOs. Asteadilylarger share of offshore operations isexpected to lie in deep water and harshweather areas, where only the mostadvanced rigs can work. More complexwells, challenging areas of operation andenvironmental requirements are likely tostrengthen demand for such units.Short-term market conditions areexpected to be challenging, and couldlead to adecline in activity. However, alarge, high quality order backlog will helpto maintain the level of activity in <strong>2009</strong> and,to some extent, in <strong>2010</strong> and 2011.Process & Construction reduced itsoperating revenues in <strong>2008</strong> through acontinuedconcentration of the business. Theycame to NOK 10 702 million as againstNOK 11 597 million in <strong>2007</strong>.In line with the goal of strengtheningprofitability, high priority was given tomargin growth. EBITDA was NOK 904million, up 16.5 percent from <strong>2007</strong>. TheEBITDA margin increased from 6.7 percentto 8.4 percent. The order backlog wasNOK 13 300 million at 1January <strong>2009</strong> comparedto NOK 12 519 million ayear earlier.The metals business has asolid orderbacklog and agood market position. InSouth America, the group’s leading positionwas further strengthened during <strong>2008</strong>through the awardoffive new EPCM metalprocessing projects including Esperanza,the world’s largest copper development.New offices were opened in South Africaand Namibia to serve Aker Solutions’global metals customers.In the petrochemicals sector, AkerSolutions’ projects have been graduallyconverted from lump sum EPC contractsto reimbursable EPCM deals. This deliberateconversion yields rather lower revenuesbut better margins and less risk. AkerSolutions has a good petrochemicalsposition in China and India. Uncertaintyprevails about these markets for the immediatefuture, but the market outlook ispositive in the longer term. The groupoccupies astrong position in niches of themarket for power plant construction, particularlyin the US.Engineering capacity in India wasexpanded during <strong>2008</strong>, and the staffisnowroughly 1700 engineers. The Indian businesshas become established as acentre forengineering services and is involved inmany projects both locally and for AkerSolutions worldwide.The work of prioritising profitabilityrather than top-line growth will continueduring <strong>2009</strong>. Acommitment will be madeto further strengthen P&C’s position in themetals market, especially within copperand in South America where many newprojects are planned in the coming years.The business area will continue to concentrateon being a niche supplier to theprocess industry, and China and India willremain important growth markets.Research and developmentNew technologies and new products areimportant requirements for safeguardingAker Solutions’ future competitiveness.The group’s large and highly competentengineering teams work closely with partnersand customers worldwide, and havefirst-hand knowledge of the latter’s technologychallenges and requirements. This closecollaboration initiates ideas and conceptswhich develop into innovative technology.That in turn generates high value creationfor customers. It also ensures that researchand development work is market drivenand cost efficient.Atypical focus area is technologies forincreased production and reservoir utilisationand for improved drilling processes.Important priorities in this context are solutionsfor subsea pumps which permitpipeline transport of oil and gas over longerdistances, or gas compression to increasepressure. Aker Solutions has apilot installationof subsea pumps on the UK ContinentalShelf, which has been operatingwith good results since 2005. The firstcommercial installation was put in place inthe Gulf of Mexico during <strong>2008</strong>. This is thedeepest subsea pump solution everinstalled. At the same time, the pumpingstation stands further from the platform towhich it is tied than any similar facility.New and groundbreaking solutions areto be installed on StatoilHydro’s Tyrihansfield in <strong>2009</strong>. These involve pumps to inject“The group’s large andhighly competentengineering teamswork closely withpartners andcustomers worldwide,and have first-handknowledge of thelatter’s technologychallenges andrequirements”seawater into the reservoir in order toimprove production and recovery. Thepumps will be the first of their kind deliveredby Aker Solutions, and the largestever installed on the seabed.Work is also continuing on seabed gascompression systems in close cooperationwith StatoilHydro and its partners onOrmen Lange. The first objective of thisproject is a 12.5 MW gas compressionpilot, currently under construction and dueto be delivered for testing in <strong>2010</strong>.Aker Solutions invested NOK 188 millionduring <strong>2008</strong> in research and developmentthrough selected projects, compared withNOK 166 million the year before. The groupalso received NOK 21 million in funds fortechnology development from customersand government, as against NOK 77 millionin <strong>2007</strong>.Events after the balance sheet dateWith partners CB&I and WorleyParsons,Aker Solutions was awarded a FEEDcontract in mid-January related to phase IIof the Kashagan field development in theCaspian Sea. This order is worth GBP 90million (USD 135 million).A share purchase programme foremployees was announced in January <strong>2009</strong>,with Aker Solutions offering some 14 100employees in Norway,the Netherlands, theUK, Chile and Canada the opportunity tobuy shares in the company at adiscount.The latter is set at NOK 1500 per employeeup to amaximum purchase of NOK 15 000over the 12 months of the programme.This begins in March <strong>2009</strong>.At the end of January, Aker Solutionsexercised its option to acquirethe remainingAker Solutions annual report <strong>2008</strong> 63
Our performanceBoard ofDirectors’ report50 percent of the shares in Wirth GmbH,which accordingly is considered as awhollyowned subsidiary. Wirth and Aker Solutionshave agood and long-standing relationship,and the acquisition will strengthen thegroup’stotal offering to the market for drillingequipment solutions while also providingsynergy opportunities between the twocompanies.The composition of the group’s executivemanagement team was changed inFebruary <strong>2009</strong>. Jarle Tautra took over asexecutive vice president (EVP) of ED&S insuccession to Nils Arne Hatleskog, whileGary Mandel became EVP for P&C in successionto Jarle Tautra.Share and share capitalDuring the year,Aker Solutions had boughtback 595 000 of its own shares, correspondingto 0.2 percent of the issued total.The company owns atotal of 4966 830shares (1.8 percent). The buy-back programmefor the company’s own sharescontinued under amandate awarded to theBoard bythe AGM on 3April <strong>2008</strong>. Thismandate gives the company theopportunity to buy back shares with atotalnominal value of NOK 54 800 000, correspondingto ten percent of the outstandingshares. The Boardhas mandated the administrationto buy back up to five percent.Repurchases above that percentage butwithin the AGM’s mandate must beconsidered by the Board. The mandateruns until the <strong>2009</strong> AGM, which will beheld on 2April <strong>2009</strong>. At 28 February <strong>2009</strong>,no shares had been acquired under themandate. The Board will propose anextension of the mandate from the date ofthe AGM’s decision until the next AGM.New terms will then be set for the buybackprogramme. The Boardwas not mandatedin <strong>2008</strong> to increase the sharecapital.Going concernBased onthe group’s financial results andposition, the Board affirms that the annualaccounts for <strong>2008</strong> have been prepared onthe assumption that the company is agoing concern.Dividend policyAker Solutions’ dividend policy specifiesan intention to pay shareholders an annualdividend of 30–50 percent of net profit.Dividend will be paid in cash and/orthrough share buy-backs. The Board willpropose atotal dividend of NOK 1.60 pershare tothe AGM for <strong>2008</strong>. Shareholderswill then have received 33 percent of netprofit in the form of share buy-backs anddividend for the fiscal year.Parent company accounts andallocation of net profitParent company Aker Solutions ASA had anet profit of NOK 205 million for <strong>2008</strong>.Pursuant to the company’s dividendpolicy,the Boardproposes that an ordinarydividend of NOK 1.60 per share bepaid.This amounts to NOK 430 million.The Board thereby proposes thefollowing allocation of net profit:Dividend¹ NOK 430 millionOther equityNOK -225 millionTotal allocated NOK 205 million1) Excluding dividend on own shares.Unrestricted equity after the proposeddividend payment amounts to NOK 3105million.Health, safety and the environmentConcern for health, safety and the environment(HSE) isone of Aker Solutions’ corevalues. The fundamental vision and attitudeis that all incidents can be prevented.On that basis, Aker Solutions works continuouslyto prevent incidents which couldcause harm to personnel, material or nonmaterialassets.Driven by careThe Just Care concept has been establishedas asymbol for the group’s HSEculture and work. Akey element is thateach person accepts personal responsibilityfor HSE based on care for people and theenvironment. Through Just Care, the HSEmessage reaches the individual employeemore effectively. Managers as role modelsand astrong commitment to communicationand training create attitudes which integrateHSE in everyday work. That contributes togood projects and better HSE results.Acommon HSE cultureEducationoccupies acentral place in AkerSolutions’ HSE programme. Since it wasintroduced in 2005, atailored HSE leadershipprogramme, developed in-house, hasbeen completed by morethan 2200 leaders.This programme equips managers with thecompetence required to become betterrole models and to drive HSE improvements.To reach out to all employees in an efficientway, the group has also developed its owneLearning programmes for important areas.These include the Just Care culture andHSE as acorevalue, as well as morespecifictopics on mastering stress and protectingthe natural environment. More than 57 000eLearning sessions have been completedsince the programmes wereintroduced.Clear expectationsAcommon HSE management system forthe whole company sets standards for themost important elements in HSE managementand leadership. Regular audits uncoverpossible gaps in relation to expectations,and the necessary countermeasuresare identified and initiated. This systemalso functions as aframework for crossorganisationalsharing and learning.Learning from accidentsOn the basis of an analysis of incidents inrecent years and exchange of experiencein the industry, Aker Solutions has developedand adopted anew component in itsHSE programme. Entitled Just Rules, thisis aset of simple but specific safety regulationsfor particular work operations whichare judged, on the basis of experience, topose higher risks. The categories withinJust Rules are: lifting operations, work atheight, energy isolation, confined spaceentry, excavation and mobile equipment.These rules were implemented throughoutAker Solutions during <strong>2008</strong>. More than32 000 employees, contract staff and subcontractorpersonnel participated duringthe year in presentations of Just Rules aspart of their extensive roll-out. By makingthe most important preventative measuresobligatory, clear and simple, Just Ruleswill be an important contribution to preventingserious incidents.The number of accidents causing seriouspersonal injury declined from 30 in <strong>2007</strong> to17 in <strong>2008</strong>. The total recordable injury frequency(TRIF) per million working hours fellfrom 3.7 to 3.6 in <strong>2008</strong>. The lost time incidentfrequency (LTIF) per million working hoursrose from 0.68 in <strong>2007</strong> to 0.93 in <strong>2008</strong>.These figures also include Aker Solutions’subcontractors. All significant accidentsand near-misses are investigated and thetreatment of each case is systematicallystored in Aker Solutions’ database. Thelessons learned from these accident andnear-misses are implemented with the aimof preventing similar incidents in the future.64Aker Solutions annual report <strong>2008</strong>
Our performanceBoard ofDirectors’ reportSick leaveSick leaveamountedto2.3 percent of totalworking hours in <strong>2008</strong>, compared with 2.4percent the year before. The trend is forsick leave in the group to remain stable atalow level after aclear decline in 2003-2006.However, it should be noted that differencesin local regulations complicate adirect comparison of sick leave betweendifferent countries.Natural environmentThe Board takes the view that AkerSolutions’ activities pose only a limiteddirect burden on the natural environment.No unintentional discharges or emissionsto the surrounding environment wererecorded in <strong>2008</strong>. Total energy consumptionby the business in <strong>2008</strong>, based onrecorded use of oil, gas and electricity,amounted to 623 049 megawatt hours.Carbon emissions related to this usage arecalculated at 146 654 tonnes. The amountof waste recorded in connection with thebusiness totalled 35 756 tonnes, of which62 percent was recycled. <strong>Report</strong>ing processesfor environmental parameters havebeen improved, and the figures above arebeing reported from <strong>2008</strong> with greateraccuracy than before.The group’starget for <strong>2009</strong> is to increaseemployees’ environmental knowledge andawareness. Initiatives will be rolled outthrough acommon, global environmentalcampaign including: further implementationof eLearning courses for all employees,additional focus on environmentalreporting, workshops for top managers,encouraging more business units to becertified to the ISO 14001 standard, andan environmental portal on the intranet. Allthese activities will be carried out inconjunction with an increased focus onenvironmental conditions internally, withcustomers, subcontractors, authorities andsociety in general. The most importantresult is that the employees develop theirpersonal relationship with the environment.19 of the group’sbusiness units arenowcertified to the ISO 14001 environmentalstandard. Five of these were certified in<strong>2008</strong>. An eLearning programme with aparticularfocus on the natural environmentwas introduced during the year, and 9000employees have so far completed it. Thealready mentioned HSE initiatives on leadershipdevelopment, eLearning and themanagement system also incorporateclear components which focus attentionon the environment. Collectively, thesecontribute to continuous improvements inenvironmental awareness and attitudesamong managers and other employees.That inspires the organisation to achievefurther gains in environmental performancein Aker Solutions’ own activities, and toassist customers in making environmentalimprovements through the products developedby the group. Examples can be foundin such areas as carbon capture, drillingrigs with astrong environmental performancein arctic conditions, treatment ofvolatile organic compounds, treatment ofsulphur and ammonia discharges, and thenext generation of biofuels.People and organisationDeveloping human resourcesAker Solutions is strongly committed toleadership and expertise development asacompetitive advantage. The Aker Academyoffers programmes in importantprofessional subject areas such as generalleadership, project execution, commercialmanagement and HSE. Implemented todate primarily in Europe, the US and Asia,these programmes had atotal of 1334participants in <strong>2008</strong>.Emphasis has also been given to implementingeLearning programmes, with24 000 active users in over 30 countries.Over 80 000 eLearning courses have beencompleted since 2005. The group’s globaleLearning portal offers more than 30tailored programmes which support bothglobal and corporate initiatives. The portfolioof eLearning programmes covers areasincluding PEM, HSE and Just Care,environmental considerations, socialresponsibility and more group-specifictopics. A new eLearning programme onmastering stress was launched in connectionwith improvement measures identifiedthrough the employee survey carried out inAker Solutions during <strong>2007</strong>. The commitmentto eLearning has helped to provideall employees with aunifying, cost-effectiveand accessible range of courses. In additionto the professional expertise theyprovide in key areas, these courses makea strong contribution to building a commoncorporate culture through auniformapproach and consistent message, as wellas opportunities for mandatory certificationin special areas. Corporate programmesoffered across the group aresupplemented by a number of trainingcourses organised by local units.“A key element is thateach person acceptspersonal responsibilityfor HSE based oncare for people andthe environment”Aker Solutions’ international traineeprogramme is now in its thirdyear.Traineeshave rotated globally between differentpositions in the group, completing atotalof 66 assignments, of which morethan halfwere outside Norway. The first batch oftrainees completed their programmeduring September, and all eight havesecured full time positions with AkerSolutions in the US, Brazil, China, Malaysiaand Norway. These positions lie withinsuch areas as business development, procurementand finance. The third batch oftrainees was recruited in the autumn of<strong>2008</strong> for atwo year programme with AkerSolutions. They come from India, Malaysia,Norway and Russia. Aker Solutionsreceived more than 1500 applications forthese ten traineeships.A global talent programme waslaunched in connection with the creationof the new ED&S business area. Its mainfocus is on developing the business area’smanagement capacity to meet the leadershipchallenges presented by a largerproportion of international projects, teamswith amore global composition and operationsin unfamiliar regions.Aker Solutions also opened its WellIntervention Academy in Stavanger duringthe spring of <strong>2008</strong>. This test facility will providethe next generation of offshoreoperatorsand engineers with first-hand knowledge of,and experience with, critical well interventionactivities. The academy can offer realisticand practical training in virtually the sameenvironment as that found offshore.OrganisationThe Aker Solutions workforce totalled33 961 people at 31 December, including23 360 employees and 10 601 contractstaff. Of the group’semployees, 49.7 percentworked in Norway, 17.2 percent in theAmericas, 14.6 percent in Asia and Australia,17.5 percent in Europe outside Norway and1.1 percent in Africa and the Middle East.Aker Solutions annual report <strong>2008</strong> 65
Our performanceBoard ofDirectors’ reportWorkforce turnover in <strong>2008</strong> averagednine percent, areduction of 1.4 percentagepoints from the year before. Aker Solutionsfaced achallenging labour market in <strong>2008</strong>,and purposeful efforts were made tosecure qualified resources through recruitment.The focus has been on implementingacommon global recruitment model inthe group with acommon interview guiderooted in the group’s values, standardinformation materials and training of inhouseresources, which has contributed inpart to amore transparent in-house labourmarket. The aim has been to ensure thatas many potential candidates as possibleexperience a professional recruitmentprocess in amarket and an industry wherecompetition over competent labour is evertougher. Common recruitment campaignswere also pursued in Norway and the USwith great success. More than 30 000applicants from over 30 countries wereregistered in the group’s recruitment systemin <strong>2008</strong>. Atotal of 4108 new employeeswere recruited from this base duringthe year, ofthese were 25percent femaleand 75 percent male.Board and management changesSimen Lieungh took over as President &CEO of Aker Solutions ASA with effectfrom 1March <strong>2008</strong>. He replaced MartinusBrandal, who moved to anew position asSenior Partner & President in Aker ASAwith responsibility for Energy Technologies.Leif Borge was appointed to replace BjørnErik Næss as chief financial officer (CFO)from April <strong>2008</strong>.The AGM held on 3April elected MartinusBrandal as the new Chairman of the Board,while Leif-Arne Langøy and Bjørn Flatgårdwere elected as Directors for atwo yearterm.Several changes were made to theexecutive management team during theyear in connection with the restructuring ofthe business areas. Jarle Tautra wasappointed EVP of the new ED&S businessarea from February <strong>2009</strong> in succession toNils Arne Hatleskog, who led the processof merging FD and MMO. Pål Helsing,previously EVP for FD, was appointedsenior vice president (SVP) for strategyand technology in April <strong>2008</strong>, reportingdirectly to President &CEO Simen Lieungh.Gary Mandel was appointed EVP for theP&C business area in succession to JarleTautra. He had been CEO of Aker AmericanShipping since <strong>2007</strong> and previously workedfor Aker Solutions, heading the former businessarea Oil, Gas, Process and Energy(OGPE) until <strong>2007</strong>. Per Harald Kongelf tookover as EVP for P&T, succeeding MadsAndersen who in September <strong>2008</strong> wasappointed EVP of Subsea. RaymondCarlsen, the former head of that businessarea, moved in October <strong>2008</strong> to aposition asPartner in Aker ASA.Equal opportunities and diversityAker Solutions wants to be an attractiveemployer for people from different backgrounds,regardless of their ethnicity,gender,religion or age. With operations in around30 countries and on every continent, diversityis adesirable and positive part of thecorporate culture and strengthens thegroup’s ability to operate in varying conditionsand frameworks. Aker Solutions isincluded in athree parties framework agreementbetween Aker ASA, the NorwegianUnited Federation of Trades Unions and theInternational Metalworkers Federation,committing the involved parties to workingtowards the development of good workingrelations. The agreement consists of elevenmain points including discrimination, workinghours and general working conditions.The agreement will be reviewed annually toensurethat the parties comply with their obligations.The group will pay the equivalent salaryfor the equivalent work and will rewardgood performance. Key factors in determiningpay are the area of responsibilityconcerned, what a job involves, theemployee’s level of expertise and commitment,results actually achieved, and localpay levels. Average pay in the company issomewhat higher for men than for women.On average, male employees have greaterpay seniority than women. Aker Solutionshas two main categories of employees:skilled workers/operators (29 percent) andwhite collar personnel (71 percent).The group benefits from diversity in therecruitment and development of its leaders.The Aker Academy’s leadership programmeswere composed of 23 percentfemales on mid-level manager coursesand 11 percent females on its top levelcourses. Aker Solutions prioritises theattraction and retention of youthfultalents. To date the Aker internationaltrainee programme has had 69 percentfemales. The corporate executive managementteam had no female members at31 December. Three of Aker Solutions’ sixshareholder-elected Directors are women,which corresponds to 50 percent. All of theemployee-elected Directors are men.All-male employee-elected Directors ispermitted in instances where the numberof female employees is less than 20percent of the total workforce.Wherever possible Aker Solutionssupports and promotes arrangementsthat bring a positive work/life balance,including flexible working, remote workingand part-time working.Performance culture and managementby resultsAker Solutions wants its organisation andeach employee to concentrate onachievingresults in the short and long terms.Processes for setting targets and measuringtheir attainment, and for rewarding employeesin relation to the results achieved,represent important instruments in thiscontext. Targets for managers and otheremployees are determined on the basis ofstrategies and budgets in each unit. Theyareset on an annual basis, but followed upand further developed where necessaryduring the year. The annual performancemeasurement processes embrace financialtargets, development and improvement ofproducts, project management, serviceand the like. Targets are also set for HSEand personal development by eachmanager and other employee.To ensure development and optimumutilisation of the group’s managementresources, an annual assessment ofmanagers is conducted as the basisfor determining plans for managementdevelopment, manager mobility and thedevelopment of talented managers.Aker Solutions wants to reward managersand other employees in accordancewith the results achieved. This is achievedthrough the determination of individual basicpay for groups of employees and remunerationsystems which pay an annual variableamount to managers and other employees.<strong>Annual</strong> variable pay is paid to employeeson the basis of the commercial resultsachieved by the relevant company orproject. Managers earnvariable pay on thebasis of commercial results for the unitsthey influence and the extent to which theycomply with the group’s values. Variablepay for senior executives is spread overseveral years to encourage long-termachievement of results and a lastingemployee relationship. Further details of66Aker Solutions annual report <strong>2008</strong>
Our performanceBoard ofDirectors’ reportthe remuneration of senior executives areotherwise provided in note 18 Salaries,wages and social security costs to theconsolidated accounts.Corporate governanceAker Solutions complies onthe whole withthe principles enshrined in the applicableNorwegian code ofpractice for corporategovernance, which also largely harmoniseswith applicable international recommendations.The annual statement on theway Aker Solutions observes the code ofpractice issued by the Norwegian CorporateGovernance Board (NUES) can be foundon page 132 of this annual report.Corporate responsibilityAs aNorwegian company with astronginternational presence, Aker Solutions hasan impact economically, environmentallyand in the lives of people globally.With thiscomes responsibility: the responsibility toset high standards; to be abusiness that isdriven by its values; and to be a goodcorporate citizen.Aker Solutions’ history and values, aswell as international norms such as theUN Global Compact, the Global <strong>Report</strong>ingInitiative and the OECD Guidelines are thebasis of its corporate responsibility principles.The company is committed to continuallyimproving its performance against them.As aglobal supplier to the energy andprocess industries, the company hassingled out two areas of corporate responsibility(CR) on which to focus: managing the challenges associatedwith entry into new and emergingmarkets developing and supporting effective,environmentally sound solutionsIn <strong>2008</strong>, the company became amemberof UN Global Compact. Membership opensup global and local opportunities todialogue and collaborate with other businesses,non-governmental organisations,labour organisations and governments oncritical issues.In addition, Aker Solutions’ major shareholder,Aker ASA, signed a frameworkagreement with the Norwegian Confederationof Trades Unions and the InternationalMetalworkers Federation on behalf ofcompanies that are a part of Aker. Theagreement commits Aker Solutions and allAker companies to working towards thedevelopment of good working relations,and to respect human and trade unionrights in the community.As part of Aker Solutions’ efforts tobuild internal awareness and understandingfor corporate responsibility, thecompany rolled out its CR eLearningprogramme globally mid-year. The courseis mandatory for all employees.In <strong>2008</strong>, the company successfullyimplemented the first phase of its strategicthree year partnership agreement with theNorwegian Red Cross. The partnershipencompassesfinancialsupport,exchangesof expertise between the organisationsand volunteer activities. In phase one, AkerSolutions offices in Norway were introducedto the Red Cross volunteer activitieslocal to them. Several Aker Solutions’offices are now actively engaged in volunteeractivities. The second phase of thepartnership is already underway, with theaim of expanding the collaboration to AkerSolutions’ offices around the world.In December, the company publishedits CR report for <strong>2008</strong>/<strong>2009</strong>, Face value.The report communicates the CR challengesthe company faces, the results it hasachieved and its ambitions going forward.The report is available from Aker Solutions’website.Customer relationsMany of Aker Solutions’ customers areleading players in their sectors on theworld stage. They implement extensiveprojects which are usually of such acharacterthat failure tomeet agreed progress,budget, quality and efficiency milestonescan have major consequences. Aker Solutionsgives great weight to its ability to deliver,and also has areputation for offeringsolutions which create added value forcustomers.Those customers have shown great confidencein the group over many years byawarding it important projects. Thisconfidence represents amajor asset, whichit is important to preserve and continuedeveloping.The group gives great weight to findingthe best and most effective solutions foreach customer. That is done by combiningan understanding of their specific challengeswith Aker Solutions’ expertise,experience, technology and products –notleast with the aid of its recognised andwell-proven model for project execution,the Aker Solutions PEM. The group also“With operations inaround 30 countriesand on every continent,diversity is adesirableand positive part of thecorporate culture”implemented important organisationalchanges in <strong>2009</strong> in order to even bettertailor its offer to customer requirements.Contact with customers is pursued atvarious levels –between senior executives,through the business area concerned,through project management and throughclose collaboration with relevant teams ofexperts.Both executive management and managersat other levels have defined roles forensuring the best possible follow-up ofeach customer. Contact at several levelsensures a good overview and understandingof the customer’s requirements,both in the short term and over alongerperspective.In addition to direct customer contact,Aker Solutions utilises external marketanalyses and surveys of customer satisfactionas tools to ensure that it is meetingcustomer expectations and needs.The group serves industries where thenumber of customers in each niche isrelatively small. However, most of theserepresent abroad and long-term potentialfor collaboration. The goal is to establishgood, long-term relations with customers,based on the group’s performance and oncompetitive tendering.Mutual confidence, built up throughbusiness relationships extending overmany years, often helps to create newopportunities. These could involve newcontracts with even better reward models,for instance, or the development of innovativesolutions and technology in closecollaboration with the customer.Confidenceis also valuable when assessing projects innew regions. It will often be easier tomanage risk, for instance, when the customerhas an established relationship withAker Solutions from earlier collaboration.OutlookThe Board would like topoint out that thisreport includes and is based in part on for-Aker Solutions annual report <strong>2008</strong> 67
Our performanceBoard ofDirectors’ reportward-looking information and statementswhich are subject to risks and uncertaintiesthat could cause actual results to differ.At its Capital Markets Day on 30 November<strong>2007</strong>, the group communicated itsobjectives for growth and profitability inthe periode <strong>2008</strong>–<strong>2010</strong>. These performancetargets were determined on the basis ofthe group’s solid order backlog and thegood market outlook for the energy andprocess industries.The financial crisis and economic downturnduring <strong>2008</strong> has created greateruncertainty about the market outlook, andthe general conditions for attaining theseobjectives have changed considerably. Asaresult, new performance targets for <strong>2009</strong>werepresented at the Capital Markets Dayon 9December <strong>2008</strong>. Nominal EBITDA isexpected to increase for <strong>2009</strong> and toexceed NOK 4500 million, while revenueswill be somewhat lower than in <strong>2008</strong>. Theseforecasts are based on asolid order backlogof high quality and the group’s expectationsof securing additional contracts.Many important organisational adjustmentsand changes were made during<strong>2008</strong>, and these have given Aker Solutionsagood starting point in meeting the globaleconomic downturn. However, itremainstoo early to say with any certainty how thisdownturnwill affect the group’soperationsand markets. No reliable analyses areavailable for when market activity willrecover. Market conditions in <strong>2009</strong> will bechallenging, and further pressureonpricesis expected. In these circumstances, it willbe even more important to continue workon optimising costs and capacity.The extensive cost-cutting programmeinitiated in <strong>2007</strong> continued as expected in<strong>2008</strong>, and will have an effect on results asplanned in <strong>2009</strong>. Thanks to its flexibility,Aker Solutions is relatively well equippedto handle the challenges expected in theimmediate future.Spare capacity is likely to become availablein the group during <strong>2009</strong>. Existingcapacity must be utilised where possible,and an important measure will be to movecapacity in-house across both businessareas and geographical regions. Acarefuleye is being kept on possible requirementsfor capacity adjustments so that these canbe made quickly should the need arise.Even if the level of activity in AkerSolutions’ principal markets weretodeclinein the short term, the fundamental basis forfurther market growth is likely to be presentin the longer term. In its annual report on theoutlook for energy markets, the InternationalEnergy Agency (IEA) concluded thatworld energy demand is growing, withdevelopments in the Asian economies asan important driver. The IEA believes thatglobal demand for primary energy couldrise by 45 percent over the next 20 years. Itsreport concludes that new standards will beintroduced to reduce carbon emissions butthat, even if these weretoinfluence demandfor fossil fuels in the long term, they willprimarily mean the implementation of newtreatment technologies over the next fewdecades and that world oil and gas demandwill remain high for many decades to come.Development and construction of carboncapture technology is also an area whereAker Solutions holds an advanced position.Existing oil and gas fields will be unableto meet all of the demand in the longer term.The amount of oil and gas produced eachyear already exceeds the new resourceswhich the industry succeeds in discoveringand developing. Should the pace of newfield development be low for atime, theresult is likely to be an accumulated energydeficit which could boost the level of activitywhen demand recovers. A substantialproportion of future developments areexpected to be located in deep water and inareas with atough climate –precisely theconditions where Aker Solutions has astrong competitive advantage.The level of activity in land-based processplants for refined oil products and artificialsubstances, and for metal processing,is also expected to decline gradually as aresult of the international economicdownturn. China has been a substantialconsumer of such materials in the recentpast. Chinese industrial growth is expectedto be lower for atime than has been thecase in recent years, but this slowdowncould be smaller than in most other parts ofthe world. Aker Solutions’ involvement withsuch projects is concentrated on nicheswherethe group has astrong position, suchas copper, gold and other selected metals.The fundamental conditions are accordinglyalso in place for fresh expansion inthese segments of the group’s businessonce the world economy starts to recover.The energy sector is characterised by alimited number of global operators, manynational oil companies, asmall set of largeand international suppliers such as AkerSolutions, and a substantial number ofsmall and medium-sized operators andsubcontractors. Most players in the industrystrengthened their financial results duringthe boom of the past few years, but not allhave the financial strength and liquidity towithstand alengthy and deep economicdownturn without making substantialchanges.The Board extends its thanks to themanagement and workforce for the goodcommitment displayed in <strong>2008</strong>. In its view,the quality and expertise built up in AkerSolutions helps to give the group clearcompetitive advantages which also applyin more demanding market conditions.Fornebu, 3March <strong>2009</strong>The Board ofDirectors of Aker Solutions ASAMartinus BrandalChairmanBjørn FlatgårdVice ChairmanHeidi M. PetersenVibeke HammerMadsenLeif-Arne langøySiri FürstÅsmund Knutsen Ingebreth Forus Arve Toft Atle Teigland Simen LieunghPresident &CEO68Aker Solutions annual report <strong>2008</strong>
Our performanceBoard ofDirectors’ reportDeclaration by the Board ofDirectors andthe President &CEOThe Boardand the President &CEO have today considered and approved the Aker Solutions ASA annual report and financial statementsfor the Aker Solutions group and its parent company for the <strong>2008</strong> calendar year end as of 31 December <strong>2008</strong>.The consolidated financial statements have been prepared and presented in accordance with the requirements of IFRS as adopted bythe EU and associated interpretations, and with additional Norwegian disclosure requirements that were inforce as of 31 December<strong>2008</strong>. The parent company financial statements for the year have been prepared in accordance with the Norwegian Accounting Act andgenerally accepted accounting principles in Norway as of 31 December <strong>2008</strong>. The annual report for the group and parent companymeets the requirements of the Norwegian Accounting Act and Norwegian Accounting Standard 16inforce as of 31 December <strong>2008</strong>.To the best of our knowledge:the <strong>2008</strong> financial statements for the group and parent company have been prepared in accordance with applicable accountingstandardsthe information provided in the financial statements gives atrue and fair portrayal of the group and parent company’s assets,liabilities, financial position, and profit as awhole as of 31 December <strong>2008</strong>The annual report provides atrue and fair overview of:– developments, profit, and the financial position of the group and parent company– the most significant risks and uncertainties facing the group and the parent companyFornebu, 3March <strong>2009</strong>The Board and the President &CEO of Aker Solutions ASAMartinus BrandalChairmanBjørn FlatgårdVice ChairmanHeidi M. PetersenVibeke HammerMadsenLeif-Arne langøySiri FürstÅsmund Knutsen Ingebreth Forus Arve Toft Atle Teigland Simen LieunghPresident &CEOAker Solutions annual report <strong>2008</strong> 69
Our performance<strong>Annual</strong> accounts70Aker Solutions annual report <strong>2008</strong>
Our performance<strong>Annual</strong> accountsContents: Accounts and notesAker Solutions group72 Consolidated income statement73 Consolidated balance sheet74 Consolidated statement of cash flow75 Consolidated statement of changes in equityNotes to consolidated accounts76 Note 1 General information76 Note 2 Accounting principles81 Note 3 Accounting estimates and judgements82 Note 4 Acquisitions of subsidiaries and minority interests84 Note 5 Related parties85 Note 6 Segment information87 Note 7 Other operating expenses87 Note 8 Net operating assets88 Note 9 Current operating assets88 Note 10 Current operating liabilities88 Note 11 Contracts90 Note 12 Provisions90 Note 13 Contingent events91 Note 14 Property, plant and equipment92 Note 15 Operating leases92 Note 16 Intangible assets93 Note 17 Tax95 Note 18 Salaries, wages and social security cost98 Note 19 Number of employees99 Note 20 Employee benefits -pension101 Note 21 Equity accounted investees102 Note 22 Investment in joint ventures103 Note 23 Financial risk management107 Note 24 Financial income and expense108 Note 25 Financial instruments108 Note 25.1 Cash and cash equivalents109 Note 25.2 Investments in other companies109 Note 25.3 Derivative financial instruments110 Note 25.4 Non-current interest-bearing receivables111 Note 25.5 Trade and other receivables111 Note 25.6 Borrowings and other non-current liabilities113 Note 26 Subsequent events113 Note 27 Discontinued operations113 Note 28 Group companies as at 31 December <strong>2008</strong>Aker Solutions ASA116 Parent company income statement117 Parent company balance sheet118 Parent company statement of cash flowNotes to parent company accounts119 Note 1 Accounting principles119 Note 2 Operating expenses120 Note 3 Net financial items120 Note 4 Tax121 Note 5 Investment in subsidiaries and other companies121 Note 6 Non interest-bearing items122 Note 7 Shareholders’ equity122 Note 8 Interest-bearing items123 Note 9 Non-current borrowings123 Note 10 Guarantees123 Note 11 Financial instruments123 Note 12 Contingent events and related partiesAker Solutions annual report <strong>2008</strong> 71
Our performance<strong>Annual</strong> accountsAker Solutions group:Consolidated income statement 1.1 –31.12Amounts in NOK million Note <strong>2008</strong> <strong>2007</strong> 2006Revenue 6 58 252 57 957 50 592Materials, goods and services -34891 -36405 -31299Salaries, wages and social security costs 18, 19, 20 -13122 -12197 -10441Other operating expenses 7 -6857 -5442 -5980Total operating expenses -54870 -54044 -47720Operating profit before depreciation, amortisation and impairment 6 3382 3913 2872Depreciation, amortisation and impairment 6, 14, 16 - 615 - 431 - 339Operating profit 2767 3482 2533Financial income 24 175 105 194Financial expenses 24 - 379 - 209 -1081Share ofprofit (+) /loss (-) of associates 6, 21 - 21 - 2 - 18Profit (+) /loss (-) on foreign currency forward contracts 1 24 - 439 162 241Profit before tax 2103 3538 1869Income tax expense 17 - 590 -1074 - 575Net profit from continuing operations 1513 2464 1294Profit for the period from discontinued operations net of tax 27 - - 2 495Profit for the period 1513 2464 3789Attributable toEquity holders of the parent company 1438 2401 3738Minority interests 75 63 51Net profit 1513 2464 3789Average number of shares 269 056 995 271 741 367 275 146 170Basic and diluted earnings per share continuing operations (NOK) 2 5.34 8.84 4.53Basic and diluted earnings per share from discontinued business (NOK) 0.00 0.00 9.06Basic and diluted earnings per share (NOK) 2 5.34 8.84 13.591) Profit /loss on foreign currency hedging instruments that do not qualify for hedge accounting.2) Equity holders of the parent company’s share ofnet profit (+) /loss (-) /average number of shares. There were nopotentially dilutive securities outstanding.72Aker Solutions annual report <strong>2008</strong>
Our performance<strong>Annual</strong> accountsAker Solutions group:Consolidated balance sheet as at 31.12Amounts in NOK million Note <strong>2008</strong> <strong>2007</strong>ASSETSNon-current assetsProperty, plant and equipment 14 4610 2815Deferred tax assets 17 519 548Intangible assets 16 7119 4995Employee benefit assets 20 234 15Interest-bearing non-current receivables 25.4 97 14Other non-current operating assets 8 4 9Investments in associates 6, 21 444 121Investments in other companies 25.2 123 133Total non-current assets 13 150 8650Current assetsCurrent tax assets 17 49 89Inventories 9 1321 884Trade and other receivables 9, 25.5 20 796 13 361Derivative financial instruments 25.3 3100 1468Interest-bearing current receivables 25 480 540Cash and cash equivalents 25.1 3828 3524Total current assets 29 574 19 866Total assets 42 724 28 516LIABILITIES AND SHAREHOLDERS’ EQUITYEquityIssued capital 548 548Own shares -10 -9Other capital paid in 1534 1534Other equity 6378 5026Total equity attributable to the equity holders of the parent company 8450 7099Minority interest 156 168Total equity 8606 7267LiabilitiesNon-current borrowings 25.6 6163 1591Employee benefits obligations 20 758 937Deferred tax liabilities 17 831 680Other non-current liabilities 25.6 1194 914Total non-current liabilities 8946 4122Current borrowings 25.6 553 24Current tax liabilities 17 252 329Provisions 10, 12 912 655Trade and other payables 10 21 052 15 165Derivative financial instruments 25.3 2403 954Total current liabilities 25 172 17 127Total liabilities 34 118 21 249Total liabilities and shareholders’ equity 42 724 28 516Fornebu, 3March <strong>2009</strong>Board ofDirectors of Aker Solutions ASAMartinus BrandalChairmanBjørn FlatgårdVice ChairmanHeidi M. PetersenVibeke HammerMadsenLeif-Arne langøySiri FürstÅsmund Knutsen Ingebreth Forus Arve Toft Atle Teigland Simen LieunghPresident &CEOAker Solutions annual report <strong>2008</strong> 73
Our performance<strong>Annual</strong> accountsAker Solutions group:Consolidated statement of cash flow 1.1 –31.12Amounts in NOK million Note <strong>2008</strong> <strong>2007</strong>Cash flow from operating activitiesProfit for the period 1513 2464Income tax expense 17 590 1074Net interest cost 225 104Profit (-) /loss (+) on foreign currency forward contracts 439 -162Depreciation, amortisation and impairment 14, 16 615 431Profit (-) /loss (+) on disposals /non-cash effects 1 -23 -64Share ofprofit (-) /loss (+) of associates 21 21 2Interest paid -295 -172Interest received 132 43Income taxes paid -472 -480Changes in other net operating assets -3613 -565Net cash from operating activities -868 2675Cash flow from investing activitiesAcquisition of subsidiaries and minorities (net of cash acquired) 4 -1817 - 87Acquisition of property, plant and equipment 6,14 -1572 -1596Proceeds from sale of property, plant and equipment 34 96Acquisition of shares in associates and other investments -377 11Net cash from investing activities -3732 -1576Cash flow from financing activitiesProceeds from borrowings 4956 -Repayment of borrowings -24 -19Proceeds from issue of share capital from minority interests 72 -Dividends paid to minority interests -22 -31Buy-back of own shares 2 -70 -781Dividends to shareholders 2 -807 -2182Net cash from financing activities 4105 -3013Effect of exchange rate changes on cash and bank deposits 799 - 228Net increase (+) /decrease (-) in cash and bank deposits 304 -2142Cash and cash equivalents at the beginning of the period 3524 5666Cash and cash equivalents at the end of the period 3 3828 3524Of which is restricted cash 4 976 6611) Gain /loss on disposal of property, plant and equipment.2) See consolidated statement of changes to equity.3) Additional undrawn committed non-current bank revolving credit facilities amounted to NOK 4.4 billion, and is together with cash and cash equivalents giving atotal liquidity bufferof NOK 8.2 billion. NOK 500 million of the undrawn committed credit facilities was agreed in February <strong>2009</strong>.4) Restricted cash includes inter alia cash in joint ventures where the partners must agree before use and cash in business units which is not owned 100 percent by Aker Solutions.74Aker Solutions annual report <strong>2008</strong>
Our performance<strong>Annual</strong> accountsAker Solutions group:Consolidated statement of changes in equity 1.1 –31.12Amounts in NOK millionNumber ofsharesSharecapitalOwnsharesOthercapitalpaid inRetainedearningsand otherreservesHedgingreserveCurrencytranslationreserveTotal attributabletoparent companyequityholdersMinorityinterestsTotalequityEquity as at 1January <strong>2007</strong> 55 029 234 550 - 1 534 5857 203 - 161 7983 131 8114Cash flow hedgesEffective portion of changes in value - - - - 788 - 788 - 788Reclassified to income statement - - - - - 633 - - 633 - - 633Deferred tax - - - - - 43 - - 43 - - 43Currency translation differences - - - - - - 434 - 434 - - 434Net income recognised directly in equity 550 - 1 534 5857 315 - 595 7661 131 7792Profit for the period - - - 2 401 - - 2401 63 2464Total recognised income and expense 550 - 1 534 8258 315 - 595 10 062 194 10 256Increase caused by share split (1:5) 220 116 936Cancellation of shares -1 146 170 - 2 2 - - - - - - -Change in minority interests - 11 - 11Dividend - - - - 2182 - - -2182 - 15 - 2197Share buy-back - - 11 - - 770 - - - 781 - - 781Equity as at 31 December <strong>2007</strong> 274 000 000 548 - 9 1534 5306 315 - 595 7099 168 7267Cash flow hedgesEffective portion of changes in value - - - - - 241 - - 241 - - 241Reclassified to income statement - - - - 373 - 373 - 373Deferred tax - - - - - 37 - - 37 - - 37Currency translation differences - - - - - 695 695 7 702Net income recognised directly in equity 548 - 9 1534 5306 410 100 7889 175 8064Profit for the period - - - 1 438 - - 1438 75 1513Total recognised income and expense 548 - 9 1534 6744 410 100 9327 250 9577Change in minority interests - 72 -72Dividend - - - - 807 - - - 807 - 22 -829Share buy-back - - 1 - - 69 - - - 70 - -70Equity as at 31 December <strong>2008</strong> 274 000 000 548 - 10 1 534 5868 410 100 8450 156 8606Share capitalAker Solutions ASA has one class of shares, ordinary shares, with equal rights for all shares. The holders of ordinary shares areentitled to receive dividends and areentitled to one vote per shareatGeneral Meetings. At the end of 2006 Aker Solutions ASA had 55 029 234 ordinary shares at apar value of NOK 10 per share. At the<strong>Annual</strong> General Meeting in March <strong>2007</strong> the shareholders agreed to split one shareatapar value of NOK 10 into five shares at par value of NOK 2. The new number ofshares after the sharesplit was 275 146 170. At the <strong>Annual</strong> General Meeting the shareholders also agreed to reduce the sharecapital in Aker Solutions ASA by NOK2292 340 to NOK 548 000 000 through the cancellation of 1146 170 treasury shares. Total outstanding shares arenow 274 000 000. All issued shares arefully paid.Share buy-backAt the <strong>2007</strong> <strong>Annual</strong> General Meeting an authorisation was given to repurchase up to 27.4 million shares, representing 10 percent of the sharecapital of AkerSolutions ASA. Aker Solutions ASA purchased 595 000 own shares in <strong>2008</strong> and as at 31 December <strong>2008</strong> Aker Solutions ASA holds 4966 830 own sharesrepresenting 1.8 percent of total outstanding shares.Hedging reserveThe hedging reserve relates to cash flow hedges of futurerevenues and expenses against exchange rate fluctuations. The income statement effects of such instrumentsarerecognised in accordance with the progress of the underlying construction contract as part of revenues or expenses as appropriate. The hedging reserve representsthe value of such hedging instruments that arenot yet recognised in the income statement. Users of the financial statement should be awareofthe underlying natureofahedge; e.g. that apositive value on ahedging instrument exists to cover anegative value on the hedged position, see note 24 Financial income and expenses.Currency translation reserveThe currency translation reserve includes exchange differences arising from the translation of the net investment in foreign operations, and foreign exchange gain /loss on loans defined as hedges/net investments, see note 24 Financial income and expenses.Minority interestsAt 31 December <strong>2008</strong> NOK 99 million (NOK 75 million in <strong>2007</strong>) of the minority interests relates to Aker Solutions Powergas Pvt Ltd in which Aker Solutions owns 64percent and NOK 44 million (NOK 17 million in <strong>2007</strong>) to Step OffshoreASinwhich Aker Solutions owns 51 percent of the shares. The change in minority interests in<strong>2008</strong> is primarily due to the acquisition of 40 percent in Aker Marine Contractors AS which gives Aker Solutions full control of the company.Dividends 1 <strong>2008</strong> <strong>2007</strong>Dividend per shareinNOK –paid 3.00 8.00Total dividend paid (NOK million) 807 2182Ordinary dividend per shareinNOK –proposed by the BoardofDirectors 1.60 3.001) Dividend is adjusted on the basis of the share split.Aker Solutions annual report <strong>2008</strong> 75
Our performanceNotes to the accountsAker Solutions group:Notes to the accounts■ Note 1: General InformationAker Solutions ASA (the company) is alimited liability company incorporated and domiciled at Fornebu in Bærum, Norway.InApril <strong>2008</strong> the company changedits name from Aker Kværner ASA to Aker Solutions ASA. The consolidated financial statements of Aker Solutions ASA incorporate the financial statements ofthe company and its subsidiaries (together referred to as the “group” and separately as group companies) and the group’s interest in associates and jointlycontrolled entities and jointly controlled assets. Aker Solutions is aleading global supplier of engineering services, fabrication, technology products,maintenance, specialised services, and total solutions for the energy and process industries.The company is listed on the Oslo Stock Exchange under the ticker AKSO.All amounts in the financial statements are presented in million Norwegian kroner (NOK), unless otherwise stated.■Note 2: Accounting principlesSummary of significant accounting policiesThe principal accounting policies applied in thepreparation of these consolidated financial statementsare set out below. These policies havebeen consistently applied to all the years presented,unless otherwise stated.The consolidated financial statements wereauthorised for issue by the Board ofDirectors on3March <strong>2009</strong>. The consolidated statements willbe authorised during the <strong>Annual</strong> General Meetingon 2April <strong>2009</strong>. Until this date the Board ofDirectors have the authority to amend thefinancial statements.Statement of complianceThe consolidated financial statements have beenprepared in accordance with International Financial<strong>Report</strong>ing Standards (IFRS) approved by theEuropean Union and its interpretations adoptedby the International Accounting Standards Board(IASB).New standards and interpretations not yet adoptedThe following IFRS/IAS standards have beenapproved but mandatory from <strong>2009</strong>, with earlierapplication permitted. The group has not implementedthese standards with effect for the financialstatements for <strong>2008</strong>: IFRS 8–Operating Segments (mandatoryfrom <strong>2009</strong>) Revised IAS 1–Presentation of FinancialStatements (mandatory from <strong>2009</strong>) Revised IAS 23 –Borrowing Costs(mandatory from <strong>2009</strong>) IAS 32 –Financial Instruments –Presentation(mandatory from <strong>2009</strong>) Revised IFRS 3–Business Combinations(mandatory from <strong>2010</strong>) IFRIC 14 –The Limit on aDefined BenefitAsset Minimum Funding Requirements andtheir Interaction (mandatory from <strong>2009</strong>) Amended IAS 27 Consolidated and SeparateFinancial Statements (mandatory from <strong>2010</strong>)Except for IAS 23 Borrowing Costs and RevisedIFRS 3Business Combinations, it is assumed thatthe new standards will have only insignificant effectson reported results or balance sheet items. Themain effects will relate to presentation formats forfinancial statements and for the note disclosures.IAS 23 Borrowing Costs requires that borrowingcosts be included as part of costs on fixedassets and on construction contracts. Today, thisis the case only when the effects are verysignificant and there are separate financingarrangements in place. It is assumed that theeffect on the consolidated statements will besmall, but there may be an impact on individualprojects and business areas.Revised IFRS 3–Business Combinationsincorporates the following changes that are likelyto be relevant to the group’s operations: The definition of abusiness has beenbroadened, which is likely to result in moreacquisitions being treated as businesscombinations. Contingent consideration will be measuredat fair value, with subsequent changestherein recognised in profit or loss. Transaction costs, other than share and debtissue costs, will be expensed as incurred. Any pre-existing interest in the acquiree willbe measured at fair value with the gain orloss recognised in profit or loss. Any non-controlling (minority) interest willbe measured at either fair value, or at itsproportionate interest in the identifiableassets and liabilities of the acquiree, ontransaction-by-transaction basis.Revised IFRS 3will be applied prospectively andthereforetherewill be no impact on prior periods inthe group’sconsolidated financial statements. Thestandardisnot yet endorsed by EU.Basis of preparationThe consolidated financial statements have beenprepared under the historical cost convention, asmodified by the revaluation of available-for-salefinancial assets and financial assets and financialliabilities (including derivative instruments) at fairvalue through profit and loss.Non-current assets and disposal groups heldfor sale are stated at the lower of carryingamount or fair value less costs to sell.The preparation of financial statements inconformity with IFRS requires management tomake judgements, estimates and assumptionsthat affect the application of policies and reportedamounts of assets and liabilities, incomeand expenses. The estimates and associatedassumptions are based on historical experienceand various other factors that are believed to bereasonable under the circumstances, the resultsof which form the basis of making the judgementsabout carrying values of assets andliabilities that are not readily apparent from othersources. The areas involving ahigher degreeof judgement or complexity, orareas whereassumptions and estimates are significant to theconsolidated financial statements are disclosedin note 1. Actual results may differ from theseestimates.The estimates and underlying assumptionsare reviewed on an ongoing basis. Revisionsto accounting estimates are recognised in theperiod in which the estimate is revised if therevision affects only that period or in the periodof the revision and future periods if the revisionaffects both current and future periods.ConsolidationSubsidiariesSubsidiaries are entities controlled by the company.Control exists when the company has thepower, directly or indirectly, togovern the financialand operating policies of an entity so as toobtain benefits from its activities. In assessingcontrol, potential voting rights that presently areexercisable or convertible are taken into account.The financial statements of subsidiaries areincluded in the consolidated financial statementsfrom the date that control commences until thedate that control ceases.Intragroup balances and any unrealised gainsand losses or income and expenses arising fromintragroup transactions, are eliminated in preparingthe consolidated financial statements.Unrealised gains arising from transactions withassociates and jointly controlled entities are76Aker Solutions annual report <strong>2008</strong>
Our performanceNotes to the accountseliminated to the extent of the group’s interest inthe entity. Unrealised losses are eliminated in thesame way as unrealised gains, but only to theextent that there isnoevidence of impairment.In preparing their individual financial statements,the accounting policies of some subsidiaries,associates and joint ventures do notconform to the accounting policies of the group.Where appropriate, adjustments are made inorder to present the consolidated financial statementson aconsistent basis.AssociatesAssociates are those entities in which the grouphas significant influence, but not control, overthe financial and operating policies. Generallythis is applicable to ashareholding of between20 percent and 50 percent of the voting rights.The consolidated financial statements includethe group’s share ofthe total recognised gainsand losses of associates on an equity accountedbasis, from the date that significant influencecommences until the date that significant influenceceases. When the group’s share oflossesexceeds its interest in an associate, the group’scarrying amount is reduced to nil and recognitionof further losses is discontinued except to theextent that the group has incurred legal orconstructive obligations or made paymentson behalf of an associate.Joint venturesJoint ventures are those entities over whose activitiesthe group has joint control, established bycontractual agreement. The consolidated financialstatements include the group’s proportionateshare ofthe entities’ assets, liabilities, revenuesand expenses with items of asimilar nature onaline by line basis, from the date that joint controlcommences until the date that joint control ceases.Non-current assets held for sale anddiscontinued operationsAdiscontinued operation is acomponent ofthe group’s business that represents aseparatemajor line of business or geographical area ofoperations that has been disposed of or is heldfor sale or is asubsidiary acquired exclusivelywith aview to resale.Classification as adiscontinued operationoccurs upon disposal or when the operationmeets the criteria to be classified as held forsale, if earlier. Adisposal group that is to beabandoned may also qualify.Upon classification of abusiness as adiscontinuedoperation, the historical income statementsare restated and the applicable individualincome statement balances are reclassified intoone separate line under Net profit/loss in theincome statement for all reporting periods. In thebalance sheet no reclassifications are made foryears prior to the year abusiness is first classifiedas adiscontinued operation.Segment reportingAsegment is adistinguishable component of thegroup that is engaged either in providing productsor services (business segment), or in providingproducts or services within aparticulareconomic environment (geographical segment),which is subject to risks and rewards that aredifferent from those of other segments.The operating segments are also consistentwith the group’s organisation into business segments.Revenue recognitionConstruction contractsEngineering and construction contract revenuesarerecognised using the percentage of completionmethod, based primarily on contract costs incurredto date compared to estimated total contractcosts. When the final outcome of acontract cannotbe reliably estimated, contract revenue isrecognised only to the extent of costs incurredthat are expected to be recoverable. Losses oncontracts are fully recognised when identified.Contract revenues include variation ordersand incentive bonuses when it is probable thatthey will result in revenue and the amount can bemeasured reliably. Disputed amounts are recognisedwhen their realisation is reasonably certainand can be measured reliably. Contract costsinclude costs that relate directly to the specificcontract and costs that are attributable to contractactivity in general and can be allocated tothe contract. Costs that cannot be attributed tocontract activity are expensed. Bidding costs arecapitalised when it is probable that the companywill be the preferred bidder. All other biddingcosts are expensed as incurred.Goods sold and services renderedRevenue from the sale of goods is recognised inthe income statement when the significant risksand rewards of ownership have been transferredto the buyer. Revenue from services rendered isrecognised in the income statement in proportionto the stage of completion of the transaction atthe balance sheet date. The stage of completionis normally assessed as the proportion that costsincurred for work performed to date bear to theestimated contract costs. No revenue is recognisedif there are significant uncertainties regardingrecovery of the consideration due, the associatedcosts and the possible return ofgoods cannotbe measured reliably, orthere iscontinuingmanagement involvement with the goods.ExpensesOperating lease paymentsPayments made under operating leases arerecognised in the income statement on astraight-line basis over the term of the leasewhen there are variations in the contractual leasepayments due under the contract terms. Leaseincentives received are recognised in the incomestatement as an integral part of the total leaseexpense.Finance lease paymentsMinimum lease payments are apportionedbetween the finance charge and the reductionof the outstanding liability. The finance charge isallocated to each period during the lease term soas to produce aconstant periodic rate of intereston the remaining balance of the liability.Financial income and expenseFinancial income and expense comprise interestpayable on borrowings calculated using theeffective interest rate method, interest receivableon funds invested, dividend income, foreignexchange gains and losses, and gains andlosses on hedging instruments that are recognisedin the income statement (see Hedging activities).Interest income is recognised in the incomestatement as it accrues, using the effective interestmethod. The interest expense componentof finance lease payments is recognised in theincome statement using the effective interestrate method.Gains or losses arising from changes in thefair value of the financial assets at fair valuethrough profit or loss category are presented inthe income statement within net financial items,in the period in which they arise.Dividend income from financial assets at fairvalue through profit or loss is recognised in theincome statement as part of net financial itemswhen the group’s right to receive payments isestablished.Changes in the fair value of monetary securitiesdenominated in aforeign currency and classifiedas available for sale are analysed between translationdifferences resulting from changes inamortised cost of the security and other changesin the carrying amount of the security. The translationdifferences on monetary securities arerecognised in profit and loss; translation differencesin non-monetary securities are recognised inequity. Changes in the fair value of non-monetarysecurities classified as available for sale arerecognised in equity.When securities classified as available for saleare sold or impaired, the accumulated fair valueadjustments recognised in equity are included inthe income statement as gains and losses frominvestment securities.Interest on available-for-sale securitiescalculated using the effective interest methodis recognised in the income statement as partof net financial items when the group’s rightto receive payments is established.Trade and other receivablesTrade and other receivables are carried at theoriginal invoice amount, less an allowance madefor doubtful receivables. Provision is made whenthere isobjective evidence that the group will beunable to recover balances in full. Balances arewritten off when the probability of recovery isassessed as being remote.Construction work in progressConstruction work in progress represents the valueof construction work performed less payments bycustomers. The value of construction work performedis measured at revenue recognised to date.Payments by customers arededucted from thevalue of the same contract or,tothe extent theyexceed this value, disclosed as advances fromcustomers (see revenue recognition).InventoriesInventories are stated at the lower of cost andnet realisable value. Net realisable value is theestimated selling price in the ordinary course ofbusiness, less the estimated costs of completionand selling expenses.The cost of inventories is based on the first-infirst-out principle and includes expendituresincurred in acquiring the inventories and bringingthem to their existing location and condition. Inthe case of manufactured inventories and workin progress, cost includes an appropriate shareof overheads based on normal operating capacity.Property, plant and equipmentOwned assetsProperty, plant and equipment are stated at costless accumulated depreciation (see below) andimpairment losses (see Impairment). The costof self-constructed assets includes the cost ofmaterials, direct labour, and, where relevant, theestimated costs of dismantling and removing theitems and restoring the site on which they arelocated, and an appropriate proportion ofproduction overheads.Aker Solutions annual report <strong>2008</strong> 77
Our performanceNotes to the accountsWhere components of property, plant andequipment have different useful lives, they areaccounted for as separate components.Leased assetsLeases where the group assumes substantiallyall the risks and rewards of ownership areclassified as finance leases. Assets acquired byway of finance leases are stated at an amountequal to the lower of its fair value or the presentvalue of the minimum lease payments at inceptionof the lease, less accumulated depreciation (seebelow) and impairment losses (see Impairment).Subsequent costsThe group capitalises the cost of areplacementpart or acomponent of property, plant andequipment when that cost is incurred if it is probablethat the future economic benefits embodiedwith the item will flow to the group and thecost of the item can be measured reliably. Allother costs are expensed as incurred.DepreciationDepreciation is normally recognised on astraight-line basis over the estimated useful livesof property, plant and equipment. The productionunit method is used for depreciation in limitedcircumstances when appropriate.Intangible assetsGoodwillAll business combinations are accounted forusing the acquisition method. Goodwill representsthe excess of the cost of an acquisitionover the fair value of the group’s share ofthenet identifiable assets of acquired businessesor interest in associates or joint ventures that arebusinesses at the date of acquisition. Goodwillon acquisitions of subsidiaries is included inintangible assets. Goodwill on acquisitions ofassociates and joint ventures is included in theinvestment balance and is tested for impairmentas part of the overall balance. Goodwill is carriedat cost less accumulated impairment losses (seeImpairment). Gains and losses on the disposalof an entity or an interest in an entity include thecarrying amount of goodwill relating to theownership interest sold. Negative goodwillarising on an acquisition is recognised directlyin the income statement.Goodwill is assumed to have an indefiniteuseful life because there isnoforeseeable limitto the period over which the asset is expected togenerate net cash inflows for the entity. Theacquisition of acompany is based upon itsstrategic fit and anticipated profitability of thatcompany over along time period.Goodwill is allocated to cash-generating unitsfor the purpose of impairment testing. The allocationis made to those cash-generating units orgroups of cash-generating units that are expectedto benefit from the business combination inwhich goodwill arose.Research and developmentResearch and development work in Aker Solutionsrelated to customer contracts areincluded ascontract costs.Expenditures on research activities, undertakenwith the prospect of obtaining new scientific ortechnical knowledge and understanding, is recognisedin the income statement as an expense asincurred.Expenditures on development activities,whereby research findings areapplied to aplan ordesign for the production of new or substantiallyimproved products and processes, is capitalised ifthe product or process is technically and commerciallyfeasible as well as being aseparable asset.Capitalised costs include the cost of materials,external contractors and direct labour.Otherdevelopment expenditures arerecognised in theincome statement as an expense as incurred.Capitalised development expenditures arestatedat cost less accumulated amortisation (see below)and impairment losses (see Impairment).Other intangible assetsOther intangible assets that are acquired by thegroup are stated at cost less accumulated amortisation(see below) and impairment losses (seeImpairment).Subsequent expendituresSubsequent expenditures on capitalised intangibleassets are capitalised only when they increasethe future economic benefits embodied inthe specific asset to which they relate. All otherexpenditures are expensed as incurred.AmortisationAmortisation is charged to the income statementon astraight-line basis over the estimated usefullives of intangible assets unless such lives areindefinite. Intangible assets are amortised fromthe date they are available for use.ImpairmentThe carrying amounts of the group’s assets,other than inventories (see Inventories) anddeferred tax assets (see Income tax), are annuallyreviewed to determine whether there isanyindication of impairment. If any such indicationexists, the asset’s recoverable amount is estimated(see Calculation of recoverable amount).For goodwill, assets that have an indefiniteuseful life and intangible assets that are not yetavailable for use, the recoverable amount is estimatedannually.An impairment loss is recognised wheneverthe carrying amount of an asset or its cashgeneratingunit exceeds its recoverable amount.Impairment losses are recognised in the incomestatement.Impairment losses recognised in respectof cash-generating units are allocated first toreduce the carrying amount of any goodwillallocated to cash-generating units (group ofunits) and then, to reduce the carrying amountof the other assets in the unit (group of units) onapro rata basis.When adecline in the fair value of an available-for-salefinancial asset has been recogniseddirectly in equity and there isobjective evidencethat the asset is impaired, the cumulative lossthat had been recognised directly in equityis recognised in profit or loss even though thefinancial asset has not been derecognised. Theamount of the cumulative loss that is recognisedin profit or loss is the difference between theacquisition cost and current fair value, less anyimpairment loss on that financial asset previouslyrecognised in profit or loss.Calculation of recoverable amountThe recoverable amount of the group’s investmentsin held-to-maturity securities and receivablescarried at amortised cost is calculated asthe present value of estimated future cash flows,discounted at the original effective interest rate(i.e., the effective interest rate computed at initialrecognition of these financial assets). Receivableswith ashort duration are not discounted.The recoverable amount of other assets is thegreater of their net selling price and value in use.In assessing value in use, the estimated futurecash flows are discounted to their present valueusing apre-tax discount rate that reflects currentmarket assessments of the time value of moneyand the risks specific to the asset. For an assetthat does not generate largely independent cashinflows, the recoverable amount is determinedfor the cash-generating unit to which the assetbelongs.Reversals of impairmentAn impairment loss in respect of aheld-to-maturitysecurity or receivable carried at amortisedcost is reversed if the subsequent increase inrecoverable amount can be related objectively toan event occurring after the impairment loss wasrecognised.An impairment loss in respect of goodwill isnot reversed.In respect of other assets, an impairment lossis reversed if there has been achange in theestimates used to determine the recoverableamount.An impairment loss is reversed only to theextent that the asset’s carrying amount does notexceed the carrying amount that would have beendetermined, net of depreciation or amortisation,if no impairment loss had been recognised.ProvisionsAprovision is recognised in the balance sheetwhen the group has apresent obligation as aresult of apast event that is probable that thegroup will be required to settle. If the effect ismaterial, provisions aredetermined by discountingthe expected futurecash flows at amarket basedpre-tax rate that reflects current market assessmentsof the time value of money and, whereappropriate, the risks specific to the liability.WarrantiesAprovision for warranties is recognised whenthe underlying products or services are sold.The provision is based on historical warrantydata and aweighting of all possible outcomesagainst their associated probabilities.RestructuringAprovision for restructuring is recognised whenthe group has approved adetailed and formalrestructuring plan, and the restructuring eitherhas commenced or has been announced publicly.Future operating costs are not provided for.Site restorationIn accordance with the group’s applicable legalrequirements, aprovision for site restoration inrespect of contaminated land is recognisedwhen the land is contaminated.Onerous contractsAprovision for onerous contracts is recognisedwhen the expected benefits to be derived by thegroup from acontract are lower than the unavoidablecost of meeting the obligations under thecontract.Employee benefitsDefined contribution plansObligations for contributions to defined contributionpension plans are recognised as an expensein the income statement as incurred.Defined benefit plansThe group’s net obligation in respect of defined78Aker Solutions annual report <strong>2008</strong>
Our performanceNotes to the accountsbenefit pension plans is calculated separatelyfor each plan by estimating the amount of futurebenefit that employees have earned in return fortheir service in the current and prior periods; thatbenefit is discounted to determine its presentvalue, and the fair value of any plan assets isdeducted. The discount rate is the yield at thebalance sheet date on government bonds/highquality corporate bonds with maturities consistentwith the terms of the obligations. The calculationis performed by aqualified actuary usingthe projected unit credit method.When the benefits of aplan to employees areincreased, the portion of the increased benefitrelating to past service by employees is recognisedas an expense in the income statement onastraight-line basis over the average period untilthe benefits become vested. To the extent thatthe benefits vest immediately, onexpense isrecognised immediately in the income statement.To the extent that any subsequent cumulativeunrecognised actuarial gain or loss exceeds 10percent of the greater of the present value of thedefined benefit obligation and the fair value ofplan assets, that portion is recognised in theincome statement over the expected averageremaining working lives of the employees participatingin the plan. Otherwise, the actuarial gainor loss is not recognised.When the actual calculation results in abenefitto the group, the recognised asset is limited tothe net total of any unrecognised actuarial lossesand past service costs and the present value ofany future refunds from the plan or reductions infuture contributions to the plan.Long-term service benefitsThe group’s net obligation in respect of longtermservice benefits, other than pension plans,is the amount of future benefit that employeeshave earned in return for their service in the currentand prior periods. The obligation is calculatedusing the projected unit credit method and isdiscounted to its present value and the fair valueof any related assets is deducted. The discountrate is the yield at the balance sheet date ongovernment bonds/high quality corporate bondswith maturities consistent with the terms of theobligations.Share-based payment transactionsFor cash-settled share-based payments, aliabilityequal to the portion of the goods or servicesreceived is recognised at the current fair valuedetermined at each balance sheet date.Cash and cash equivalentsCash and cash equivalents include cash onhand, demand deposits held at banks and othershort-term highly liquid investments with originalmaturity of three months or less. Restricted cashis mainly cash tied up in projects through jointventures with external parties. The amountsfluctuate with the projects’ life cycle and areusually released when the project is delivered orclose to delivery.Derivative financial instrumentsThe group uses derivative financial instrumentsto hedge its exposure toforeign exchange andinterest rate risks arising from operational,financial and investment activities. Derivativesthat do not qualify for hedge accounting areaccounted for as trading instruments.Derivatives are initially recognised at fair valueon the date aderivative contract is entered intoand are subsequently measured at their fairvalue. The gain or loss on measurement to fairvalue is recognised immediately in profit andloss. Where derivatives qualify for hedge accounting,recognition of any resultant gain or lossdepends on the nature ofthe item being hedged(see Hedging activities).The fair value of interest rate swaps is the estimatedamount that the group would receive orpay to terminate or eliminate the swap at thebalance sheet date, taking into account currentinterest rates and the current creditworthiness ofthe swap counterparties. The fair value of forwardexchange contracts is their quoted marketprice at the balance sheet date, being the presentvalue of the quoted forward price.The fair values of various derivative instrumentsused for hedging purposes are disclosedin note 25.3 Derivative financial instruments.Movements on the hedging reserve in shareholders’equity are shown in Statement of changesin equity (other reserves). The full fair value of ahedging derivative is classified as anon-currentasset or liability when the remaining hedged itemis classified as non-current asset or liability. Withthe exception of items related to trade receivablesand work in progress, this is when the remainingmaturity is more than 12 months; it isclassified as acurrent asset or liability when theremaining maturity of the hedged item is lessthan 12 months or when it is related to tradereceivables and work in progress. Tradingderivatives are classified as current asset orliability.Interest-bearing borrowingsInterest-bearing borrowings are recognised initiallyat fair value less attributable transactioncosts. Subsequent to initial recognition, interestbearingborrowings are stated at amortised costwith any difference between cost and redemptionvalue being recognised in the income statementover the period of the borrowings on an effectiveinterest basis.Income taxIncome tax on the profit or loss for the yearcomprises current and deferred tax. Income taxis recognised in the income statement except tothe extent that it relates to items recognised directlyin equity, inwhich case it is recognised inequity.Deferred tax is provided using the balancesheet liability method, providing for temporarydifferences between the carrying amounts ofassets and liabilities for financial reporting purposesand the amounts used for taxation purposes.The following temporary differences arenot provided for: goodwill not deductible for taxpurposes, the initial recognition of assets or liabilitiesthat affect neither accounting nor taxableprofit, nor differences relating to investments insubsidiaries to the extent that they will not reversein the foreseeable future. The amount of deferredtax provided is based on the expected mannerof realisation or settlement of the carrying amountof assets and liabilities, using tax rates enacted orsubstantively enacted at the balance sheet date.Adeferred tax asset is recognised only to theextent that it is probable that future taxable profitswill be available against which the asset can beutilised. Deferred tax assets are reduced to theextent that it is no longer probable that the relatedtax benefit will be realised.Additional income taxes that arise from thedistribution of dividends are recognised at thesame time as the liability to pay the relateddividend.Share capitalOrdinary sharesOrdinary shares are classified as equity. Incrementalcosts directly attributable to the issueof new share oroptions are shown in equity asadeduction, net of tax, from the proceeds.Repurchase of share capitalWhen share capital recognised as equity isrepurchased, the amount of the considerationpaid, including directly attributable costs, isrecognised as achange in equity. Repurchaseof share capital is recognised as areduction inequity and is classified as treasury shares.Financial instrumentsFinancial instruments in the Aker Solutions groupconsists of cash and cash equivalents, investmentsin other companies, derivative financialinstruments, non-current interest-bearingreceivables, Trade and other receivables andnon-current borrowings.The group classifies its financial assets in thefollowing categories: at fair value through profitor loss, loans and receivables, and available forsale. The classification depends on the purposefor which the financial assets were acquired.Management determines the classification of itsfinancial assets at initial recognition.Financial assets at fair value through profit orlossFinancial assets at fair value through profit andloss are financial assets held for trading. Afinancialasset is classified in this category if acquiredprincipally for the purpose of selling in the shortterm. Derivatives are classified as held fortrading unless they are designated as hedges.Assets in this category are classified asderivative financial instruments.Loans and receivablesLoans and receivables are non-derivative financialassets with fixed or determinable paymentsthat are not quoted in an active market. Theyare included in current assets as trade and otherreceivables and interest-bearing receivables,except for maturities greater than 12 monthsafter the balance sheet date. These are includedin non-current assets as loans and receivablesand interest-bearing receivables in the balancesheet.Available-for-sale financial assetsAvailable-for-sale financial assets are non-derivativesthat are either designated in this categoryor not classified in any other categories. Theyare included in non-current assets as investmentsin other companies, unless managementintends to dispose of the investment within 12months of the balance sheet date. They will thenbe included in current assets as other investments.Regular purchases and sales of financialassets are recognised on the trade-date –thedate on which the group commits to purchaseor sell the asset. Investments are initially recognisedat fair value plus transaction costs for allfinancial assets not carried at fair value throughprofit and loss. Financial assets carried at fairvalue through profit and loss are initially recognisedat fair value, and transaction costs areexpensed in the income statement. Available-forsalefinancial assets and financial assets at fairvalue through profit and loss are subsequentlycarried at fair value. Loans and receivables arecarried at amortised cost using the effectiveinterest method.Aker Solutions annual report <strong>2008</strong> 79
Our performanceNotes to the accountsFinancial assets are derecognised when therights to receive cash flows from the investmentshave expired or have been transferred and thegroup has transferred substantially all risks andrewards of ownership. The fair values of quotedinvestments are based on current bid prices. Ifthe market for afinancial asset is not active (andfor unlisted securities), the group establishes fairvalue by using valuation techniques. Theseinclude the use of recent arm’s length transactions,reference to other instruments that aresubstantially the same, discounted cash flowanalysis and option pricing models, makingmaximum use of market inputs and relying aslittle as possible on entity-specific inputs. Impairmentof financial instruments is described underthe impairment section above.Foreign currencyFunctional and presentation currencyThe consolidated financial statements arepresented in Norwegian kroner (NOK), which isAker Solutions ASA’s functional currency and thepresentation currency for the group.Foreign currency transactions and balancesTransactions in foreign currencies are translatedat the foreign exchange rate ruling at the dateof the transaction. Monetary assets and liabilitiesdenominated in foreign currencies at the balancesheet date are translated to the functional currencyat the foreign exchange rate at that date.Foreign exchange differences arising on translationare recognised in the income statement.Non-monetary assets and liabilities that aremeasured in terms of historical cost in aforeigncurrency are translated using the exchange rateat the date of the transaction. Non-monetaryassets and liabilities denominated in foreign currenciesthat are stated at fair value are translatedto the functional currency at foreign exchangerates at the dates the fair value was determined.Net investment in foreign operationsItems included in the financial statements ofeach of the group’s entities are measured usingthe currency of the primary economic environmentin which the entity operates. The resultsand financial position of all the group entities(none of which has the currency of ahyperinflationaryeconomy) that have afunctional currencydifferent from the group’s presentation currencyare translated into the presentation currency asfollows: assets and liabilities, including goodwill andfair value adjustments, for each balancesheet presented are translated at the closingrate at the date of that balance sheet; income and expenses for each incomestatement are translated at averageexchange rates for the year, calculated on thebasis of 12 monthly rates.Exchange differences arising from the translationof the net investment in foreign operations, andof related hedges, are included as acomponentof equity (Translation reserve). These translationdifferences are reclassified to the income statementupon disposal of the related operations.In respect of all foreign operations, any currencyrevaluation differences that have arisensince 1April 2004, the date of transition to IFRS,are presented as aseparate component of equity.Hedging activitiesThe group designates certain derivatives aseither:a. hedges of the fair value of assets or liabilities(fair value hedge);b. hedges of aparticular risk associated witharecognised liability or ahighly probableforecasted transaction (cash flow hedge); orc. hedges of anet investment in aforeignoperation (net investment hedge).Fair value hedgesThe change in fair value of the hedging instrumentis recognised in the consolidated incomestatement. The change in fair value of thehedged item attributable to the risk hedged isrecorded as part of the carrying value of the hedgeditem. When an unrecognised firm commitmentis designated as hedged item, the subsequentcumulative change in fair value of thefirm commitment attributable to the hedged riskis recognised as an asset or liability withcorresponding gain or loss recognised in theconsolidated income statement.Cash flow hedgesThe effective portion of changes in the fair valueof derivatives that are designated and qualify ascash flow hedges are recognised in equity. Thegain or loss relating to the ineffective portionof derivative hedging instruments is recognisedimmediately in the income statement within netfinancial items.Amounts accumulated in equity are reclassifiedto the income statement in the periods whenthe hedged item is recognised in profit or loss.However, when the forecast transaction that ishedged results in the recognition of anon-financialasset or anon-financial liability, the gainsand losses previously deferred in equity aretransferred from equity and included in the initialmeasurement of the cost of the asset or liability.Hedge accounting is discontinued when thegroup revokes the hedging relationship, the hedginginstrument expires or is sold, terminated, orexercised, or no longer qualifies for hedge accounting.Any cumulative gain or loss deferredin equity at that time remains in equity and isrecognised when the forecast transaction isultimately recognised in the income statement.When aforecast transaction is no longer expectedto occur, the cumulative gain or loss that wasdeferred in equity is recognised immediately inthe income statement.Net investment hedgeHedges of net investments in foreign operationsare accounted for similarly to cash flow hedges.Any gain or loss on the hedging instrumentrelating to the effective portion of the hedge isrecognised in equity. The ineffective portion isrecognised immediately in the income statementwithin net financial items.Gains and losses accumulated in equity areincluded in the income statement when theforeign operation is partially disposed of or sold.80Aker Solutions annual report <strong>2008</strong>
Our performanceNotes to the accounts■ Note 3: Accounting estimates and judgementsEstimates and judgements are continually reviewed and are based on historical experiences and other expectations of future events.The group makes estimates and assumptions concerning future events. The resulting accounting estimates will, by definition, seldom accurately equalthe related actual results, but are based on the best estimate at the time. The estimates and assumptions that have asignificant risk of causing materialadjustments to the carrying amounts of assets and liabilities within the next financial year are discussed below.Revenue recognitionAs described in the accounting principles the percentage-of-completion method is used to account for construction contracts. Use of this method requiresestimates of the final outcome (revenue and costs) of the contract as well as measurement of progress achieved to date as aproportion of the total workto be performed.The main uncertainty of contract revenue is related to recoverable amounts from variation orders, claims and incentive payments which are recognisedto the extent that it is in the group’s judgement that it is probable that they will result in revenue, and they are capable of being reliably measured. In manyprojects there are frequent changes in scope of work resulting in anumber of variation orders. Normally the contracts with customers include proceduresfor presentation of and agreement of variation orders. At any point in time, there will be unapproved variation orders and claims included in the projectrevenue. Even though management has extensive experience in assessing the outcome of such negotiations there will always be uncertainties.Cost to complete depends on productivity factors as well as the cost level for the input factors. Factors that could significantly impact cost estimates,claims and variation orders include weather conditions, the subcontractors and others with an impact on schedules, commodity prices and currency rates.Experience, systematic use of the project execution model and focus on core competencies reduces but does not eliminate this risk.Progress measurement based on costs has an inherent risk related to the cost estimate as described above. In situations where cost is not seen toproperly reflect actual progress, alternative measures such as hours or plan progress are used to achieve more precise revenue recognition. The estimationuncertainty during the early stages of acontract is mitigated by apolicy of normally not recognising revenue in excess of costs on large projects before thecontract reaches 20 percent completion.WarrantiesAt the end of each contract, aprovision is set up to cover any warranty expenditures. The warranty period is normally two years. The provision is oftenset at one percent of the contract value, but can also be ahigher or lower amount following aspecific evaluation of the actual circumstances for eachcontract. Both the general on percent provision and the evaluation of project specific circumstances are based on experience from earlier projects. Factorsthat could impact the estimated claim information include the group’s quality initiatives and project execution model. Reference is made to note 12 Provisions,for further information about provisions.Property, plant and equipment and intangible assetsAt every balance sheet date, the group considers whether there are indications of impairment on the book values of long term assets. If such indicationsexist, avaluation is performed to assess whether or not and if applicable by which amount the asset should be written down for impairment.Such valuations will often have to be based on estimates of future results for anumber of cash flow generating units.References are made to note 14 Property, plant and equipment and note 16 Intangible assets.GoodwillIn accordance with the accounting policy stated, the group tests annually whether goodwill has suffered any impairment. The recoverable amounts ofcash-generating units have been determined based on value-in-use calculations. These calculations require the use of estimates and are consistent withthe market valuation of the group. Further details about goodwill and impairment reviews are included in note 16 Intangible assets.Income taxesThe group is subject to income taxes in numerous jurisdictions. Significant judgement is required to determine the worldwide provision for income taxes.There are many transactions and calculations for which the ultimate tax determination is uncertain during the ordinary course of business. Provisionsfor anticipated tax audit issues are based on estimates of eventual additional taxes. Taxassets arise following tax losses that can be brought forward toreduce the income tax on future year’s taxable profits. The recognition of such atax asset, consequently, depends on there being sufficient evidence of thefuture taxable profit which is necessary to use the brought forward loss. Such judgements are reasonably easy in countries with significant group activities,but may be more difficult in other tax jurisdictions. Where the final tax outcome of these matters is different from the amounts that were initially recorded,such differences will impact the income tax and deferred tax provisions in the period in which such determination is made. Reference is made to note 17Taxfor further information about income taxes.Pension benefitsThe present value of the pension obligations depends on anumber of factors that are determined on an actuarial basis using anumber of assumptions.The assumptions used in determining the net cost (income) for pensions include financial factors such as the discount rate, expected salary growth, inflationand return onassets as well as demographical factors about mortality, employee turnover, disability and early retirement. Assumptions about all thesefactors are set based on the situation at the time when the assessment is made. However, itisreasonably certain that such factors will change over thevery long time periods for which pension calculations are made. Any changes in these assumptions will impact the calculated pension obligations. The effecton the accounts of such changes are, however, spread over relatively long time periods by the use of the corridor approach, where changes are amortisedover many years. Further information about the pension obligations and the assumptions used are included in note 20 Employee benefits –pension.Aker Solutions annual report <strong>2008</strong> 81
Our performanceNotes to the accounts■ Note 4: Acquisition of subsidiaries and minority interestsAcquisition of minority interests in <strong>2008</strong>Aker Marine Contractors ASAker Solutions acquired in July <strong>2008</strong> an additional 30 percent of the shares in Aker Marine Contractors AS from Taubåtkompaniet AS, and in October 10percent of the shares, and holds after the transaction 100 percent of the shares in the company. The total price for the 40 percent acquired in <strong>2008</strong> wasNOK 744 million (NOK 559 million and 185 million respectively) including NOK 2million in transaction costs. The transaction resulted in areduction ofminority interests of NOK 75 million, and an increase in goodwill of NOK 595 million.Acquisition of subsidiaries in <strong>2008</strong>Qserv LtdAker Solutions acquired 100 percent of the shares in the company in July <strong>2008</strong>. Qserv Ltd is awell service provider in Aberdeen, UK. Aker Solutions haspaid compensation for the shares totalling GBP 99 million. In addition, there will be performance-based payments, payable in 2011, which depend onprofit in <strong>2008</strong>, <strong>2009</strong> and <strong>2010</strong>. Transaction costs amount to NOK 8million. The estimated value of the remaining compensation payable to the sellers hasbeen discounted and recognised as aliability in the balance sheet. The current analysis and allocation of fair value is provisional.Acquisitions that are not material for the group:First Interactive ASIn February <strong>2008</strong>, Aker Solutions acquired 60.2 percent of the shares in the Norwegian company First Interactive AS. The agreement includes an optionto buy the remaining shares. First Interactive AS is asoftware company specialising in 3D visualisation and simulation for the oil &gas sector.Aker Offshore OyIn January <strong>2008</strong>, Aker Solutions acquired 74 percent of the shares in Aker Offshore Oy, formerly RR Offshore Oy, and holds after the transaction 100 percentof the shares in the company. Aker Offshore Oyislocated in Finland and is an engineering and project management company. Aker Solutions has hadbusiness relations with the company several years prior to the acquisition.Aker Solutions has also acquired 100 percent of the shares in Aker Installation Floating Production AS in <strong>2008</strong> (see note 5Related parties). In addition thegroup acquired 100 percent of the shares in Aker Well Services Partners LLC.Total acquisition costs amount to NOK 1629 million including acquisition of minority interests and transaction costs of NOK 10 million. Consolidated netprofit from acquired business in the period from acquisition to year end is NOK 53 million in <strong>2008</strong>.Values at time of acquisition 1Amounts in NOK millionPre-acquisitioncarryingamountsFair valueadjustmentsRecognisedvalues onacquisitionOf whichjoint venturePlant and equipment 426 222 648 -Intangible assets 3 92 95 -Non-current investments 7 - 7 -Current operating assets 305 - 305 -Cash and cash equivalents 46 - 46 -Minority interests -5 - - 5 -Deferred tax liabilities -35 - 81 - 116 10Other non-current liabilities -84 - - 84 -Borrowings -150 -3 - 153 -Current operating liabilities -402 - - 402 -34Net assets and liabilities 111 230 341 -24Goodwill on acquisition 2 1288 34Deferred payment - 510 -Cash 1119 10Cash paid -1119 -10Cash and overdraft facilities 46 -Net cash outflow -1073 -101) Values at time of acquisition relate mainly to the acquisition of Qserv Ltd.2) The goodwill arising from the acquisitions is mainly attributable to the anticipated profitability of the operations and to the anticipated synergies.82Aker Solutions annual report <strong>2008</strong>
Our performanceNotes to the accountsAcquisition of subsidiaries and jointly controlled companies in <strong>2007</strong>Wirth Maschinen- und Bohrgeräte-Fabrik GmbHAker Solutions acquired 50 percent of the shares in the company Wirth Maschinen- und Bohrgeräte-Fabrik GmbH in September <strong>2007</strong> (Wirth). Wirth is aGerman provider of drilling machines and pumps. Aker Solutions MH AS has cooperated with Wirth for more than 20 years. There isashareholders’agreement with the other shareholders of Wirth with put /call option arrangements for the remaining 50 percent ownership to be transferred to AkerSolutions at aprice based on future earnings. The agreement also results in the owners exercising joint control of Wirth in the period until the options becomeexercisable. The option was executed in January <strong>2009</strong> (see note 26 Subsequent events for further description of the transaction). The current analysis andallocation of fair value is provisional.Acquisitions that are not material for the group:Phoenix Polymers International LtdIn June <strong>2007</strong>, Aker Solutions Subsea Ltd acquired 50 percent and obtained control over Phoenix International Ltd in Aberdeen. The company is animportant sub-supplier of buoyancy elements to Aker Solutions Subseas’ drilling and riser projects.Aker Insurance ASIn August <strong>2007</strong>, Aker Solutions acquired 9.9 percent of the shares and now owns 100 percent of the company.Total acquisition costs amounted to NOK 217 million. Consolidated net profit from acquired business in the period from acquisition to year endis NOK 31 million in <strong>2007</strong>.Values at time of acquisitionsAmounts in NOK millionPre-acquisitioncarrying amountsFair valueadjustmentsRecognisedvalues onacquisitionOf whichjoint venturePlant and equipment 26 - 26 26Intangible assets 1 54 55 54Non-current investments 2 - 2 2Current operating assets 387 31 418 405Cash and cash equivalents 84 - 84 70Minority interests 7 - 1 6 -Deferred tax liabilities 3 - 32 -29 - 28Other non-current liabilities -288 - - 288 -288Current operating liabilities -186 - - 186 -164Net assets and liabilities 36 52 88 77Goodwill on acquisition 1 129 78Deferred payment -46 - 46Cash 171 109Cash paid -171 -109Cash and overdraft facilities 84 70Net cash outflow -87 - 391) The goodwill arising from the acquisitions is attributable to the anticipated profitability of the operations and to the anticipated synergies.Aker Solutions annual report <strong>2008</strong> 83
Our performanceNotes to the accounts■ Note 5: Related partiesThe group has several related party relationships between parents and subsidiaries (see note 28 Group companies as at 31 December <strong>2008</strong>), associates(see note 21 Equity accounted investees), joint ventures (see note 22 Investments in joint ventures) and with its directors and executive officers (see note18 Salaries, wages and social security costs).The largest shareholder Aker Holding AS is controlled by Aker ASA which is controlled by Kjell Inge Røkke through TRG Holding AS. All entities which KjellInge Røkke controls or has significant influence in are considered related parties to Aker Solutions.In accordance with recommended accounting practice, information regarding significant related party transactions, benefits and agreements should be disclosedwhere such information may assist users of the financial statements in their understanding of the activities of the group. All transactions have been based onarm’s length terms. The transactions below are considered to be significant related party transactions which are not disclosed in the notes listed above.Aker Drilling ASAIn 2005, Aker Drilling and Aker Solutions entered into acontract for the turn-key delivery of two sixth-generation deepwater drilling semi-submersibles. Therigs are equipped with Aker Solutions Dual RamRig drilling equipment. The contract value was approximately NOK 7.8 billion. The construction of the twoH-6e drilling rigs, Aker Spitsbergen and Aker Barents, is now in the completion phase. By the current schedule, Aker Drilling will take delivery in February andsecond quarter <strong>2009</strong> respectively. The sea trials for Aker Spitsbergen were completed in January <strong>2009</strong> with good results; however some damage to the drillingequipment will lead to some additional costs for Aker Solutions. The project has experienced cost overruns due to delays and technical challenges. In <strong>2008</strong>Aker Solutions has recognised NOK 2.1 billion in revenue on the contracts to Aker Drilling (NOK 4.2 billion in <strong>2007</strong> and NOK 2.4 billion in 2006).Aker Floating Production ASAAker Floating Production signed acontract for delivery and installation of an FPSO with Reliance Industries Ltd, India in <strong>2007</strong>. The installation contract wasexecuted through Aker Installation Floating Production, at that time asubsidiary of Aker Floating Production. Aker Solutions managed the marine installationof the floating production storage and offloading (FPSO) vessel to be leased out by Aker Floating Production. There was aseparate contract to deliver processtechnology to the FPSO. The total values of Aker Solutions’ contracts wereapproximately USD 250 million and NOK 671 million. The process systems contractwas completed by year end <strong>2008</strong> and the installation contract is between Aker Solutions and Reliance Industries Ltd following the acquisition of Aker InstallationFloating Production AS. In <strong>2008</strong>, Aker Solutions has recognised NOK 32 million in revenue on the contracts to Aker Floating Production ASA.Aker Installation Floating Production ASAker Installation Floating Production was acquired from Aker Floating Production in fourth quarter <strong>2008</strong> for NOK 2million. Before the acquisition NOK 167million was recognised in <strong>2008</strong> as revenue on contracts to Aker Installation Floating Production.Aker Oilfield Services ASAker Solutions has increased its shareholding in Aker Oilfield Services from 19 percent to 32.3 percent through arights issue of NOK 166 million in firstquarter <strong>2008</strong>. Aker Oilfield Services is aspecialised subsea light well intervention contractor with afleet of subsea and well intervention vessels confirmedfor delivery in <strong>2009</strong> and <strong>2010</strong>. Aker Oilfield Services and Aker Solutions will use complementary strengths to offer light well intervention service packages.In addition, Aker Solutions has acontract with Aker Oilfield Services to deliver subsea equipment with avalue of NOK 242 million. Aker Solutions also hasareimbursable contract based on service provided to Aker Oilfield Services. Step Offshore (owned 51 percent by Aker Solutions) has an agreement forfluid and pumping systems with Aker Oilfield Services of NOK 51 million.In <strong>2008</strong>, Aker Solutions has recognised NOK 61 million in revenue on the contracts to Aker Oilfield Services. Aker Solutions has accounted for theinvestment in the company according to the equity method (see note 21 Equity accounted investees). Aloan has been provided to Aker Oilfield Servicesamounting to NOK 65 million at the end of December <strong>2008</strong> (see note 25.4 Interest-bearing non-current receivables).Aker Clean Carbon ASAker Solutions transferred its Just Catch technology for CO 2 capture, valued at NOK 32 million, to the company Aker Clean Carbon, which will developCO 2 capture projects. The transaction took place in <strong>2008</strong> and gave Aker Solutions 30 percent of the shares in Aker Clean Carbon, while Aker ASA owns 70percent. The ownership ratio has been determined following valuations and negotiations that have also recognised the value of Aker Solutions’ exclusiverights to participate in building future carbon capture facilities in co-operation with Aker Clean Carbon. Aker Solutions has accounted for the investment inthe company according to the equity method (see note 21 Equity accounted investees). Aker Solutions has provided aloan to Aker Clean Carbon thatamounted to NOK 15 million at the end of December <strong>2008</strong> (see note 25.4 Interest bearing non-current receivables).Intellectual Property Holding ASAker Solutions has an agreement with Intellectual Property Holding that holds all rights, titles and interests in and to registered trademarks and domain namescontaining ”Aker”. Intellectual Property Holding will act as ajoint branding tool wherethe companies in the Aker group join forces in selected initiatives. Theannual royalty cost for Aker Solutions is approximately NOK 10 million.Aker Capital ASAker Solutions acquired in October <strong>2008</strong> shares in Aker Marine Contractors equivalent to 10 percent from Aker Capital. The purchase price was NOK 185million (see note 4Acquisitions of subsidiaries and minority interests for further information).Aker Asset Management ASAAker Insurance receives investment management services from Aker Asset Management. <strong>Annual</strong> fee is based on average total capital and amounted toapproximately NOK 1million.Aker PensjonskasseAker Pensjonskasse was established by Aker ASA to manage the Aker Solutions retirement plan for employees, retirees and related companies. The totalpaid-in equity was NOK 103 million at the end of <strong>2008</strong>. Aker Solutions holds 93.4 percent of the shares in the Aker Pensjonskasse.Aker ASAAker Subsea Inc and Aker <strong>Kvaerner</strong> Willfab Inc, which are subsidiaries of Aker Solutions, are sponsoring employers of the US pension plan <strong>Kvaerner</strong>Consolidated Retirement Plan. The principal sponsor for the plan is <strong>Kvaerner</strong> U.S. Inc, asubsidiary of TH Global Plc. Aker ASA has provided aguaranteeto the plan in the event that Aker Solutions becomes liable for more than one third ofthe underfunded element of the plan.84Aker Solutions annual report <strong>2008</strong>
Our performanceNotes to the accounts■ Note 6: Segment informationAsegment is adistinguishable component of the group that is engaged either in providing products or services (business segment), or in providingproducts or services within aparticular economic environment (geographical segment), which is subject to risks and rewards that are different from thoseof other segments. See page 18 –41ofthe annual report for adescription of the business segments. The transactions between the segments have beenbased on arm’s length terms.Operating revenue in geographical segments are based on the geographical location of customers whereas segment assets and capital expenditure arebased on geographical location of the companies.Due to the <strong>2008</strong> restructuring of Field Development (FD) and Maintenance, Modification and Operations (MMO) into the new business area named EnergyDevelopment and Services (ED&S), historical Aker Solutions numbers were restated according to the new structure. The recently announced restructuringof the Subsea business area and Products &Technologies business area will be effective as at 1January <strong>2009</strong>, hence figures have not been restated in theannual report.<strong>2008</strong> –Business segmentsAmounts in NOK millionNoteEnergyDevelopment&ServicesSubseaProducts &TechnologiesProcess &ConstructionUnallocatedTotalExternal revenueConstruction contracts 14 381 8039 9640 6569 295 38 924Services revenue 7866 2030 2684 3576 943 17 099Products - 1 110 714 144 - 1968Other - - 17 165 79 261Total revenue from external customers 22 247 11 179 13 055 10 454 1317 58 252Inter-segment revenue 437 27 1161 248 -1873 -Operating revenue 22 684 11 206 14 216 10 702 -556 58 252Operating profit /loss before depreciation, amortisationand impairment -475 1228 1448 904 277 3382Depreciation, amortisation and impairment -93 - 166 -185 -25 - 146 -615Operating profit (+) /loss (-) -568 1062 1263 879 131 2767Share ofprofit (+) /loss (-) of associates - - 7 - 3 - 25 -21Capital expenditures 165 546 388 337 136 1572Net current operating assets excl. tax 8 839 837 994 -1832 12 850Net non-current operating assets excl. tax 8 2882 2080 4068 1786 393 11 209Net operating assets excl. tax 8 3721 2917 5062 -46 405 12 059Tax-related items 8 -515Investment in associates 90 - 19 24 311 444Investments in other companies 123Other operating liabilities -1194Net interest-bearing items -2311Total equity incl. minority interests 8606Order intake (unaudited) 16 681 11 466 16 121 11 291 31 55 590Order backlog (unaudited) 18 315 11 876 14 705 13 300 -180 58 016Own employees (unaudited) 8542 4108 4003 5417 1290 23 360Intangible assets 2323 558 2791 1284 163 7119Total operating assets excl. tax 9661 8585 13 100 5641 197 37 184Total operating liabilities excl. tax -5940 -5668 -8038 -5687 208 -25125Total net operating assets excl. tax 3721 2917 5062 -46 405 12 059Aker Solutions annual report <strong>2008</strong> 85
Our performanceNotes to the accounts<strong>2007</strong> –Business segmentsAmounts in NOK millionNoteEnergyDevelopment&ServicesSubseaProducts &TechnologiesProcess &ConstructionUnallocatedTotalExternal revenueConstruction contracts 18 488 7239 9128 7885 -103 42 637Services revenue 6465 1437 1725 2948 1021 13 596Products - 993 494 87 - 1 574Other 2 - 32 104 12 150Total revenue from external customers 24 955 9669 11 379 11 024 930 57 957Inter-segment revenue -34 182 974 573 -1695 -Operating revenue 24 921 9851 12 353 11 597 -765 57 957Operating profit /loss before depreciation, amortisationand impairment 1391 960 959 776 -173 3913Depreciation, amortisation and impairment -127 -112 -72 - 24 -96 - 431Operating profit (+) /loss (-) 1264 848 887 752 -269 3482Share ofprofit (+) /loss (-) of associates - - 2 - -4 -2Capital expenditures 490 577 298 53 178 1596Net current operating assets excl. tax 8 -776 849 323 -1357 -100 -1061Net non-current operating assets excl. tax 8 2726 1624 1217 1035 295 6897Net operating assets excl. tax 8 1950 2473 1540 -322 195 5836Tax-related items 8 -372Investment in associates 53 - 18 21 29 121Investments in other companies 133Other operating liabilities -914Net interest-bearing items 2463Total equity incl. minority interests 7267Order intake (unaudited) 19 792 12 377 10 733 14 996 44 57 942Order backlog (unaudited) 24 317 10 951 11 520 12 519 -1046 58 261Own employees (unaudited) 8163 3673 2666 5516 1280 21 298Intangible assets 2540 646 824 900 85 4995Total operating assets excl. tax 7716 5027 6234 3812 758 23 547Total operating liabilities excl. tax -5766 -2554 -4694 -4134 -563 -17711Total net operating assets excl. tax 1950 2473 1540 -322 195 58362006 –Business segmentsAmounts in NOK millionEnergyDevelopment&ServicesSubseaProducts &TechnologiesProcess &constructionUnallocatedTotalExternal revenueConstruction contracts 17 644 2724 3908 9074 -46 33304Services revenue 6054 1274 1427 3403 706 12 864Products - 2 589 1355 - - 3944Other 331 5 7 135 2 480Total revenue from external customers 24 029 6592 6697 12 612 662 50 592Inter-segment revenue 565 349 875 603 -2392 -Operating revenue 24 594 6941 7572 13 215 -1730 50 592Operating profit/loss before depreciation, amortisation and impairment 1244 479 531 641 -23 2 872Depreciation, amortisation and impairment -60 - 100 -62 - 34 -83 - 339Operating profit (+) /loss (-) 1184 379 469 607 -106 2533Share ofprofit (+) /loss (-) of associates - 1 -1 3 - 21 -18Order intake (unaudited) 24 717 11 747 12 997 14 026 -1216 62 271Order backlog (unaudited) 29 764 8775 12 741 10 855 -2440 59 69586Aker Solutions annual report <strong>2008</strong>
Our performanceNotes to the accountsGeographical segmentsOperating revenues Total operating assets Capital expenditureby customer location by company location by company locationAmounts in NOK million <strong>2008</strong> <strong>2007</strong> 2006 <strong>2008</strong> <strong>2007</strong> <strong>2008</strong> <strong>2007</strong>Norway 21 180 23 396 20 567 19 046 11 029 584 963Europe 8704 8628 9619 7873 5713 470 219North America 8597 9243 9976 5453 3802 148 101Asia 13 939 11 336 5282 1894 1353 317 212Other 5832 5354 5148 2918 1650 53 101Total 58 252 57 957 50 592 37 184 23 547 1572 1596■Note 7: Other operating expensesOther operating expenses amount to NOK 6.9 billion in <strong>2008</strong> (NOK 5.4 billion in <strong>2007</strong> and NOK 6.0 billion in 2006). The expenses include agency costs,audit fees, operating lease costs, research and development costs and other expenses regarding premises, electricity,maintenance, travelling, IT-equipmentand insurance fees.Fees to auditorsOther assuranceOtherAudit services Taxservices servicesAmounts in NOK million <strong>2008</strong> <strong>2007</strong> <strong>2008</strong> <strong>2007</strong> <strong>2008</strong> <strong>2007</strong> <strong>2008</strong> <strong>2007</strong>Aker Solutions ASA 4 4 - - - - - -Subsidiaries 26 22 2 2 4 4 5 2Total 30 26 2 2 4 4 5 2■Note 8: Net operating assetsAmounts in NOK million Note <strong>2008</strong> <strong>2007</strong>Inventories 1321 884Trade and other receivables 9, 25.5 20 796 13 361Provisions 12 -912 -655Trade and other payables 10 -21052 -15165Derivative financial instruments (net assets and liabilities) 25.3 697 514Net current operating assets excl. tax 6 850 -1061Employee benefit assets 20 234 15Other non-current operating assets 4 9Intangible assets 6, 16 7119 4995Property, plant and equipment 14 4610 2815Employee benefits obligations 20 -758 -937Net non-current operating assets excl. tax 6 11 209 6897Net operating assets excl. tax 6 12 059 5836Income tax payable 17 -252 -329Prepaid income tax 17 49 89Deferred tax assets 17 519 548Deferred tax liabilities 17 -831 -680Total tax related items 6 -515 -372Net operating assets incl. tax 11 544 5464Aker Solutions annual report <strong>2008</strong> 87
Our performanceNotes to the accounts■ Note 9: Current operating assetsAmounts in NOK million Note <strong>2008</strong> <strong>2007</strong>Trade debtors 1, 2 25.5 8923 5815Other receivables 1 4288 2338Work in progress to be invoiced 11 6868 4774Advances to suppliers 717 434Trade and other receivables 25.5 20 796 13 361Derivative financial instruments 25.3 3100 1468Inventories 3 1321 884Current operating assets excl. tax 25 217 15 7131) Trade debtors include NOK 135 million falling due after one year (NOK 89 million in <strong>2007</strong>). Book value of trade and other receivables are approximately equal to fair value.2) Receivables from related parties at the end of <strong>2008</strong> amounts to NOK 35 million (NOK 425 million in <strong>2007</strong>).3) Write-downs of inventories are NOK 2million in <strong>2008</strong> (NOK 9million in <strong>2007</strong>).■Note 10: Current operating liabilitiesAmounts in NOK million Note <strong>2008</strong> <strong>2007</strong>Trade creditors 1, 2 4482 3217Advances from customers 6860 2852Accrued operating and financial costs 7972 8644Other current liabilities 2 1738 452Trade and other payables 21 052 15 165Provisions 12 912 655Derivative financial instruments 25.3 2403 954Current operating liabilities excl. tax 24 367 16 7741) Trade creditors include NOK 33 million falling due after one year (NOK 11 million in <strong>2007</strong>). Book value of trade creditors and other current liabilities are approximately equal to fair value.2) Trade creditors and other current liabilities include NOK 43 million to related parties at the end of <strong>2008</strong> (NOK 0million in <strong>2007</strong>).■Note 11: ContractsAmounts in NOK million Note <strong>2008</strong> <strong>2007</strong>Value all contracts 163 425 126 967Costs from ongoing contracts 93 623 62 013Results from ongoing contracts 11 786 6693Order backlog 6 58 016 58 261Value of work performed 105 409 68 706Invoiced 98 541 63 932Work in progress to be invoiced 9 6868 4774Trade debtors 9 8923 5815Recoverable on contracts 15 791 10 589Advances from customers 10 6860 285288Aker Solutions annual report <strong>2008</strong>
Our performanceNotes to the accountsOrder intake (unaudited)Amounts in NOK million <strong>2008</strong> <strong>2007</strong> 1Energy Development &Services 16 681 19 792Subsea 11 466 12 377Products &Technologies 16 121 10 733Process &Construction 11 291 14 996Unallocated 31 44Total 55 590 57 942Order backlog (unaudited)Amounts in NOK million <strong>2008</strong> <strong>2007</strong> 1Energy Development &Services 18 315 24 317Subsea 11 876 10 951Products &Technologies 14 705 11 520Process &Construction 13 300 12 519Unallocated -180 -1046Total 58 016 58 2611) Due to the <strong>2008</strong> restructuring of Field Development (FD) and Maintenance, Modification and Operations (MMO) into the new business area named Energy Development &Services (ED&S),historical Aker Solutions numbers were restated according to the new structure. The recently announced restructuring of the Subsea business area and Products &Technologies businessarea will be effective as at 1January <strong>2009</strong>, hence figures have not been restated in the annual report.The group enters into delivery commitments prior to commencement of production. Of the backlog as at 31 December <strong>2008</strong> of NOK 58 billion, NOK 2.3 billion(NOK 5.4 billion in <strong>2007</strong>) relate to certain major contracts which are not expected to yield any profit. Expected losses on such contracts have been charged toprofit and loss and based on best estimates. The overall quality of the order backlog has improved during <strong>2008</strong>, which is reflected in results from ongoingcontracts.Largest projects in progress at year end <strong>2008</strong> (unaudited)ProjectBusinesssegmentCustomerEstimateddeliveryAdriatic LNG Terminal ED&S Terminale GNL Adriatico s.r.l <strong>2009</strong>Kashagan ePF1 ED&S Agip <strong>2009</strong>Skarv ED&S BP 2011Gjøa ED&S StatoilHydro <strong>2010</strong>Aker Drilling ED&S Aker Drilling AS <strong>2009</strong>Statfjord Latelife ED&S StatoilHydro <strong>2009</strong>Frigg Cessation ED&S Total <strong>2010</strong>Tampen ED&S StatoilHydro 2011Frigstad P&T Frigstad Discoverer Invest <strong>2009</strong>CNOOC P&T CNOOC <strong>2010</strong>PetroRig P&T Jurong Shipyard <strong>2009</strong> /<strong>2010</strong>Seadrill P&T Jurong Shipyard <strong>2009</strong> /<strong>2010</strong>Sevan P&T Sevan Drilling 2012TMT P&T Daewoo Shipbuilding &Marine Engineering <strong>2009</strong> /2011Odebrecht P&T Daewoo Shipyard 2011Morvin Subsea StatoilHydro <strong>2009</strong>Reliance Subsea Reliance <strong>2009</strong>Dalia Subsea (Phase 2) Subsea Total E&P Angola <strong>2009</strong>Sempra P&C Cameron LNG <strong>2009</strong>Yansab P&C Yansab <strong>2009</strong>Longview Power Project P&C Longview Power 2011Boddington Gold Mine P&C BGM Management Company <strong>2009</strong>Gulf LNG P&C Gulf LNG Energy 2011GTA West P&C TransCanada Energy <strong>2010</strong>Aker Solutions annual report <strong>2008</strong> 89
Our performanceNotes to the accounts■ Note 12: ProvisionsAmounts in NOK million Warranties Other TotalBalance as at 1January <strong>2008</strong> 437 218 655Reclassified 19 -19 -Provisions made during the year 234 203 437Provisions used during the year -105 -51 - 156Provisions reversed during the year -62 - 26 -88Currency translation differences 34 30 64Balance as at 31 December <strong>2008</strong> 557 355 912Expected timing of paymentNon-current 143 165 308Current 414 190 604Balance as at 31 December <strong>2008</strong> 557 355 912See note 3Accounting estimates and judgements and note 13 Contingent events.WarrantiesThe provision for warranties relates mainly to the possibility that Aker Solutions, based on contractual agreements, needs to perform guarantee workrelated to products and services delivered to customers. The provision is based on estimates of liabilities arising from existing contracts and the costof the guarantee work. The warranty period is normally two years and any cash effects will arise in this period.OtherOther includes mainly restructuring provisions, provisions for onerous leases and provisions for loss contracts. Provisions for loss contracts are partlyrecorded as reduction of projects under construction in the balance sheet, and partly as short-term provisions in the balance sheet, depending on theamount recorded as project under construction for each project.■Note 13: Contingent eventsProject risks and uncertaintiesThe group’s projects are toalarge extent long-term contracts awarded on acompetitive bidding basis. Failure tomeet schedule or performance guaranteesor increases in contract costs may result in non-recoverable costs, which could exceed revenues realised from the applicable project. Where aprojectis identified as loss making, provisions for future losses are made (see note 12 Provisions). The accounting treatment is based on the best estimate at thetime. Inevitably, such circumstances and information may be subject to changes in subsequent periods and thus the eventual outcome may be better orworse than estimated.In the group’s view, the following project is subject to estimation uncertainty, the outcome of which could have amaterial impact on the consolidatedfinancial statements:Sempra –LNG regasification facilityCameron LNG LLC (ultimately Sempra LNG –“Sempra”) and Aker Solutions US Inc. /IHI Inc. have entered into an agreement for engineering, procurement,construction and commissioning services of an LNG regasification facility located on the south coast of Louisiana in the United States. The original value of thecontract was USD 470 million. Since the construction of the facility started in 2005, the project has been substantially affected by several force majeureevents,including hurricanes, and significant customer requested changes to the initial project scope. These events and scope changes have resulted in significantincreases to the project cost and delayed the original scheduled completion date. Aker Solutions is seeking recovery for such cost increases under the contract.While the final outcome is subject to some uncertainty,the expectation is that the ultimate outcome will not have amaterial financial impact on Aker Solutions’financial position or results.Legal proceedingsWith its extensive worldwide operations, companies included in the group are inthe course of their activities involved in legal disputes. Provisions havebeen made to cover the expected outcome of the disputes to the extent negative outcomes are likely and reliable estimates can be made. However, thefinal outcome of these cases will always be subject to uncertainties and resulting liabilities may exceed recorded provisions.Blind FaithAker Solutions has delivered asemi-submersible hull for Chevron Corporations’ Blind Faith platform. The platform has been installed in the Gulf of Mexicoand production started in November <strong>2008</strong>. Aker Solutions is in discussions with the customer regarding compensation for acceleration work. Chevron Corporationshas presented aguarantee claim towards Aker Solutions and initiated an arbitral process in Houston. Although there can be no assurance regarding theoutcome, the expectation is that this will not have amaterial impact on Aker Solutions’ financial position or results.Hitachi –Council Bluffs power plantIn 2003, Hitachi America Ltd (“Hitachi”) entered into acontract with Aker Construction Inc (“ACI”) for the civil, underground, structural erection, boiler, turbine,Air Quality Control System (“AQCS”) and ancillary scopes of work for a790 megawatt pulverized coal-fired power plant to be delivered toMidAmerican Energy Company in Council Bluffs, Iowa in the United States. The original value of the contract was USD 331 million.Hitachi and ACI’ssubcontractor AZCO Inc (“AZCO”) have filed various claims against ACI. ACI has disputed these claims and filed various counterclaims againstboth Hitachi and AZCO. The disputes between Hitachi and ACI, and ACI and AZCO arecumulated in ajoint hearing, and arbitration hearings areongoing inChicago, Illinois in the United States. Afinal awardonall matters and between all parties is expected in the fourth quarter of <strong>2009</strong>. Although therecan be noassurance with regards to the final arbitration award, the expectation is that this will not have amaterial impact on Aker Solutions’ financial position or results.90Aker Solutions annual report <strong>2008</strong>
Our performanceNotes to the accounts■ Note 14: Property, plant and equipmentAmounts in NOK millionBuildingsand sitesMachinery,equipment andsoftwareConstructionin progressTotalHistorical costBalance as at 1January <strong>2007</strong> 1162 3107 45 4314Additions 371 966 259 1596Additions through business combinations 1 - 26 - 26Disposals -51 - 279 - - 330Currency translation differences -47 - 114 -2 - 163Historical cost as at 31 December <strong>2007</strong> 1435 3706 302 5443Additions 397 798 377 1572Additions through business combinations 2 - 648 - 648Disposals - - 87 3 - 84Currency translation differences 119 220 -11 328Historical cost as at 31 December <strong>2008</strong> 1951 5285 671 7907Accumulated depreciationsBalance as at 1January <strong>2007</strong> -568 -1984 -1 -2553Depreciation for the year -129 - 301 - - 430Impairment loss - - - -Disposals 62 236 - 298Currency translation differences 19 38 - 57Accumulated depreciation as at 31 December <strong>2007</strong> -616 -2011 -1 -2628Depreciation for the year -189 -376 - - 565Impairment loss - - 43 - -43Disposals 8 48 - 56Currency translation differences -9 -109 1 -117Accumulated depreciation as at 31 December <strong>2008</strong> -806 -2491 - -3297Book value as at31 December <strong>2007</strong> 819 1695 301 281531 December <strong>2008</strong> 1145 2794 671 4610Of which capitalised leases31 December <strong>2007</strong> 7 - - 731 December <strong>2008</strong> 5 245 - 2501) Additions relate mainly to the acquisition of 50 percent in Wirth Maschinen- und Bohrgeräte-Fabrik GmbH which is proportionally consolidated in the accounts.2) Additions relate mainly to acquisition of 100 percent in Qserv Ltd.Assets are depreciated on astraight-line basis over their expected economic lives, as follows:Machinery and equipmentBuildingsSites3–15years8–30yearsNo depreciationThe estimated residual values are reviewed annually.See note 25.6 Borrowings and other non-current liabilities for information about bank borrowings which are secured by property, plant and equipment.Aker Solutions annual report <strong>2008</strong> 91
Our performanceNotes to the accounts■ Note 15: Operating leasesTotal non-cancellable operating lease commitmentsAmounts in NOK million <strong>2008</strong> <strong>2007</strong>Contracts due within one year 392 522Contracts running from one to five years 3420 1635Contracts running for more than five years 1634 1253Total 5446 3410Lease and sublease payments recognised in the income statement in <strong>2008</strong>Amounts in NOK millionBuildingsConstructionequipmentOther plant andmachinery Other TotalMinimum lease payments 736 34 208 22 1000Contingent payments 31 - 2 9 42Sublease payments -8 - - - -8Total 759 34 210 31 1034Lease and sublease payments recognised in the income statement in <strong>2007</strong>Amounts in NOK millionBuildingsConstructionequipmentOther plant andmachinery Other TotalMinimum lease payments 380 160 188 4 732Contingent payments 2 - 1 - 3Sublease payments 1 - - - 1Total 383 160 189 4 736The major part of the operating lease costs and commitments relates to rental on alarge number of locations worldwide. Aker Solutions has atwelve yearleasing agreement with Norwegian Property for the headquarters, Aker Hus, at Fornebu, Bærum expiring in 2019.Other plant and machinery costs primarily include leasing of IT equipment, cars, inventory and lease of the vessel Boa Sub C. Leasing of IT equipment isbased on athree year agreement with Hewlett Packard International Bank PLC. From January <strong>2008</strong>, inventory and ICT equipment are leased from SGFinans. There isnointention to purchase the equipment and it cannot be sublet.None of the leases include significant contingent rent.■Note 16: Intangible assetsAmounts in NOK million Note GoodwillOther intangibleassetsTotalBook value as at 1January <strong>2007</strong> 5051 3 5 054Additions - 3 3Additions through business combinations 4 129 55 184Disposals - - 3 - 3Amortisation for the year - - 1 - 1Currency translation differences -242 - - 242Book value as at 31 December <strong>2007</strong> 6 4938 57 4995Additions - 12 12Additions through business combinations 4 1883 95 1978Disposals - - 7 -7Amortisation for the year - - 7 -7Currency translation differences 138 10 148Book value as at 31 December <strong>2008</strong> 6 6959 160 7119The increase in goodwill is mainly caused by the acquisitions of Qserv Ltd and Aker Marine Contractors AS with respectively NOK 1206 million andNOK 595 million. The acquisition of Qserv Ltd caused an increase in other intangible assets, mainly related to customer relationship, of NOK 84 million.See note 4Acquisition of subsidiaries and minority interest for further description.92Aker Solutions annual report <strong>2008</strong>
Our performanceNotes to the accountsResearch and development costsMost of the costs for research and development in Aker Solutions are related to projects and are booked as contract costs. In addition, research anddevelopment costs of NOK 188 million have been expensed during the year because the criteria for capitalisation was not met (NOK 166 million in <strong>2007</strong>).In addition, research and development costs paid by customers totalled NOK 21 million in <strong>2008</strong> (NOK 77 million in <strong>2007</strong>).Allocation of goodwillAmounts in NOK million <strong>2008</strong> <strong>2007</strong>Energy Development &Services 1 2304 2306Subsea 1 556 562Products &Technologies 2652 776Process &Construction 1284 1127Other 163 167Total 6959 49381) Decrease in goodwill is related to currency translation effects.Cash generating unitsGoodwill originates from anumber of acquisitions. Management monitors goodwill impairment at the business segment level which is also considered thecash generating unit (CGU) due to the level of integration within the CGUs.Determination of recoverable amountsRecoverable amounts are based on value in use calculations. The calculations use cash flow projections based on the future cash flow, budgets andstrategic forecasts for the periods <strong>2009</strong> –2013 and an annual growth of 2.5 percent for subsequent periods. Adiscount rate (WACC) of 16.5 percentbefore tax has been used for discounted cash flows.For all business areas the recoverable amounts are higher then the carrying amounts and consequently the analysis indicates that no impairmentis required. As asensitivity analysis, recoverable amount has also been calculated using discount rates up to 25 percent, without any effect on theconclusions.■Note 17: TaxIncome tax expenseAmounts in NOK million <strong>2008</strong> <strong>2007</strong> 2006Current tax expenseCurrent year 484 548 318Adjustments for prior years -36 9 35Total current tax expense 448 557 353Deferred tax expenseOrigination and reversal of temporary differences 189 550 244Benefit of tax losses /timing differences recognised -47 -33 - 22Total deferred tax expense 142 517 222Total tax expense in income statement 590 1074 575Taxexpense discontinued operations - - 65Taxexpense including tax related to discontinued operations 590 1074 640Aker Solutions annual report <strong>2008</strong> 93
Our performanceNotes to the accountsEffective tax rateThe table below reconciles the reported income tax expense to the expected income tax expense according to the corporate income tax rateof 28 percent in Norway.Amounts in NOK million <strong>2008</strong> <strong>2007</strong> 2006Profit before tax 2103 3538 1869Expected income taxes (28 percent) of profit before tax 589 991 523Taxeffect of prior year adjustments -37 -12 26Taxeffect of items booked against equity 4 - 31Taxeffect of permanent differences 1 21 23 -32Taxeffect of tax losses /other timing differences not included in the period incurred -47 -33 - 22Taxeffect of change in tax rates 37 15 -Taxeffect of differences in tax rates from 28 percent 2 38 90 49Other -15 - -Income tax expense 590 1074 575Effective tax rate 28 % 30 % 31%Taxeffect of differences 1 83 521) In 2006 the main difference was the gain on disposal of Aker Kværner Power &Automation Systems AS.2) The major part of the difference relates to the US where the tax rate is 41 percent.Recognised deferred tax assets and liabilitiesAssets Liabilities (-) NetAmounts in NOK million <strong>2008</strong> <strong>2007</strong> <strong>2008</strong> <strong>2007</strong> <strong>2008</strong> <strong>2007</strong>Property, plant and equipment 16 5 -160 -27 -144 -22Pensions 137 246 - - 137 246Projects -64 - -1722 -1340 -1786 -1340Taxloss carry forward 31 114 - - 31 114Other 399 183 1051 1 687 1 1450 870Total 519 548 -831 -680 -312 -1321) Includes the tax effect of tax losses carried forward of NOK 3251 million (NOK 2849 million in <strong>2007</strong>) used to offset positive timing differences.Change in recognised deferred tax assets and liabilitiesAmounts in NOK millionProperty, plantand equipment Pensions ProjectsTaxlosscarry forward Other TotalNet deferred tax assets and liabilities as at 1January <strong>2007</strong> 85 246 -1415 91 1485 492Recognised in profit and loss -105 - 75 23 - 510 -517Recognised in equity - - - - -86 - 86Disposal /acquisition of companies - - - - -25 - 25Currency translation differences -2 - - - 6 4Net deferred tax assets and liabilities as at 31 December <strong>2007</strong> -22 246 -1340 114 870 -132Recognised in profit and loss -74 - 109 -452 -103 597 -142Recognised in equity - - - - -4 -4Disposal /acquisition of companies -35 - - - -81 -116Currency translation differences -13 - 6 20 68 82Net deferred tax assets and liabilities as at 31 December <strong>2008</strong> -144 137 -1786 31 1450 -31294Aker Solutions annual report <strong>2008</strong>
Our performanceNotes to the accountsTaxlosses carried forwardAmounts in NOK million Norway EuropeNorthAmericaSouthAmerica Asia Other Total<strong>2009</strong> - - - - - - -<strong>2010</strong> - - - - - - -2011 - - - - - - -2012 - - - - - - -2013 - 1 - - - - 12014 and later - - 224 - - - 224Indefinite 4389 173 - 60 35 6 4663Total tax losses carried forward 4389 174 224 60 35 6 4 888Taxlosses not recognised as deferred tax asset - - -2 -28 - 35 -4 -69Taxlosses recognised as deferred tax asset 4389 174 222 32 - 2 4819Deferred tax losses are recognised in the balance sheet to the extent that forecasts and realistic expectations about results show that Aker Solutions willbe able to use the tax losses before they expire.Geographical split<strong>2008</strong>Amounts in NOK millionCurrent taxexpenseDeferred taxexpenseTotal taxchangeNet deferredtax liabilityNet payabletax liabilityNorway 13 -20 - 7 - 489 -18Europe 65 47 112 -71 - 38North America 93 114 207 212 46South America 41 -3 38 22 -48Asia 234 2 236 -1 -121Other countries 2 2 4 15 -24Total 448 142 590 -312 -203Taxasset 519 49Taxliability -831 -252<strong>2007</strong>Amounts in NOK millionCurrent taxexpenseDeferred taxexpenseTotal taxchangeNet deferredtax liabilityNet payabletax liabilityNorway 40 566 606 -307 -38Europe 29 50 79 -83 - 59North America 346 -93 253 236 -105South America 21 5 26 16 - 15Asia 74 2 76 5 -5Other countries 47 -13 34 1 -18Total 557 517 1074 -132 -240Taxasset 548 89Taxliability -680 -329■Note 18: Salaries, wages and social security costsAmounts in NOK million Note <strong>2008</strong> <strong>2007</strong> 2006Salaries and wages including holiday allowance 11 140 9741 8365Social security tax /National insurance contribution 1328 1373 1304Pension costs 20 322 543 337Other employee costs 332 540 435Salaries, wages and social security costs 13 122 12 197 10 441Loans to employees are shown in note 25.4 Non-current interest-bearing receivables. No guarantees are granted to any employee.Aker Solutions annual report <strong>2008</strong> 95
Our performanceNotes to the accountsDirectors and nomination committee’s annual feesThe board fees for <strong>2008</strong> were NOK 3150 000, including NOK 600 000 transferred to the labour union covering occupational activities in the group.In addition, fees to the reward committee were NOK 75 000. The amounts are the same as in <strong>2007</strong>. The Board ofDirectors did not receive any otherpayments in <strong>2007</strong> or <strong>2008</strong>. The members of the Board ofDirectors have no agreements that entitle them to any extraordinary remuneration.Fees paid to the nomination committee in <strong>2008</strong> amounted to NOK 90 000, NOK 30 000 per member (NOK 10 000 per member in <strong>2007</strong>).Board ofDirectors 1Amounts in NOK in <strong>2008</strong>RewardcommitteeBoard feesLeif-Arne Langøy 2, 4 25 000 325 000Martinus Brandal 2, 4 300 000Bjørn Flatgård 25000 350 000Heidi Marie Petersen 300 000Vibeke Hammer Madsen 25 000 300 000Karl Erik Kjelstad 2, 4 75 000Siri Fürst 300 000Atle Teigland 3 150 000Åsmund Knutsen 3 150 000Arve Toft 3 150 000Ingebreth Forus 3 150 000Amounts in NOK in <strong>2007</strong>RewardcommitteeAuditcommitteeBoard feesLeif-Arne Langøy 25 000 400 000Bjørn Flatgård 25000 350 000Helge Midttun 25 000 75 000Heidi Marie Petersen 225 000Vibeke Hammer Madsen 25 000 300 000Karl Erik Kjelstad 300 000Siri Fürst 25 000 300 000Atle Teigland 25 000 150 000Åsmund Knutsen 150 000Bernt Harald Kilnes 37 500Arve Toft 112 500Øyvind Hopland 50 000Ingebreth Forus 100 0001) Members of the Board of Directors, the reward committee and the audit committee are elected for two years at the general meeting.2) According to policy in the Aker group, fees to board members employed in Aker companies will be paid to the Aker companies, not to the board member in person. The same policy isimplemented for fees for the reward committee. Therefore, board and compensation committee fees for Leif-Arne Langøy, and board fees for Martinus Brandal and Karl Erik Kjelstad in <strong>2008</strong>were paid to Aker ASA. In <strong>2007</strong>, board fees to Leif-Arne Langøy and Karl Erik Kjelstad were paid to Aker ASA and Aker Yards ASA.3) According to agreement with and initiative from the employees, NOK 150 000 is transferred to the labour union covering occupational activities in the group, for each board member electedfrom the employees.4) As at April <strong>2008</strong>, Martinus Brandal replaced Leif-Arne Langøy as chairman of the board. Karl Erik Kjelstad resigned as director of the board on the same date.The nomination committeeThe Aker Solutions ASA nomination committee comprises the following individuals as at 31 December <strong>2008</strong>: Kjell Inge Røkke (Chairman), Kjeld Rimbergand Gerhard Heiberg.The reward committeeThe reward committee has three independent members elected by and among the Board ofDirectors. As at 31 December <strong>2008</strong> the members of thereward committee are Leif-Arne Langøy, Bjørn Flatgård and Vibeke Hammer Madsen.The reward committee shall ensure that the company’s reward policy serves the interest of the shareholders and that the company has internallyconsistent and externally competitive remuneration of executives.Guidelines for remuneration to the President &CEO and the members of the executive management teamThe main purpose of the executive reward programme is to encourage astrong and sustainable performance-based culture, which supports growthin shareholder value. The total remuneration to executives consists of amarket based salary, afew standard employee benefits and avariable payprogramme.The President &CEO and the executive management team participate in the standard pension and insurance schemes applicable to all employees.The company practice standard employment contracts and standard terms and conditions regarding notice period and severance pay for President &CEO and the members of the executive management team. The company does not offer share option programmes to any managers or employees.The objective of the variable pay programme is to contribute to the company achieving good financial results and management according to thecompany’s values and business ethics.96Aker Solutions annual report <strong>2008</strong>
Our performanceNotes to the accountsThe variable pay programme is based on the achievement of financial and personal performance targets, leadership performance in accordance with thecompany’s values and the development of the company’s share price. The programme represents apotential for an additional variable pay up to the valueof 100 percent of base salary. Earnings are paid over three years. The first half of the variable pay is paid the following year. The remaining amount is paidtwo years later with the addition of aretention element provided the executive is still employed by the company. The annual payments are restricted to oneannual base salary and the restriction will be fully effective from <strong>2009</strong>. The actual reward ofleaders for <strong>2008</strong> was according to the guidelines of the company.The variable pay in <strong>2008</strong> are amounts earned in <strong>2007</strong> and 2005.Remuneration to members of the executive management teamMembers of the executive management team as at 31 December <strong>2008</strong> are: Simen Lieungh, Leif Hejø Borge, Niels Didrich Buch, Mads Andersen,Nils Arne Hatleskog, Per Harald Kongelf and Jarle Tautra. Simen Lieungh replaced Martinus Brandal, who returned to Aker ASA, as at 1March <strong>2008</strong>.Leif Hejø Borge replaced Bjørn Erik Næss as at 1April <strong>2008</strong>. Nils Arne Hatleskog replaced Pål Helsing as at 11 April <strong>2008</strong>. Mads Andersen replacedRaymond Carlsen, who returned to Aker ASA, as at 1October <strong>2008</strong>. Per Harald Konelf replaced Mads Andersen, who took over Subsea, as at 1October<strong>2008</strong>. Niels Didrich Buch entered the executive management team as at 1March <strong>2008</strong>. Thorleif Gram left the executive management team as at 1March<strong>2008</strong>. Total taxable remuneration of the executive management team for <strong>2008</strong> was NOK 38 927 917 (NOK 61 341 631 in <strong>2007</strong>). In addition, Aker Solutionsalso had NOK 919 395 in <strong>2008</strong> (NOK 1290 782 in <strong>2007</strong>) in pension costs for the executive management team.The following remunerations have been paid:Executive management teamAmounts in NOK in <strong>2008</strong> Base salary 1 variable pay 2 Other benefits 3 remunerationTotalTotal taxablePension benefitearned /cost tocompanySimen Lieungh March –December 3456 219 755 051 21 182 4232 452 106 186 4Martinus Brandal January –February 1212 235 722 953 - 1 935 188 36 584 4Leif Hejø Borge April –December 1702 151 2500 000 20 618 4222 769 36 328Bjørn Erik Næss January –February 892 684 3123 251 - 4 015 935 15 988Niels Didrich Buch March –December 1396 465 316 057 21 969 1734 491 77 843Pål Helsing January –March 832 488 - 21969 854 457 71 374Nils Arne Hatleskog April –December 1265 527 444 807 16 219 1726 553 60 250Mads Andersen January –December 2279 657 2507 561 21 969 4809 187 54 330Torleif Gram January –April 617 817 1379 013 113 192 2110 022 206 299 4, 7Raymond Carlsen January –September 2256 456 5178 746 20 788 7455 990 104 066 4Per Harald Kongelf October –December 499 160 - 12678 511 838 36 328Jarle Tautra January –December 2374 805 2922 261 21 969 5319 035 113 819Total 18 785 664 19 849 700 292 553 38 927 917 919 395Amounts in NOK in <strong>2007</strong>Martinus Brandal January –December 3906 965 577 499 19 023 4503 487 76 229Bjørn Erik Næss January –December 2496 864 2222 303 22 831 4741 998 89 513Simen Lieungh January –September 1984 483 6292 094 45 660 8322 237 71 602 4, 6Pål Helsing October –December 512 500 - 21094 533 594 19 135Mads Andersen January –December 2303 615 5152 378 28 382 7484 375 59 260Torleif Gram January –December 2239 582 5443 460 994 381 8677 423 586 699 4Raymond Carlsen January –December 2130 755 8345 521 26 100 10 502 376 206 649 4Gary Mandel January –April 1287 029 5701 121 3398 6991 548 47 121 5Jarle Tautra January –December 2606 790 6956 552 21 251 9584 593 134 574Total 19 468 582 40 690 929 1182 120 61 341 631 1290 7821) Includes holiday allowance.2) The variable pay in <strong>2008</strong> are amounts earned in <strong>2008</strong>, <strong>2007</strong> and 2005 in addition to holiday allowance of variable pay paid in <strong>2007</strong>.3) Other benefits include insurance agreements, which is membership in the standard employee scheme and an additional executive group life and disability insurance with acover of maximumNOK 4402 320.4) Includes management pension rights where contributions stopped in 2002 .The schemes were wound up following the merger between <strong>Kvaerner</strong> and Aker Maritime.5) Gary Mandel has adefined contribution plan only.6) Simen Lieungh was included in the pension benefit program until 31 December <strong>2007</strong>.7) Other benefits include NOK 103 455 for car /housing.There are no loans granted to members of the executive management team.Aker Solutions annual report <strong>2008</strong> 97
Our performanceNotes to the accountsPeriod of notice, severance pay and pension benefits for each member of the current executive management teamName /TitlePresident &CEOSimen LieunghExecutive Vice President &CFOLeif Hejø BorgeExecutive Vice PresidentNiels Didrich BuchExecutive Vice PresidentMads AndersenExecutive Vice PresidentNils Arne HatleskogExecutive Vice PresidentPer Harald KongelfExecutive Vice PresidentJarle TautraAgreed periodof notice Severance pay Pension benefits6months 12 months Standard employee defined benefit plan as described in note 20.In addition vested company pension rights (see description previous page).6months 6months Standard employee defined benefit plan as described in note 20.6months 6months Standard employee defined benefit plan as described in note 20.6months 6months Standard employee defined benefit plan as described in note 20.6months 6months Standard employee defined benefit plan as described in note 20.6months 6months Standard employee defined benefit plan as described in note 20.6months 6months Standard employee defined benefit plan as described in note 20.Share-based paymentsIncluding the members of the executive management team, atotal of 48 managers are entitled to variable pay according to the programme described onthe previous page. The total accrual for the variable pay programme is NOK 112 million at 31 December <strong>2008</strong>. The development of the company’s shareprice is an element of the variable pay programme.Amounts in NOK <strong>2008</strong> <strong>2007</strong> 2006Paid in the year 11 665 450 115 419 678 35 122 508Expensed in the year -9381 273 - 90094 622Accrued at the end of the year - 21 046 724 136 466 401Directors’ and executive management team’s shareholdingThe following number of shares were owned by the Directors and the members of the executive management team (and their related parties) as at31 December <strong>2008</strong>.Martinus Brandal, Chairman 7500Bjørn Flatgård, Vice Chairman 5535Leif-Arne Langøy, Director 175 000Åsmund Knutsen, Director 1505Simen Lieungh, President &CEO 5014Leif Hejø Borge, Executive Vice President &CFO 15 000Gary Mandel, Executive Vice President 1350Mads Andersen, Executive Vice President 2395Shares■Note 19: Number of employees (unaudited)<strong>2008</strong> <strong>2007</strong> 1Energy Development &Services 8542 8163Subsea 4108 3673Products &Technologies 4003 2666Process &Construction 5417 5516Other 1290 1280Total Aker Solutions employees 23 360 21 298Agencies 10 601 11 623Total 33 961 32 920Employees in Norway 11 464 10 931Employees in other countries 11 896 10 3671) Due to the <strong>2008</strong> restructuring of Field Development (FD) and Maintenance, Modification and Operations (MMO) into the new business area named Energy Development &Services (ED&S),historical Aker Solutions numbers were restated according to the new structure. The recently announced restructuring of the Subsea business area and Products and Technologies businessarea will be effective as at 1January <strong>2009</strong>, hence figures have not been restated in the annual report.98Aker Solutions annual report <strong>2008</strong>
Our performanceNotes to the accounts■ Note 20: Employee benefits –pensionThe group’spension costs show the futurepension entitlement earned by employees in the financial year.Inadefined contribution plan the company is responsiblefor paying an agreed contribution to the employee’spension assets. The employee bears the risk related to the investment returnonthe pension assets.In adefined benefit plan, the company is responsible for paying an agreed pension to the employee based on his or her final pay.Pension plans in NorwayThe Norwegian companies in the group areobligated to follow the Act on Mandatory company pensions and these companies’ pension schemes followthe requirements as set in the Act. On 1July <strong>2008</strong> all the Norwegian companies in Aker Solutions changed from adefined benefit plan to adefined contributionplan in which the company is responsible for paying an agreed contribution to the employee’spension assets. Employees over 58 years at the time of transitionremain in the defined benefit plan. The change of pension plan resulted in aone-time positive effect (gain) of NOK 291 million. The gain is mainly related tothe difference between pension obligations recognised for these employees and the paid up policy received by the employees participating in the plan.To ensurethat the employees weretreated fairly on the change over to the new plan the company has introduced aCompensation plan. The basis for decidingthe compensation amount is the difference between calculated pension capital in the defined benefit plan and the value of the defined benefit plan at the ageof 67 years. The compensation amount will be adjusted annually in accordance with the adjustment of the employees’ pensionable income, and accruedinterest according to market interest. If the employee leaves the company voluntarily beforethe age of 67 years, the compensation amount will be reduced.The defined benefit plan is covered by the Aker Pension Fund. Aker Solutions participates in amulti-employer plan called AFP together with the Norwegianstate and other employers. The participating employers pay acontribution to the plan independent of the company’suse of it. The employers also pay 25percent of the pension paid to own pensioners. The Norwegian state pays acontribution of 40 percent of paid pensions. The figures regarding defined benefitbelow include Aker Solutions’scost and liability related to the AFP-plan.Definied benefit plans in Norway largely consist of adefined benefit plan for employees over 58 years when the plan was changed to defined contribution planon 1July <strong>2008</strong>, special pension schemes financed through company operations and contractual early retirement (AFP) schemes. In addition the net pensionliability will include the accrued liabilities in the compensation plan.Pension plans outside NorwayGroup companies in Canada and Germany have defined benefit plans. The benefit plan in Canada was closed to new members as at 1September <strong>2008</strong>. Mostcompanies in other countries have defined contribution plans wherethe employer only contributes an agreed amount that is separately administered.Net periodic pension cost /return (-)Amounts in NOK million Note <strong>2008</strong> <strong>2007</strong> 2006Defined benefit plansService cost 199 263 195Interest on projected benefit obligation 171 180 143Expected returnonplan assets -150 -138 - 122Net amortisations and deferrals 33 68 9Curtailments and settlements -296 - -Administration cost 19 9 7Social security tax 4 53 31Pension cost defined benefit plans -20 435 263Pension cost compensation plan 51 - -Pension cost defined contribution plans 291 108 74Total pension cost 18 322 543 337Aker Solutions annual report <strong>2008</strong> 99
Our performanceNotes to the accountsStatus of pension plans reconciled with the balance sheet<strong>2008</strong> <strong>2007</strong>Amounts in NOK million Funded Unfunded Total Funded Unfunded TotalDefined benefit plansAccumulated benefit obligation 1918 537 2455 2931 509 3440Effect of projected futurecompensation levels 225 98 323 827 83 910Projected benefit obligation (PBO) 2143 635 2778 3758 592 4350Social security tax on plan assets in excess of /less than PBO 46 82 128 150 74 224Plan assets at fair value 1872 - 1872 2662 - 2 662Plan assets in excess of (+) /less (-) that PBO - 317 - 717 -1034 -1246 - 666 -1912Unrecognised net gain (-) /loss (+) 452 109 561 906 84 990Net employee benefit assets (+) /employee benefit obligations (-) 135 - 608 - 473 - 340 - 582 - 922As presented in the balance sheet:Employee benefit assets 234 - 234 15 - 15Employee benefit obligation - 99 - 608 - 707 - 355 - 582 - 937Compensation plan obligation - - 51 - 51 - - -Total employee benefit obligation - 99 - 659 - 758 - 355 - 582 - 937NOK 26 million of the pension prepayment at the end of <strong>2008</strong> relates to group companies in Canada (NOK 14 million in <strong>2007</strong>). NOK 49 million andNOK 33 million of the accrued pension liability at the end of <strong>2008</strong> relates to group companies in Canada and Germany respectively (NOK 43 million andNOK 31 million in <strong>2007</strong>).Economic assumptionsEconomic assumptions (Norwegian plans) <strong>2008</strong> <strong>2007</strong>Discount rate 4.50% 4.50% 5.00% 5.00%Asset return 6.50% 6.50% 6.00% 6.00%Salary progression 4.25% 4.25% 4.25% 4.25%Pension indexation 3.00% 3.00% 2.50% 2.50%The discount rate is based on the Norwegian 10-year government bond rate. The asset returnisexpected to be higher than the discount rate because theassets areinvested in instruments with ahigher risk than government bonds. Experience has shown that the rate of returnonpension assets has been about1percent higher than the discount rate over an extended period of time.Generally,a1percent increase in the discount rate will lead to approximately 20 percent decrease in service cost /projected benefit obligation.Economic assumptions (outside Norway)For the Canadian plans, adiscount rate of 7.5 percent (5.25 percent in <strong>2007</strong>), an expected rate of returnonassets of 7.25 percent (unchanged from <strong>2007</strong>)and an expected salary increase of 3.5 percent (unchanged from <strong>2007</strong>).Movement in pension obligation and plan assetAmounts in NOK million <strong>2008</strong> <strong>2007</strong>Projected benefit obligation as at 1January 4350 4034Service cost incl. cost related to the compensation plan 300 263Interest on projected benefit obligation 171 180Benefits paid by the plan - 109 - 107Curtailment /settlement -1926 - 13Acquisition /disposal - 26Change in unrecognised gain (-) /loss (+) 18 - 40Currency translation differences 9 7Projected benefit obligation as at 31 December 2813 4350Plan assets at fair value as at 1January 2662 2438Expected returnonplan assets 150 138Contributions paid into the plan 350 383Benefits paid by the plan - 79 - 80Curtailment /settlement -1041 -Change in unrecognised gain (-) /loss (+) - 159 - 199Administration costs - 19 - 20Currency translation differences 8 2Plan assets at fair value as at 31 December 1872 2662100Aker Solutions annual report <strong>2008</strong>
Our performanceNotes to the accountsAnalyses of the plan assets and the expected return onplan assets at the balance sheet dateMajor categories of plan assets in percent of total plan assets (Norwegian plans) <strong>2008</strong> <strong>2007</strong>Equity instruments 3.6% 6.9%Debt instruments 94.7% 66.2%Money market 0.0% 22.3%Other assets 1.7% 4.6%Plan assets 100.0% 100.0%The estimated contributions expected to be paid to the plans during <strong>2009</strong> areNOK 56 million in Norway and NOK 20 million in Canada. <strong>Annual</strong> returnonplanassets is NOK 138 million in <strong>2008</strong> (NOK 182 million in <strong>2007</strong>).Overview of net pension obligation and change in unrecognised gains and lossesAmounts in NOK million <strong>2008</strong> <strong>2007</strong> 2006 2005Projected benefit obligation 2813 4350 4034 3339Plan assets at fair value 1872 2662 2438 2073Net pension obligation - 941 -1688 -1596 -1266Change in unrecognised gain (-) /loss (+) projected benefit obligation 18 - 40 615 112Change in unrecognised gain (-) /loss (+) plans assets - 159 - 199 101 4■Note 21: Equity accounted investeesAssociated companies <strong>2008</strong>Amounts in NOK millionBook valueas at1.1.<strong>2008</strong>Additions /Disposals /PaymentsProfitafter tax /ImpairmentCurrencyand otheradjustmentsBook valueas at31.12.<strong>2008</strong>Aker Offshore Oy 1 15 -15 - - -Siva Verdal Eiendom AS 14 - - - 14JSC Astrakhan Korabel 31 -31 - - -Power Maintenance and Constructors, LLC 19 -2 - 6 23Aker Bravo AS 2 - - - 2Beijing Bomco –MHOffshore 6 -2 2 - 6Aker Clean Carbon AS - 32 - 13 - 19Aker Encore AS - 20 - - 20Aker Oilfield Services AS - 269 -9 - 260Nippon Pusnes Co. Ltd 6 - 2 2 10TNT Company LLP - 26 - 6 32DOS Marine LLP - 29 - 6 35Other companies 28 -2 -3 - 23Total 121 324 -21 20 444Associated companies <strong>2007</strong>Amounts in NOK millionBook valueas at1.1.<strong>2007</strong>Additions /Disposals /PaymentsProfitafter tax /ImpairmentCurrencyand otheradjustmentsBook valueas at31.12.<strong>2007</strong>Aker Offshore Oy 1 16 - - -1 15Siva Verdal Eiendom AS 14 - - - 14JSC Astrakhan Korabel 31 - - - 31Power Maintenance and Constructors, LLC 19 3 - -3 19Aker Bravo AS 6 - -4 - 2Beijing Bomco –MHOffshore 5 - 1 - 6Other companies 31 2 1 - 34Total 122 5 - 2 - 4 121Aker Solutions annual report <strong>2008</strong> 101
Our performanceNotes to the accountsThe group’s interest in its principal associates were asfollows 2<strong>2008</strong>Amounts in NOK millionBusiness officePercentageof votingrightsPercentageheld Assets Liabilities Equity RevenuesNet profit/lossSiva Verdal Eiendom AS Trondheim, Norway 46.0% 46.0% 40 4 36 7 -Power Maintenance and Constructors, LLC Hammond, USA 49.0% 49.0% 118 70 48 625 -Aker Bravo Oslo, Norway 45.0% 45.0% 21 19 2 - -2Beijing Bomco –MHOffshore Beijing, China 50.0% 50.0% 17 - 17 17 2Nippon Pusnes Co. Ltd Tokyo, Japan 28.0% 28.0% 198 162 36 334 6Aker Oilfield Services AS Oslo, Norway 32.3% 32.3% 726 270 456 - - 24Aker Clean Carbon AS Oslo, Norway 30.0% 30.0% 140 75 65 8 - 44TNT Company LLP Aktau, Kazakhstan 49.0% 49.0% 5 5 - 4 -DOS Marine LLP Aktau, Kazakhstan 49.0% 49.0% 1 1 - 1 -Aker Encore AS Oslo, Norway 50.0% 50.0% 41 - 41 - -<strong>2007</strong>Amounts in NOK millionBusiness officePercentageof votingrightsPercentageheld Assets Liabilities Equity RevenuesNet profit/lossRR Offshore Oy 1 Ulvila, Finland 40.0% 26.0% 186 183 3 255 7Siva Verdal Eiendom AS Trondheim, Norway 46.0% 46.0% 44 8 36 6 1JSC Astrakhan Korabel Astrakhan, Russia 56.0% 56.0% 31 - 31 - -Power Maintenance and Constructors, LLC Hammond, USA 49.0% 49.0% 69 27 42 306 5Aker Bravo AS Oslo, Norway 45.0% 45.0% 24 21 3 2 -10Beijing Bomco –MHOffshore Beijing, China 50.0% 50.0% 11 3 8 2 11) Former name RR Offshore Oy, subsidiary from January <strong>2008</strong>.2) Balance sheet and profit and loss items listed above are 100 percent of total.■Note 22: Investment in joint venturesThe group has interests in several joint venture activities, whose principal activities are construction contracts. The group’s share ofassets, liabilities,income and expenses of the joint venture operating agreements and entities are included in the consolidated financial statements. The material agreementsand entities are listed below.Joint venture operating agreementsPercentage share <strong>2008</strong> <strong>2007</strong>Aker <strong>Kvaerner</strong> Clough Murray &Robertsen Joint Venture 61% 61%Aker Maritime Kiewit Contractors 49% 49%AKTIV Joint Venture 40% 40%ASC –ERSAI Consortium 50% -Angel 50% 50%Anglian Water 3Joint Venture 1 - 50%Anglian Water 4Joint Venture 50% 50%Cameron LNG (Sempra) 50% 50%Hull Water 2 - 50%IHI Ingleside 3 - 50%JV Yansab 50% 50%O&G Solutions Joint Venture 50% 50%Snøhvit 4 - 65%Halton Hills Power Partners Joint Venture 50% 50%Siemens /Aker <strong>Kvaerner</strong> Songer –Longview Consortium 50% 50%AK /IHI Gulf 50% 50%ASO /IHI 50% -KAT Nuclear 45% 45%1) Anglian Water 3joint venture agreement was terminated in December <strong>2008</strong>.2) Hull Water joint venture agreement was terminated in December <strong>2008</strong>.3) IHI Ingleside was terminated in March <strong>2008</strong>.4) Snøhvit joint venture agreement was terminated in December <strong>2008</strong>.102Aker Solutions annual report <strong>2008</strong>
Our performanceNotes to the accountsJoint venture operating entitiesPercentage share 1 Business Office <strong>2008</strong> <strong>2007</strong>AKCS Offshore Partner Newfoundland, Canada 40% 40%K_WAC Ltd Brendford, UK 30% -Aker Reinertsen AS Trondheim, Norway 50% 50%Aker <strong>Kvaerner</strong> &Soapro Egenharia Ltda Luanda, Angola 50% 50%Wirth Maschinen- und Bohrgeräte-Fabrik GmbH 2 Erkelenz, Germany 50% 50%1) The share oflegal ownership equals the share ofvoting shares for all joint ventures.2) Subsidiary asatJanuary <strong>2009</strong>.The table below presents the assets, liabilities, income and expenses included in the annual accounts relating to joint venture operating entities.Amounts in NOK million <strong>2008</strong> <strong>2007</strong>Current assets 845 568Non-current assets 215 157Current liabilities -541 -363Non-current liabilities -263 -229Net assets/liabilities 256 133Operating income 1142 559Operating expenses -973 -492Operating profit 169 67■Note 23:Financial risk managementFinancial risksThe group is exposed to avariety of financial risks: currency risk, interest rate risk, price risk, credit risk, liquidity risk and capital risk. The market riskswill affect the group’s income or the value of financial instruments held. The objective of financial risk management is to manage and control financial riskexposures, within acceptable parameters. The group’s overall risk management programme focuses on the unpredictability of financial markets and seeksto minimise potential adverse effects on the group’s financial performance. The Aker Solutions group uses financial instruments to hedge certain riskexposures and seeks to apply hedge accounting in order to reduce the volatility in the income statement.Risk management is the responsibility of the business unit and project managers in cooperation with the central treasury department (Corporate Treasury)to identify, evaluate and hedge all financial risks under policies approved by the Board ofDirectors. The Board provides written principles for overall riskmanagement, as well as written policies covering specific areas. There have been no changes in these policies during the year.Currency risk policyThe group operates internationally and is exposed to currency risk on commercial transactions, recognised assets and liabilities and net investmentsin foreign operations which are denominated in acurrency other than the respective functional currencies of the business unit. The group exposure tocurrency risk is primarily to the USD, EUR, GBP and NOK but is in addition in smaller scale exposed to currencies all over the world.The Aker Solutions policy requires group companies to hedge their entire currency risk exposure inany project with Corporate Treasury using forward contractsand currency options. This is done for the project’s lifetime. Corporate Treasury manages the internal exposures in accordance with the CorporateTreasury’s risk management policy entering into forward contracts or currency options with the financial market place. Any changes to the hedged cashflows shall be amended and adjusted as they occur. See note 25.3 Derivative financial instruments for further details. The currency exposure from foreigncurrency investments are not hedged. Dividend or return oncapital invested is hedged when paid.For segment reporting purposes, each business unit designates contracts with Corporate Treasury as fair value hedges or cash flow hedges, as appropriate.External foreign exchange contracts are designated at group level as hedges of currency risk on specific assets, liabilities or future transactions ongross basis, and hedge accounting is applied to more than 80 percent of these hedges. For Aker Solutions segment reporting all foreign currency hedgesare treated as qualifying hedges. The correction where disqualifying hedges no longer are reflected in accordance to hedge accounting, is performed atgroup level and is included in the “unallocated” part of the segment reporting.The principal amounts and interests of the group’s non-current borrowings are denominated in currencies that match the cash flows generated by thegroup companies holding the loans, primarily NOK, but also GBP and USD. This provides an economic hedge without entering into any derivatives.Transaction exposureThe transaction exposure isdefined as the currency risk in projects and working capital.Aker Solutions annual report <strong>2008</strong> 103
Our performanceNotes to the accountsThe group’s exposure tothe main foreign currencies were asfollows based on notional amounts as at 31 December:<strong>2008</strong> <strong>2007</strong>Amounts in million USD EUR GBP USD EUR GBPBank -324 -70 - 26 -229 -20 - 22Intercompany loans 145 25 86 17 -21 35External funding -100 - - - - -Trade receivables 596 106 28 598 36 -Trade payables -105 -79 - 77 -191 -106 -43Balance sheet exposure 212 -18 11 195 -111 -30Estimated forecast sales 1854 9 - 1243 66 -Estimated forecast purchases -431 -334 -27 -198 -219 -49Cash flow exposure 1 423 -325 -27 1045 -153 -49Forward exchange contracts -1633 344 14 -1250 255 80Net exposure 2 1 - 2 -10 - 9 1Trade receivables, trade payables and estimated forecast sales and purchases in the table above are calculated based on the group’s hedge transactions.These are considered to be the best estimate of the currency exposure given that all currency exposure ishedged, in accordance with the group’s policy.The net exposure ishandled by the Corporate Treasury that is allowed to hold positions within an approved trading mandate. This mandate is closelymonitored and reported on adaily basis to the management. The group also has minor exposure toother currencies.Aforeign currency sensitivity analysis indicates that changes in the foreign currency rates result in minor effects on equity and profit and loss. A10percentstrengthening of the NOK against the following currencies at 31 December would have increased (decreased) equity and profit and loss by the amountsshown below. The selected rate of 10 percent reflects the recent years’ changes in currency rates. The sensitivity analysis is calculated based on thehedged transactions as in the currency exposure table above, and the effect from hedge accounting rules were fair value effects from non-qualifyinghedges will be reported as profit and loss. It includes only project related items and assumes that all other variables, in particular interest rates, remainconstant. Calculations are based on amounts and foreign currency exchange rates as at 31 December, and the outstanding amounts are representative forthe whole year due to alow degree of seasonality. The analysis is performed on the same basis for <strong>2007</strong>.Although hedge accounting is not applied to all foreign exchange contracts, these contracts are still “economically” hedged. This means that the effect onprofit and loss under financial items in the table below, will have an opposite effect on future operating income or expense as progress on projects increase.<strong>2008</strong> <strong>2007</strong>Effect in NOK million Profit and loss Equity 1 Profit and loss Equity 1USD 45 133 -262 -328EUR 23 243 -4 119GBP 32 2 34 221) The effects to equity that follows directly from the effects to profit and loss are not included.A10percent weakening of the NOK against the above currencies at 31 December would have had the equal but opposite effect on the above amounts,on the basis that all other variables remain constant.The most important risk, related to currency, isthe risk of reduced competitiveness abroad in the case of astrengthened NOK. This risk is related to futurecommercial contracts and is not included in the sensitivity analysis above.The sensitivity analysis does not include effects on the consolidated result and equity from changed exchange rates used for consolidation of foreign subsidiaries.Translation exposureThe translation exposure isdefined as assets and investments made in foreign currency.The group has several investments in foreign operations, whose net assets are exposed to foreign currency translation risk. Currency exposure arisingfrom the net assets of the group’s foreign operations is normally not hedged.Exchange ratesThe following significant exchange rates applied during the year:Average rateClosing rateNOK <strong>2008</strong> <strong>2007</strong> <strong>2008</strong> <strong>2007</strong>USD 5.649 5.853 7.024 5.403EUR 8.307 8.016 9.888 7.966GBP 10.356 11.700 10.145 10.792Interest rate riskThe group’s interest rate risk arises from non-current borrowings. Borrowings issued at variable rates expose the group to cash flow interest rate risk.Borrowings issued at fixed rates expose the group to fair value interest rate risk, however as these borrowings are measured at amortised cost, interestrate variations do not effect profit and loss. Group policy is to maintain approximately 30 –50percent of its borrowings in fixed rate instruments usinginterest rate swaps to achieve this when necessary.104Aker Solutions annual report <strong>2008</strong>
Our performanceNotes to the accountsAs the group has no significant interest-bearing operating assets, operating income and operating cash flows are substantially independent of changesin market interest rates. At year end 50 percent of the NOK 1.6 billion bond debt interest rate was fixed for the duration of the bonds through interest rateswaps. In addition we have entered into aNOK 2000 million fixed rate swap as hedge for drawings on the Revolving Credit Facilities.The group does not account for any fixed rate financial assets or liabilities at fair value through profit and loss, and the group does not designate derivatives(interest rate swaps) as hedging instruments under afair value hedge accounting model. Therefore achange in interest rates at the reporting datewould not effect profit and loss with respect to the fixed rate instruments.An increase of 100 basis points in interest rates at the reporting date would have increased (decreased) equity and profit and loss by the amounts shown below.This analysis assumes that all other variables, in particular foreign currency rates, remain constant. The analysis is performed on the same basis as for <strong>2007</strong>.<strong>2008</strong> <strong>2007</strong>Amounts in NOK million Profit and loss Equity 1 Profit and loss Equity 1Cash and cash equivalents 38 - 35 -FRA (forward rate agreement) - - 1 -Interest rate swap 35 27 12 19Non-current interest-bearing receivables 1 - - -Current interest-bearing receivables 5 - 5 -Borrowings -62 - -15 -Interest-bearing current liabilities -5 - - -Cash flow sensitivity (net) 12 27 39 191) The effects to equity that follow directly from the effects to profit and loss are not included.Adecrease of 100 basis points in interest rates at the reporting date would have had the equal but opposite effect on the above amounts, on the basis thatall other variables remain constant.Price riskThe group is exposed to fluctuations in market prices both in the investment portfolio and in the operating businesses related to individual contracts.The investment portfolio is limited and does not include shareholdings in listed companies.The businesses may be exposed to changes in market price for raw material, equipment and development in wages. This is partly managed in the bidphase by locking in committed prices to customers without adequate protection on such costs and partly managed in the execution phase after award.The group makes individual assessments of such risks and protects itself either through escalation clauses with customers, locking in subcontractor orequipment providers, or by adding risk contingencies to the price calculations. The group does not enter into commodity derivative contracts.Credit riskCredit risk is the risk of financial losses to the group if customer or counterparty to financial investments /instruments fails to meet its contractualobligations, and arises principally from investment securities and group receivables.The investment portfolio is primarily related to deposits with banks. Thereisaseparate procedurefor the acceptance of final counterparties both for derivativesand deposits, and counterparties have to be investment graded. Credit risk on financial counterparties is reviewed on aregular basis and is monitored closely.Assessment of credit risk related to customers and subcontractors is an important requirement in the bid phase and throughout the contract period. Suchassessments are based on credit ratings, income statement and balance sheet reviews and using credit assessment tools available (e.g. Dun &Bradstreetand Credit Watch). Sales to customers are settled in cash.Based on estimates of incurred losses in respect of trade and other receivables, the group establishes an allowance for impairment. Main componentsof this allowance are aspecific loss component relating to individually significant exposures, and acollective loss component in respect of losses incurredbut not yet identified. Provisions for impairment of receivables are low (NOK 116 million in <strong>2008</strong>, NOK 83 million in <strong>2007</strong>), which is higher than the historicallosses (NOK 5million in <strong>2008</strong>, NOK 4million in <strong>2007</strong>). Revenues are mainly related to large and long-term projects closely followed up in terms of paymentsup front and in accordance with agreed milestones. Normally, lack of payments are due to disagreements of project deliveries and are solved bychange of deliveries (see note 13 Contingent events). The customers are mainly large and highly reputable oil companies with alow credit risk, which reducesthe credit risk significantly. Based on the above the group’s credit risk is considered to be insignificant.At the balance sheet date, there were nosignificant concentrations of credit risk. The maximum exposure tocredit risk at the reporting date equals the fairvalue of each category of financial instruments (see note 25 Financial instruments). The group does not hold collateral as security.Aker Solutions ASA gives parent company guarantees to group companies. For further information, see note 9Guarantees in the Aker Solutions ASA accounts.Liquidity riskLiquidity risk represents the risk that the group will not be able to meet its financial obligations as they fall due. The group’s approach to managing liquidityis to ensure, as far as possible, that it will always have sufficient liquidity reserves to meet its liabilities when due.Prudent liquidity risk management includes maintaining sufficient cash, the availability of funding from an adequate amount of committed credit facilitiesand the ability to close out market positions. Due to the dynamic nature ofthe underlying businesses, Corporate Treasury maintains flexibility in fundingby maintaining availability under committed credit lines (note 25.6 Borrowings and other non-current liabilities).Management monitors rolling weekly and monthly forecasts of the group’s liquidity reserve on the basis of expected cash flow. For information regardingcapital expenditures and net operating assets, see note 6Segment information.Aker Solutions annual report <strong>2008</strong> 105
Our performanceNotes to the accountsFinancial liabilities and the period in which they are mature:<strong>2008</strong> <strong>2007</strong>Amounts in NOK millionTotal6mthsandless6-12mths1-2years2-5yearsMorethan5yearsTotal6mthsand less6-12mths1-2years2-5yearsMorethan5yearsUnsecured bond issues 1Fixed rate bondNOK 150 mill. -195 - - 9 - 9 - 177 - -204 -5 -4 -9 -27 - 159Floating rate bondsNOK 500 mill. -523 -14 - 509 - - - -566 -17 - 17 -533 - -NOK 650 mill. -735 -19 - 13 -24 - 679 - -834 -23 - 23 -46 - 742 -NOK 300 mill. -380 -9 -6 -12 - 353 - -432 -11 - 11 -22 - 66 -322Committed credit facilitiesEUR 750 mill. -5523 -100 -100 -183 -5140 - - - - - - -NOK 2000 mill.Other non-current borrowings -312 -99 - 9 - 18 -186 - -20 - - - -20 -Other non-current liabilities -1194 -126 -126 -126 -816 - -914 -134 -134 -134 -512 -Derivative financial instrumentsAssets 24 582 11 211 6121 5873 1377 - 26 210 16 478 6704 2523 505 -Liabilities -25637 -11602 -6288 -6263 -1484 - -25647 -16151 -6528 -2480 -488 -Trade and other payables -20796 -20306 - - 490 - - -15165 -15141 - - 24 - -Interest-bearing current liab. -59 - -59 - - - -25 - -25 - - -Total -30772 -21064 -998 -1252 -7458 - -17597 -15004 -38 - 725 -1350 -4811) Nominal currency value including interests.See note 25.3 Derivative financial instruments for maturity analysis of foreign currency contracts included in cash flow hedge accounting.Capital riskThe group’s objectives when managing capital are tosafeguard the group’s ability to continue as agoing concern inorder to provide returns for shareholdersand benefits for other stakeholders and to maintain an optimal capital structure toreduce the cost of capital.In order to maintain or adjust the capital structure, the group may adjust the amounts of dividends paid to shareholders, return capital to shareholders,issue new shares or sell assets to reduce debt. From time to time, the group purchases its own shares in the market; the timing of these purchases isdepending on market prices.During the first quarter of <strong>2007</strong> Aker Solutions announced abuy-back of own shares, and in connection with the <strong>Annual</strong> General Meeting it was decidedto cancel some of the own new shares. Furthermore, there were additional share buy-backs in <strong>2008</strong> and as per year end the group holds 1.8 percent ofoutstanding shares. The Statement of changes to equity includes further details.The group monitors capital on the basis of agearing ratio (gross debt /EBITDA) and Interest coverage ratio (EBITDA /Net finance cost). The ratios arecalculated from gross debt, including all interest-bearing liabilities as shown in note 25 Financial instruments, EBITDA (earnings before interest, tax,depreciation and amortisation) and consolidated finance cost. The reported ratios are well within the requirements in the loan agreements.The ratio as at 31 December <strong>2008</strong> and <strong>2007</strong> were asfollows:Amounts in NOK million <strong>2008</strong> <strong>2007</strong>Gearing ratioGross debt 6716 1615EBITDA 3382 3913Gross debt /EBITDA 2.0 0.4Interest coverageEBITDA 3382 3913Consolidated finance cost 263 124EBITDA /Finance cost 12.9 31.6106Aker Solutions annual report <strong>2008</strong>
Our performanceNotes to the accounts■ Note 24: Financial income and expensesRecognised in profit and lossAmounts in NOK million <strong>2008</strong> <strong>2007</strong> 2006Net change in fair value of disqualified hedge instruments 1 -439 155 241Interest income on bank deposits 116 85 172Net foreign exchange gain /loss 31 18 20Ineffective portion of changes in fair value of cash flow hedges -6 7 -Other finance income 34 2 2Finance income 175 112 194Interest expense on financial liabilities measured at amortised cost -379 -209 -429Refinancing cost 2 - - - 652Finance expenses -379 -209 -1081Net finance expense recognised in profit and loss 3 -643 58 -6461) Some hedge transactions do not qualify for hedge accounting under IFRS, primarely because alarge number of internal transactions are grouped and netted before external hedgetransactions are established. The fair value changes on foreign exchange forward contracts, not hedge accounted, have been recorded in the income statement as financial items. Hedgeaccounting is explained in note 25.3 Derivative financial instruments.2) Refinancing costs consist of capitalised refinance costs from the refinancing in 2004, unwinding of discount, interest on second priority lien notes due 15 June <strong>2007</strong> and interest on depositfor neutralisation of loan 15 June <strong>2007</strong>.3) Net finance expense recognised in profit and loss includes income and expense from financial instruments only (see note 25 Financial instruments). Share ofprofit or loss from associates istherefore not included.The above financial income and expense include the following in respect of assets (liabilities) not at fair value through profit or loss.Amounts in NOK million <strong>2008</strong> <strong>2007</strong> 2006Total interest income on financial assets 116 85 172Total interest expenses on financial liabilities -379 -209 -1081Recognised directly in equityAmounts in NOK million <strong>2008</strong> <strong>2007</strong> 2006Hedging reserve as at 1January 315 203 -Fair value of cash flow hedges transferred to profit and loss 373 -633 -178Effective portion of changes in fair value of cash flow hedge -241 788 461Deferred tax -37 -43 - 80Hedging reserve movements 95 112 203Hedging reserve as at 31 December 410 315 203Currency translation reserve as at 1January -595 -161 -216Effective portion of change in fair value of net investment hedge - 120 7Foreign currency translation differences for foreign operations 695 -554 48Currency translation reserve movements 695 -434 55Currency translation reserve as at 31 December 100 -595 -161An impairment loss of NOK 5million (NOK 4million in <strong>2007</strong> and NOK 13 million in 2006) in respect of trade receivables was recognised in cost of sales.See note 25 Financial instruments for information of the financial income and expenses generating items.Aker Solutions annual report <strong>2008</strong> 107
Our performanceNotes to the accounts■ Note 25: Financial instruments<strong>2008</strong> <strong>2007</strong>Amounts in NOK million Note Assets Liabilities Assets LiabilitiesCash and cash equivalents 25.1 3828 - 3524 -Investments in other companies 25.2 123 - 133 -Non-current available-for-sale financial assets 123 - 133 -Derivative financial instruments 25.3 3100 -2403 1468 -954Current financial assets and liabilities through profit or loss 3100 -2403 1468 -954Non-current interest-bearing receivables 25.4 97 - 14 -Non-current loans and receivables 4 - 9 -Trade and other receivables 25.5 20 796 - 13 361 -Current interest-bearing receivables 480 - 540 -Borrowings 25.6 - - 6163 - - 1591Other non-current liabilities - - 1194 - - 914Trade and other payables - - 21 052 - - 15 165Interest-bearing current liabilities - - 553 - - 24Total loans and receivables and financial liabilities at amortised cost 21 377 -28962 13 924 -17694Less non-current portion loans and receivables and financial liabilitiesat amortised cost -101 7357 -23 2 505Current portion loans and receivables and financial liabilitiesat amortised cost 21 276 -21605 13 901 -15189Basis for determining fair values and fair values versus carrying amountsCash and cash equivalentsThe carrying amount is areasonable approximation of fair values for cash and cash equivalents.Non-current available-for-sale financial assetsAvailable-for-sale financial assets are measured at fair value. Fair values are estimated using market-based pricing techniques.Current financial assets and liabilities through profit or lossFinancial assets and liabilities through profit or loss are measured at fair value. The fair value of financial instruments traded in active markets (suchas currency forward contracts and options, interest swaps and forward rate agreements) is based on quoted market prices (current bid price) at the balancesheet date.Loans and receivables and financial liabilities at amortised costDue to the short term nature, the carrying amount is areasonable approximation of fair values for the financial instrument current receivables and liabilities,with the exception of financial borrowings, which is detailed in the table below.Amounts in NOK millionCarryingamount<strong>2008</strong> <strong>2007</strong>Fair valueCarryingamountFair valueBonds 1 1582 1600 1571 1600Other borrowings 5134 5160 44 44Total Borrowings 6716 6760 1615 16441) Fair value is quoted prices on the Oslo Stock Exchange. The difference between the carrying amount and the fair value of the bonds is due to amortisation of issue costs and accruedinterests.In all material financial instruments measured at fair value, the measurement is performed by using valuation techniques based on assumptions supportedby observed market prices or rates.■Note 25.1: Cash and cash equivalentsGroup cash pool systemsThe group policy for the purpose of optimising availability and flexibility of cash within the group is to operate acentrally managed cash pooling arrangement.Such arrangements are either organised with abank as aservice provider, orasapart of the operation of the internal treasury function. An importantcondition for the participants (business units) in such cash pooling arrangements is that the group as an owner of such pools is financially viable and isable to prove its capability to service its obligations concerning repayment of any net deposits made by business units.108Aker Solutions annual report <strong>2008</strong>
Our performanceNotes to the accounts■ Note 25.2: Investments in other companiesAmounts in NOK million <strong>2008</strong> <strong>2007</strong>Investments in other companies as at 1January 133 16Additions 1 66 119Disposals 2 -76 -2Investments in other companies as at 31 December 123 1331) Additions in <strong>2008</strong> are mainly related to additional investments in Aker Pensjonskasse. In <strong>2007</strong> the additions were mainly related to Aker Solutions ASA’s purchase of 19.1 percentof Aker Oilfield Services AS.2) Disposals are mainly related to additional investments in Aker Oilfield Services AS which is now classified as an associated company, see note 21 Equity accounted investees.■Note 25.3: Derivative financial instrumentsFair value of financial instruments<strong>2008</strong> <strong>2007</strong>Amounts in NOK million Assets Liabilities Assets LiabilitiesForward foreign exchange contracts –cash flow hedges 979 -115 925 -409Forward foreign exchange contracts –fair value hedges 27 -303 - -Forward foreign exchange contracts –embedded derivatives included in ordinarycommercial contracts 1933 -30 - -Forward foreign exchange contracts –not hedge accounted 154 -1895 500 -545Forward foreign exchange contracts –hedge of net investments in US entities - - 25 -Interest rate swaps –cash flow hedges - - 52 17 -Interest rate swaps –not hedge accounted 7 - 8 1 -Total 3100 -2403 1468 -954Trading derivatives are classified as current assets or liabilities. The full fair value of ahedging derivative is classified as anon-current asset or liability if theremaining maturity of the hedged item is more than 12 months, and as acurrent asset or liability if the maturity of the hedged item is less than 12 months.If the hedged item is related to projects, such as work in progress or trade receivables, the hedging derivative is always classified as current asset or liability.No material embedded derivatives were identified in <strong>2007</strong>.The ineffective portion recognised in the profit and loss that arises from cash flow hedges amounts to aloss of NOK 6million (gain of NOK 7million in <strong>2007</strong>).There was no material ineffectiveness on fair value hedges in <strong>2008</strong>. In <strong>2007</strong>, there were nofair value hedges.Derivative contractsCorporate Treasury hedge future transactions in foreign currencies. Approximately 80 percent of the exposure toforeign exchange variations in future cashflows are related to afew large projects. These projects have been hedged as one-to-one contracts in order to meet the requirements for hedge accounting.All other hedges are not designated as IAS 39 hedges and will have an effect on profit or loss. Most qualifying hedges are classified as cash flow hedges(hedges of highly probable future revenues and /orexpenses). Some hedges that clearly qualify as hedges of firm commitments, are classified as fair valuehedges.The fair value of the net qualifying forward foreign exchange cash flow hedges recognised in the balance sheet as at 31 December <strong>2008</strong>, were NOK 864million (NOK 516 million in <strong>2007</strong>).The hedged transactions in foreign currency are highly probable future transactions expected to occur at various dates during the next 1–7years, dependingon progress in the projects. Gains and losses on forward foreign exchange contracts recognised in the hedging reserve in equity as at 31 December <strong>2008</strong>,are recognised in the income statement in the period or periods during which the hedged transactions affect the income statement. This is generally within12 months from the balance sheet date unless the gain or loss is over the life of the asset.The following table indicates the periods in which the cash flows associated with derivatives that are cash flow hedges are expected to occur and whenthe cash flows related to project revenues are expected to impact profit and loss. Given the hedging policy this table also constitutes amaturity analysis forderivative financial assets and liabilities.Aker Solutions annual report <strong>2008</strong> 109
Our performanceNotes to the accounts<strong>2008</strong> <strong>2007</strong>Amounts in NOK millionExpectedcashflows6mthsor less6-12mths1-2years2-5yearsMorethan 5yearsExpectedcash flows6mthsor less6-12mths1-2years2-5yearsMorethan 5yearsInterest rate swaps 1Receivables 76 20 20 17 19 - 288 41 43 77 74 53Payables -110 -23 - 36 -28 - 23 - -251 -32 - 38 -69 - 62 -50Foreign currencyforward contracts 2Receivables 6760 2645 1621 1982 512 - 10 160 5693 2756 1426 285 -Payables -3497 -2364 -332 -590 -211 - -6619 -3861 -1660 -905 -193 -Total 3229 278 1273 1381 297 - 3578 1841 1101 529 104 31) 50 percent of the group’s interest exposure related to the Norwegian bonds and part of anticipated drawings on committed facilities are swapped to fixed interest rate. The cash flows in thetable are based on fixed rate of 4.5 percent and market floating rate.2) The figures include the hedges that qualify for hedge accounting, which comprises approximately 400 transactions and 80 percent of the group’s exposure. The amounts are NOK nominalvalues of foreign currency cash flows at NOK closing exchange rates 31 December <strong>2008</strong>. The group has economic hedges on the remaining exposures which are not hedge accounted.These economic hedges constitute about 1900 transactions.The following table shows the unsettled cash flow hedges’ impact on profit and loss and equity as at 31 December:<strong>2008</strong> <strong>2007</strong>Amounts in NOK millionFair value of allhedginginstruments asat 31.12.<strong>2008</strong>Recognisedin profit andlossDeferred inequity (thehedgingreserve)Fair value of allhedging instruments asat 31.12.<strong>2007</strong>Recognisedin profit andlossDeferred inequity (thehedging reserve)Interest rate swaps 1 -52 - -52 17 9 17Forward exchange contracts 2 864 157 707 516 308 208Total 3 812 157 655 533 317 2251) The value of the interest swaps is attributable to changes in the interest swap curve for Norwegian kroner during the period from inception of the hedge to the balance sheet date.2) The purpose of the hedging instrument is to secure asituation where the hedged item and the hedging instrument together represent apredetermined value independent of fluctuationsof exchange rates. Revenue and expense on the underlying construction contracts are recognised in the income statement in accordance with progress. Consequently, NOK 308 million ofthe value of the forward contracts have already affected the income statement indirectly as revenues and expenses are recognised based on updated forecasts and progress. The NOK 208million that are currently recorded directly in the hedging reserve, will be reclassified to income statement over approximately the next three years.Interest rate swapsAs at 31 December <strong>2008</strong>, Aker Solutions has one bond of NOK 150 million with fixed interest rates at 6percent and three bonds with atotal of NOK 1450million with floating interest rates. Parts of the cash flow interest rate risks represented by these floating interest rates (mainly NIBOR and LIBOR) are hedgedto fixed interest rates using interest rate swaps. The share offloating /fixed interest rates is 50 /50. In addition, NOK 2000 million of drawings undercommitted facilities are swapped to 12 months fixed rate from 15 January <strong>2009</strong>. Hedge accounting is applied using the cash flow hedge accounting modelwhich means that gains and losses on interest rate swap contracts as at 31 December <strong>2008</strong> are recognised in the hedging reserve in equity and will becontinuously released to the income statement until the repayment of the bank borrowings (Note 25.6 Borrowings and other non-current liabilities).The fair value amounts of the outstanding interest rate swap contracts as at 31 December <strong>2008</strong> were NOK -52 million (NOK 17 million in <strong>2007</strong>).■Note 25.4: Interest-bearing non-current receivablesAmounts in NOK million <strong>2008</strong> <strong>2007</strong>Loans to employees 1 6 10Loans to related parties 2 88 -Other 3 4Non-current interest-bearing receivables 97 141) Average interest rate for loans to employees is 5.79 percent in <strong>2008</strong>, and was 4.42 percent in <strong>2007</strong>.2) Related to Aker Bravo AS, Aker Clean Carbon AS and Aker Oilfield Services AS (see note 5Related parties).The group has not recognised any impairment losses related to its interest-bearing non-current receivables.110Aker Solutions annual report <strong>2008</strong>
Our performanceNotes to the accounts■ Note 25.5: Trade and other receivablesAmounts in NOK million <strong>2008</strong> <strong>2007</strong>Trade receivables 9039 5898Less provision for impairment of receivables -116 -83Trade receivables net 8923 5815Advances to suppliers 717 434Work in progress 6868 4774Other receivables 4288 2338Trade and other receivables 20 796 13 361Derivative financial instruments 3100 1468Total current trade and other receivables 23 896 14 829The aging of loans and receivables as at 31 December <strong>2008</strong> was:Amounts in NOK million <strong>2008</strong> <strong>2007</strong>Not past due 4738 3924Past due 0–30days 2276 1219Past due 31 –90days 1052 411Past due 91 days to one year 844 255More than one year 129 89Total 9039 5898■Note 25.6: Borrowings and other non-current liabilities31 December <strong>2008</strong>:Amounts in NOK millionNominalcurrency valueBookvalueInterestrateFixedinterestmarginInterestcouponMaturitydateInterest termsNorwegian bondsISIN NO 0010341316 NOK 500 million 494 5.93% 0.70% 6.63% 01.12.<strong>2009</strong> Floating, 3monthsISIN NO 0010341324 NOK 650 million 643 5.93% 1.05% 6.98% 01.12.2011 Floating, 3monthsISIN NO 0010341332 NOK 300 million 297 5.93% 1.35% 7.28% 01.12.2013 Floating, 3monthsISIN NO 0010342587 NOK 150 million 148 6.00% 6.00% 01.12.2013 FixedTotal bonds 1 1582Bank debtRevolving credit facility EUR 750 million 4776 0.50% 25.10.2012 IBOR +Margin 2Revolving credit facility 4 NOK 2000 million - 19.12.2011 IBOR +Margin 3Other loans 358Total borrowings 6716Classified as current borrowings 553Classified as non-current borrowings 6163Total borrowings 6716Other non-current liabilities 5 1194Aker Solutions annual report <strong>2008</strong> 111
Our performanceNotes to the accounts31 December <strong>2007</strong>:Amounts in NOK millionNominalcurrency valueBookvalueInterestrateFixedinterestmarginInterestcouponMaturitydateInterest termsNorwegian bondsISIN NO 0010341316 NOK 500 million 491 5.81% 0.70% 6.51% 01.12.<strong>2009</strong> Floating, 3monthsISIN NO 0010341324 NOK 650 million 638 5.81% 1.05% 6.86% 01.12.2011 Floating, 3monthsISIN NO 0010341332 NOK 300 million 295 5.81% 1.35% 7.16% 01.12.2013 Floating, 3monthsISIN NO 0010342587 NOK 150 million 147 6.00% 6.00% 01.12.2013 FixedTotal bonds 1 1571Bank debtRevolving credit facility EUR 750 million - 0.50% 25.10.2012 IBOR +Margin 2Other loans 44Total borrowings 1615Classified as current borrowings 24Classified as non-current borrowings 1591Total borrowings 1615Other non-current liabilities 5 9141) The book value is calculated by reducing the nominal value of NOK 1600 million by total issue costs related to the new financing of NOK 28 million (NOK 38 million in <strong>2007</strong>). It also comprisesaccrued interest and issue costs related to the bonds.2) The margin applicable to the facility is decided by aprice grid based on the gearing ratio. Commitment fee is 40 percent of the margin.3) The margin applicable to the facility is decided by aprice grid based on the gearing ratio. Commitment fee is 50 percent of the margin.4) The facility is increased from NOK 1500 million to NOK 2000 million in February <strong>2009</strong>.5) Other non-current liabilities mainly consist of estimated deferred payment related to the acquisition of Qserv Ltd NOK 531 million, deferred payment TH Global NOK 234 million (NOK 407in <strong>2007</strong>) and insurance liabilities of NOK 173 million (NOK 315 million in <strong>2007</strong>). The deferred liabilities are non-interest bearing, but have been discounted in the financial statements.Norwegian bondsAker Solutions has issued four bonds with maturities of three, five and seven years (two loans), starting 1December 2006. The bonds are denominated inNorwegian kroner and are issued in the Norwegian bond market. Three of the bonds are issued based on afloating interest rate plus apredefined margin.One of the bonds, NOK 150 million with seven years maturity, has afixed interest rate of 6percent.The bonds are issued with Norsk Tillitsmann as trustee and the loan agreements are based on Norsk Tillitsmann’s standard loan agreement for suchbonds. The bonds are unsecured on anegative pledge basis and include no dividend restrictions.The bonds are listed on the Oslo Stock Exchange.Bank debtThe bank debt consists of two revolving credit facilities of EUR 750 million with initial maturity in October 2012 and NOK 2000 million maturing in December2011. The facilities are provided by abank syndicate consisting of Nordic and international high quality banks. The EUR 750 million facility was drawnwith NOK 4100 million and USD 100 million at year end <strong>2008</strong> and the NOK 2000 million facility was undrawn. The terms and conditions include restrictionswhich are customary for this kind of facility, including inter alia negative pledge provisions and restrictions on acquisitions, disposals and mergers.Furthermore, there are certain changes of control provisions included. The facility includes no dividend restrictions and is unsecured.The financial covenants are based on two sets of key financial ratios; agearing ratio based on gross debt /EBITDA and an interest coverage ratio basedon EBITDA /net finance costs. The financial covenants aretested on aquarterly basis. The margin applicable to the facility is based on aprice grid determinedby the gearing ratio.The facility is hedged to fixed rate through an interest rate swap for NOK 2000 million through <strong>2009</strong>.Repayments of non-current borrowingsAmounts in NOK million Bonds 1 Other Total<strong>2009</strong> -500 -149 -649<strong>2010</strong> - - -2011 -650 - -6502012 - - 4750 -47502013 -450 -261 -711Total repayments -1600 -5160 -67601) All figures are stated at nominal value.112Aker Solutions annual report <strong>2008</strong>
Our performanceNotes to the accountsMortgages and guarantee liabilitiesThe group has NOK 1million in mortgage liabilities, which is secured by pledges on property, plant and equipment with book values of NOK 1million.The group has no guarantee liabilities as at 31 December <strong>2008</strong>, except for guarantees related to contracts.■Note 26: Subsequent eventsDividendThe Board ofDirectors of Aker Solutions will propose an ordinary dividend of NOK 1.60 per share.Wirth Maschinen- und Bohrgeräte- Fabrik GmbHIn August <strong>2007</strong>, Aker Solutions acquired the first 50 percent of the shares in the German company Wirth, with an option to buy the remaining stocks.In January <strong>2009</strong>, Aker Solutions signed an agreement to buy the remaining 50 percent share inWirth. Wirth’s technology complements Aker Solutions’portfolio of drilling equipment products and technology. This acquisition is pending antitrust clearance.Employee share purchase programmeAker Solutions has decided to offer approximately 14 100 of its employees the opportunity to buy Aker Solutions ASA shares with amarket value of approximatelyNOK 15 000 per employee including adiscount of NOK 1500. The duration of the programme will be 12 months, from March <strong>2009</strong> through to March <strong>2010</strong>.Employees who keep their shares until 1September 2011 and are still employed by the company will be entitled to abonus share award ofone bonusshare for every two Aker Solutions ASA shares held under the programme. The programme will be introduced in <strong>2009</strong> in Norway, the United Kingdom, theNetherlands, Canada and Chile and in addition the US, pending approval from local authorities.■Note 27: Discontinued operationsAker Solutions’ Pulping &Power businesses were sold in the fourth quarter of 2006.■ Note 28: Group companies as at 31 December <strong>2008</strong>Company Location Ownership (percent) 1Aker Solutions ASA Fornebu, Norway 100Aker Advantage Pty Ltd Melbourne, Australia 100Aker Marine Contractors Pty Ltd Perth, Australia 100Aker Process Systems Pty Ltd Welshpool, Australia 100Aker Solutions Australia Pty Ltd Melbourne, Australia 100Aker Subsea Pty Ltd Melbourne, Australia 100Aker Solutions Belgium NV/SA Antwerp, Belgium 100Aker Solutions do Brasil Ltda Curitiba, Brazil 100MC Engenharia Ltda São Paulo, Brazil 100Aker Chemetics Offshore Services Inc Vancouver, Canada 100Aker Construction Canada Ltd Ontario, Canada 100Aker Solutions Canada Inc Vancouver, Canada 100Aker Solutions Oilfield Services Canada Inc St. Johns Newfoundland, Canada 100Aker Solutions Chile S.A Santiago, Chile 100Aker Cool Sorption (Beijing) Technology Ltd Beijing, China 100Aker E&C (Shanghai) Co Ltd Shanghai, China 100Aker Projects (Shanghai) Co Ltd Shanghai, China 100Aker Cool Sorption AS Glostrup, Denmark 100Aker Cool Sorption International AS Glostrup, Denmark 100Aker Operations APS Glostrup, Denmark 100Aker Offshore OY Pori, Finland 100Aker Process Systems SAS Vincennes Cedex, France 100Aker Process GmbH Lagenfeld, Germany 100Aker MH (India) Pvt Mumbai, India 51Aker Powergas Pvt Ltd Mumbai, India 64PT Aker <strong>Kvaerner</strong> Indonesia Snd Bhd Jakarta, Indonesia 100PT Aker Solutions Subsea Indonesia Jakarta, Indonesia 100<strong>Kvaerner</strong> (Ireland) Ltd Dublin, Ireland 100Aker Engineering Malaysia Snd Bhd Kuala Lumpur, Malaysia 90Aker Process Systems Asia Pacific Sdn Bhd Shah Akam, Malaysia 100Aker Process Systems Snd Bhd Kuala Lumpur, Malaysia 100Aker Solutions Malaysia Snd Bhd Kuala Lumpur, Malaysia 100Phoenix Polymers Malaysia Ltd Kuala Lumpur, Malaysia 50Aker Solutions Asia Pacific Snd Bhd Kuala Lumpur, Malaysia 100Aker Solutions annual report <strong>2008</strong> 113
Our performanceNotes to the accountsCompany Location Ownership (percent) 1Aker Solutions (Mauritius) Ltd Port Louis, Mauritius 100Aker Solutions SA de CV Lomas de Chaputtepec, Mexico 100Aker Advantage BV Gravenhage, Netherlands 100Aker Process BV Zoetermeer, Netherlands 100Aker Process Engineering Services BV Maastrichts, Netherlands 100Aker Solutions BV Zoetermeer, Netherlands 100Caspian Sea Solutions BV Zoetermeer, Netherlands 100Aker <strong>Kvaerner</strong> Nigeria Ltd Lagos State, Nigeria 100Aker Academy AS Fornebu, Norway 100Aker Advantage AS Bergen, Norway 100Aker Business Services AS Fornebu, Norway 100Aker Carbon AS Lysaker, Norway 100Aker Contracting Russia AS Fornebu, Norway 100Aker Egersund AS Egersund, Norway 100Aker Elektro AS Stord, Norway 100Aker Engineering &Technology AS Fornebu, Norway 100Aker Geo AS Stavanger, Norway 100Aker Installation FP AS Fornebu, Norway 100Aker Insurance AS Fornebu, Norway 100Aker Insurance Services AS Fornebu, Norway 100Aker Jacket Technology AS Verdal, Norway 100Aker Kværner Contracting International (Spain) AS Fornebu, Norway 100Aker Kværner Contracting Italy AS Fornebu, Norway 100Aker Kværner Process Systems International AS Fornebu, Norway 100Aker Marine Contractors AS Fornebu, Norway 100Aker MH AS Kristiansand S, Norway 100Aker O&G Group AS Fornebu, Norway 100Aker Offshore Partner AS Stavanger, Norway 100Aker Operations AS Stavanger, Norway 100Aker P&C Americas AS Fornebu, Norway 100Aker P&C Europe AS Fornebu, Norway 100Aker P&C Group AS Fornebu, Norway 100Aker Piping Tecnology AS Verdal, Norway 100Aker Porsgrunn AS Porsgrunn, Norway 100Aker Process System International AS Fornebu, Norway 100Aker Process Systems AS Fornebu, Norway 100Aker Pusnes AS Arendal, Norway 100Aker Sakkyndig Virksomhet AS Verdal, Norway 100Aker Solutions AS Fornebu, Norway 100Aker Solutions Contracting AS Lysaker, Norway 100Aker Stord AS Stord, Norway 100Aker Subsea AS Fornebu, Norway 100Aker Valves AS Stord, Norway 100Aker Verdal AS Verdal, Norway 100Aker Well Service AS Stavanger, Norway 100Drilltech AS Kristiansand S, Norway 100First Interactive AS Stavanger, Norway 60KB eDesign AS Oslo, Norway 100Kogas AS Fornebu, Norway 100Kværner Engineering AS Fornebu, Norway 100Kværner Eureka AS Tranby, Norway 100Maritime Promeco AS Kristiansand S, Norway 100Norwegian Contractors AS Fornebu, Norway 100Step Offshore AS Hvalstad, Norway 51Stord Montasje AS Stord, Norway 100Stord Verft AS Stord, Norway 100Aker Solutions Peru SA San Isidro, Peru 100Aker <strong>Kvaerner</strong> Caribe LLP San Juan, Puerto Rico 98<strong>Kvaerner</strong> Davy GOT Moscow, Russia 51Aker Process Gulf Ltd Al Khobar, Saudi Arabia 100Aker MH (Singapore) Pte Ltd Singapore, Singapore 100Aker Solutions (Services) Pte Ltd Singapore, Singapore 100Aker Solutions Singapore Pte Ltd Singapore, Singapore 100Aker Pusnes Korea Co Ltd Pusan, South Korea 80<strong>Kvaerner</strong> Pulping SL Barcelona, Spain 100<strong>Kvaerner</strong> Water AB Ørnskjøldsvik, Sweden 100<strong>Kvaerner</strong> Holdings Switzerland AG Zug, Switzerland 100114Aker Solutions annual report <strong>2008</strong>
Our performanceNotes to the accountsCompany Location Ownership (percent) 1Aker Cool Sorption Siam Ltd Rayong, Thailand 100Aker Cool Sorption Thailand Ltd Rayong, Thailand 100Aker <strong>Kvaerner</strong> (Thailand) Ltd Bangkok, Thailand 100Aker <strong>Kvaerner</strong> E&C (Thailand) Ltd Bangkok, Thailand 100Aker <strong>Kvaerner</strong> E&C Holdings (Thailand) Ltd Bangkok, Thailand 100Aker Advantage Ltd London, UK 100Aker Business Services Ltd London, UK 100Aker Construction (Stevanage) Ltd London, UK 100Aker <strong>Kvaerner</strong> Kazakhstan Ltd London, UK 100Aker MH UK Ltd Aberdeen, UK 100Aker Offshore Partner Ltd London, UK 100Aker Process Ltd London, UK 100Aker Process Systems Ltd Aberdeen, UK 100Aker Qserv Ltd Aberdeen, UK 100Aker Solutions Angola Ltd Maidenhead, UK 100Aker Solutions DC Trustees Ltd London, UK 100Aker Solutions E&C Ltd Stockton on Tees, UK 100Aker Subsea Ltd Maidenhead, UK 100Aker Well Services Ltd Aberdeen, UK 100Phoenix Polymers International Ltd Aberdeen, UK 50Qserv Pipeline &Process Ltd London, UK 100Woodfield Systems Co Ltd Kent, UK 100Aker <strong>Kvaerner</strong> Well Service LLC Muscat, United Arab Emirates 70Aker MH FZE Dubai, United Arab Emirates 100Aker Advantage Inc Houston, USA 100Aker Business Services Inc Houston, USA 100Aker Construction Inc Houston, USA 100Aker Enercon Inc Houston, USA 100Aker Field Development Inc Houston, USA 100Aker Industrial Constructions Inc Houston, USA 100Aker <strong>Kvaerner</strong> Pharmaceuticals LLC Houston, USA 100Aker <strong>Kvaerner</strong> Power Inc Charlotte, USA 100Aker <strong>Kvaerner</strong> Process Systems US Inc Houston, USA 100Aker <strong>Kvaerner</strong> US LLP Houston, USA 100Aker <strong>Kvaerner</strong> Willfab Inc Williamsport, USA 100Aker Marine Contractors US Inc Houston, USA 100Aker Maritime US Inc Houston, USA 100Aker Metals Inc Houston, USA 100Aker MH Inc Katy, USA 100Aker Michigan Inc Houston, USA 100Aker Oil &Gas US LLC Houston, USA 100Aker P&C Inc Houston, USA 100Aker P&C US Inc Houston, USA 100Aker Plant Services Group Inc Houston, USA 100Aker Solutions Chile Corporation Houston, USA 100Aker Solutions US Inc Houston, USA 100Aker Solutions USA Corporation Houston, USA 100Aker Strategic Operations Inc Washington, USA 100Aker Subsea Inc Houston, USA 100Aker US Holdings Inc Houston, USA 100Aker Well Services Inc Houston, USA 100DSI Constructors Houston, USA 100<strong>Kvaerner</strong> Process Services Inc Houston, USA 100RIG Specialities Inc Houston, USA 1001) The share oflegal ownership equals the share ofvoting shares.Aker Solutions annual report <strong>2008</strong> 115
Our performance<strong>Annual</strong> accountsAker Solutions ASA:Income statement 1.1 –31.12Amounts in NOK million Note <strong>2008</strong> <strong>2007</strong>Operating revenues 22 17Operating expenses 2 -212 -171Operating loss -190 -154Income from investments in subsidiaries - 2157Net financial items 3 472 436Profit before tax 282 2439Tax 4 -77 -149Net profit 205 2290Net profit for the year is distributed as follows:Proposed dividends 430 809Other equity -225 1481Total distributed 205 2290116Aker Solutions annual report <strong>2008</strong>
Our performance<strong>Annual</strong> accountsAker Solutions ASA:Balance sheet as at 31.12Amounts in NOK million Note <strong>2008</strong> <strong>2007</strong>ASSETSDeferred tax asset 4 - 40Investments in group companies 5 6744 6856Investments in associates 5 270 72Interest-bearing non-current receivables 8 90 8Total non-current assets 7104 6976Interest-bearing current receivables from group companies 8 14 996 9726Non interest-bearing receivables from group companies 6 2764 2843Other current receivables 6 1168 1494Cash and cash equivalents 8 1404 1855Total current assets 20 332 15 918Total assets 27 436 22 894LIABILITIES AND SHAREHOLDERS’ EQUITYIssued capital 7 548 548Own shares 7 -10 -9Share premium reserve 7 4279 4279Other equity 7 3105 3447Total equity 7922 8265Interest-bearing debt 8, 9 6373 1571Deferred tax liability 4 14 -Total non-current borrowings 6387 1571Interest-bearing current debt to group companies 8 9006 9999Provision for dividend 6 430 809Non interest-bearing dept to group companies 6 1284 1259Other current liabilities 6 2407 991Total current liabilities 13 127 13 058Total liabilities and shareholders’ equity 27 436 22 894Fornebu, 3March <strong>2009</strong>Board ofDirectors of Aker Solutions ASAMartinus BrandalChairmanBjørn FlatgårdVice ChairmanHeidi M. PetersenVibeke HammerMadsenLeif-Arne langøySiri FürstÅsmund Knutsen Ingebreth Forus Arve Toft Atle Teigland Simen LieunghPresident &CEOAker Solutions annual report <strong>2008</strong> 117
Our performance<strong>Annual</strong> accountsAker Solutions ASA:Statement of cash flow 1.1 –31.12Amounts in NOK million <strong>2008</strong> <strong>2007</strong>Profit before tax 282 2439Unrealised exchange gain - -26Accrued interest long-term debt 18 2Depreciation and amortisation (+) - 28Changes in other net operating assets 1724 3684Net cash flows operating activities 2024 6127Acquisition of businesses -167 -394Disposal of businesses 112 31Net cash flow from investing activities - 55 -363Proceeds from non-current debt 4802 -Changes in net borrowings from group companies -6345 -4240Buy-back of own shares -70 -781Dividends paid -807 -2182Net cash from financing activities -2420 -7203Net decrease (-) /increase (+) in cash and bank deposits -451 -1439Cash and cash equivalent at 1January 1855 3294Cash and cash equivalent at the end of the period 1404 1855118Aker Solutions annual report <strong>2008</strong>
Our performance<strong>Annual</strong> accountsAker Solutions ASA:Notes to the accounts■ Note 1: Accounting principlesAker Solutions ASA is acompany domiciled in Norway. The accounts are presented in conformity with Norwegian legislations and Norwegian generallyaccepted accounting principles.Investment in subsidiaries and associatesInvestments in subsidiaries and associates are accounted for using the cost method in the parent company accounts. The investments are valued at costless impairment losses. Write-down to fair value are according to good accounting practice recognised when the impairment is considered not to betemporary and reversed if the basis for the write-down is no longer present.Dividends and other payouts are recognised as income the same year as it is appropriated in the subsidiary. Ifthe dividend exceeds accumulated profitsin the subsidiary after the day of acquisition the payment is treated as areduction of the carrying value of the investment.Classification and valuation of balance-sheet itemsCurrent assets and current liabilities includes items due within one year or items that are part of the operating cycle. The rest is classified as fixedassets /non-current debt.Current assets are valued at the lowest of cost and fair value. Current debt is valued at nominal value at the time of recognition.Fixed assets are valued at cost less accumulated depreciation, but are written down to fair value if impairment is not expected to be temporary. Noncurrentdebts are initially valued at transaction value less attributable transaction cost. Subsequent to initial recognition, interest-bearing long-term debt isstated at amortised cost with any difference between cost and redemption value being recognised in the income statement over the period of the borrowingon an effective interest basis.Trade receivables and other receivables are recognised at nominal value less provision for expected losses. Provision for expected losses is consideredon an individual basis.Other receivables are valued at nominal value less provisions for expected loss. Provisions for losses are based on individual judgement of each receivable.Cash and cash equivalents is the parent company’s cash as well as net deposits from subsidiaries in the group cash pooling systems owned by the parentcompany. Correspondingly the parent company’s current debt to group companies will include the same net deposits in the group’s cash pooling system.Foreign currency and interest swapsCash, receivables and foreign currency debt are valued at the exchange rate at the end of the fiscal year. Subsidiaries have entered into agreements withthe parent company to hedge their foreign exchange exposure. In the parent company this risk is hedged in the external financial markets. All agreementsare booked at fair value with any gains or losses booked against the income statement. In order to reduce the financial market exposure, interest swapagreements are entered. The value of these are recognised directly against equity and released to income statement in proportion to the relevant interestexpense.TaxTaxexpense in the profit &loss account comprises current tax and changes in deferred tax. Deferred tax is calculated as 28 percent of temporary differencesbetween accounting and tax values as well as any tax losses carry forward atthe year end. Anet deferred tax asset is recognised only to the extent itis probable that future taxable profits will be available against which the asset can be utilised.■Note 2: Operating expensesThere are no employees in Aker Solutions ASA and hence no salary or pension related costs and also no loans or guarantees related to the executivemanagement team. Group management and corporate staff are employed by other Aker Solutions companies and costs for their services as well as otherparent company costs are charged to Aker Solutions ASA. Remuneration to and shareholding of directors and senior management, Simen Lieungh andLeif Hejø Borge, are described in note 18 Salaries, wages and social security costs to the consolidated accounts.Fees to KPMG for statutory audit of the parent company including group consolidation amounted to NOK 4million, fees for other assurance servicesamonted to NOK 0.2 million and fees for other advisory services amounted to NOK 0.2 million.Aker Solutions annual report <strong>2008</strong> 119
Our performanceNotes to the accounts■ Note 3: Net financial itemsAmounts in NOK million <strong>2008</strong> <strong>2007</strong>Income from investment in other companies 31 -Interest income 1050 945Interest expense -677 -664Net interest 373 281Net foreign exchange gain 68 155Net other financial items 68 155Net financial items 472 436■Note 4: TaxAmounts in NOK million <strong>2008</strong> <strong>2007</strong>Basis for taxable incomeNet profit (+) /loss (-) before tax 282 2439Group contribution without taxes impact - -1935Changes in non-current assets -31 28Permanent differances 11 -Change in timing differences -484 100Transferred to (utilisation of) tax loss carried forward 222 -632Taxable income - -Positive/(negative) timing differencesCurrent assets 339 -75Taxloss carry forward -289 -67Total positive /negative timing differences 50 -142Deferred tax (28 percent of timing differences) -14 40TaxexpenseOrgination and reversal of temporary differences -135 28Benefit of tax losses recognised 62 -177Withholding tax -4 -Total income tax expense in income statement -77 -149The tax loss carry forward isassumed to be fully deductible against future taxable income in the Norwegian group companies.120Aker Solutions annual report <strong>2008</strong>
Our performanceNotes to the accounts■ Note 5: Investments in subsidiaries and other companiesInvestments in subsidiariesAmounts in NOK millionRegisteredofficeSharecapitalNumber ofshares heldBook valueOwner- /voting shareAker P&C Group AS Fornebu, Norway 500 500 000 1189 100%Aker O&G Group AS Fornebu, Norway 1110 1110 000 5555 100%Total investments in group companies 6744Investments in subsidiaries are changed with 112 million from the sale of shares in Aker Business Services Ltd.Investments in subsidiaries and other companies are held at the lower of cost and estimated fair value.Investments in other companiesAmounts in NOK millionRegisteredofficeSharecapitalNumber ofshares heldBook valueOwner- /voting shareAker Oilfield Services AS Oslo, Norway 321 10 379 470 270 32.29%Total investments in other companies 270■Note 6: Non interest-bearing itemsAmounts in NOK million <strong>2008</strong> <strong>2007</strong>Non interest-bearing receivables from group companies 1 2764 2843Other receivables 2 1168 1494Current assets 3932 4337Non interest bearing liabilities to group companies 3 -1284 -1259Other current liabilities 2 -2407 - 991Current liabilities excl. tax and dividend -3691 -2250Net current assets excl. tax and dividend 241 2087Dividend -430 - 809Deferred tax assets /liabilities - 14 40Net operating assets incl. tax and dividend -203 13181) Hereof NOK 2755 million in unrealised gains on group companies foreign exchange hedging with the parent company and NOK 9million in other receivables from group companies.2) Unrealised gains and losses in relation to foreign exchange hedging of the company’s borrowing and lending portefolio3) Hereof NOK 1211 million are unrealised losses on group companies foreign exchange hedging with the parent company and NOK 73 million in other liabilities to group companies.All current assets and liablities are due within one year.Aker Solutions annual report <strong>2008</strong> 121
Our performanceNotes to the accounts■ Note 7: Shareholders’ equityAmounts in NOK millionNumberof shares Share capital Own shares Share premium Other equity TotalEquity as at 1January <strong>2007</strong> 55 029 234 550 4279 2713 7542Dividend from shares heldby Aker Solutions ASA 19 19Change in 2006 dividend -1 -1Increase caused by share split (1:5) 220 116 936 - -Cancellations of shares -1146 170 - 2 2 - -Share buy back 2 -11 - 770 - 781Net profit 2290 2290Proposed dividend -809 - 809Cash flow hedge 1 5 5Equity as at 31 December <strong>2007</strong> 274 000 000 548 -9 4279 3447 8265Dividend from shares heldby Aker Solutions ASA 2 2Share buy back 2 -1 -69 -70Net profit 205 205Proposed dividend -430 -430Cash flow hedge 1 -50 -50Equity as at 31 December <strong>2008</strong> 274 000 000 548 -10 4 279 3105 79221) The value of interest swap agreements changing interest from floating to fixed interest is recognised directly in equity and will be released to income together with the corresponding interestexpense.2) Afurther 595 000 shares were bought in January <strong>2008</strong>. After the acquisition, Aker Solutions ASA holds in total 4966 830 shares.3) Proposed dividend is excl. dividend on own shares as at 31 December <strong>2008</strong>.The share capital of Aker Solutions ASA is divided into 274 000 000 shares with anominal value of NOK 2. The shares can be freely traded. An overviewof the company’s largest shareholders is to be found in page 129 Share and shareholder information.Own shares have been acquired for the purpose of being used in prospective share programs for employees, as settlement in future corporate acquisitionsor for other purposes as decided by the Board ofDirectors.■Note 8: Interest-bearing itemsAmounts in NOK million <strong>2008</strong> <strong>2007</strong>Cash and cash equivalents 1404 1855Interest-bearing current receivables from group companies 14 996 9726Other interest-bearing non-current receivables 1 90 8Interest-bearing current borrowings from group companies -9006 -9999Interest-bearing non-current borrowings -6373 -1571Net interest-bearing assets (+) /liabilities (-) 1111 19Interest income 1050 945Interest expense -677 -664Net interest 373 2811) Loan to Aker Bravo AS NOK 8million, loan to Aker Clean Carbon AS NOK 15 million, loan to Aker Oilfield Services AS NOK 65 million and deposit in Stiftelsen Aker SolutionsKompensasjonsordning NOK 2million.For information on the group cash pooling system see note 25.1 Cash and cash equivalents to the consolidated accounts.122Aker Solutions annual report <strong>2008</strong>
Our performanceNotes to the accounts■ Note 9: Non-current borrowingsAmounts in NOK million <strong>2008</strong> <strong>2007</strong>Revolving credit facility 4802 -Norwegian bonds 1600 1600Refinancing costs to be amortised -55 -37Accrued interest 26 8Non-current borrowings at 31 December 6373 1571Repayments of non-current loans 1<strong>2009</strong> -500 -5002011 -650 -6502012 -4802 -2013 -450 -450Total repayments -6402 -16001) Norwegian bonds and revolving credit facility as described in note 25.6 Borrowings and other non-current liabilities to the consolidated accounts relates entirely to Aker Solutions ASA, seethis note for information regarding interest rates, covenants and pledges.■Note 10: GuaranteesAmounts in NOK million <strong>2008</strong> <strong>2007</strong>Parent company guarantees to group companies 1 44 594 34 725Counter guarantees for bank /surety bonds 2 7855 5548Total guarantee liabilities 52 449 40 2731) Parent company guarantees to support subsidiaries in contractual obligations towards customers. Aker Solutions ASA has also issued counter indemnities in relation to office rental on behalfof subsidiaries.2) Bank guarantees and surety bonds are issued on behalf of Aker Solutions subsidiaries, and counter indemnified by Aker Solutions ASA.■Note 11: Financial instrumentsThe corporate treasury function is located within Aker Solutions ASA and as part of this the company do investment and hedging deals with groupcompanies. After internal netting the remaining net exposure ishedged in the external market. Corporate Treasury is allowed to hold positions within anapproved trading mandate. Investments in group companies are normally not hedged and will be subject to currency fluctuations. Group policy is tomaintain approximately 30 –50percent of its borrowings in fixed rate instruments using interest rate swaps to achieve this when necessary. For moreinformation please see note 23 Financial risk management to the consolidated accounts.■Note 12: Contingent events and related partiesAker Solutions ASA’s investment in Aker Oilfield Services AS and contract with Intellectual Property Holding AS are described in note 5Related parties tothe consolidated accounts.Aker Solutions annual report <strong>2008</strong> 123
Our performanceAuditor’s report124Aker Solutions annual report <strong>2008</strong>
Our performanceAker Solutions annual report <strong>2008</strong> 125
Our performanceShare and shareholder informationOpen and direct dialogueAker Solutions is committed to maintaining an open and direct dialoguewith its investors, analysts, and the financial community in general.Accurate, timely publication of informationrelevant to the market is important inensuring that Aker Solutions’ share pricereflects the company’s underlying value.Aker Solutions’ objective is that thecompany’s shareholders will receive competitivereturns on their investments overtime through acombination of dividends,share buybacks, and share price growth.Dividend policyThe Board ofDirectors considers that longtermaverage dividend payments to shareholdersshould amount to 30 to 50 percentof the Aker Solutions group’s net profit,through cash dividends and/or share buybacks.Considerations affecting dividenddisbursements are alternative uses forsuch funds and applying them to furtherstrengthen the company’s financial structure.The Boardwill propose to Aker Solutions’<strong>Annual</strong> General Meeting that atotal persharedividend of NOK 1.60 be paid for<strong>2008</strong>.The following table shows Aker Solutions’dividend payments for the period2005–<strong>2008</strong>:YearDividend2005 NOK 12006 NOK 22006 –extraordinary NOK 6<strong>2007</strong> NOK 3<strong>2008</strong> –proposed NOK 1.60Shares and share capitalAker Solutions ASA has 274 000 000 ordinaryshares. Each share has apar value ofNOK 2(see page 75ofthe consolidatedaccounts). As of 31 December <strong>2008</strong>, thecompanyhad 5231 shareholders, of whom562 (10.7 percent) were non-Norwegian.Aker Solutions has asingle class of shares.Each share isentitled to one vote. As of31 December <strong>2008</strong>, the company held4966 830 or 1.8 percent of its own (treasury)shares. No shareissues werecarried out in<strong>2008</strong>.Stock exchange listingAker Solutions shares are listed on theOSEBX, the main list of the Oslo StockExchange (ticker: AKSO). Aker Solutionsshares are registered in the NorwegianCentral Securities Depository; DnB NOR isthe company’s registrar. The shares havethe securities registration number ISINNO0010215684. Aker Solutions ASA waslisted on the Oslo Stock Exchange on2April 2004.Largest shareholderAker HoldingAker SolutionsAker ASAAker ASA: 60%The Norwegian Government: 30%SAAB AB: 7.5%Investor AB: 2.5%Aker Holding: 40.27%Aker Solutions’ largest shareholder is AkerHolding AS, which owns 40.27 percent ofthe company’s shares as of 31 December<strong>2008</strong>. Aker ASA holds a controlling 60percent stake in Aker Holding. TheNorwegian government owns 30 percentof Aker Holding’s shares and the Swedishcompanies SAAB AB and Investor AB own7.5 percent and 2.5 percent, respectively.The co-owners of Aker Holding haveagreed that Aker Solutions will continue tobe developed as an internationally competitive,major supplier of technology,products, systems, and services, withoperations concentrated in the energy, oil,and gas sectors.Aker Holding’s owners will continue theestablished, close industrial cooperationbetween Aker Solutions and other Akercompanies. While these companies arelegally and financially independent units,they share many unifying features andcomplementary capabilities. Aker companiesare linked by their Aker ASA ownership.When agreements are entered intobetween two or moreAker companies, theboards of directors and other partiesinvolved are critically aware ofthe need toact in the best interests of the involvedcompanies and in accordance with goodcorporate governance. If needed, external,independent opinions are sought.Current Board authorisationsThe 3April <strong>2008</strong> <strong>Annual</strong> General Meetingof Aker Solutions authorised the Board ofDirectors to acquirecompany shares up toatotal par value of NOK 54 800 000. Theauthorisation also allows for using companyshares as security. The lowest pershareprice to be paid under this authorisationis NOK 1; the highest is NOK 300. Theauthorisation is valid until the <strong>2009</strong> <strong>Annual</strong>General Meeting or until 30 June <strong>2009</strong>,whichever occurs first.Acquisition ofown sharesThe company’ssharebuy-back programmewas continued under the Board authorisationgranted by the <strong>2008</strong> <strong>Annual</strong> GeneralChange in share capitalDate Change in share capital Share capital in NOK Number of shares Par value in NOK1January 2006 550 292 340 55 029 234 10.0031 December 2006 550 292 340 55 029 234Change in <strong>2007</strong> -2292 340 218 970 76631 December <strong>2007</strong> 548 000 000 274 000 000 2.0031 December <strong>2008</strong> 548 000 000 274 000 000 2.00126Aker Solutions annual report <strong>2008</strong>
Our performanceShare and shareholder informationMeeting. The Board has authorised thecompany’s administration to repurchasetreasury shares up to 5 percent of thecompany’s outstanding shares. The sharebuy-back programme runs until the 2April<strong>2009</strong> <strong>Annual</strong> General Meeting. As of 28February <strong>2009</strong>, none of the company’sshares had been acquired pursuant to theBoardauthorisation.The Board will propose an extension ofthe mandate from the date of the AGM’sdecision until the next AGM.Share price development in NOK■ AKSO indexed ■ OSEBX indexed8007006005004003002001000Stock option programmeAker Solutions ASA has as of 31 December<strong>2008</strong> no stock option programme.Jun2004Dec2004Jun2005Dec2005Jun2006Dec2006Jun<strong>2007</strong>Dec<strong>2007</strong>Jun<strong>2008</strong>Dec<strong>2008</strong>Feb<strong>2009</strong>Share purchase programme foremployeesIn January, Aker Solutions announcedthat it is offering approximately 14 100 ofits employees in Norway, the Netherlands,United Kingdom, Chile and Canada theopportunity to buy Aker Solutions ASAshares at adiscount. The discount is NOK1500 per employee and the total buyingamount per employee is NOK 15 000 forthe 12 months (from March <strong>2009</strong> to March<strong>2010</strong>) the programme is running. The persharepurchase price will be equal to theaverage (volume-weighted) share price ofAker Solutions ASA’s shares on the OsloStock Exchange on the last trading daybefore the shares are distributed.Employees who keep their shares until1September 2011 and who are continuouslyemployed by Aker Solutions throughoutthe period for which they hold theirshares will be entitled to abonus shareaward, free of charge, of one bonus sharefor every two Aker Solutions ASA sharesheld under the programme.Investor relationsAker Solutions seeks to maintain an openand direct dialogue with shareholders,financial analysts, and the financialcommunity in general. In addition tomeetings with analysts and investors, thecompany schedules regular presentationsat major financial centers in Europe andthe US.<strong>2008</strong> share dataGeographic distribution of ownershipAs of 13 february <strong>2009</strong><strong>2008</strong> <strong>2007</strong>Highest closing share price NOK 157.00 190.75Lowest closing share price NOK 26.15 131.75Average closing share price NOK 101.80 152.15Closing price as of 31 December NOK 45.00 144.50Own (treasury) shares as of 31 December No. of shares 4966 830 4371 830Shares issued and outstanding as of 31 Dec. No. of shares 274 000 000 274 000 000Market capitalisation as of 31 December NOK million 12 330 39 593Daily turnover No. of shares 2173 788 2171 000Turnover ratio Percent 200.9 197.5Earnings per share NOK 5.34 8.84Nationality Number of shares OwnershipNon-Norwegian shareholders 134 796 609 49.20%Norwegian shareholders 139 203 391 50.80%Total 274 000 000 100%Ownership structure bynumbers of shares heldAs of 13 february <strong>2009</strong>Shares held Number of shareholders Share capital1–100 1262 0.03%101 –1000 2912 0.51%1001 –10000 1191 1.39%10 001 –100 000 266 3.58%100 001 –500 000 115 8.65%More than 500 000 50 85.85%Total 5796 100%Aker Solutions annual report <strong>2008</strong> 127
Our performanceShare and shareholder informationVisitors to Aker Solutions’ website cansubscribe to email delivery of companynews. All Aker Solutions press releases andinvestor relations (IR) publications, includingarchived material, are available at the company’swebsitewww.akersolutions.com.This online resource provides thecompany’s quarterly and annual reports,prospectuses, corporate presentations,articles of association, financial calendar,Investor Relations and Corporate Governancepolicies, and other information. AtAker Solutions’ annual capital markets daypresentation, open to all stakeholders, keyexecutives provide detailed, up-to-dateinformation about the company’s businessactivities and market conditions.Shareholders can contact the company’sinvestor relations staff at: ir@akersolutions.com. The Oslo Stock Exchange displaysspecial symbols alongside company listingsto indicate satisfactory distribution ofinformation (i) and information in English(E). Both the i and the E symbols havebeen awarded to Aker Solutions. Detailson these designations are available atwww.oslobors.no.AnalystsThe following security brokers provide analytic coverage of Aker Solutions (as of 13 February <strong>2009</strong>)Company Name PhoneABG Sundal Collier Ole Martin Westgaard + 47 22 01 61 60ABN AMRO Thomas Deitz +44207 67 881 07Arctic Securities Kjetil Garstad +4721013224Barclays Mick Pickup +44203 13 466 95Citigroup Fiona Maclean +44207 98 641 44Carnegie Frederik H. Lunde +472<strong>2009</strong>379Credit Agricole Cheuvreux Geoffroy Stern + 33 141897379Danske Bank Endre Storløkken +4724008442Deutsche Bank Christyan FMalek +44207 54 582 49DnB NOR Lars-Daniel Westby +4722948983Fearnley Fonds Truls Olsen +4722936393First Securities Pål Dahl +4723238198Fondsfinans Gøran Andreassen +4723113033Goldman Sachs Henry Tarr +44207 55 259 81Handelsbanken Håkon Amundsen +4722940995HSBC David Phillips +44207 99 153 88JP Morgan Amy Wong +44207 32 594 60Merrill Lynch Alejandro Demichelis +44207 99 615 68Nordea Anne Ulriksen +4722486867Nomura Iqbal Nasim +44207 10 239 77Orion Securities Aleksandr Solovjov +37052461968Pareto Rune Juliussen +4722878732RS Platou Markets Terje Mauer +4722016324SEB Enskilda Terje Fatnes +4721008538UBS Alex Brooks +44207 56 758 04Electronic interim and annualreportsAker Solutions encourages its shareholdersto subscribe to the company’s annualreports via the electronic delivery systemof the Norwegian Central SecuritiesDepository (VPS). Please note that VPSservices (VPS Investortjenester) aredesigned primarily for Norwegian shareholders.Subscribers to this service receiveannual reports in PDF format via email.VPS distribution takes place at the sametime as distribution of the printed versionof Aker Solutions’ annual report to shareholderswho have requested it.Quarterly reports, which are generallyonly distributed electronically, are availablefrom the company’s website and othersources. Shareholders who are unable toreceive the electronic version of quarterlyreports may subscribe to the printed versionby contacting Aker Solutions’ investorrelations staff.Nomination committeeAker Solutions has anomination committeeconsisting of no fewer than three members,as set forth in the company’s articlesof association. The composition of thenomination committee must reflect theinterests of shareholders and the committee’smembers must be independent.The nomination committee has thefollowing members: Kjell Inge Røkke (Chairman),<strong>2008</strong>–<strong>2010</strong> Gerhard Heiberg, <strong>2008</strong>–<strong>2010</strong> Kjeld Rimberg, <strong>2007</strong>–<strong>2009</strong><strong>Annual</strong> General Meeting<strong>Annual</strong> General Meetings are normally heldin late March or early April. Written notificationis sent to all shareholders or theirnominees individually.All information relevantto the <strong>Annual</strong> General Meeting is also availableon the company’s website. To vote atshareholders’ meetings, shareholders (ortheir duly authorised representatives) musteither be physically present, or vote byproxy; registration and proxy instructionsare published on the company’s website.<strong>2008</strong> share dataThe company’s total market capitalisationas of 31 December <strong>2008</strong> was NOK 12 330million. During <strong>2008</strong>,atotal of 550 522 000Aker Solutions shares were traded,corresponding to 3.4 times the company’sfreely tradeable stock. Of the company’soutstanding shares, 59.73 percent werefreely tradeable in <strong>2008</strong>; the remaining40.27 percent was owned by Aker HoldingAS. Shares traded on all of the 252 possibletrading days. The average daily tradingvolume was 2184 611 shares.RegistrarShareholders may contact Aker Solutions’registrar with questions pertaining to theirshareholding:DnB NOR ASAVerdipapirserviceStranden 21NO-0021 Oslo, NorwayTelephone: +4722482770Telefax: +4722481171www.dnbnor.com128Aker Solutions annual report <strong>2008</strong>
Our performanceShare and shareholder information20 largest shareholdersAs of 13 February <strong>2009</strong>Name Nominee No. of shares held OwnershipAker Holding AS 110 333 615 40.27%JPMorgan Chase Bank x 16236 318 5.93%State Street Bank and Trust CO. x 14765 932 5.39%State Street Bank &Trust CO. x 9 566 744 3.49%Clearstream Banking S.A. x 5 783 983 2.11%Aker Solutions ASA 4966 830 1.81%Bank of New York Mellon x 4 740 961 1.73%Citibank N.A. New York Branch x 4 600 000 1.68%JPMorgan Chase Bank x 4 170 163 1.52%Bank of New York, Brussels Branch 3767 650 1.38%Citibank N.A. New York Branch x 3 541 890 1.29%The Northern Trust C.O. x 3 313 890 1.21%JPMorgan Chase Bank x 2 856 722 1.04%Deutsche Bank AG Frankfurt x 2 736 889 1.00%JPMorgan Chase Bank x 2 540 803 0.93%Bank of New York Mellon x 2 473 158 0.90%RBC Dexia Investor Services Trust x 2 373 573 0.87%Folketrygdfondet 2118 400 0.77%State Street Bank and Trust CO. x 2 078 473 0.76%Investors Bank &Trust Company x 2 016 178 0.74%Total, 20 largest shareholders 204 982 172 74.81%Other shareholders 69 017 828 25.19%Total 274 000 000 100%Aker Solutions annual report <strong>2008</strong> 129
Our performanceAnalytical informationAnalytical information Aker SolutionsAmounts in NOK million <strong>2008</strong> <strong>2007</strong> 2006Order backlog 31.12 58 016 58 261 59 695Order intake 55 590 57 942 62 271Revenue 58 252 57 957 50 592EBITDA 3382 3913 2872EBITDA margin 5.8% 6.8% 5.7%Profit before tax 2103 3538 1869Rate of taxation 28.1% 30.4% 30.8%Net profit from continuing operations 1513 2464 1294Basic earnings per share continuing operations 5.34 8.84 4.53Cash flow from operating activities -868 2675 2636Cash flow from investing activities -3732 -1576 985Cash flow from financing activities 4105 -3013 -4688Cash flow per share 1.11 -7.82 -3.93Total capital 42 724 28 516 31 396Borrowings 6716 1615 1568Equity ratio 20.14% 25.48% 25.84%Liquidity ratio 117.49% 116.04% 120.04%Gearing ratio 73.56% 64.59% 59.90%Return ontotal capital 6.97% 12.51% 10.23%Return onequity 17.58% 33.91% 46.70%Return oncapital employed 8.50% 16.97% 12.52%RevenueAmounts in NOK million 1Q07 2Q07 3Q07 4Q07 <strong>2007</strong> 1Q08 2Q08 3Q08 4Q08 <strong>2008</strong>ED&S 6998 6864 5691 5368 24 921 5879 6690 5577 4538 22 684Subsea 2136 2429 2571 2715 9851 3038 2550 2205 3413 11 206P&T 2513 2690 3287 3863 12 353 3251 3326 3388 4251 14 216P&C 2842 2929 2992 2834 11 597 2205 2649 2595 3253 10 702Other -342 -215 -304 96 -765 -156 -142 -258 - -556Total 14 147 14 697 14 237 14 876 57 957 14 217 15 073 13 507 15 455 58 252RevenueAmounts in NOK millionEBITDA marginReturn oncapital employed60 00050 00040 00030 00020 00010 00008%7%6%5%4%3%2%1%0%18%16%14%12%10%8%6%4%2%0%2006<strong>2007</strong><strong>2008</strong>2006<strong>2007</strong><strong>2008</strong>2006<strong>2007</strong><strong>2008</strong>130Aker Solutions annual report <strong>2008</strong>
Our performanceAnalytical informationEBITAmounts in NOK million 1Q07 2Q07 3Q07 4Q07 <strong>2007</strong> 1Q08 2Q08 3Q08 4Q08 <strong>2008</strong>ED&S 320 361 316 267 1264 307 261 186 -1322 -568Subsea 150 198 250 250 848 265 236 234 327 1062P&T 188 202 227 270 887 254 283 297 429 1263P&C 160 216 195 181 752 169 225 229 256 879Other -46 - 72 -83 - 68 -269 -98 -9 48 190 131Total 772 905 905 900 3482 897 996 994 -120 2767EBITDAAmounts in NOK million 1Q07 2Q07 3Q07 4Q07 <strong>2007</strong> 1Q08 2Q08 3Q08 4Q08 <strong>2008</strong>ED&S 336 378 332 345 1391 325 281 221 -1302 -475Subsea 171 222 282 285 960 295 288 269 376 1228P&T 202 218 245 294 959 278 313 352 505 1448P&C 168 221 201 186 776 175 230 235 264 904Other -21 - 46 -63 - 43 -173 -71 14 74 260 277Total 856 993 997 1067 3913 1002 1126 1151 103 3382Order intakeAmounts in NOK million 1Q07 2Q07 3Q07 4Q07 <strong>2007</strong> 1Q08 2Q08 3Q08 4Q08 <strong>2008</strong>ED&S 7556 1730 6542 3964 19 792 3431 3503 5388 4359 16 681Subsea 2266 4200 1905 4006 12 377 2972 3045 1714 3735 11 466P&T 1889 3476 1872 3496 10 733 2760 4089 6611 2661 16 121P&C 6414 3281 3462 1839 14 996 4265 3657 1655 1714 11 291Other -821 629 252 -16 44 - 145 -298 427 47 31Total 17 304 13 316 14 033 13 289 57 942 13 283 13 996 15 795 12 516 55 590Order backlogAmounts in NOK million 1Q07 2Q07 3Q07 4Q07 <strong>2007</strong> 1Q08 2Q08 3Q08 4Q08 <strong>2008</strong>ED&S 30 299 25 083 25 871 24 317 24 317 21 750 18 545 18 479 18 315 18 315Subsea 8838 10 618 9706 10 951 10 951 10 677 11 357 11 039 11 876 11 876P&T 12 092 12 861 11 371 11 520 11 520 10 930 11 692 16 045 14 705 14 705P&C 14 265 14 343 13 824 12 519 12 519 12 170 12 980 13 032 13 300 13 300Other -2736 -1973 -1443 -1046 -1046 -1045 -1185 -392 -180 -180Total 62 758 60 932 59 329 58 261 58 261 54 482 53 389 58 203 58 016 58 016Earnings per shareAmounts in NOKOrder intakeAmounts in NOK millionOrder backlogAmounts in NOK million1060 00060 000864250 00040 00030 00020 00010 00050 00040 00030 00020 00010 0000002006<strong>2007</strong><strong>2008</strong><strong>2007</strong><strong>2008</strong><strong>2007</strong><strong>2008</strong>■ ED&S ■ Subsea ■ P&T ■ P&C■ ED&S ■ Subsea ■ P&T ■ P&CAker Solutions annual report <strong>2008</strong> 131
Our organisation and governanceCorporate governanceSafeguarding shareholder interestsAker Solutions’ goal is to ensure the greatest possible value creation overtime, based on good corporate governance. Aker Solutions’ corporategovernance principles establish an appropriate division of roles andresponsibilities among the company’s owners, its Board ofDirectors,and its executive management.The following presents Aker Solutions’practices regarding each of the recommendationscontained in the most recentversion of the Norwegian Code of Practicefor Corporate Governance. Deviationsfrom these recommendations are explainedunder the appropriate Code heading.PurposeAker Solutions’ corporate governance principlesare intended to ensure anappropriatedivision of roles and responsibilitiesamong the company’s owners, its Board ofDirectors, and its executive management.An appropriate division of roles is intendedto ensure that goals and strategies are established,that adopted strategies areimplemented, and that performance issubject to measurement and follow-up.Aker Solutions’ corporate governanceprinciples also help ensurethat the group’sactivities are subject to satisfactory control.An appropriate division of roles and satisfactorycontrol contribute to the greatestpossible value creation over time, to thebenefit of owners and other stakeholders.The corporate governance policy hasbeen prepared by the BoardofDirectors ofAker Solutions ASA. The principles arebased on the Norwegian Code of Practicefor Corporate Governance, dated 4 December<strong>2007</strong>. The following presents AkerSolutions’ practices regarding each of therecommendations contained in the Codeof Practice.Corporate values and ethicalguidelinesThe Boardhas approved andadopted AkerSolutions’ corporate values, which are presentedon page 10 of this annual report.Our ethical guidelines and other policydocuments have been prepared in accordancewith these values.Our businessAker Solutions’ business purpose clausereads as follows: “The company’spurposeis owning and operating industrial businessesand other, related activities, capitalmanagement and other group functions,and participation in or acquisition of otherbusiness activities.”The business purpose clause ensuresthat shareholders have control of thescope of the business activities and theirrisk profile, without limiting the Board ormanagement’sability to carry out strategicand financially viable decisions within thedefined purpose. The group’s financialgoals and main strategies are presented inthis annual report.Equity and dividendsThe group’s equity as of 31 December<strong>2008</strong> amounted to NOK 8 605 million,which corresponds to an equity ratio of20.1 percent. Aker Solutions ASA regardsthe current equity structure asappropriateand adapted to the group’s objectives,strategy, and risk profile.Aker Solutions ASA’s dividend policy isdiscussed in the section Share and shareholderinformation, see page 126 of thisannual report. The group’s dividend policyis among the factors considered in preparingthe Board’s proposal for allocation ofprofit for <strong>2008</strong>.Board authorisationsThe Board’s proposals for future Boardauthorisations are tobelimited to definedissues and are toremain in force until thenext annual shareholders’ meeting.The current Board authorisation toacquire company (treasury) shares is alsopresented in the section Share and shareholderinformation on page 126 of thisannual report.Equal treatment of shareholders andtransactions with related partiesAker Solutionshas asingleclass of shares;all shares carry the same rights in the company.Equal treatment of all shareholdersis crucial. If existing shareholders’ preemptiverights are waived upon an increase inshare capital, the Board must justify thewaiver.Transactions in own (treasury) sharesare executed on the Oslo Stock Exchangeor by other means at the listed price.Aker Solutions ASA has prepared guidelinesdesigned to ensure that members ofthe Board ofDirectors and executive managementnotify the Board ofany materialdirect or indirect interest they may have inagreements entered into by the group.Aker ASA owns 60 percent of the sharesin Aker Holding AS; as of 31 December<strong>2008</strong>, Aker Holding owned 40.27 percentof Aker Kværner ASA (now Aker SolutionsASA) stock. The Norwegian parliamentarybill St.prp. no. 88 (2006–<strong>2007</strong>) providesfurther details on the establishment of AkerHolding AS and the agreement betweenAker ASA and the other Aker Holding ASshareholders.Based on its shared industrial historyand ownership ties, Aker Solutions aims tomaintain its close cooperation with theAker group and various other companiesassociated with Aker ASA. For example,there is major potential in joint projectsbetween Aker Solutions and other Akercompanies that serve the oil and gasindustry.Aker Solutions ASA is not regarded as arelated party, under the Norwegian PublicLimited Liability Companies Act, withregard toAker ASA or companies in whichAker ASA has ownership interests. Nevertheless,the Board and management ofAker Solutions are keenly aware that AkerSolutions must conduct relations with Akercompanies at arm’s length.Further, transactions of acertain sizebetween Aker Solutions ASA and Aker groupcompanies are subject to the proceduresset forth in section 3-8 of the NorwegianPublic Limited Liability Companies Act.For further information, see note 5Relatedparties to the consolidated accounts.Freely negotiable sharesAker Solutionssharesare freely negotiable.No restrictions on transferability are foundin the company’s articles of association.<strong>Annual</strong> General MeetingsAker Solutions encourages shareholdersto participate in its <strong>Annual</strong> General Meetings.Holding <strong>Annual</strong> General Meetings as132Aker Solutions annual report <strong>2008</strong>
Our organisation and governanceCorporate governancesoon as possible after year-end is apriority.Our goal is to publish notices of shareholders’meetings and comprehensivesupporting information — including therecommendations of the nomination committee— on the company’s website nolater than 21 days before the <strong>Annual</strong>General Meeting, and to distribute thesedocuments to shareholders with knownaddresses within the deadlines set forth inthe Norwegian Public Limited LiabilityCompanies Act. The deadline for shareholdersto register to attend is set as closeto the date of the meeting as possible.Shareholders who areunable to attend themeeting in person may vote by proxy. Furtherinformation on procedures for registrationand proxy voting is provided withthe meeting notice and registration andproxy forms.Pursuant to Aker Solutions’ articles ofassociation, the BoardChairman or anotherperson appointed by the Board Chairmanchairs <strong>Annual</strong> General Meetings. To theextent possible, Board members, thenomination committee chairman, and thecompany’s auditor attend <strong>Annual</strong> GeneralMeetings.The nomination committee focuses oncomposing aBoard that works as ateamand on selecting Board members whoseexperience and qualifications complementeach other. Thus, typically, the <strong>Annual</strong>General Meeting is invited to vote for theBoard asawhole.Minutes of <strong>Annual</strong> General Meetingsare published as soon as practical via theOslo Stock Exchange messaging servicewww.newsweb.no (ticker: AKSO) and on thecompany’s website www.akersolutions.com under the heading Investor Relations.Nomination committeeThe company has anomination committee,as set forth in its articles of association.The nomination committee comprises nofewer than three members, who normallyserve for two years. The composition ofthe nomination committee must reflect theinterests of shareholders, as well as maintainthe committee members’ independencefrom Aker Solutions’ Board and executivemanagement. The members andchair of the nomination committee areelected by the company’s <strong>Annual</strong> GeneralMeeting, which also determines theirremuneration.Pursuant to the articles of association,the nomination committee recommendscandidates for election to the Boardof Directors. The nomination committeealso makes recommendations as to theremuneration of Board members. Thecomposition of the nomination committeeis presented under the section Share andshareholder information in this annualreport. The nomination committee is toprovide written justifications of its recommendations.Board composition andindependenceUnder anagreement with employee representativesthe company does not have acorporate assembly, which is provided forunder Norwegian law. Employees’ rightsto representation and participation in decisionmaking have been secured throughextended employee representation on theBoardofDirectors, among other measures.Pursuant to the company’s articles ofassociation, the Board comprises from sixto ten members, one-third ofwhom are tobe elected by and among Aker Solutionsemployees. Further, up to three shareholder-electeddeputy Board membersmay be elected. The nomination committee’srecommendations generally proposean appointment for Board Chairman; theBoard Chairman is elected by shareholdersat the <strong>Annual</strong> General Meeting. TheBoard elects its Deputy Chairman. Boardmembers are elected for a two-yearperiod.The majority of shareholder-electedBoard members are independent of AkerSolutions’ executive management and keybusiness associates. Further, no fewerthan four of the shareholder-elected Boardmembers are independent of the company’slargest shareholder.The current composition of the Boardand the Board members’ expertise, capabilities,and independence are presentedon page 136 of the annual report. Boardmembers’ shareholdings are presented innote 18 Salaries, wages, and social securitycosts to the consolidated accounts. Thecompany encourages Board members toown Aker Solutions stock. The shareholder-electedBoard members have abroad range of expertise, capabilities, andexperience from finance, industry, andnon-governmental organisations.Three of the shareholder-elected Boardpositions are upfor election in <strong>2009</strong>. Thenomination committee’srecommendationsand accompanying justification will be“The principles arebased on theNorwegian Code ofPractice for CorporateGovernance, dated4December <strong>2007</strong>”published on the company’s website andvia the Oslo Stock Exchange’s messageservice, www.newsweb.no, as soon as it isavailable.The work ofthe Board ofDirectorsThe Board annually adopts aplan for itswork, emphasising goals, strategy, and execution.Further, the Board has adoptedBoard instructions that regulate areas ofresponsibility, tasks, and division of rolesof the Board, Board Chairman, and President&CEO. The Board instructions alsofeaturerules as to Boardschedules, noticeand chairing of Board meetings, decisionmaking, the President &CEO’s duty andright to disclose information to the Board,professional secrecy, impartiality, andother matters.Pursuant to the Board instructions, theBoard evaluates its own performance andexpertise once a year. The Board hasappointed acompensation committee.Risk management and internalcontrolAker Solutions has established acomprehensiveset of internal control proceduresand systems to ensure unified and reliablefinancial reporting. Each of the group’sbusiness units must annually evaluate itsinternal control systems and financialreporting procedures. The group also regularlyconducts internal audits of individualunits’ adherence to systems and procedures.The Board receives reports on thecompany’s financial performance andstatus reports on the group’s most importantindividual projects on amonthly basis.Page 58 of the annual report presents amore detailed description of the managementof operational and financial risksassociated with the group’s businessactivities.Board remunerationRemuneration paid to Aker Solutions’Aker Solutions annual report <strong>2008</strong> 133
Our organisation and governanceCorporate governanceBoard ofDirectors reflects the Board’s responsibilities,expertise, time spent, andthe complexity of the business. Remunerationis not profit-dependent.Additional information on remunerationpaid to Board members for <strong>2008</strong> ispresented in note 18 to the consolidatedaccounts.Remuneration of executivemanagementThe Board has adopted guidelines forremuneration of Aker Solutions’ executivemanagement in accordance with the rulesand regulations of section 6-16a of theNorwegian Public Limited Liability CompaniesAct.Aker Solutions ASA does not have stockoption plans or other share award programmesfor employees for <strong>2008</strong>, but ashare purchase programme has been initiatedfor <strong>2009</strong>. Further details are availableon the company’s website. Note 18 to theconsolidated accounts provides furtherdetails as to remuneration paid in <strong>2008</strong>to individual members of Aker Solutions’executive management. The company’sguidelines for remuneration of executivemanagement are discussed in note 18 tothe consolidated accounts, and arepresented to the <strong>Annual</strong> General Meeting.Information and communicationThe company has prepared an InvestorRelations (IR) policy, which isavailable atAker Solutions’ website. Aker Solutions’reporting of financial and other informationis to be based on openness and on equaltreatment of market participants.The long-term purpose of Aker Solutions’systematic IR work is to ensure thecompany’s access to capital at competitiveterms and correct pricing of shares forshareholders. These goals are to beaccomplished through accurate and timelydistribution of information that can affectthe company’s share price; the companyalso complies with current rules and marketpractices, including the requirement ofequal treatment.All stock exchange notices and pressreleases are made available on the company’swebsite, www.akersolutions.com;stock exchange notifications are alsoavailable from www.newsweb.no. All informationthat is distributed to shareholders issimultaneously published on Aker Solutions’website. The company endeavors to holdpublic presentations of its financial reporting;such presentations are often broadcastsimultaneously via the Internet.Aker Solutions’ financial calendar ispublished on the company’s website.TakeoversIn light ofAker Solutions’ ownership structure,the Board has thus far not deemed itappropriate to prepareseparate guidelinesfor takeover situations.AuditorThe auditor makes an annual presentationof its plan for auditing work to the Board.Further,the auditor has provided the Boardwith awritten confirmation that the requirementof independence is met.The auditor participates in the Boardmeeting that deals with the annualaccounts, and the auditor has reviewedthe company’s internal controls with theBoard. The Board ofDirectors has beengiven the opportunity to meet with theauditor without the company’s executivemanagement present; however, no suchmeeting has been requested.The Boardhas not deemed it necessaryto introduce guidelines for executive management’suse of auditors for servicesother than auditing. However, the Boardreceives an annual overview of servicesother than auditing that have been suppliedto the company.Remuneration to auditors for auditingand other services is presented in note 7Other operating expenses to the consolidatedaccounts. Such data and theselection of the auditor for the <strong>2009</strong>accounting year are also presented to the<strong>Annual</strong> General Meeting.134Aker Solutions annual report <strong>2008</strong>
Our organisation and governanceCorporate governanceAker Solutions annual report <strong>2008</strong> 135
Our organisation and governanceBoard ofDirectorsBoard ofDirectorsMartinus BrandalChairman of the BoardMartinus Brandal (born 1960) rejoined Aker in <strong>2008</strong>. He was President &CEO of Aker Solutions ASAfrom July 2006 to March <strong>2008</strong>. From July 2004 to July 2006 Brandal was EVP in charge of operations,strategy and business development for Aker ASA. From 1985 to 2004, Brandal held various managementpositions in the ABB Group at its headquarters in Zurich, including Group SVP and Head ofBusiness Area Process Automation. He is also Chairman of the Boards of Aker Drilling and Aker FloatingProduction, and aBoard member of Aker Oilfield Services and of Odim. He holds aBSc in ElectricalEngineering from Oslo University College. As of 31 December <strong>2008</strong>, Brandal holds, through aprivatelyowned company, 7500 shares in the company and has no stock options. Brandal is aNorwegiancitizen. He has been elected for the period <strong>2008</strong>–<strong>2010</strong>.Bjørn FlatgårdDeputy ChairmanBjørnFlatgård(born1949) runs his own business, the principal activities of which areparticipation onBoards of directors and investing. Flatgårdwas President and CEO of Elopak AS from 1996 to <strong>2007</strong>.He previously served as President and CEO of Nycomed Pharma and EVP of Hafslund Nycomed andNycomed AS. Flatgårdholds multiple Boardpositions in major Norwegian companies. Flatgårdhas anMSc in Chemical Engineering from the Norwegian University of Science and Technology and adegreefrom the Norwegian School of Management. As of 31 December <strong>2008</strong>, Flatgårdholds 5535 shares in thecompany,and has no stock options. FlatgårdisaNorwegian citizen. He has been elected for the period<strong>2008</strong>–<strong>2010</strong>.Heidi M. PetersenDirectorHeidi M. Petersen (born 1958) is an independent businesswoman. From 2000 to July <strong>2007</strong>, she wasManaging Director of Future Engineering AS and of Rambøll Oil &Gas AS. Petersen was employed in<strong>Kvaerner</strong> Oil &Gas from 1988, becoming head of <strong>Kvaerner</strong> Oil &Gas Sandefjord in1997. Petersenhas varied Board experience of industrial, oil and gas-based operations as well as of energy supplyand financial enterprises. She currently chairs the BoardofSandefjordAirport and is amember of theBoards of Norsk HydroASA, Nordea AB, Songa Floating Production ASA and Noreco ASA among others.She holds an MSc from the Norwegian University of Science and Technology. Asof31December<strong>2008</strong>, Petersen holds no shares in the company, and has no stock options. Petersen is aNorwegiancitizen. She has been elected for the period <strong>2007</strong>–<strong>2009</strong>.Vibeke Hammer MadsenDirectorVibeke Hammer Madsen (born 1955) has been CEO of the Federation of Norwegian Commercial andService Enterprises since 2002. Prior to this she was Partner in PA Consulting Group. From 1993 to1999 Hammer Madsen was Vice President and held various positions in StatoilHydro. Hammer Madsenholds arange of Board positions. She is agraduate of the Norwegian School of Radiography. Asof31 December <strong>2008</strong>, Hammer Madsen holds no shares in the company, and has no stock options.Hammer Madsen is aNorwegian citizen. She has been elected for the period <strong>2007</strong>–<strong>2009</strong>.Leif-Arne LangøyDirectorLeif-Arne Langøy (born1956) was President &CEO of Aker ASA, formerly Aker RGI, from 2003 to <strong>2008</strong>.From 2006 to <strong>2008</strong> he was also Chairman of the Board. Langøy has previously served as President &CEO of the Aker Yards Group, and for 13 years as Managing Director of Aker Brattvaag. He is Chairmanof the Boards of Aker Holding, Aker Seafoods and Aker BioMarine, aBoardmember of Aker Exploration,and Deputy Chairman of TRG Holding. Langøy has an MBA from the Norwegian School of Economicsand Business Administration. As of 31 December <strong>2008</strong>, Langøy holds, through aprivately ownedcompany, 175 000 shares in the company and has no stock options. Langøy is aNorwegian citizen.He has been elected for the period <strong>2008</strong>–<strong>2010</strong>.136Aker Solutions annual report <strong>2008</strong>
Our organisation and governanceBoard ofDirectorsSiri FürstDirectorSiri Fürst (born 1958) has been Partner and Business Consultant in Considium Consulting Group sinceJanuary 2005. From 1984 to 1999 she held various management positions in Hafslund, HafslundNycomed and Nycomed Pharma. From 1999 to 2003 she was Managing Director of DiaGenic ASA.Fürst is agraduate of the Norwegian School of Economics and Business Administration. As of 31December <strong>2008</strong>, Fürst holds no shares in the company, and has no stock options. Fürst is aNorwegiancitizen. She has been elected for the period <strong>2007</strong>–<strong>2009</strong>.Atle TeiglandDirectorAtle Teigland (born 1957) was elected by the employees of Aker Solutions to the Board ofDirectors inOctober 2004. He has previously served for several years on the Boards of Aker RGI and Aker Maritime.Teigland is aGroup Union Representative for Aker Solutions on afull time basis and has been employedby Aker Elektro ASsince 1978. Teigland is acertified electrician. As of 31 December <strong>2008</strong>, Teiglandholds no shares in the company, and has no stock options. Teigland is aNorwegian citizen. He hasbeen elected for the period <strong>2007</strong>–<strong>2009</strong>.Åsmund KnutsenDirectorÅsmund Knutsen (born1959) was elected by the employees of Aker Solutions to the Board ofDirectorsin October 2004. He has held various positions in Aker Engineering &Technology AS since 1991 andis now aGroup Union Representative for white collar employees on afull time basis. Knutsen holds aMSc in Hydrodynamics. As of 31 December <strong>2008</strong>, Knutsen holds 1505 shares in the company, andhas no stock options. Knutsen is aNorwegian citizen. He has been elected for the period <strong>2007</strong>–<strong>2009</strong>.Ingebreth ForusDirectorIngebreth Forus (born 1950) was elected by the employees of Aker Solutions as adeputy Boardmember in <strong>2007</strong>. He took over as afull Board member in May <strong>2007</strong>. Forus was employed by <strong>Kvaerner</strong>between 1975 and 1980, and joined Aker Well Service as awireline supervisor in 1995. He became aUnion Representative on afull time basis in 2004 and is also amember of the Board ofIndustri Energi(formerly NOPEF). Forus holds adegree in civil engineering from Stavanger Technical School and afurther degree from the University of Bergen. As of 31 December <strong>2008</strong>, Forus holds no shares in thecompany, and has no stock options. Forus is aNorwegian citizen. He has been elected for the period<strong>2007</strong>–<strong>2009</strong>.Arve ToftDirectorArve Toft (born 1966) was elected by the employees of Aker Solutions to the Board ofDirectors inMarch <strong>2007</strong>. Toft has been employed by Aker Solutions since 1983 and is aGroup Union Representativefor Aker Solutions on afull time basis. He has been afull time local union representative at Aker StordAS for 5years. Toft is acertified mechanic and scaffolder. Asof31December <strong>2008</strong> Toft holds noshares in the company, and has no stock options. Toft is aNorwegian citizen. He has been elected forthe period <strong>2007</strong>–<strong>2009</strong>.Aker Solutions annual report <strong>2008</strong> 137
Our organisation and governanceExecutive management teamExecutive management teamSimen LieunghPresident &CEOSimen Lieungh (born 1960) first joined Aker Solutions in 1988 and has been President &CEO sinceMarch <strong>2008</strong>. He has more than 20 years’ experience with large field development projects, coveringall phases from conceptual studies to completion and delivery of complete installations. Prior to this,Lieungh was aresearch scientist with the Norwegian Defence Research Establishment and fromOctober <strong>2007</strong> to February <strong>2008</strong> he was Managing Director of Arne Blystad AS. Lieungh is agraduate ofthe Norwegian University of Science and Technology. Asof15February <strong>2009</strong>, Lieungh holds 15 014shares in the company and has no stock options. Lieungh is aNorwegian citizen.Leif BorgeChief Financial Officer &EVPLeif Borge (born 1963) joined Aker Solutions in <strong>2008</strong>. From 2002 to <strong>2008</strong> he was CFO of Aker YardsASA, after serving as CFO of Zenitel NV, Stento ASA and Vitana, asubsidiary of Rieber &Søn ASA inthe Czech Republic. Borge is agraduate of the Pacific Lutheran University in Washington State. As of15 February <strong>2009</strong>, he holds 20 000 shares in the company, and has no stock options. Borge is aNorwegian citizen.Niels Didrich BuchChief ofStaff &EVPNiels Didrich Buch (born 1963) joined Aker Solutions in 1999 and was appointed Chief of Staff &EVPin <strong>2008</strong>. From 2005 he was head of corporate business development in Aker Solutions and previouslyhe held various other positions in the company, incorporate legal. Before this he worked ten yearswith the Norwegian Foreign Service, including six of them abroad in Asia and Europe. Buch holds alaw degree from the University of Oslo. As of 15 February <strong>2009</strong>, he holds no shares in the companyand has no stock options. Buch is aNorwegian citizen.Mads Andersen 1EVP SubseaMads Andersen (born 1965) joined Aker Solutions in 2000 and has been an EVP since 2003. He has20 years’ experience in the upstream oil and gas industry. Andersen has held arange of technical andmanagerial positions in oilfield service and oil companies including Schlumberger and Saga Petroleum(now StatoilHydro). Andersen is agraduate of Glasgow University and the Norwegian School ofManagement. As of 15 February <strong>2009</strong>, he holds 12 395 shares in the company and has no stockoptions. Andersen is aNorwegian citizen.Per Harald Kongelf 2EVP Products &TechnologiesPer Harald Kongelf (born 1959) was appointed EVP of the reorganised business area Products &Technologies in October <strong>2008</strong>. He has 20 years’ experience within the oil and gas industry. For thepast five years he was president of Aker Solutions’ process systems business unit. Before that heworked as an investment manager in the Statkraft Group and in Aker Solutions. He holds an MScfrom the Norwegian University of Science and Technology. Asof15February <strong>2009</strong>, he holds noshares in the company and has no stock options. Kongelf is aNorwegian citizen.138Aker Solutions annual report <strong>2008</strong>
Our organisation and governanceExecutive management teamJarle Tautra 3EVP Energy Development &ServicesJarle Tautra (born 1953) has been an EVP with Aker Solutions since 2002. He has 27 years’ experiencein offshore-related activities. From 1997 to 2002 Tautra served as President of Aker Oil &Gas and asEVP of EPC Norway in Aker Maritime ASA. Prior to this, he held various positions in Norsk HydroASA. Tautra is agraduate of the Norwegian University of Science and Technology. Asof15February,he holds no shares in the company and has no stock options. Tautra is aNorwegian citizen.Gary Mandel 4EVP Process &ConstructionGary Mandel (born 1960) first joined Aker Solutions in 1995. He has over 25 years of experience in theoil and gas industry, both upstream and downstream. Prior to Aker Solutions Mandel held the positionof Chairman &CEO at Aker American Shipping ASA and Vice Chairman of Aker Philadelphia ShipyardASA. Previously, heserved as EVP for Aker Solutions between 2002 and <strong>2007</strong>. Mandel is an engineeringgraduate from the University of Nuevo Leon, Mexico. As of 15 February <strong>2009</strong>, he holds 1350 sharesin the company and has no stock options. Mandel is aUScitizen.1) Mads Andersen replaced Raymond Carlsen as EVP Subsea in October <strong>2008</strong>. Carlsen was EVP Subsea from 2002 to <strong>2008</strong>.2) Per Harald Kongelf replaced Mads Andersen in October <strong>2008</strong>. Andersen was EVP in Products &Technologies from 2003 to <strong>2008</strong> and is now EVP Subsea.3) Jarle Tautra replaced Nils Arne Hatleskog as EVP Energy Development &Services in February <strong>2009</strong>.4) Gary Mandel replaced Jarle Tautra in February <strong>2009</strong>. Tautra is now heading the Energy Development &Services business area.Aker Solutions annual report <strong>2008</strong> 139
Our organisation and governanceCompany informationAker Solutions ASASnarøyveien 361364 FornebuPostal address:P.O. Box 169NO-1325 LysakerTelephone: +47 67 51 30 00Telefax: +47 67 51 30 10E-mail: ir@akersolutions.comWeb: www.akersolutions.comThe following corporate publications are alsoavailable from www.akersolutions.comFace valueCorporate responsibility report <strong>2008</strong>/<strong>2009</strong>The art of engineeringPowered to perform <strong>2008</strong>/09COPYRIGHT AND LEGAL NOTICE Copyright in all published material including photographs, drawings and images in this publication remains vestedin Aker Solutions and third party contributors to this publication as appropriate. Accordingly, neither the whole nor any part of this publication can bereproduced in any form without express prior permission. Articles and opinions appearing in this publication do not necessarily represent the views ofAker Solutions. While all steps have been taken to ensure the accuracy of the published contents, Aker Solutions does not accept any responsibility forany errors or resulting loss or damage whatsoever caused and readers have the responsibility to thoroughly check these aspects for themselves.Enquiries about reproduction of content from this publication should be directed to Aker Solutions ASA.140Aker Solutions annual report <strong>2008</strong>
NotesAker Solutions annual report <strong>2008</strong> 141
Notes142Aker Solutions annual report <strong>2008</strong>
<strong>Annual</strong> report <strong>2007</strong>
Innovation throughgenerationsAker <strong>Kvaerner</strong> is an Aker company.Shared values and an innovative spirit are long-standingtraditions that forge active industrial development.People create Aker companies. Ever sinceAker was established in 1841, innovationand commitment drive us. Several Akercompanies have roots that date back tothe 1700’s – to the industrial revolution inGreat Britain and the Nordic countries.Aker has a long history of industrialinnovation. In recent decades, Aker companieshave strengthened their marketposition as preferred partners in globalgrowth markets: energy resources, energytechnologies, maritime technologies,seafood, and marine biotechnology.Aker is an active industrial holdingcompany. Aker companies are developedand strengthened through organic growth,acquisitions, restructuring and focusingof businesses.People who are willing to take onchallenges and have the ability to deliverinnovative solutions constitute Aker’sheritage. Aker’s generations of dedicationand know-how, combined with today’stechnologies and tools, yield tomorrow’sproducts, services, and industrialsolutions.Aker companies, with a total of27 100 employees on fi ve continents,had <strong>2007</strong> operating revenues totalingNOK 62 billion.Aker Kværner ASAAker ExplorationAker Floating ProductionAker DrillingA leading supplier to theenergy sector worldwideInnovative, technology-drivenoffshore exploration companyOwns, operates, and chartersFPSO vesselsOperator of the world’s two mostadvanced drilling rigsAker Oilfield ServicesAker DOF SupplyAker American ShippingAker Philadelphia ShipyardSubsea well maintenance andintervention specialistsShipowner building a fleet ofanchor handling vesselsPremiere US shipowner for productand shuttle tankersThe most modern and costeffectiveUS shipyardAker SeafoodsAker BioMarineAker Clean CarbonAkerSeafood company that harvests,processes, and sells white fishBiotechnology company that developshigh-value products from krillPioneering CO 2 capture technologywith patented solutionActive industrial owner – createsand develops companies
Aker <strong>Kvaerner</strong>:Historical factsAker <strong>Kvaerner</strong> delivers engineering, construction,manufacturing, technology products, maintenance andother specialised services, often as total solutions forcomplete projects.Global scaleAker <strong>Kvaerner</strong> has annual revenues totalling approximately NOK 58billion and employs almost 33 000 individuals worldwide, with morethan 24 000 direct employees and approximately 9 000 hired-in. Wehave offices in around 30 countries worldwide with global headquartersat Fornebu near Oslo, Norway.Markets and customersAker <strong>Kvaerner</strong> delivers products, services and solutions to customersworldwide in the oil and gas, refining, chemicals, metals and otherprocess industries, mining, nuclear and power generation. The majorityof our customers are companies in the energy and process industries.Our deliveries enable our customers to build, efficiently operate andeffectively maintain their facilities. Examples include complete offshoreplatforms for oil and gas projects and onshore petrochemicalplants.OwnershipAker <strong>Kvaerner</strong> is part of Aker (www.akerasa.com) and was listed onthe Oslo Stock Exchange in 2004 (ticker: AKVER). The largest shareholder is Aker Holding AS with a 40.27 percent stake in the company.Aker Holding is owned by Aker ASA (60 percent), the NorwegianGovernment (30 percent), SAAB AB (7.5 percent) and Investor AB(2.5 percent).The companies brought together to createAker <strong>Kvaerner</strong> were established in the fi rsthalf of the 19th Century, during the IndustrialRevolution. Cutting-edge technology andengineering providers from the very beginning,they delivered products includingsteam engines for rail and marine use and arange of industrial ironworks.Over the next 100 years, the businessesgrew significantly. In the mid-1900’s, bothAker and <strong>Kvaerner</strong> were international corporationswith activities in ship building, waterpower, wood processing and other processoperations, mechanical workshops and otherindustries.Through the 1970’s, 80’s and 90’s, theydeveloped their capabilities and experienceas suppliers of complete solutions to offshoreand onshore oil and gas and processingprojects. They each grew – organically andthrough international acquisitions – to beleaders in their markets.On 11 March 2002, the former <strong>Kvaerner</strong>group and the Aker Maritime group(comprising the oil and gas activities of thewider Aker group) were merged, and startedto operate as one company under the name<strong>Kvaerner</strong>.On 29 March 2004, following a restructuringof both Aker and <strong>Kvaerner</strong>, today’s Aker<strong>Kvaerner</strong> was established.
About us and our goalsHighlights <strong>2007</strong>ContentsAbout us and our goals5 Key fi gures6 Goals and strategies8 Our values10 Letter from the President & CEOOur business12 Business Areas14 Field Development16Maintenance, Modificationsand Operations18 Subsea20 Products & Technologies22 Process & ConstructionOur performance26 Board of Directors’ report38 <strong>Annual</strong> accounts78 <strong>Annual</strong> accounts – parent company86 Auditor’s report88 Share and shareholder information92 Analytical informationOur organisation and governance94 Corporate governance96 Board of Directors98 Executive Management Team100 AddressFinancial Calendar <strong>2008</strong>14 February 4th quarter and preliminaryannual results <strong>2007</strong>3 April <strong>Annual</strong> General Meeting <strong>2008</strong>24 April 1st quarter results <strong>2008</strong>31 July 2nd quarter results <strong>2008</strong>23 October 3rd quarter results <strong>2008</strong>27 November Capital Markets DayBest year everFull year consolidated revenues of NOK 57 957 million represented an increase of 15 percent comparedto 2006. This increase was due mainly to good markets and high activity in all business areas.EBITDA of NOK 3 913 million for the year showed an increase of 36 percent from NOK 2 872 million in2006, which gave a margin increase from 5.7 percent to 6.8 percent. Net profit for the year was NOK2 464 million, giving earnings per share of NOK 8.84.New global operating modelTo further strengthen our offering and become more transparent to the market, we have optimised ouroperations by transforming our existing structure into five focused business areas with truly globalscope. Bringing together specialised units serving the same market segments enhances knowledgesharing and enables more effective use of our total resources. The change supports the company’sstated objective of further profitable growth.Improvement programmesTo strengthen our competitiveness, we have initiated multiple improvement programmes includingsupply management enhancement, legal structure simplification, tax optimisation and overheadrestructuring. These programmes share the common ambition of driving down our cost base, savingmore than NOK 1 billion over the next two to three years.Strategic ownership of Aker <strong>Kvaerner</strong>In June Aker ASA, Wallenberg-related companies and the Norwegian Government entered into agreementsproviding long term strategic ownership for Aker <strong>Kvaerner</strong>. Under the agreements, Aker transferred its 40.1percent ownership interest in Aker <strong>Kvaerner</strong> to the newly established company Aker Holding. Aker holds acontrolling 60 percent stake in Aker Holding. The Norwegian Government owns 30 percent and the Swedishcompanies SAAB AB and Investor AB own 7.5 percent and 2.5 percent respectively.Ormen Lange and Snøhvit projects completedOn 6 October, gas production commenced from the Ormen Lange gas field, 120 km into the North Sea.Aker <strong>Kvaerner</strong> was the main contractor for the large onshore processing facility which was developed withan innovative “subsea-to-shore” concept. The terminal was Norway’s largest construction site, employingat one time over 11 000 people from more than 50 nations. On 13 September, after five years of development,StatoilHydro commenced production of liquefied natural gas (LNG) at Hammerfest, as the world’smost northerly gas liquefaction plant came on stream. The plant serves the Snøhvit field, which is the firstoffshore development in the Barents Sea. Aker <strong>Kvaerner</strong> was the main installation contractor for the plant.High-tech manufacturing centre openedAker <strong>Kvaerner</strong>’s integrated subsea oil and gas centre in Malaysia was officially opened in June. Locatedin Port Klang Free Zone, Pulau Indah, this purpose-built manufacturing centre, with a total investmentvalue of USD 100 million, is the fi rst of its kind in the world.Aker <strong>Kvaerner</strong> acquires drilling technology companyIn August, Aker <strong>Kvaerner</strong> signed an agreement for the acquisition of 50 percent of the shares in theGerman company Wirth GmbH, with an option to buy the remaining shares over the next few years.Wirth is a quality supplier of drilling equipment and has been one of Aker <strong>Kvaerner</strong>’s key suppliers formore than twenty years.Contract awardsAker <strong>Kvaerner</strong> was awarded several important contracts in <strong>2007</strong>. Among these were the Skarv EPcmacontract for BP with a contract value of NOK 2 billion; the Longview project for Genpower Holdings witha contract value of USD 654 million; process technology to Aker Floating Production with a contractvalue of NOK 430 million; a complete subsea production system to Reliance Industries worth approximatelyUSD 250 million; and the Valhall redevelopment of steel structure for BP with a contract value ofNOK 450 million. In addition drilling equipment contracts worth in total approximately NOK 6 billion andseveral frame agreements were awarded. The total order intake in <strong>2007</strong> was NOK 58.3 billion.4Aker <strong>Kvaerner</strong> annual report <strong>2007</strong>
About us and our goalsKey fi guresOrders and results <strong>2007</strong> 2006 2005Order backlog 31.12 NOK mill. 58 261 59 695 48 522Order intake NOK mill. 57 942 62 271 51 937Operating revenues NOK mill. 57 957 50 592 36 940EBITDA NOK mill. 3 913 2 872 1 816EBITDA margin Percent 6.8 5.7 4.9Net profit from continuing operations NOK mill. 2 464 1 294 1 052Cash fl ow <strong>2007</strong> 2006 2005Cash flow from operational activities NOK mill. 2 675 2 636 3 674Balance sheet <strong>2007</strong> 2006 2005Interest bearing debt NOK mill. 2 022 2 126 5 279 1)Equity ratio Percent 25.5 25.8 16.5Return on equity Percent 46.6 30.1 24.5Return on capital employed Percent 38.4 29.7 13.7Share <strong>2007</strong> 2006 2005Share price 31.12 2) NOK 144.5 155.6 82.9Dividends per share 2) NOK 3.00 8.00 1.00Earnings per share continuing operations 2) NOK 8.84 4.53 4.47Employees <strong>2007</strong> 2006 2005Employees 31.12 Full time equivalents 24 427 22 722 18 324HSE <strong>2007</strong> 2006 2005Lost time incident frequency Per million worked hours 0.68 1.0 1.31) Incl. subordinated loan. 2) Adjusted for share split.Operating revenuesAmounts in NOK millionEBITDAAmounts in NOK millionOrder intakeAmounts in NOK millionOrder backlogAmounts in NOK million10 39316 38174689114 24212 12410 92315 69512 3539 8519 74495996053010 7338 42212 37711 5<strong>2010</strong> 68310 951■ Field Development■ MMO■ Subsea■ P&T■ P&C■ Field Development■ MMO■ Subsea■ P&T■ P&C■ Field Development■ MMO■ Subsea■ P&T■ P&C■ Field Development■ MMO■ Subsea■ P&T■ P&CAker <strong>Kvaerner</strong> annual report <strong>2007</strong> 5
About us and our goalsGoals and strategiesThe preferredpartner6Aker <strong>Kvaerner</strong> annual report <strong>2007</strong>
About us and our goalsGoals and strategiesGoals and strategiesTo deliver on our strategy Aker <strong>Kvaerner</strong> will:Drive HSE improvementContinue to develop our Just Care culture through increased awareness, training, auditing and sharing of bestpractice, engaging with all stakeholdersStrengthen technology leadershipContinue to develop leading technologies within subsea, drilling equipment, well services, LNG, concrete andfloating structures and downstream processingAcquire companies and enter into partnerships that fi ll technology gaps or supplement our product portfolioApply Aker <strong>Kvaerner</strong> technologies and competence to develop environmentally sustainable solutions, e.g. withincarbon capture and sequestration (CCS) and offshore wind energyIncrease global presenceStrengthen leading position in the North Sea and in Arctic regionsExpand product offering in selected markets including Asia, West Africa, Brazil and Gulf of MexicoExpand value-added products and services offeringLeverage our comprehensive offering across the entire value chain to enhance our competitive advantageFurther capitalise on our partnering activities with other Aker companies to meet new market opportunitiesGenerate new service concepts to expand our offering to new and existing customersOptimise use of resourcesDevelop resources to secure fl exible capacity and cost baseSelect, bid and execute the right projectsBe the preferred employer in our chosen marketsDeliver on improvement programmesContinue to roll out commodity-based supply management using best value sourcingReduce cost base by focusing on working capital, taxation and overheadsConvert risk to profit through full utilisation of Aker <strong>Kvaerner</strong>’s Project Execution ModelAker <strong>Kvaerner</strong> annual report <strong>2007</strong> 7
About us and our goalsOur valuesUnity and commitmentAker <strong>Kvaerner</strong>’s business activities build on oursix corporate values, which are shared by Akercompanies worldwide.Our employees’ dedication and know-how allow us to deliver on ourcommitments to customers, employees, and the communities in whichwe work.The values that we share have a long history. They originated amongAker companies, and have steadily evolved over time, always reflectingthe work of the generations at Aker.Although the companies that comprise Aker generally engage indistinctly different businesses, they share many common culturalfeatures. Aker’s six core values are the nucleus of comprehensive,long term efforts that ensure the companies’ vitality in tomorrow’sconditions. How the various Aker companies achieve their growth andprofitability is no less important than the achievements themselves.Aker <strong>Kvaerner</strong>’s corporate values lend support and guidance in dayto-daypriorities and decision-making. Acting in accordance with ourcorporate values promotes sound action and reinforces Aker <strong>Kvaerner</strong>’slong term relations with its many and varied stakeholders.An effective corporate culture must remain dynamic and responsive.Thus, it is with a combination of humility and pragmatism that Aker<strong>Kvaerner</strong> works to strengthen and cultivate its shared values.Solid values are the foundation that enables Aker <strong>Kvaerner</strong> to achievesustainable, long term industrial development. People who “speak thesame language” cooperate more easily.At the annual Operating Managers Conference, we gather 200 executivesfrom around the world to set the direction and align the organisation todrive execution on our strategy for continued profitable growth.Aker <strong>Kvaerner</strong> – Our values in contextWe take personal responsibility forHSE because we careAll incidents can be prevented. We strivecontinuously for zero accidents to personnel,material and non-material assets.We focus on employee health and oncontinuously improving the work environment.We conduct our operations through efficientuse of materials and energy, with minimumwaste and damage to the environment.We design products and services to haveno undue environmental impact, to be safeand to be efficient in consuming energy andnatural resources. We seek to ensure that ourproducts can be recycled or disposed ofsafely.We deliver consistently and striveto beat our goalsWhen doing a job, we understand both therisks and opportunities involved and knowhow to manage them. We take pride in deliveringas we promise.Making money creates new opportunitiesand the resources for going forward, bothfor us and for our customers and partners.Commercial edge benefits us all.We reward performance – what youachieve – and alignment with our values –how you behave.Building customer trust is key toour businessAfter all, without customer trust and satisfaction,the rest doesn’t matter.Good customer references build ourreputation – and the only way to achieve thisis by consistent and predictable performance.Our customers will recognise us for our globalexecution excellence.We fi nd new ways, always linked to realcustomer needs and business priorities.8Aker <strong>Kvaerner</strong> annual report <strong>2007</strong>
About us and our goalsOur valuesOur valuesHSE mindsetWe take personal responsibilityfor HSE because we careDelivering resultsWe deliver consistently and striveto beat our goalsCustomer driveBuilding customer trust is key toour businessPeople and teamsAll our major achievements areteam effortsHands-on managementWe know our business and getthings doneOpen and direct dialogueWe encourage early and honestcommunicationAll our major achievements areteam effortsIn the end, it comes down to the talent andmotivation of you and me. Delivering strongresults is impossible without a highly capableworkforce.We learn on the job, through challengingtasks, coaching and training.Development of people and teams in ourcompany has one purpose – to create afoundation for long term sustainable valuecreation through efficient project executionand sound business operation.We respect and encourage diversity andbuild strong, energised and effective teams– and we have fun together, making us evenbetter.Our goal is to be the preferred employerin our industry.We know our business and getthings doneOnce decisions are made we combine allour efforts and focus all our energies onexecution.We are accountable and solutionsoriented,focusing on the right details at theright time. We follow through and ensureaccountability.We believe in empowering people closeto the action to take responsibility. Hands-ondoes not mean hands-in.We stimulate entrepreneurship andchallenge bureaucracy, complicated hierarchiesand “silo” mentality. We are OneAker <strong>Kvaerner</strong>.We encourage early and honestcommunicationWe listen hard and talk straight – no sugarcoating, no fi lters.We value early, accurate and reliablecommunication – after all, the first problemwe encounter is usually the easiest one tocope with.We challenge each other. The best decisionsare taken when different opinions anddifferent cultures meet in open and directdialogue.We expect the highest standards ofethical behaviour and integrity – from all ofus, everywhere.Aker <strong>Kvaerner</strong> annual report <strong>2007</strong> 9
About us and our goalsLetter from the President & CEO10Aker <strong>Kvaerner</strong> annual report <strong>2007</strong>
About us and our goalsLetter from the President & CEOIt has been another record setting yearStrong fi nancial performance, successful delivery of key projects, majorproject wins and a safer working environment characterise <strong>2007</strong>.An overall improvement in our Health, Safetyand Environment (HSE) performance – hasmade our company a safer place to work.This result is attributed to the ever increasingnumber of our people being trained in HSEregulations and practices as part of thecontinuing development of our Just Careculture.To date, Aker <strong>Kvaerner</strong> is a company withmore than 24 000 employees and NOK 58billion in revenues. Our positive profit performancehas enabled the Board of Directorsto propose a NOK 3 per share ordinarydividend payment for <strong>2007</strong>.We have a workforce made up of bothpermanent employees and hired-in personnelthat totals 33 000 people worldwide. We areproud to be a company that is repeatedlyrecognised as an attractive employer in internationalthird party rankings. This is reflectedin our ability to attract talent in a challengingemployment market.In April, we restructured the company tostreamline our operations into fi ve businessareas with global responsibilities. We alsoappointed country managers with responsibilityfor key regions. The new structure isdesigned to better align the global resourcesand expertise we offer to the market.As part of our continuous push for operationalimprovement, we initiated a detailedreview of all of our core processes and for“staff functions” earlier this year. To date theresults of this improvement process are veryencouraging, and it will be continued in<strong>2008</strong>.In June <strong>2007</strong>, Aker ASA announced thetransfer of its 40.1 percent ownership interestin Aker <strong>Kvaerner</strong> to the newly establishedcompany Aker Holding AS. Aker holds a controlling,60 percent stake in Aker Holding.The Norwegian Government now owns 30percent of Aker Holding, the Swedish technologycompany SAAB AB owns 7.5 percent,and the Swedish investment company InvestorAB holds 2.5 percent. Aker and the NorwegianGovernment have a common understandingand a mutual commitment to holdtheir shares in Aker Holding for at least tenyears. This agreement secures our companya strong platform for continuing our profitablegrowth strategy.In <strong>2007</strong> we delivered on some of thelargest and most complex projects we haveever undertaken, most notably StatoilHydro’sSnøhvit and Ormen Lange. We also continuedto win significant contracts, securing ahealthy order backlog going forward.We opened a new high-tech subsea manufacturingcentre in Malaysia, and conducted astate-of-the-art upgrade of our subsea engineeringand manufacturing facilities at Tranby inNorway. We also invested in a purpose-builtaftermarket facility in Houston.During the year we won multiple technologyawards, encouraging us to continue ourinvestments in clearly identified technologyniches where we differentiate ourselves fromthe competition. At the same time we willcontinue to look for acquisitions that strengthenour technology offering.There is an increasing concern about globalwarming and the need for measures tolimit emissions of greenhouse gases. Werecognise that, as a large international companyand a supplier to producers of fossilfuels, our commitment to addressing theseenvironmental dilemmas is more importantthan ever.During <strong>2007</strong>, we invested in a new pilotfacility based on our Just Catch technology,a world leading concept for CO 2capture. Wehave also formed a joint venture with Prajunder the name BioCnergy to become theleader in the European biofuels market.These are just two examples of our environmentalinitiatives.In September, we conducted our PeopleSurvey. This survey is designed to measurehow well we live up to our values in our everydayoperations. Over 90 percent of employeesresponded. The input from this surveywill for the basis for improvements that will beimplemented through <strong>2008</strong>–<strong>2009</strong>.On behalf of all Aker companies, a NOK1 million donation was made to the Red Crossto assist in their disaster relief programmesaround the world. At the same time, we werepleased to announce the signing of a strategicthree year partnership agreement with theNorwegian Red Cross. The partnershipencompasses fi nancial support, exchangeof expertise and volunteerism, and is in effecton a global basis from January <strong>2008</strong>.”We have a world ofopportunities. Thechallenge is to selectthe right ones and todeliver consistently, onbudget, on scheduleand with the rightquality. ”Our markets continue to show positivegrowth in demand. We have a world of opportunities.The challenge is to select the rightones and to deliver consistently, on budget,on schedule and with the right quality.In January <strong>2008</strong>, it was announced that Iam to accept a new role in Aker ASA, andthat the nomination committee would proposemy candidacy as the new Chairman of theBoard of Aker <strong>Kvaerner</strong>. I will go on to spendmore than 50 percent of my time togetherwith the new President & CEO Simen Lieunghand his team to further develop the companyand to explore cross-business opportunitieswithin the Aker family of companies.Best regards,Aker Kværner ASAMartinus BrandalPresident & CEOAker <strong>Kvaerner</strong> annual report <strong>2007</strong> 11
Our businessBusiness Areas12Aker <strong>Kvaerner</strong> annual report <strong>2007</strong>
Our businessBusiness AreasField DevelopmentA leading global provider of services – from studies, through front-end engineeringdesign to full turn-key engineering, procurement and construction (EPC) projectexecution – for fi xed and floating offshore platforms, LNG terminals, and onshoreoil and gas facilities.Page 14 – 15Maintenance, Modifications and OperationsA leading global provider of maintenance, modifications and operations (MMO)services to operators of offshore platforms and onshore oil and gas facilities – fromconcept screening through engineering, procurement, construction and installation(EPCI) project execution and operational support to removal, decommissioning andrecycling of discarded offshore installations.Page 16 – 17SubseaA leading global provider of subsea systems, solutions and services for the oiland gas industry. Covering all aspects of subsea fi eld development for both newand existing fi elds – from individual activities and products to complete subseaproduction systems, and maintained for the complete life-of-field.Page 18 – 19Products & TechnologiesA leading global provider of specialised products and services to the upstream oiland gas industry, based on proprietary technology and know-how. Key deliverablesinclude advanced drilling equipment and systems, upstream processing technology,mooring systems, as well as loading and offloading technology. Other deliveriesinclude well intervention technology and services, marine operations and subseainstallations, and reservoir evaluation services.Page 20 – 21Process & ConstructionA leading global provider of management, design and construction services formajor projects spanning refining, petrochemical processing and bio refinery, metalsand mining, power generation, acid plants, and nuclear clean-up services. The fulllife cycle of services from initial concept through technology development, processtechnology application, design, procurement, construction, commissioning, operations,maintenance, modification and decommissioning.Page 22 – 23Aker <strong>Kvaerner</strong> annual report <strong>2007</strong> 13
Our businessField DevelopmentTechnology and projectexecution expertiseWith the world’s energy needs increasing sharply, oil companies areaiming to liberate new resources in deeper waters and in moredemanding climates. Aker <strong>Kvaerner</strong>’s Field Development (FD) businessarea is well positioned to tackle complex developments that make majordemands on the interaction between technology and project execution.Highlights <strong>2007</strong> Successful delivery of giant projectsOrmen Lange and Snøhvit to StatoilHydro Integration of topsides for the advancedAker H-6e rig for Aker Drilling Completion of concrete structure forAdriatic LNG terminal; topsideprogressing on scheduleRecord high turnoverThe Skarv EPcma contract covers detail engineeringand procurement work for the 16 000 ton FPSOtopsides as well as construction managementassistance to BP. On peak, the project will engageover 400 people from Aker <strong>Kvaerner</strong>.We service oil and gas field developments incarefully selected business segments. Ourservice offering includes concept development,preliminary studies, front-end engineering,detailed engineering, project management,procurement and fabrication as well asassembly and hook-up of modules, topsidesand complete platforms. Our core competencecovers: floating drilling rigs and productionplatforms fixed installations in concrete or steel gas liquefaction plants and regasificationterminals onshore receiving and processing terminalsDeliveries include complete value chains forgas technology including carbon capture,and tailored solutions for Arctic conditionsand ultra deepwaters. We are pursuing majorprojects in Norway, Russia, Kazakhstan, Gulfof Mexico and in the Asia-Pacific region,together with a number of studies and preliminaryprojects in these and other regions.Our main engineering and technology unit islocated in Oslo, together with our headquarters,and we have three offshore yardsat Verdal, Stord and Egersund in Norway. FDalso has units in the US, Russia, Kazakhstan,Australia and Malaysia. Turnover in <strong>2007</strong>totalled NOK 16 381 million and we engageapproximately 3 600 permanent and 2 700non-permanent employees.Our customers experience predictability,effective risk assessment and the assurancethat their projects are executed to the agreedlevel of quality, on schedule and to budget.That applies whether the work is done in Arcticareas, in ultra deepwaters or in othertough environments. The complexity of ourprojects, and the fact that they are often executedin challenging locations, makes it evenmore important to deliver on our health,safety and environmental commitment. Ourresults reflect our success.Combined with our responsible approach,our project management competence, engineeringexpertise, advanced technology andworld class fabrication has made us a preferredsupplier of complex oil and gasprojects worldwide.Strong in selected areasNational and international oil companies areconcentrating their exploration activities andnew developments in ever deeper watersand areas with more extreme climates. Thiscreates opportunities and highlights ourcompetitive edge in demanding regions. Risingactivity in climatically challenging areasand deepwater reflects expectations amongthe oil companies about long term trends inenergy prices.We pursue projects in the North and NorwegianSeas, the Norwegian and Russiansectors of the Barents Sea, the Atlantic offCanada, the Caspian Sea, the Sakhalinregion, Australia and the deepwater parts ofthe Gulf of Mexico. In Norway, we are numberone in our segment.We are the contractor of choice for robustfl oating production platforms for deepwaterworldwide and are solidly placed in concretetechnology, with unique experience gainedover many years in the North Sea. Today concretestructures have acquired a new relevance,not least in waters with harsh climatesand for LNG terminals. We also have specialistexpertise in offshore processing installationsand land-based plants, both for traditionaloil and gas operations and for LNGregasification.Supplies under pressureOur markets developed positively during<strong>2007</strong> and prospects are good, with a numberof interesting opportunities on the horizon inour key markets.Constraints in global fabrication capacityand in the supply of qualified labour continueto impact the market. We are working effectivelywith these challenges and are selectiveabout the exciting projects we take on.Exciting projectsDuring the first quarter, we secured the contractto construct the production platform forthe Valhall field south of Ekofisk. Our Verdalyard is responsible for this delivery. WorthNOK 450 million, the contract includes constructionof the jacket, transport to the fi eldand installation on the seabed. Peak staffing,planned for June <strong>2008</strong>, will involve some 300people.14Aker <strong>Kvaerner</strong> annual report <strong>2007</strong>
Our businessField DevelopmentThe Gjøa project has entered into thefabrication phase, and four yards inPoland, four in Norway and one in Russiawill fabricate steel structures and piping forthe platform’s topside. The topside will beassembled at Aker <strong>Kvaerner</strong> Stord.During <strong>2008</strong> Aker <strong>Kvaerner</strong> has performedengineering and procurement forStatoilHydros semisubmersible productionplatform Gjøa. At the end of the year almost800 people were involved in this project, 140of them were engineers doing detail piping,structure and outfitting steel design at Aker<strong>Kvaerner</strong> Powergas in Mumbai, India. Aker<strong>Kvaerner</strong> will deliver the Gjøa semisubmersibleto StatoilHydro late January <strong>2010</strong>.A letter of intent for the Kashagan hookupcontract, part of the Kashagan experimentalphase development, was awarded inthe second quarter to an unincorporatedconsortium of Aker <strong>Kvaerner</strong> and Ersai. Theclient is Agip KCO, and the early work activitiesfor the hook-up work, worth approximatelyUSD 157 million, started in April.In the third quarter, BP awarded us thecontract for detailed engineering services,procurement and construction managementassistance for a new fl oating production,storage and offloading (FPSO) unit. This productionfacility is intended for the Skarv fieldin the Norwegian Sea. Our scope of theproject is worth approximately NOK 2 billionand will involve more than 400 of our peopleat peak staffing. The fi eld is due to come onstream in the autumn of 2011.As in 2006, the now completed Snøhvitand Ormen Lange projects contributed to ahigh level of activity, as did other projectsincluding the construction of the two AkerH-6e drilling rigs for Aker Drilling. The hulland topsides for the fi rst of these units, AkerSpitsbergen, were mated at our Stord yard inNovember. The schedule for delivering thesetwo rigs has been extended to July <strong>2008</strong> andDecember <strong>2008</strong> respectively. The new timelineis caused by delays in work from subcontractorswith more subsequent carry-overwork to the later project phases, and alsothat the scope of our engineering has beenmore extensive than originally planned.We delivered Blind Faith for Chevron andwill deliver the Adriatic LNG terminal - to beinstalled off the Italian coast for ExxonMobiland its partners - in <strong>2008</strong>. For the Kashaganproject for Agip KCO, the fi rst of sevenbarges with process equipment was deliveredduring <strong>2007</strong>. The yards in Egersund,Norway and Astrakhan, Russia had high levelsof activity on this project. Aker <strong>Kvaerner</strong>is well positioned to win more contracts forthe development of Kashagan, one of theworld’s largest offshore oil fi elds.Good resultsWe enjoyed high activity in <strong>2007</strong>. Operatingrevenues were NOK 16 381 million, comparedwith NOK 16 125 million in 2006. This increasereflects activity levels which were high, especiallyas a result of work on Snøhvit and OrmenLange. EBITDA was NOK 891 million, comparedwith NOK 903 million in 2006.The EBITDA margin was 5.4 percent, comparedwith 5.6 percent the year before.Order intake during the year totalled NOK12 124 million, with a significant number ofsmall projects together with major awardsand a growing workload.As part of Aker <strong>Kvaerner</strong>’s focusedrestructuring in the spring of <strong>2007</strong>, Aker<strong>Kvaerner</strong> Powergas in India and the US engineeringservices unit were transferred fromFD to the new Process & Construction businessarea, while our engineering servicesunit in Malaysia was transferred to the Subseabusiness area.Goals for <strong>2008</strong>Our immediate goal is to extend our positionin our selected market segments. Our leadershipin Norway and the far north will bemaintained. Aker <strong>Kvaerner</strong>’s development asan attractive partner in Russia and the CaspianSea will be continued. We will strengthenour activities on the UK continental shelf andin the deepwater areas of the Gulf of Mexico.south-east Asia is another priority, where wewill build on our presence from the company’sbase in Perth, Australia.We will continue to strengthen our positionas a supplier of LNG installations. Inaddition we will maintain our commitment tocarbon capture.Strong markets in the Arctic and inthe gas value chainOur key markets are expected to remainstrong. The order backlog at 1 January <strong>2008</strong>of NOK 15 695 million consists of a numberof contracts with deliveries from <strong>2008</strong> to 2011and form a solid foundation for the future. Thecompletion of deliveries to Ormen Langeand Snøhvit will contribute to a somewhatlower level of activity in <strong>2008</strong> than in <strong>2007</strong>.Key fi gures Field Development <strong>2007</strong> 2006 2005Operating revenue NOK million 16 381 16 125 9 950EBITDA NOK million 891 903 530EBITDA margin Percent 5.4 5.6 5.3Order intake NOK million 12 124 17 140 18 546Order backlog (as of 31 December) NOK million 15 695 20 385 19 978Number of employees (as of 31 December) Man years 3 586 3 562 3 443Aker <strong>Kvaerner</strong> annual report <strong>2007</strong> 15
Our businessMaintenance, Modifications and OperationsThe thriving modificationsmarketAker <strong>Kvaerner</strong>’s Maintenance, Modifications and Operations (MMO)business area is a market leader in the North Sea. We are the only majorcontractor that has a presence in both the Norwegian and UK markets.With more than 30 years’ experience, we hold a unique market positionand are rapidly expanding internationally.Highlights <strong>2007</strong> Actively contributed to delivery of giantOrmen Lange onshore gas facilityStatfjord Late Life ready for gas exportFirst oil Buzzard, Dumbarton, BrendaAl Zaafarana operations contract in Egypt Delivered on Frigg field decommissioningmilestonesOrmen Lange onshore site, Norway. Installed andcompleted all electrical, instrumentation and telecommunicationssystems. Continuing through longtermcontract for maintenance and modification work.Our operations support and maintenancebusiness encompasses a wide range ofservices that supplement and support ourcustomers’ effective operation of installationsand infrastructure.Our core competencies are in: modifications project execution and tools operational expertise and technology shutdown planning and execution concept development and front-endengineering and design (FEED) studies maintenance planning and execution electrical, instrumentation and telecommunicationscontracting at offshore andland-based oil and gas facilities on-site operations and operational supportservices decommissioning, including subsequentre-use of parts, and material recyclingWe derive competitive advantage from beingin close proximity to our customers, particularlywith our operations in Norway atStavanger, Bergen, Trondheim and Kristiansund;in the UK at Aberdeen and Stockton; inSt John’s, Canada and in Houston, USA. Ourheadquarters are in Stavanger, and we havea second major hub in Aberdeen.We have prefabrication workshops inNorway at Hinna, Mongstad, Ågotnes, andKristiansund. We also have a facility at Stordfor recycling offshore installations.In <strong>2007</strong>, we delivered revenues ofNOK 9 744 million. We have approximately4 855 permanent and 1 078 non-permanentemployees.Increased value creationCarefully planned maintenance and improvedefficiency are two of the most important measuresfor increasing productivity and theproduction lifetime of offshore oil and gas infrastructureand land-based processing plants.Longer installation lifetimes, reduceddowntime and more efficient operations leadto greater value creation for customers. Ourlocal market presence and ability to deploythe resources required for large scaleprojects are a winning combination.Our strategy is to offer expert, intensiveand value creating services in our market.We have the knowledge, depth and breadthof experience to take on the largest of projects.We minimise downtime through well-plannedfacilities maintenance combined with unbeatableupgrading expertise. This significantlyreduces risk from operational interruptions,either scheduled or unforeseen.We continuously develop services with newtechnology that contribute to improved workingmethods and solutions. Examples includeinvestment in hydrocarbon trainingmaintenance training for complexoperationsintegrated operationssensor/wireless technologyrobotics (both subsea and topsides)and unmanned platformsIn our operation and management of theAH001 production platform in the North Sea,we are responsible for all formal approvalsas the appointed duty holder in the UK. Thisresponsibility attests to the expertise of ouroperations people. We also provide operationsservices on other UK continental shelfplatforms and, from our base in Egypt, forplatforms in the Red Sea.There are clear synergies between MMOand Aker <strong>Kvaerner</strong>’s Field Development(FD) business area. FD delivers offshoreplatforms which offer us significant potentialfor subsequent operations, maintenanceand decommissioning contracts. Servicingthe entire life cycle of facilities gives us aclear competitive advantage in our market.The growing MMO marketWe perform maintenance and modificationservices for oil and gas operators in the Norwegianand UK sectors of the North Sea. Wealso decommission, remove and dismantleoffshore installations. The combined marketfor these services is worth approximatelyNOK 19 billion per year.We are working to develop our marketshare, which is around 45 percent in Norway,20 percent in the UK, and growing in theinternational market.The overall market for our services grewsignificantly in <strong>2007</strong> thanks to rising energyprices. This was reflected in the postpone-16Aker <strong>Kvaerner</strong> annual report <strong>2007</strong>
Our businessMaintenance, Modifications and OperationsStatfjord Late Life, Norway. ModifiedStatfjord A&B from oil producer to gasproducer. Milestone ready for gasexport to UK achieved this autumn.ment of decommissioning projects, offset byincreases in the development of marginalfi elds, high investment in new fi eld developments,an increasing focus on fi eld life extensionprojects, and further modifications toaging infrastructure. At the same time, therising average age of installations in theNorth Sea has led to greater demand formaintenance services.One example of where life extension postponesdecommissioning is Statfjord Late Life,where the facility has changed from being anoil producer to be a gas producer.Continued high activity levelsWe developed our business very favourablyduring <strong>2007</strong>, with growth in revenues andsignificantly increased margins. We focusedon international expansion and establishmentin selected areas, principally Canada,the Caspian Sea and the Gulf of Mexico.Significant contract awards and achievementsincluded: Statfjord Late Life: ready for gas late<strong>2007</strong> Kashagan hook-up: letter of intent plusearly work agreement Engineering studies and projects capabilityexpanded across the North Seaand in Houston Al Zaafarana, Egypt: operation and maintenancecontract in Gulf of Suez Completion of significant project milestoneson Frigg decommissioning Husky White Rose: retained maintenancecontract and gained engineering, fi elddevelopment and subsea support Helped achieve first oil from Buzzard,Dumbarton and Brenda Continued LTI-free performance onHess AH001 and Nexen Scott/BuzzardassetsOur order intake of NOK 8 422 million wasexcellent. At year end <strong>2007</strong>, we had an orderbacklog of NOK 10 683 million.Operating revenues were NOK 9 744 million,compared with NOK 9 677 million in2006. This increase reflects high oil prices,resulting in several projects for lifetime extensionof installations, development of smallersizedfields, and projects focusing on environmentalimprovements.EBITDA was NOK 530 million, comparedwith NOK 452 million in 2006, an increase ofNOK 78 million. EBITDA margin was 5.4 percent,compared with 4.7 percent the yearbefore.In this busy market, recruitment and retentionis a competitive challenge. We succeededin retaining employees and recruitingsome 500 new permanent employees.In April <strong>2007</strong>, Aker <strong>Kvaerner</strong> Geo wastransferred from MMO to Aker <strong>Kvaerner</strong>’sProducts & Technologies business area.<strong>2008</strong> - goals and objectivesOur goals for <strong>2008</strong> are to maintain our marketshare in the traditional MMO market in Norway,and to maintain and improve our UKmarket share. We will focus on growing inhigh margin and specialist technology niches.One such market niche is for engineeringstudies, where we will continue to develop,based on our successes in <strong>2007</strong>.We will continue to deliver our strategy forinternational growth in selected regions – e.g.Canada, the Caspian Sea and the Gulf ofMexico – and will capitalise on synergiesacross Aker <strong>Kvaerner</strong>.We will be a preferred partner to our customersand a preferred employer to bothexisting and potential employees.Outlook for <strong>2008</strong>High energy prices and high industry activitylevels are expected to continue, leading tofurther fi eld life extensions and marginal fielddevelopments.Tendering levels will remain high, particularlyfor “late life” modifications and similarlife extension projects, and for the engineeringstudies that are often the precursors tothis type of work. We are ideally positionedfor both.The international market for our MMOservices is expected to demonstrate sustainedand significant growth. Our marketshare will remain strong.Key fi gures Maintenance, Modifications and Operations <strong>2007</strong> 2006 2005Operating revenue NOK million 9 744 9 677 7 355EBITDA NOK million 530 452 279EBITDA margin Percent 5.4 4.7 3.8Order intake NOK million 8 422 9 933 9 777Order backlog (as of 31 December) NOK million 10 683 12 245 12 028Number of employees (as of 31 December) Man years 4 855 5 187 4 655Aker <strong>Kvaerner</strong> annual report <strong>2007</strong> 17
Our businessSubseaDeep impactAker <strong>Kvaerner</strong>’s subsea business area (Subsea) has grown to become akey player in the fast expanding global subsea market. The only supplierin the world that can manufacture and deliver a complete subsea productionsystem including umbilicals, we are well positioned for further growth.Highlights <strong>2007</strong> Record high revenue, EBITDA andEBITDA margin Opened new high-tech manufacturingcentre in Malaysia, the world’s only “onestop shop” for production of completesubsea systems Established long term frame agreementwith StatoilHydro for delivery of subseaproduction systems and relatedaftermarket services Technology breakthroughs withMultiBooster at BP’s King fi eld andentry into the subsea power cable market USD 300 million subsea system contracton the Indian continental shelf signedwith Reliance IndustriesAker <strong>Kvaerner</strong>: The world’s no. 1 supplier of steeltube umbilicals.As a full lifecycle provider of subsea productsand systems, from front-end studies toaftermarket support, we manufacture anddeliver the following products and servicesboth as complete engineering, procurementand construction (EPC) deliveries and standaloneproducts: subsea production systems, includingsubsea trees subsea control systems template and manifold systems umbilicals: fl exible fl owlines for tie-in ofsubsea production systems subsea processing and boosting technology,including subsea gas compression,processing systems, multi-phasepumps, water and gas injection deepwater drilling riser systems tie-in systems surface wellheads aftermarket servicesWe are a global business area with 3 673permanent and 1 375 non-permanent employeesbased in 23 locations around the world.Awarded global ISO 9001:2000 quality certification,we work on projects worldwide, throughone global organisation and a single businessmodel, using common systems.Our headquarters are in Oslo, Norway.Manufacturing facilities are located in Mossand Tranby, Norway; Curitiba and Rio dasOstras, Brazil; Port Klang, Malaysia; Aberdeen,UK; Mobile, Alabama, US; and Batam,Indonesia. A global network of service basessecures quality aftermarket support.In <strong>2007</strong>, we had operating revenues ofNOK 9 851 million, an increase of 42 percentcompared to 2006.Complete subsea solutionsOver several decades we have developedunbeatable know-how in subsea oil and gasdevelopments. Our ability to manufactureand deliver complete subsea production systems,including umbilicals, is unrivalled in themarketplace.Our reputation as a complete system providerwas further strengthened in <strong>2007</strong> withthe opening of a new high-tech manufacturingcentre in Port Klang, Malaysia. This centre,built in record time, is the world’s only“one stop shop” for the production of completesubsea systems.Over the past 20 years, we have developeda strong market position in processingand boosting technologies which increaseoil and gas recovery and life-of-field fromwells with declining production rates. Thisposition was highlighted this year with thesuccessful start-up of two MultiBoosterpumps at BP’s King field in the Gulf of Mexicoand the installation of a SeaBoosterseawater injection system at StatoilHydro’sTyrihans field.A significant proportion of the world’sremaining oil and gas reserves is in demandingreservoir conditions. Aker <strong>Kvaerner</strong> isaddressing this by developing suitable technologiesfor these fi elds. For example, ourunique technology for high-pressures/hightemperatures(HPHT) received another accoladein <strong>2007</strong> when StatoilHydro chose us assupplier of a subsea production system forthe Morvin fi eld.Growth in all subsea segmentsThe global subsea market grew significantlyin <strong>2007</strong>. The key driver behind this growth isthe high price of oil, itself driven by the dramaticincrease in energy consumption, particularlyin fast-developing countries such asIndia and China.Total investment in subsea hardware – ourcore business – increased by 60 percent comparedto 2006, to NOK 30 billion. Market analystspredict that growth will continue over thecoming years, at an annual rate of approximately20 percent. Strong growth in new-buildsof deepwater drilling units has also resulted ina high order intake for deepwater drilling risers,a product we began offering out of our newfacility in Malaysia and shortly Brazil.The global umbilical market had a solidyear. According to Quest Offshore, we werethe world’s leading manufacturer of steeltube umbilicals in <strong>2007</strong>, with a market shareof 40 percent in km.High activity levels<strong>2007</strong> was an excellent year for us, with ourbest ever revenues of NOK 9 851 million, anda record high EBITDA of NOK 960 million.18Aker <strong>Kvaerner</strong> annual report <strong>2007</strong>
Our businessSubseaThe high-tech manufacturing centrein Malaysia is the world’s only”one stop shop” for production ofcomplete subsea systems.Among key contracts awarded in <strong>2007</strong>were the USD 300 million subsea systemcontract signed with Reliance Industries’MA-D6 project, and the 5+2+2 year frameagreement with StatoilHydro for delivery ofsubsea production systems and relatedaftermarket services.The USD 90 million deal to deliver threesubsea manifolds to Petrobras of Brazil, theumbilical frame agreement with Australia’sWoodside Petroleum, a fi rst step into theChinese drilling riser market through a contractwith CNOOC, and entry into the subseapower cable market through a USD 65 millioncontract also with Petrobras, are other milestoneawards. At year end <strong>2007</strong>, our orderbacklog stood at a record high NOK 10 951million, an 25 percent increase over 2006.<strong>2007</strong> also saw significant investment inupgrading our manufacturing and servicefacilities around the world. Our new Houston-basedcentre for assembly, testing andaftermarket activity in the Gulf of Mexicowas opened in April. A NOK 65 millionupgrade of our facility in Tranby, Norway,made it one of the most efficient subsea treeand pump manufacturing sites in the world.Additionally, our USD 100 million high-techmanufacturing centre in Malaysia was officiallyopened in June. These investments willprovide a sound basis for our future growth.Another important development was ourestablishment, together with Aker and DOFSubsea, of Aker Oilfield Services, a providerof subsea light well intervention services.The acquisition of Phoenix Polymers InternationalLtd, a manufacturer of buoyancy productsfor the oil and gas industry and supplierof floatation elements to our drilling risers,was also strategically important.This was a year for key deliveries, such asfi rst oil through the subsea system at theKikeh field, the fi rst deepwater project inMalaysia, and the technology breakthroughof the MultiBooster at BP’s King fi eld. Deliveriesto Reliance Industries’ giant projects onthe Indian continental shelf have been – andstill are – a key focus area.<strong>2008</strong> GoalsOne of our key objectives for <strong>2008</strong> and beyondis to continue the expansion of ourstrong global position, partly by leveragingthe manufacturing centre in Malaysia to becomethe number one subsea supplier in theAsia-Pacific region. We will continue to developtechnology in selected areas, particularlywithin increased oil recovery (IOR),where we already hold a pioneering position.Increasing service revenue is another keygoal. This will be met by growth in theinstalled base and through planned investmentsinto our existing aftermarket facilitiesin Ågotnes, Norway and Perth, Australia, aswell as the opening of a new facility in Kakinada,India.Continuing to contribute to Aker <strong>Kvaerner</strong>’sdeliveries across the entire oil and gas valuechain, as well as working with other companiesin the wider Aker family, will remain astrategy for success, as will improving marginsthrough increasingly cost-efficientsupply chain management with best valuesourcing.Continuous growthHigh oil prices and market activity levels areexpected to continue. Market analysts suggestthat all subsea markets will continue togrow in the coming years, with a strong increasein the Asia-Pacific and West Africa regions.Construction activity for deepwater drillingunits is predicted to remain high. As aresult, we will open a new production facilityfor deepwater drilling risers in Rio das Ostras,Brazil in <strong>2008</strong>.An increasing number of subsea developmentswill move into deeper waters, withsubsequently longer step-outs. This trend willcontinue to drive demand for subsea supportinfrastructure such as umbilicals.We are enjoying high tendering and biddingactivity at the start of <strong>2008</strong>, and the marketoutlook remains positive. We will not, however,lose focus on the safe, on-time deliveryof our existing solid order backlog.Key fi gures Subsea <strong>2007</strong> 2006 2005Operating revenue NOK million 9 851 6 941 5 478EBITDA NOK million 960 479 339EBITDA margin Percent 9.8 6.9 6.2Order intake NOK million 12 377 11 747 6 394Order backlog (as of 31 December) NOK million 10 951 8 775 4 019Number of employees (as of 31 December) Man years 3 673 3 028 1 987Aker <strong>Kvaerner</strong> annual report <strong>2007</strong> 19
Our businessProducts & TechnologiesGrowth through innovativetechnologyThrough its Products & Technologies (P&T) business area, Aker <strong>Kvaerner</strong>holds a leading position in the drilling equipment, FPSO topsides andsub-surface market, delivering systems, equipment and services.Highlights <strong>2007</strong> Strong growth in all business segments,record high EBITDA Strategic investment in Wirth GmbH,a German quality provider of key drillingequipment Breakthrough in the Chinese offshoremarket and successful entrance into thedrillship market FPSO process modules delivered inrecord time to Aker Floating Production Successful introduction of “BOA SUB C”,a specialised construction vessel for ultradeepwater Winner of Offshore TechnologyConference (OTC) Spotlight on NewTechnology award with PowerTrac ® ConeCrusher, a highly innovative and efficientmethod for scale removal in oil and gaswells Market leading position gained forenvironmentally safe crude loadingtechnology for Arctic conditionsAker <strong>Kvaerner</strong>’s PowerTrac ® Cone Crusher providesa new solution for cost-efficient, safe and environmentallysound removal of scale from wells.P&T growth is driven by three key markets: Deepwater drilling• Drilling equipment and systems• Mooring systems Floating production• Mooring and offloading equipment• Upstream process technologies• Floater installation and subseaconstruction Increased oil recovery• Well intervention• Geological consulting and services• Process technology upgrades• Drilling equipment upgrade• Subsea tieback installationWe are a leading supplier of: Advanced drilling equipment andsystems Upstream processing technology Mooring systems and loading andoffloading technology Well intervention technology andservices Marine and subsea installation Reservoir evaluation servicesDeveloped for the demanding North Sea environment,most of our products, technologiesand services are now also exported to other oilproducing regions. Today more than two thirdsof our deliveries are outside the North Sea.We are a global business area with morethan 2 600 permanent and 800 non-permanentskilled employees worldwide. Our headquartersare in Norway while we have offices,service bases and production facilities in keyoil producing regions around the world.Our increasing installed base providessignificant service and after-sales potentialgoing forward.State-of-the art expertise andcompetitive advantagesA significant proportion of the world’s remainingoil and gas reserves are located atgreat water depths, in Arctic regions, and inreservoirs with demanding conditions suchas high temperatures and pressures. Advancedtechnologies and innovative solutionsfor increased oil recovery (IOR) are oftendecisive in exploiting identified reserves.We have state-of-the-art expertise, productsand technologies to address these challenges,holding a leading position in severalupstream technology segments includingadvanced drilling equipment systems, wellstream separation and process systems,mooring and offloading systems.Our marine operations segment hassecured full market and operational controlof two highly specialised construction vessels.With their high-tech specifications andsafety margins, these vessels are ideallysuited for operations in harsh marine environments.Extensive experience in the towingand installation of offshore fixed and fl oatingplatforms has helped us develop a safe, costeffectiveand patented technique for theinstallation of subsea structures, known asthe Pencil Buoy Method.Market conditionsFrom a market perspective, <strong>2007</strong> was yetanother positive year. All target segmentsdeveloped favourably. Contracts for 4 floatingdrilling units (i.e. semisubmersibles and drillships)were awarded and nearly 40 FPSO’swere under construction or on order at yearend<strong>2007</strong>. As a result the market for drillingequipment and systems, mooring equipment,processing systems and offloading unitsenjoyed high activity. With an increasingnumber of drilling rigs and floating productionunits entering the market, contracting of marineoperations and subsea installation services areexpected to develop positively.With increasing oil prices, the life of severalprojects in their “tail-end” productionphase has been extended. This has lead togrowing interest in our increased oil recovery(IOR) solutions, which include well interventionservices and technology.An excellent year<strong>2007</strong> was an excellent year with strong fi nancialperformance and growth opportunitiesfor all business segments.Key developments in <strong>2007</strong> included: theaward-winning PowerTrac ® Cone Crusher,20Aker <strong>Kvaerner</strong> annual report <strong>2007</strong>
Our businessProducts & Technologieswhich removes scale from oil wells, preventingblockages; the compact electrostaticcoalescer (CEC) process technology,which reduces water content in oil to as littleas 0.5 percent – particularly important inmore mature fields where the amount ofwater produced can be as high as 90 percent– and safe crude loading technology forArctic conditions, which transports oil fromthe FPSO to the shuttle tanker and allows foremergency releases with no oil spillage.We continue to take a major share of thestrong new-build market for deepwater drillingrigs and drillships. Key contracts awardedin <strong>2007</strong> included: China National Offshore OilCorporation (CNOOC), a breakthrough in theChinese offshore market; and two drillingequipment contracts awarded by DaewooShipbuilding & Marine Engineering Co. Ltd(DSME), one for a single drillship and one fora semisubmersible. An important achievementwithin the drilling equipment segmentwas the acquisition of 50 percent of theshares in German company Wirth GmbH,with an option to buy the remaining sharesover the next few years. Wirth’s technologycomplements our portfolio and is an excellentfit with our drilling equipment segment. Itwill increase the added value and servicepotential within this segment.We have been successful in the well interventionmarket.MajorcontractsontheNorwegianContinental Shelf (NCS) were entered into in<strong>2007</strong>, highlighting the strong home marketposition. As the number of horizontal wellsincreases significantly, both in Norway andworldwide, the outlook for our well interventiontechnologies and services is favourable. In<strong>2007</strong>, we successfully carried out our first wirelinetractor operation in the Gulf of Mexico.The PowerTrac ® Cone Crusher wasawarded the OTC Spotlight on New Technologyaward. This environmentally-friendlyinvention has enabled very cost-efficientscale removal in oil and gas well, deliveringsignificant business benefit for our clients.In <strong>2007</strong>, Aker <strong>Kvaerner</strong>’s geological consultingbusiness was transferred into the P&Tbusiness area. With this move, Aker <strong>Kvaerner</strong>has organised its sub-surface activities underone global business area. We see a clearpotential for growth in this segment.Our marine operations segment hassecured many important contracts in theNorth Sea and in the Gulf of Mexico. Theseinclude the installation of the Sevan HummingbirdFPSO on the UK continental shelf andfloater installation contracts with both Statoil-Hydro and BP Norway. With the delivery ofthe ultra deepwater multipurpose vessel BOASUB C, we have further strengthened ourposition in the offshore installation marketand are well positioned to install numerousfloaters under construction with this charteredsuperior vessel. It is currently operating inthe Gulf of Mexico.We have significant experience in theArctic and other harsh environments and area market leader in advanced offshore loadingequipment. We have taken a leadingposition in crude offloading technology. Thesystems for transferring oil from platform toshuttle tanker can function in extreme temperatures(down to - 50°C) and withstand anemergency release with no environmentalimpact. We delivered two such systems in<strong>2007</strong>, one for the Prirazlomnya field and oneto Lukoil’s Varenday loading terminal. Wehave also won a contract for the delivery ofmooring winches and fairleads for Statoil-Hydro’s Gjøa semisubmersible platform.Our process systems segment deliveredits first process module to Aker FloatingProduction in record time. This segment alsocompleted its fi rst two offshore SulphateRemoval Units (SRUs) for Petrobras’ FPSOP50 in Brazil and won other importantcontracts for the design and supply of oiland gas treatment packages. We haveestablished a strong position in topsideupstream process modules for the FPSOmarket.Operating revenues were NOK 12 353million, up 63 percent from NOK 7 572 millionin 2006. The strongest growth came with thedrilling equipment segment. EBITDA wasNOK 959 million, compared with NOK 531million in 2006, an increase of NOK 428 million.EBITDA margin was 7.8 percent, comparedwith 7.0 percent the year before. Order intakeamounted to NOK 10 733 million in <strong>2007</strong>.Goals for <strong>2008</strong>We have three target markets for growth inthe immediate future: deepwater drilling (drillingequipment and systems and mooringsystems); fl oating production units (mooringand offloading equipment, upstream processtechnologies and floater installations);and IOR through well intervention, processingtechnology upgrades and subsea tiebackinstallation. In IOR services, technologyis an integrated part of the offering, which isprovided under long term contracts. We willcontinue to improve and strengthen our positionin each of these growth markets both organicallyand through acquisitions.With a growing installed base of equipmentand technologies, our aim is to increasethe service and after-sales share of our operatingrevenues during <strong>2008</strong>. This will requirefurther strengthening of our service organisation.We will also expand our technologyportfolio to better meet the new challengesfacing the upstream oil and gas industry.The way forwardHigh energy prices and market activity levelsare expected to continue. All of our marketsegments are expected to remain strong, especiallywithin the drilling rig, floating productionand IOR segments. Several awardedcontracts, with deliveries in <strong>2008</strong> and later,form a solid foundation for further development.At year end <strong>2007</strong>, our order backlogamounted to NOK 11 520 million, with deliveriesthrough 2011.Key fi gures Products & Technologies <strong>2007</strong> 2006 2005Operating revenue NOK million 12 353 7 572 4 648EBITDA NOK million 959 531 336EBITDA margin Percent 7.8 7.0 7.2Order intake NOK million 10 733 12 997 9 290Order backlog (as of 31 December) NOK million 11 520 12 741 7 370Number of employees (as of 31 December) Man years 2 666 2 167 1 776Aker <strong>Kvaerner</strong> annual report <strong>2007</strong> 21
Our businessProcess & ConstructionCapitalising on growthmarketsAker <strong>Kvaerner</strong>’s Process & Construction business area (P&C) is a leadingprovider in the management, design and construction of major projectsacross refining, petrochemical processing and biorefinery, metals andmining, LNG, power generation, acid plants, nuclear clean-up servicesand water treatment.Highlights <strong>2007</strong> Strong growth – 37 percent increase inbacklogHealthy revenue increase 41 percent EBITDA growth – EBITDAmargin from 4.4 percent in 2006 to7.2 percent in <strong>2007</strong>Strong cash flow from operating activities USD 1.3 billion joint venture contract forUS power stationLaunch of BioCnergy joint ventureSan Cristobal silver-zinc mining project for ApexSilver – the largest EPCm project ever executed inBolivia incorporating state-of-the-art technology.Our success is founded upon a portfolio ofstrong local, yet globally-enabled businessunits. We have four global focus areas delivering:Metals and mining Studies, project management, engineering,procurement and construction (EPC),engineering, procurement and constructionmanagement (EPCm), commissioningand start-up services to mining andmineral processing companies operatingmainly in Australia and the Americas.ConstructionConstruction and global construction managementfor all of the market segments weserve.Process and bio-refinery Front-end engineering design (FEED) /EPC/EPCm projects with selected petrochemicalprocess technologies; theMiddle East is a key market. FEED/EPC for biorefineries; primaryfocus is Europe and the US. LNG FEED/EPC/EPCM projects forglobal re-gasification markets.Technology and services Technology and services spanningnuclear clean-up; water treatment;bleaching, chlor-alkali and acid plants;plus engineering facility services, primarilyin the UK and US. Specialised niche technology know-howacross some 50 licensor technologies. Own technology arm offering expertiseand know-how in the design, supply andoperation of various proprietary processsystems and plants.This is an integrated global enterprise withcore operations focused on Europe, theAmericas, Australia, China, India and theMiddle East. We have a fi rst class engineeringtalent-base of around 4 700 permanentand 5 300 non-permanent employees, ensuringconsiderable workforce flexibility and positioningthe business to manage the cyclicalworkload of our markets.Technology experienceLocal market presence and expertise inselected areas, backed up by extensiveworld-wide resources, have enabled us todevelop a strong market position in severalgeographical areas and technology niches.In petrochemicals, we have establishedsolid, long term relationships over manyyears with licensors of select niche technologiesfor the production of purified terephthalicacid (PTA), polypropylene (PP), polyethylene(PE), butanediol (BDO), acetic acidand others. As an example, we have played amajor role in the engineering, procurementand construction of 26 of the more than 100Univation UNIPOL PE reactor lines and athird of the Dow UNIPOL PP reactor lines,that are either in operation or under constructionaround the world.We have established BioCnergy, a jointventure with Indian group Praj Industries, aglobal leader in biofuels technology, toaddress biofuels opportunities in Europe.<strong>2007</strong> in briefWe delivered robust growth with an EBITDAincrease of 41 percent and an order backlogat year end <strong>2007</strong> of NOK 10.9 billion, 37 percentover the previous year. All four of ourglobal focus areas contributed to thisgrowth.We delivered a total of NOK 10.4 billion inoperating revenues in <strong>2007</strong>, down from NOK12.0 billion in 2006. The focus on improvingprofitability versus revenue growth over thelast three years yielded an EBITDA margin of7.2 percent in <strong>2007</strong>, up from 3.1 percent and4.4 percent in 2005 and 2006 respectively,and on a healthy NOK 1.2 billion in cash fl owfromoperatingactivities.We nowdemonstratea portfolio of strategically well positioned,profitable businesses in growth markets,ready to grow the top line. Our achievementsalso indicate that the refocusing of our business– bringing together Aker <strong>Kvaerner</strong>’senergy, process and related constructionactivities to achieve greater synergies andbetter resource utilisation – is paying off. Atthe same time, this has enabled us to capitaliseon a favourable investment environmentin the metals sector and in the power generationmarket in North America.22Aker <strong>Kvaerner</strong> annual report <strong>2007</strong>
Our businessProcess & ConstructionA strong, local operational presence hasproven effective in further strengthening ourposition in the global market. This compellingmodel for generating major local businessopportunities is successful in the Asia Pacificregion, from our operations in China andIndia, in our European markets and in theMiddle East.As an example, in Saudi Arabia, we areworking in a joint venture with SINOPEC on aworld-class polyolefins project for SaudiBasic Industries Corporation (SABIC) atYanbu. Work on this huge developmentstarted in 2005 and it is expected to come onstream in <strong>2008</strong>.India is a key engineering hub for all ofAker <strong>Kvaerner</strong>. Our operations deliver importantinput to many projects locally in India, inthe Middle East and, increasingly, worldwide.Contract highlights in <strong>2007</strong> As part of a consortium, we securedpivotal contracts for the engineering,supply of equipment and construction forthe Longview project, a supercritical pulverisedcoal-fired power generating facilityin USA. Our scope of work is valuedat approximately USD 654 million. A consortium comprising BP, AssociatedBritish Foods and DuPont awarded Bio-Cnergy a FEED study for a plannedworld-scale bioethanol plant in the UK. <strong>2007</strong> saw the successful conclusion ofour project for Zhejiang Hualian SunshinePetro-Chemical Co. for a new PTA plantin China. We secured further PTAprojects in Brazil and Portugal, cementingour position as the world’s mostexperienced contractor in the executionof projects utilising INVISTA technologyfor the production of PTA. These plantsrepresent approximately one fi fth of theworld’s PTA production capacity. Our success in China was further highlightedby securing the basic engineer-ing design and supply of equipment fora new PP plant for PetroChina GuangXiPetrochemical Company. We were alsoawarded a contract by ShenHua BaotouCoal Chemicals for a new PP and PEfacility at its coal chemical complex.Magnox Electric awarded us a nucleardecommissioning contract to design,build and install a plant for the retrievaland encapsulation of wet intermediatelevel wastes at the Hunterston A site inWest Kilbride, Scotland.British Nuclear Group awarded two contractsto the ACKtiv Nuclear joint venturecomprising Aker <strong>Kvaerner</strong>, Atkins andCarillion to support decommissioning atthe First Generation Magnox StoragePond, Sellafield in the UK.In the LNG market, where we are amongthe world leaders in terminal construction,the USD 680 million Gulf LNG EPCproject, along the US gulf coast, is beingmanaged from our Houston operations injoint venture with IHI.Looking aheadWe will enjoy further success in PTA, PE andPP, with a continuing focus on China and theMiddle East. China is expected to continueas the main driver for petrochemical processinvestment over the next several years, drivenby its burgeoning economy. Aker <strong>Kvaerner</strong>has established a sourcing hub in China andplans to substantially grow its local operationsover the next three to four years.Other active markets include Europe,where plant renewals are anticipated, andSouth America - notably Brazil - where interestin new projects is growing. In the US, therefining sector is starting to look to new plantafter a long period of flat investment.Our contract successes in the UK Nuclearsector in <strong>2007</strong>, coupled with the UK NuclearDecommissioning Authority’s continued investmentin clean-up and decommissioningsuggest a significant up-turn in investment.With the potential for a steady workflow tolast for many decades, combined with ourexcellent track record, we are very well positionedin nuclear clean-up.Our emphasis in metals and mining willremain on Australia and the Americas, wherethe major ore deposits are located. Despiteworldwide capacity challenges, we have astrong market position - in terms of volumewe are currently number two overall, andnumber one in South America. Our objectiveis to achieve the same status in Australia,with Africa and Asia seen as the next keymarkets to target.The metals market is booming, thanks toChina’s high demand for commodityresources, especially base metals like copperand nickel. Investment in metals isexpected to increase by 30-40 percent peryear.We are the number one contractor to thecopper industry, with experience accumulatedover more than 50 projects, and are inthe process of developing new and improvedtechnology for gold and diamond extraction.We are engaged in the construction of thelargest gold mine currently being developedin Australia, and have developed new andimproved nickel technology for BHP Billitonas part of the Ravensthorpe project.Our major construction operations inNorth America ensure we are well placed tobuild on our success in this important market.Our LNG regasification position is particularlystrong, where we are ranked numberone in terms of number of contracts andvalue.The markets for power operation and environmentalsolutions, as well as the non-ferrousmetals generation market, are particularlyactive, with over ten power stationprojects in the Americas being sanctioned in<strong>2008</strong>, and indications that many more willfollow.Key fi gures Process & Construction <strong>2007</strong> 2006 2005Operating revenue NOK million 10 393 12 007 10 136EBITDA NOK million 746 530 314EBITDA margin Percent 7.2 4.4 3.1Order intake NOK million 14 242 11 670 10 842Order backlog (as of 31 December) NOK million 10 923 7 989 8 340Number of employees (as of 31 December) Man years 8 367 7 758 5 535Aker <strong>Kvaerner</strong> annual report <strong>2007</strong> 23
Our performance24Aker <strong>Kvaerner</strong> annual report <strong>2007</strong>
Our performanceContents26 Board of Directors’ report<strong>Annual</strong> accounts Aker <strong>Kvaerner</strong> group38 Consolidated income statement39 Consolidated balance sheet40 Consolidated statement of cash fl ow41 Consolidated statement of changes to equity42 Notes to the accounts<strong>Annual</strong> accounts Aker Kværner ASA78 Income statement79 Balance sheet80 Statement of cash fl ow81 Accounting principles82 Notes to the accounts86 Auditor’s report88 Share and shareholder information92 Analytical informationAker <strong>Kvaerner</strong> annual report <strong>2007</strong> 25
Our performanceBoard of Directors’ reportContinued progressAker <strong>Kvaerner</strong> continued to make progress in <strong>2007</strong>. Very positivedevelopments in its principal markets, combined with good projectexecution, meant that performance was even better than in 2006, theprevious record-setting year. Operating revenues came to NOK 57 957million, up by 14.6 percent from the year before. Profitability alsoimproved, with operating profit before depreciation rising by 36 percent toNOK 3 913 million. The EBITDA margin improved from 5.7 percent in 2006to 6.8 percent. Profitability is expected to make continued steadyprogress, with operating revenues of NOK 58-60 billion and an EBITDAmargin of 8 percent in <strong>2008</strong>. The target for <strong>2010</strong> is an EBITDA margin of9 to 11 percent. An ordinary dividend of NOK 3 per share is proposed bythe Board for the fi scal year <strong>2007</strong>, in total NOK 822 million.All of Aker <strong>Kvaerner</strong>’s five business areasmade progress in <strong>2007</strong> and the order backlogreflects a persistently strong market. Completionof the Ormen Lange and Snøhvit projectshad a positive impact on both operations andthe accounts. Following their delivery, Aker<strong>Kvaerner</strong> expects revenues in <strong>2008</strong> to continueat the high <strong>2007</strong> level, and to increase themthereafter. Order intake in <strong>2007</strong> came to NOK57 942 million, and the order backlog at 1 January<strong>2008</strong> was NOK 58 261 million. It is expectedthat the activity in Aker <strong>Kvaerner</strong>’s principalmarkets will remain high over the next few years.Aker <strong>Kvaerner</strong>’s strong focus on health,safety and the environment (HSE) continuesto receive the highest priority, and a numberof programmes and measures supporting itsHSE focus are being implemented throughoutthe organisation. These measures willhelp to increase employee knowledge in theHSE area and to prevent unwanted incidents.The goal is zero harm to people, materialassets and the environment. Sick leave in<strong>2007</strong> remained more or less unchanged fromthe year before, while the personnel injuryfrequencies declined. The Board deeplyregrets that, despite the strong commitment toHSE, a tragic accident occurred on 6 January<strong>2007</strong> when one of our employees died duringa lifting operation on the UK continental shelf.A change occurred in Aker <strong>Kvaerner</strong>’sownership during <strong>2007</strong>. Aker ASA first reducedits holding from 50.01 to 40.1 percent, andthen sold this interest to the newly establishedcompany Aker Holding AS, owned by Aker, theNorwegian state, SAAB AB and Investor AB.Aker <strong>Kvaerner</strong>’s market capitalisation at31 December <strong>2007</strong> was NOK 39 593 million,compared with NOK 42 813 million a yearearlier.The businessPrincipal operationsAker <strong>Kvaerner</strong> is a leading global supplier ofengineering services, fabrication, technologyproducts, maintenance, specialised servicesand total solutions for the energy and processindustries. Its main activities embrace deliveriesto oil, gas, and petrochemical facilities,and the company is also a major supplier toprojects for gas and coal-fired power stations,metal processing plants and other selectedindustries.To optimise the organisation of the company’sbusiness, a new global operationsmodel was adopted in the fi rst quarter of<strong>2007</strong>. Aker <strong>Kvaerner</strong> thereafter comprisesfive business areas which also form the fi vereporting segments:Field Development (FD)Maintenance, Modifications andOperations (MMO)SubseaProducts & Technologies (P&T)Process & Construction (P&C)At 31 December <strong>2007</strong>, The company had24 427 direct employees, including 10 931 inNorway, plus 8 290 contract or “hired-in” personnel.Aker <strong>Kvaerner</strong>’s head office is in Norway,at Fornebu outside Oslo.Strategic target areasThe company’s vision is to be the preferredpartner for projects, products and servicesin the energy sector. This vision applies to allits business areas.Aker <strong>Kvaerner</strong> is recognised as an attractivebusiness partner and employer, and itsemployees hold state-of-the-art expertise ina number of areas.Aker <strong>Kvaerner</strong> occupies a strong position,which will be consolidated and further developed.That calls for significant commitmentand substantial resources. Expectations frominvestors, customers and employees, andfrom the community and the market in general,will be met by delivering responsibly,profitably and consistently every single day.11 target areas have been defined for<strong>2008</strong> to help the company realise its vision ofbeing the preferred partner:Give HSE the highest priorityAker <strong>Kvaerner</strong> has a Just Care culture designedto strengthen the organisation’s focuson HSE in every project and for every productit delivers.Commitment to HSE education will continue.Involvement among employees is at arecord level, and HSE results have shownprogress since 2006. However, further effortis needed to reach the goal of zero harm topeople, material assets and the environment.Establish clear leadership in the ArcticAker <strong>Kvaerner</strong> has solid experience working inthe demanding Arctic environment. It will continueto develop new solutions for this region.Establish clear leadership in deepwatertechnologyTechnological breakthroughs gives a strongcompetitive edge in the deepwater segment.Developing new solutions will continue to beimportant in the future as well as an increasedcommitment to improving products, servicesand expertise across the business.Strengthen position as a turn-key supplier tothe LNG and gas industryAker <strong>Kvaerner</strong> will continue its efforts to expandits already extensive value chainthrough a stronger commitment to gas technology.By improving the utilisation of its specialistunits, it can offer support throughoutthe life cycle.Strengthen commitment to south-east AsiaAker <strong>Kvaerner</strong> will expand its activities insouth-east Asia, including China, India and26Aker <strong>Kvaerner</strong> annual report <strong>2007</strong>
Our performanceBoard of Directors’ report”All of Aker <strong>Kvaerner</strong>’s five business areasmade progress in <strong>2007</strong> and the order backlogcombined with the tendering activity reflect apersistently strong market.”Malaysia, where it can exploit its competitiveadvantages.Commit to acquiring strategic technologyAker <strong>Kvaerner</strong> is among the technology developmentleaders in its core areas, developingworld-class solutions and winning anumber of awards for its technological productsand services.This work will continue, with an increasedcommitment to identifying and acquiringtechnology which enhances its portfolio andprovides added value for customers.Maintain an increased focus on selectingand executing projectsPrioritising the right projects is more importantthan simply winning new projects.Reliable and predictable project executionyields clear competitive advantages. Thecompany will continue strengthening its executionof demanding projects by selectingthe right projects and consistently implementingits project execution model (PEM).Develop pricing concepts for projects,services and maintenance contractsAker <strong>Kvaerner</strong> has previously priced its tenderson the basis of labour and materialcosts plus a percentage for profit. This ‘costplus’calculation method fails to take into accountthe expertise actually contributed to aproject - or the added value which this represents.Cost-plus thinking is being replaced by apricing model which sells quality and expertise,and which focuses on the value addedto the customer in a project. Combined withother value creation methods, this approachhas been shown to provide far better projectprofitability than the cost-plus model. Withthis new pricing model Aker <strong>Kvaerner</strong> is paidfor the added value delivered to the customer.Take care of talented employeesHuman resources are the key to successfulproject execution, growth, and new projectand business opportunities. Aker <strong>Kvaerner</strong>has more than 24 000 employees, and willcontinue its efforts to develop both individualsand teams with the aim of creating one ofthe world’s most attractive workplaces. Oneof the company’s goals is to reduce turnoverin its workforce to an average of less thannine percent worldwide.Improvement programmesAker <strong>Kvaerner</strong> has a strong foundation and amore flexible cost structure after the refinancingin 2006, but improvement opportunitiesremain. In order to strengthen competitivenesseven further, a number of improvementprogrammes were launched during the secondquarter of <strong>2007</strong>. The goal is to reducethe cost base by NOK 1 billion over the nexttwo to three years. Various measures have sofar yielded savings in the order of NOK 280million. These programmes embrace areasincluding procurement, simplification of thelegal structure, optimisation of tax and workingcapital and improved earnings throughgood risk management.Stronger commitment to the Process &Construcion business areaA detailed review of development opportunitiesfor Process & Construction was carriedout in <strong>2007</strong>. It has been resolved to continueand strengthen the company’s commitmentto this business area.The Metals segment will be strengthenedthrough organic growth and acquisitions.Geographically, priority will be given to theSouth American market. The centre of gravityfor the Process business will be shifted graduallytowards south-east Asia. This means inpart that all significant new capacity in thisarea will be added in that region. Transfer oftechnology and know-how from Europe tothe business area’s activities in other parts ofthe world, and particularly to growth marketssuch as India and China, will also be facilitatedto a greater extent. Moderate growth isexpected for Construction in its existingNorth American market.MarketsAker <strong>Kvaerner</strong>’s markets are continuing todevelop well, and the outlook is good. Internationaldemand for energy is expected tocontinue growing for at least three to fi veyears. Developments in China and India willmake a particular contribution to stimulatingdemand. Strong raw material prices will helpto keep demand high for Aker <strong>Kvaerner</strong>’sproducts and services, and contribute to investmentboth in existing installations andfields and in new and more demanding areas.Combined with new technology forimproved recovery, high oil prices will boostdemand for the maintenance and upgradingof existing installations. This will extend theinstallations’ economic life and their recoveryfactor. In technology, expertise and execution,Aker <strong>Kvaerner</strong> is well positioned toundertake these types of assignments.Development of new oil and gas fi eldsalso represents a strong market. A numberof these projects are located in particularlydemanding areas, in ultra deepwater and inharsh weather regions. Aker <strong>Kvaerner</strong> hasstrong competitive advantages in this marketas a result of its experience in the North Seaand state-of-the-art expertise.The positive trend for international commercein general, and particularly in China,provides a foundation for maintaining a highlevel of investment in other industries whereAker <strong>Kvaerner</strong> can offer its services, such asmining, metals and chemicals.Risk managementAker <strong>Kvaerner</strong>’s decision-making system isorganised in a matrix format which defineswhich decisions can be taken at which levelsin the organisation. At corporate level, advisorycommittees have been established toprovide quality assurance of major issuesbefore a final decision is taken. These committeesevaluate issues before a decision ismade by corporate management or the mainboard: the corporate risk committee considersoperational project risk the fi nance committee considers fi nancialmarket risk the investment committee considers riskassociated with acquisition and sale ofbusinesses as well as other investmentdecisions.The various risks evaluated by the respectivecommittees are outlined below.Operational project risk: Aker <strong>Kvaerner</strong>’scommercial operations will normally involverisk. Responsibility for ongoing risk assessmentrests with the various operational businessareas. Typical examples of such riskare the ability to deliver existing contracts atthe agreed time, quality, functionality andprice. Delivering projects and equipment inaccordance with the contract terms and theanticipated cost framework represents asubstantial risk element, which will be themost significant factor affecting Aker <strong>Kvaerner</strong>’sfinancial performance. Results also dependon costs, both Aker <strong>Kvaerner</strong>’s ownand those charged by suppliers, interest expenses,exchange rates and the customer’sability to pay.Aker <strong>Kvaerner</strong> works systematically withrisk management in all its business areas,through extensive systems and procedures.The aim is to ensure a thorough assessmentAker <strong>Kvaerner</strong> annual report <strong>2007</strong> 27
Our performanceBoard of Directors’ reportof both new and deliveries under execution.Risk management and awareness also representkey elements in educational activitiesand the corporate culture. The goal is not toavoid all risk, but to understand, manage andbe paid for managing risk. Good risk assessmentis a core competence which can delivercompetitive advantages.A model for following up every phase of adelivery – evaluating, tendering, decisionmakingand execution – has been establishedby Aker <strong>Kvaerner</strong>. This project executionmodel (PEM) ensures that all the businessareas share a uniform tool for projectexecution and follow-up, which in turnensures a unified corporate culture and providesopportunities for cross-organisationaldeliveries. Aker <strong>Kvaerner</strong> has establisheddecision-making and evaluation bodies atvarious levels to deal with project and equipmentdeliveries. At the pinnacle of this systemsits the corporate risk committee, whichassesses and recommends contracts to theappropriate decision-making authority (thePresident & CEO or the Board). The risk committeereviewed almost 30 projects during<strong>2007</strong>. Given today’s market conditions, keepingdeliveries at a level which Aker <strong>Kvaerner</strong>has the capacity and expertise to execute isimportant, as is selecting and winning theright projects. A substantial order backlogalso makes it more essential than ever tomaintain good control of risk while executingcontracts.Financial market risk: Aker <strong>Kvaerner</strong> hasestablished guidelines and systems to manageits exposure in financial markets. These systemscover currency, interest rate, counterpartyand liquidity risk. Substantial amountshave been committed as bank guarantees tocustomers in connection with the company’sactivities. Aker <strong>Kvaerner</strong> has a centralisedtreasury function, which assists the operationalunits and corporate functions. Frameworksfor financial risk are set by a corporatefi nance committee.Currency risk: operational units cover theirforeign currency positions via the corporatetreasury department when contracts areawarded. In turn, the treasury departmentcovers these positions directly against externalbanks. All operational units are required tocover their currency positions against theirfunctional currency. All major contracts arehedged and documented in such a way thatthey qualify for hedge accounting. Qualifiedhedges account for about 80 percent of thetotal currency exposure. The remaining 20percent is secured through net positions whichdo not qualify for hedge accounting under therelevant accounting standards. The corporatetreasury department is also mandated to takea limited open position. Total currency turnoverfor the company against external banks in<strong>2007</strong> was almost NOK 87 billion.Interest rate risk: operational units do notcover their interest exposure unless deliveriesentail significant advances or requiresubstantial financing of working capital. Thecorporate goal is to have up to 50 percent ofgross debt on fi xed interest rates and termsof three to five years. At 31 December, morethan half the outstanding debt had fi xedinterest rates.Counterparty risk: specific assessmentsare made of all major contractual counterpartiesand efforts are made to cover riskthrough parent company guarantees, structuringof payment terms or bank guarantees.Where bank risk is concerned, specific maximumlevels have been set for Aker <strong>Kvaerner</strong>’sexposure to each financial institution.Liquidity risk: in addition to seeking to ensurethat all deliveries in the operational unitshave a neutral or positive effect on cash flow,Aker <strong>Kvaerner</strong>’s policy is to maintain satisfactoryliquidity at corporate level to meet unforeseendevelopments. This goal is expressedas a total of undrawn bank credit facilitiesand liquid assets corresponding toeight to 10 percent of revenues. This targetwill vary over time, depending on the compositionof revenues in various segments. Effortswill be made to ensure that debt has anaverage remaining term of three to fi ve years.At 31 December, the liquidity buffer amountedto NOK 9 547 million or roughly 16.47 percentof <strong>2007</strong> revenues. Average duration onthe existing outstanding debt including theundrawn bank revolver is approximately 4.6years. Aker <strong>Kvaerner</strong> is in compliance withthe financial covenants in its loan agreements;see Note 25.6 to the consolidatedaccounts on non-current borrowings.Guarantee portfolio: a significant proportionof business area contracts are supportedby bank or insurance guarantees. Ondemand guarantees account for a largeshare of these, particularly in Field Development,Subsea and Products & Technologies.These guarantees can fall due for payment atshort notice. Aker <strong>Kvaerner</strong> has made nopayments under such guarantees over thepast decade, apart from one case in whichan unfriendly claim was determined by thecourt. Careful assessments are made beforeproviding on-demand guarantees, with insurancepolicies taken out if necessary to protectagainst unfriendly claims under the guarantees.Aker <strong>Kvaerner</strong>’s guarantee portfolioat 31 December totalled some NOK 5.5 billion,down about 10 percent from the yearbefore. Some NOK 1 600 million in new guaranteeswere provided during <strong>2007</strong>. Furtherdetails about uncertainties and contingentevents are presented in Note 13 to the consolidatedaccounts on contingent events.Acquisition/sale of businesses and otherinvestment decisions: proposals for majoracquisitions or sales of businesses and forsubstantial investments in fixed assets (property,machinery and equipment) are submittedto the investment committee for a recommendationbefore fi nal approval by the corporatemanagement or the Board. The committeebecomes involved at an early stage insuch processes, and evaluations from therelevant specialist staff functions form an importantpart of the assessment process.Such work provides proactive quality assurancethat all necessary considerations havebeen properly assessed in such processes,including the question of whether the investmentsatisfies the required return. The committeeoften provides guidance for furtherwork on mergers and acquisitions and oncapex investments by the business areas,and ensures that the investments made arefollowed up with requirements for ex-postcalculations of the results achieved.The year <strong>2007</strong>Change in ownership structureAker ASA reduced its holding in Aker <strong>Kvaerner</strong>from 50.01 to 40.1 percent in January<strong>2007</strong>. During June, Aker, SAAB AB, InvestorAB and the Norwegian Government reachedan agreement on the long term strategicownership of Aker Kværner ASA. Under thisdeal, Aker transferred its 40.1 percent holdingin Aker <strong>Kvaerner</strong> to the newly-createdcompany Aker Holding AS. Following thistransaction, Aker ASA is the majority shareholderin Aker Holding with 60 percent of theshares, while the Norwegian state owns 30percent. The Swedish companies SAAB andInvestor have holdings of 7.5 and 2.5 percentrespectively.Aker ASA and the Norwegian Governmenthave undertaken to retain their holdings in28Aker <strong>Kvaerner</strong> annual report <strong>2007</strong>
Our performanceBoard of Directors’ report”Prioritising the right projects ismore important than simplywinning new projects.”Aker <strong>Kvaerner</strong> jointly for at least 10 years.They are agreed that Aker <strong>Kvaerner</strong> will continueto be developed as an internationalcompetitive main contractor for technology,products, systems and services, directedprimarily at the process, metals and constructionindustries and the oil and gas sector.The owners of Aker Holding will maintainthe close collaboration between Aker <strong>Kvaerner</strong>and other Aker companies. The principalshareholder in Aker, Kjell Inge Røkke, hasconfirmed that he will control Aker throughhis companies for as long as the ownershipcollaboration in Aker Holding continues.Delivery of the Ormen Lange andSnøhvit projectsStatoilHydro commenced gas production atOrmen Lange on 6 October. This gas fieldlies 120 kilometres from Norway’s west coast,in a demanding area of the Norwegian Seawith water depths from 800 to 1 100 metres.Production is based on innovative subseatechnology, with the unprocessed well streamcarried in two multiphase fl ow pipelines tothe processing plant in Aukra. Aker <strong>Kvaerner</strong>was the main contractor for this largeprocessing facility at Nyhamna on the islandof Gossa.Production of liquefied natural gas (LNG)was initiated by StatoilHydro on 13 Septemberat its receiving and processing plant onMelkøya island outside Hammerfest. The gascomes from Snøhvit, the fi rst offshore field tobe developed in the Norwegian sector of theBarents Sea. This development has no surfaceinstallations, utilising only remotely operatedsubsea facilities and pipelines to theland-based plant. Aker <strong>Kvaerner</strong> was responsiblefor assembly of the latter.Aker <strong>Kvaerner</strong> has won acclaim for its workon these two major projects. This successrests in part on close and positive collaborationwith the customers; on Aker <strong>Kvaerner</strong>’ssubstantial experience with oil and gasprojects; and on its technological assets andeffective project execution. Ormen Lange andSnøhvit will be important reference projects forAker <strong>Kvaerner</strong> in the international oil and gasindustry. These projects document its leadingpositions in both innovation and execution ofmajor projects in demanding locations.High-tech manufacturing centre inMalaysiaAfter a rapid planning and construction period,the world’s most advanced productionfacility for subsea technology was officiallyopened at Port Klang in Malaysia. Aker<strong>Kvaerner</strong> has invested NOK 500 million inthis plant, which will increase its opportunitiesto serve the subsea market both in Malaysiaand in the rest of the strategically importantAsia-Pacific region. Technology producedat this facility can also be included indeliveries from Aker <strong>Kvaerner</strong> to projects inother regions.InvestmentsThe most substantial investments in new activities,acquisitions and capacity were madeby Subsea and P&T. Capital spending inthese business areas during <strong>2007</strong> totalledNOK 875 million (excluding acquisitions).Subsea investments included an expansionof the production plant at Rio das Ostras inBrazil and construction of a new Indian servicebase at Kakinada. Investments by P&T includedthe Aker <strong>Kvaerner</strong> Well InterventionAcademy at Forus in Norway and a numberof wireline tractors to meet demand in thewell service segment.Aker <strong>Kvaerner</strong> acquired 50 percent of theshares in German drilling technology specialistWirth Maschinen- und Bohrgeräte-Fabrik GmbH (Wirth) during August <strong>2007</strong>.The purchase agreement gives Aker <strong>Kvaerner</strong>an option to buy all the remaining sharesat a later date.Wirth has been an important sub-contractorfor more than 20 years, and the acquisitionwill supplement the company’s technologyportfolio by allowing it to offer its own completesolutions for topside drilling equipment.With operating revenues of NOK 1 554million and an EBITDA of NOK 236 million in<strong>2007</strong>, Wirth has some 500 employees and ishighly regarded for its expertise and technology.The company’s order backlog at 31December was NOK 1 600 million.Presentation of the accountsAker <strong>Kvaerner</strong> prepares and presents its accountsin accordance with the InternationalFinancial <strong>Report</strong>ing Standards (IFRS).Income statementConsolidated <strong>2007</strong> operating revenues wereNOK 57 957 million, up by 14.6 percent fromNOK 50 592 million in 2006. This increaseprimarily reflects good market conditions anda generally high level of activity in all thebusiness areas.EBITDA (earnings before interest, tax,depreciation and amortisation) amounted toNOK 3 913 million, up 36.2 percent fromNOK 2 872 million in 2006. Profitabilitystrengthened during the year, with an EBITDAmargin of 6.8 percent as against 5.7 percentin 2006. The growth in EBITDA is primarilyattributable to operational improvements, ahigh level of activity, and positive price andmargin developments in the market.Depreciation, impairment charges andamortisation totalled NOK 431 million, comparedwith NOK 339 million in 2006. Operatingprofit (EBIT) was NOK 3 482 million asagainst NOK 2 533 million in 2006.Net fi nancial expenses amounted to NOK104 million, compared with NOK 887 millionin 2006 – including NOK 648 million in specialitems related to refinancing debt. Carriedout in December 2006, this refinancingreduced annual interest expenses by roughlyNOK 180 million.Aker <strong>Kvaerner</strong> hedges currency risk for allproject exposures in accordance with wellestablishedpractice. Although this providesa full currency hedge, parts of the hedging(about 20 percent) fail to meet the requirementsfor hedge accounting specified in theIAS 39 international accounting standard.Fluctuations in the value of the associatedhedging instruments are recognised as afi nancial item in the accounts. The accountingeffect appears as an income of NOK 162million in a separate line under fi nancial itemsfor <strong>2007</strong>. The income in 2006 was NOK 241million.The loss from associated companies wasNOK 2 million, compared with NOK 18 millionin 2006. Tax expense was NOK 1 074million as against NOK 575 million the yearbefore. This corresponded to an effective taxrate of 30 percent, compared with 31 percentin 2006.Consolidated net profit for <strong>2007</strong> was NOK2 464 million, compared with NOK 3 789 millionthe year before. The latter fi gure includedNOK 2 495 million from discontinued operationsand NOK 1 294 million from continuedoperations. The <strong>2007</strong> performance yieldedearnings per share of NOK 8.84, up fromNOK 4.53 for continued operations in 2006.Cash fl owConsolidated cash flow from operating activitiesdepends on a number of factors, includingprogress with and delivery of projects,changes in working capital and pre-paymentsfrom customers. Net cash flow fromoperations totalled NOK 2 675 million, comparedwith NOK 2 636 million in 2006.Net cash flow from investment activities in<strong>2007</strong> was negative at NOK 1 576 million, primarilyas a result of plant investments inMalaysia and Norway. The figure for 2006Aker <strong>Kvaerner</strong> annual report <strong>2007</strong> 29
Our performanceBoard of Directors’ reportwas NOK 985 million, including NOK 2 054million in net cash fl ow from the disposal ofoperations.Net cash flow from fi nancing activitieswas negative at NOK 3 013 million, includingNOK 2 182 million in dividend for the yearand NOK 781 million on buying back thecompany’s own shares.Balance sheet and liquidityConsolidated long term interest-bearing debtamounted to NOK 2 billion at 31 December,unchanged from the same date the year before.Long term debt comprised four bond loansin the Norwegian market and deferred acquisitioncost to Trafalgar House Global (THG).The bond loans are for NOK 500 millionmaturing in <strong>2009</strong>, NOK 650 million maturingin 2011, and NOK 150 million and NOK 300million respectively which mature in 2013.These loans have floating interest rates with theexception of the one for NOK 150 million maturingin 2013, which has a fixed rate. Parts of theloans with floating rates have been converted tofixed rates through interest swap agreements.Fifty percent of the total bond loans accordinglyhave fixed rates. The average term to maturityfor these loans is about four years.Deferred acquisition cost to THG totalledNOK 407 million at 31 December (correspondingto GBP 37.8 million) and matures in2012. It is due to be repaid in equal annualinstalments until maturity.A syndicated bank facility of NOK 5 974million (corresponding to EUR 750 million)has also been established, with a fi ve-yearremaining term to maturity. This facility incorporatestwo options for possible extension ofthe term by one plus one years. The first ofthese options was exercised in <strong>2007</strong>, so thatmaturity is now in 2012. The bank facility hadnot been drawn at 31 December.As an alternative to drawing on the bankfacility, use was made of the Norwegian certificatemarket during <strong>2007</strong>. This market hasgood liquidity at times, and pricing is normallylower than the bank facility.Aker <strong>Kvaerner</strong>’s current operationalassets totalled NOK 15 713 million at 31December, compared with NOK 15 118 milliona year earlier.Consolidated non-current assets totalledNOK 8 650 million at 31 December, comparedwith NOK 7 569 million a year earlier.The largest item was goodwill, whichamounted to NOK 4 995 million as againstNOK 5 054 million. This goodwill relates primarilyto the acquisition of Trafalgar House in 1996and the merger with Aker Maritime in 2001.Net interest-bearing items amounted toNOK 2 056 million at 31 December, comparedwith NOK 4 140 million a year earlier.The reduction reflects the payment of dividendand repurchase of the company’s ownshares.The current liabilities of NOK 17 127 millionat 31 December consisted primarily of tradeand other payables. The correspondingfigure in 2006 was NOK 17 520 million.Book equity including minority intereststotalled NOK 7 267 million at 31 December.Minority interests amounted to NOK 168 million.The company’s equity ratio was 25.5percent of the total balance sheet at 31December. Financial adequacy and liquidityare good.The business areasField Development (FD) continued its positivedevelopment in <strong>2007</strong>. Operating revenuesfor the year totalled NOK 16 381 million,up from NOK 16 125 million in 2006. This increasereflected a number of major projects,including Ormen Lange and Snøhvit. Substantialactivity with deliveries to the Kashaganproject in the Caspian Sea also continuedthroughout the year, as did the assignmentsfor Aker Drilling related to constructionof the two Aker H-6e rigs, which will be theworld’s biggest and most advanced floatingdrilling units. Other large projects pursued in<strong>2007</strong> were the construction of the semisubmersibleproduction platform for Gjøa on theNorwegian continental shelf, and delivery ofthe hull plus topside assembly for Chevron’sBlind Faith platform in the Gulf of Mexico.EBITDA for <strong>2007</strong> was NOK 891 million,compared with NOK 903 million the yearbefore, while the EBITDA margin declinedfrom 5.6 percent in 2006 to 5.4 percent. Thebusiness area is particularly well positionedin relation to the commitment by oil companiesto development and production in areasof deepwater and harsh weather. However,the effect of completing both Ormen Langeand Snøhvit in <strong>2007</strong> will be some short-termdecline in operating revenues. These areexpected to rise again during <strong>2008</strong>. Growthis primarily expected to come in the BarentsSea, the Caspian Sea and south-east Asia.FD will also retain its leading position in theNorth Sea, where it holds a number of importantcontracts and was awarded the prestigiousjob of developing the Skarv field asrecently as last autumn. The order backlog at1 January <strong>2008</strong> was NOK 15 695 million,compared with NOK 20 385 million a yearearlier.Maintenance, Modifications and Operations(MMO) also had a high level of activity during<strong>2007</strong>. Operating revenues came to NOK9 744 million, compared with NOK 9 677 millionthe year before. MMO maintained its solidposition in the Norwegian market, with a marketshare of roughly 50 percent. Purposeful effortsyielded further profitability gains both in longterm contracts covering maintenance workand in modification assignments for existinginstallations and plants.The Statfjord Late Life project was readiedfor gas export in <strong>2007</strong>, an important milestoneboth for customer StatoilHydro and forAker <strong>Kvaerner</strong>. Electrical, instrumentationand telecommunication installations werecompleted during the year for the OrmenLange and Snøhvit projects. Important deliverieswere also completed in connection withthe removal of offshore installations from theabandoned Frigg fi eld. Internationally, MMOsecured a foothold in Canada through a longterm contract for operation and maintenanceservices on Husky’s White Rose productionship. In addition, the topside assembly contractcommenced for the Kashagan developmentin the Caspian Sea, and MMO wasawarded an operations contract for the AlZaafarna production ship off Egypt.EBITDA for <strong>2007</strong> was NOK 530 million,compared with NOK 452 million the yearbefore, while the EBITDA margin rose from4.7 percent in 2006 to 5.4 percent. The marketoutlook is good, and the order backlog at1 January was NOK 10 683 million, comparedwith NOK 12 245 million a year earlier.Subsea also made strong progress in <strong>2007</strong>.Total operating revenues increased by noless than 42 percent from 2006 to NOK 9 851million. Construction of Aker <strong>Kvaerner</strong>’s newMalaysian integrated production centre forsubsea technology for the oil and gas industrywas completed during the year. This representsan important strategic and marketcommitment. The centre is the world’s mostadvanced production facility for completesubsea solutions, and provides a good foundationfor serving important markets - notonly in Malaysia but also in the rest of theAsia-Pacific region. It will also be able to contributeto subsea equipment deliveries inother parts of the world.A fi ve-year frame agreement with optionsfor a further two plus two years was concludedwith StatoilHydro in September, concerningthe delivery of subsea productionsystems and associated maintenance andservice work to future projects. An important30Aker <strong>Kvaerner</strong> annual report <strong>2007</strong>
Our performanceBoard of Directors’ report”Substantial amounts have beencommitted as guarantees tocustomers in connection withthe company’s activities.”breakthrough in the market for new subseatechnology was also achieved in <strong>2007</strong> withthe successful implementation of the Multi-Booster technology on BP’s King field inthe Gulf of Mexico. Another important assignmentwas the contract worth USD 250 millionconcluded with Reliance Industries for subseasystems to be used on the Indian subcontinent.EBITDA for <strong>2007</strong> was NOK 960 million,compared with NOK 479 million the yearbefore, while the EBITDA margin rose from6.9 percent in 2006 to 9.7 percent. Thisprogress primarily reflects better margins incertain projects, improved project executionand procurement savings. With the marginexpected to reach double fi gures over thenext few years, the market outlook is verygood. The order backlog at 1 January <strong>2008</strong>was NOK 10 951 million, compared with NOK8 775 million a year earlier.Products & Technologies (P&T) achievedresults in <strong>2007</strong> which were characterised bycontinued strong growth and rising marketshares. Operating revenues for <strong>2007</strong> came toNOK 12 353 million, up by no less than 63percent from the year before. This sharp increasereflects a persistently high level of activityin the market for drilling equipment aswell as new breakthroughs in other importantmarkets. P&T secured an important entryinto the Chinese offshore sector during <strong>2007</strong>,and further strengthened its position in themarket for drilling systems for use on drillships.Aker <strong>Kvaerner</strong> Pusnes and Aker<strong>Kvaerner</strong> Process Systems had a high levelof activity and good progress. The businessarea has a strong position and a high level ofactivity in attractive niches such as welltechnology and services. Combined withexpertise and experience from Arctic regionsand other demanding areas where growth isexpected to continue, this contributes tostrong demand and a positive outlook. Theacquisition of 50 percent of the shares inWirth will also help to strengthen Aker <strong>Kvaerner</strong>’sinternational position in the drillingequipment segment.EBITDA for <strong>2007</strong> was NOK 959 million,compared with NOK 531 million the yearbefore, while the EBITDA margin rose from 7percent in 2006 to 7.8 percent. The improvementprimarily reflects attractive technology,improved project execution and strongdemand for the business area’s products.The order backlog at 1 January <strong>2008</strong> wasNOK 11 520 million, slightly lower than a yearearlier.Process & Construction (P&C) made solidprogress in <strong>2007</strong>, with operating revenues ofNOK 10 393 million. All four of the businessareas’ global core activities showed growth.This is an effect of the successful restructuringcarried out to secure synergies and improveresource utilisation, plus a further focusingof attention on a few selected strategicmarket niches. Growth was particularlystrong for deliveries to mining and metallurgicalplants and to the building of oil- and gasfiredpower stations in North America.EBITDA for <strong>2007</strong> was NOK 746 million,compared with NOK 530 million the yearbefore, while the EBITDA margin rose from4.4 percent in 2006 to 7.2 percent. Progresshere partly reflected a generally strongerfocus on profitable projects, better cost controland improved quality in project execution.P&C has secured a solid foothold in severalinternational growth markets, and has wonimportant contracts in countries such asChina and India. The outlook is good, andthe order backlog at 1 January <strong>2008</strong> totalledNOK 10 923 million, compared with NOK7 989 million a year earlier.Research and developmentAker <strong>Kvaerner</strong> possesses large and highlycompetent engineering teams, which workclosely with the company’s partners and customersworldwide. These engineers are oftenlocated at the customer’s premises, givingthem fi rst-hand knowledge of the latter’stechnology challenges and requirements.Ideas and concepts which develop into newgroundbreaking technology are initiated atthis interface. Such interaction also ensuresthat research work is relevant and pursuedon the basis of customer requirements. TheOrmen Lange subsea compression stationpilot provides an example of such collaborationbetween Aker <strong>Kvaerner</strong>, customer Statoil-Hydro and sub-contractors. The goal is todevelop a subsea compression station as afully acceptable alternative to an offshoreplatform. Testing of the pilot will take place atthe Nyhamna land terminal in <strong>2009</strong>-11. Thetechnology will be transferable to other offshorefield developments, and could dramaticallyreduce customer costs.Aker <strong>Kvaerner</strong> invested NOK 166 millionin selected technology development projectsduring <strong>2007</strong>. In addition, it received NOK 77million in technology development fundingfrom customers and government agencies.This commitment to technology will continue.In addition to Aker <strong>Kvaerner</strong>’s own developmentprojects, extensive technology work ispursued in cooperation with customers aspart of project activities. Expenses for suchdevelopment are largely charged to the relevantprojects as they are incurred.Events after the balance sheet dateAt 15 February <strong>2008</strong>, the company had announcednew contracts worth some NOK 2billion since 1 January.New President & CEOSimen Lieungh has been appointed President& CEO of Aker <strong>Kvaerner</strong> in succession toMartinus Brandal, who is moving to Aker ASAas Executive Vice President for Energy Technologies.Mr Brandal will also be nominated asthe new Chairman of the Board of Aker <strong>Kvaerner</strong>.These changes will help to strengthenopportunities for Aker and Aker <strong>Kvaerner</strong> withbusiness development and value creation inthe energy sector. At the same time, Aker<strong>Kvaerner</strong> will be provided with managementcapacity and quality which will help it to exploitits many competitive advantages even furtherand to secure continued growth.Lieungh worked for Aker <strong>Kvaerner</strong> in variouspositions from 1988 to <strong>2007</strong>, most recentlyas executive vice president for Field Development.He combines substantial industrialknowledge with outstanding leadership qualities.The Board is pleased that Lieungh hasreturned to the company, and looks forward toexcellent collaboration with him, strengtheningAker <strong>Kvaerner</strong> even further. He will take over aschief executive in March.The Board extends its thanks to Mr Brandalfor his significant commitment as President &CEO of Aker <strong>Kvaerner</strong>. Under his leadership,the company has continued its progress inboth markets and financial results, and therebyfurther strengthened its position as a leadingglobal player. Through his new position withAker, he will continue to play a key role in Aker<strong>Kvaerner</strong>, where he will be nominated as thenew Chairman of the Board.New name: Aker SolutionsThe Board of Aker <strong>Kvaerner</strong> has resolved topropose a change of name to the company’s<strong>Annual</strong> General Meeting (AGM) on 3 April<strong>2008</strong>. Aker <strong>Kvaerner</strong> ASA would thereby becomeAker Solutions ASA. This proposal is aconsequence of the clarifications in <strong>2007</strong>concerning the ownership structure of thecompany. The new name represents an endto the integration process, merging twohistoric competitors, and describes the developmentof complete industrial solutionsfor the company’s customers.Aker <strong>Kvaerner</strong> annual report <strong>2007</strong> 31
Our performanceBoard of Directors’ reportThe new Aker Solutions name will help tounderline this family association even furtherand highlight the many opportunities inherentin the affiliation to and with the other Akercompanies.Aker Clean CarbonAker <strong>Kvaerner</strong> has devoted several years todeveloping Just Catch, a technology forcarbon capture in gas-fired power stations.For almost a year, these efforts have largelybeen pursued under contract from Aker CleanCarbon, an Aker subsidiary. This work has resultedin detailed plans for the construction ofa first carbon capture facility. Aker Clean Carbonis responsible for these plans, and Aker<strong>Kvaerner</strong> has resolved to transfer its technologycommitment in the area to this company.That will give Aker <strong>Kvaerner</strong> a 30 percent holdingin Aker Clean Carbon, while Aker retainsthe remaining 70 percent.This ownership division has been determinedon the basis of valuations and negotiationswhich have also aimed to secureexclusive rights for Aker <strong>Kvaerner</strong> to participatein the construction of future carboncapture facilities by Aker Clean Carbon.The plant on which Aker Clean Carbon willnow commence work is due to be completedin <strong>2009</strong> and to have an annual capacity of100 000 tonnes of carbon dioxide. The estimatedinvestment will be about NOK 725 million.Aker Clean Carbon intends to build itsfi rst facility in association with the gas-firedpower station and the gas processing plantat Kårstø, north of Stavanger. Connecting toboth these emission sources would ensurecontinuous operation for the facility even ifthe gas-fired station were to be shut down forperiods. The technology can be applied to allindustrial plants and power stations driven byfossil fuels such as oil, natural gas or coal.By combining their resources in AkerClean Carbon, Aker and Aker <strong>Kvaerner</strong> willbe strongly placed in a market with substantialpotential. A purposeful and long termcommitment to carbon capture will allow Aker<strong>Kvaerner</strong> to strengthen its earnings whilehelping to solve the climate challenges.Share and share capitalThe AGM of 29 March <strong>2007</strong> resolved tosplit the share, with one existing shareconverted to five new ones. This changed thenumber of issued shares from 55 029 234 to275 146 170. The split was implemented on30 March <strong>2007</strong>.A cancellation of issued shares was alsoresolved by the AGM in order to reduce theshare capital. Implemented on 3 September<strong>2007</strong>, this transaction cut the number ofshares from 275 146 170 to 274 000 000. Theshare capital was thereby reduced from NOK550 292 340 to NOK 548 000 000. At31 December, Aker <strong>Kvaerner</strong> had boughtback 4 371 830 of its own shares or 1.6 percentof the outstanding total.The buy-back programme for the company’sown shares has continued under a mandateawarded to the Board by the AGM on 29March <strong>2007</strong>. This mandate authorises thecompany to buy back up to 10 percent of theoutstanding shares. The Board has mandatedthe administration to buy back up to five percent.Repurchases above that percentage butwithin the AGM’s mandate must be consideredby the Board. The mandate runs until the<strong>2008</strong> AGM, which will be held on 3 April <strong>2008</strong>.At 28 February <strong>2008</strong>, 4 966 830 shareshad been acquired under the mandate. TheBoard will propose an extension of the mandateby 12 months from the date of theAGM’s decision. New terms will then be setfor the buy-back programme.The <strong>2007</strong> AGM also mandated the Boardto raise the share capital by up to NOK109 600 000. Under this mandate, the Boardcan resolve to waive the pre-emptive right ofexisting shareholders to subscribe to newshares. The mandate can be used severaltimes, and runs until the AGM on 3 April <strong>2008</strong>.It has so far remained unused.Going concernBased on Aker <strong>Kvaerner</strong>’s financial results andposition, the Board affirms that the annualaccounts for <strong>2007</strong> have been prepared on theassumption that the company is a goingconcern.Dividend policyAdopted by the Board in 2006, Aker <strong>Kvaerner</strong>’sdividend policy specifies an intention to payshareholders an annual dividend of 30-50percent of net profit. Dividend will be paid incash or through share buy-backs. The Boardwill propose a total dividend of NOK 3 pershare to the AGM for <strong>2007</strong>. Shareholders willthen have received 65 percent of net profit inthe form of share buy-backs and dividend forthe fiscal year.Parent company accounts andallocation of net profitParent company Aker <strong>Kvaerner</strong> ASA had anet profit of NOK 2 290 million for <strong>2007</strong>.Pursuant to the company’s dividendpolicy, the Board will propose to the AGM on3 April that an ordinary dividend of NOK 3per share be paid. This amounts to NOK 822million or 33 percent of the net profit.The Board thereby proposes the followingallocation of net profit:Dividend 1)Other equityTotal allocated1) Exclusive dividend on own shares.NOK 809 millionNOK 1 481 millionNOK 2 290 millionUnrestricted equity after the proposed dividendpayment amounts to NOK 3 447 million.Health, safety and the environmentConcern for health, safety and the environment(HSE) is one of Aker <strong>Kvaerner</strong>’s corevalues. The fundamental vision and attitudeis that all accidents can be prevented. Onthat basis, Aker <strong>Kvaerner</strong> works continuouslyto prevent incidents which could cause harmto personnel, to material or non-material assets.Driven by careThe Just Care concept has been establishedas a symbol for Aker <strong>Kvaerner</strong>’s HSEculture and work. A key element is that eachperson accepts personal responsibility forHSE based on care for people and the environment.Through Just Care, the HSE messagereaches the individual employee moreeffectively. Managers as role models and astrong commitment to communication andtraining create attitudes which integrate HSEin everyday work. That contributes to goodprojects and better HSE resultsA common HSE cultureEducation occupies a central place in Aker<strong>Kvaerner</strong>’s HSE programme. From 2005 to<strong>2007</strong>, more than 1 700 leaders have gonethrough a purpose-made HSE leadershipprogramme. This programme equips managerswith the competence required to becomebetter role models and to drive HSE improvements.To reach out to all employees in an efficient way, Aker <strong>Kvaerner</strong> has also developeda dedicated Just Care eLearningprogramme. Through various modules, thiscovers the Just Care culture and HSE as acore value, as well as more specific topics onmastering stress and HSE risk assessments.More than 28 000 eLearning sessions havebeen delivered since the programme was introducedin the autumn of 2006. Three newmodules focusing on environment, travelhealth and safety, and HSE in the office are32Aker <strong>Kvaerner</strong> annual report <strong>2007</strong>
Our performanceBoard of Directors’ report”Ormen Lange and Snøhvit willbe important reference projectsfor Aker <strong>Kvaerner</strong> in the internationaloil and gas industry.”being introduced to complete the programme.Aker <strong>Kvaerner</strong> conducts a people surveyat regular intervals which allows all employeesto provide feedback. This measures thecorporate culture in important areas, includingHSE. Results from the last three surveys,held in 2004, 2005 and <strong>2007</strong>, show a clearpositive trend in HSE culture, while the HSEstatistics show that the injury frequenciesand sick leave have been reduced over thesame period.Systematic improvementA common HSE operating system for thewhole company defines specific expectationsto HSE management and leadership.Regular audits uncover possible gaps relativeto the expectations, and the actions requiredto close such gaps are identified andinitiated. This system also functions as aframework for cross-organisational sharingand learningLearning from accidentsThe Board deeply regrets that a tragic fatalitywas suffered in <strong>2007</strong>. One of Aker <strong>Kvaerner</strong>’semployees died on 6 January in a liftingaccident on the UK continental shelf. This accidentwas also reported in the annual reportfor 2006. An extensive investigation was carriedout and follow-up action has been taken.The total injury frequency per million workinghours declined from 4.2 in 2006 to 3.7.The lost-time incident frequency per millionworking hours decreased from 1.1 in 2006 to0.68 in <strong>2007</strong>. These fi gures also include Aker<strong>Kvaerner</strong>’s sub-contractors.All significant accidents and near missesare investigated and the lessons from themimplemented, with the aim of preventing similarincidents in the future. On the basis of ananalysis of incidents in recent years andexchange of experience in the industry, Aker<strong>Kvaerner</strong> has developed and adopted a newcomponent in its HSE programme under thetitle Just Rules. Just Rules are a set of simplebut specific safety regulations for particularwork operations which experience suggestscould pose a higher level of risk. These ruleswill be implemented throughout Aker<strong>Kvaerner</strong> during <strong>2008</strong>. By making the mostimportant preventative measures obligatory,clear and simple, Just Rules will be animportant contribution to preventing seriousincidents.Sick leaveSick leave amounted to 2.4 percent of totalworking hours in <strong>2007</strong>, compared with 2.3percent the year before. The trend is for sickleave in the company to remain stable at alow level after a clear decline in 2003-06.It should be noted that differences in localregulations complicate a direct comparisonof sick leave between different countries.EnvironmentThe Board takes the view that Aker <strong>Kvaerner</strong>’sactivities pose only a limited direct burden onthe external environment. No unintentionaldischarges or emissions to the environmentwere recorded in <strong>2007</strong>. Total energy consumptionby the business in <strong>2007</strong>, based onrecorded use of oil, gas and electricity,amounted to 149 000 megawatt-hours. Theamount of waste recorded in connection withthe business totalled of 29 000 tonnes, ofwhich 13 000 were recycled.Improvements in environmental reportingwere instituted during <strong>2007</strong>, and fi guresrelated to energy consumption, greenhousegases and waste handling will be reportedwith greater accuracy from <strong>2008</strong>.The mentioned HSE initiatives on leadershipdevelopment, eLearning and the operatingsystem incorporate clear componentswhich focus attention on the environment.These contribute to continuous improvementsin environmental awareness and attitudesamong managers and other employees. Thatinspires the organisation to achieve furthergains in environmental performance in Aker<strong>Kvaerner</strong>’s own activities, and to assist customersin making environmental improvementsthrough the products developed bythe company. Examples can be found in suchareas as carbon capture, drilling rigs andbiofuels. The company is due to completetwo H-6e drilling rigs specially designed tooperate in demanding Arctic conditions whilesatisfying the goal of discharging no harmfulsubstances to the sea. In a strategic alliancewith Praj Industries Ltd, Aker <strong>Kvaerner</strong> iscommitted to offering technology, design andconstruction of biofuel production facilities.People and organisationDeveloping human resourcesAker <strong>Kvaerner</strong> depends on a highly positivereputation as an employer to attract the mostcompetent employees. To strengthen its visibilityand weight in the labour market the companyinitiated a global recruitment process,across business areas and national frontiers,in <strong>2007</strong>. The aim is to ensure that the largestnumber of potential candidates is exposed toa professional recruitment process in a marketand an industry where competition overqualified personnel is becoming ever tougher.This process involves a standardisation of therecruitment system and associated toolswhich ensure both a good overview of candidatesand their appropriate allocation.Enhanced selection quality is also achieved.In addition to securing access to resourcesthrough recruitment, Aker <strong>Kvaerner</strong> will givepriority to its commitment to continuing thedevelopment of expertise by individualemployees and by the organisation as awhole. An international trainee programmewas established under the Aker <strong>Kvaerner</strong>Lost Time Incident FrequencyPer 1 million worked hours, including subcontractors1.501.251.000.750.500.25Total Recordable Incident FrequencyPer 1 million worked hours, including subcontractors8642Sick Leave RatePercent of worked hours43210.00200420052006<strong>2007</strong>0200420052006<strong>2007</strong>0200420052006<strong>2007</strong>Aker <strong>Kvaerner</strong> annual report <strong>2007</strong> 33
Our performanceBoard of Directors’ reportAcademy in <strong>2007</strong>. During the year, twentytrainees from Brazil, China, Malaysia andRussia rotated through various positionsaround the world and around the company.The selection of the trainees was precededby international marketing campaigns tobuild the Aker <strong>Kvaerner</strong> brand in the selectedregions. Trainees in <strong>2008</strong> will be recruitedfrom India, Norway, Russia and Malaysia.Aker <strong>Kvaerner</strong> is strongly committed toleadership and expertise development as acompetitive advantage. The Aker <strong>Kvaerner</strong>Academy offers programmes in importantprofessional subject areas such as leadership,project execution, commercial managementand HSE. Around 24 000 employeescompleted an Academy programme during<strong>2007</strong>. Most of these courses were providedthrough eLearning. The portfolio of eLearningprogrammes has been expanded withcourses on executing a good recruitmentprocess, introductory for new employees,information security and the Risk Dashboard.More than 40 000 eLearning courses havebeen completed through Aker <strong>Kvaerner</strong>’sglobal eLearning portal since its launch in2006. The establishment of eLearning supportsboth global and corporate initiatives.With more than 24 000 direct employeesworldwide, the company has a great need forunifying, cost-effective and accessiblecourses. In addition to the professional competencethey provide in key areas such asthe project execution and HSE programme,these courses make a strong contribution tobuilding a common corporate culture througha uniform approach and consistent message.Corporate programmes offered across thecompany are supplemented by a number oftraining courses organised within Aker <strong>Kvaerner</strong>’sindividual units.The company carried out its global, valuesbasedemployee survey in <strong>2007</strong>. A responserate of roughly 90 percent indicated majorsupport and involvement among the workforcefor expressing their views about their companyand their workplace. The results were the bestever achieved by Aker <strong>Kvaerner</strong> in these polls.They were particularly good for DeliveringResults, one of the company’s core values.Findings for Customer Drive, People andTeams, Corporate Responsibility and HSEwere also good. Aker <strong>Kvaerner</strong> will work during<strong>2008</strong>-09 on priority improvement areas identifiedthrough the survey before a new poll isconducted in the autumn of <strong>2009</strong>.OrganisationAker <strong>Kvaerner</strong> is a knowledge and expertisecompany. Its business rests on the expertiseand skills of its workforce, combined with theability to combine and exploit this expertisewith experience.Aker <strong>Kvaerner</strong>’s workforce totalled 32 717people at 31 December, including 24 427employed directly and 8 290 on contract. Ofits own personnel, 47.3 percent worked inNorway, 27.2 percent in the Americas, 12percent in Asia, 12.9 percent in Europe outsideNorway and 0.6 percent in Africa andthe Middle East. Workforce turnover in <strong>2007</strong>averaged 10.4 percent, a decline of 0.3 percentfrom 2006. The Board notes that the stabilityof the company’s employees and managementpersonnel is good. In a challenginglabour market with high capacity requirements,Aker <strong>Kvaerner</strong> succeeded in recruiting4 040 people in <strong>2007</strong>.The company’s overriding guidelinesrequire that all employees are treated equally.Everyone has the right to enjoy a safe andsecure workplace, without any form of bullyingor harassment, as well as a satisfactorybalance between work and leisure. Theguidelines also provide a clear framework forsystematic employee development.Equal opportunitiesAker <strong>Kvaerner</strong> wants to be an attractive employerfor people regardless of their ethnicity,gender, religion or age. With operations inmore than 30 countries and on every continent,diversity is a desirable and positive partof the corporate culture and strengthens thecompany’s ability to operate in varying conditionsand frameworks. Aker <strong>Kvaerner</strong>’s policyis to pay the same salary for the samework, and to reward good performance. Keyfactors in determining pay are the area of responsibilityconcerned, what a job involves,the employee’s level of expertise and commitment,results actually achieved, and localpay levels. Average pay in the company issomewhat higher for men than for women.On average, male employees have greaterpay seniority than women. Aker <strong>Kvaerner</strong> hastwo main categories of employees: skilledworkers/operators (37 percent) and whitecollar personnel (63 percent). Women constitute3 percent of the fi rst category and 24percent of the second. The corporate managementteam had no female members at 31December. Three of Aker <strong>Kvaerner</strong>’s sixshareholder-elected Directors are women,which corresponds to 50 percent. None ofthe employee-elected Directors are women.A performance cultureAker <strong>Kvaerner</strong> is concerned to encouragegood performance, both by the organisationand by each of its employees. Systems haveaccordingly been developed for developingperformance and results and for employeerewards. These include using a combinationof methods to develop employees, manageperformance and results, and provide rewardsin relation to results achieved. Themost important instruments for managingperformance and results are: an annual performance and developmentcontract between manager and employee,where personal development and resultsachieved are followed up throughout theyear and evaluated at its endTotal workforceRegional distributionPermanent employeesRegional distributionContract staffRegional distribution0.6 %13.5 %11.9 %21.9 %52.2 %■ Norway■ America■ Asia-Pacific■ Africa &Middle East■ Europe ex.Norway0.6 %12.7 %12.0 %27.2 %47.3 %■ Norway■ America■ Asia-Pacific■ Africa &Middle East■ Europe ex.Norway0.6 %15.4 %11.5 %8.4 %64.6 %■ Norway■ America■ Asia-Pacific■ Africa &Middle East■ Europe ex.Norway34Aker <strong>Kvaerner</strong> annual report <strong>2007</strong>
Our performanceBoard of Directors’ report”Aker <strong>Kvaerner</strong>’s history and values,as well as the inspiration of internationalnorms are the basis of itscorporate responsibility principles.” a “360 degree” assessment of eachmanager, which provides them with feedbackfrom superiors, colleagues andsubordinates on their managementbehaviour and ability to lead in accordancewith Aker <strong>Kvaerner</strong>’s values an annual review of the company’s managementresources to identify talentedpersonnel and to ensure career development,optimum use of managers andmanagement mobility in the organisation a regular employee survey which providesthe basis for setting improvement targetsfor the organisation and managers.The most important instruments for rewardingmanagers and employees are: individual variable pay for managersbased on results achieved, personaldevelopment and leadership in accordancewith the Aker <strong>Kvaerner</strong>’s values variable pay for employees is also implementedbased on the unit’s results or theproject’s execution and results.Rewards for senior executives are spreadover several years to ensure that these personnelremain with Aker <strong>Kvaerner</strong> for the longterm.The company’s practice of variablepay for executives is an attractive and competitiveform of reward for managers whodeliver results. Further details of the remunerationof senior executives are otherwise providedin Note 18 to the consolidated accountson salaries, wages and social security costs.Corporate governanceAker <strong>Kvaerner</strong> is on the whole in compliancewith the Norwegian Code of Practice forCorporate Governance. Good corporategovernance plays a key role in Aker <strong>Kvaerner</strong>’sconfidence-building efforts. The companygives weight to building confidence amongits shareholders, lenders, customers, andother stakeholders. Ensuring a professionalindependence between the company’sBoard of Directors and its executive managementis essential in building and maintainingsuch confidence. Aker <strong>Kvaerner</strong>’sannual report on corporate governance,based on the code of practice issued by theNorwegian Corporate Governance Board(NCGB) and dated 4 December <strong>2007</strong>, canbe found on page 94 of this annual report.Corporate responsibilityAs a strong global company, Aker <strong>Kvaerner</strong>has an impact economically, environmentallyand in the lives of people globally. With thiscomes responsibility. The responsibility to sethigh standards, to be a business that isdriven by its values, to be a good corporatecitizen.Aker <strong>Kvaerner</strong>’s history and values, aswell as the inspiration of international normssuch as the UN Global Compact and the Global<strong>Report</strong>ing Initiative are the basis of itscorporate responsibility principles. The companyis committed to continually improvingits performance against them.As a global supplier to the energy industry,the company has singled out two areas ofcorporate responsibility on which to focus: managing the challenges associated withentry into new and emerging markets developing and supporting effectivesolutions in line with the demands ofenvironmental protection and sustainabledevelopmentIn <strong>2007</strong>, the company reviewed its corporatepolicies and updated the Corporate Responsibility(CR) principles contained within them.The company also published its CR report,Values Driven Business 2006/<strong>2007</strong>, whichcommunicates the CR challenges the companyfaces, the results it has achieved and itsambitions going forward. The report is availablefrom Aker <strong>Kvaerner</strong>’s website.In order to map awareness, understandingand use of our values, Aker <strong>Kvaerner</strong>conducted its <strong>2007</strong> People survey. The overallresults of the survey showed an improvementin both the understanding of, and compliancewith, our values from 2005–<strong>2007</strong>.As part of our continuous efforts toimprove our CR performance, the companycompleted the production of a CR eLearningprogramme. The programme is scheduled toroll out globally in the first quarter <strong>2008</strong> andwill be mandatory for all employees.At year end, Aker <strong>Kvaerner</strong> signed a threeyear global partnership with the NorwegianRed Cross. The partnership represents a significantfinancial donation, as well as anexchange of skills, competence and informationbetween the Red Cross and Aker <strong>Kvaerner</strong>.In addition, local employee volunteerprogrammes will be facilitated by Red Crossoffices globally.For the last five years, Aker <strong>Kvaerner</strong> hasbeen supporting Red Cross disaster reliefactivities with annual donations. This formalpartnership marks a more focused and integratedapproach toward the company’s communitysupport efforts. The partnership is aresult of an employee survey where the RedCross was chosen as the preferred partnerorganisation. In <strong>2008</strong>, all business units withinAker <strong>Kvaerner</strong> globally will be encouraged toparticipate and support Red Cross initiatives.Customer relationsAker <strong>Kvaerner</strong>’s customers are characterisedby responsibility for large and demandingprojects, where failure to meet agreeddeadlines, budgets, quality standards andproduction efficiency can have major consequences.The company is recognised for itsability to deliver and for contributing solutionswhich create added value for its customers.Those customers, leading players on theworld stage, have shown great confidence inAker <strong>Kvaerner</strong> over many years by awardingimportant projects to the company. This confidence represents a major asset, which it isimportant to preserve and continue developing.Customer Drive is one of Aker <strong>Kvaerner</strong>’score values. The company gives great weightto finding the best and most effective solutionsfor each customer. That is done by combiningan understanding of the customer’sspecific challenges with Aker <strong>Kvaerner</strong>’sexpertise, experience, technology and products- and not least with the aid of its recognisedand well-proven model for project execution,the PEM.Contact with customers is pursued at variouslevels - between senior executives,through the business area concerned,through project management and throughclose collaboration with relevant teams ofexperts. Both corporate management andmanagers at other levels have defined rolesfor ensuring the best possible follow-up witheach customer. Contact at several levelsensures a good overview and understandingof the customer’s requirements, both in theshort term and over a longer perspective.In addition to direct customer contact,Aker <strong>Kvaerner</strong> utilises external market analysesand surveys of customer satisfaction astools to ensure that it is meeting customerexpectations and needs.The company serves industries where thenumber of customers in each niche is relativelysmall. Most of these represent broadand long term potential for collaboration.Aker <strong>Kvaerner</strong> wants to establish good, longterm relations with its customers, based onperformance and on competitive tendering.Mutual confidence, built up through businessrelationships extending over manyyears, often helps to create new opportunities.These could involve new contracts withAker <strong>Kvaerner</strong> annual report <strong>2007</strong> 35
Our performanceBoard of Directors’ reporteven better reward models, for instance, orthe development of innovative solutions andtechnology in close collaboration with thecustomer. Confidence is also valuable whenconsidering projects in new regions. It will oftenbe easier to manage risk, for instance, when thecustomer has an established relationship withAker <strong>Kvaerner</strong> from earlier collaboration.OutlookThe Board would like to point out that this reportincludes and is based on, inter alia, forward-lookinginformation and statements thatare subject to risks and uncertainties thatcould cause actual results to differDemand for energy is expected to continuerising in the years to come, providingfurther growth opportunities for Aker <strong>Kvaerner</strong>.Since fossil fuels will remain the world’sprimary energy source in coming decades,much of this expansion must take place inthe oil and gas sector. That means continuedgrowth in the market for development, technologyand services related to oil and gasfi elds. Aker <strong>Kvaerner</strong> is well positioned totake its share of the expected increase, particularlyin south-east Asia - primarily inMalaysia, India and China - as well as inSouth America, in Africa and in Arctic regions.Increased need for energy is expected toencourage persistently high prices for oil andgas. Future projects will to a greater extentembrace fields where both the actual developmentand achieving a high recovery factorfor the reserves will be more complex anddemanding. That will in turn contribute toinvestment in solutions for enhancing therecovery factor in established fi elds, and willalso lead to the development of discoveriesin ultra deepwaters and harsh-weather areas.Aker <strong>Kvaerner</strong> has state-of-the-art expertise,advanced technology and practical experiencewhich will be exploited as competitiveadvantages in securing such assignments.The outlook is also good in the marketniches for process technology and landbasedplants. Customers in the mining andmetallurgical industries are expected to facea continuing need for major investment inupgrading existing facilities and developingnew ones to meet international demand. Thegenerally high level of activity in global industrywill also sustain a high level of demand forenergy and processed products derivedfrom oil and gas. Aker <strong>Kvaerner</strong> utilises anumber of leading patented technologies asthe basis for the processing plants it deliversto customers in these segments.In addition to continuing the developmentof its existing organisation, Aker <strong>Kvaerner</strong>will increasingly assess opportunities forattractive acquisitions. Such acquisitionscould typically be implemented where theyprovide the company with the possibility ofcomplementing its value chain, or where theyoffer the chance of increasing market shareor combining existing operations with newmarket niches in an effective model.The company is considering the acquisitionof businesses which can further strengthen itsexpansion, and will concentrate its attention onsmall and medium-sized enterprises whichcan help to supplement existing expertise,products and/or technologies.At Aker <strong>Kvaerner</strong>’s annual Capital MarketsDay in December 2006, an objectiveof delivering an EBITDA margin of between6.5 and 7 percent by the end of <strong>2007</strong> wasannounced. This objective was achieved,with an EBITDA margin of 6.8 percent, in thesecond quarter of <strong>2007</strong>.Aker <strong>Kvaerner</strong> has clear ambitions of continuingto increase shareholder value. Itaccordingly has clear requirements thatfuture growth must also be profitable, andmeet the goal of increasing profits and marginsfaster than revenues. Operating revenuesin <strong>2008</strong> are expected to rise to NOK58-60 billion. The Board regards the orderbacklog as comfortable, and expects to seeoperating revenues rise by eight to 10 percentannually in the <strong>2009</strong>-10 period.Aker <strong>Kvaerner</strong> is expected to maintain itssteady progress in profitability. An EBITDAmargin of approximately eight percent hasbeen forecast for <strong>2008</strong>, and the goal is that thisfigure will reach nine to 11 percent by <strong>2010</strong>.These performance targets build on Aker <strong>Kvaerner</strong>’ssolid order backlog and good marketprospects in the energy and process industries.The Subsea and Products & Technologies businessareas are expected to yield an EBITDAmargin in double digits. The three other businessareas – Field Development, Maintenance,Modifications and Operations and Process &Construction – are expected to show highsingle-digit margins. These performance targetsexclude the effect of possible acquisitions.Earnings per share for Aker <strong>Kvaerner</strong> areexpected to increase by an annual averageof 15-20 percent in <strong>2008</strong>-10.The company gives great weight to safeguardingand continuing to develop its expertise.This is done in part through various programmesfor expertise building and rewardingof employees, and through purposefuland broad-based recruitment of new personnel.Aker <strong>Kvaerner</strong>’s goal is to reduceemployee turnover to less than nine percent.Set to be pursued further with high intensity,the improvement programmes introduced in<strong>2007</strong> will help Aker <strong>Kvaerner</strong> to reduce its costbase by NOK 1 billion over the next two tothree years when compared with <strong>2007</strong>.The Board extends its thanks to the managementand workforce for the good resultsdelivered in <strong>2007</strong> and for the major commitmentmade to creating further progress atAker <strong>Kvaerner</strong>.Fornebu, 4 March <strong>2008</strong>The Board of Directors of Aker Kværner ASALeif-Arne LangøyChairmanBjørn FlatgårdVice ChairmanHeidi M. Petersen Karl Erik Kjelstad Ingebreth Forus Atle TeiglandVibeke HammerMadsenSiri Fürst Åsmund Knutsen Arve Toft Simen LieunghPresident & CEO36Aker <strong>Kvaerner</strong> annual report <strong>2007</strong>
Our performanceContents: Accounts and notesAker <strong>Kvaerner</strong> group38 Consolidated income statement39 Consolidated balance sheet40 Consolidated statement of cash flow41 Consolidated statement of changes to equityNotes to consolidated accounts42 Note 1 General information42 Note 2 Accounting principles46 Note 3 Accounting estimates and judgements47 Note 4 Acquisition of businesses48 Note 5 Related parties49 Note 6 Segment information51 Note 7 Other operating expenses51 Note 8 Net operating assets51 Note 9 Current operating assets52 Note 10 Current operating liabilities52 Note 11 Contracts53 Note 12 Provisions53 Note 13 Contingent events54 Note 14 Property, plant and equipment55 Note 15 Operating leases56 Note 16 Intangible assets56 Note 17 Tax58 Note 18 Salaries, wages and social security costs61 Note 19 Number of employees61 Note 20 Employee benefits – pension64 Note 21 Investments accounted for in accordance withthe equity method65 Note 22 Investment in joint ventures65 Note 23 Financial risk management69 Note 24 Financial income and expenses70 Note 25 Financial instruments70 Note 25.1 Cash and cash equivalents71 Note 25.2 Investments in other companies71 Note 25.3 Derivative financial instruments72 Note 25.4 Non-current interest-bearing receivables72 Note 25.5 Trade and other receivables73 Note 25.6 Non-current borrowings74 Note 26 Subsequent events74 Note 27 Discontinued operations75 Note 28 Group companies as at 31 December <strong>2007</strong>Aker Kværner ASA78 Parent company income statement79 Parent company balance sheet80 Parent company statement of cash flow81 Accounting principlesNotes to parent company accounts82 Note 1 Operating expenses82 Note 2 Net financial items82 Note 3 Tax83 Note 4 Investment in subsidiaries and other companies83 Note 5 Non interest-bearing items84 Note 6 Shareholders’ equity84 Note 7 Interest-bearing items85 Note 8 Non-current borrowings85 Note 9 Guarantees85 Note 10 Financial instruments85 Note 11 Contingent events and related partiesAker <strong>Kvaerner</strong> annual report <strong>2007</strong> 37
Our performanceAker <strong>Kvaerner</strong> group:Consolidated income statementAmounts in NOK million Note <strong>2007</strong> 2006 2005Revenue 6 57 957 50 592 36 940Materials, goods and services - 36 405 - 31 299 - 21 294Salaries, wages and social security costs 18, 19, 20 - 12 197 - 10 441 - 9 699Other operating expenses 7 - 5 442 - 5 980 - 4 131Total operating expenses - 54 044 - 47 720 - 35 124Operating profit before depreciation 6 3 913 2 872 1 816Depreciation 6, 14, 16 - 431 - 339 - 306Operating profit 3 482 2 533 1 510Financial income 24 105 194 68Financial expense 24 - 209 - 1 081 - 467Share of profit (+) / loss (-) of associates 6, 21 - 2 - 18 25Profit (+) / loss (-) on foreign currency forward contracts 1) 24 162 241 - 396Profit before tax 3 538 1 869 740Income tax expense 17 - 1 074 - 575 312Net profit from continuing operations 2 464 1 294 1 052Profit for the period from discontinued operations (net of tax) - 2 495 193Profit for the period 2 464 3 789 1 245Attributable toEquity holders of the parent company 2 401 3 738 1 229Minority interests 63 51 16Net profit 2 464 3 789 1 245Average number of shares 271 741 367 275 146 170 275 146 170Basic and diluted earnings per share continuing operations (NOK) 2) 8.84 4.53 3.77Basic and diluted earnings per share from discontinued business (NOK) 0.00 9.06 0.70Basic and diluted earnings per share (NOK) 2) 8.84 13.59 4.471) Profit / loss on foreign currency hedging instruments which do not qualify for hedge accounting.2) Equity holders of the parent company’s share of net profit (+) / loss (-) / average number of shares. There were no potentially dilutive securities outstanding.38Aker <strong>Kvaerner</strong> annual report <strong>2007</strong>
Our performanceAker <strong>Kvaerner</strong> group:Consolidated balance sheet as at 31.12Amounts in NOK million Note <strong>2007</strong> 2006ASSETSNon-current assetsProperty, plant and equipment 14 2 815 1 761Deferred tax assets 17 548 552Intangible assets 16 4 995 5 054Pension funds 20 15 4Interest-bearing non-current receivables 25.4 14 54Other non-current operating assets 8 9 6Investments in associates 6, 21 121 122Investments in other companies 25.2 133 16Total non-current assets 8 650 7 569Current assetsPrepaid income tax 17 89 86Inventories 9 884 593Trade and other receivables 9, 25.5 13 361 13 712Derivative financial instruments 25.3 1 468 813Interest-bearing current receivables 25 540 546Deposit to repay second priority lien notes 25 - 2 411Cash and cash equivalents 25.1 3 524 5 666Total current assets 19 866 23 827Total assets 28 516 31 396LIABILITIES AND SHAREHOLDERS' EQUITYEquityIssued capital 548 550Own shares - 9 -Other capital paid in 1 534 1 534Other equity 5 026 5 899Total equity attributable to the equity holders of the parent company 7 099 7 983Minority interest 168 131Total equity 7 267 8 114LiabilitiesBorrowings 25.6 1 998 2 126Employee benefits 20 937 931Deferred tax liabilities 17 680 60Other non-current operating liabilities 8 507 316Total non-current liabilities 4 122 3 433Second priority lien notes 25.6 - 2 329Interest-bearing current liabilities 25 24 -Income tax payable 17 329 230Provisions 10, 12 655 602Trade and other payables 10 15 165 16 217Derivative financial instruments 25.3 954 471Total current liabilities 17 127 19 849Total liabilities 21 249 23 282Total liabilities and shareholders' equity 28 516 31 396Fornebu, 4 March <strong>2008</strong>The Board of Directors of Aker Kværner ASALeif-Arne LangøyChairmanBjørn FlatgårdVice ChairmanHeidi M. Petersen Karl Erik Kjelstad Ingebreth Forus Atle TeiglandVibeke HammerMadsenSiri Fürst Åsmund Knutsen Arve Toft Simen LieunghPresident & CEOAker <strong>Kvaerner</strong> annual report <strong>2007</strong> 39
Our performanceAker <strong>Kvaerner</strong> group:Consolidated statement of cash fl owAmounts in NOK million Note <strong>2007</strong> 2006 1)Cash flow from operating activitiesProfit for the period 2 464 3 789Tax cost 17 1 074 640Net interest cost 104 887Profit (-) / loss (+) on foreign currency forward contracts - 162 - 241Depreciation 14, 16 431 393Profit (-) / loss (+) on disposals / non cash effects 2) - 64 - 2 483Share of profit (-) / loss (+) of associates 21 2 18Interest paid - 172 - 450Interest received 43 214Income taxes paid - 480 - 311Changes in other net operating assets - 565 180Net cash from operating activities 2 675 2 636Cash flow from investing activitiesAcquisition of businesses / net of cash acquired 4 - 87 - 276Disposal of businesses / net of cash disposed of 3) - 2 054Acquisition of property, plant and equipment 6,14 - 1 596 - 826Proceeds from sale of property, plant and equipment 96 127Changes in other assets 11 - 94Net cash from investing activities - 1 576 985Cash flow from financing activitiesProceeds from non-current debt - 1 577Repayment of non-current debt 25.6 - 19 - 3 535Deposit to repay second priority lien notes - - 2 411Dividends paid to minority interests - 31 - 44Buy-back of own shares 4) - 781 -Dividends to shareholders 4) - 2 182 - 275Net cash from financing activities - 3 013 - 4 688Effect of exchange rate changes on cash and bank deposits - 228 - 13Net increase (+) / decrease (-) in cash and bank deposits - 2 142 - 1 080Cash and cash equivalents at the beginning of the period 5 666 6 746Cash and cash equivalents at the end of the period 5) 3 524 5 666Of which is restricted cash 6) 661 1 1461) The cash flow from operations of Pulping & Power is included above for 2006.2) Gain on disposal of Pulping & Power and Aker Kværner Power & Automation is included in non cash effects.3) Pulping & Power and Aker Kværner Power & Automation were sold in 2006.4) See consolidated statement of changes to equity.5) Additional undrawn committed non-current bank revolving credit facilities amounted to NOK 6.0 billion, and is together with cash and cash equivalents giving a total liquidity bufferof NOK 9.5 billion.6) Restricted cash includes inter alia cash in joint ventures where the partners must agree before use.40Aker <strong>Kvaerner</strong> annual report <strong>2007</strong>
Our performanceAker <strong>Kvaerner</strong> group:Consolidated statement of changes to equityAmounts in NOK millionNumber ofsharesSharecapitalOwnsharesOthercapitalpaid inRetainedearningsand otherreservesHedgingreserveTranslationreserveTotal attributabletoparent companyequityholdersMinorityinterestsTotalequityEquity as at 1 January 2006 55 029 234 550 - 1 534 2 394 - - 216 4 262 65 4 327Dividend - - - 275 - - - 275 - - 275Profit for the period - - 3 738 - - 3 738 51 3 789Change in minority interests 59 59Dividend to minority interests - 44 - 44Cash flow hedgesEffective portion of changes in value - - - 461 - 461 - 461Reclassified to income statement - - - - 178 - - 178 - - 178Deferred tax - - - - 80 - - 80 - - 80Currency translation differences - - - - 55 55 - 55Equity as at 31 December 2006 55 029 234 550 - 1 534 5 857 203 - 161 7 983 131 8 114Increase caused by share split (1:5) 220 116 935Dividend - - - - 2 182 - - - 2 182 - - 2 182Share buy-back - - - 11 - - 770 - - - 781 - - 781Cancellation of shares - 1 146 170 - 2 2 - - - - - - -Profit for the period - - - 2 401 - - 2 401 63 2 464Change in minority interests - 11 - 11Dividend to minority interests - 15 - 15Cash flow hedgesEffective portion of changes in value - - - 788 - 788 - 788Reclassified to income statement - - - - 633 - - 633 - - 633Deferred tax - - - - 43 - - 43 - - 43Currency translation differences - - - - - 434 - 434 - - 434Equity as at 31 December <strong>2007</strong> 274 000 000 548 - 9 1 534 5 306 315 - 595 7 099 168 7 267Share capitalAker Kværner ASA has one class of shares, ordinary shares, with equal rights for all shares. The holders of ordinary shares are entitled to receive dividend asdeclared from time to time and are entitled to one vote per share at General meetings. At the end of 2006 Aker Kværner ASA had 55 029 234 ordinary shares at apar value of NOK 10 per share. On the <strong>Annual</strong> General Meeting in March <strong>2007</strong> the shareholders agreed to split one share at a par value of NOK 10 into five sharesat par value of NOK 2. The new number of shares after the share split is 275 146 170. At the <strong>Annual</strong> General Meeting the shareholders also agreed to reduce theshare capital in Aker Kværner ASA by NOK 2 292 340 to NOK 548 000 000 through cancellation of 1 146 170 treasury shares. Total outstanding shares are now274 000 000. All issued shares are fully paid.Share buy-backOn the <strong>2007</strong> <strong>Annual</strong> General Meeting’s it was given an authorisation for share buy backs to purchase up to 27.4 million shares, representing 10 percent of the sharecapital of Aker Kværner ASA. Aker Kværner ASA owned 4 371 830 own shares at the end of <strong>2007</strong> which represented 1.6 percent of total outstanding shares. As at4 March <strong>2008</strong> Aker Kværner ASA has purchased further 595 000 own shares and holds 4 966 830 own shares representing 1.8 percent of total outstanding shares.Hedging reserveThe hedging reserve relates to hedge of future revenues and expenses against exchange rate fluctuations. The income statement effects of such instruments arerecognised in accordance with progress of the underlying construction contract as part of revenues or expenses as appropriate. The hedging reserve representsthe value of such hedging instruments that are not yet recognised in the income statement. Users of the financial statment should be aware of the underlying nature ofa hedge; e.g that a positive value on a hedging instrument exists to cover a negative value on the hedged position, see note 24 Financial income and expense.Translation reserveTranslation reserve includes exchange differences arising from the translation of the net investment in foreign operations, and foreign exchange gain / loss onloans defined as hedges / net investments, see note 24 Financial income and expense..Minority interestsPer 31 December <strong>2007</strong> NOK 70 million (NOK 51 million in 2006) of the minority interests relates to Aker Marine Contractors AS in which Aker <strong>Kvaerner</strong> owns60 percent and NOK 75 million (NOK 71 million in 2006) to Aker <strong>Kvaerner</strong> Powergas Pvt Ltd where Aker <strong>Kvaerner</strong> owns 64 percent of the shares. The change inminority interests in <strong>2007</strong> is primarily due to the acquisition of the last 9.9 percent in Aker Insurance AS in August <strong>2007</strong>.Dividends 1) <strong>2007</strong> 2006Dividend per share in NOK – paid 8,00 1,00Ordinary dividend per share in NOK – proposed by the Board of Directors 3,00 2,00Extraordinary dividend per share in NOK – proposed by the Board of Directors - 6,001) Dividend is adjusted on the basis of the share split.Aker <strong>Kvaerner</strong> annual report <strong>2007</strong> 41
Our performanceAker <strong>Kvaerner</strong> group:Notes to the accountsNote 1: General InformationAker Kværner ASA (the company) is a limited liability company incorporated and domiciled in Norway. The consolidated fi nancial statements of Aker KværnerASA incorporate the financial statements of the company and its subsidiaries (together referred to as the “group”) and the group’s interest in associates andjointly controlled entities and jointly controlled assets.The company is listed on the Oslo Stock Exchange.The fi nancial statements are presented in million Norwegian kroner (NOK).Note 2: Accounting principlesA summary of the principal accounting policiesapplied in the preparation of these consolidatedfinancial statements are set out below. Thesepolicies have been consistently applied to all theyears presented, unless otherwise stated.Statement of complianceThe consolidated financial statements have beenprepared in accordance with International Financial<strong>Report</strong>ing Standards (IFRS) approved by the EuropeanUnion and its interpretations adopted by theInternational Accounting Standards Board (IASB).New standards effective in <strong>2007</strong>IFRS 7, Financial instruments: Disclosures and thecomplementary Amendment to IAS 1, Presentationof Financial Statements-Capital disclosures wereadopted in <strong>2007</strong>. IFRS 7 introduces new disclosuresrelating to financial instruments. This standarddoes not have any impact on the classification andvaluation of the group’s financial instruments.IFRIC 11 – Group and Treasury Share Transactionsare implemented with no material effect.The following IFRS/IAS standards have beenapproved but effective from <strong>2009</strong>, with earlier applicationpermitted. These standards are not implementedwith effect for the financial statements for <strong>2007</strong>. IAS 23 – Borrowing costs IFRS 8 – Operating segments IAS 1 – Presentation of financial statements IAS 32 – Financial instruments – PresentationExcept for the standard on borrowing costs, it isassumed that the new standards will have onlyinsignificant effect on reported results or balancesheet items. The main effects will relate topresentation formats for financial statements andfor the note disclosures.The standard on borrowing costs requires thatinterest be included as part of the cost ofqualifying assets which includes property plantand equipment and construction contracts.Today, borrowing costs are expensed as incurred.Although the company does not believe the newstandard will have a significant impact on itsfinancial statements in the aggregate, there couldbe some effects within segment reporting.Basis of preparationThe consolidated financial statements have beenprepared under the historical cost convention, asmodified by the revaluation of available-for-salefinancial assets and financial assets and financialliabilities (including derivative instruments) at fairvalue through profit and loss.Non-current assets and disposal groups heldfor sale are stated at the lower of carryingamount or fair value less costs to sell.The preparation of fi nancial statements inconformity with IFRS requires management tomake judgements, estimates and assumptionsthat affect the application of policies and reportedamounts of assets and liabilities, income andexpenses. The estimates and associated assumptionsare based on historical experience and variousother factors that are believed to be reasonableunder the circumstances, the results of which formthe basis of making the judgements about carryingvalues of assets and liabilities that are not readilyapparent from other sources. The areas involving ahigher degree of judgement or complexity, or areaswhere assumptions and estimates are significant tothe consolidated financial statements are disclosedin note 3 Accounting estimates and judgements.Actual results may differ from these estimates.The estimates and underlying assumptionsare reviewed on an ongoing basis. Revisions toaccounting estimates are recognised in theperiod in which the estimate is revised if the revisionaffects only that period or in the period ofthe revision and future periods if the revisionaffects both current and future periods.ConsolidationSubsidiariesSubsidiaries are entities controlled by the company.Control exists when the company has the power,directly or indirectly, to govern the financial andoperating policies of an entity so as to obtain benefitsfrom its activities. In assessing control, potentialvoting rights that presently are exercisable or convertibleare taken into account. The financial statementsof subsidiaries are included in the consolidatedfinancial statements from the date that controlcommences until the date that control ceases.Intragroup balances and any unrealised gainsand losses or income and expenses arising fromintragroup transactions, are eliminated in preparingthe consolidated financial statements. Unrealisedgains arising from transactions with associatesand jointly controlled entities are eliminatedto the extent of the group’s interest in the entity.Unrealised losses are eliminated in the same wayas unrealised gains, but only to the extent thatthere is no evidence of impairment.In preparing their individual financial statements,the accounting policies of some subsidiaries,associates and Joint Ventures do not conformto the accounting policies of the group.Where appropriate, adjustments are made inorder to present the consolidated financial statementson a consistent basis.AssociatesAssociates are those entities in which the grouphas significant influence, but not control, over thefi nancial and operating policies. Generally this isapplicable to a shareholding of between 20percent and 50 percent of the voting rights.The consolidated financial statements includethe group’s share of the total recognised gains andlosses of associates on an equity accounted basis,from the date that significant influence commencesuntil the date that significant influence ceases.When the group’s share of losses exceeds itsinterest in an associate, the group’s carryingamount is reduced to nil and recognition of furtherlosses is discontinued except to the extent that thegroup has incurred legal or constructive obligationsor made payments on behalf of an associate.Joint venturesJoint ventures are those entities over whose activitiesthe group has joint control, established bycontractual agreement. The consolidated financialstatements include the group’s proportionate shareof the entities’ assets, liabilities, revenue and expenseswith items of a similar nature on a line byline basis, from the date that joint control commencesuntil the date that joint control ceases.Non-current assets held for sale anddiscontinued operationsA discontinued operation is a component of thegroup’s business that represents a separatemajor line of business or geographical area ofoperations or is a subsidiary acquired exclusivelywith a view to resale.Classification as a discontinued operation occursupon disposal or when the operation meets the criteriato be classified as held for sale, if earlier. A disposalgroup that is to be abandoned may also qualify.42Aker <strong>Kvaerner</strong> annual report <strong>2007</strong>
Our performanceUpon classification of a business as a discontinuedoperation, the historical income statementsare restated and the applicable individual incomestatement balances are reclassified into oneseparate line under Net profit/loss in the incomestatement for all reporting periods. In the balancesheet no reclassifications are made for yearsprior to the year a business is first classified as adiscontinued operation.Segment reportingA segment is a distinguishable component of thegroup that is engaged either in providingproducts or services (business segment), or inproviding products or services within a particulareconomic environment (geographical segment),which is subject to risks and rewards that aredifferent from those of other segments.The operating segments are also consistent withthe group’s organisation into business segments.Revenue recognitionConstruction contractsEngineering and construction contract revenuesare recognised using the percentage of completionmethod, based primarily on contract costincurred to date compared to estimated total contractcosts. When the final outcome of a contractcannot be reliably estimated, contract revenue isrecognised only to the extent of costs incurred thatare expected to be recoverable. Losses on contractsare fully recognised when identified.Contract revenues include variation ordersand incentive bonuses when it is probable thatthey will result in revenue and the amount can bemeasured reliably. Disputed amounts are recognisedwhen their realisation is reasonably certainand can be measured reliably. Contract costsinclude costs that relate directly to the specificcontract and costs that are attributable to contractactivity in general and can be allocated tothe contract. Costs that cannot be attributed tocontract activity are expensed. Bidding costs arecapitalised when it is probable that the companywill be the preferred bidder. All other biddingcosts are expensed as incurred.Goods sold and services renderedRevenue from the sale of goods is recognised inthe income statement when the significant risksand rewards of ownership have been transferredto the buyer. Revenue from services rendered isrecognised in the income statement in proportionto the stage of completion of the transaction atthe balance sheet date. The stage of completionis normally assessed as the proportion that costincurred for work performed to date bear to theestimated contract costs. No revenue is recognisedif there are significant uncertainties regardingrecovery of the consideration due, associatedcosts or the possible return of goods alsocontinuing management involvement with thegoods.Government grantsGovernment grants are recognised in thebalance sheet initially as deferred income whenthere is reasonable assurance that they will bereceived and that the group will comply withapplicable conditions. Grants that compensatethe group for expenses incurred are recognisedas revenue in the income statement on asystematic basis in the same periods in which theexpenses are incurred. Grants that compensatethe group for the cost of an asset are deductedfrom acquisition cost.ExpensesOperating lease paymentsPayments made under operating leases arerecognised in the income statement on a straightlinebasis over the term of the lease when thereare variations in the contractual lease paymentsdue under the contract terms. Lease incentivesreceived are recognised in the income statementas an integral part of the total lease expense.Finance lease paymentsMinimum lease payments are apportioned betweenthe finance charge and the reduction of the outstandingliability. The finance charge is allocatedto each period during the lease term so as toproduce a constant periodic rate of interest onthe remaining balance of the liability.Financial income and expenseFinancial income and expense comprise interestpayable on borrowings calculated using the effectiveinterest rate method, interest receivable onfunds invested, dividend income, foreign exchangegains and losses, and gains and losses onhedging instruments that are recognised in theincome statement (see Hedging activities). Interestincome is recognised in the income statement as itaccrues, using the effective interest method. Theinterest expense component of finance leasepayments is recognised in the income statementusing the effective interest rate method.Gains or losses arising from changes in thefair value of the fi nancial assets at fair valuethrough profit or loss category are presented inthe income statement within net financial items, inthe period in which they arise.Dividend income from financial assets at fairvalue through profit or loss is recognised in theincome statement as part of net financial itemswhen the group’s right to receive payments isestablished.Changes in the fair value of monetary securitiesdenominated in a foreign currency and classifiedas available for sale are analysed betweentranslation differences resulting from changes inamortised cost of the security and other changesin the carrying amount of the security. The translationdifferences on monetary securities arerecognised in profit and loss; translation differencesin non-monetary securities are recognised inequity. Changes in the fair value of monetary andnon-monetary securities classified as availablefor sale are recognised in equity.When securities classified as available for saleare sold or impaired, the accumulated fair valueadjustments recognised in equity are included inthe income statement as gains and losses frominvestment securities.Interest on available-for-sale securities calculatedusing the effective interest method is recognisedin the income statement as part of netfinancial items when the group’s right to receivepayments is established.Trade and other receivablesTrade and other receivables are carried at theoriginal invoice amount, less an allowance madefor doubtful receivables. Provision is made whenthere is objective evidence that the group will beunable to recover balances in full. Balances arewritten off when the probability of recovery isassessed as being remote.Construction work in progressConstruction work in progress represents thevalue of construction work performed less paymentsby customers. The value of constructionwork performed is measured at revenue recognisedto date. Payments by customers are deductedfrom the value of the same contract or, to the extentthey exceed this value, disclosed as advancesfrom customers (see revenue recognition).InventoriesInventories are stated at the lower of cost or netrealisable value. Net realisable value is the estimatedselling price in the ordinary course ofbusiness, less the estimated costs of completionand selling expenses.The cost of inventories is based on the fi rst-infi rst-out principle and includes expendituresincurred in acquiring the inventories and bringingthem to their existing location and condition. Inthe case of manufactured inventories and work inprogress, cost includes an appropriate share ofoverheads based on normal operating capacity.Property, plant and equipmentOwned assetsProperty, plant and equipment are stated at costless accumulated depreciation (see below) andimpairment losses (see Impairment). The cost ofself-constructed assets includes the cost of materials,direct labour, and, where relevant, of theestimated costs of dismantling and removing theitems and restoring the site on which they arelocated, and an appropriate proportion of productionoverheads.Where components of property, plant andequipment have different useful lives, they areaccounted for as separate components.Leased assetsLeases where the group assumes substantiallyall the risks and rewards of ownership are classified as finance leases. Assets acquired by way offi nance leases are stated at an amount equal tothe lower of its fair value or the present value ofthe minimum lease payments at inception of thelease, less accumulated depreciation (see below)and impairment losses (see Impairment).Subsequent costsThe group capitalises cost of replacing part orcomponent of property, plant and equipmentwhen that cost is incurred if it is probable that thefuture economic benefits embodied with the itemwill flow to the group and the cost of the item canbe measured reliably. All other costs are expensedas incurred.DepreciationDepreciation is normally recognised on a straightlinebasis over the estimated useful lives of property,plant and equipment. The production unit methodis used for depreciation when appropriate.Intangible assetsGoodwillAll business combinations are accounted forusing the acquisition method. Goodwill representsthe excess of the cost of an acquisitionover the fair value of the group’s share of the netidentifiable assets of acquired businesses orinterest in associates or joint ventures that arebusinesses at the date of acquisition. Goodwillon acquisitions of subsidiaries is included inintangible assets. Goodwill on acquisitions ofassociates and joint ventures is included in theinvestment balance and is tested for impairmentas part of the overall balance. Goodwill is carriedat cost less accumulated impairment losses (seeImpairment). Gains and losses on the disposal ofan entity or an interest in an entity include theAker <strong>Kvaerner</strong> annual report <strong>2007</strong> 43
Our performancecarrying amount of goodwill relating to theownership interest sold. Negative goodwill arisingon an acquisition is recognised directly in theincome statement.Goodwill is assumed to have indefinite usefullife because there is no foreseeable limit to theperiod over which the asset is expected to generatenet cash inflows for the entity. The acquisitionof a company is based upon its strategic fit andanticipated profitability of that company over along time period.Goodwill is allocated to cash-generating unitsfor the purpose of impairment testing. The allocationis made to those cash generating units orgroups of cash-generating units that are expectedto benefit from the business combination inwhich goodwill arose.Research and developmentResearch and development work in Aker <strong>Kvaerner</strong>is normally related to customer contracts and areincluded as contract costs.Expenditures on research activities, undertakenwith the prospect of obtaining new scientific ortechnical knowledge and understanding, is recognisedin the income statement as an expense asincurred.Expenditures on development activities, wherebyresearch findings are applied to a plan or designfor the production of new or substantially improvedproducts and processes, is capitalised if theproduct or process is technically and commerciallyfeasible as well as being a separable asset.Capitalised costs include the cost of materials,external contractors and direct labour. Otherdevelopment expenditures are recognised in theincome statement as an expense as incurred.Capitalised development expenditures are statedat cost less accumulated amortisation (seebelow) and impairment losses (see Impairment).Other intangible assetsOther intangible assets that are acquired by thegroup are stated at cost less accumulated amortisation(see below) and impairment losses (seeImpairment).Subsequent expendituresSubsequent expenditures on capitalised intangibleassets are capitalised only when they increasethe future economic benefits embodied in thespecific asset to which they relate. All otherexpenditures are expensed as incurred.AmortisationAmortisation is charged to the income statementon a straight-line basis over the estimated usefullives of intangible assets unless such lives areindefinite. Intangible assets are amortised fromthe date they are available for use.ImpairmentThe carrying amounts of the group’s assets,other than inventories (see Inventories) and deferredtax assets (see Income tax), are annuallyreviewed to determine whether there is any indicationof impairment. If any such indicationexists, the asset’s recoverable amount is estimated(see Calculation of recoverable amount).For goodwill, assets that have an indefiniteuseful life and intangible assets that are not yetavailable for use, the recoverable amount is estimatedannually.An impairment loss is recognised whenever thecarrying amount of an asset or its cash-generatingunit exceeds its recoverable amount. Impairmentlosses are recognised in the income statement.Impairment losses recognised in respect ofcash-generating units are allocated first to reducethe carrying amount of any goodwill allocated tocash-generating units (group of units) and then, toreduce the carrying amount of the other assets inthe unit (group of units) on a pro rata basis.Goodwill and indefinite-lived intangible assetswere tested for impairment at year end.When a decline in the fair value of an availablefor-salefinancial asset has been recogniseddirectly in equity and there is objective evidencethat the asset is impaired, the cumulative loss thathad been recognised directly in equity is recognisedin profit or loss even though the financialasset has not been derecognised. The amount ofthe cumulative loss that is recognised in profit orloss is the difference between the acquisitioncost and current fair value, less any impairmentloss on that financial asset previously recognisedin profit or loss.Calculation of recoverable amountThe recoverable amount of the group’s investmentsin held-to-maturity securities and receivablescarried at amortised cost is calculated asthe present value of estimated future cash flows,discounted at the original effective interest rate(i.e., the effective interest rate computed at initialrecognition of these financial assets). Receivableswith a short duration are not discounted.The recoverable amount of other assets is thegreater of their net selling price and value in use.In assessing value in use, the estimated futurecash flows are discounted to their present valueusing a pre-tax discount rate that reflects currentmarket assessments of the time value of moneyand the risks specific to the asset. For an asset thatdoes not generate largely independent cash inflows,the recoverable amount is determined for the cashgeneratingunit to which the asset belongs.Reversals of impairmentAn impairment loss in respect of a held-to-maturitysecurity or receivable carried at amortised cost isreversed if the subsequent increase in recoverableamount can be related objectively to an event occurringafter the impairment loss was recognised.An impairment loss in respect of an investmentin an equity instrument classified as available forsale is not reversed through profit or loss. If the fairvalue of a debt instrument classified as availablefor-saleincreases and the increase can beobjectively related to an event occurring after theimpairment loss was recognised in profit or loss,the impairment loss shall be reversed, with theamount of the reversal recognised in profit or loss.An impairment loss in respect of goodwill isnot reversed.In respect of other assets, an impairment loss isreversed if there has been a change in the estimatesused to determine the recoverable amount.An impairment loss is reversed only to theextent that the asset’s carrying amount does notexceed the carrying amount that would have beendetermined, net of depreciation or amortisation, ifno impairment loss had been recognised.ProvisionsA provision is recognised in the balance sheet whenthe group has a present obligation as a result of apast event that is probable that the group will berequired to settle. If the effect is material, provisionsare determined by discounting the expected futurecash flows at a market based pre-tax rate that reflectscurrent market assessments of the time valueof money and, where appropriate, the risks specificto the liability.WarrantiesA provision for warranties is recognised when theunderlying products or services are sold. Theprovision is based on historical warranty dataand a weighting of all possible outcomes againsttheir associated probabilities.RestructuringA provision for restructuring is recognised whenthe group has approved a detailed and formalrestructuring plan, and the restructuring haseither commenced or has been announcedpublicly. Future operating costs are not provided for.Site restorationIn accordance with the group’s applicable legalrequirements, a provision for site restoration inrespect of contaminated land is recognisedwhen the land is contaminated.Onerous contractsA provision for onerous contracts is recognisedwhen the expected benefits to be derived by thegroup from a contract are lower than the unavoidablecost of meeting the obligations under the contract.Employee benefitsDefined contribution plansObligations for contributions to defined contributionpension plans are recognised as an expensein the income statement as incurred.Defined benefit plansThe group’s net obligation in respect of definedbenefit pension plans is calculated separately foreach plan by estimating the amount of futurebenefit that employees have earned in return fortheir service in the current and prior periods; thatbenefit is discounted to determine its presentvalue, and the fair value of any plan assets isdeducted. The discount rate is the yield at thebalance sheet date on government bonds / highquality corporate bonds with maturities consistentwith the terms of the obligations. The calculationis performed by a qualified actuary using theprojected unit credit method.When the benefits of a plan to employees areincreased, the portion of the increased benefitrelating to past service by employees is recognisedas an expense in the income statement on astraight-line basis over the average period untilthe benefits become vested. To the extent that thebenefits vest immediately, an expense is recognisedimmediately in the income statement.To the extent that any subsequent cumulativeunrecognised actuarial gain or loss exceeds 10percent of the greater of the present value of thedefined benefit obligation and the fair value ofplan assets, that portion is recognised in theincome statement over the expected averageremaining working lives of the employees participatingin the plan. Otherwise, the actuarial gainor loss is not recognised.When the actual calculation results in a benefitto the group, the recognised asset is limited tothe net total of any unrecognised actuarial lossesand past service costs and the present value ofany future refunds from the plan or reductions infuture contributions to the plan.Long term service benefitsThe group’s net obligation in respect of long termservice benefits, other than pension plans, is theamount of future benefit that employees haveearned in return for their service in the currentand prior periods. The obligation is calculatedusing the projected unit credit method and is44Aker <strong>Kvaerner</strong> annual report <strong>2007</strong>
Our performancediscounted to its present value and the fair value ofany related assets is deducted. The discount rate isthe yield at the balance sheet date on governmentbonds/high quality corporate bonds with maturitiesconsistent with the terms of the obligations.Share-based payment transactionsAs described in note 18 Salaries, wages and socialsecurity costs, the group has a variable payscheme for senior managers where the final paymentsdepend on percentage increase for theAker <strong>Kvaerner</strong> share price in the three year period.The fair value of the estimated amount payable tothe employee is recognised linearly as an expenseover the three year agreement period with a correspondingincrease in liabilities. The fair value is initiallymeasured at grant date. Measurement of fairvalue takes into account the terms and conditionsupon which the instruments were granted and isbased on an expected bonus to be earned.For cash-settled share-based payments, aliability equal to the portion of the goods or servicesreceived is recognised at the current fair valuedetermined at each balance sheet date.Cash and cash equivalentsCash and cash equivalents include cash in hand,deposits held at call with banks and other shorttermhighly liquid investments with original maturityof three months or less. Restricted cash is mainlycash tied up in projects through joint ventures withexternal parties. The amounts fluctuate with theprojects’ life cycle and are usually released whenthe project is delivered or close to delivery.Derivative fi nancial instrumentsThe group uses derivative financial instruments tohedge its exposure to foreign exchange and interestrate risks arising from operational, financingand investment activities. Derivatives that do notqualify for hedge accounting are accounted foras trading instruments.Derivatives are initially recognised at fair valueon the date a derivative contract is entered intoand are subsequently remeasured at their fairvalue. The gain or loss on remeasurement to fairvalue is recognised immediately in profit and loss.Where derivatives qualify for hedge accounting,recognition of any resultant gain or loss dependson the nature of the item being hedged (seeHedging activities).The fair value of interest rate swaps is theestimated amount that the group would receive orpay to terminate or eliminate the swap at thebalance sheet date, taking into account currentinterest rates and the current creditworthiness ofthe swap counterparties. The fair value of forwardexchange contracts is their quoted market priceat the balance sheet date, being the presentvalue of the quoted forward price.The fair values of various derivative instrumentsused for hedging purposes are disclosedin note 23.3 Derivative financial instruments.Movements on the hedging reserve in shareholders’equity are shown in Statement of changesto equity (other reserves). The full fair value of ahedging derivative is classified as a non-currentasset or liability when the remaining hedged itemis classified as non-current asset or liability. Withthe exception of items related to trade receivablesand work in progress, this is when the remainingmaturity is more than 12 months; it is classified asa current asset or liability when the remainingmaturity of the hedged item is less than 12months or when it is related to trade receivablesand work in progress. Trading derivatives areclassified as current asset or liability.Interest-bearing borrowingsInterest-bearing borrowings are recognised initiallyat fair value less attribute transaction costs. Subsequentto initial recognition, interest-bearing borrowingsare stated at amortised cost with any differencebetween cost and redemption value beingrecognised in the income statement over the periodof the borrowings on an effective interest basis.Income taxIncome tax on the profit or loss for the year comprisescurrent and deferred tax. Income tax isrecognised in the income statement except to theextent that it relates to items recognised directlyin equity, in which case it is recognised in equity.Current tax is the expected tax payable on thetaxable income for the year, using tax rates enactedor substantially enacted at the balance sheet date,and any adjustment to tax payable in respect ofprevious years.Deferred tax is provided using the balance sheetliability method, providing for temporary differencesbetween the carrying amounts of assets and liabilitiesfor financial reporting purposes and the amountsused for taxation purposes. The following temporarydifferences are not provided for: goodwill not deductiblefor tax purposes, the initial recognition of assetsor liabilities that affect neither accounting nor taxableprofit, or differences relating to investments in subsidiariesto the extent that they will not reverse in theforeseeable future. The amount of deferred taxprovided is based on the expected manner ofrealisation or settlement of the carrying amount ofassets and liabilities, using tax rates enacted orsubstantively enacted at the balance sheet date.A deferred tax asset is recognised only to theextent that it is probable that future taxable profitswill be available against which the asset can beutilised. Deferred tax assets are reduced to theextent that it is no longer probable that the relatedtax benefit will be realised.Additional income taxes that arise from the distributionof dividends are recognised at the same timeas the liability to pay the related dividend.Share capitalOrdinary sharesOrdinary shares are classified as equity. Incrementalcosts directly attributable to the issue ofnew share or options are shown in equity as adeduction, net of tax, from the proceeds.Repurchase of share capitalWhen share capital recognised as equity is repurchased,the amount of the consideration paid,including directly attributable costs, is recognisedas a change in equity. Repurchase of share capitalis recognised as a reduction in equity and isclassified as treasury shares.Financial instrumentsFinancial instruments in Aker <strong>Kvaerner</strong> group consistof cash and cash equivalents, investments inother companies, derivative financial instruments,non-current interest-bearing receivables, Trade andother receivables and non-current borrowings.The group classifies its financial assets in thefollowing categories: at fair value through profit orloss, loans and receivables, and available forsale. The classification depends on the purposefor which the financial assets were acquired.Management determines the classification of itsfinancial assets at initial recognition.Financial assets at fair value throughprofit or lossFinancial assets at fair value through profit andloss are fi nancial assets held for trading. A financialasset is classified in this category if acquiredprincipally for the purpose of selling in the shortterm. Derivatives are classified as held for tradingunless they are designated as hedges. Assets inthis category are classified as current assets asderivative financial instruments.Loans and receivablesLoans and receivables are non-derivative financialassets with fixed or determinable paymentsthat are not quoted in an active market. They areincluded in current assets as trade and otherreceivables and interest-bearing receivables,except for maturities greater than 12 months afterthe balance sheet date. These are included innon-current assets as loans and receivables andinterest-bearing receivables in the balance sheet.Available-for-sale fi nancial assetsAvailable-for-sale fi nancial assets are non-derivativesthat are either designated in this category ornot classified in any other categories. They areincluded in non-current assets as investments inother companies, unless management intends todispose of the investment within 12 months of thebalance sheet date. They will then be included incurrent assets as other investments.Regular purchases and sales of financial assetsare recognised on the trade-date – the date onwhich the group commits to purchase or sell theasset. Investments are initially recognised at fairvalue plus transaction costs for all financial assetsnot carried at fair value through profit and loss.Financial assets carried at fair value through profitand loss are initially recognised at fair value, andtransaction costs are expensed in the incomestatement. Available-for-sale financial assets andfinancial assets at fair value through profit and lossare subsequently carried at fair value. Loans andreceivables are carried at amortised cost using theeffective interest method.Financial assets are derecognised when therights to receive cash flows from the investmentshave expired or have been transferred and thegroup has transferred substantially all risks andrewards of ownership.The fair values of quoted investments arebased on current bid prices. If the market for afi nancial asset is not active (and for unlistedsecurities), the group establishes fair value byusing valuation techniques. These include theuse of recent arm’s length transactions, referenceto other instruments that are substantiallythe same, discounted cash flow analysis andoption pricing models, making maximum use ofmarket inputs and relying as little as possible onentity-specific inputs. Impairment of financialinstruments is described under the impairmentsection above.Foreign currencyFunctional and presentation currencyThe consolidated financial statements are presentedin Norwegian kroner (NOK), which is AkerKværner ASA’s functional currency and the presentationcurrency for the group.Foreign currency transactions and balancesTransactions in foreign currencies are translatedat the foreign exchange rate ruling at the date ofthe transaction. Monetary assets and liabilitiesdenominated in foreign currencies at the balancesheet date are translated to Norwegian kroner atthe foreign exchange rate at that date. Foreignexchange differences arising on translation arerecognised in the income statement. Non-Aker <strong>Kvaerner</strong> annual report <strong>2007</strong> 45
Our performancemonetary assets and liabilities that are measuredin terms of historical cost in a foreign currencyare translated using the exchange rate at thedate of the transaction. Non-monetary assetsand liabilities denominated in foreign currenciesthat are stated at fair value are translated toNorwegian kroner at foreign exchange rates atthe dates the fair value was determined.Net investment in foreign operationsItems included in the financial statements of eachof the group’s entities are measured using thecurrency of the primary economic environment inwhich the entity operates. The results and financialposition of all the group entities (none of which hasthe currency of a hyperinflationary economy) thathave a functional currency different from thegroup’s presentation currency are translated intothe presentation currency as follows: assets and liabilities, including goodwill andfair value adjustments, for each balance sheetpresented are translated at the closing rate atthe date of that balance sheet; income and expenses for each incomestatement are translated at average exchangerates for the year, calculated on the basis of12 monthly rates.Exchange differences arising from the translationof the net investment in foreign operations, andof related hedges, are included as a componentof equity (Translation reserve). These translationdifferences are reclassified to the income statementupon disposal of the related operations.In respect of all foreign operations, any currencyrevaluation differences that have arisen since 1 April2004, the date of transition to IFRS, are presentedas a separate component of equity.Hedging activitiesThe group designates certain derivatives aseither:a) hedges of the fair value of recognised liabilities(fair value hedge);b) hedges of a particular risk associated with arecognised liability or a highly probableforecasted transaction (cash flow hedge); orc) hedges of a net investment in a foreignoperation (net investment hedge).Fair value hedgesChanges in the fair value of derivatives that aredesignated and qualify as fair value hedges arerecorded in the income statement, together withany changes in the fair value of the hedged assetor liability that are attributable to the hedged risk.The group only applies fair value hedge accountingfor hedging fixed interest rate risk on borrowings.The gain or loss relating to the effectiveportion of interest rate swaps hedging fixed rateborrowings is recognised in the income statementwithin net financial items. The gain or lossrelating to the ineffective portion of the hedgingrelationship is recognised in the income statementwithin net financial items. Changes in thefair value of the fixed rate borrowings that arehedged against interest rate risk are recognisedin the income statement within net financial items.If the hedge no longer meets the criteria forhedge accounting, the adjustment to the carryingamount of a hedge item is amortised to profit andloss over the period to maturity using the effectiveinterest method.Cash fl ow hedgesThe effective portion of changes in the fair valueof derivatives that are designated and qualify ascash flow hedges are recognised in equity. Thegain or loss relating to the ineffective portion ofderivative hedging instruments is recognisedimmediately in the income statement within netfi nancial items.Amounts accumulated in equity are reclassified to the income statement in the periods whenthe hedged item is recognised in profit or loss.However, when the forecast transaction that ishedged results in the recognition of a non-financialasset or a non-financial liability, the gains andlosses previously deferred in equity are transferredfrom equity and included in the initialmeasurement of the cost of the asset or liability.Hedge accounting is discontinued when thegroup revokes the hedging relationship, thehedging instrument expires or is sold, terminated,or exercised, or no longer qualifies for hedgeaccounting. Any cumulative gain or loss deferred inequity at that time remains in equity and isrecognised when the forecast transaction isultimately recognised in the income statement.When a forecast transaction is no longer expectedto occur, the cumulative gain or loss that wasdeferred in equity is recognised immediately inincome statement.Net investment hedgeHedges of net investments in foreign operationsare accounted for similarly to cash flow hedges.Any gain or loss on the hedging instrument relatingto the effective portion of the hedge isrecognised in equity. The ineffective portion isrecognised immediately in the income statementwithin net fi nancial items.Gains and losses accumulated in equity areincluded in the income statement when theforeign operation is partially disposed of or sold.Note 3: Accounting estimates and judgementsEstimates and judgements are continually reviewed and are based on historical experiences and other expectations of future events.The group makes estimates and assumptions concerning future events. The resulting accounting estimates will, by definition, seldom accurately equal the relatedactual results, but are based on the best estimate at the time. The estimates and assumptions that have a significant risk of causing material adjustments to thecarrying amounts of assets and liabilities within the next financial year are discussed below.Revenue recognitionAs described in the accounting principles the percentage-of-completion method is used to account for construction contracts. Use of this method requires estimatesof the final outcome (revenue and costs) of the contract as well as measurement of progress achieved to date as a proportion of the total work to be performed.The main uncertainty of contract revenue is related to recoverable amounts from variation orders, claims and incentive payments which are recognised to theextent that it is probable that they will result in revenue, and they are capable of being reliably measured. In many projects there are frequent changes ofscope of work resulting in a number of variation orders. Normally the contracts with customers include procedures for presentation of and agreement ofvariation orders. At any point in time, there will be such variation orders and claims not being finally decided upon. Even though management has extensiveexperience in assessing the outcome of such negotiations there will always be uncertainties.Cost to complete depends on productivity factors as well as the cost level for the input factors. In an environment with high capacity utilisation in the industry thereis an increasing uncertainty in the cost estimates. Experience, systematic use of the project execution model and focus on core competencies reduces this risk.Progress measurement based on costs has an inherent risk related to the cost estimate as described above. In situations where cost is not seen to properlyreflect actual progress, alternative measures such as hours or plan progress are used to achieve more precise revenue recognition. The estimationuncertainty during the early stages of a contract is mitigated by a policy of normally not recognising revenue in excess of costs on a large project before thecontract reaches 20 percent completion.WarrantiesAt the end of each contract, a provision is set up to cover any warranty expenditures. The warranty period is normally two years. The provision is often set at onepercent of the contract value, but can also be a higher or lower amount following a specific evaluation of the actual circumstances for each contract. Both the generalone percent provision and the evaluation of project specific circumstances are based on experience from earlier projects. Factors that could impact the estimatedclaim information include the group’s quality initiatives and project execution model. Reference is made to note 12 Provisions, for further information about provisions.Property, plant and equipment and intangible assetsAt every balance sheet date, it is considered whether there are indications of impairment of the book values of long term assets. If such indications exist, a valuation isperformed to assess whether or not and if applicable by which amount the asset should be written down for impairment.46Aker <strong>Kvaerner</strong> annual report <strong>2007</strong>
Our performanceSuch valuations will often have to be based on estimates of future results for a number of cash flow generating units.References are made to note 14 Property, plant and equipment and note 16 Intangible assets.GoodwillIn accordance with the accounting policy stated, the group tests annually whether goodwill has suffered any impairment. The recoverable amounts of cashgeneratingunits have been determined based on value-in-use calculations. These calculations require the use of estimates and are consistent with the marketvaluation of the group. Further details about goodwill and impairment reviews are included in note 16 Intangible assets.Income taxesThe group is subject to income taxes in numerous jurisdictions. Significant judgement is required to determine the worldwide provision for income taxes. There aremany transactions and calculations for which the ultimate tax determination is uncertain during the ordinary course of business. Provisions for anticipated tax auditissues are based on estimates of eventual additional taxes. Tax assets arise following tax losses that can be brought forward to reduce the income tax on futureyear’s taxable profits. The recognition of such a tax asset, consequently, depends on there being sufficient evidence of the future taxable profit which is necessaryto use the brought forward loss. Such judgements are reasonably easy in countries with significant group activities, but may be more difficult in other tax jurisdictions.Where the final tax outcome of these matters is different from the amounts that were initially recorded, such differences will impact the income tax and deferred taxprovisions in the period in which such determination is made. Reference is made to note 17 Tax for further information about income taxes.Pension benefitsThe present value of the pension obligations depends on a number of factors that are determined on an actuarial basis using a number of assumptions. Theassumptions used in determining the net cost (income) for pensions include financial factors such as the discount rate, expected salary growth, inflation and returnon assets as well as demographical factors about mortality, employee turnover, disability and early retirement. Assumptions about all these factors are set based onthe situation at the time when the assessment is made. However, it is reasonably certain that such factors will change over the very long time periods for whichpension calculations are made. Any changes in these assumptions will impact the calculated pension obligations. The effect on the accounts of such changes arehowever, spread over relatively long time periods by the use of the corridor approach, where changes are amortised over many years. Further information about thepension obligations and the assumptions used are included in note 20 Employee benefits.Note 4: Acquisition of businessesWirth Maschinen- und Bohrgeräte-Fabrik GmbHAker <strong>Kvaerner</strong> acquired 50 percent of the shares in the company in September <strong>2007</strong>. Wirth is a German provider of drilling machines and pumps. Aker <strong>Kvaerner</strong>MH AS has cooperated with Wirth for about 20 years. There is a shareholders’ agreement with the other shareholders of Wirth with put / call option arrangementsfor the remaining 50 percent ownership to be transferred to Aker <strong>Kvaerner</strong> at a price based on future earnings. The options are exercisable during <strong>2009</strong>–<strong>2010</strong>. Theagreements also results in the owners exercising joint control of Wirth in the period until the options become excercisable. The current analysis and allocation offair value is provisional and will be updated when the analysis is complete.Phoenix Polymers International LtdIn June <strong>2007</strong>, Aker <strong>Kvaerner</strong> Subsea Ltd acquired 50 percent and obtained control over Phoenix International Ltd in Aberdeen. The company is an importantsub-supplier of buoyancy elements to Aker <strong>Kvaerner</strong> Subseas’ drilling and riser projects.Aker Insurance ASIn August <strong>2007</strong>, Aker <strong>Kvaerner</strong> acquired 9.9 percent of the shares and now owns 100 percent of the company.The total acquistion cost was NOK 217 million. Consolidated net profit from acquired businesses in the period from acquisition to year end is NOK 31 million.Values at time of acquisitionAmounts in NOK millionPre acquisitioncarrying amountsAdjustmentto IFRSFair valueadjustmentsRecognised valueson acquisitionOf whichJoint VenturePlant and equipment 13 13 - 26 26Patents / trademarks 1 - 54 55 54Interest-bearing current receivables - - - - -Non-current investments 2 - - 2 2Current operating assets 387 - 31 418 405Cash and cash equivalents 84 - - 84 70Minority interests 7 - - 1 6 -Deferred tax liabilities - 3 - 32 - 29 - 28Other non-current liabilities - 280 - 8 - - 288 - 288Current operating liabilities - 173 - 13 - - 186 - 164Net assets and liabilities 41 - 5 52 88 77Goodwill on acquisition 1) 129 78Deferred payment - 46 - 46Cash 171 109Cash paid - 171 - 109Cash and overdraft facilities 84 70Net cash outflow - 87 - 391) The goodwill arising from the acquisitions is attributable to the anticipated profitability of the operations and to the anticipated synergies.Later acquisitionsFor acquisitions in <strong>2008</strong>, see note 26 Subsequent events.Aker <strong>Kvaerner</strong> annual report <strong>2007</strong> 47
Our performanceNote 5: Related partiesThe group has several related party relationships between parents and subsidiaries (see note 28 Group companies as at 31 December <strong>2007</strong>), associates(see note 21 Investments accounted for in accordance with the equity method), joint ventures (see note 22 Investments in Joint Ventures) and with its directorsand executive officers (see note 18 Salaries, wages and social security costs).The largest shareholder Aker Holding AS is controlled by Aker ASA which is controlled by Kjell Inge Røkke through TRG Holding AS. All entities whichKjell Inge Røkke controls or has significant influence over are considered related parties to the Aker <strong>Kvaerner</strong> group.In accordance with recommended accounting practice, information regarding significant related party transactions, benefits and agreements should bedisclosed where such information may assist users of the financial statements in their understanding of the activities of the group. All transactions havebeen based on arm’s length terms. The transactions below are considered to be significant related party transactions not disclosed in the notes listedabove.Aker Drilling ASAIn 2005, Aker Drilling ASA and Aker <strong>Kvaerner</strong> entered into a contract for the turn-key delivery of two sixth-generation deepwater drilling semisubmersibles.The contract value including mooring systems was originally approximately NOK 7.8 billion. The two drilling rigs are scheduled for delivery in July andDecember <strong>2008</strong>.Aker Floating Production ASAA contract with Aker Floating Production ASA to deliver a complete subsea production system for a Reliance Industries Ltd in India was signed in <strong>2007</strong>.Aker <strong>Kvaerner</strong> will also deliver the marine installation of the floating production storage and offloading (FPSO) vessel to be leased out by Aker FloatingProduction. There is a seperate contract with Aker Floating Production ASA to deliver process technology to the FPSO. The total value of Aker <strong>Kvaerner</strong>’scontracts is approximately USD 250 million and NOK 610 million.Aker Oilfield ServicesAker <strong>Kvaerner</strong> has invested NOK 72.3 million in Aker Oilfield Services and owns 19.1 percent of the shares, see note 26 Subsequent events. Aker <strong>Kvaerner</strong>has signed a letter of intent with Aker Oilfield Services and is set to expand its subsea service offering by providing equipment and personnel to the world’s firstdeepwater Subsea Equipment Support Vessel (SESV). The contract, to commence latest <strong>2010</strong>, is worth approximately USD 60 million over an initial five yearperiod.Aker Clean Carbon ASAker <strong>Kvaerner</strong> has agreed to transfer its Just Catch technology for CO 2capture to the company Aker Clean Carbon AS, which will develop CO 2captureprojects. The transaction to take place i <strong>2008</strong> will give Aker <strong>Kvaerner</strong> 30 percent of the shares in Aker Clean Carbon AS, while Aker ASA will own 70 percent.The ownership ratio has been determined following valuations and negotiations that have also recognised the value of Aker <strong>Kvaerner</strong>’s exclusive rights toparticipate in building future carbon capture facilities in co-operation with Aker Clean Carbon.Intellectual Property Holding ASAker Kværner ASA has an agreement with Intellectual Property Holdings AS (IPH) that holds all rights, titles and interests in and to registered trademarksand domain names containing ”Aker” and ”Kværner”. IPH will act as a joint branding tool where the companies in the Aker group join forces in selectedinitiatives. The annual royalty cost for Aker <strong>Kvaerner</strong> is approximately NOK 10 million.Aker Insurance ASAfter Aker ASA had received an accumulated dividend of NOK 80 million, Aker <strong>Kvaerner</strong> acquired in <strong>2007</strong> the 9.9 percent of the shares controlled by AkerASA for NOK 10 million. After the transaction, Aker <strong>Kvaerner</strong> owns 100 percent of the shares in Aker Insurance AS.Shared ResourcesAker <strong>Kvaerner</strong> Business Partner and Aker <strong>Kvaerner</strong>’s corporate functions are offering services to other Aker companies on arm’s length terms.48Aker <strong>Kvaerner</strong> annual report <strong>2007</strong>
Our performanceNote 6: Segment informationA segment is a distinguishable component of the group that is engaged either in providing products or services (business segment), or in providing products orservices within a particular economic environment (geographical segment), which is subject to risks and rewards that are different from those of other segments.See page 14–23 of the annual report for a description of the business segments. The transactions between the segments have been based on arm’s length terms.Operating revenue in geographical segments are based on the geographical location of customers whereas segment assets and capital expenditure are basedon geographical location of the companies.At the end of first quarter <strong>2007</strong> Aker <strong>Kvaerner</strong> reorganised its segments and prior year figures are restated.<strong>2007</strong> – Business segmentsAmounts in NOK millionFieldDevelopmentMaintenance,Modificationsand OperationsSubseaProducts &TechnologiesProcess &ConstructionUnallocatedTotalExternal revenueConstruction contracts 16 163 3 199 7 239 9 128 7 010 - 102 42 637Services revenue - 6 465 1 437 1 725 2 948 1 021 13 596Products - - 993 494 87 - 1 574Other 6 2 - 32 99 11 150Total revenue from external customers 16 169 9 666 9 669 11 379 10 144 930 57 957Inter-segment revenue 212 78 182 974 249 -1 695 -Operating revenue 16 381 9 744 9 851 12 353 10 393 - 765 57 957Operating profit / loss before depreciation 891 530 960 959 746 - 173 3 913Depreciation - 118 - 9 - 112 - 72 - 24 - 96 - 431Operating profit (+) / loss (-) 773 521 848 887 722 - 269 3 482Share of earnings in associated companies - - - 2 - - 4 - 2Capital expenditures 201 289 577 298 53 178 1 596Net current operating assets excl. tax - 893 127 849 323 - 1 367 - 100 - 1 061Net non-current operating assets excl. tax 1 354 1 372 1 616 1 051 1 035 - 38 6 390Net operating assets excl. tax 461 1 499 2 465 1 374 - 332 - 138 5 329Tax - 372Investment in associates 53 - - 18 21 29 121Investments in other companies 133Net interest-bearing items 2 056Total equity incl. minority interests 7 267Order intake (unaudited) 12 124 8 422 12 377 10 733 14 242 44 57 942Order backlog (unaudited) 15 695 10 683 10 951 11 520 10 923 - 1 511 58 261Own employees (unaudited) 3 586 4 855 3 673 2 666 8 367 1 280 24 427Intangible assets 1 105 1 434 646 824 900 86 4 995Total operating assets excl. tax 5 147 3 468 5 027 6 234 3 321 350 23 547Total operating liabilities excl. tax - 4 686 - 1 969 - 2 562 - 4 860 - 3 653 - 488 - 18 218Total net operating assets excl. tax 461 1 499 2 465 1 374 - 332 - 138 5 329Aker <strong>Kvaerner</strong> annual report <strong>2007</strong> 49
Our performance2006 – Business segmentsAmounts in NOK millionFieldDevelopmentMaintenance,Modificationsand OperationsSubseaProducts &TechnologiesProcess &ConstructionUnallocatedTotalExternal revenueConstruction contracts 15 236 3 236 2 724 3 908 8 245 - 46 33 303Services revenue 36 6 025 1 274 1 427 3 396 706 12 864Products - - 2 589 1 355 - - 3 944Other 342 1 5 7 124 2 481Total revenue from external customers 15 614 9 262 6 592 6 697 11 765 662 50 592Inter-segment revenue 511 415 349 875 242 - 2 392 -Operating revenue 16 125 9 677 6 941 7 572 12 007 - 1 730 50 592Operating profit / loss before depreciation 903 452 479 531 530 - 23 2 872Depreciation - 54 - 6 - 100 - 62 - 34 - 83 - 339Operating profit (+) / loss (-) 849 446 379 469 496 - 106 2 533Share of earnings in associated companies - - 1 - 1 3 - 21 - 18Capital expenditures 77 16 369 119 72 173 826Net current operating assets excl. tax - 1 972 124 762 - 364 - 684 - 38 - 2 172Net non-current operating assets excl. tax 1 238 1 115 1 340 895 1 141 - 151 5 578Net operating assets excl. tax - 734 1 239 2 102 531 457 - 189 3 406Tax 348Investment in associates 53 - 1 18 20 30 122Investments in other companies 16Net interest-bearing items 4 222Total equity incl. minority interests 8 114Order intake (unaudited) 17 140 9 933 11 747 12 997 11 670 - 1 216 62 271Order backlog (unaudited) 20 385 12 245 8 775 12 741 7 989 - 2 440 59 695Own employees (unaudited) 3 562 5 187 3 028 2 167 7 758 1 020 22 722Intangible assets 1 099 1 436 755 706 1 013 45 5 054Total operating assets excl. tax 4 788 3 704 5 007 3 910 4 096 438 21 943Total operating liabilities excl. tax - 5 522 - 2 464 - 2 905 - 3 379 - 3 639 - 628 - 18 537Total net operating assets excl. tax - 734 1 240 2 102 531 457 - 190 3 4062005 – Business segmentsAmounts in NOK millionFieldDevelopmentMaintenance,Modificationsand OperationsSubseaProducts &TechnologiesProcess &ConstructionUnallocatedTotalExternal revenueConstruction contracts 9 646 2 571 2 614 1 162 6 811 - 19 22 785Services revenue 27 4 391 1 075 1 724 3 042 483 10 742Products - - 1 619 1 336 - - 1 2 954Other 122 2 57 - 217 61 459Total revenue from external customers 9 795 6 964 5 365 4 222 10 070 524 36 940Inter-segment revenue 155 391 113 426 66 - 1 151 -Operating revenue 9 950 7 355 5 478 4 648 10 136 - 627 36 940Operating profit / loss before depreciation 530 279 339 336 314 18 1 816Depreciation - 53 - 9 - 86 - 67 - 23 - 68 - 306Operating profit (+) / loss (-) 477 270 253 269 291 - 50 1 510Share of earnings in associated companies - 13 - 7 1 18 - 25Order intake (unaudited) 18 546 9 777 6 394 9 290 10 842 - 2 912 51 937Order backlog (unaudited) 19 978 12 028 4 019 7 370 8 340 - 3 213 48 52250Aker <strong>Kvaerner</strong> annual report <strong>2007</strong>
Our performanceGeographical segmentsOperating revenues bycustomer locationTotal operating assets bycompany locationCapital expenditure bycompany locationAmounts in NOK million <strong>2007</strong> 2006 2005 <strong>2007</strong> 2006 <strong>2007</strong> 2006Norway 23 396 20 567 14 685 11 029 9 119 963 354Europe 8 628 9 619 8 471 5 713 6 580 219 96North America 9 243 9 976 6 846 4 730 3 761 101 139Asia 11 336 5 282 2 341 546 1 020 212 221Other 5 354 5 148 4 597 1 529 1 463 101 16Total 57 957 50 592 36 940 23 547 21 943 1 596 826Note 7: Other operating expensesOther operating expenses amounts to NOK 5.4 billion in <strong>2007</strong> (NOK 6.0 billion in 2006 and NOK 4.1 billion in 2005). The expenses includes agency costs, audit fees,operating lease costs, research and development costs and other expenses regarding premises, electricity, maintenance, travelling, IT-equipment and insurance fees.Fees to KPMGFees for statutory audit of the whole Aker <strong>Kvaerner</strong> group amounted to NOK 26 million (NOK 25 million in 2006 and NOK 22 million in 2005), fees for other assuranceservices amounted to NOK 2 million (NOK 5 million in 2006 and NOK 2 million in 2005), fees for tax advisory service amounted to NOK 4 million (NOK 4 million in 2006and NOK 3 million in 2005) and fees for other advisory services amounted to NOK 2 million (NOK 2 million in 2006 and NOK 2.5 million in 2005).Note 8: Net operating assetsAmounts in NOK million Note <strong>2007</strong> 2006Inventories 884 593Trade and other receivables 9,25.5 13 361 13 712Provisions 12 - 655 - 602Trade and other payables 10 - 15 165 - 16 217Derivative financial instruments (net assets and liabilities) 25.3 514 342Net current operating assets excl. tax 6 - 1 061 - 2 172Pension funds 20 15 4Other non-current operating assets 9 6Intangible assets 6,16 4 995 5 054Property, plant and equipment 14 2 815 1 761Employee benefits 20 - 937 - 931Other non-current operating liabilities 1) - 507 - 316Net non-current operating assets excl. tax 6 6 390 5 578Net operating assets excl. tax 6 5 329 3 406Income tax payable 17 - 329 - 230Prepaid income tax 17 89 86Deferred tax assets 17 548 552Deferred tax liabilities 17 - 680 - 60Net operating assets incl. tax 4 957 3 7541) Non-current insurance liabilities for <strong>2007</strong> are NOK 315 million (NOK 293 million in 2006).Note 9: Current operating assetsAmounts in NOK million Note <strong>2007</strong> 2006Trade debtors 1), 2) 5 815 5 756Other receivables 1) 2 338 3 085Work in progress to be invoiced 11 4 774 3 924Advances to suppliers 434 947Trade and other receivables 25.5 13 361 13 712Derivative financial instruments 25.3 1 468 813Inventories 3) 884 593Current operating assets 15 713 15 1181) Trade debtors include NOK 89 million falling due after one year and other receivables includes NOK 19 million falling due after one year (for 2006 the numbers were NOK 100 millionand NOK 42 million respectively). Book value of trade and other receivables are approximately equal to fair value.2) Receivables from related parties at the end of <strong>2007</strong> are NOK 425 million (NOK 0 million in 2006).3) Write-downs of inventories are NOK 9 million in <strong>2007</strong> (NOK 13 million in 2006).Aker <strong>Kvaerner</strong> annual report <strong>2007</strong> 51
Our performanceNote 10: Current operating liabilitiesAmounts in NOK million Note <strong>2007</strong> 2006Trade creditors 1) 3 217 4 237Advances from customers 2) 2 852 5 261Accrued operating and financial costs 8 644 5 393Other current liabilities 1) 452 1 326Trade and other payables 15 165 16 217Provisions 12 655 602Derivative financial instruments 25.3 954 471Current operating liabilities excl. tax 16 774 17 2901) Trade creditors include NOK 11 million falling due after one year and NOK 13 million of other current liabilities falling due after one year (for 2006 the numbers were NOK 16 millionand NOK 24 million respectively). Book value of trade creditors and other current liabilities are approximately equal to fair value.2) Remaining prepayment from Aker Drilling was at the end of 2006 NOK 720 million.Note 11: ContractsAmounts in NOK million Note <strong>2007</strong> 2006Value all contracts 126 967 124 596Costs from ongoing contracts 62 013 60 869Results from ongoing contracts 6 693 4 032Order backlog 6 58 261 59 695Value of work performed 68 706 64 901Invoiced 63 932 60 977Work in progress to be invoiced 9 4 774 3 924Trade debtors 9 5 815 5 756Recoverable on contracts 10 589 9 680Receivables where payment is withheld by customers based on non-fulfilled contract obligations 13 3Advances from customers 2 852 5 261Order intake (unaudited)Amounts in NOK million <strong>2007</strong> 2006Field Development 12 124 17 140Maintenance, Modifications and Operations 8 422 9 933Subsea 12 377 11 747Products & Technologies 10 733 12 997Process & Construction 14 242 11 670Unallocated 44 - 1 216Total 57 942 62 271Order backlog (unaudited)Amounts in NOK million <strong>2007</strong> 2006Field Development 15 695 20 385Maintenance, Modifications and Operations 10 683 12 245Subsea 10 951 8 775Products & Technologies 11 520 12 741Process & Construction 10 923 7 989Unallocated - 1 511 - 2 440Total 58 261 59 695The group enters into delivery commitments prior to commencement of production. Of the current backlog of NOK 58.3 billion, NOK 5.4 billion (NOK 3.2 billion in2006) relate to certain major contracts which are not expected to yield any profit. Expected losses on such contracts have been charged to profit and lossand based on best estimates. The overall quality of the order backlog has improved during <strong>2007</strong>, which is reflected in results from ongoing contracts.52Aker <strong>Kvaerner</strong> annual report <strong>2007</strong>
Our performanceLargest projects in progress at year end <strong>2007</strong> (unaudited)Project Business segment Customer Estimated deliveryAdriatic LNG Terminal (ALT) FD Terminale GNL Adriatico s.r.l <strong>2008</strong>Sempra FD Cameron <strong>2008</strong>Kashagan ePF1 FD/MMO Agip <strong>2008</strong>Aker Drilling FD/MMO/P&T Aker Drilling AS <strong>2008</strong>Yansab P&C Yansab <strong>2008</strong>Reliance Subsea Reliance Ltd <strong>2008</strong>Frigg Cessation MMO/FD Total <strong>2009</strong>Dalia Subsea (Phase 2) Subsea Total E&P Angola <strong>2009</strong>Gjøa FD/MMO StatoilHydro <strong>2010</strong>Longview Power Project P&C Hitachi 2011During <strong>2007</strong>, the following large contracts are delivered or have marginal revenue recognition for <strong>2008</strong>:Blind Faith, Dalia EPC, Hitachi, Ormen Lange MIC, Hammerfest LNG (Snøhvit) and West-E Drill.Note 12: ProvisionsAmounts in NOK million Warranties Other ProvisionsBalance as at 1 January <strong>2007</strong> 328 274 602Reclassified - 24 24 -Charged to operations 168 130 298Utilised - 21 - 155 - 176Reversed - 4 - 44 - 48Sale / acquisition 1 - 1 -Translation effects - 11 - 10 - 21Balance as at 31 December <strong>2007</strong> 437 218 655See note 3 Accounting estimates and judgements and note 13 Contingent events.WarrantiesThe provision for warranties relates mainly to the possibility that Aker <strong>Kvaerner</strong>, based on contractual agreements, needs to perform guarantee work related toproducts and services delivered to customers. The provision is based on estimates of liabilities arising from existing contracts and the cost of work that needsto be done. The warranty period is normally two years and any cash effects will arise in this period.OtherOther includes primarely a provision for onerous leases.Note 13: Contingent eventsProject risks and uncertaintiesThe group’s operations are to a large extent subject to long term contracts, some of which are fixed-price, turn-key contracts that are awarded on acompetitive bidding basis. Failure to meet schedule or performance guarantees or increases in contract costs may result in non-recoverable costs, whichcould exceed revenues realised from the applicable project. Where a project is identified as loss making, provisions for future losses are made (see note 12Provisions). The accounting treatment is based on the best estimate at the time. Inevitably, such circumstances and information may be subject to changes insubsequent periods and thus the eventual outcome may be better or worse than estimated.The Frigg Cessation project is a pioneer project for decommissioning of larger fields in the North Sea. The project is challenging related to execution andthere are environmental and safety issues which creates uncertainty with regards to the fi nal outcome.Legal proceedingsWith its extensive worldwide operations, companies included in the group are in the course of their activities involved in legal disputes. Provisions have beenmade to cover the expected outcome of the disputes to the extent negative outcomes are likely and reliable estimates can be made. However, the finaloutcome of these cases will always be subject to uncertainties and resulting liabilities may exceed recorded provisions.Blind FaithAker <strong>Kvaerner</strong> has successfully completed the semisubmersible hull for Chevron’s Blind Faith platform. The semisubmersible left the Aker <strong>Kvaerner</strong> Verdalyard in Norway 24 June <strong>2007</strong> and has been transported to a Gulf of Mexico integration yard to be outfitted with the topsides. Aker <strong>Kvaerner</strong> is in discussionswith the client regarding an estimated Schedule Recovery Contractor Work Estimate (SRCWE) of USD 71 million. Although there can be no assurance regardingthe outcome, the expectation is that this will not have a material impact on Aker <strong>Kvaerner</strong>’s fi nancial position or results.HolbornIn 2000, Aker <strong>Kvaerner</strong> Netherlands BV and Holborn Europa Raffinerie GmbH (Holborn) entered into contracts for delivery of a steam reformer and a unit forremoval of sulphur and conversion of aromatics in refinery streams. This is in order to produce ultra low sulphur and low aromatics diesel in accordance withthe EU Fuel Directives.Aker <strong>Kvaerner</strong> annual report <strong>2007</strong> 53
Our performanceAker <strong>Kvaerner</strong> Netherlands BV has launched legal proceedings against Holborn claiming payment of outstanding invoices in the amount of EUR 9.2 million inaddition to reimbursement of amounts drawn on bank guarantees in the amount of EUR 7.0 million. Holborn has rejected the claim and raised counter claimsof approximately EUR 34.2 million based on alleged defects, delays and acts of gross negligence and / or wilful misconduct in the execution of the project.Aker <strong>Kvaerner</strong> Netherlands BV has rejected the counter claims from Holborn.The courts have encouraged the parties to try to reach a commercial settlement honouring EUR 10 million of Holborn’s claims. However, no settlement hasbeen reached. A partial ruling from District Court of Hamburg rejecting Holborn’s counterclaim was received in September <strong>2007</strong>. Holborn has appealed anda ruling on the appeal is expected to take 6–12 months. Although there can be no assurance regarding the outcome, the expectation is that this will not have amaterial negative impact on Aker <strong>Kvaerner</strong>’s financial position or results.Note 14: Property, plant and equipmentAmounts in NOK millionBuildingsand sitesMachinery,equipment andsoftwareConstructionin progressTotalHistorical costBalance as at 1 January 2006 1 101 3 415 29 4 545Additions 114 685 27 826Additions regarding acquisition 102 43 - 145Disposals - 76 - 436 - - 512Disposals regarding sale of business - 71 - 596 - 10 - 677Translation differences - 8 - 4 - 1 - 13Historical cost as at 31 December 2006 1 162 3 107 45 4 314Balance as at 1 January <strong>2007</strong> 1 162 3 107 45 4 314Additions 371 966 259 1 596Additions regarding acquisition 1) - 26 - 26Disposals - 51 - 279 - - 330Disposals regarding sale of business - - - -Translation differences - 47 - 114 - 2 - 163Historical cost as at 31 December <strong>2007</strong> 1 435 3 706 302 5 443Accumulated depreciationBalance as at 1 January 2006 - 564 - 2 430 - 2 - 2 996Depreciation in the year 2) - 59 - 331 - - 390Depreciation regarding acquisition - 20 - 25 - - 45Impairment loss - - - -Disposals 37 419 - 456Disposals regarding sale of business 35 384 1 420Translation differences 3 - 1 - 2Accumulated depreciation as at 31 December 2006 - 568 - 1 984 - 1 - 2 553Balance as at 1 January <strong>2007</strong> - 568 - 1 984 - 1 - 2 553Depreciation in the year - 129 - 301 - - 430Depreciation regarding acquisition - - - -Impairment loss - - - -Disposals 62 236 - 298Disposals regarding sale of business - - - -Translation differences 19 38 - 57Accumulated depreciation as at 31 December <strong>2007</strong> - 616 - 2 011 - 1 - 2 628Book value as at1 January 2006 537 985 27 1 54931 December 2006 594 1 123 44 1 76131 December <strong>2007</strong> 819 1 695 301 2 815Of which capitalised leases31 December 2006 2 - - 231 December <strong>2007</strong> 7 - - 71) Regarding acquisition of 50 percent in Wirth Maschinen- und Bohrgeräte-Fabrik GmbH which is proportionally consolidated in the accounts.2) Including depreciation in Pulping & Power business area with NOK 51 million in 2006.54Aker <strong>Kvaerner</strong> annual report <strong>2007</strong>
Our performanceAssets are written down on a straight-line basis over their expected economic lives, as followsMachinery and equipmentBuildingsSites3 - 15 years8 - 30 yearsNo depreciationThe estimated residual value is reviewed annually.See note 25.6 Non-current borrowings for information about bank borrowings which are secured by property, plant and equipment.Note 15: Operating leasesTotal non-cancellable operating lease commitments are payable as followsAmounts in NOK million <strong>2007</strong> 2006Contracts due within one year 522 505Contracts running for one to five years 1 635 1 625Contracts running for more than five years 1 253 1 336Total 3 410 3 466Lease and sublease payments recognised in the income statement in <strong>2007</strong>Amounts in NOK millionBuildingsConstructionequipmentOther plant andmachinery Other TotalMinimum lease payments 380 160 188 4 732Contingent rents 2 - 1 - 3Sublease payments 1 - - - 1Total 383 160 189 4 736Lease and sublease payments recognised in the income statement in 2006Amounts in NOK millionBuildingsConstructionequipmentOther plant andmachinery Other TotalMinimum lease payments 334 - 95 - 429Contingent rents 11 8 8 - 27Sublease payments - - - - -Total 345 8 103 - 456The major part of the operating lease costs and commitments relates to rent of office facilities. Aker <strong>Kvaerner</strong> has a twelve year leasing agreement withNorwegian Property of Aker <strong>Kvaerner</strong> Headquarters.In <strong>2007</strong> Aker <strong>Kvaerner</strong> Industrial Constructions had extensive costs relating to lease of construction equipment in several mining projects for the client Phelps Dodge.Other plant and machinery costs include leasing primarely of IT-equipment, inventory and lease of the ship Boa Sub C. IT-equipement is a three year agreementwith Hewlett Packard International Bank PLC. From January <strong>2008</strong>, inventory and IT equipment are leased from SG Finans. There is no intention to purchasethe equipment and it cannot be sublet.None of the leases include significant contingent rent.Aker <strong>Kvaerner</strong> annual report <strong>2007</strong> 55
Our performanceNote 16: Intangible assetsAmounts in NOK million Note Goodwill PatentsTotal intangibleassetsBook value as at 1 January 2006 4 559 22 4 581Additions 763 14 777Disposals - 291 - 32 - 323Impairment - - -Amortisation - - 3 - 3Translation differences 20 2 22Book value as at 31 December 2006 6 5 051 3 5 054Book value as at 1 January <strong>2007</strong> 5 051 3 5 054Additions 4 129 58 187Disposals - - 3 - 3Impairment - - -Amortisation - - 1 - 1Translation differences - 242 - - 242Book value as at 31 December <strong>2007</strong> 6 4 938 57 4 995The increase in goodwill is mainly caused by the acquisitions of Phoenix Polymers International Ltd and Wirth Maschinen- und Bohrgeräte-Fabrik GmbH withrespectively NOK 34 million and NOK 78 million. The acquisitions of Wirth caused an increase in patents of NOK 50 million.Research and Development costsMost of the costs for research and development in Aker <strong>Kvaerner</strong> are related to projects and are booked as contract costs. Research and development costsof NOK 166 million have been expensed during the year as the criteria for capitalisation is not met. In addition, research and development costs paid by customerstotalled NOK 77 million in <strong>2007</strong>.Cash generating unitGoodwill originates from a number of acquisitions, the acquisitions of Trafalgar House in 1996 and Aker Maritime in 2002 being the largest. Subsequent to themain acquisitions, the group has been reorganised a number of times, including mergers and de-mergers of individual businesses. As a result of this, it is nolonger possible to identify and allocate goodwill to individual businesses from past acquisitions. Consequently, we have identified the business areas as thelowest identifiable cash generating units for goodwill allocation.Determination of recoverable amounts / Fair valueRecoverable amounts are based on value in use calculations. The calculations use cash flow projections based on the future cash flow, budgets for the periods<strong>2008</strong>-<strong>2010</strong> and an annual growth of 2.5 percent for subsequent periods. A discount rate (WACC) of 13.3 percent before tax has been used for discountedcash flows.For all business areas the recoverable amounts are higher than the carrying amounts and consequently the analysis indicates that no write-down for impairment isnecessary. As a sensitivity analysis, recoverable amount has also been calculated using discount rates up to 40 percent, without any effect for the conclusions.Note 17: TaxIncome tax expenseAmounts in NOK million <strong>2007</strong> 2006 2005Current tax expenseCurrent year 548 318 115Adjustments for prior years 9 35 34Total current tax expense 557 353 149Deferred tax expenseOrigination and reversal of temporary differences 550 244 78Benefit of tax losses / timing differences recognised - 33 - 22 - 539Total deferred tax expense 517 222 - 461Total tax expense in income statement 1 074 575 - 312Tax expense discontinued operations - 65 85Tax expense incl. tax related to discontinued operations 1 074 640 - 22756Aker <strong>Kvaerner</strong> annual report <strong>2007</strong>
Our performanceEffective tax rateThe table below reconciles the reported income tax expense to the expected income tax expense according to the corporate income tax rate of 28 percentin Norway.Amounts in NOK million <strong>2007</strong> 2006 2005Profit before tax 3 538 1 869 740Expected income taxes (28 percent) of profit before tax 991 523 207Tax effect of prior year adjustments - 12 26 24Tax effect of items booked against equity - 31 -Tax effect of permanent differences 23 - 32 - 12Tax effect of tax losses / other timing differences not included in the period incurred - 33 - 22 - 539Tax effect of change in tax rates 15 - -Tax effect of differences in tax rates from 28 percent 90 49 12Other - - - 4Income tax expense 1 074 575 - 312Effective tax rate 30 % 31 % - 42 %Tax effect of differences 83 52 - 519Comments to selected lines in the table aboveTax rates outside Norway different from 28 percent.The major part of the difference relates to the US where the tax rate is 41 percent.Permanent differencesIn <strong>2007</strong> the differences mainly relates to tax exemption in Malaysia and certain differences in UK. In 2006 the main difference was the gain on disposal ofAker Kværner Power & Automation Systems as.The change in effective tax rate from 2005 to 2006 is mainly caused by the recognition of a deferred tax asset in 2005 regarding losses (NOK 1 796 million) thatexisted but did not qualify for recognition in 2004.Deferred tax assets and liabilitiesDeferred tax assetsAmounts in NOK millionProperty, plantand equipmentPensionsTax losscfwd Other TotalDeferred tax assets as at 1 January 2006 67 268 424 92 851Recognised in profit and loss 22 - 24 - 333 53 - 282Recognised in equity - - - - -Disposal / acquisition of companies - - - - 21 - 21Translation differences 2 2 - - 4Deferred tax assets as at 31 December 2006 91 246 91 124 552Recognised in profit and loss - 84 - 23 105 44Recognised in equity - - - - 43 - 43Disposal / acquisition of companies - - - - -Translation differences - 2 - - - 3 - 5Deferred tax assets as at 31 December <strong>2007</strong> 5 246 114 183 548Deferred tax liabilitiesAmounts in NOK millionProperty, plantand equipment Projects Other 1) TotalDeferred tax liabilities as at 1 January 2006 15 632 - 601 46Recognised in profit and loss - 9 789 - 840 - 60Recognised in equity - - 80 80Disposal / acquisition of companies - - 6 - - 6Translation differences - - - -Deferred tax liabilities as at 31 December 2006 6 1 415 - 1 361 60Recognised in profit and loss 21 - 75 615 561Recognised in equity - - 43 43Disposal / acquisition of companies - - 25 25Translation differences - - - 9 - 9Deferred tax liabilities as at 31 December <strong>2007</strong> 27 1 340 - 687 6801) Includes the tax effect of tax losses carried forward of NOK 2 849 million used to offset positive timing differences.Aker <strong>Kvaerner</strong> annual report <strong>2007</strong> 57
Our performanceTax losses carried forwardTax losses carried forward expire as followsAmounts in NOK millionNorwayEuropeotherNorthAmericaSouthAmericaAsiaPacific Other Total<strong>2008</strong> - - 355 - - - 355<strong>2009</strong> - - 163 - - - 163<strong>2010</strong> - - - - - - -2011 - - 68 - - - 682012 - - - - - - -2013 and later - - 476 - - - 476Indefinite 2 849 539 - 57 193 13 3 651Total tax losses carried forward 2 849 539 1 062 57 193 13 4 713Tax losses not recognised as deferred tax asset - - 477 - 805 - 31 - 193 - - 1 506Tax losses recognised as deferred tax asset 2 849 62 257 26 - 13 3 207Comments regarding recognitionDeferred tax losses are recognised in the balance sheet to the extent that forecasts and realistic expectations about results show that Aker <strong>Kvaerner</strong> will beable to use the tax losses before they expire.Geographical split<strong>2007</strong>Amounts in NOK millionCurrenttax expenseDeferredtax expenseTotaltax chargeNet deferredtax liabilityNet payabletax liabilityNorway 40 566 606 - 307 - 38Europe 29 50 79 - 83 - 59North America 346 - 93 253 236 - 105South America 21 5 26 16 - 15Asia 74 2 76 5 - 5Other countries 47 - 13 34 1 - 18Total 557 517 1 074 - 132 - 240Tax asset 548 89Tax liability - 680 - 3292006Amounts in NOK millionCurrenttax expenseDeferredtax expenseTotaltax chargeNet deferredtax liabilityNet payabletax liabilityNorway 28 252 280 344 - 11Europe 30 34 64 - 15 - 45North America 175 - 38 137 141 - 11South America 19 - 9 10 25 - 28Asia 61 - 7 54 8 - 14Other countries 40 - 10 30 - 11 - 35Total 353 222 575 492 - 144Tax asset 552 86Tax liability - 60 - 230Note 18: Salaries, wages and social security costsAmounts in NOK million Note <strong>2007</strong> 2006 2005Salaries and wages including holiday allowance 9 741 8 365 8 009Social security tax / National insurance contribution 1 373 1 304 1 046Pension costs 20 543 337 302Other employee costs 540 435 342Salaries, wages and social security costs 12 197 10 441 9 699Loans to employees are shown in note 25.4 Non-current interest-bearing receivables. No guarantees are granted to any employees.58Aker <strong>Kvaerner</strong> annual report <strong>2007</strong>
Our performanceDirectors and nomination committee’s annual feesThe board fees for <strong>2007</strong> were NOK 3 150 000, including NOK 600 000 transferred to the labour union covering occupational activities in the group. In addition,fees to the reward committee were NOK 75 000 and to the audit committee NOK 75 000, the fees for 2006 were the same. The chairman of the Board ofDirectors and the Board of Directors did not receive any other payments for <strong>2007</strong>. The members of the Board of Directors have no agreements which entitlesthem to any extraordinary remuneration.Fees paid to the nomination committee in <strong>2007</strong> and 2006 were NOK 30 000 per year, 10 000 per member.Board of Directors 1)Amounts in NOK in <strong>2007</strong>RewardcommitteeAuditcommitteeBoard feesLeif-Arne Langøy 2) 25 000 400 000Bjørn Flatgård 25 000 350 000Helge Midttun 4) 25 000 75 000Heidi Marie Petersen 4) 225 000Vibeke Hammer Madsen 25 000 300 000Karl Erik Kjelstad 2) 300 000Siri Fürst 25 000 300 000Atle Teigland 3) 25 000 150 000Åsmund Knutsen 3) 150 000Bernt Harald Kilnes 3), 4) 37 500Arve Toft 3), 4) 112 500Øyvind Hopland 3), 5) 50 000Ingebreth Forus 3), 5) 100 000Amounts in NOK in 2006RewardcommitteeAuditcommitteeBoard feesLeif-Arne Langøy 2) 25 000 400 000Bjørn Flatgård 25 000 350 000Helge Midttun 25 000 300 000Vibeke Hammer Madsen 25 000 300 000Martinus Brandal 2), 6) 75 000Karl Erik Kjelstad 2), 6) 225 000Siri Fürst 25 000 300 000Atle Teigland 3) 25 000 150 000Åsmund Knutsen 3) 150 000Eldar Myhre 3), 7) 50 000Øyvind Hopland 3), 7) 100 000Bernt Harald Kilnes 3) 150 0001) Members of Board of Directors, the reward committee and the audit committee are elected for two years at the General Meeting.2) According to policy in the Aker group, Board of Directors employed in Aker companies will not be paid Board fees but have their Board fees directly paid to their employing company.Leif-Arne Langøy and Karl Erik Kjelstad therefore had their Board fees for <strong>2007</strong> paid to Aker ASA, while for 2006, Leif-Arne Langøy and Martinus Brandal had their Board fees paid toAker ASA and Karl Erik Kjelstad had his Board fees paid to Aker Yards ASA.3) According to agreement and initiative from the employees, NOK 150 000 is transferred to the labour union covering occupational activities in the group, for each Board memberselected from the employees.4) As at 29 March <strong>2007</strong>, Director of the Board Helge Midttun was replaced by Heidi Marie Petersen and Director of the Board Bernt Harald Kilnes was replaced by Arve Toft.5) Director of the Board Øyvind Hopland resigned as at May <strong>2007</strong>. He was replaced by alternate director Ingebreth Forus.6) As at 15 March 2006, Director of the Board Martinus Brandal was replaced by Karl Erik Kjelstad as Mr. Brandal entered into the position as President & Chief Executive Officer (CEO)as at 1 July 2006.7) Director of the Board Eldar Myhre resigned as at 11 May 2006. He was replaced by his alternate director Øyvind Hopland.Nomination committeeThe Aker Kværner ASA nomination committee comprises the following individuals as at 31 December <strong>2007</strong>: Kjell Inge Røkke (Chairman), Kjeld Rimberg andGerhard Heiberg.The reward committeeThe reward committee has three independent members chosen by and from the Directors. As at 31 December <strong>2007</strong> the members of the reward committeeare Leif-Arne Langøy, Bjørn Flatgård and Vibeke Hammer Madsen.The reward committee shall ensure that the company’s reward policy serves the interest of the shareholders and that the company has an internally consistentand externally competitive remuneration of executives.Guidelines for remuneration to the President and CEO and the members of the Executive Management TeamThe main purpose of the executive reward programme is to encourage a strong and sustainable performance-based culture, which supports growth in shareholdervalue. The total remuneration to executives consists of a market based salary, a few standard employee benefits and a variable pay programme.The President and CEO and the Executive Management Team participate in the standard pension and insurance schemes applicable to all employees. Thecompany practice standard employment contracts and standard terms and conditions regarding notice period and severance pay for President and CEO andthe members of the Executive Management Team. The company does not offer share option programmes to any managers or employees.The objective of the variable pay programme is to contribute to the company achieving good financial results and management according to the company’svalues and business ethics.Aker <strong>Kvaerner</strong> annual report <strong>2007</strong> 59
Our performanceThe variable pay programme is based on the achievement of financial and personal performance targets, leadership performance in accordance with thecompany’s values and the development of the company’s share price. The programme represents a potential for an additional variable pay up to the value of100 percent of base salary, up from 60 percent last year. Earnings are paid over three years. The first half of the variable pay is paid the following year. Theremaining amount is paid two years later with the addition of a retention element provided the executive is still employed by the company. The annual paymentsare restricted to one annual base salary and the restriction will be fully effective from <strong>2009</strong>. The actual reward of leaders for <strong>2007</strong> was according to theguidelines of the company. The variable pay in <strong>2007</strong> represents amounts earned in 2006 and 2004.Remuneration to members of the Executive Management TeamMembers of the Executive Management Team as at 31 December <strong>2007</strong> are: Martinus Brandal, Bjørn Erik Næss, Pål Helsing, Mads Andersen, Torleif Gram,Raymond Carlsen and Jarle Tautra. Pål Helsing replaced Simen Lieungh as at 1 October <strong>2007</strong>. Gary Mandel left the Executive Management Team as at30 April <strong>2007</strong>. Total taxable remuneration of the Executive Management Team for <strong>2007</strong> was NOK 61 341 631 (NOK 37 125 476 in 2006). In addition Aker<strong>Kvaerner</strong> also had NOK 1 290 782 in <strong>2007</strong> (NOK 4 129 720 in 2006) in pension cost for the Executive Management Team.The following remunerations have been paid:Ex. Management TeamAmounts in NOK in <strong>2007</strong>Basesalary 1)Total variablepay 2)Otherbenefits 3)Total taxableremunerationPension benefitearned / costto companyMartinus Brandal January - December 3 906 965 577 499 19 023 4 503 487 76 229Bjørn Erik Næss January - December 2 496 864 2 222 303 22 831 4 741 998 89 513Simen Lieungh January - September 1 984 483 6 292 094 45 660 8 322 237 71 602Pål Helsing October - December 512 500 - 21 094 533 594 19 135Mads Andersen January - December 2 303 615 5 152 378 28 382 7 484 375 59 260Torleif Gram January - December 2 239 582 5 443 460 994 381 8 677 423 586 699 4)Raymond Carlsen January - December 2 130 755 8 345 521 26 100 10 502 376 206 649 4)Gary Mandel January - April 1 287 029 5 701 121 3 398 6 991 548 47 121 5)Jarle Tautra January - December 2 606 790 6 956 552 21 251 9 584 593 134 574Sum 19 468 582 40 690 929 1 182 120 61 341 631 1 290 7824), 6)Amounts in NOK in 2006Martinus Brandal July - December 1 770 694 - 23 401 1 794 095 95 459Inge K. Hansen January - June 2 223 224 2 000 000 26 992 4 250 216 3 063 725 7)Bjørn Erik Næss January - December 2 387 967 708 750 26 992 3 123 709 70 902Simen Lieungh January - December 2 229 725 2 679 513 26 992 4 936 230 73 615 4)Mads Andersen January - December 1 789 730 2 387 141 26 992 4 203 863 38 173Torleif Gram January - December 2 013 464 2 005 779 25 792 4 045 035 460 794 4)Raymond Carlsen January - December 1 833 435 1 997 877 26 992 3 858 304 119 925 4)Gary Mandel January - December 3 004 616 3 016 913 20 654 6 042 183 111 842 5)Jarle Tautra January - December 2 114 777 2 730 072 26 992 4 871 841 95 285Sum 19 367 632 17 526 045 231 799 37 125 476 4 129 7201) Includes holiday allowance.2) The variable pay in <strong>2007</strong> are amounts earned in 2006 and 2004.3) Other benefits include insurance agreements, which is membership in the standard employee scheme and an additional executive group life and disability insurance with a cover ofmaximum NOK 4 505 640.4) Includes management pension rights where contributions stopped in 2002 . The schemes were wound up following the merger between <strong>Kvaerner</strong> and Aker Maritime.5) Gary Mandel has a defined contribution plan only.6) Simen Lieungh was included in the pension benefit program until 31.12.07.7) Includes special management pension scheme for the previous President & CEO Inge K. Hansen.There are no loans granted to members of the Executive Management team.Period of notice, severance pay and pension benefits for each member of the current Executive Management TeamName/TitlePresident & CEOMartinus BrandalExecutive Vice President & CFOBjørn Erik NæssExecutive Vice PresidentPål HelsingExecutive Vice PresidentMads AndersenExecutive Vice PresidentTorleif GramExecutive Vice PresidentRaymond CarlsenExecutive Vice PresidentJarle TautraAgreed period ofnotice Severance pay Pension benefits6 months 12 months Standard employee defined benefit plan as described in note 20.6 months 6 months Standard employee defined benefit plan as described in note 20.6 months 6 months Standard employee defined benefit plan as described in note 20.6 months 6 months Standard employee defined benefit plan as described in note 20.6 months 6 months Standard employee defined benefit plan as described in note 20.In addition vested company pension rights (see description above).6 months 6 months Standard employee defined benefit plan as described in note 20.In addition vested company pension rights (see description above).6 months 6 months Standard employee defined benefit plan as described in note 20.60Aker <strong>Kvaerner</strong> annual report <strong>2007</strong>
Our performanceShare based paymentsIncluding the members of the Executive Management Team, a total of 47 managers are entitled to variable pay according to the programme described above.The development of the company’s share price is an element of the variable pay programme.Amounts in NOK <strong>2007</strong> 2006 2005Paid in the year 115 419 678 35 122 508 672 014Expensed in the year - 90 094 622 82 166 301Accrued at the end of the year 21 046 724 136 466 401 81 494 287Directors’ and Executive Management Team’s ShareholdingThe following number of shares were owned by the Directors and the members of the Executive Management Team (and their related parties) as at 31 December<strong>2007</strong>.SharesLeif-Arne Langøy, Chairman 75 000Bjørn Flatgård, Vice Chairman 5 535Åsmund Knutsen, Director 1 505Karl Erik Kjelstad, Director 2 500Martinus Brandal, President & CEO 7 500Bjørn Erik Næss, Executive Vice President & CFO 5 000Torleif Gram, Executive Vice President 5 000Mads Andersen, Executive Vice President 2 395Raymond Carlsen, Executive Vice President 5 000Note 19: Number of employees (unaudited)<strong>2007</strong> 2006Field Development 3 586 3 562Maintenance, Modifications and Operations 4 855 5 187Subsea 3 673 3 028Products & Technologies 2 666 2 167Process & Construction 8 367 7 758Other 1 280 1 020Total Aker <strong>Kvaerner</strong> employees 24 427 22 722Agencies 8 290 10 322Total 32 717 33 044Employees in Norway 10 931 10 806Employees in other countries 13 496 11 916Note 20: Employee benefits – pension cost and liabilitiesThe group companies in Norway, Canada and Germany have retirement benefit plans that give the employees a right to future benefits (defined benefit plans).Normally, retirement benefits are based on the number of years of service and the expected salary upon retirement. Retirement plans are either organised byindependent pension funds, through insurance companies, in collective co-operations or directly by the company. Contributions to the pension funds aremade in accordance with local laws and accounting rules based on standard actuarial assumptions in the applicable country.The Norwegian group companies are obliged by law to have a pension plan for their employees. The companies have, through Aker Pension Fund , a pensionplan according to the law. About 11 000 Aker <strong>Kvaerner</strong> employees are covered by the Aker Pension Fund which also covers employees from some Aker companies.Aker <strong>Kvaerner</strong> participates together with the Norwegian state and other employers in a multi-employer plan called AFP. The participating employers pay a contributionto the plan independent of the company’s use of it. The employers also pay 25 percent of the pension paid to own pensioneers. The Norwegian state pays acontribution of 40 percent of paid pensions. The figures regarding defined benefit below include Aker Kværner’s cost and liability related to the AFP-plan.Outside Norway, Canada and Germany most companies have defined contribution plans where the employer only contributes an agreed amount that is separatelyadministered. See note 26 Subsequent events.Aker <strong>Kvaerner</strong> annual report <strong>2007</strong> 61
Our performanceNet periodic pension cost / return (-)Amounts in NOK million <strong>2007</strong> 2006 2005Defined benefit plansService cost 263 195 174Interest on projected benefit obligation 180 143 143Expected return on plan assets - 138 - 122 - 115Net amortisations and deferrals 68 9 4Administration cost 9 7 8Social security tax 53 31 30Pension cost defined benefit plans 435 263 244Pension cost defined contribution plans 108 74 58Total pension cost 543 337 302Status of pension plans reconciled with the balance sheet<strong>2007</strong> 2006Amounts in NOK million Funded Unfunded Total Funded Unfunded TotalDefined benefit plansAccumulated benefit obligation (ABO) 2 931 509 3 440 2 674 485 3 159Effect of projected future compensation levels 827 83 910 786 89 875Projected benefit obligation (PBO) 3 758 592 4 350 3 460 574 4 034Social security tax on plan assets in excess of / less than PBO 150 74 224 143 72 215Plan assets at fair value 2 662 - 2 662 2 438 - 2 438Plan assets in excess of (+) / less (-) that PBO - 1 246 - 666 - 1 912 - 1 165 - 646 - 1 811Unrecognised net gain (-) / loss (+) 906 84 990 803 81 884Net prepaid pension (+) / accrued pension liability (-) - 340 - 582 - 922 - 362 - 565 - 927Pension prepayment 15 - 15 4 - 4Accrued pension liability - 355 - 582 - 937 - 366 - 565 - 931Economic assumptions (Norwegian plans)Discount rate 5.00 % 5.00 % 5.00 % 4.50 % 4.50 % 4.50 %Asset return 6.00 % 6.00 % 6.00 % 5.50 % 5.50 % 5.50 %Salary progression 4.25 % 4.25 % 4.25 % 4.25 % 4.25 % 4.25 %Pension indexation 2.50 % 2.50 % 2.50 % 2.50 % 2.50 % 2.50 %Economic assumptions (Norwegian plans)The discount rate is based on the Norwegian 10-year government bond rate. The asset return is expected to be higher than the discount rate because theassets are invested in instruments with a higher risk than government bonds. Experience has shown that the rate of return on pension assets has been about1 percent higher than the discount rate over long time.Generally, a 1 percent increase in the discount rate will lead to around a 20 percent decrease in service cost / projected benefit obligation.For the Canadian plans, a discount rate of 5.25 percent (5 percent in 2006), an expected rate of return on assets of 7.25 percent (same as in 2006) and anexpected salary increase of 3.5 percent (4 percent in 2006) are used.62Aker <strong>Kvaerner</strong> annual report <strong>2007</strong>
Our performanceMovement in net prepaid pension (+) / accrued pension liability (-)Amounts in NOK million <strong>2007</strong> 2006Projected benefit obligation as at 1 January 4 034 3 339Service cost 1) 263 201Interest on projected benefit obligation 180 143Benefits paid - 107 - 106Members moved - 13 - 43Acquisition / disposal 26 - 108Change in unrecognised gain (-) / loss (+) - 40 615Translation difference 7 - 7Projected benefit obligation as at 31 December 4 350 4 034Plan assets at fair value as at 1 January 2 438 2 073Expected return on plan assets 138 122Contribution from scheme members 383 249Benefits paid - 80 - 76Members moved - - 22Change in unrecognised gain (-) / loss (+) - 199 101Administration costs - 20 - 6Translation difference 2 - 3Plan assets at fair value as at 31 December 2 662 2 4381) The pension cost in Pulping and Power is included in this reconciliation for 2006 as the disposal took place in the end of that year.Analyses of the plan assets and the expected return on plan assets at the balance sheet date <strong>2007</strong> 2006Major categories of plan assets in percent of total plan assets Norge NorgeEquity instruments 6,9 % 9,2 %Debt instruments 66,2 % 48,9 %Money market 22,3 % 39,6 %Other assets 4,6 % 2,3 %Plan assets 100,0 % 100,0 %The estimated contributions expected to be paid to the plans during <strong>2008</strong> are NOK 185 million in Norway and NOK 16 million in Canada. <strong>Annual</strong> return onplan assets is NOK 182 million in <strong>2007</strong> (NOK 133 million in 2006 ).Overview over net pension obligation and change in unrecognised gains and lossesAmounts in NOK million <strong>2007</strong> 2006 2005Projected benefit obligation 4 350 4 034 3 339Plan assets at fair value 2 662 2 438 2 073Net pension obligation - 1 688 - 1 596 - 1 266Change in unrecognised gain (-) / loss (+) projected benefit obligation - 40 615 112Change in unrecognised gain (-) / loss (+) plans assets - 199 101 4Aker <strong>Kvaerner</strong> annual report <strong>2007</strong> 63
Our performanceNote 21: Investments accounted for in accordance with the equity methodAssociated companies <strong>2007</strong>Amounts in NOK millionBook valueas at1.1.<strong>2007</strong>Additions /Disposals /PaymentsProfitafter tax /ImpairmentCurrencyand otheradjustmentsBook valueas at 31.12.<strong>2007</strong>RR Offshore Oy 16 - - - 1 15Siva Verdal Eiendom 14 - - - 14JSC Astrakhan Korabel 31 - - - 31Power Maintenance and Constructors, LLC 19 3 - - 3 19Aker Bravo 6 - - 4 - 2Beijing Bomco - MH Offshore 5 - 1 - 6Other companies 31 2 1 - 34Total 122 5 - 2 - 4 121Associated companies 2006Amounts in NOK millionBook valueas at1.1.2006Additions /DisposalsPaymentsProfitafter tax /ImpairmentCurrencyand otheradjustmentsBook valueas at 31.12.2006Aker <strong>Kvaerner</strong> Powergas Pvt Ltd 1) 53 - 51 2 - 4 -RR Offshore Oy 32 - - 16 - 16Siva Verdal Eiendom 14 - - - 14JSC Astrakhan Korabel - 31 - - 31Power Maintenance and Constructors, LLC - 19 - - 19Aker Arctic Technology AB 9 - - 1 - 8Aker Bravo - 7 - 1 - 6Beijing Bomco - MH Offshore - 6 - 1 - 5Other companies 5 15 - 1 4 23Total 113 27 - 18 - 1221) Subsidiary from March 2006.The group’s interest in its principal associates were as follows 2)<strong>2007</strong>Amounts in NOK millionBusiness officePercentageof voting rightsPercentageheld Assets Liabilities Equity RevenuesNet profit /lossRR Offshore Oy 4) Ulvila, Finland 40,0 % 26,0 % 186 183 3 255 7Siva Verdal Eiendom Trondheim, Norway 46,0 % 46,0 % 44 8 36 6 1JSC Astrakhan Korabel 3), 4) Astrakhan, Russia 56,0 % 56,0 % 31 - 31 - -Power Maintenance and Constructors, LLC Hammond, USA 49,0 % 49,0 % 69 27 42 306 5Aker Bravo Oslo, Norway 45,0 % 45,0 % 24 21 3 2 - 10Beijing Bomco - MH Offshore Beijing, China 50,0 % 50,0 % 11 3 8 2 12006Amounts in NOK millionBusiness officePercentageof voting rightsPercentageheld Assets Liabilities Equity RevenuesNet profit /lossRR Offshore Oy Ulvila, Finland 40,0 % 26,0 % 83 86 - 3 251 - 31Siva Verdal Eiendom Trondheim, Norway 46,0 % 46,0 % 41 8 33 4 2JSC Astrakhan Korabel 3) Astrakhan, Russia 56,0 % 56,0 % 95 88 7 26 - 7Power Maintenance and Constructors, LLC Hammond, USA 49,0 % 49,0 % 68 30 38 398 - 3Aker Arctic Technology AB Helsinki, Finland 12,5 % 12,5 % 102 38 64 28 - 1Aker Bravo Oslo, Norway 45,0 % 45,0 % 33 20 13 2 - 1Beijing Bomco - MH Offshore Beijing, China 50,0 % 50,0 % 14 4 10 1 - 32) Balance sheet and profit and loss items listed above are 100 percent of total.3) Despite the fact that Aker <strong>Kvaerner</strong> owns 56 percent of JSC Astrakhan Korabel the group does not have controlling interest.4) In February <strong>2008</strong>, Aker <strong>Kvaerner</strong> entered into an agreement which gives full ownership of RR Offshore OY and as part of the agreement, Aker <strong>Kvaerner</strong> sells its shares in theAstrakhan Korabel yard to ST Holding. See note 26 Subsequent events for more details.64Aker <strong>Kvaerner</strong> annual report <strong>2007</strong>
Our performanceNote 22: Investment in joint venturesThe group has interests in several joint venture activities, whose principal activities are construction contracts. The group’s share of assets, liabilities, income andexpenses of the joint ventures operating agreements and entities are included in the consolidated financial statements. The material agreements and entities arelisted below.Joint venture operating agreementsPercentage share <strong>2007</strong> 2006Aker <strong>Kvaerner</strong> Clough Murray & Robertsen Joint Venture 61 % 61 %Aker Maritime Kiewit Contractors 49 % 49 %AKTIV Joint Venture 40 % 40 %ALT GBS JV 1) - 51 %Angel 50 % 50 %Anglian Water 3 Joint Venture 50 % 50 %Anglian Water 4 Joint Venture 50 % 50 %Cameron LNG (Sempra) 50 % 50 %Hull Water 50 % 50 %IHI Ingleside 50 % 50 %JV Yansab 50 % 50 %O&G Solutions Joint Venture 50 % 53 %Snøhvit 65 % 65 %Halton Hills Power Partners Joint Venture 50 % 50 %Siemens / Aker <strong>Kvaerner</strong> Songer - Longview Consortium 50 % -AK / IHI Gulf 50 % -1) ALT GBS joint venture agreement was terminated in September <strong>2007</strong>.Joint venture operating entitiesPercentage share 1) Business Office <strong>2007</strong> 2006AKCS Offshore Partner New Foundland, Canada 40 % 40 %Aker Reinertsen AS Trondheim, Norway 50 % 50 %Aker <strong>Kvaerner</strong> & Soapro Egenharia Ltda Luanda, Angola 50 % 50 %Wirth Maschinen- und Bohrgeräte-Fabrik GmbH Erkelenz, Germany 50 % -1) The share of legal ownerships equals the share of voting shares for all joint ventures.The table below presents the assets, liabilities, income and expenses included in the annual accounts relating to joint venture operating entities.Amounts in NOK million <strong>2007</strong> 1) 2006Current assets 568 42Non-current assets 157 0Current liabilities - 363 - 37Non-current liabilities - 229 1Net assets / liabilities 133 6Income 559 264Expenses - 492 - 260Total 67 41) The increase in assets, liabilities, income and expenses are mainly caused by the acquisition of 50 percent in Wirth.Note 23: Financial risk managementFinancial risksThe group’s activities expose it to a variety of financial risks: market risk (including currency risk, interest rate risk and price risk), credit risk, liquidity risk andcapital risk. The market risks will affect the group’s income or the value of financial instruments held. The objective of market risk management is to manageand control market risk exposures, within acceptable parameters. The group’s overall risk management programme focuses on the unpredictability of financialmarkets and seeks to minimise potential adverse effects on the group’s financial performance. The Aker <strong>Kvaerner</strong> group uses fi nancial instruments to hedgecertain risk exposures and seeks to apply hedge accounting in order to reduce the volatility in the income statement.Risk management is the responsibility of project managers in cooperation with the central treasury department (Group Treasury) identifying, evaluating andhedging financial risks under policies approved by the Board of Directors. The Board provides written principles for overall risk management, as well aswritten policies covering specific areas. There have been no changes in these policies during the year.Aker <strong>Kvaerner</strong> annual report <strong>2007</strong> 65
Our performanceCurrency riskThe group operates internationally and is exposed to currency risk on commercial transactions, recognised assets and liabilities and net investments inforeign operations which are denominated in a currency other than the respective functional currencies of group entities. The currency risk exposure relatedto future commercial transactions, recognised assets and liabilities are primarily the USD, EUR and GBP. In addition there are several others. The currencies inwhich these transactions primarily are denominated are NOK, EUR, USD and GBP.The Aker <strong>Kvaerner</strong> policy requires group companies to hedge their entire currency risk exposure with Group Treasury using forward contracts and currencyoptions. Group Treasury manage the internal exposures in accordance with the Group Treasury’s risk management policy and hedge 100 percent of anticipatedcash flow from sales and purchases that are in a different currency than the relevant entity’s functional currency. This is done for the project’s lifetime usingforward contracts or currency options. Variations to forecasted cash flows are hedged as they occur. See note 25.3 Derivative financial instruments for furtherdetails.For segment reporting purposes, each subsidiary designates contracts with Group Treasury as fair value hedges or cash flow hedges, as appropriate. Externalforeign exchange contracts are designated at group level as hedges of currency risk on specific assets, liabilities or future transactions on gross basis, andhedge accounting is applied to more than 80 percent of these hedges. The Aker <strong>Kvaerner</strong> segment reporting, therefore handles all foreign currency hedgesas qualifying hedges. The correction where disqualifying hedges no longer are reflected in accordance to hedge accounting, is performed at group level andis included in the ”unallocated” part of the segment reporting.The principal amounts and interests of the group’s non-current borrowings are denominated in currencies that match the cash flows generated by the groupcompanies holding the loans, primarily NOK, but also GBP. This provides an economic hedge without entering into any derivatives.The group has several investments in foreign operations, whose net assets are exposed to foreign currency translation risk. Currency exposure arising fromthe net assets of the group’s foreign operations is not hedged, except for USD 200 million of net investments in US entities being hedged by foreign exchangeforwards. See note 23.3 Derivative financial instruments for further details.The group’s exposure to the main foreign currency risk was as follows based on notional amounts as per 31 December.<strong>2007</strong> 2006Amounts in million USD EUR GBP USD EUR GBPBank -229 -20 -22 -143 243 -1Intercompany loans 17 -21 35 184 -17 19External funding - - - - -282 -Trade receivables 598 36 - 586 23 7Trade payables -191 -106 -43 -82 -164 -20Balance sheet exposure 195 -111 -30 545 -197 5Estimated forecast sales 1 243 66 - 1 500 51 -Estimated forecast purchases -198 -219 -49 -378 -263 -19Cash flow exposure 1 045 -153 -49 1 122 -212 -19Forward exchange contracts -1 250 255 80 -1 657 419 15Net exposure -10 -9 1 10 10 1Trade receivables, trade payables and estimated forecast sales and purchases in the table above are calculated based on the groups hedge transactions.These are considered to be the best estimate of the currency exposure given that all currency exposure is hedged, in accordance with the group’s policy.Currency exposure in intercompany loans occurs when the loan is in another currency than the functional currency of one or both of the parties of the loanagreement. Normally only one of the parties has a currency exposure related to an internal loan.The group also has minor exposure to other currencies such as AUD, SGD, SEK, DKK and JPY.The following significant exchange rates applied during the year.Average rate<strong>Report</strong>ing date mid-spot rateNOK <strong>2007</strong> 2006 <strong>2007</strong> 2006USD 5,853 6,428 5,403 6,255EUR 8,016 8,058 7,966 8,238GBP 11,700 11,814 10,792 12,268A foreign currency sensitivity analysis indicates that a changes in the foreign currency rates results in minor effects on equity and profit and loss. A 10 percentstrengthening of the NOK against the following currencies at 31 December would have increased (decreased) equity and profit or loss by the amounts shownbelow. The selected rate of 10 percent reflects the recent years’ changes in currency rates. The sensitivity analysis is calculated based on the hedged transactionsas in the currency exposure table above. It includes only project related items and assumes that all other variables, in particular interest rates, remainconstant. Calculations are based on amounts and foreign currency exchange rates as at 31 December, and the outstanding amounts are representative forthe whole year due to a low degree of seasonality. The analysis is performed on the same basis for 2006.<strong>2007</strong> 2006Effect in NOK million Profit or loss Equity 1) Profit or loss Equity 1)USD - 262 - 328 - 34 - 663EUR - 4 119 - 21 204GBP 34 22 8 161) The effects to equity that follows directly from the effects to profit or loss are not included.66Aker <strong>Kvaerner</strong> annual report <strong>2007</strong>
Our performanceA 10 percent weakening of the NOK against the above currencies at 31 December would have had the equal but opposite effect on the above amounts, onthe basis that all other variables remain constant.Although hedge accounting is not applied to all foreign exchange contracts, these contracts are still ”economic-wise” hedged. This means that the effect onprofit or loss under financial items in the table above, will have an opposite effect on future operating income or expense as progress on projects increase.The most important risk, related to currency, is the risk of reduced competitiveness abroad in the case of a strengthened NOK. This risk is related to futurecommercial contracts and is not included in the sensitivity analysis above.Interest rate riskThe group’s interest rate risk arises from non-current borrowings. Borrowings issued at variable rates expose the group to cash flow interest rate risk. Borrowingsissued at fixed rates expose the group to fair value interest rate risk, however as these borrowings are measured at amortised cost, interest rate variationsdoes not affect profit or loss. Group policy is to maintain approximately 30-50 percent of its borrowings in fixed rate instruments using interest rate swaps toachieve this when necessary.As the group has no significant interest-bearing operating assets, operating income and operating cash flows are substantially independent of changes in marketinterest rates. At year end 50 percent of the NOK 1.6 billion bond debt interest rate was fixed between two to six years through interest swaps. In addition to thebonds the deferred acquisition payments of TH Resources of GBP 38 million (see note 25.6 Non-current borrowings) has a fixed interest rate.The group does not account for any fixed rate financial assets or liabilities at fair value through profit and loss, and the group does not designate derivatives(interest rate swaps) as hedging instruments under a fair value hedge accounting model. Therefore a change in interest rates at the reporting date would notaffect profit or loss with respect to the fixed rate instruments.An increase of 100 basis points in interest rates at the reporting date would have increased (decreased) equity and profit or loss by the amounts shown below.This analysis assumes that all other variables, in particular foreign currency rates, remain constant. The analysis is performed on the same basis for 2006.<strong>2007</strong> 2006Amounts in NOK million Profit or loss Equity 1) Profit or loss Equity 1)Cash and cash equivalents 35 - 57 -FRA (forward rate agreement) 1 - - -Interest rate swap 12 19 26 24Non-current interest-bearing receivables - - - -Current interest-bearing receivables 5 - 5 -Deposit to repay second priority lien note - - 24 -Borrowings - 15 - - 1 -Second priority lien note - - - -Interest-bearing current liabilities - - - -Cash flow sensitivity (net) 39 19 111 241) The effects to equity that follows directly from the effects to profit or loss are not included.A decrease of 100 basis points in interest rates at the reporting date would have had the equal but opposite effect on the above amounts, on the basis that allother variables remain constant.Price riskThe group is exposed to fluctuations in market prices both in the investment portfolio and in the operating businesses related to individual contracts.The investment portfolio is limited and does not include shareholdings in listed companies.The businesses may be exposed to changes in market price for raw material, equipment and development in wages. This is partly managed in the bid phaseby locking in committed prices to clients without adequate protection on such costs and partly managed in the execution phase after award. The group makesindividual assessment of such risks and protects itself either through escalation clauses with clients, locking in subcontractor or equipment providers or byadding risk contingencies to the price calculations. The group does not enter into commodity derivative contracts.Credit riskCredit risk is the risk of financial losses to the group if customer or counterparty to fi nancial investments / instruments fails to meet its contractual obligations,and arises principally from investment securities and group receivables.The investment portfolio is primarily related to deposits with banks. There is a separate procedure for the acceptance of final counterparties both for derivativesand deposits, and counterparties have to be investment graded. Credit risk on financial counterparties is viewed as insignificant.Assessment of credit risk related to clients and subcontractors are made when necessary on an individual basis. Such assessments are based on creditratings, income statement and balance sheet reviews and using credit assessment tools available (e.g. Dun & Bradstreet). Sales to customers are settled incash. The group does not require collateral in respect of trade and other receivables.Based on estimates of incurred losses in respect of trade and other receivables, the group establishes an allowance for impairment. Main components of thisallowance are a specific loss component relating to individually significant exposures, and a collective loss component in respect of losses incurred but notyet identified. Provisions for impairment of receivables are low (NOK 83 million in <strong>2007</strong>, NOK 41 million in 2006), which is higher than the historical losses(NOK 4 million in <strong>2007</strong>, NOK 13 million in 2006). Revenues are mainly related to large and long term projects closely followed up in terms of payments upfront and in accordance with agreed milestones. Normally, lack of payments are due to disagreements of project deliveries and are solved by change ofdeliveries (see note 13 Contingent events). The clients are mainly large and highly reputable oil companies with a low credit risk, which reduces the credit risksignificantly. Based on the above the Group’s credit risk is considered to be insignificant.At the balance sheet date, there were no significant concentrations of credit risk. The maximum exposure to credit risk at the reporting date equals the fairvalue of each category of financial instruments (see note 25 Financial instruments). The group does not hold collateral as security.Aker <strong>Kvaerner</strong> annual report <strong>2007</strong> 67
Our performanceAker Kværner ASA gives parent company guarantees to group companies. For further information, see note 9 Guarantees in the Aker Kværner ASA account.Liquidity riskLiquidity risk is the risk that the group will not be able to meet its financial obligations as they fall due. The group’s approach to managing liquidity is to ensure,as far as possible, that it will always have sufficient liquidity to meet its liabilities when due. This is under both normal and stressed conditions, without incurringunacceptable losses or risking damage to the group’s reputation.Prudent liquidity risk management includes maintaining sufficient cash, the availability of funding from an adequate amount of committed credit facilities andthe ability to close out market positions. Due to the dynamic nature of the underlying businesses, Group Treasury maintains flexibility in funding by maintainingavailability under committed credit lines (note 25.6 Non-current borrowings).Management monitors rolling weekly and monthly forecasts of the group’s liquidity reserve on the basis of expected cash flow. For information regardingcapital expenditures and net operating assets, see note 6 Segment information.Financial liabilities and the period in which they are mature<strong>2007</strong> 2006Amounts in NOK millionTotal6 mthsandless6-12mths1-2years2-5yearsMorethan 5yearsTotal6 mthsandless6-12mths1-2years2-5yearsMorethan 5yearsUnsecured bond issues 1)Fixed rate bondNOK 150 mill. - 204 - 5 - 4 - 9 - 27 - 159 - 213 - 5 - 4 - 9 - 27 - 168Floating rate bondsNOK 500 mill. - 566 - 17 - 17 - 533 - - - 569 - 11 - 12 - 23 - 523 -NOK 650 mill. - 834 - 23 - 23 - 46 - 742 - - 810 - 16 - 16 - 32 - 746 -NOK 300 mill. - 432 - 11 - 11 - 22 - 66 - 322 - 405 - 7 - 8 - 15 - 45 - 330Deferred acquisition costs TH GlobalGBP 38 mill. 2) - 480 - - 96 - 96 - 288 - - 654 - - 109 - 109 - 327 - 109Other non-current liabilitiesUSD - 20 - - - - 20 - - 33 - - - 29 - 4 -Derivative financial instrumentsAssets 3) 26 210 16 478 6 704 2 523 505 - 36 236 14 623 7 516 13 248 849 -Liabilities 3) -25 647 -16 151 -6 528 -2 480 - 488 - -35 977 -14 481 -7 464 -13 187 - 845 -Trade and other payables -15 165 -15 141 - - 24 - - -16 217 -15 962 - - 255 - -Interest-bearing current liab. - 25 - - 25 - - - - - - - - -Sum -17 163 -14 870 1 - 687 - 1 126 - 481 -18 642 -15 859 - 97 - 411 -1 668 - 6071) Nominal currency value including interests.2) The difference of payments in 2006 and <strong>2007</strong> is due to changes in the foreign exchange rate (GBP / NOK).3) The numbers represent grossing effects caused by time adjustments (ie. by using forward-forwards to adjust maturities).See note 25.3 Derivative financial instruments for maturity analysis of foreign currency contracts included in cash fl ow hedge accounting.Capital riskThe group’s objectives when managing capital are to safeguard the group’s ability to continue as a going concern in order to provide returns for shareholdersand benefits for other stakeholders and to maintain an optimal capital structure to reduce the cost of capital.In order to maintain or adjust the capital structure, the group may adjust the amounts of dividends paid to shareholders, return capital to shareholders, issuenew shares or sell assets to reduce debt. From time to time, the group purchases its own shares in the market; the timing of these purchases depends onmarket prices.During the first quarter <strong>2007</strong> Aker <strong>Kvaerner</strong> announced a buy-back of own shares and in connection with the <strong>Annual</strong> General Meeting it was decided to cancelparts of the own new shares. In addition, there were several share buy-backs in <strong>2007</strong> and as per year end the group holds 1.6 percent of outstanding shares.Please see Statement of changes to equity for more details.The group monitors capital on the basis of a gross debt / EBITDA ratio. The target for the ratio is to be kept below 2. This ratio is calculated as gross debt, includingall interest bearing liabilities as shown in note 25 Financial instruments, divided by EBITDA (earnings before interest, tax, depreciation and amortisation). The secondpriority lien note in 2006 is excluded.The ratio as at 31 December <strong>2007</strong> and 2006 were as followsAmounts in NOK million <strong>2007</strong> 2006Gross debt 2 022 2 126EBITDA 3 912 2 872Gross debt / EBITDA 0,5 0,768Aker <strong>Kvaerner</strong> annual report <strong>2007</strong>
Our performanceNote 24: Financial income and expensesRecognised in profit and lossAmounts in NOK million <strong>2007</strong> 2006 2005Ineffective portion of changes in fair value of cash flow hedges 7 - -Net change in fair value of financial assets at fair value through profit or loss 1) 155 241 - 396Profit (+) / loss (-) on foreign currency forward contracts 162 241 - 396Interest income on bank deposits 85 172 50Net foreign exchange gain / loss 18 20 18Other finance income 2 2 -Finance income 105 194 68Interest expense on financial liabilities measured at amortised cost - 209 - 429 - 467Refinancing cost 2) - - 652 -Finance expense - 209 -1 081 - 467Net finance expense recognised in profit or loss 3) 58 - 646 - 7951) All hedging instruments did not qualify for hedge accounting in accordance with IAS 39 in 2005 and January 2006. The hedging instruments for the minor contracts did not qualify forthe rest of 2006 and for <strong>2007</strong>. The fair value changes on foreign exchange forward contracts, not hedge accounted, have been recorded in the income statement as financial items.Hedge accounting is explained in note 25.3 Derivative financial instruments.2) Refinancing costs consists of capitalised refinance costs from the refinancing in 2004, unwinding of discount, interest on second priority lien notes due 15 June <strong>2007</strong> and interest ondeposit for neutralisation of loan 15 June <strong>2007</strong>.3) Net finance expense recognised in profit and loss includes income and expense from financial instruments only (see not 25 Financial instruments). Share of profit or loss fromassociates is therefore not included.The above financial income and expense include the following in respect of assets (liabilities) not at fair value through profit or lossTotal interest income on financial assets 85 172 50Total interest expense on financial liabilities - 209 -1 081 - 467Recognised directly in equityAmounts in NOK million <strong>2007</strong> 2006 2005Hedging reserve as at 1 January 203 - -Fair value of cash flow hedges transferred to profit and loss - 633 - 178 -Effective portion of changes in fair value of cash flow hedge 788 461 -Deferred tax - 43 - 80 -Hedging reserve movements 112 203 -Hedging reserve as at 31 December 315 203 -Translation reserve as at 1 January - 161 - 216 - 360Effective portion of change in fair value of net investment hedge 120 7 42Foreign currency translation differences for foreign operations - 554 48 102Translation reserve movements - 434 55 - 216Translation reserve as at 31 December - 595 - 161 - 216An impairment loss of NOK 4 million (NOK 13 million in 2006) in respect of trade receivables was recognised in cost of sales.See note 25 Financial instruments for information of the financial income and expenses generating items.Aker <strong>Kvaerner</strong> annual report <strong>2007</strong> 69
Our performanceNote 25: Financial instruments<strong>2007</strong> 2006Amounts in NOK million Note Assets Liabilities Assets LiabilitiesCash and cash equivalents 25.1 3 524 - 5 666 -Investments in other companies 25.2 133 - 16 -Non-current available-for-sale financial assets 133 - 16 -Derivative financial instruments 25.3 1 468 - 954 813 - 471Current financial assets and liabilities through profit or loss 1 468 - 954 813 - 471Non-current interest-bearing receivables 25.4 14 - 54 -Non-current loans and receivables 9 - 6 -Trade and other receivables 25.5 13 361 - 13 712 -Current interest-bearing receivables 540 - 546 -Deposit to repay second priority lien notes 25.6 - - 2 411 -Borrowings 25.6 - -1 998 - - 2 126Second priority lien notes 25.6 - - - - 2 329Trade and other payables - - 15 165 - -16 217Interest-bearing current liabilities - - 24 - -Total loans and receivables and financial liabilities at amortised cost 13 924 - 17 187 16 729 - 20 672Less non-current portion loans and receivablesand financial liabilities at amortised cost - 23 1 998 - 60 2 126Current portion loans and receivablesand financial liabilities at amortised cost 13 901 - 15 189 16 669 - 18 546Basis for determining fair values and fair values versus carrying amountsCash and cash equivalentsThe carrying amount is a reasonable approximation of fair values for cash and cash equivalents.Non-current available-for-sale fi nancial assetsAvailable-for-sale financial assets are measured at fair value. Fair values are estimated using market-based pricing techniques.Current fi nancial assets and liabilities through profit or lossFinancial assets and liabilities through profit or loss is measured at fair value. The fair value of fi nancial instruments traded in active markets (such as currencyforward contracts and options, interest swaps and FRA’s) is based on quoted market prices (current bid price) at the balance sheet date.Loans and receivables and fi nancial liabilities at amortised costDue to the short term nature, the carrying amount is a reasonable approximation of fair values for the financial instrument current receivables and liabilities,with the exception of non-current borrowings, which is detailed in the table below.Amounts in NOK millionCarryingamount<strong>2007</strong> 2006Fair valueCarryingamountFair valueBonds 1) 1 571 1 600 1 559 1 600Other borrowings 2) 427 427 567 567Total Borrowings 1 998 2 027 2 126 2 1671) Fair value is quoted prices on the Oslo Stock Exchange. The difference between the carrying amount and the fair value of the bonds is due to amortisation of issue costs and accruedinterests.2) Include deferred acquisition costs of TH Resources of NOK 407 million, which is the calculated NPV of yearly payments to TH Global for agency business, using a discount rate of6 percent. The remaining debt of NOK 20 million are related to several minor loans where the carrying amount is used as fair value due as the difference between carrying amountand fair value is immaterial.In all material financial instruments measured at fair value, the measurment is performed by using valuation techniques based on assumptions supported byobservative market prices or rates.Note 25.1: Cash and cash equivalentsGroup cash pool systemsThe group policy for the purpose of optimising availability and flexibility of cash within the group is to operate a centrally managed cash-pooling arrangement.Such arrangements are either organised with a bank as a service provider, or as a part of the operation of the internal treasury function. An important conditionfor the participants (business units) in such cash pooling arrangements is that the group as an owner of such pools is financially viable and is able toprove its capability to service its obligations concerning repayment of any net deposits made by business units.70Aker <strong>Kvaerner</strong> annual report <strong>2007</strong>
Our performanceNote 25.2: Investments in other companiesAmounts in NOK million <strong>2007</strong> 2006Investments in other companies as at 1 January 16 22Additions 1) 119 3Disposals - 2 - 9Investments in other companies as at 31 December 133 161) Additions are mainly related to Aker Kværner ASA purchase 19.1 percent of Aker Oilfield Services in <strong>2007</strong>.Available-for-sale financial assets are shares in unlisted companies and are mainly dominated in NOK (NOK 83 million in <strong>2007</strong> and NOK 11 million in 2006).Note 25.3: Derivative financial instruments<strong>2007</strong> 2006Amounts in NOK million Assets Liabilities Assets LiabilitiesForward foreign exchange contracts – cash flow hedges 925 - 409 440 - 151Forward foreign exchange contracts – not hedge accounted 500 - 545 355 - 317Forward foreign exchange contracts – hedge of net investments in US entities 25 - 1 -Interest rate swaps - cash flow hedges 17 - 8 -Interest rate swaps - not hedge accounted 1 - 9 - 3Total 1 468 - 954 813 - 471Trading derivatives are classified as current assets or liabilities. The full fair value of a hedging derivative is classified as a non-current asset or liability if theremaining maturity of the hedged item is more than 12 months, and as a current asset or liability if the maturity of the hedged item is less than 12 months. Ifthe hedged item is related to projects, such as work in progress or trade receivables, the hedging derivative is always classified as current asset or liability.The ineffective portion recognised in the profit and loss that arises from cash flow hedges amounts to a gain of NOK 7 million (gain of NOK 2 million in 2006).No ineffectiveness arose from net investment in foreign entity hedges in <strong>2007</strong> or 2006. In <strong>2007</strong> there were no fair value hedges and the ineffectiveness fromfair value hedges was NOK 0 million in 2006.Foreign currency forward contractsGroup Treasury hedge future transactions in foreign currencies. Due to the large number of transactions, Treasury may bundle the contracts (both foramounts and currency) before hedging the net portion externally. This procedure means that it is not possible to achieve hedge accounting (due mainly to themix of currency bundles). Approximately 80 percent of the exposure to foreign exchange variations in future cash flows is related to a few large projects.These projects have been hedged as one-to-one contracts from February 2006 in order to meet the requirements for hedge accounting. All other hedges arenot designated as IAS 39 hedges and will have a small but volatile effect on profit or loss.The notional principal amounts of the net qualifying forward foreign exchange cash fl ow hedges at 31 December <strong>2007</strong> were NOK 516 million (NOK 289 millionin 2006).The hedged highly probable forecast transactions denominated in foreign currency are expected to occur at various dates during the next 1–7 years, dependingon progress in the projects. Gains and losses on forward foreign exchange contracts recognised in the hedging reserve in equity as of 31 December<strong>2007</strong> are recognised in the income statement in the period or periods during which the hedged transactions affect the income statement. This is generallywithin 12 months from the balance sheet date unless the gain or loss is over the lifetime of the asset.The following table indicates the periods in which the cash flows associated with derivatives that are cash flow hedges are expected to occur and whenthe cash flows related to project revenues are expected to impact profit and loss. Given the hedging policy this table also constitutes a maturity analysis forderivative financial assets and liabilities.<strong>2007</strong> 2006Amounts in NOK millionExpectedcashflows6 mthsor less6-12mths1-2years2-5yearsMorethan 5yearsExpectedcashflows6 mthsor less6-12mths1-2years2-5yearsMorethan 5yearsInterest rate swaps 1)Receivables 288 41 43 77 74 53 142 16 16 64 43 3Payables - 251 - 32 - 38 - 69 - 62 - 50 - 132 - 15 - 15 - 59 - 40 - 3Foreign currency forwardcontracts 2)Receivables 10 160 5 693 2 756 1 426 285 - 10 693 3 472 1 575 5 612 34 -Payables - 6 619 - 3 861 - 1 660 - 905 - 193 - - 3 961 - 1 558 - 1 098 - 1 305 - -Total 3 578 1 841 1 101 529 104 3 6 742 1 915 478 4 312 37 -1) Half of the group’s interest exposure related to the Norwegian bonds is swapped to fixed interest rate. The cash flows in the table are based on fixed rate of 4.5 percent and market floating rate.2) The figures include the hedges that qualify for hedge accounting, which comprises approximately 400 transactions and 80 percent of the group’s exposure. The amounts are NOKnominal values of foreign currency cash flows at NOK closing exchange rates 31 December <strong>2007</strong>. The group has economic hedges on the remaining exposures which are not hedgeaccounted. These economic hedges constitute about 1 900 transactions.Aker <strong>Kvaerner</strong> annual report <strong>2007</strong> 71
Our performanceThe following table shows the unsettled cash flow hedges’ impact on profit and loss and equity as at 31 December.<strong>2007</strong> 2006Amounts in NOK millionFair value of allhedginginstruments as at31.12.<strong>2007</strong>Recognised inprofit and lossDeferred in equity(the hedgingreserve)Fair value of allhedginginstruments as at31.12.2006Recognised inprofit and lossDeferred in equity(the hedgingreserve)Interest rate swaps 1) 17 9 17 8 8 8Forward exchangecontracts 2) 516 308 208 288 118 170Total 533 317 225 296 126 1781) The value of the interest swaps is attributable to changes in the interest swap curve for Norwegian kroner during the period from inception of the hedge on 1 December 2006 to yearend <strong>2007</strong>. Based on an assumption of unchanged interest swap curves after 1 January <strong>2008</strong>, this value will come to Income statement during the next seven years.2) The purpose of the hedging instrument is to secure a situation where the hedged item and the hedging instrument together represent a predetermined value independent offluctuations of exchange rates. Revenue and expense on the underlying construction contracts are recognised in the income statement in accordance with progress. Consequently,NOK 308 million of the value of the forward contracts have already affected income statement indirectly as revenues and expenses are recognised based on updated forecasts andprogress. The NOK 208 million that are currently recorded directly in the hedging reserve, will be reclassified to income statement over approximately the next three years.A USD forward contract is used to hedge USD 200 million of the net investment in the group’s US entities. The hedge replaces a hedge of USD 85 millionwhich was entered into 1 December 2006 and replaced in June <strong>2007</strong>. The foreign exchange gain of NOK 120 million (NOK 4 million in 2006) on translation ofthe forward contract to NOK at the balance sheet date is recognised in translation reserves, in shareholder’s equity, offsetting the same amount of currencylosses / gains on translation of the net assets of the group’s US entities.Interest rate swapsAs per 31 December <strong>2007</strong>, Aker <strong>Kvaerner</strong> has one bond of NOK 150 million with fi xed interest rates at 6 percent and three bonds with a total of NOK 1 450million with floating interest rates. Parts of the cash flow interest rate risks represented by these fl oating interest rates (mainly NIBOR and LIBOR) are hedgedto fixed interest rates using interest rate swaps. The share of floating / fixed interest rates is 50 / 50. Hedge accounting is applied using the cash flow hedgeaccounting model which means that gains and losses on interest rate swap contracts as at 31 December <strong>2007</strong> are recognised in the hedging reserve inequity and will be continuously released to the income statement until the repayment of the bank borrowings (note 25.6 Non-current borrowings).The fair value amounts of the outstanding interest rate swap contracts at 31 December <strong>2007</strong> were NOK 17 million (NOK 8 million in 2006).Note 25.4: Non-current interest-bearing receivablesAmounts in NOK million <strong>2007</strong> 2006Restricted deposits - 42Loans to employees 1) 10 12Other 4 -Non-current interest-bearing receivables 14 541) Average interest rate for loans to employees is 4.42 percent in <strong>2007</strong>, and was 2.92 percent in 2006.The group has not recognised any impairment losses related to its non-current interest-bearing receivables.Note 25.5: Trade and other receivablesAmounts in NOK million <strong>2007</strong> 2006Trade receivables 1) 5 898 5 797Less provision for impairment of receivables - 83 - 41Trade receivables net 5 815 5 756Advances to suppliers 434 947Receivables from related parties 3 9Work in progress 4 774 3 924Other receivables 1) 2 335 3 076Trade and other receivables 13 361 13 712Derivative financial instruments 1 468 813Total trade and other current receivables 14 829 14 5251) Trade receivables and other receivables include NOK 89 million and NOK 19 million respectively, falling due after one year (NOK 100 million and NOK 42 million in 2006).72Aker <strong>Kvaerner</strong> annual report <strong>2007</strong>
Our performanceNote 25.6: Non-current borrowings31 December <strong>2007</strong>:Amounts in NOK millionNominalcurrency valueBookvalueInterestrateFixed int.marginInterestcouponMaturitydateInterest termsNorwegian bondsISIN NO 0010341316 NOK 500 million 491 5.81 % 0.70 % 6.51 % 01.12.<strong>2009</strong> Floating, 3 monthsISIN NO 0010341324 NOK 650 million 638 5.81 % 1.05 % 6.86 % 01.12.2011 Floating, 3 monthsISIN NO 0010341332 NOK 300 million 295 5.81 % 1.35 % 7.16 % 01.12.2013 Floating, 3 monthsISIN NO 0010342587 NOK 150 million 147 6.00 % 6.00 % 01.12.2013 Fixed, 7 yearsTotal bonds 1 ) 1 571Bank debtRevolving credit facility EUR 750 million - 0,50 % 25.10.2011 LIBOR + Margin 2)Deferred acquisition cost TH Global 3) GBP 38 million 407 6.00 % 13.10.2012Other loans 20Total non-current borrowings 1 99831 December 2006:Amounts in NOK millionNominalcurrency valueBookvalueInterestrateFixed int.marginInterestcouponMaturitydateInterest termsNorwegian bondsISIN NO 0010341316 NOK 500 million 487 3.67 % 0.70 % 4.37 % 01.12.<strong>2009</strong> Floating, 3 monthsISIN NO 0010341324 NOK 650 million 634 3.67 % 1.05 % 4.72 % 01.12.2011 Floating, 3 monthsISIN NO 0010341332 NOK 300 million 292 3.67 % 1.35 % 5.02 % 01.12.2013 Floating, 3 monthsISIN NO 0010342587 NOK 150 million 146 6.00 % 6.00 % 01.12.2013 Fixed, 7 yearsTotal bonds 1) 1 559Bank debtRevolving credit facility EUR 750 million - 0.625 % 25.10.2011 LIBOR + Margin 2)Deferred acquisition cost TH Global 3) GBP 54 million 534 6,00 % 13.10.2012Other loans 33Total non-current borrowings 2 1261) The book value is calculated by reducing the nominal value of NOK 1 600 million by total issue costs related to the new financing of NOK 38 million (NOK 47 million in 2006). It alsocomprises accrued interest and issue costs related to the bonds.2) The margin applicable to the facility is decided by a price grid based on the gearing ratio. Commitment fee is 40 percent of the margin.3) The acquisition of TH Resources. The book value is net present value of yearly payments, discounted by 6 percent per year.Norwegian bondsAker <strong>Kvaerner</strong> has issued four bonds with maturities of three, five and seven years (two loans), starting 1 December 2006. The bonds are denominated in Norwegiankroner and are issued in the Norwegian bond market. Three of the bonds are issued based on a floating interest rate plus a predefined margin. Oneof the bonds, NOK 150 million with seven years maturity, has a fixed interest rate of 6 percent.The bonds are issued with Norsk Tillitsmann as trustee and the loan agreements are based on Norsk Tillitsmann standard loan agreement for such bonds. Thebonds are unsecured on a negative pledge basis and include no dividend restrictions.The bonds are listed on the Oslo Stock Exchange.Bank debtThe bank debt is a multicurrency revolving credit facility of EUR 750 million with initial maturity in October 2012. The facility includes two one-year extensionoptions meaning that the maturity may be extended to October 2014. The facility is provided by a bank syndicate consisting of Nordic and international highquality banks. The facility was undrawn at year end <strong>2007</strong>. The terms and conditions include restrictions which are customary for this kind of facility, includinginter alia negative pledge provisions and restrictions on acquisitions, disposals and mergers. Furthermore, there are certain changes of control provisionsincluded. The facility includes no dividend restrictions and is unsecured.The financial covenants are based on two sets of key financial ratios; a gearing ratio based on gross debt / EBITDA and an interest coverage ratio based on EBITDA /net finance costs. The financial covenants are tested on a quarterly basis. The margin applicable to the facility is based on a price grid determined by the gearing ratio.The facility is unsecured.Aker <strong>Kvaerner</strong> annual report <strong>2007</strong> 73
Our performanceRefi nancing 1 December 2006On 1 December 2006, Aker <strong>Kvaerner</strong> concluded a refinancing of all credit facilities. The refinancing included repayment of all subordinated credit facilitiesestablished in 2002 with final maturity in 2011, cancellation of credit facilities and neutralisation of second priority lien notes 2004 / 2011. All costs related tothe old debt were recognised in the income statement as at 31 December 2006 and the fi nal settlement of the second priority lien notes took place 15 June<strong>2007</strong> in accordance with the assumptions in December 2006.Repayments of non-current borrowingsBonds 1)Deferred costTH Global 2) Other Total<strong>2008</strong> - -96 - - 96<strong>2009</strong> - 500 -96 - - 596<strong>2010</strong> - - 96 - 18 - 1142011 - 650 - 96 - 2 - 7482012 - - 96 - - 962013 - 450 - - - 450Total repayments - 1 600 - 480 - 20 - 2 1001) All figures are stated at nominal value.2) The payment amounts include interest.Mortgages and guarantee liabilitiesThe group has NOK 1 million in mortgage liabilities, which is secured by pledges on property, plant and equipment with book values of NOK 1 million.The group has no guarantee liabilities as at 31 December <strong>2007</strong>, except for guarantees related to contracts.Note 26: Subsequent eventsAcquisition of own sharesDuring January <strong>2008</strong>, Aker <strong>Kvaerner</strong> has acquired in total 595 000 own shares for a total consideration of NOK 70 million.DividendThe Board of Directors will propose an ordinary dividend of NOK 3 per share which amounts to NOK 822 millionRR Offshore OY / JSC Astrakhan KorabelIn February <strong>2008</strong> Aker <strong>Kvaerner</strong> has entered into an agreement which gives full ownership of the Finnish engineering and project management companyRR Offshore OY and ends the co-operation between Aker <strong>Kvaerner</strong> and its former Russian partner ST Holdings. As part of the agreement, Aker <strong>Kvaerner</strong> sellsits shares in the Astrakhan Korabel yard to ST Holding. The parties have agreed to not disclose any transaction values.First Interactive ASIn February <strong>2008</strong>, Aker <strong>Kvaerner</strong> has acquired a majority shareholding in the Norwegian company First Interactive. The agreement includes an option to buythe remaining shares. First Interactive is a software company specialising in 3D visualisation and simulation for the oil & gas sector. First Interactive and Aker<strong>Kvaerner</strong> MH are jointly developing applications for 3D visualisation and simulation of offshore drilling operations. The technology and competence can alsobe applied to other parts of Aker <strong>Kvaerner</strong>’s business such as marine installation, subsea and well services. First Interactive’s headquarter is in Stavanger,Norway, with a subsidiary in St. Petersburg, Russia. In <strong>2007</strong>, First Interactive realised revenues in excess of NOK 25 million.New Pension plan for employees in NorwayDuring the summer of <strong>2008</strong> Aker <strong>Kvaerner</strong> in Norway will start the process of transitioning its current Defined Benefit pension plans for employees below 58years of age over to a Defined Contribution plan. Employees in the existing plan will keep their vested rights (accrued benefit) in the form of a “paid-up policy.” Thenew Defined Contribution plan is designed so that existing employees in the current pension scheme will not lose out on the change over to the new plan.Aker Oilfield ServicesIn February <strong>2008</strong> Aker <strong>Kvaerner</strong> has increased the ownership in Aker Oilfield Services from 19 percent to 32 percent by investing NOK 167 million in newequity in the company.Note 27: Discontinued operationsAker <strong>Kvaerner</strong>’s Pulping & Power businesses were sold in the fourth quarter of 2006.74Aker <strong>Kvaerner</strong> annual report <strong>2007</strong>
Our performanceNote 28: Group companies as at 31 December <strong>2007</strong>Company Location Ownership (percent) 1)Aker Kværner ASA Fornebu, Norway 100Aker <strong>Kvaerner</strong> Business Partner Ltd London, UK 100Aker Kværner E&C Group AS Fornebu, Norway 100Aker <strong>Kvaerner</strong> Australia Pty Ltd Melbourne, Australia 10011259 Newfoundland Ltd British Columbia, Canada 100Aker Oil & Gas Technology Canada British Columbia, Canada 100Aker <strong>Kvaerner</strong> Chemetics Offshore Services Inc British Columbia, Canada 100Aker <strong>Kvaerner</strong> E&C US Inc Houston, USA 100Aker <strong>Kvaerner</strong> E&C Inc Houston, USA 100Aker <strong>Kvaerner</strong> Industrial Constructions Inc Houston, USA 100Aker <strong>Kvaerner</strong> Metals Inc Houston, USA 100Aker <strong>Kvaerner</strong> Pharmaceuticals LLC Houston, USA 100Aker <strong>Kvaerner</strong> Caribe LLP San Juan, Puerto Rico 98Aker <strong>Kvaerner</strong> US LLP Houston, USA 100Aker <strong>Kvaerner</strong> E&C Worldwide Corporation Houston, USA 100Aker <strong>Kvaerner</strong> Chile S.A. Santiago, Chile 100Aker <strong>Kvaerner</strong> Business Partner Inc Houston, USA 100Aker <strong>Kvaerner</strong> Songer Inc Houston, USA 100Aker <strong>Kvaerner</strong> Power Inc Charlotte, USA 100DSI Constructors Houston, USA 100Aker <strong>Kvaerner</strong> Willfab Inc Williamsport, USA 100<strong>Kvaerner</strong> Peru SA San Isidro, Peru 100Aker <strong>Kvaerner</strong> E&C (Thailand) Ltd Bankok, Thailand 100Aker <strong>Kvaerner</strong> E&C Europe Ltd London, UK 100Aker <strong>Kvaerner</strong> Engineering Services Ltd Stockton on Tees, UK 100Aker <strong>Kvaerner</strong> Europe BV Zoetermeer, Netherlands 100Aker <strong>Kvaerner</strong> Belgium NV / SA Antwerp, Belgium 100Aker <strong>Kvaerner</strong> Germany GmbH Lagenfeld, Germany 100Aker <strong>Kvaerner</strong> Netherlands BV Zoetermeer, Netherlands 100Aker <strong>Kvaerner</strong> Projects Ltd London, UK 100Aker <strong>Kvaerner</strong> Gulf Ltd Al Khobar, Saudi Arabia 100<strong>Kvaerner</strong> Construction (Stevanage) Ltd London, UK 100<strong>Kvaerner</strong> (Ireland) Ltd Dublin, Ireland 100MC Engenharia Ltda São Paulo, Brazil 100<strong>Kvaerner</strong> Pulping SL Barcelona, Spain 100<strong>Kvaerner</strong> Water AB Ørnskjøldsvik, Sweden 100Aker Kværner O&G Group AS Fornebu, Norway 100Aker Kværner AS Fornebu, Norway 100Aker Kværner Business Partner AS Fornebu, Norway 100Aker Kværner Carbon AS Lysaker, Norway 100Aker Kværner Contracting AS Lysaker, Norway 100Aker Kværner Contracting International (Spain) AS Fornebu , 'Norway 100Aker Kværner Geo AS Stavanger, Norway 100Aker <strong>Kvaerner</strong> Well Services Ltd Aberdeen, UK 100Aker Kværner Elektro AS Stord, Norway 100Aker Kværner Offshore Partner AS Stavanger, Norway 100Aker Inspection and Consulting AS Verdal, Norway 100Aker Kværner Advantage AS Bergen, Norway 100Aker <strong>Kvaerner</strong> Oilfield Services Canada Inc St. Johns Newfoundland, Canada 100Aker <strong>Kvaerner</strong> Oil & Gas Brazil Ltda Curitiba, Brazil 100Aker <strong>Kvaerner</strong> Songer Canada Ltd Ontario, Canada 100Aker <strong>Kvaerner</strong> Oil & Gas US LLC Houston, USA 100Aker <strong>Kvaerner</strong> Inc Houston, USA 100Aker <strong>Kvaerner</strong> Enercon Inc Houston, USA 100Aker <strong>Kvaerner</strong> Michigan Inc Houston, USA 100Aker <strong>Kvaerner</strong> Plant Services Group Inc Houston, USA 100Aker <strong>Kvaerner</strong> Subsea Inc Houston, USA 100<strong>Kvaerner</strong> Process Services Inc Houston, USA 100Aker <strong>Kvaerner</strong> Process Systems US Inc Houston, USA 100Aker Kværner Subsea AS Fornebu, Norway 100<strong>Kvaerner</strong> Oilfield Products Group Ltd London, UK 100PT Aker <strong>Kvaerner</strong> Subsea Indonesia Jakarta, Indonesia 100Aker <strong>Kvaerner</strong> Subsea Ltd Maidenhead, UK 100Aker Kværner Operations AS Stavanger, Norway 100Aker <strong>Kvaerner</strong> Operations Ltd London, UK 100Aker <strong>Kvaerner</strong> Advantage Ltd London, UK 100Aker <strong>Kvaerner</strong> annual report <strong>2007</strong> 75
Our performanceCompany Location Ownership (percent) 1)Aker <strong>Kvaerner</strong> Advantage BV Gravenhage, Netherlands 100Aker <strong>Kvaerner</strong> Advantage Pty Ltd Melbourne, Australia 100Aker Kværner Process Systems AS Fornebu, Norway 100Aker <strong>Kvaerner</strong> Process Systems Asia Pacific Sdn Bhd Shah Akam, Malaysia 100Aker <strong>Kvaerner</strong> Process Systems Australia Pty Ltd Welshpool, Australia 100Aker <strong>Kvaerner</strong> Process Systems SA Vincennes Cedex, France 100Aker Kværner Cool Sorption AS Glostrup, Denmark 100Aker <strong>Kvaerner</strong> Process Systems Ltd Aberdeen, UK 100Aker Kværner Engineering & Technology AS Fornebu, Norway 100KB eDesign AS Oslo, Norway 100Norwegian Contractors AS Fornebu, Norway 100Aker Marine Contractors AS Fornebu, Norway 60Aker Marine Contractors Pty Ltd Perth, Australia 60Aker Marine Contractors US Inc Houston, USA 60Aker Maritime US Inc Houston, USA 100Aker Offshore International Ltd London, UK 100Aker <strong>Kvaerner</strong> Offshore Partner Ltd London, UK 100Aker Kværner Stord AS Stord, Norway 100Stord Montasje AS Stord, Norway 100Stord Verft AS Stord, Norway 100Aker Valves AS Stord, Norway 100Aker Kværner Verdal AS Verdal, Norway 100Aker Kværner Cold Bending AS Verdal, Norway 100Aker FDV AS Verdal, Norway 100Aker Kværner Industributikk AS Verdal, Norway 100Aker Kværner Sakyndig Virksomhet AS Verdal, Norway 100Aker Kværner Jacket Technology AS Verdal, Norway 100Kogas AS Fornebu, Norway 100Aker Kværner Egersund AS Egersund, Norway 100Kværner Eureka AS Tranby, Norway 100<strong>Kvaerner</strong> Holdings Switzerland AG Zug, Switzerland 100<strong>Kvaerner</strong> E&C Singapore Pte Ltd Singapore, Singapore 100Aker <strong>Kvaerner</strong> Subsea (Services) Pte Ltd Singapore, Singapore 100Aker <strong>Kvaerner</strong> Oil & Gas Australia Pty Ltd Melbourne, Australia 100Aker <strong>Kvaerner</strong> Angola Ltd Maidenhead, UK 100Aker <strong>Kvaerner</strong> Nigeria Ltd Lagos State, Nigeria 100<strong>Kvaerner</strong> Process Overseas Holding Ltd London, UK 100Aker <strong>Kvaerner</strong> E&C (Shanghai) Co Ltd Shanghai, China 100Aker <strong>Kvaerner</strong> Engineering S.E.A. Snd Bhd Kuala Lumpur, Malaysia 90Aker <strong>Kvaerner</strong> (Mauritius) Ltd Port Louis, Mauritius 100Aker <strong>Kvaerner</strong> (Thailand) Ltd Bankok, Thailand 100PT Aker <strong>Kvaerner</strong> Indonesia Snd Bhd Jakarta, Indonesia 100Aker Kværner MH AS Kristiansand S, Norway 100Drilltech AS Kristiansand S, Norway 100Aker <strong>Kvaerner</strong> MH UK Ltd Aberdeen, UK 100Maritime Promeco AS Kristiansand S, Norway 100Aker <strong>Kvaerner</strong> MH India Pvt Mumbai, India 51Aker <strong>Kvaerner</strong> MH Inc Katy, USA 100RIG Specialities Inc Houston, USA 100Aker <strong>Kvaerner</strong> MH Singapore Pte Ltd Singapore, Singapore 100Woodfield Systems Co Ltd Kent, UK 100Aker Kværner Pusnes AS Arendal, Norway 100Aker Kværner Porsgrunn AS Porsgrunn, Norway 100Pusnes Korea Co Ltd Pusan, South Korea 80Aker Kværner Well Service AS Stavanger, Norway 100Aker <strong>Kvaerner</strong> Advantage Inc Houston, USA 100Aker Insurance AS Fornebu, Norway 100Aker Kværner E&C Europe AS Fornebu, Norway 100Aker <strong>Kvaerner</strong> Engineering Services BV Maastrichts, Netherlands 100Aker <strong>Kvaerner</strong> OGPE Projects (Shanghai) Co Ltd Shanghai, China 100Aker <strong>Kvaerner</strong> Strategic Operations Inc Washington, USA 100Aker Kværner E&C Americas AS Fornebu, Norway 100Step Offshore AS Hvalstad, Norway 51Aker <strong>Kvaerner</strong> Kazakhstan Ltd London, UK 100Aker Kværner Contracting Italy AS Fornebu, Norway 100Aker <strong>Kvaerner</strong> Canada Inc British Columbia, Canada 100<strong>Kvaerner</strong> Davy GOT Moscow, Russia 51Aker <strong>Kvaerner</strong> E&C Holdings (Thailand) Ltd Bankok, Thailand 100Aker <strong>Kvaerner</strong> Powergas Pvt Ltd Mumbai, India 6476Aker <strong>Kvaerner</strong> annual report <strong>2007</strong>
Our performanceCompany Location Ownership (percent) 1)Aker <strong>Kvaerner</strong> Powergas Systems Pvt Ltd Mumbai, India 64Aker <strong>Kvaerner</strong> Well Services Inc Houston, USA 100Aker <strong>Kvaerner</strong> Process Systems Snd Bhd Kuala Lumpur, Malaysia 100Aker <strong>Kvaerner</strong> Malaysia Snd Bhd Kuala Lumpur, Malaysia 100Aker <strong>Kvaerner</strong> Contracting Ltd Aberdeen, UK 100Aker <strong>Kvaerner</strong> Operations APS Glostrup, Denmark 100Aker <strong>Kvaerner</strong> Asia Pacific Snd Bhd Kuala Lumpur, Malaysia 100Kværner Engineering AS Fornebu, Norway 100Aker <strong>Kvaerner</strong> US Inc Houston, USA 100Aker <strong>Kvaerner</strong> US Holdings Inc Houston, USA 100Aker <strong>Kvaerner</strong> Development Inc Houston, USA 100Aker Kværner Process Systems International AS Fornebu, Norway 100Aker <strong>Kvaerner</strong> Cool Sorption Siam Ltd Rayong, Thailand 100Aker <strong>Kvaerner</strong> SA de CV Lomas de Chaputtepec, Mexico 100Aker Kværner Academy AS Fornebu, Norway 100Phoenix Polymers International Ltd Aberdeen, UK 501) The share of legal ownership equals the share of voting shares.Aker <strong>Kvaerner</strong> annual report <strong>2007</strong> 77
Our performanceAker Kværner ASA:Income statementAmounts in NOK million Note <strong>2007</strong> 2006Operating revenues 17 21Operating expenses 1 - 171 - 135Operating loss - 154 - 114Income from investments in subsidiaries 2 157 3 970Net financial items 2 436 - 364Profit before tax 2 439 3 492Tax 3 - 149 52Net profit 2 290 3 544Net profit for the year is distributed as followsProposed dividends 809 2 200Other equity 1 481 1 344Total distributed 2 290 3 54478Aker <strong>Kvaerner</strong> annual report <strong>2007</strong>
Our performanceAker Kværner ASA:Balance sheet as at 31 DecemberAmounts in NOK million Note <strong>2007</strong> 2006ASSETSDeferred tax asset 3 40 193Investments in group companies 4 6 856 6 593Investments in other companies 4 72 -Interest-bearing non-current receivables 7 8 8Total non-current assets 6 976 6 794Interest-bearing current receivables from group companies 7 9 726 5 737Interest-bearing current receivables other 7 - 45Non interest-bearing receivables from group companies 5 2 843 5 816Other current receivables 5 1 494 171Cash and cash equivalents 7 1 855 3 294Total current assets 15 918 15 063Total assets 22 894 21 857LIABILITIES AND SHAREHOLDERS' EQUITYIssued capital 6 548 550Own shares 6 - 9 -Share premium reserve 6 4 279 4 279Other equity 6 3 447 2 713Total equity 8 265 7 542Interest-bearing debt 7, 8 1 571 1 559Total non-current borrowings 1 571 1 559Interest-bearing current debt to group companies 7 9 999 10 250Provision for dividend 809 2 200Non interest-bearing debt to group companies 5 1 259 212Other current liabilities 5 991 94Total current liabilities 13 058 12 756Total liabilities and shareholders' equity 22 894 21 857Fornebu, 4 March <strong>2008</strong>The Board of Directors of Aker Kværner ASALeif-Arne LangøyChairmanBjørn FlatgårdVice ChairmanHeidi M. Petersen Karl Erik Kjelstad Ingebreth Forus Atle TeiglandVibeke HammerMadsenSiri Fürst Åsmund Knutsen Arve Toft Simen LieunghPresident & CEOAker <strong>Kvaerner</strong> annual report <strong>2007</strong> 79
Our performanceAker Kværner ASA:Statement of cash fl owAmounts in NOK million <strong>2007</strong> 2006Profit (+) / loss (-) before tax 2 439 3 492Unrealised exchange gain (-) / loss (+) - 26 - 186Accrued interest long term debt 2 6Depreciation and amortisation (+) 28 -Changes in other net operating assets 3 684 - 2 427Net cash flows operating activities 6 127 885Acquisition of businesses - 394 - 310Disposal of businesses 31 -Net cash flow from investing activities - 363 - 310Proceeds from non-current debt - 1 553Repayment of non-current debt - - 3 535Changes in net borrowings from group companies - 4 240 4 362Purshase of shares - 781 -Dividends paid - 2 182 - 275Net cash from financing activities - 7 203 2 105Net decrease(-) / increase (+) in cash and bank deposits - 1 439 2 680Cash and cash equivalent at 1 January 3 294 614Cash and cash equivalent at the end of the period 1 855 3 29480Aker <strong>Kvaerner</strong> annual report <strong>2007</strong>
Our performanceAker Kværner ASA:Accounting principlesAker Kværner ASA is a company domiciled in Norway. The accounts are presented in conformity with Norwegian legislations and Norwegian generally acceptedaccounting principles.Investment in subsidiaries / other companiesInvestments in subsidiaries / other companies are accounted for using the cost method in the parent company accounts. The investments are valued at costless impairment losses. Write down to fair value are according to good accounting practice recognised when the impairment is considered not to betemporary and reversed if the basis for the write down is no longer present.Dividends and other payouts are recognised as income the same year as it is appropriated in the subsidiary. If the dividend exceeds accumulated profits inthe subsidiary after the day of acquisition, the payment is treated as a reduction of the carrying value of the investment.Classification and valuation of balance-sheet itemsCurrent assets and current liabilities include items due within one year or items that are part of the operating cycle. The rest is classified as fixed assets /non-current debt.Current assets are valued at the lowest of cost and fair value. Current debt is valued at nominal value at the time of recognition.Fixed assets are valued at cost less accumulated depreciation, but are written down to fair value if impairment is not expected to be temporary. Non-currentdebts are initially valued at transaction value less attributable transaction costs. Subsequent to initial recognition, interest-bearing non-current debt is stated atamortised cost with any difference between cost and redemption value being recognised in the income statement over the period of the borrowing on aneffective interest basis.Trade receivables and other receivables are recognised at nominal value less provision for expected losses. Provision for expected losses is considered on anindividual basis.Other receivables are valued at nominal value less provisions for expected loss. Provisions for losses are based on individual judgement of each receivable.Cash and cash equivalents is the parent company’s cash as well as net deposits from subsidiaries in the group cash pooling systems owned by the parentcompany. Correspondingly the parent company’s current debt to group companies will include the same net deposits in the group’s cash pooling system.Foreign currency and interest swapsCash, receivables and foreign currency debt are valued at the exchange rate at the end of the fiscal year. Subsidiaries have entered into agreements with theparent company to hedge their foreign exchange exposure. In the parent company this risk is hedged in the external fi nancial markets. All agreements arebooked at fair value with any gains or losses booked against the income statement. In order to reduce the financial market exposure, interest swap agreements areentered. The value of these are recognised directly against equity and released to income statement in proportion to the relevant interest expense.TaxTax expense in the profit & loss account comprises current tax and changes in deferred tax. Deferred tax is calculated as 28 percent of temporary differencesbetween accounting and tax values as well as any tax losses carry forward at the year end. A net deferred tax asset is recognised only to the extent it isprobable that future taxable profits will be available against which the asset can be utilised.Aker <strong>Kvaerner</strong> annual report <strong>2007</strong> 81
Our performanceAker Kværner ASA:Notes to the accountsNote 1: Operating expensesThere are no employees in Aker Kværner ASA. Group management and corporate staff are employed by other Aker Kværner companies and costs for theirservices as well as other parent company costs are charged to Aker Kværner ASA. Directors and senior managements remuneration and shareholding aredescribed in note 18 Salaries, wages and social security costs to the consolidated accounts.Fees to KPMG in <strong>2007</strong> for statutory audit of the parent company amounted to NOK 4 million. Fees for statutory audit of the whole Aker <strong>Kvaerner</strong> groupamounted to 26 million, fees for other assurance services amounted to NOK 2 million, fees for tax advisory service amounted to NOK 4 million and fees forother advisory services amounted to NOK 2 million.Note 2: Net financial itemsAmounts in NOK million <strong>2007</strong> 2006Interest income 945 238Interest expense - 664 - 366Net interest 281 - 128Expenses of refinancing - - 336Net foreign exchange gain 155 100Net other financial items 155 - 236Net financial items 436 - 364Note 3: TaxAmounts in NOK million <strong>2007</strong> 2006Basis for taxable incomeNet profit (+) / loss (-) before tax 2 439 3 492Group contribution without taxes impact - 1 935 - 3 632Changes in non-current assets 28 - 45Change in timing differences 100 - 313Transferred to (utilisation of) tax loss carried forward - 632 498Taxable income - -Positive / (negative) timing differencesCurrent assets - 75 16Tax loss carry forward - 67 - 707Total negative timing differences - 142 - 691Deferred tax asset (28 percent of negative timing differences) 40 193Deferred tax expenseOrgination and reversal of temporary differences 28 - 87Benefit of tax losses recognised - 177 139Total income tax expense in income statement - 149 52The tax loss carry forward is assumed to be fully deductible against future taxable income in the Norwegian group companies.82Aker <strong>Kvaerner</strong> annual report <strong>2007</strong>
Our performanceNote 4: Investments in subsidiaries and other companiesInvestments in subsidiariesAmounts in NOK millionRegisteredofficeSharecapitalNumber ofshares heldBookvalueOwner- /votingshareAker Kværner E&C Group AS Norway 500 500 000 1 189 100 %Aker Kværner O&G Group AS Norway 1 110 1 110 000 5 555 100 %Aker <strong>Kvaerner</strong> Business Partner Ltd U.K. 163 14 000 000 112 100 %Total investments in group companies 6 856Investments in subsidiaries are held at the lower of cost and estimated fair value.Investments in group companies are changed by NOK 263 million and hereof NOK 321 million represent capital increase in Aker Kværner O&G GroupAS, partly offset by NOK 23 million write down of the shares in Aker <strong>Kvaerner</strong> Business Partner Ltd and NOK 35 million for sale of shares in Aker KværnerShared Services AS.Investments in other companiesAmounts in NOK millionRegisteredofficeSharecapitalNumber ofshares heldBookvalueOwner- /votingshareAker Innovation AS Norway - 165 - 16,17 %Aker Oilfield Services Ltd Cyprus 1 5 143 621 72 19,10 %Total investments in other companies 72Note 5: Non interest-bearing itemsAmounts in NOK million <strong>2007</strong> 2006Non interest bearing receivables from group companies 1) 2 843 5 816Other receivables 2) 1 494 171Current assets 4 337 5 987Non interest bearing liabilities to group companies 1) - 1 259 - 212Other current liabilities 2) - 991 - 94Current liabilities excl. tax and dividend - 2 250 - 306Net current assets excl. tax and dividend 2 087 5 681Dividend - 809 - 2 200Deferred tax assets 40 193Net assets incl. tax and dividend 1 318 3 6741) Hereof NOK 2 185 million in group contributions from subsidiaries, NOK 626 million in unrealised gains on group companies foreign exchange hedging with the parent company andNOK 32 million in other receivables from group companies.2) Unrealised gains and losses in relation to foreign exchange hedging of the company’s borrowing and lending portefolio.3) Hereof NOK 1 239 million are unrealised losses on group companies foreign exchange hedging with a parent company and NOK 20 million in other liabilities to group companies.All current assets and liablities are due within one year.Aker <strong>Kvaerner</strong> annual report <strong>2007</strong> 83
Our performanceNote 6: Shareholders’ equityAmounts in NOK million Number of shares Share capital Own shares Share premium Other equity TotalEquity as at 1 January 2006 55 029 234 550 4 279 1 361 6 190Net profit 3 544 3 544Proposed dividend - 2 200 - 2 200Cash flow hedge 1) 8 8Equity as at 31 December 2006 55 029 234 550 4 279 2 713 7 542Dividend from shares held by Aker Kværner ASA 19 19Change in 2006 dividend - 1 - 1Increase caused by share split (1:5) 220 116 936Cancellation of shares - 1 146 170 - 2 2 - -Share buy-back 2) - 11 - 770 - 781Net profit 2 290 2 290Proposed dividend 3) - 809 - 809Cash flow hedge 1) 5 5Equity as at 31 December <strong>2007</strong> 274 000 000 548 - 9 4 279 3 447 8 2651) The value of interest swap agreements changing interest from floating to fixed interest is recognised directly in equity and will be released to income together with the correspondinginterest expense.2) A further 595 000 shares were bought in January <strong>2008</strong>. After the acquisition, Aker Kværner ASA holds in total 4 966 830 shares.3) Proposed dividend is excl. dividend on own shares as at 31 December <strong>2007</strong>.The share capital of Aker Kværner ASA is divided into 274 000 000 shares with a nominal value of NOK 2. The shares can be freely traded. An overview ofthe company’s largest shareholders is to be found in page 88 Share and shareholder information.Own shares have been aquired for the purpose of being used in prospective share programs for employees, as settlement in future corporate aquisitions orfor other purposes as decided by the Board of Directors.Note 7: Interest-bearing itemsAmounts in NOK million <strong>2007</strong> 2006Cash and cash equivalents 1 855 3 294Interest-bearing current receivables from group companies 9 726 5 737Other interest-bearing current receivables - 45Other interest-bearing non-current receivables 1) 8 8Interest-bearing current borrowings from group companies - 9 999 - 10 250Interest-bearing non-current borrowings - 1 571 - 1 559Net interest-bearing assets (+) / liabilities (-) 19 - 2 725Interest income 945 238Interest expense - 664 - 366Net interest 281 - 1281) Loan to Aker Bravo AS due for repayment December 2016 with interest rate 4.5 percent.For information on the group cash pooling system see note 25.1 Cash and cash equivalents to the consolidated accounts.84Aker <strong>Kvaerner</strong> annual report <strong>2007</strong>
Our performanceNote 8: Non-current borrowingsAmounts in NOK million <strong>2007</strong> 2006Non-current borrowings at 1 January - 3 167Discounting effect - 223Foreign exchange effects - - 191Non-current borrowings as per time of refinancing 1 December 2006 - 3 199Discounting effect - 289Repayments - - 3 535Premium refinancing - 42Foreign exchange effects - 5Nominal value 1) 1 600 1 600Refinancing costs to be amortised - 37 - 47Accrued interest 8 6Non-current borrowings at 31 December 1 571 1 5591) The company’s loans are described in note 25.6 Non-current borrowings to the consolidated accounts.Repayments of non-current loans 1)<strong>2009</strong> - 500 - 5002011 - 650 - 6502013 - 450 - 450Total repayments - 1 600 - 1 6001) All figures are stated at nominal value.For information regarding interest rates, covenants and pledges, see the note 25.6 Non-current borrowings to the consolidated accounts.Note 9: GuaranteesAmounts in NOK million <strong>2007</strong> 2006Parent company guarantees to group companies 1) 34 725 44 966Counter guarantees for bank / surety bonds 2) 5 548 6 349Total guarantee liabilities 40 273 51 3151) Parent Company Guarantees to support subsidiaries in contractual obligations towards clients. Aker Kværner ASA has also issued counter indemnities in relation to office rental onbehalf of subsidiaries.2) Bank guarantees and surety bonds are issued on behalf of Aker <strong>Kvaerner</strong> subsidiaries, and counter indemnified by Aker Kværner ASA.Note 10: Financial InstrumentsDerivative financial instruments are used to hedge cash flow exposure due to fluctuations in foreign exchange rates and interest rates. Investments in subsidiariesare normally not hedged and will be subject to currency fluctuations. Management has a credit policy in place and the exposure to credit risk is monitored on anongoing basis. For more information please see note 23 Financial risk management to the consolidated accounts.Note 11: Contingent events and related partiesContingent events and transactions with related parties are described in note 13 Contingent events and note 5 Related parties to the consolidated accounts.Aker <strong>Kvaerner</strong> annual report <strong>2007</strong> 85
Our performanceAuditor’s report86Aker <strong>Kvaerner</strong> annual report <strong>2007</strong>
Our performanceAker <strong>Kvaerner</strong> annual report <strong>2007</strong> 87
Our performanceShare and shareholder informationOpen and direct dialogueAker <strong>Kvaerner</strong> is committed to maintaining an open and direct dialoguewith its investors, analysts and the fi nancial community in general. Thetimely release of information relevant to the equity market, is important inensuring that the share price reflects Aker <strong>Kvaerner</strong>’s underlying value.Aker <strong>Kvaerner</strong>’s objective is to secure thatthe company’s shareholders will, over time,receive competitive returns on their investmentsthrough a combination of dividends,share buy-back and share price.Dividend policyThe Board of Directors considers that thelong-term average dividend payments toshareholders should amount to 30 to 50percent of the net profit, through cashdividend and/or share buy-back. Considerationsthat affect such payments include alternativeuse of assets and strengthening of thecompany’s financial structure.The Board of Directors will propose toAker <strong>Kvaerner</strong>’s <strong>Annual</strong> General Meeting thata total dividend of NOK 3 per share shouldbe paid for <strong>2007</strong>. The following table showsAker <strong>Kvaerner</strong>’s dividend payments:YearOrdinary dividend2005 NOK 12006 NOK 2<strong>2007</strong> – proposed NOK 3Shares and share capitalAker Kværner ASA has 274 000 000 ordinaryshares. Each share has a par value of NOK 2(see page 41, the Consolidated accounts).As of 31 December <strong>2007</strong>, the company had3 197 shareholders, of whom 53.33 percentwere non-Norwegian shareholders.The <strong>Annual</strong> General Meeting in March<strong>2007</strong> adopted a share split where each existingAker Kværner ASA share, with a par valueof NOK 10, was split into fi ve (5) new shares,each with a par value of NOK 2. The company’sshare capital was also reduced by NOK2 292 340, from NOK 550 292 340 to NOK548 000 000, by cancelling 1 146 170 of thecompany’s treasury shares, each with a parvalue of NOK 2. Accordingly, the number ofcompany shares was reduced from 275 146 170to 274 000 000. The reduction correspondsto the cancellation of the company’s treasuryshares.Aker <strong>Kvaerner</strong> has a single share class.Each share is entitled to one vote. As of 31December <strong>2007</strong> the company held 4 371 830or 1.6 percent of its own shares. No shareissues were carried out during <strong>2007</strong>.Stock exchange listingAker <strong>Kvaerner</strong> was listed on the Oslo StockExchange on 2 April 2004. The company’sshares are listed on the Oslo Stock Exchange’smain list (OSEBX) with the ticker code AKVER.Aker <strong>Kvaerner</strong> shares are registered in theNorwegian Registry of Securities; the shareshave the securities registration number ISINNO NO0010215684. DnB NOR Bank ASA isthe company’s registrar.Largest shareholderAker <strong>Kvaerner</strong>’s largest shareholder is AkerHolding AS, which holds 40.27 percent of thecompany’s shares (as of 31 December <strong>2007</strong>).In June <strong>2007</strong>, Aker ASA, the Wallenbergrelatedcompanies SAAB AB and Investor AB,and the Norwegian Government entered intoagreements that provide long term strategicownership for Aker <strong>Kvaerner</strong>. Under the agreements,Aker transferred its 40.1 percentownership interest in Aker <strong>Kvaerner</strong> to thecompany Aker Holding AS. Aker ASA holds acontrolling 60 percent stake in Aker Holding.The Norwegian Government owns 30 percentof Aker Holding, the Swedish companies<strong>2007</strong> share buy-back overviewAs of 31 December <strong>2007</strong>SAAB AB and Investor AB own 7.5 percentand 2.5 percent respectively. The parties haveagreed that Aker <strong>Kvaerner</strong> will continue to bedeveloped as an internationally competitive,major supplier of technology, products, systems,and services, with operations primarilydirected at the energy, oil and gas sectors.Aker Holding’s owners will continue the established,close industrial cooperation betweenAker <strong>Kvaerner</strong> and other Aker companies.Current Board authorisationsAt Aker <strong>Kvaerner</strong>’s <strong>Annual</strong> General Meetingon 29 March <strong>2007</strong>, the Board of Directorswas granted the authorisation to: Increase the company’s share capital byup to NOK 109 600 000. The authoritygranted may be used for purposes thatinclude mergers and contributions inkind and may be used in take-oversituations. Shareholders’ preferentialrights may be set aside. Acquire company (treasury) shares up toa total par value of NOK 54 800 000 (10percent). The authorisation also allows foragreement liens in company shares. Thelowest per share price to be paid underthis authorisation is NOK 1; the highest isNOK 300.Date No. of shares Share price NOK million30 March <strong>2007</strong> 1) 1 268 830 126.60 160 633 87825 April <strong>2007</strong> 517 000 144.62 74 768 5409 May <strong>2007</strong> 341 000 143.26 48 851 66015 May <strong>2007</strong> 364 000 137.20 49 940 80015 August <strong>2007</strong> 45 000 146.73 6 602 85016 August <strong>2007</strong> 306 000 141.81 43 393 86021 August <strong>2007</strong> 270 000 144.27 38 952 90029 August <strong>2007</strong> 310 000 139.81 43 341 10030 November <strong>2007</strong> 625 000 159.55 99 718 7507 December <strong>2007</strong> 325 000 153.67 49 942 750Total accumulated NOK investment 4 371 830 140.94 616 147 088Own shares of total 1.6 %88Aker <strong>Kvaerner</strong> annual report <strong>2007</strong>1) Accumulated buy-back of own shares in Q1 <strong>2007</strong>, and adjusted for cancellation of 1 146 170 shares (NOK 154 283 651)and NOK 8 dividend per share.
Our performanceShare and shareholder informationAll authorisations are valid until the company’s<strong>2008</strong> <strong>Annual</strong> General Meeting, or 30 June<strong>2008</strong>, whichever occurs sooner.Acquisition of own sharesThe share buy-back programme was continuedusing the existing Board authorisationfrom the <strong>2007</strong> <strong>Annual</strong> General Meeting tobuy company (treasury) shares. The Boardhas authorised the administration to repurchasetreasury shares up to 5 percent. Theprogramme will last until the <strong>Annual</strong> GeneralMeeting 3 April <strong>2008</strong>. As of 28 February<strong>2008</strong>, 4 966 830 (1.81 percent) shares hadbeen acquired pursuant to the Board’sauthorisation. The Board of Directors of Aker<strong>Kvaerner</strong> will also propose an extension ofthe current authorisation, both for the sharecapital increase of up to NOK 109 600 000million and share buy-back of up to 10 percentof outstanding shares, by a period of 12months from the date of the authorisationgranted by the <strong>Annual</strong> General Meeting. Newterms and conditions for the share buy-backprogramme will be determined at that point.Investor relationsAker <strong>Kvaerner</strong> seeks to maintain an open anddirect dialogue with shareholders, financialanalysts, and the financial community in general.In addition to meetings with analysts andinvestors, the company schedules regularpresentations at major financial centres inEurope and the United States. Visitors to Aker<strong>Kvaerner</strong>’s website can subscribe to emaildeliveries of Aker <strong>Kvaerner</strong>’s press releases. AllAker <strong>Kvaerner</strong> press releases and investorrelations (IR) publications, including archivedmaterial, are available at the company’s website,Indexed share price development in NOK■ Aker <strong>Kvaerner</strong> ■ Philadelphia Oil Service Index (OSX) ■ Oslo Stock Exchange (OSEBX)800700600500400300200100002.04.0402.07.0402.10.04<strong>2007</strong> share data02.01.0502.04.0502.07.0502.10.0502.01.0602.04.0602.07.0602.10.0602.01.0702.04.0702.07.0702.10.0702.01.08<strong>2007</strong> 2006Highest closing share price NOK 190.175 158Lowest closing share price NOK 131.75 81.2Average closing share price NOK 152.15 118.74Closing price as of 31 December NOK 144.50 155.6Own (treasury) shares as of31 DecemberShares issued and outstanding as of31 DecemberMarket capitalisation as of31 DecemberAverage daily turnoverNumber ofsharesNumber ofshares4 371 830 0274 000 000 55 029 234NOK million 39 593 42 813Number ofshares2 171 728 1 705 299Turnover ratio Percent 197.5 155.6Earnings per share continuing operations NOK 8.84 4.53Change in share capital15.02.08Geographic distribution ofownershipAs of 15 February <strong>2008</strong>NationalityNumber ofsharesOwnershipin %Non-Norwegian 144 588 696 52.77Norwegian 129 411 304 47.23Total 274 000 000 100DateChange inshare capitalShare capitalin NOKNumber ofsharesPar valuein NOK1 January 2005 550 292 340 55 029 234 10.0031 December 2005 550 292 340 55 029 234 10.001 January 2006 550 292 340 55 029 234 10.0031 December 2006 550 292 340 55 029 234 10.00Change in <strong>2007</strong> (2 292 340)31 December <strong>2007</strong> 548 000 000 274 000 000 2.00Aker <strong>Kvaerner</strong> annual report <strong>2007</strong> 89
Our performanceShare and shareholder informationwww.akerkvaerner.com. This online resourceincludes the company’s quarterly and annualreports, prospectuses, corporate presentations,articles of association, fi nancial calendar,and the company’s Investor Relationsand Corporate Governance policies, alongwith other information. Aker <strong>Kvaerner</strong>’s annualcapital markets day, open to all stakeholders,is where key executives provide detailed,up-to-date information about the company’sbusiness activities and market conditions.Shareholders can contact the company byemail at: IR@akerkvaerner.com. The OsloStock Exchange displays special symbolsalongside company listings to indicate satisfactorydistribution of information (i) andinformation in English (E). Both the i and Esymbols have been awarded to Aker <strong>Kvaerner</strong>.Details on these designations are available atwww.oslobors.no.Electronic interim and annualreportsAker <strong>Kvaerner</strong> encourages its shareholders toreceive the company’s annual reports via theelectronic delivery service of the NorwegianRegistry of Securities (VPS). Subscribers tothis service receive annual reports in PDF formatby email. VPS services (VPS-Investortjenester)aredesignedprimarilyforNorwegianshareholders. VPS distribution takes place atthe same time as distribution of the printedversion of Aker <strong>Kvaerner</strong>’s annual report toshareholders who have requested it. Quarterlyreports, which are generally only distributedelectronically, are available from the company’swebsite and other sources. Shareholders whoare unable to receive the electronic version ofquarterly reports may subscribe to the printedversion by contacting Aker <strong>Kvaerner</strong>’s investorrelations staff.Nomination committeeAker <strong>Kvaerner</strong> has a nomination committee,as set forth in the company’s articles ofassociation.Pursuant to the articles of association, thenomination committee comprises no fewerthan three members. The composition of thenomination committee must reflect the interestsof shareholders, and must ensure the nominationcommittee members’ independence.AnalystsThe following security brokers provide analytic coverage of Aker <strong>Kvaerner</strong>:Company Name PhoneABG Anders Kirkhorn Rosenlund + 47 22 01 60 59ABN AMRO Thomas Deitz + 44 207 67 881 07Carnegie Rachid Bendriss + 47 22 00 93 71Citigroup Fiona Maclean + 44 207 98 641 44Crédit Agricole Cheuvreux Geoffroy Stern + 33 1 41 89 73 79Danske Bank Endre Storløkken + 47 85 40 70 71Deutsche Bank Christyan F. Malek + 44 207 54 582 49DnB NOR Lars-Daniel Westby + 47 22 94 89 83Fearnley Fonds Kjell Erik Eilertsen + 47 22 93 63 88Fondsfinans Christian Must + 47 23 11 30 44Glitnir Securities Terje Mauer + 47 22 01 63 24Goldman Sachs Henry Tarr + 44 207 55 259 81Handelsbanken Anne S. Ulriksen + 47 22 94 08 24HSBC David Phillips + 44 207 99 153 88JP Morgan Tao Ly + 44 207 32 56 292Kaupthing Christopher Moe + 47 24 14 74 28Merrill Lynch Alejandro Demichelis + 44 207 99 615 68Orion Securities Aleksandr Solovjov + 37 05 24 61 968Pareto Rune Juliussen + 47 22 87 87 32SEB Enskilda Pål Dahl + 47 21 00 85 61Standard & Poor’s Jan-Sigurd Sørensen + 44 207 17 678 16UBS Alex Brooks + 44 207 56 758 04The nomination committee has the followingmembers: Kjell Inge Røkke (Chairman), 2006-<strong>2008</strong> Gerhard Heiberg, 2006-<strong>2008</strong> Kjeld Rimberg, <strong>2007</strong>-<strong>2009</strong><strong>Annual</strong> General Meeting<strong>Annual</strong> General Meetings are normally held inlate March or early April. Written notification issent to all shareholders individually or to theshareholder’s nominee. All relevant informationabout the <strong>Annual</strong> General Meeting is also availableon the company’s website. To vote at theshareholders’ meeting, shareholders (or theirduly authorised representative) must either bephysically present, or must vote by proxy, underprovisions set out on the company’s website.<strong>2007</strong> share dataThe company’s total market capitalisation asof 31 December <strong>2007</strong> was NOK 39 593 million.During <strong>2007</strong>, a total of 542 682 000 Aker<strong>Kvaerner</strong> shares were traded, correspondingto 3.3 times the company’s freely tradablestock. Of the Company’s shares, 59.73 percentwere freely tradable in <strong>2007</strong>; the remaining40.27 percent was owned by Aker Holding.The shares traded on all of the 250 possibletrading days. The average daily trading volumewas 2 171 728 shares.90Aker <strong>Kvaerner</strong> annual report <strong>2007</strong>
Our performanceShare and shareholder information20 largest shareholdersAs of 15 February <strong>2008</strong>Name Nominee No. of shares held Ownership in %Aker Holding AS 110 333 615 40.27JPMorgan Chase Bank x 15 478 531 5.65JPMorgan Chase Bank Fidelity Lending 14 802 100 5.40State Street Bank x 11 932 254 4.35Fidelity Funds-Europe 5 635 450 2.06Mellon Bank As x 5 046 596 1.84Clearstream Banking x 5 011 426 1.83Aker Kværner ASA 4 966 830 1.81The Northern Trust x 4 497 556 1.64Mellon Bank As x 4 414 907 1.61JPMorgan Chase Bank x 4 314 776 1.57JPMorgan Chase Bank x 3 994 789 1.46Morgan Stanley & Co 3 405 166 1.24JPMorgan Chase Bank 3 148 317 1.15Bank of New York x 3 083 611 1.13UBS AG x 2 618 593 0.96SIS Segaintersettle x 2 158 760 0.79Bank of New York 2 102 550 0.77Citibank x 2 038 000 0.74The Northern Trust x 1 954 800 0.71Total, 20 largest shareholders 210 938 627 75.74Other shareholders 63 061 373 24.26Total 274 000 000 100Ownership structure by number of shares heldAs of 15 February <strong>2008</strong>Shares held No. of shareholders % share capital1 – 100 1 129 0.02101 – 1000 1 451 0.211001 – 10 000 583 0.7110 001 – 100 000 258 3.65100 001 – 500 000 109 8.48More than 500 000 49 86.93Total 3 579 100Aker <strong>Kvaerner</strong> annual report <strong>2007</strong> 91
Our performanceAnalytical informationAnalytical information Aker <strong>Kvaerner</strong>Amounts in NOK million <strong>2007</strong> 2006 2005Order backlog 31.12 58 261 59 695 48 522Order intake 57 942 62 271 51 937Revenue 57 957 50 592 36 940EBITDA 3 913 2 872 1 816EBITDA-margin 6.8 % 5.7 % 4.9 %Profit before tax 3 538 1 869 740Rate of taxation 30.4 % 30.8 % -42.2 %Net profit from continuing operations 2 464 1 294 1 052Interest cover 17.16 6.36 3.59Basic earnings per share continuing operations 8.84 4.53 4.47Cash flow from operating activities 2 675 2 636 3 674Cash flow from investing activities -1 576 985 -443Cash flow from financing activities -3 013 -4 688 -306Cash flow per share -7.82 -3.93 11.06Total capital 28 516 31 396 26 295Borrowings 1 998 2 126 5 279Equity ratio 25.48 % 25.84 % 16.46 %Liquidity ratio 116,04 % 120.04 % 124.86 %Gearing ratio 65.24 % 60.97 % 74.44 %Return on total capital 11.81 % 9.98 % 5.04 %Return on equity 46.59 % 30.05 % 24.48 %Return on capital employed 38.37 % 29.73 % 13.73 %RevenueAmounts in NOK million 1Q06 2Q06 3Q06 4Q06 2006 1Q07 2Q07 3Q07 4Q07 <strong>2007</strong>Field Development 3 139 4 228 4 027 4 731 16 125 4 817 4 598 3 807 3 159 16 381MMO 1 969 2 517 2 315 2 876 9 677 2 564 2 588 2 275 2 317 9 744Subsea 1 513 1 842 1 489 2 097 6 941 2 136 2 429 2 571 2 715 9 851P&T 1 207 1 588 1 958 2 819 7 572 2 513 2 690 3 287 3 863 12 353P&C 2 920 3 029 2 722 3 336 12 007 2 459 2 607 2 601 2 726 10 393Other -201 -522 -452 -555 -1 730 -342 -215 -304 96 -765Total group 10 547 12 682 12 059 15 304 50 592 14 147 14 697 14 237 14 876 57 957RevenueAmounts in NOK millionEBITDA marginReturn on capital employedEarnings per share 1)NOK60 0007 %40 %1050 00040 00030 00020 00010 0006 %5 %4 %3 %2 %1 %30 %20 %10 %8642020052006<strong>2007</strong>0 %20052006<strong>2007</strong>0 %20052006<strong>2007</strong>020052006<strong>2007</strong>92Aker <strong>Kvaerner</strong> annual report <strong>2007</strong>1) Continuing operations.
Our performanceAnalytical informationEBITDAAmounts in NOK million 1Q06 2Q06 3Q06 4Q06 2006 1Q07 2Q07 3Q07 4Q07 <strong>2007</strong>Field Development 201 251 209 242 903 220 246 222 203 891MMO 107 116 107 122 452 132 140 130 128 530Subsea 85 114 142 138 479 171 222 282 285 960P&T 90 118 156 167 531 202 218 245 294 959P&C 100 108 176 146 530 152 213 181 200 746Other 66 -31 -29 -29 -23 -21 -46 -63 -43 -173Total group 649 676 761 786 2 872 856 993 997 1 067 3 913EBITAmounts in NOK million 1Q06 2Q06 3Q06 4Q06 2006 1Q07 2Q07 3Q07 4Q07 <strong>2007</strong>Field Development 188 237 196 228 849 206 231 208 128 773MMO 105 115 105 121 446 130 138 128 125 521Subsea 61 82 121 115 379 150 198 250 250 848P&T 75 104 141 149 469 188 202 227 270 887P&C 94 100 169 133 496 144 208 175 195 722Other 47 -47 -46 -60 -106 -46 -72 -83 -68 -269Total group 570 591 686 686 2 533 772 905 905 900 3 482Order intakeAmounts in NOK million 1Q06 2Q06 3Q06 4Q06 2006 1Q07 2Q07 3Q07 4Q07 <strong>2007</strong>Field Development 3 192 919 11 608 1 421 17 140 5 347 821 4 543 1 413 12 124MMO 2 071 909 5 189 1 764 9 933 2 353 1 233 2 172 2 664 8 422Subsea 1 463 4 789 3 255 2 240 11 747 2 266 4 200 1 905 4 006 12 377P&T 3 123 3 655 2 566 3 653 12 997 1 889 3 476 1 872 3 496 10 733P&C 3 078 2 596 2 286 3 710 11 670 6 270 2 957 3 289 1 726 14 242Other -51 92 -1 268 11 -1 216 -821 629 252 -16 44Total group 12 876 12 960 23 636 12 799 62 271 17 304 13 316 14 033 13 289 57 942Order backlogAmounts in NOK million 1Q06 2Q06 3Q06 4Q06 2006 1Q07 2Q07 3Q07 4Q07 <strong>2007</strong>Field Development 19 557 16 174 23 822 20 385 20 385 20 881 16 973 17 540 15 695 15 695MMO 12 060 10 404 13 365 12 245 12 245 11 977 10 605 10 406 10 683 10 683Subsea 4 008 6 719 8 704 8 775 8 775 8 838 10 618 9 706 10 951 10 951P&T 9 271 11 287 11 946 12 741 12 741 12 092 12 861 11 371 11 520 11 520P&C 8 651 7 949 7 852 7 989 7 989 11 706 11 848 11 749 10 923 10 923Other -2 903 -2 282 -3 002 -2 440 -2 440 -2 736 -1 973 -1 443 -1 511 -1 511Total group 50 644 50 251 62 687 59 695 59 695 62 758 60 932 59 329 58 261 58 261Order backlogAmounts in NOK millionOrder intakeAmounts in NOK million70 00060 00050 00040 000■ Field Development■ MMO■ Subsea■ P&T■ P&C70000600005000040000■ Field Development■ MMO■ Subsea■ P&T■ P&C30 0003000020 0002000010 0001000002006<strong>2007</strong>02006<strong>2007</strong>Aker <strong>Kvaerner</strong> annual report <strong>2007</strong> 93
Our organisation and governanceCorporate governanceSafeguarding the interests ofour stakeholdersAker <strong>Kvaerner</strong>’s ambition is to ensure the greatest possible value creationover time, based on good corporate governance. The following presentsAker <strong>Kvaerner</strong>’s practices regarding each of the recommendationscontained in the most recent version of the Norwegian Code of Practicefor Corporate Governance.PurposeAker <strong>Kvaerner</strong>’s corporate governance principlesare intended to ensure an appropriatedivision of roles and responsibilities amongthe company’s owners, its Board of Directors,and its executive management. An appropriatedivision of roles is intended to ensure thatgoals and strategies are established, thatadopted strategies are implemented, andthat performance is subject to measurementand follow-up.Our corporate governance principles alsohelp ensure that Aker <strong>Kvaerner</strong>’s activitiesare subject to satisfactory control. An appropriatedivision of roles and satisfactory controlcontribute to the greatest possible valuecreation over time, to the benefit of ownersand other stakeholders.The corporate governance policy hasbeen prepared by the Board of Directors ofAker Kværner ASA. The principles are basedon the Norwegian Code of Practice for CorporateGovernance, dated 4 December <strong>2007</strong>.The following presents Aker <strong>Kvaerner</strong>’s practicesregarding each of the recommendationscontained in the Code of Practice.Our valuesThe Board has approved and adopted Aker<strong>Kvaerner</strong>’s corporate values, which are presentedon page 8 of this annual report. Ourethical guidelines and other policy documentshave been prepared in accordancewith these values.Our businessAker <strong>Kvaerner</strong>’s business purpose clausereads as follows: “The company’s purpose isowning and operating industrial businessesand other, related activities, capital managementand other Group functions, and participationin or acquisition of other businesses.”The business purpose clause ensuresthat shareholders have control of the scopeof the business activities and their risk profile,without limiting the Board or management’sability to carry out strategic and fi nanciallyviable decisions within the defined purpose.Aker <strong>Kvaerner</strong>’s fi nancial goals and mainstrategies are presented on page 7 ofthis report and in the Board of Directors’report.Equity and dividendsAker <strong>Kvaerner</strong>’s equity as of 31 December<strong>2007</strong> amounted to NOK 7 267 million, whichcorresponds to an equity ratio of 25.5 percent.Aker <strong>Kvaerner</strong> regards the currentequity structure as appropriate and adaptedto its objectives, strategy, and risk profile.Aker <strong>Kvaerner</strong>’s dividend policy is discussedin the section Share and shareholderinformation, see page 88 of this annualreport. Dividend policy is among the factorsconsidered in preparing the Board’s proposalfor allocation of profit for <strong>2007</strong>.Current Board authorisations to increaseshare capital and acquire own (treasury)shares are also presented in the sectionShare and shareholder information in thisannual report.Equal treatment of shareholdersAker <strong>Kvaerner</strong> has a single class of shares;all shares carry the same rights in the company.Equal treatment of all shareholders iscrucial. If existing shareholders’ pre-emptiverights are waived upon an increase in sharecapital, the Board must justify the waiver.Transactions in own shares must be executedon the Oslo Stock Exchange or by othermeans at the listed price.Transactions with related partiesWith regard to material transactions betweenthe company and a shareholder or memberof the Board or executive management, orparties closely related to the aforementioned,the Board shall ensure that such transactionsare entered into on an arm’s length basis. Ifneeded, external, independent evaluationsof such transactions are sought.Aker <strong>Kvaerner</strong> has prepared guidelinesdesigned to ensure that members of theBoard of Directors and executive managementnotify the Board of any direct or indirectstake they may have in agreements enteredinto by the Aker <strong>Kvaerner</strong>.Aker ASA owns 60 percent of the sharesin Aker Holding AS; as of 31 December <strong>2007</strong>,Aker Holding owns 40.27 percent of AkerKværner ASA stock. The Norwegian parliamentarybill St.prp. no. 88 (2006-<strong>2007</strong>) providesmore details on the establishment ofAker Holding AS and the agreement betweenAker ASA and the other Aker Holding ASshareholders.Based on its shared industrial history andownership ties, Aker <strong>Kvaerner</strong> aims to maintainits close cooperation with the Aker companiesand certain other companies associatedwith Aker ASA. For example, there maybe mutual business opportunities in jointprojects between Aker <strong>Kvaerner</strong> and otherAker companies that serve the oil and gasindustry.Aker Kværner ASA is not viewed as arelated party with regard to Aker ASA or companiesin which Aker ASA has ownershipinterests, under the Norwegian Public LimitedLiability Companies Act. Nevertheless,the Board and management of Aker <strong>Kvaerner</strong>are aware that Aker <strong>Kvaerner</strong> must conductrelations with Aker companies on anarm’s length basis. Further, transactions of acertain size between Aker Kværner ASA andAker companies are subject to the proceduresset forth in section 3-8 of the NorwegianPublic Limited Liability Companies Act.For further information, see Note 5 to theconsolidated accounts Related parties.Freely negotiable sharesAker <strong>Kvaerner</strong> shares are freely negotiable.No restrictions on transferability are found inthe company’s articles of association.<strong>Annual</strong> General MeetingsAker <strong>Kvaerner</strong> encourages shareholders toparticipate in its <strong>Annual</strong> General Meetings.Our goal is to publish notices of shareholders’meetings and comprehensive supportinginformation – including the recommendationsof the nomination committee – on thecompany’s website no later than 21 daysbefore the <strong>Annual</strong> General Meeting. Thesedocuments are distributed to shareholderswith known addresses no later than twoweeks before the <strong>Annual</strong> General Meeting.The deadline for shareholders to givenotice of their intention to attend the meetingis set as close to the date of the meeting aspossible, but not earlier than five days beforethe <strong>Annual</strong> General Meeting.Shareholders who are unable to attend themeeting in person may vote by proxy. Pursuantto Aker <strong>Kvaerner</strong>’s articles of association, the94Aker <strong>Kvaerner</strong> annual report <strong>2007</strong>
Our organisation and governanceCorporate governanceBoard Chairman, or other person appointedby the Board Chairman, chairs <strong>Annual</strong> GeneralMeetings. To the extent possible, Board members,the nomination committee leader, and theauditor attend <strong>Annual</strong> General Meetings.Minutes of <strong>Annual</strong> General Meetings arepublished as soon as practically possible viathe Oslo Stock Exchange messaging servicewww.newsweb.no (ticker: AKVER) and on thecompany’s website www.akerkvaerner.comunder the heading Investor Relations.Nomination committeeThe company has a nomination committee,as set forth in the company’s articles of association.Pursuant to the articles of association,the nomination committee comprises nofewer than three members. The compositionof the nomination committee must reflect theinterests of shareholders, as well as maintainthe committee members’ independence fromAker <strong>Kvaerner</strong>’s Board and executive management.Nomination committee membersand chair are elected by the company’s <strong>Annual</strong>General Meeting, which also determinesremuneration payable to committee members.Pursuant to the articles of association, thenomination committee recommends candidatesfor the Board of Directors. The nominationcommittee also makes recommendationsas to remuneration of Board members. Thecomposition of the nomination committee ispresented under the section Shares andshareholder information in this annual report.Board composition andindependencePursuant to the company’s articles of association,the Board comprises between sixand ten members, one-third of whom are tobe elected by and among Aker <strong>Kvaerner</strong> employees.Further, up to three shareholderelecteddeputy board members may beelected. The Board chairman and deputychairman are elected by the Board under anagreement with employee representatives;the agreement provides that the company isnot to have a corporate assembly. Boardmembers are elected for a period of twoyears.The current composition of the Board ispresented on page 96 of the annual report;the Board members’ expertise, capabilities,and independence are also presented. Boardmembers’ shareholdings are presented inNote 18 to the consolidated accounts Salaries,wages, and social security costs. The shareholder-electedBoard members have a broadrange of expertise, capabilities, and experiencefrom finance, industry, and non-governmentalorganisations.The work of the Board of DirectorsThe Board has adopted board instructionsthat regulate areas of responsibility, tasks,and division of roles of the Board, BoardChairman, and President & CEO. The Boardinstructions also feature rules as to Boardschedules, rules for notice and chairing ofBoard meetings, decision-making rules, thegeneral manager’s duty and right to discloseinformation to the Board, professional secrecy,impartiality, and other matters.Pursuant to the Board instructions, theBoard evaluates its own performance andexpertise once a year. The Board hasappointed a compensation committee.Risk management and internalcontrolAker <strong>Kvaerner</strong> has established a comprehensiveset of internal procedures and systemsto ensure unified and reliable fi nancial reporting.Each of Aker <strong>Kvaerner</strong>’s businessunits must annually evaluate its internal controlsystems and procedures with regard tofinancial reporting. Aker <strong>Kvaerner</strong> also regularlyconducts internal audits of individualunits’ adherence to systems and procedures.The Board receives monthly reports on thecompany’s fi nancial performance and statusreports on Aker <strong>Kvaerner</strong>’s most importantindividual projects.Page 27 of the annual report presents amore detailed description of the managementof operational and financial risks associatedwith Aker <strong>Kvaerner</strong>’s business activities.Remuneration to the Board ofDirectorsAker <strong>Kvaerner</strong>’s <strong>Annual</strong> General Meeting determinesthe Board’s remuneration based onthe recommendations of the nominationcommittee. Additional information on remunerationpaid to Board members for <strong>2007</strong> ispresented in Note 16 to the consolidated accounts:Salaries, wages, and social securitycosts.Remuneration of executivemanagementAker <strong>Kvaerner</strong>’s guidelines for remunerationof executive management are presented inNote 18 to the consolidated accounts Salaries,wages, and social security costs. Theguidelines are given to Aker <strong>Kvaerner</strong>’s <strong>Annual</strong>General Meeting each year as part of itsprocessing of the annual accounts. Note 18also provides details as to remuneration paidin <strong>2007</strong> to individual members of Aker <strong>Kvaerner</strong>’sexecutive management.Information and communicationThe company has prepared an Investor Relations(IR) policy, which is available at Aker<strong>Kvaerner</strong>’s website. Aker <strong>Kvaerner</strong>’s reportingof fi nancial and other information is to bebased on openness and on equal treatmentof market participants.The purpose of Aker <strong>Kvaerner</strong>’s systematicIR work is to ensure the company’saccess to capital at competitive terms and toensure shareholders correct pricing ofshares. These goals are to be accomplishedthrough correct and timely distribution ofinformation that can affect the company’sshare price; the company is also to complywith current rules and market practices,including the requirement of equal treatment.All stock-exchange notices and pressreleases are made available on the company’swebsite www.akerkvaerner.com; stockexchangenotifications are also availablefrom www.newsweb.no. All information that isdistributed to shareholders is simultaneouslypublished on Aker <strong>Kvaerner</strong>’s website.The company’s fi nancial calendar is foundon page 4 of this annual report.TakeoversIn light of Aker <strong>Kvaerner</strong>’s ownership structure,the Board has thus far not deemed it appropriateto prepare separate guidelines fortakeover situations.AuditorThe auditor participates in the Board meetingthat deals with the annual accounts.Remuneration for auditors, presented inNote 7 to the consolidated accounts Otheroperating expenses, is separately stated forauditing and non-auditing services. The Boardwill evaluate whether guidelines should beestablished for executive management’s useof auditors for services other than auditing.Aker <strong>Kvaerner</strong> annual report <strong>2007</strong> 95
Our organisation and governancePresentation of the Board of DirectorsLeif-Arne LangøyChairman of the BoardLeif-Arne Langøy (born 1956) hasbeen President and CEO of AkerASA, formerly Aker RGI, since 2003,and Chairman of the Board since2006. He has previously served asPresident & CEO of Aker Yards and,for 13 years, as Managing Directorof Aker Brattvaag. He is Chairman ofthe Board of Aker ASA, Aker Holding,Aker Seafoods, Aker Drilling, AkerFloating Production, Aker BioMarineand Aker Exploration, deputy chairmanof TRG Holding and a Boardmember of Aker Philadelphia Shipyard.Langøy holds an MBA from theNorwegian School of Economicsand Business Administration. As of31 December <strong>2007</strong>, Langøy holds75 000 shares in the company, andhas no stock options. Langøy is aNorwegian citizen. He has beenelected for the period <strong>2007</strong>-<strong>2009</strong>.Heidi M. PetersenDirectorHeidi M. Petersen (born 1958) is anindependent businesswoman. Sheholds an MSc from the University ofTrondheim (now NTNU). In the periodfrom 2000 to July <strong>2007</strong>, she wasmanaging director of Future EngineeringAS and of Rambøll Oil &Gas AS. Petersen was employed in<strong>Kvaerner</strong> Oil & Gas from 1988, becominghead of <strong>Kvaerner</strong> Oil & GasSandefjord in 1997. Petersen hasvaried board experience of industrial,oil and gas-based operations as wellas of energy supply and financialenterprises. She currently chairs theboard of Sandefjord Airport and is amember of the boards of NorskHydro ASA, Ocean Heavy Lift andAwilco Offshore. As of 31 December<strong>2007</strong>, Petersen holds no shares inthe company, and has no stockoptions. Petersen is a Norwegiancitizen. She has been elected for theperiod <strong>2007</strong>–<strong>2009</strong>.Karl Erik KjelstadDirectorKarl Erik Kjelstad (born 1966) isSenior Partner & President, MaritimeTechnologies of Aker ASA. Hehas been with the Aker group since1998. Kjelstad was President &CEO of Aker Yards ASA from January2003–June <strong>2007</strong>. Prior to joiningAker, he held the position as seniorconsultant at PA Consulting Group.From 1992 to 1996 he held variousmanagement positions in the TTSGroup. Kjelstad is Chairman ofAker Philadelphia Shipyard ASA,Aker Oilfield Services Ltd, and AkerDOF Supply AS. Kjelstad holds aMaster of Science (M.Sc) degree inMarine Engineering from the NorwegianUniversity of Science andTechnology (NTNU). As of 31December <strong>2007</strong>, Kjelstad holds2 500 shares in the company, andhas no stock options. Kjelstad is aNorwegian citizen. He has beenelected for the period 2006–<strong>2008</strong>.Ingebreth ForusDirectorIngebreth Forus (born 1950) waselected by the employees of Aker<strong>Kvaerner</strong> as a deputy boardmember in <strong>2007</strong>. He took over fromØyvind Hopland as a full boardmember in May <strong>2007</strong>. Forus wasemployed by <strong>Kvaerner</strong> between 1975and 1980, and joined Aker <strong>Kvaerner</strong>Well Service as a wireline supervisorin 1995, becoming a union representativeon a full-time basis in 2004.He is a member of the board ofIndustri Energi (former NOPEF).Forus holds a degree in civil engineeringfrom Stavanger TechnicalSchool and a cand.mag. degreefrom the University of Bergen. As of31 December <strong>2007</strong>, Forus holds noshares in the company, and has nostock options. Forus is a Norwegiancitizen. He has been elected for theperiod <strong>2007</strong>-<strong>2009</strong>.Atle TeiglandDirectorAtle Teigland (born 1957) was electedby the employees of Aker <strong>Kvaerner</strong>to the Board of Directors in October2004. He has served on the boardof Aker RGI for several years.Teigland is a Group Union Representativefor Aker <strong>Kvaerner</strong> on a fulltimebasis and has been employedby Aker <strong>Kvaerner</strong> Elektro since1978. Teigland is a certifiedelectrician. As of 31 December<strong>2007</strong>, Teigland holds no shares inthe company, and has no stockoptions. Teigland is a Norwegiancitizen. He has been elected for theperiod <strong>2007</strong>–<strong>2009</strong>.96Aker <strong>Kvaerner</strong> annual report <strong>2007</strong>
Our organisation and governancePresentation of the Board of DirectorsVibeke HammerMadsenDirectorVibeke Hammer Madsen (born1955) has been CEO of The Federationof Norwegian Commercialand Service Enterprises since 2002.Prior to this, she was Partner in PAConsulting Group. From 1993 to 1999Madsen was Vice President and heldvarious positions in Statoil. She is agraduate of the Norwegian Schoolof Radiography. As of 31 December<strong>2007</strong>, Madsen holds no sharesin the company, and has no stockoptions. Madsen is a Norwegiancitizen. She has been elected forthe period <strong>2007</strong>–<strong>2009</strong>.Siri FürstDirectorSiri Fürst (born 1958) has beenPartner and Business Consultant inConsidium Consulting Group sinceJanuary 2005. From 1984 to 1999she held various management positionsin Hafslund, Hafslund Nycomedand Nycomed Pharma. From 1999to 2003 she was Managing Directorof DiaGenic ASA. Fürst is a graduateof the Norwegian School of Economicsand Business Administration.As of 31 December <strong>2007</strong>, Fürstholds no shares in the company,and has no stock options. Fürst is aNorwegian citizen. She has beenelected for the period <strong>2007</strong>–<strong>2009</strong>.Åsmund KnutsenDirectorÅsmund Knutsen (born 1959) waselected by the employees of Aker<strong>Kvaerner</strong> to the Board of Directorsin October 2004. He has heldvarious positions in Aker <strong>Kvaerner</strong>Engineering & Technology since1991 and is now a Group UnionRepresentative for white-collaremployees on a full-time basis.Knutsen holds an MSc in Hydrodynamics.As of 31 December<strong>2007</strong>, Knutsen holds 1 505 sharesin the company, and has no stockoptions. Knutsen is a Norwegiancitizen. He has been elected for theperiod <strong>2007</strong>–<strong>2009</strong>.Arve ToftDirectorArve Toft (born 1966) was electedby the employees of Aker <strong>Kvaerner</strong>to the Board of Directors in March<strong>2007</strong>. Toft is a Group Union Representativefor Aker <strong>Kvaerner</strong> on a fulltimebasis and has been employedby Aker <strong>Kvaerner</strong> since 1983. Toft isa certified mechanic and scaffolder.He has been a full-time local unionrepresentative at Aker KværnerStord AS for 5 years. Toft holds noshares in the company, and has nostock options. Toft is a Norwegiancitizen. He has been elected for theperiod <strong>2007</strong>-<strong>2009</strong>.Bjørn FlatgårdDeputy ChairmanFlatgård (born 1949) runs his ownbusiness, the principal activities ofwhich are participation on boardsof directors and investing. Flatgårdwas President and CEO of ElopakAS from 1996–<strong>2007</strong>. He previouslyserved as President and CEO forNycomed Pharma and Executive VicePresident for Hafslund Nycomed andNycomed AS. Flatgård holds multipleboard positions in major Norwegiancompanies. Flatgård holds a Masterof Science in Chemical Engineeringfrom the Norwegian University ofScience and Technology and adegree from the Norwegian Schoolof Management. As of 31 December<strong>2007</strong>, Flatgård holds 5 535 sharesin the company, and has no stockoptions. Flatgård is a Norwegiancitizen. He has been elected for theperiod 2006–<strong>2008</strong>.Aker <strong>Kvaerner</strong> annual report <strong>2007</strong> 97
Our organisation and governancePresentation of the Executive Management TeamMartinus Brandal 1)President & CEOMartinus Brandal (born 1960) hasbeen President & CEO of AkerKværner ASA since July 2006. Priorto this, Brandal was Executive VicePresident (EVP) in charge of operations,strategy and business developmentat Aker ASA. He joined the Akergroup in July 2004. From 1985 to2004, Brandal held various managementpositions in the ABB Group atits headquarters in Zurich, includingGroup Senior Vice President andHead of Business Area ProcessAutomation. He has also held boardpositions in several of the Aker companies,including Aker <strong>Kvaerner</strong>, AkerYards and Aker Seafoods. Brandalhas a BSc in Electrical Engineeringfrom Oslo University College. As of15 February <strong>2007</strong>, Brandal holds7 500 shares in the company, andhas no stock options. Brandal is aNorwegian citizen.Bjørn Erik Næss 2)EVP & Chief Financial OfficerBjørn Erik Næss (born 1954) hasbeen EVP & Chief Financial Officer(CFO) of Aker Kværner ASA sinceOctober 2004. Prior to this, he wasEVP and CFO of Carlsberg BreweriesA/S from 2000. From 1995 to 2000,Næss was CFO of the Orkla group.Næss is a graduate of theNorwegian School of Economicsand Business Administration. As of31 December <strong>2007</strong>, he holds 5 000shares in the company, and has nostock options. Næss is a Norwegiancitizen.Pål HelsingEVP Field DevelopmentPål Helsing (born 1960) has beenan EVP with Aker <strong>Kvaerner</strong> since<strong>2007</strong>. Prior to this appointment, hewas Senior Vice President for SubseaSystems. He joined Aker <strong>Kvaerner</strong> in1993 and has extensive industryexperience from several high levelmanagement positions within thecompany in Norway and internationally.Before starting with Aker<strong>Kvaerner</strong>, Helsing worked with FMCKongsberg as Engineering Manager.He is a graduate of GlasgowUniversity and the NorwegianSchool of Management. As of 31December <strong>2007</strong>, he holds noshares in the company, and has nostock options Helsing is aNorwegian citizen.Torleif GramEVP MMOTorleif Gram (born 1949) has beenan EVP with Aker <strong>Kvaerner</strong> since2002. Prior to this appointment, hewas Managing Director of AkerOffshore Partner AS from 1994 andof Aker Contracting AS from 1991.Gram joined Aker <strong>Kvaerner</strong> in 1976and has extensive experience fromboth Aker Engineering AS and AkerStord AS where he held variouspositions. He is a graduate of theNorwegian University of Scienceand Technology (NTNU). As of 31December <strong>2007</strong>, he holds 5 000shares in the company, and has nostock options. Gram is a Norwegiancitizen.Raymond CarlsenEVP SubseaRaymond Carlsen (born 1955) hasbeen an EVP with Aker <strong>Kvaerner</strong>since 2003, heading the Subseabusiness since 2002. He has 26years of broad international managementexperience. Carlsen hasbeen with Aker <strong>Kvaerner</strong> since1989, with senior managementassignments in south-east Asia,Europe, and the United States.Carlsen is a graduate of the FloridaInstitute of Technology. As of 31December <strong>2007</strong>, he holds 5 000shares in the company, and has nostock options. Carlsen is aNorwegian citizen.98Aker <strong>Kvaerner</strong> annual report <strong>2007</strong>
Our organisation and governancePresentation of the Executive Management TeamMads AndersenEVP Products &TechnologiesMads Andersen (born 1965) joinedAker <strong>Kvaerner</strong> in 2000 and hasbeen an EVP since 2003. He has19 years of experience in theupstream oil and gas industry.Andersen has held a range oftechnical and managerial positionsin oilfield service and oil companiesincluding Schlumberger and SagaPetroleum (now StatoilHydro).Andersen is a graduate of GlasgowUniversity and the NorwegianSchool of Management. As of 31December <strong>2007</strong>, he holds 2 395shares in the company, and has nostock options. Andersen is aNorwegian citizen.Jarle TautraEVP Process & ConstructionJarle Tautra (born 1953) has beenan EVP with Aker <strong>Kvaerner</strong> since2002. He has 26 years of experiencein offshore-related activities.From 1997 to 2002 Tautra served asPresident of Aker Oil & Gas and asEVP of EPC Norway in Aker MaritimeASA. Prior to this, he held variouspositions in Norsk Hydro ASA.Tautra is a graduate of theNorwegian University of Scienceand Technology. As of 31 December<strong>2007</strong>, he holds no shares in thecompany, and has no stock options.Tautra is a Norwegian citizen.1) Martinus Brandal will be nominated as new Chairman of the Board of Aker Kværner ASA, and has been appointed Senior Partner & President for the Energy Technologies sector inAker ASA. Simen Lieungh has been appointed President & CEO of Aker <strong>Kvaerner</strong> from 1 March <strong>2008</strong>.2) Bjørn Erik Næss will leave Aker <strong>Kvaerner</strong> in March <strong>2008</strong> to take the position as CFO in the leading Norwegian financial institution, DnBNOR. Leif Borge has been appointed CFO ofAker <strong>Kvaerner</strong>.Aker <strong>Kvaerner</strong> annual report <strong>2007</strong> 99
Our organisation and governanceAddressAker Kværner ASASnarøyveien 361364 FornebuPostal address:P. O. Box 169NO-1325 LysakerTelephone: +47 67 51 30 00Telefax: +47 67 51 30 10ir@akerkvaerner.comwww.akerkvaerner.comCOPYRIGHT AND LEGAL NOTICE Copyright in all published material including photographs, drawings and images in this magazine remains vested in Aker <strong>Kvaerner</strong> and third party contributorsto this magazine as appropriate. Accordingly, neither the whole nor any part of this magazine can be reproduced in any form without express prior permission. Articles and opinionsappearing in this magazine do not necessarily represent the views of Aker <strong>Kvaerner</strong>. While all steps have been taken to ensure the accuracy of the published contents. Aker <strong>Kvaerner</strong> doesnot accept any responsibility for any errors or resulting loss or damage whatsoever caused and readers have the responsibility to thoroughly check these aspects for themselves. Enquiriesabout reproduction of content from this magazine should be directed to the editor.100Aker <strong>Kvaerner</strong> annual report <strong>2007</strong>
Aker <strong>Kvaerner</strong> annual report <strong>2007</strong> 101
Consept & design:Haugvar Communications & DesignConsulting:MonsenHejna asPhotos:Aker <strong>Kvaerner</strong>Aker <strong>Kvaerner</strong> Gulf LimitedEivind Røhne, beyond the iceJo Michael StudioKjetil AlsvikMoment Studio / Eva Helene Storm HanssenNils VikRenato LangfeldtSteven SheaSør Stangebye, KF21Translation:Flom-Jacobsen & Fish (page 94-95)Rolf E. Gooderham (page 26-35)Production:Signatur ASPrint:RKGrafisk AS
www.akerkvaerner.com