Performance on Raven's Advanced Progressive Matrices by African ...
Performance on Raven's Advanced Progressive Matrices by African ...
Performance on Raven's Advanced Progressive Matrices by African ...
- No tags were found...

Create successful ePaper yourself
Turn your PDF publications into a flip-book with our unique Google optimized e-Paper software.
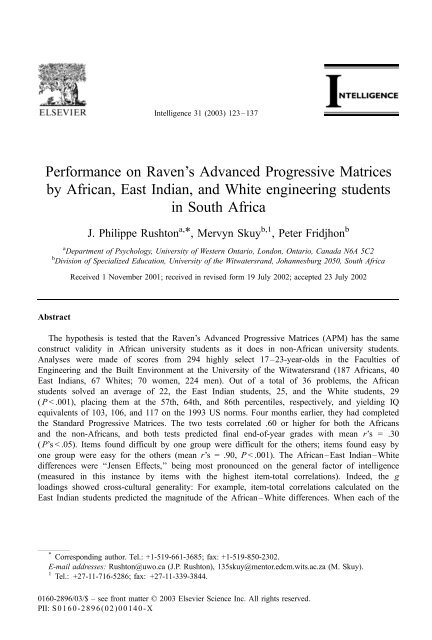
J.P. Rusht<strong>on</strong> et al. / Intelligence 31 (2003) 123–137 127The present study examines further whether ‘‘universalist’’ assumpti<strong>on</strong>s are valid in theSouth <strong>African</strong> c<strong>on</strong>text. The c<strong>on</strong>struct validity of IQ scores is examined in a highly selectgroup of <strong>African</strong>, East Indian, and White university students <strong>on</strong> the more difficult Raven’s<strong>Advanced</strong> <strong>Progressive</strong> <strong>Matrices</strong> (APM). External validity is assessed <strong>by</strong> examining whetherscores <strong>on</strong> the APM predict final end-of-year examinati<strong>on</strong> marks taken 4 m<strong>on</strong>ths later, aswell as scores gathered <strong>on</strong> the Standard <strong>Progressive</strong> <strong>Matrices</strong> 4 m<strong>on</strong>ths earlier. Internalvalidity is assessed <strong>by</strong> examining whether the item structures and g loading patterns are thesame for the different racial groups, and whether <strong>African</strong>–White group differences are mostpr<strong>on</strong>ounced <strong>on</strong> the g factor as hypothesized <strong>by</strong> Spearman (1927) (see Jensen, 1998), andobserved in previous studies. One of the hypotheses raised <strong>by</strong> Rusht<strong>on</strong> et al. (2002) is alsotested, namely that a higher performing group of <strong>African</strong> students might be identified,yielding evidence of a bimodal distributi<strong>on</strong> in <strong>African</strong> university students. The APM is anideal test for these purposes (see more below) because it was developed to spread out thedistributi<strong>on</strong> of scores in the top 25% of the populati<strong>on</strong> (Raven, 2000; Raven, Raven, &Court, 1998).2. Method2.1. OverviewThe primary purpose was to examine performance <strong>on</strong> the APM in an <strong>African</strong> sample thatwould be expected to score very much above the general South <strong>African</strong> populati<strong>on</strong> mean. Inthe US, engineers are am<strong>on</strong>g the very highest scoring groups <strong>on</strong> tests such as the ScholasticAptitude Test (SAT) and the Graduate Record Examinati<strong>on</strong> (GRE). For example, the meanverbal + quantitative + analytic scores of engineering students <strong>on</strong> the GRE is about 1800,whereas psychology and educati<strong>on</strong> students average about 1500, a difference of about <strong>on</strong>estandard deviati<strong>on</strong> (Educati<strong>on</strong>al Testing Service, 1998). In turn, students entering universityto study psychology score about <strong>on</strong>e standard deviati<strong>on</strong> above the general populati<strong>on</strong>. Thus,engineers may be up to about two standard deviati<strong>on</strong>s above the general populati<strong>on</strong>, at least inthe US and most developed nati<strong>on</strong>s.First-year students from the Faculties of Engineering and the Built Envir<strong>on</strong>ment at theUniversity of the Witwatersrand are am<strong>on</strong>g the highest academically achieving <strong>African</strong>students. They had been tested <strong>on</strong> Raven’s Standard <strong>Progressive</strong> <strong>Matrices</strong> in April 2001(Rusht<strong>on</strong> et al., 2002) and were invited to take part in a follow-up study in August 2001.Participants were paid 50 rand (at that time about US$8) each. Final end-of-year examinati<strong>on</strong>marks were taken in December 2001. (In the Southern Hemisphere, December marks thecompleti<strong>on</strong> of the academic year and the beginning of the l<strong>on</strong>g summer break.)2.2. SubjectsAn initial pool of 342 subjects who took the APM was reduced to 294 17–23-yearolds<strong>by</strong> eliminating small or ambiguous categories. Excluded were those who had not
128J.P. Rusht<strong>on</strong> et al. / Intelligence 31 (2003) 123–137taken part in the earlier testing (n = 31), or who, in the earlier testing, had self-identifiedas ‘‘Colored’’ (n = 5), ‘‘Other’’ (n = 7), listed their age as over 23 (n = 2), or failed to givebiographical data (n = 3). The analyses were c<strong>on</strong>ducted <strong>on</strong> 187 <strong>African</strong>s (144 men, 43women), 40 East Indians (24 men, 16 women), and 67 Whites (56 men, 11 women).(Forty-eight of those who had taken the Standard <strong>Progressive</strong> <strong>Matrices</strong> did not turn upfor the APM: 11/198 = 5.5% of the <strong>African</strong>s, 18/58 = 31% of the East Indians, and 19/86 = 22% of the Whites).2.3. Test instrumentThe Raven’s APM is the most difficult of the Raven’s <strong>Matrices</strong> tests. Regardless ofversi<strong>on</strong>, the Raven’s tests (the Colored <strong>Progressive</strong> <strong>Matrices</strong>, the Standard <strong>Progressive</strong><strong>Matrices</strong>, and the APM) are the best known, most researched, and most widely used of allculture-reduced tests (Raven, 2000). The Raven’s APM was designed to differentiate betweenpeople of ‘‘superior intellectual ability,’’ such as ‘‘students for advanced scientific or technicalstudies’’ (Raven et al., 1998, pp. 1–2). The <strong>Advanced</strong> <strong>Matrices</strong> test shows reliability andvalidity across a range of populati<strong>on</strong>s, including <strong>African</strong> Americans and other n<strong>on</strong>-Whites.The total score provides a good measure of g, the general factor of intelligence, at least withinthe U.S. (Jensen, 1980; Raven et al., 1998).The APM c<strong>on</strong>sists of two comp<strong>on</strong>ents, published in separate booklets. Set 1 c<strong>on</strong>sists of ashort set of 12 diagrammatic puzzles, each with a missing part that the test taker attempts toidentify from several opti<strong>on</strong>s. Set 1 calls for all the intellectual processes sampled <strong>on</strong> the fulltest. It is normally used for practice, to familiarize people with the test, and to allay anxiety. Inthis study, Set 1 with the correct answers was given to the students to take home 1 weekbefore the testing sessi<strong>on</strong> so they could practice and test themselves. Four m<strong>on</strong>ths earlier,these students had also been given the Raven’s Standard <strong>Progressive</strong> <strong>Matrices</strong> (Rusht<strong>on</strong> et al.,2002).Set II c<strong>on</strong>sists of 36 puzzles that are identical in presentati<strong>on</strong> with those in Set 1. However,they increase in difficulty more steadily and become c<strong>on</strong>siderably more complex. As theitems are arranged in inverse order to the frequency with which they are solved, the validityof the total score does not depend (as it does <strong>on</strong> the Standard versi<strong>on</strong>) up<strong>on</strong> every<strong>on</strong>eattempting all the items in the Set. To ensure sustained interest and freedom from fatigue,each problem is boldly presented, accurately drawn, and, as far as possible, pleasing to lookat.2.4. ProcedureThe Raven’s APM was administered without any time limits (up to 1 h), but was typicallycompleted within 30 min. Professor Skuy, <strong>on</strong>e of the authors of this study, and his colleagues,carried out the testing in a classroom. All students appeared well motivated. The instructi<strong>on</strong>srequested students to wait quietly at their desks if they finished before 30 min. After 30 min,however, they could come to the fr<strong>on</strong>t of the room, hand in their answer sheets and testbooklets, and receive payment.
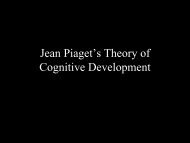
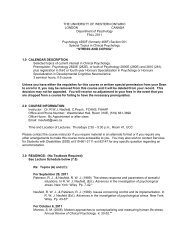
J.P. Rusht<strong>on</strong> et al. / Intelligence 31 (2003) 123–137 1293. Results3.1. Means, S.D., and c<strong>on</strong>struct validitiesAll calculati<strong>on</strong>s are based <strong>on</strong> raw scores, with each of the 36 items scored as 0 (incorrect)or 1 (correct). Internal c<strong>on</strong>sistencies based <strong>on</strong> Cr<strong>on</strong>bach’s a were .85 for the sample as aFig. 1. Percentage of <strong>African</strong> and White 17–23-year-old first-year engineering students attaining various scores <strong>on</strong>the Raven’s <strong>Advanced</strong> <strong>Progressive</strong> <strong>Matrices</strong> Test.
130J.P. Rusht<strong>on</strong> et al. / Intelligence 31 (2003) 123–137whole (n = 294), .82 for the <strong>African</strong>s (n = 187), .79 for the East Indians (n = 40), and .75 forthe Whites (n = 67). The 48 no-shows for the sec<strong>on</strong>d testing did not have significantlydifferent mean scores <strong>on</strong> the Standard <strong>Progressive</strong> <strong>Matrices</strong> than those who showed up forboth sessi<strong>on</strong>s.The <strong>African</strong>, East Indian, and White mean scores were, in order, 22, 25, and 29 out of 36(S.D. = 5.6, 4.9, 4.0; ranges = 5–36, 12–34, 18–35). Men averaged the same scores aswomen (unweighted means = 23.9, 22.9; S.D. = 5.5, 6.0; ranges = 5–36, 11–33). Analysis ofvariance (ANOVA) with race and sex as factors showed a significant main effect <strong>on</strong>ly forrace, with no effect for sex either as a main effect or an interacti<strong>on</strong>, F(2,294) = 28.51,P < .001; F(1,294) < 1.00; and F(2,294) < 1.00. For the total score, the <strong>African</strong>–Whitedifference was 1.54 S.D. (based <strong>on</strong> total S.D. of 5.92). Using the 1993 US norms for 18–22-year-olds, the <strong>African</strong>s fall at the 57th percentile, the East Indians at the 64th percentile,and the Whites at the 86th percentile, which yield IQ equivalents of 103, 106, and 117,respectively (Raven et al., 1998). Post-hoc tests showed that both the <strong>African</strong>–East Indianand East Indian–White means were significantly different from each other ( P < .05).Fig. 1 shows the percentage of <strong>African</strong>s and of Whites who attained various raw scores(with the intermediately scoring East Indian group being excluded for clarity). The <strong>African</strong>sshow an almost normal distributi<strong>on</strong> <strong>on</strong> this test, although the l<strong>on</strong>ger tail of low scores isvisible; the ceiling effect remains for the White group. There is no evidence of a bimodaldistributi<strong>on</strong> am<strong>on</strong>g the <strong>African</strong>s with a higher scoring group equal to the Whites, asc<strong>on</strong>jectured might be the case <strong>by</strong> Rusht<strong>on</strong> et al. (in press).4. Item analysesTable 1 shows the proporti<strong>on</strong> of each of the samples that selected the correct answer <strong>on</strong>each of the 36 items. For all groups, the test items increased in difficulty as the test progressed(mean r = .90, P < .001). The item difficulties, measured <strong>by</strong> the proporti<strong>on</strong> getting the correctTable 1Proporti<strong>on</strong> of sample selecting the correct answer <strong>on</strong> items of the <strong>Advanced</strong> <strong>Progressive</strong> <strong>Matrices</strong> <strong>by</strong> raceItem <strong>African</strong> Indian White Item <strong>African</strong> Indian White Item <strong>African</strong> Indian White1 .94 1.00 1.00 13 .68 .85 .93 25 .49 .50 .752 .89 .97 .99 14 .74 .85 .99 26 .45 .35 .603 .95 .97 .99 15 .81 .80 .90 27 .35 .40 .694 .90 .93 .94 16 .75 .75 .99 28 .27 .20 .515 .90 .87 .99 17 .72 .87 .88 29 .24 .15 .436 .92 1.00 .99 18 .53 .53 .75 30 .27 .38 .697 .90 .95 .99 19 .69 .62 .81 31 .28 .42 .528 .76 .90 .96 20 .65 .70 .78 32 .19 .28 .459 .90 1.00 1.00 21 .60 .75 .93 33 .32 .38 .5410 .71 .88 .96 22 .58 .60 .94 34 .30 .30 .5711 .84 .95 .97 23 .59 .70 .90 35 .32 .47 .6312 .80 .92 .99 24 .42 .45 .75 36 .09 .18 .28
J.P. Rusht<strong>on</strong> et al. / Intelligence 31 (2003) 123–137 131Table 2Item-total correlati<strong>on</strong>s for the <strong>Advanced</strong> <strong>Progressive</strong> <strong>Matrices</strong> <strong>by</strong> raceItem <strong>African</strong> Indian White Item <strong>African</strong> Indian White Item <strong>African</strong> Indian White1 .09 – – 13 .24 .11 .23 25 .50 .30 .382 .29 .09 .31 14 .53 .60 .18 26 .37 .46 .303 .29 .09 .09 15 .38 .21 .32 27 .45 .29 .394 .34 .01 .32 16 .54 .56 .24 28 .28 .31 .395 .15 .10 .09 17 .34 .41 .14 29 .24 .30 .466 .18 – .18 18 .36 .54 .38 30 .42 .35 .597 .47 .46 .24 19 .34 .54 .30 31 .22 .43 .448 .32 .23 .48 20 .29 .40 .13 32 .30 .49 .529 .46 – – 21 .56 .45 .45 33 .28 .46 .4810 .55 .58 .36 22 .46 .53 .32 34 .38 .47 .5011 .47 .35 .13 23 .56 .48 .19 35 .46 .56 .5312 .40 .34 .34 24 .38 .50 .48 36 .24 .19 .24Hyphen indicates that correlati<strong>on</strong> could not be computed because of lack of variance <strong>on</strong> item (see Table 1).answer (Table 1), were similar for <strong>African</strong>s, East Indians, and Whites (r’s > .90, P’s < .001).This suggests that the test measures the same c<strong>on</strong>struct in all three groups. However, even <strong>on</strong>this <strong>Advanced</strong> test, 55% of the items were too easy for these university students (as indicated<strong>by</strong> pass rates of 71% or more; 35% of the items had an optimal pass rate of between 30% and70%, which provides maximum discriminatory power; while 10% of the items were toodifficult, with a pass rate between 0% and 29%). Only <strong>on</strong>e item (item 36 for the <strong>African</strong>s) was‘‘extremely difficult’’ ( P < .10) for any of the groups.Another index for comparing items across groups is the item-total correlati<strong>on</strong> (r it )calculated using both the point-biserial (r pb ) (Table 2) and the biserial correlati<strong>on</strong>s (r b ) (Table3) of each item’s pass or fail status (0 or 1) with the total score <strong>on</strong> the test. These indicate theextent to which a particular item measures the same c<strong>on</strong>struct that is measured <strong>by</strong> the test as awhole, as well as how well the item discriminates am<strong>on</strong>g the testees within each group. SinceTable 3Biserial item-total correlati<strong>on</strong>s for the <strong>Advanced</strong> <strong>Progressive</strong> <strong>Matrices</strong> <strong>by</strong> raceItem <strong>African</strong> Indian White Item <strong>African</strong> Indian White Item <strong>African</strong> Indian White1 .18 – – 13 .32 .16 .43 25 .61 .37 .532 .47 .25 .93 14 .69 .92 .53 26 .49 .58 .393 .60 .25 .27 15 .55 .33 .51 27 .60 .32 .494 .60 .04 .64 16 .73 .78 .77 28 .39 .42 .455 .23 .16 .27 17 .47 .63 .24 29 .34 .48 .566 .32 – .53 18 .45 .69 .53 30 .54 .41 .767 .80 .98 .77 19 .43 .68 .41 31 .31 .55 .568 .42 .37 1.00 20 .40 .53 .16 32 .44 .66 .679 .80 – – 21 .68 .60 .83 33 .39 .59 .5010 .74 .89 .76 22 .57 .68 .64 34 .47 .62 .6211 .72 .71 .31 23 .73 .62 .32 35 .59 .69 .6612 .56 .62 1.03 24 .48 .64 .63 36 .42 .29 .27Hyphen indicates that correlati<strong>on</strong> could not be computed because of lack of variance <strong>on</strong> item (see Table 1).
132J.P. Rusht<strong>on</strong> et al. / Intelligence 31 (2003) 123–137the total score <strong>on</strong> the Raven’s is a very good measure of g, the general factor of intelligence(Jensen, 1980, pp. 645–648), the item-total correlati<strong>on</strong> is also an estimate of each item’s gloading. (The r b correlati<strong>on</strong> is used here to calculate item-total correlati<strong>on</strong>s in additi<strong>on</strong> to themore usual r pb because its formula c<strong>on</strong>tains within it a correcti<strong>on</strong> for item difficulty in theform of the ordinate, y, of the normal curve at the % pass/% fail cut-point. Since r pb lacks thiscorrecti<strong>on</strong>, it is possible that r pb c<strong>on</strong>founds g loading with item-difficulty level, thus, makingthe apparent Jensen Effects an artifact of item difficulty rather than a true reflecti<strong>on</strong> of g.)5. Differences in gTo test whether <strong>African</strong>–East Indian–White differences are more pr<strong>on</strong>ounced <strong>on</strong> the moreg loaded items, we followed the same procedure as in our previous studies (Rusht<strong>on</strong> & Skuy,2000; Rusht<strong>on</strong> et al., 2002), and correlated the item-total correlati<strong>on</strong>s from Tables 2 and 3 (theestimates of g), with the standardized differences between the ethnic groups in proporti<strong>on</strong>passing each item from Table 1 (the estimate of the race effect size). The results are set out inTable 4 using, in turn, the <strong>African</strong>, East Indian, and White point-biserial (r pb ) and biserial (r b )item-total correlati<strong>on</strong>s. The 36 Pears<strong>on</strong> r’s and Spearman r’s ranged from .08 to .64, with amean of .31 and a median of .26, with 22 of the 36 correlati<strong>on</strong>s being at least marginallysignificant ( P < .10). The <strong>African</strong>–White differences were <strong>on</strong> g regardless of whether g wascalculated from <strong>African</strong>, East Indian, or White point-biserial (r pb ) correlati<strong>on</strong>s (mean r = .48,mean r = .49, mean P’s < .01) or <strong>by</strong> <strong>African</strong>, East Indian, or White biserial (r b ) correlati<strong>on</strong>s(mean r = .38, mean r = .39, mean P’s < .05). (Note that it would have been incorrect to usethe item-total correlati<strong>on</strong>s from the combined samples because these would reflect thebetween-groups variance in additi<strong>on</strong> to the within-groups variance and so inflate the effect.)Table 4Point-biserial (r pb ) and biserial (r b ) item-total correlati<strong>on</strong>s ( g loadings) and differences in standardized <strong>African</strong>–Indian–White item pass rates <strong>on</strong> the Raven’s <strong>Progressive</strong> <strong>Matrices</strong>Item-total correlati<strong>on</strong>s<strong>African</strong> (n = 36) Indian (n = 33) White (n = 34)r pb r b r pb r b r pb r bPears<strong>on</strong> correlati<strong>on</strong>sIndian–White .509** .265 y .293 * .175 .198 .209<strong>African</strong>–Indian .212 .174 .254 y .278 y .196 .251 y<strong>African</strong>–White .637** .379* .469** .377* .334* .385*Spearman correlati<strong>on</strong>sIndian–White .538** .316* .324* .195 .212 .191<strong>African</strong>–Indian .165 .081 .162 .181 .213 .257 y<strong>African</strong>–White .640** .371* .499** .424** .339* .382** P < .05.** P < .01.P < .10.
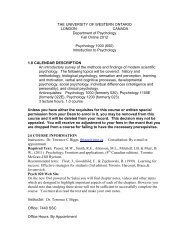
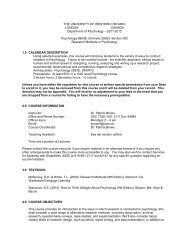
J.P. Rusht<strong>on</strong> et al. / Intelligence 31 (2003) 123–137 133Low reliabilities found for data at the item level likely depressed these Jensen Effects (as gfactor effects are called). Since in the Rusht<strong>on</strong> et al. (2002) study, aggregating both the itemtotalcorrelati<strong>on</strong>s (the measure of g) and the race effects enhanced the magnitude of the JensenEffect, aggregati<strong>on</strong> was employed here to offset the depressi<strong>on</strong> effect of low item reliability.Scores at the item level were averaged four at a time to make nine ‘‘subtests.’’ This procedureboosted the size of the Jensen Effects <strong>on</strong> the Black–White difference regardless of whethercalculated from <strong>African</strong>, Indian, or White point-biserial (r pb ) correlati<strong>on</strong>s (mean r = .55, meanr = .52, mean P’s < .10) or <strong>by</strong> <strong>African</strong>, Indian, or White biserial (r b ) correlati<strong>on</strong>s (meanr = .55, mean r = .52, mean P’s < .10).6. External validitiesExternal validities were established. For both the <strong>African</strong> and the n<strong>on</strong>-<strong>African</strong> students,scores <strong>on</strong> the <strong>Advanced</strong> <strong>Matrices</strong> predicted scores <strong>on</strong> the Standard <strong>Matrices</strong> measured 4m<strong>on</strong>ths earlier, with r = .60 for the 187 <strong>African</strong>s and r = .70 for the 107 n<strong>on</strong>-<strong>African</strong>s (.66 forthe 40 East Indians and .58 for the 67 Whites). Even more importantly, the <strong>Advanced</strong><strong>Matrices</strong> also predicted final end-of-year exam marks measured 4 m<strong>on</strong>ths later, with r = .34Fig. 2. Regressi<strong>on</strong> of Raven’s scores <strong>on</strong> university grades for <strong>African</strong>s and n<strong>on</strong>-<strong>African</strong>s.
134J.P. Rusht<strong>on</strong> et al. / Intelligence 31 (2003) 123–137for the <strong>African</strong>s and r = .28 for the n<strong>on</strong>-<strong>African</strong>s (.18 for the East Indians and .08 for theWhites, who had greater restricti<strong>on</strong> of range). Fig. 2 shows the regressi<strong>on</strong> of exam marks <strong>on</strong>test scores for the <strong>African</strong> and the n<strong>on</strong>-<strong>African</strong> university students (with the scores from thesmaller samples of East Indian and White students combined for clarity). Because the <strong>African</strong>and n<strong>on</strong>-<strong>African</strong> regressi<strong>on</strong> lines run almost completely parallel over the entire range ofscores, these results indicate that the tests are likely not biased against <strong>African</strong>s.7. Discussi<strong>on</strong>The <strong>African</strong> engineering students at the University of the Witwatersrand are the highestscoring <strong>African</strong> sample measured to date, solving an average of 22 out of the 36 problems <strong>on</strong>Set II of the APM. The East Indian and White students solved 25 and 29 out of 36, respectively.By the 1993 US norms, the <strong>African</strong> students were at the 57th percentile, the Indians at the64th, and the Whites at the 86th, yielding IQ equivalents of 103, 106, and 117, respectively.As expected, these scores are all higher than those obtained 4 m<strong>on</strong>ths earlier <strong>on</strong> theStandard <strong>Progressive</strong> <strong>Matrices</strong>, with the <strong>African</strong>s gaining the equivalent of six IQ points andthe n<strong>on</strong>-<strong>African</strong>s gaining five. These gains could be due to a combinati<strong>on</strong> of the removal ofthe ceiling effect, and to the practice effect of having taken the Standard <strong>Progressive</strong> <strong>Matrices</strong>4 m<strong>on</strong>ths earlier and Set I of the APM 1 week earlier. The <strong>African</strong>–White differenceamounted to 1.54 S.D. (based <strong>on</strong> the total sample S.D. of 5.92). There was no evidence of abimodal distributi<strong>on</strong> am<strong>on</strong>g the <strong>African</strong> students or of a higher scoring <strong>African</strong> group equal toWhites, as c<strong>on</strong>jectured might be the case <strong>by</strong> Rusht<strong>on</strong> et al. (2002).The c<strong>on</strong>struct validity of <strong>African</strong> IQ scores was c<strong>on</strong>firmed in this study. The inter-itemmatrices were the same for <strong>African</strong>s as for the n<strong>on</strong>-<strong>African</strong>s, with similar a coefficients, itemdifficulty levels, and g factor loadings. External validities were also established, with the<strong>African</strong> students’ APM scores predicting their scores <strong>on</strong> the Standard <strong>Progressive</strong> <strong>Matrices</strong>taken 4 m<strong>on</strong>ths earlier (r = .60) and their final end-of-year examinati<strong>on</strong> marks taken 4 m<strong>on</strong>thslater (r = .34). These results thus join those from earlier studies showing that mental abilitytest scores in <strong>African</strong>s do have predictive power (Kendall et al., 1988; Sternberg et al., 2001).The data from the present study c<strong>on</strong>firm that <strong>African</strong> university students range in IQ scorefrom 77 to 103. As university students in Africa likely score 1–2 S.D. above the generalaverage, their scores are c<strong>on</strong>sistent with the results of previous studies which found the meanIQ score of the <strong>African</strong> general populati<strong>on</strong> to be around 70 (Lynn & Vanhanen, 2002). Thepresent study also c<strong>on</strong>firms the findings that <strong>African</strong>–White differences reflect g rather thanculturally specific ways of thinking. The g effect is robust and implies that <strong>African</strong>–Whitedifferences are due to factors similar to those in other countries, such as the US and theNetherlands (Jensen, 1998; te Nijenhuis & van der Flier, 2001).Questi<strong>on</strong>s can be raised, however, about these c<strong>on</strong>clusi<strong>on</strong>s. One reviewer suggested thatpers<strong>on</strong>s with such low IQs could not complete law and medical school and then practice theseprofessi<strong>on</strong>s and suggested, therefore, that the low scores called into questi<strong>on</strong> the predictivevalidity of the tests. Two explanati<strong>on</strong>s for this c<strong>on</strong>undrum are possible. The first is that thelow <strong>African</strong> mean IQ score does represent the probable level of cognitive performance for the
136J.P. Rusht<strong>on</strong> et al. / Intelligence 31 (2003) 123–137ReferencesAvenant, T. J. (1988). The establishment of an individual intelligence scale for adult South <strong>African</strong>s. Report <strong>on</strong> anexploratory study c<strong>on</strong>ducted with WAIS-R <strong>on</strong> a sample of Blacks (Report No. P-91). Pretoria: South AfricaHuman Sciences Research Council.Educati<strong>on</strong>al Testing Service (1998). Graduate Record Examinati<strong>on</strong>s: guide to the use of scores. Princet<strong>on</strong>, NJ:Educati<strong>on</strong>al Testing Service.Fahrmeier, E. D. (1975). The effect of school attendance <strong>on</strong> intellectual development in Northern Nigeria. ChildDevelopment, 46, 281–285.Feuerstein, R. (1980). The dynamic assessment of retarded performers. Glenview, IL: Scott, Foresman.Glewwe, P., & Jaco<strong>by</strong>, H. (1992). Estimating the determinants of cognitive achievement in low-income countries:the case of Ghana. Washingt<strong>on</strong>, DC: World Bank.Gord<strong>on</strong>, R. A. (1997). Everyday life as an intelligence test: effects of intelligence and intelligence c<strong>on</strong>text.Intelligence, 24, 203–320.Gottfreds<strong>on</strong>, L. S. (1997). Why g matters: the complexity of everyday life. Intelligence, 24, 79–132.Grieve, K. W., & Viljoen, S. (2000). An exploratory study of the use of the Austin Maze in South Africa. South<strong>African</strong> Journal of Psychology, 30, 14–18.Jencks, C., & Phillips, M. (Eds.) (1998). The Black–White test score gap. Washingt<strong>on</strong>, DC: Brookings Instituti<strong>on</strong>Press.Jensen, A. R. (1980). Bias in mental testing. New York: Free Press.Jensen, A. R. (1998). The g factor. Westport, CT: Praeger.Kamin, L. (1995). Lies, damned lies, and statistics. In R. Jaco<strong>by</strong>, & N. Glauberman (Eds.), The bell curve: history,documents, opini<strong>on</strong>s (pp. 81–105). New York, NY: Random House.Kendall, I. M., Verster, M. A., & V<strong>on</strong> Mollendorf, J. W. (1988). Test performance of blacks in Southern Africa. InS. H. Irvine, & J. W. Berry (Eds.), Human abilities in cultural c<strong>on</strong>text (pp. 299–339). Cambridge, UK: CambridgeUniv. Press.Luria, A. R. (1979). The making of mind. Cambridge, MA: Harvard Univ. Press.Lynn, R., & Owen, K. (1994). Spearman’s hypothesis and test score differences between Whites, Indians, andBlacks in South Africa. Journal of General Psychology, 121, 27–36.Lynn, R., & Vanhanen, T. (2002). IQ and the wealth of nati<strong>on</strong>s. Westport, CT: Praeger.Neisser, U. (Ed.) (1998). The rising curve: l<strong>on</strong>g term gains in IQ and related measures. Washingt<strong>on</strong>, DC:American Psychological Associati<strong>on</strong>.Neisser, U., Boodoo, G., Bouchard Jr., T. J., Boykin, A. W., Brody, N., Ceci, S. J., Halpern, D., Loehlin, J. C.,Perloff, R., Sternberg, R. J., & Urbina, S. (1996). Intelligence: knowns and unknowns. American Psychologist,15, 77–101.Nell, V. (2000). Cross-cultural neuropsychological assessment: theory and practice. L<strong>on</strong>d<strong>on</strong>: Erlbaum.Owen, K. (1992). The suitability of Raven’s Standard <strong>Progressive</strong> <strong>Matrices</strong> for various groups in South Africa.Pers<strong>on</strong>ality and Individual Differences, 13, 149–159.Raven, J. (2000). The Raven’s <strong>Progressive</strong> <strong>Matrices</strong>: change and stability over culture and time. CognitivePsychology, 41, 1–48.Raven, J., Raven, J. C., & Court, J. H. (1998). Manual for Raven’s <strong>Advanced</strong> <strong>Progressive</strong> <strong>Matrices</strong> (1998 editi<strong>on</strong>).Oxford, England: Oxford Psychologists Press.Rusht<strong>on</strong>, J. P. (2001). Black–White differences <strong>on</strong> the g factor in South Africa: a ‘‘Jensen Effect’’ <strong>on</strong> the WechslerIntelligence Scale for Children—Revised. Pers<strong>on</strong>ality and Individual Differences, 31, 1227–1232.Rusht<strong>on</strong>, J. P. (2002). Jensen Effects and <strong>African</strong>/Colored/Indian/White differences <strong>on</strong> Raven’s Standard <strong>Progressive</strong><strong>Matrices</strong> in South Africa. Pers<strong>on</strong>ality and Individual Differences, 33, 65–70.Rusht<strong>on</strong>, J. P., & Jensen, A. R. (in press). <strong>African</strong>–White IQ differences from Zimbabwe <strong>on</strong> the WechslerIntelligence Scale for Children—Revised are mainly <strong>on</strong> the g factor. Pers<strong>on</strong>ality and Individual Differences.Rusht<strong>on</strong>, J. P., & Skuy, M. (2000). <str<strong>on</strong>g>Performance</str<strong>on</strong>g> <strong>on</strong> Raven’s <strong>Matrices</strong> <strong>by</strong> <strong>African</strong> and White university students inSouth Africa. Intelligence, 28, 251–265.
J.P. Rusht<strong>on</strong> et al. / Intelligence 31 (2003) 123–137 137Rusht<strong>on</strong>, J. P., Skuy, M., & Fridjh<strong>on</strong>, P. (2002). Jensen Effects am<strong>on</strong>g <strong>African</strong>, Indian, and White engineeringstudents in South Africa <strong>on</strong> Raven’s Standard <strong>Progressive</strong> <strong>Matrices</strong>. Intelligence, 30, 409–423.Skuy, M., Gewer, A., Osrin, Y., Khunou, D., Fridjh<strong>on</strong>, P., & Rusht<strong>on</strong>, J. P. (2002). Effects of mediated learningexperience <strong>on</strong> Raven’s <strong>Matrices</strong> scores of <strong>African</strong> and n<strong>on</strong>-<strong>African</strong> university students in South Africa.Intelligence, 30, 221–232.Skuy, M., Hoffenberg, S., Visser, L., & Fridjh<strong>on</strong>, P. (1990). Temperament and cognitive modifiability of academicallysuperior black adolescents in South Africa. Internati<strong>on</strong>al Journal of Disability, Development, andEducati<strong>on</strong>, 37, 29–44.Skuy, M., Schutte, E., Fridjh<strong>on</strong>, P., & O’Carroll, S. (2001). Suitability of published neuropsychological test normsfor urban <strong>African</strong> sec<strong>on</strong>dary school students in South Africa. Pers<strong>on</strong>ality and Individual Differences, 30,1413–1425.Skuy, M., & Shmukler, D. (1987). Effectiveness of the learning potential assessment device with Indian andColored adolescents in South Africa. Internati<strong>on</strong>al Journal of Special Educati<strong>on</strong>, 12, 131–149.Spearman, C. (1927). The abilities of man: their nature and measurement. New York: Macmillan.Sternberg, R. J., Grigorenko, E. L., Ngorosho, D., Tantufuye, E., Mbise, A., Nokes, C., Jukes, M., & Bundy, D. A.(2002). Assessing intellectual potential in rural Tanzanian school children. Intelligence, 30, 141–162.Sternberg, R. J., Nokes, C., Geissler, P. W., Prince, R., Okatcha, F., Bundy, D. A., & Grigorenko, E. L. (2001). Therelati<strong>on</strong>ship between academic and practical intelligence: a case study in Kenya. Intelligence, 29, 401–418.te Nijenhuis, J., & van der Flier, H. (2001). Group differences in mean intelligence for the Dutch and Third Worldimmigrants. Journal of Biosocial Science, 33, 469–475.Vern<strong>on</strong>, P. A. (1983). Speed of informati<strong>on</strong>-processing and general intelligence. Intelligence, 7, 53–70.Wigdor, A. K., & Garner, W. R. (Eds.) (1982). Ability testing: uses, c<strong>on</strong>sequences, and c<strong>on</strong>troversies: Part 1.Report of the Committee, Part 2. Documentati<strong>on</strong> secti<strong>on</strong>. Washingt<strong>on</strong>, DC: Nati<strong>on</strong>al Academy Press.Zaaiman, H., van der Flier, H., & Thijs, G. D. (2001). Dynamic testing in selecti<strong>on</strong> for an educati<strong>on</strong>al programme:assessing South <strong>African</strong> performance <strong>on</strong> the Raven <strong>Progressive</strong> <strong>Matrices</strong>. Internati<strong>on</strong>al Journal of Selecti<strong>on</strong>and Assessment, 9, 258–269.Zindi, F. (1994). Differences in performance. Psychologist, 7, 549–552.