Cross-National Variation in Violent Crime Rates - Psychology ...
Cross-National Variation in Violent Crime Rates - Psychology ...
Cross-National Variation in Violent Crime Rates - Psychology ...
Create successful ePaper yourself
Turn your PDF publications into a flip-book with our unique Google optimized e-Paper software.
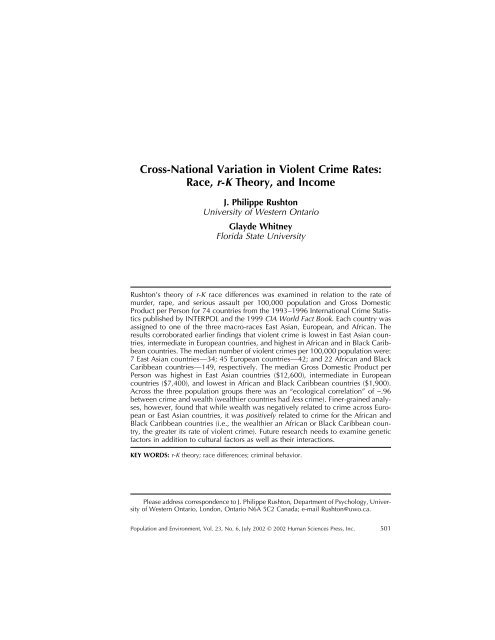
<strong>Cross</strong>-<strong>National</strong> <strong>Variation</strong> <strong>in</strong> <strong>Violent</strong> <strong>Crime</strong> <strong>Rates</strong>:Race, r-K Theory, and IncomeJ. Philippe RushtonUniversity of Western OntarioGlayde WhitneyFlorida State UniversityRushton’s theory of r-K race differences was exam<strong>in</strong>ed <strong>in</strong> relation to the rate ofmurder, rape, and serious assault per 100,000 population and Gross DomesticProduct per Person for 74 countries from the 1993–1996 International <strong>Crime</strong> Statisticspublished by INTERPOL and the 1999 CIA World Fact Book. Each country wasassigned to one of the three macro-races East Asian, European, and African. Theresults corroborated earlier f<strong>in</strong>d<strong>in</strong>gs that violent crime is lowest <strong>in</strong> East Asian countries,<strong>in</strong>termediate <strong>in</strong> European countries, and highest <strong>in</strong> African and <strong>in</strong> Black Caribbeancountries. The median number of violent crimes per 100,000 population were:7 East Asian countries—34; 45 European countries—42; and 22 African and BlackCaribbean countries—149, respectively. The median Gross Domestic Product perPerson was highest <strong>in</strong> East Asian countries ($12,600), <strong>in</strong>termediate <strong>in</strong> Europeancountries ($7,400), and lowest <strong>in</strong> African and Black Caribbean countries ($1,900).Across the three population groups there was an “ecological correlation” of −.96between crime and wealth (wealthier countries had less crime). F<strong>in</strong>er-gra<strong>in</strong>ed analyses,however, found that while wealth was negatively related to crime across Europeanor East Asian countries, it was positively related to crime for the African andBlack Caribbean countries (i.e., the wealthier an African or Black Caribbean country,the greater its rate of violent crime). Future research needs to exam<strong>in</strong>e geneticfactors <strong>in</strong> addition to cultural factors as well as their <strong>in</strong>teractions.KEY WORDS: r-K theory; race differences; crim<strong>in</strong>al behavior.Please address correspondence to J. Philippe Rushton, Department of <strong>Psychology</strong>, Universityof Western Ontario, London, Ontario N6A 5C2 Canada; e-mail Rushton@uwo.ca.Population and Environment, Vol. 23, No. 6, July 2002 © 2002 Human Sciences Press, Inc. 501
502POPULATION AND ENVIRONMENTJ. P. Rushton (2000) has proposed an evolutionary life-history theoryto account for racial differences <strong>in</strong> a host of demographic, populational,and environmental variables. The theory proposes a gene-based Negroid-Caucasoid-Mongoloid gradient of r/K reproductive strategies. Drawn fromsociobiology (Wilson, 1975), the r-K cont<strong>in</strong>uum def<strong>in</strong>es a genetically-coord<strong>in</strong>atedgroup of traits that evolved together to meet the trials of life—survival,growth, and reproduction. At one end of this scale, r-strategies arecharacterized by high fertility, low-<strong>in</strong>vestment parent<strong>in</strong>g, fast maturation,and low <strong>in</strong>telligence and learn<strong>in</strong>g ability. K-strategies, on the other hand,are characterized by low fertility, high-<strong>in</strong>vestment parent<strong>in</strong>g, slow maturation,and high <strong>in</strong>telligence and competitive ability. Typically, the K-strategyrequires more complex nervous systems and bigger bra<strong>in</strong>s. It has been hypothesizedthat r-selected species are more adapted to non-competitive environmentsof resource abundance whereas K-selected species are adaptedto more competitive environments of resource scarcity. Because the componentsof life-history (differential fertility, rates of maturation, sexual behavior,and parent<strong>in</strong>g) are critical determ<strong>in</strong>ants of demography, r/K theorycould have important implications for understand<strong>in</strong>g human variation.Rushton extended r/K theory to human race differences and found itpredicts a wide spectrum of characteristics <strong>in</strong>clud<strong>in</strong>g fertility, <strong>in</strong>fant mortality,rates of physical maturation, IQ scores, bra<strong>in</strong> size, dizygotic tw<strong>in</strong>n<strong>in</strong>g,crime, sexual potency, sexual precocity, number of sexual partners, andhormone levels. Mongoloids tend toward the K end of the r-K gradient. Onaverage, they devote resources to produc<strong>in</strong>g fewer children, <strong>in</strong>vest moreheavily <strong>in</strong> them, and provide them with greater parental care. Negroids, onaverage, lie more toward the r end of the gradient. They tend to devoteresources to produc<strong>in</strong>g greater numbers of children, <strong>in</strong>vest less heavily <strong>in</strong>them, and provide less parental care. Caucasoids tend toward be<strong>in</strong>g <strong>in</strong>termediate,though closer on the r-K gradient to Mongoloids than to Negroids.One test of Rushton’s gene-based theory is whether the racial differences<strong>in</strong> British, Canadian, and U.S. crime statistics are generalizable <strong>in</strong>ternationally(Neapolitan, 1998; Rushton, 1990, 1995; Lynn, 2002b). Do EastAsian populations from Ch<strong>in</strong>a, Japan, Korea, and Vietnam (sometimescalled Orientals, or more technically, Mongoloids) generally average lowerrates of violent crime (e.g., murder, rape, and serious assault) than do Europeanpopulations (Whites, Caucasoids)? In turn, do Europeans and theirdescendants generally average lower rates of violent crime than Africansand their descendants (Blacks, Negroids)? The answers may shed light onthe extent to which observed racial differences are the result of local conditionswith<strong>in</strong> Brita<strong>in</strong>, Canada, and the United States (e.g., anti-Black racism;selective migration from Pacific Rim countries) versus conditions endemic
503J. PHILIPPE RUSHTON AND GLAYDE WHITNEYto the populations (e.g., cultural values, family structures, genetic and biologicalfactors).<strong>Crime</strong> statistics with<strong>in</strong> Brita<strong>in</strong>, Canada, and the United States showthat people of East Asian ancestry are disproportionately under-representedwhile those of African ancestry are disproportionately over-represented relativeto those of European ancestry. For example, <strong>in</strong> Canada, a governmentcommission found that Blacks were five times more likely to be <strong>in</strong> jail thanWhites and ten times more likely than Asians (Ontario, 1996). In Brita<strong>in</strong>,the Home Office (1999) found that Blacks, who were 2% of the generalpopulation, made up 15% of the prison population. (No figures were reportedfor East Asians such as the Ch<strong>in</strong>ese, but Asians from the Indian subcont<strong>in</strong>entwere 3% of the general population and 2% of the prison population.)In the U.S., Wilson and Herrnste<strong>in</strong> (1985) and Taylor and Whitney(1999) analyzed the FBI Uniform <strong>Crime</strong> Statistics and <strong>National</strong> <strong>Crime</strong> VictimizationSurveys from the U.S. Department of Justice (e.g., 1997, 1998)and found that s<strong>in</strong>ce record keep<strong>in</strong>g began at the turn of the century, andthroughout the 1960s, 1970s, 1980s, and 1990s, African Americans consistentlycommitted proportionately more violent crime than did EuropeanAmericans, while Asian Americans consistently committed proportionatelyfewer. Victim surveys tell a similar story. The proportional differences <strong>in</strong>arrest statistics cannot therefore be attributed to police prejudice.F<strong>in</strong>er gra<strong>in</strong>ed analyses with<strong>in</strong> the United States also f<strong>in</strong>d race a factor.Whitney (1995) found that the best predictor of local murder rate is thepercent of the population that is African American. Across 170 cities, Whitney(1995) found a correlation of r = 0.69 between the rate of murder andthe percent of the population that was African American. Similarly, acrossthe 50 states, Whitney (1995) found a correlation of r = 0.77 between therate of murder and the percent African American. In a follow-up study,Hama (1999) found a correlation of r = 0.76 across the 50 states betweenviolent crime (an aggregate of murder, non-negligent manslaughter, rape,robbery, and aggravated assault), and the percentage of the population thatwas African American.Lynn (2002a, 2002b) has exam<strong>in</strong>ed the application of Rushton’s r-Ktheory to racial differences <strong>in</strong> sexual behavior and psychopathic personality.Thus, Lynn (2002a) analyzed the annual surveys of the <strong>National</strong> Op<strong>in</strong>ionResearch Center for 1990–1996 and found that, compared to Whites,Blacks reported more sexual partners and a greater frequency of sexual<strong>in</strong>tercourse. Similarly, Lynn (2002b) reviewed the literature on psychopathyand found that East Asians averaged the lowest rate, Blacks highest, andWhites <strong>in</strong>termediate. The attributes <strong>in</strong>cluded: be<strong>in</strong>g diagnosed with childhoodconduct disorder or Attention Deficit Hyperactivity Disorder (ADHD),
504POPULATION AND ENVIRONMENTbe<strong>in</strong>g suspended or excluded from school, scor<strong>in</strong>g low on tests of moralunderstand<strong>in</strong>g, fail<strong>in</strong>g to live up to f<strong>in</strong>ancial obligations such as pay<strong>in</strong>gback student loans, poor work commitment, recklessness (e.g., hav<strong>in</strong>g trafficaccidents), ma<strong>in</strong>ta<strong>in</strong><strong>in</strong>g monogamous relationships, be<strong>in</strong>g responsibleparents, engag<strong>in</strong>g <strong>in</strong> domestic violence, and need<strong>in</strong>g hospitalization for <strong>in</strong>juriessusta<strong>in</strong>ed through altercations.Two fundamentally different models have been put forth to expla<strong>in</strong>why the races differ <strong>in</strong> average rate of crime and other socially valued outcomes:(1) the “discrim<strong>in</strong>ation” model, and (2) the “distributional” model(Herrnste<strong>in</strong>, 1990). The discrim<strong>in</strong>ation model focuses on social and <strong>in</strong>stitutionalpractices that discrim<strong>in</strong>ate aga<strong>in</strong>st members of one group (or favormembers of another), thus tilt<strong>in</strong>g the “play<strong>in</strong>g field.” The crucial assumptionof this model is that <strong>in</strong> the absence of such discrim<strong>in</strong>ation, crime rateswould be about equal for all populations. Factors hypothesized under thismodel <strong>in</strong>clude relative poverty, anti-Black bias by police, a lack of accessto legitimate channels of upward mobility, and <strong>in</strong>adequate family socializationdue to the legacy of slavery. On the other end of the model, crim<strong>in</strong>ologistsas early as the 1920s expla<strong>in</strong>ed the under-representation of East Asians<strong>in</strong> U.S. crime statistics by hypothesiz<strong>in</strong>g the East Asian “ghetto.” This“ghetto” was seen as a response to external prejudice that protected membersfrom the disruptive tendencies of the outside society. It was also claimedthat bias aga<strong>in</strong>st East Asian migration (“yellow peril”) resulted <strong>in</strong> only thewealthiest or hardest-work<strong>in</strong>g East Asians ga<strong>in</strong><strong>in</strong>g entry <strong>in</strong>to White-majoritycountries.The alternative distributional model expla<strong>in</strong>s the overlapp<strong>in</strong>g of thepopulations and their differ<strong>in</strong>g averages <strong>in</strong> terms of differential populationcharacteristics—for example, Rushton’s (2000) r-K life-history theory, orSowell’s (1994) theory of socialization through subtle cultural traditions.Other factors hypothesized to underlie the distribution model <strong>in</strong>clude deeprootedcultural values and family structures endemic to populations, as wellas biological variables <strong>in</strong>clud<strong>in</strong>g body type, percent of age of cohort, hormonallevels, exposure to toxic chemicals such as lead which may havedifferent effects based on constitutional differences <strong>in</strong> metabolism, and personalityand temperament. Thus accord<strong>in</strong>g to the distributional model, thepopulation differences are expected to occur more universally. The twomodels may each be partially correct (Ellis & Walsh, 1999).To test whether the race differences <strong>in</strong> crime found with<strong>in</strong> Brita<strong>in</strong>, Canada,and the U.S. occurred more universally, Wilson and Herrnste<strong>in</strong> (1985)and Rushton (1990, 1995) collated data from INTERPOL Yearbooks (1980to 1990) and found that Pacific Rim countries reported less violent crime(an aggregate of murder, rape, and serious assault) than did European coun-
505J. PHILIPPE RUSHTON AND GLAYDE WHITNEYtries and much less than did African and Caribbean countries. Summ<strong>in</strong>g thecrimes, and averag<strong>in</strong>g across years, Rushton (1990, 1995) found statisticallysignificant differences per 100,000 population of: 44 (Pacific Rim), 74 (European),and 143 (Afro-Caribbean) total crimes, respectively. These resultsdid not depend on the selection of countries because when only ethnicallymore homogeneous sets were chosen, for example, by limit<strong>in</strong>g countriesto those from northeast Asia, central Europe, and sub-Saharan Africa, theproportionate differences rema<strong>in</strong>ed the same—or became even greater.Nor did the pattern alter for other sets of countries. For example, <strong>in</strong> theCaribbean data set, six ma<strong>in</strong>ly White/Amer<strong>in</strong>dian countries averaged 72per 100,000 whereas eight ma<strong>in</strong>ly Black countries averaged 449 violentcrimes per 100,000 population (Rushton, 1995).These results have been contested. The ma<strong>in</strong> reasons given for reject<strong>in</strong>gthem have been that: (1) the category of race is too poorly def<strong>in</strong>ed toallow reliable classification, (2) the source books conta<strong>in</strong> too many errorsto be reliable or representative, and (3) the results do not always occur <strong>in</strong>the predicted direction (Gabor & Roberts, 1990; Neapolitan, 1998; Roberts& Gabor, 1990; Yee et al., 1993). In short, questions have been raisedabout the reliability of the data.A recent critique of Rushton’s work by Neapolitan (1998), for example,exam<strong>in</strong>ed the s<strong>in</strong>gle crime of homicide, across 118 countries (with manyLat<strong>in</strong> American countries all questionably assigned as “White”), while controll<strong>in</strong>gfor other, ma<strong>in</strong>ly socio-economic variables. Neapolitan found raceexpla<strong>in</strong>ed “a small amount of the variance <strong>in</strong> homicides” (p. 145) and thatalthough “the association of the black variable [<strong>in</strong> a regression analysis] isstatistically significant,” it failed to rema<strong>in</strong> so after controll<strong>in</strong>g for “EthnicHeterogeneity,” “Income Inequality,” “GNP per Person (log),” “MeanHousehold Size,” “Percent Urban,” and “Percent Young.”Neapolitan’s (1998) critique of Rushton’s work requires a reply. To thelimited extent that Neapolitan strives to expla<strong>in</strong> the differences he observes,he roots himself <strong>in</strong> the discrim<strong>in</strong>ation model. In his words, what is neededis “more research address<strong>in</strong>g justice, particularly racial justice” (p. 148). Heignores the distributional model and holds that race cannot be primary becauseit is only a “political construction result<strong>in</strong>g from social conflict” (p.149). This position obscures more than it clarifies for his analyses confoundthe facts need<strong>in</strong>g to be expla<strong>in</strong>ed with explanations of those facts. For example,the social variables that Neapolitan used to make the higher homicide<strong>in</strong> African countries “disappear” have themselves been expla<strong>in</strong>ed <strong>in</strong>terms of race-correlated genes for <strong>in</strong>telligence (lead<strong>in</strong>g to low <strong>in</strong>come;Herrnste<strong>in</strong> & Murray, 1994; Rushton, 2000).A fundamental rule of science is that explanations must be based on
506POPULATION AND ENVIRONMENTthe “totality of evidence.” In this paper we use the 1993 to 1996 INTERPOLYearbooks for homicide, rape, and serious assault to exam<strong>in</strong>e whether raceis a more universal predictor variable. We also exam<strong>in</strong>e the role of GrossDomestic Product per Person on these variables both across and with<strong>in</strong>ethnicities. If cross-nationally race is predictive of rape as well as homicideand serious assault, it places the hypothesis on firmer scientific ground.Moreover, although a case can be made that poverty leads men to commitmurder and serious assault, the logic becomes weaker when extended todifferences <strong>in</strong> committ<strong>in</strong>g rape.METHODThe International <strong>Crime</strong> Statistics for 1993–1996 collated and publishedby INTERPOL were exam<strong>in</strong>ed. The 1996 Yearbook provided data for14 categories of crime <strong>in</strong> 116 countries. For clarity of test<strong>in</strong>g our hypothesis,we followed previous research (Wilson & Herrnste<strong>in</strong>, 1985; Rushton, 1990,1995) and w<strong>in</strong>nowed the data to 3 crimes <strong>in</strong> 74 countries. The number ofcrimes was reduced because the figures for some crimes are highly dependenton a particular country’s laws, <strong>in</strong>come levels, or mores (e.g., “Sexoffences”) or on the availability of goods to be stolen (e.g., “Theft of MotorCars”). Thus, we focused on the three most serious and unambiguouscrimes, which are given def<strong>in</strong>itional limits <strong>in</strong> the preface to the INTERPOLYearbooks: Murder, “Any act performed with the purpose of tak<strong>in</strong>g humanlife, <strong>in</strong> whatever circumstance. This def<strong>in</strong>ition excludes abortion but <strong>in</strong>cludes<strong>in</strong>fanticide;” Rape, (separate from other “Sex offences”); and Seriousassault, “An <strong>in</strong>jury whereby life could be endangered, <strong>in</strong>clud<strong>in</strong>g cases of<strong>in</strong>jury <strong>in</strong>volv<strong>in</strong>g the use of a dangerous <strong>in</strong>strument. Cases where <strong>in</strong>strumentsare used merely to threaten people without caus<strong>in</strong>g <strong>in</strong>jury are to beexcluded” (INTERPOL, 1996, front matter).We consulted the CIA World Fact Book for 1999 for two values: (1)“Ethnic Groups,” the percentage of various races <strong>in</strong> a country; and (2) GrossDomestic Product (GDP) per Person. In order for a country to be <strong>in</strong>cluded,all 5 categories of <strong>in</strong>formation had to be available for at least one report<strong>in</strong>gyear. Data from racially mixed countries (e.g., Brazil, U.S.A.) can be epidemiologicallymislead<strong>in</strong>g and difficult to <strong>in</strong>terpret <strong>in</strong> trans-national comparisonsso we <strong>in</strong>cluded only countries where 90% or more of their populationis from one of the three geographic population groups of East Asian, European,or African. Rwanda was also excluded because of the anomalouslyhigh rate of homicide result<strong>in</strong>g from the civil war that occurred dur<strong>in</strong>g the
507J. PHILIPPE RUSHTON AND GLAYDE WHITNEYperiod analyzed. Altogether, complete data were available for 74 countries:7 East Asian, 45 European, and 22 African.RESULTSThe means, medians, and standard deviations for the three racial groupsfor each of the three types of crime, their sum, and the Gross DomesticProduct per Person, are shown <strong>in</strong> Table 1. As can be seen, for all four crimecategories, the East Asian and European countries averaged about one-thirdthe rates of African and Black Caribbean countries. Moreover, the predictedEast Asian < European differences also generally occurred (for serious assaultsthis was reversed but the SDs were very large <strong>in</strong> this category, especiallyfor Asian countries, and us<strong>in</strong>g the median, rather than the mean,aga<strong>in</strong> resulted <strong>in</strong> concordance with previous studies). For 7 East Asian, 45European, and 22 African and Black Caribbean countries, the medians per100,000 population were, respectively: Murder—1.6, 4.2, and 7.9; Rape—2.8, 4.5, and 5.5; and Serious Assault—31.0, 33.7, and 135.6. Summ<strong>in</strong>gthe medians resulted <strong>in</strong> a total of violent crimes per 100,000 of population:East Asians, 35; Europeans, 42; and Africans or Black Caribbeans, 149.With each country taken as an <strong>in</strong>dependent entry, the results of onewayanalyses of variance showed significant differences among the populations<strong>in</strong> each of the crime categories (Murder, F 2,71 = 4.52, p < 0.01; Rape,F 2,71 = 9.22, p < 0.001; Serious assault, F 2,71 = 10.45, p < 0.001; Sum of allthree crimes, F 2,71 = 10.11, p < 0.001). Some might question the applicationof parametric analyses to these ratio figures. However, the exact probabilityof gett<strong>in</strong>g this particular median rank<strong>in</strong>g three times <strong>in</strong> a row is 1/6 × 1/6 ×1/6 = 0.01.To exam<strong>in</strong>e the SES/wealth correlates of crime, we used each country’smedian Gross Domestic Product (GDP) per Person. It was highest <strong>in</strong> EastAsian countries ($12,600), <strong>in</strong>termediate <strong>in</strong> European countries ($7,400),and lowest <strong>in</strong> African and Black Caribbean countries ($1,900). Follow<strong>in</strong>gthe prescriptive advice of Lub<strong>in</strong>ski and Humphreys (1996) to correlate groupmeans when predict<strong>in</strong>g the behavior or status of groups, and the exampleof Jensen (1998, pp. 442–443) who found an “ecological correlation” of0.998 across the three racial groups between bra<strong>in</strong> size and IQ scores, wecalculated a similar correlation of −0.96 between crime and wealth acrossthe three major geographic races (wealthier races had less crime). Calculat<strong>in</strong>gthe correlations between GDP and crime across all 76 countries foundthe association to be weaker but still significant, aga<strong>in</strong> show<strong>in</strong>g the wealthierthe country, the less the crime. More perplex<strong>in</strong>g, however, is the f<strong>in</strong>d<strong>in</strong>g
508POPULATION AND ENVIRONMENTTABLE 1Mean and Median <strong>Rates</strong> of <strong>Crime</strong> per 100,000 People and Gross Domestic Productper Person for Three Macro-PopulationsEast Asian (n = 7) European (n = 45) African (n = 22)Mean SD Median Mean SD Median Mean SD MedianMurder 3.90 5.90 1.56 5.65 4.85 4.16 13.48 17.89 7.89Rape 5.00 5.50 2.80 5.18 4.12 4.48 20.05 23.95 5.51Serious assault 83.05 114.78 31.04 68.90 76.08 33.72 233.59 235.12 135.55All crimes comb<strong>in</strong>ed 91.95 115.31 34.40 79.73 76.08 43.36 267.12 264.48 148.95GDP 12,060 9,844 12,600 10,823 8,548 7,400 2,683 2,011 1,900Note: 7 East Asian countries = Ch<strong>in</strong>a, Hong Kong, Japan, Korea, Macao, Mongolia, Vietnam; 45 European countries = Armenia, Austria, Azerbaijan,Bulgaria, Chile, Croatia, Cyprus, Czech, Denmark, Estonia, F<strong>in</strong>land, France, Georgia, Germany, Greece, Hungary, Ireland, Israel,Jordan, Kuwait, Latvia, Lebanon, Luxembourg, Macedonia, Malta, Netherlands, Norway, Poland, Portugal, Romania, Saudi Arabia, Slovak,Slovenia, Spa<strong>in</strong>, Sweden, Switzerland, Syria, Turkey, Ukra<strong>in</strong>e, Uzbekistan, Tunisia, Belarus, Kazajstan, Lithuania, Moldova; 22 African or BlackCaribbean countries = Angola, Ben<strong>in</strong>, Botswana, Burk<strong>in</strong>a Faso, Cameroon, Ivory Coast, Dom<strong>in</strong>ica, Ethiopia, Gabon, Gambia, Ghana, Grenada,Jamaica, Kenya, Namibia, St. Kitts and Nevis, Swaziland, Tanzania, Turks & Caicos, Uganda, Zambia, Zimbabwe.
509J. PHILIPPE RUSHTON AND GLAYDE WHITNEYthat the correlations with the GDP are positive for the 22 African and BlackCaribbean countries (Murder, r = 0.33, ns; Rape, r = 0.65, p < 0.05; andSerious assault, r = 0.63, p < 0.01), suggest<strong>in</strong>g that <strong>in</strong> those regions andamong those populations, it is the wealthier, more urbanized countries thathave the most social disruption.DISCUSSIONThese results first corroborate predictions from Rushton’s r-K theory ofracial differences that Blacks average higher rates of violent crime thando Whites and East Asians and then extend the earlier trans-national data(Wilson & Herrnste<strong>in</strong>, 1985; Rushton, 1990, 1995), which found that peopleof East Asian descent commit relatively fewer acts of violent crime thando those of European or African descent. Present results show that the populationpatterns <strong>in</strong> crime found with<strong>in</strong> Brita<strong>in</strong>, Canada, and the UnitedStates are more generalizable than is often supposed. This implies that someof the causes of race differences must be sought beyond the local conditionsof particular countries or even groups of countries.Several qualifications need to be stated. First, the racial group<strong>in</strong>gs donot represent “pure types.” Although we omitted countries with very mixedpopulations (e.g., Brazil, U.S.A.), enormous ethnic variation exists with<strong>in</strong>all countries. Second, each country differs <strong>in</strong> the procedures used to collectand dissem<strong>in</strong>ate the figures on crime. Third, great variability exists <strong>in</strong> thesefigures with<strong>in</strong> each group<strong>in</strong>g. Ben<strong>in</strong>, for example, a West African country,reported a relatively low crime rate, with 3.7 homicides, 1.0 rapes, and17.4 serious assaults per 100,000 people. Macao, <strong>in</strong> East Asia, reportedhigher rates <strong>in</strong> each of these categories, 4.6, 2.8, and 83.0, respectively.Nonetheless, despite substantial overlap, the mean population differenceswere as predicted from previous research.These data speak to one of the most important issues fac<strong>in</strong>g the fieldof crim<strong>in</strong>ology <strong>in</strong> show<strong>in</strong>g there are significant differences <strong>in</strong> murder, rape,and serious assaults <strong>in</strong> East Asian, European, and African countries thatparallel those found with<strong>in</strong> Brita<strong>in</strong>, Canada, and the United States. Moreover,the crime differences cannot simply be attributed to “poverty” forsuch an explanation does not fit the f<strong>in</strong>er-gra<strong>in</strong>ed analyses found with<strong>in</strong>African countries where violent crime <strong>in</strong>creased with GDP. This could bebecause only wealthier nations have the <strong>in</strong>frastructure to gather and reportcrime statistics comparable to those for East Asia and Europe. It is alsopossible that there are some gene-culture <strong>in</strong>teractions when opportunitiesbecome available for engag<strong>in</strong>g <strong>in</strong> behavior not otherwise affordable. In Af-
510POPULATION AND ENVIRONMENTrica, for example, there is a l<strong>in</strong>k between wealth and AIDS: wealthier malesturn their resources <strong>in</strong>to sexual partners (Rushton & Bogaert, 1989).Lynn (2002a; 2002b) recently noted the relation between race differences<strong>in</strong> sexual behavior and psychopathic personality and Rushton’s r-Ktheory. He therefore called for a paradigm shift <strong>in</strong> the analysis of a numberof population and environment issues. Most notably, while HIV/AIDS is aserious public health problem for all racial groups, it is especially so forAfricans and people of African descent (currently almost 9 out of every 100Africans are <strong>in</strong>fected with HIV/AIDS; the rate is 2.2% <strong>in</strong> the Black Caribbean;<strong>in</strong> the U.S. about 2% of African Americans are liv<strong>in</strong>g with HIV/AIDScompared to 0.4% of European Americans and less than 0.1% of East AsianAmericans (UNAIDS/WHO, 2001). S<strong>in</strong>ce there is little cultural contact betweenthe various African descended populations, the explanation is mostlikely a genetic one.Taken together, these results support the distributional model ratherthan the discrim<strong>in</strong>ation model of why the races differ <strong>in</strong> average rate ofcrime and other socially valued outcomes. However, we do not suggestthat racial differences are 100% genetic, but rather that they are due togenes, cultures, and their <strong>in</strong>teractions. Genetic factors <strong>in</strong>volve bra<strong>in</strong> sizeand <strong>in</strong>telligence (Jensen, 1998; Rushton & Ankney, 2000), and hormonelevels like testosterone (Ellis & Nyborg, 1992). Cultural factors <strong>in</strong>volve socializationpractices, <strong>in</strong>clud<strong>in</strong>g of deep-rooted values transmitted by families(Sowell, 1994). The precise paths by which racial factors have theireffects are complex and need to be explicated <strong>in</strong> detail.REFERENCESCernovsky, Z. Z. & Litman, L. C. (1993). Re-analyzes of J. P. Rushton’s crime data. CanadianJournal of Crim<strong>in</strong>ology, 35, 31–36.CIA (1999). World Fact Book. Wash<strong>in</strong>gton, DC: U.S. Government Pr<strong>in</strong>t<strong>in</strong>g Office.Ellis, L., & Nyborg, H. (1992). Racial/ethnic variations <strong>in</strong> male testosterone levels: A probablecontributor to group differences <strong>in</strong> health. Steroids, 57, 72–75.Ellis, L., & Walsh, A. (1999). Crim<strong>in</strong>ology: A global perspective. Needham Heights, MA: Allyn& Bacon.Gabor, T., & Roberts, J. V. (1990). Rushton on race and crime: The evidence rema<strong>in</strong>s unconv<strong>in</strong>c<strong>in</strong>g.Canadian Journal of Crim<strong>in</strong>ology, 32, 335–343.Hama, A. (1999). Demographic changes and social breakdown: The role of <strong>in</strong>telligence. Mank<strong>in</strong>dQuarterly, 40, 41–56.Herrnste<strong>in</strong>, R. J. (1990). Still an American dilemma. The Public Interest, No. 98, 3–17.Herrnste<strong>in</strong>, R. J., & Murray, C. (1994). The bell curve. New York: Free Press.Home Office (1999). Statistics on Race and the Crim<strong>in</strong>al Justice System: A Home Office publicationunder section 95 of the Crim<strong>in</strong>al Justice Act 1991: Report 1999. Norwich, UK:The Stationery Office.Jensen, A. R. (1998). The g Factor. Westport, CT: Praeger.
511J. PHILIPPE RUSHTON AND GLAYDE WHITNEYInterpol. (1993–1996). International <strong>Crime</strong> Statistics, 1963–1996. Lyons, France: InterpolGeneral Secretariat.Lub<strong>in</strong>ski, D., & Humphreys, L. G. (1996). See<strong>in</strong>g the forest from the trees: When predict<strong>in</strong>gthe behavior or status of groups, correlate means. <strong>Psychology</strong>, Public Policy, and Law, 2,363–376.Lynn, R. (2002a). Race differences <strong>in</strong> sexual behavior: A test of some predictions from Rushton’sr-K theory. Population and Environment, 22, 73–81.Lynn, R. (2002b). Racial and ethnic differences <strong>in</strong> psychopathic personality. Personality andIndividual Differences, 32, 273–316.Neapolitan, J. L. (1998). <strong>Cross</strong>-national variation <strong>in</strong> homicides: Is race a factor? Crim<strong>in</strong>ology,36, 139–155.Ontario. (1996). Report of the Commission on Systemic Racism <strong>in</strong> the Ontario Crim<strong>in</strong>al JusticeSystem. M<strong>in</strong>istry of the Solicitor-General and Correctional Services. Toronto, Canada:Queen’s Pr<strong>in</strong>ter for Ontario.Roberts, J. V., & Gabor, T. (1990). Lombrosian w<strong>in</strong>e <strong>in</strong> a new bottle: research on crime andrace. Canadian Journal of Crim<strong>in</strong>ology, 32, 291–313.Rushton, J. P. (1990). Race and crime: A reply to Roberts and Gabor. Canadian Journal ofCrim<strong>in</strong>ology, 32, 315–334.Rushton, J. P. (1995). Race and crime: International data for 1989–90. Psychological Reports,76, 307–312.Rushton, J. P. (2000). Race, evolution, and behavior: A life history perspective (3rd edition).Port Huron, MI: Charles Darw<strong>in</strong> Research Institute.Rushton, J. P., & Ankney, C. D. (2000). Size matters: A review and new analyses of racialdifferences <strong>in</strong> cranial capacity and <strong>in</strong>telligence that refute Kam<strong>in</strong> and Omari. Personalityand Individual Differences, 29, 591–620.Rushton, J. P., & Bogaert, A. F. (1989). Populational differences <strong>in</strong> susceptibility to AIDS: Anevolutionary analysis. Social Science and Medic<strong>in</strong>e, 28, 1211–1220.Sowell, T. (1994). Race and culture. New York: Basic Books.Taylor, J., & Whitney, G. (1999). <strong>Crime</strong> and racial profil<strong>in</strong>g by U.S. police: Is there an empiricalbasis? Journal of Social, Political, and Economic Studies, 24, 485–510.UNAIDS/WHO (2001). AIDS epidemic update: December 2001. Geneva, Switzerland: Jo<strong>in</strong>tUnited Nations Programme on HIV/AIDS (UNAIDS) and World Health Organization(WHO).United States. Department of Justice. (1997). <strong>Crime</strong> <strong>in</strong> the United States. Wash<strong>in</strong>gton, D.C.:U.S. Government Pr<strong>in</strong>t<strong>in</strong>g Office.United States. Department of Justice. (1998). Crim<strong>in</strong>al victimization <strong>in</strong> the United States, 1997.Wash<strong>in</strong>gton, D.C.: U.S. Government Pr<strong>in</strong>t<strong>in</strong>g Office.Whitney, G. (1995). Ideology and censorship <strong>in</strong> behavior genetics. Mank<strong>in</strong>d Quarterly, 35,327–342.Wilson, E. O. (1975). Sociobiology: The new synthesis. Cambridge, MA: Harvard UniversityPress.Wilson, J. Q., & Herrnste<strong>in</strong>, R. J. (1985). <strong>Crime</strong> and human nature. New York: Simon andSchuster.Yee, A. H., Fairchild, H. H., Weizmann, F., & Wyatt, G. E. (1993). Address<strong>in</strong>g psychology’sproblems with race. American Psychologist, 48, 1132–1140.


