General English Pre-Intermediate Modules 9-12 Student's Book
General English Pre-Intermediate Modules 9-12 Student's Book
General English Pre-Intermediate Modules 9-12 Student's Book

Create successful ePaper yourself
Turn your PDF publications into a flip-book with our unique Google optimized e-Paper software.
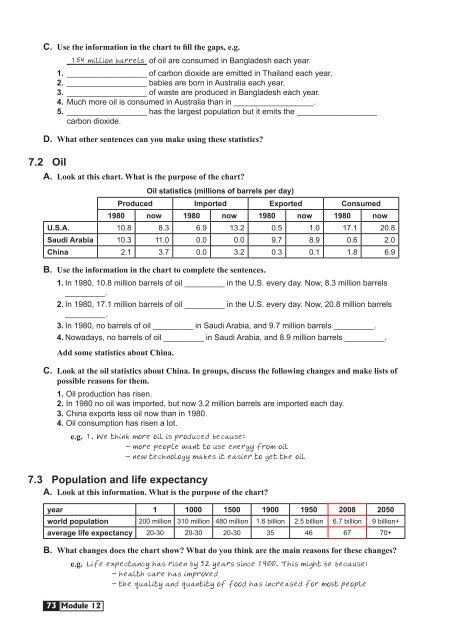
C. Use the information in the chart to fill the gaps, e.g.154 million barrels of oil are consumed in Bangladesh each year.1. __________________ of carbon dioxide are emitted in Thailand each year.2. __________________ babies are born in Australia each year.3. __________________ of waste are produced in Bangladesh each year.4. Much more oil is consumed in Australia than in __________________.5. __________________ has the largest population but it emits the __________________carbon dioxide.D. What other sentences can you make using these statistics?7.2 OilA. Look at this chart. What is the purpose of the chart?73 Module <strong>12</strong>Oil statistics (millions of barrels per day)Produced Imported Exported Consumed1980 now 1980 now 1980 now 1980 nowU.S.A. 10.8 8.3 6.9 13.2 0.5 1.0 17.1 20.8Saudi Arabia 10.3 11.0 0.0 0.0 9.7 8.9 0.6 2.0China 2.1 3.7 0.0 3.2 0.3 0.1 1.8 6.9B. Use the information in the chart to complete the sentences.1. In 1980, 10.8 million barrels of oil _________ in the U.S. every day. Now, 8.3 million barrels_________.2. In 1980, 17.1 million barrels of oil _________ in the U.S. every day. Now, 20.8 million barrels_________.3. In 1980, no barrels of oil _________ in Saudi Arabia, and 9.7 million barrels _________.4. Nowadays, no barrels of oil _________ in Saudi Arabia, and 8.9 million barrels _________.Add some statistics about China.C. Look at the oil statistics about China. In groups, discuss the following changes and make lists ofpossible reasons for them.1. Oil production has risen.2. In 1980 no oil was imported, but now 3.2 million barrels are imported each day.3. China exports less oil now than in 1980.4. Oil consumption has risen a lot.e.g. 1. We think more oil is produced because:- more people want to use energy from oil- new technology makes it easier to get the oil7.3 Population and life expectancyA. Look at this information. What is the purpose of the chart?year 1 1000 1500 1900 1950 2008 2050world population 200 million 310 million 480 million 1.6 billion 2.5 billion 6.7 billion 9 billion+average life expectancy 20-30 20-30 20-30 35 46 67 70+B. What changes does the chart show? What do you think are the main reasons for these changes?e.g. Life expectancy has risen by 32 years since 1900. This might be because:- health care has improved- the quality and quantity of food has increased for most people


![[Eng] Nov 2012 DRAFT - The Curriculum Project](https://img.yumpu.com/45590859/1/184x260/eng-nov-2012-draft-the-curriculum-project.jpg?quality=85)