Introduction Optional Reading Workshop Content - Bivio
Introduction Optional Reading Workshop Content - Bivio
Introduction Optional Reading Workshop Content - Bivio

Create successful ePaper yourself
Turn your PDF publications into a flip-book with our unique Google optimized e-Paper software.
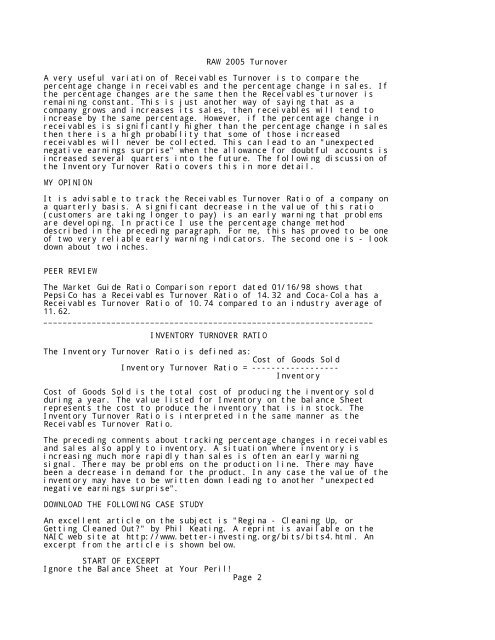
RAW 2005 TurnoverA very useful variation of Receivables Turnover is to compare thepercentage change in receivables and the percentage change in sales. Ifthe percentage changes are the same then the Receivables turnover isremaining constant. This is just another way of saying that as acompany grows and increases its sales, then receivables will tend toincrease by the same percentage. However, if the percentage change inreceivables is significantly higher than the percentage change in salesthen there is a high probability that some of those increasedreceivables will never be collected. This can lead to an "unexpectednegative earnings surprise" when the allowance for doubtful accounts isincreased several quarters into the future. The following discussion ofthe Inventory Turnover Ratio covers this in more detail.MY OPINIONIt is advisable to track the Receivables Turnover Ratio of a company ona quarterly basis. A significant decrease in the value of this ratio(customers are taking longer to pay) is an early warning that problemsare developing. In practice I use the percentage change methoddescribed in the preceding paragraph. For me, this has proved to be oneof two very reliable early warning indicators. The second one is - lookdown about two inches.PEER REVIEWThe Market Guide Ratio Comparison report dated 01/16/98 shows thatPepsiCo has a Receivables Turnover Ratio of 14.32 and Coca-Cola has aReceivables Turnover Ratio of 10.74 compared to an industry average of11.62.____________________________________________________________________INVENTORY TURNOVER RATIOThe Inventory Turnover Ratio is defined as:Cost of Goods SoldInventory Turnover Ratio = ------------------InventoryCost of Goods Sold is the total cost of producing the inventory soldduring a year. The value listed for Inventory on the balance Sheetrepresents the cost to produce the inventory that is in stock. TheInventory Turnover Ratio is interpreted in the same manner as theReceivables Turnover Ratio.The preceding comments about tracking percentage changes in receivablesand sales also apply to inventory. A situation where inventory isincreasing much more rapidly than sales is often an early warningsignal. There may be problems on the production line. There may havebeen a decrease in demand for the product. In any case the value of theinventory may have to be written down leading to another "unexpectednegative earnings surprise".DOWNLOAD THE FOLLOWING CASE STUDYAn excellent article on the subject is "Regina - Cleaning Up, orGetting Cleaned Out?" by Phil Keating. A reprint is available on theNAIC web site at http://www.better-investing.org/bits/bits4.html. Anexcerpt from the article is shown below.START OF EXCERPTIgnore the Balance Sheet at Your Peril!Page 2