Introduction Optional Reading Workshop Content - Bivio
Introduction Optional Reading Workshop Content - Bivio
Introduction Optional Reading Workshop Content - Bivio

Create successful ePaper yourself
Turn your PDF publications into a flip-book with our unique Google optimized e-Paper software.
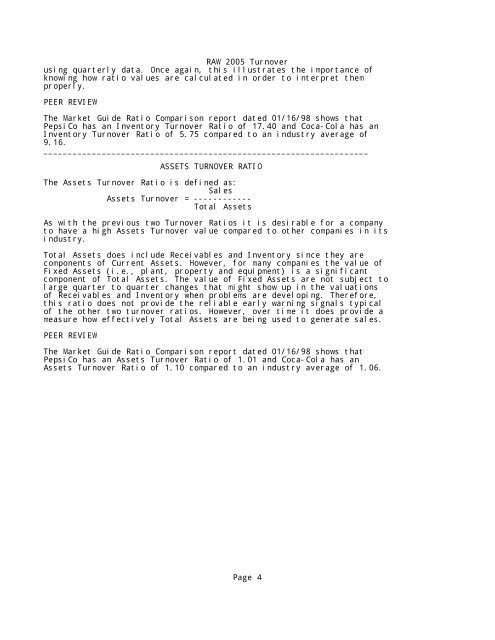
RAW 2005 Turnoverusing quarterly data. Once again, this illustrates the importance ofknowing how ratio values are calculated in order to interpret themproperly.PEER REVIEWThe Market Guide Ratio Comparison report dated 01/16/98 shows thatPepsiCo has an Inventory Turnover Ratio of 17.40 and Coca-Cola has anInventory Turnover Ratio of 5.75 compared to an industry average of9.16.___________________________________________________________________ASSETS TURNOVER RATIOThe Assets Turnover Ratio is defined as:SalesAssets Turnover = ------------Total AssetsAs with the previous two Turnover Ratios it is desirable for a companyto have a high Assets Turnover value compared to other companies in itsindustry.Total Assets does include Receivables and Inventory since they arecomponents of Current Assets. However, for many companies the value ofFixed Assets (i.e., plant, property and equipment) is a significantcomponent of Total Assets. The value of Fixed Assets are not subject tolarge quarter to quarter changes that might show up in the valuationsof Receivables and Inventory when problems are developing. Therefore,this ratio does not provide the reliable early warning signals typicalof the other two turnover ratios. However, over time it does provide ameasure how effectively Total Assets are being used to generate sales.PEER REVIEWThe Market Guide Ratio Comparison report dated 01/16/98 shows thatPepsiCo has an Assets Turnover Ratio of 1.01 and Coca-Cola has anAssets Turnover Ratio of 1.10 compared to an industry average of 1.06.Page 4