Leibtag, Ephraim, <strong>and</strong> Phil Kaufman (2003). Exploring Food PurchaseBehavior of Low-Income Households: How Do <strong>The</strong>y Economize? CurrentIssues in Economics of Food Markets, Agriculture In<strong>for</strong>mation BulletinNo. 747-07, U.S. Department of Agriculture, Economic Research Service,June. http://www.ers.usda.gov/publications/aib747/aib74707.pdf.Oliveira, Victor (2009). <strong>The</strong> Food Assistance L<strong>and</strong>scape: FY 2008 AnnualReport. Economic In<strong>for</strong>mation Bulletin No. 6-6, U.S. Department ofAgriculture, Economic Research Service, April. http://www.ers.usda.gov/Publications/EIB6-6/EIB6-6.pdf.Oliveira, Victor, <strong>and</strong> Elizabeth Frazao (2009). <strong>The</strong> <strong>WIC</strong> Program:Background, Trends, <strong>and</strong> Economic Issues, 2009 Edition. EconomicResearch Report No. 73, U.S. Department of Agriculture, EconomicResearch Service, April. http://www.ers.usda.gov/Publications/ERR73/ERR73Fm.pdf.Stewart, Hayden, Jeffery Hyman, Elizabeth Frazão, Jean Buzby, <strong>and</strong>Andi Carlson (2011). “Can Low-Income Americans Af<strong>for</strong>d To SatisfyMyPyramid <strong>Fruit</strong> <strong>and</strong> <strong>Vegetable</strong> Guidelines?” Journal of NutritionEducation <strong>and</strong> Behavior 43 (2011):173-79.Todd, Jessica E., Lisa Mancino, Ephraim Leibtag, <strong>and</strong> Christina Tripodo(2010). Methodology Behind the Quarterly Food-at-Home PriceDatabase. Technical Bulletin No. 1926, U.S. Department of Agriculture,Economic Research Service, April. http://www.ers.usda.gov/Publications/TB1926/TB1926.pdf.U.S. Department of Agriculture, Agricultural Research Service (2009).USDA National Nutrient Database <strong>for</strong> St<strong>and</strong>ard Reference, Release 22.Nutrient Data Laboratory Home Page. http://www.ars.usda.gov/ba/bhnrc/ndl.U.S. Department of Agriculture, Food <strong>and</strong> Nutrition Service, Women,Infants, <strong>and</strong> Children (2010). “<strong>WIC</strong> Food Packages – Maximum MonthlyAllowances.” http://www.fns.usda.gov/wic/benefits<strong>and</strong>services/foodpkgallowances.HTM.U.S. Department of Agriculture, Food <strong>and</strong> Nutrition Service (2007). “SpecialSupplemental Nutrition Program <strong>for</strong> Women, Infants <strong>and</strong> Children (<strong>WIC</strong>):Revisions in the <strong>WIC</strong> Food Packages; Interim Rule.” Federal Register 72(234), U.S. Department of Agriculture, 7 CFR Part 246. http://www.fns.usda.gov/wic/regspublished/wicfoodpkginterimrulepdf.pdf.U.S. Department of Agriculture, Food <strong>and</strong> Nutrition Service (2010). “<strong>WIC</strong>Program Participation <strong>and</strong> Costs.” August 31, 2010. http://www.fns.usda.gov/pd/wisummary.htm.U.S. Department of Health <strong>and</strong> Human Services <strong>and</strong> U.S. Department ofAgriculture (2005). Dietary Guidelines <strong>for</strong> Americans 2005. http://www.healthierus.gov/dietaryguidelines.14<strong>The</strong> <strong>WIC</strong> <strong>Fruit</strong> <strong>and</strong> <strong>Vegetable</strong> <strong>Cash</strong> <strong>Voucher</strong>: Does Regional Price Variation Affect Buying Power? / EIB-75Economic Research Service/USDA
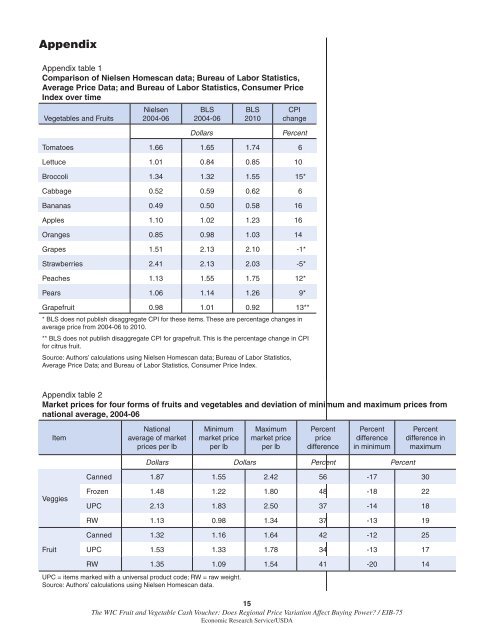
AppendixAppendix table 1Comparison of Nielsen Homescan data; Bureau of Labor Statistics,Average Price Data; <strong>and</strong> Bureau of Labor Statistics, Consumer PriceIndex over time<strong>Vegetable</strong>s <strong>and</strong> <strong>Fruit</strong>sNielsen2004-06BLS2004-06BLS2010CPIchangeDollarsPercentTomatoes 1.66 1.65 1.74 6Lettuce 1.01 0.84 0.85 10Broccoli 1.34 1.32 1.55 15*Cabbage 0.52 0.59 0.62 6Bananas 0.49 0.50 0.58 16Apples 1.10 1.02 1.23 16Oranges 0.85 0.98 1.03 14Grapes 1.51 2.13 2.10 -1*Strawberries 2.41 2.13 2.03 -5*Peaches 1.13 1.55 1.75 12*Pears 1.06 1.14 1.26 9*Grapefruit 0.98 1.01 0.92 13*** BLS does not publish disaggregate CPI <strong>for</strong> these items. <strong>The</strong>se are percentage changes inaverage price from 2004-06 to 2010.** BLS does not publish disaggregate CPI <strong>for</strong> grapefruit. This is the percentage change in CPI<strong>for</strong> citrus fruit.Source: Authors’ calculations using Nielsen Homescan data; Bureau of Labor Statistics,Average Price Data; <strong>and</strong> Bureau of Labor Statistics, Consumer Price Index.Appendix table 2Market prices <strong>for</strong> four <strong>for</strong>ms of fruits <strong>and</strong> vegetables <strong>and</strong> deviation of minimum <strong>and</strong> maximum prices fromnational average, 2004-06ItemNationalaverage of marketprices per lbMinimummarket priceper lbMaximummarket priceper lbPercentpricedifferencePercentdifferencein minimumPercentdifference inmaximumDollars Dollars Percent PercentCanned 1.87 1.55 2.42 56 -17 30VeggiesFrozen 1.48 1.22 1.80 48 -18 22UPC 2.13 1.83 2.50 37 -14 18RW 1.13 0.98 1.34 37 -13 19Canned 1.32 1.16 1.64 42 -12 25<strong>Fruit</strong>UPC 1.53 1.33 1.78 34 -13 17RW 1.35 1.09 1.54 41 -20 14UPC = items marked with a universal product code; RW = raw weight.Source: Authors’ calculations using Nielsen Homescan data.15<strong>The</strong> <strong>WIC</strong> <strong>Fruit</strong> <strong>and</strong> <strong>Vegetable</strong> <strong>Cash</strong> <strong>Voucher</strong>: Does Regional Price Variation Affect Buying Power? / EIB-75Economic Research Service/USDA