Download PDF - Produce for Better Health Foundation
Download PDF - Produce for Better Health Foundation
Download PDF - Produce for Better Health Foundation

You also want an ePaper? Increase the reach of your titles
YUMPU automatically turns print PDFs into web optimized ePapers that Google loves.
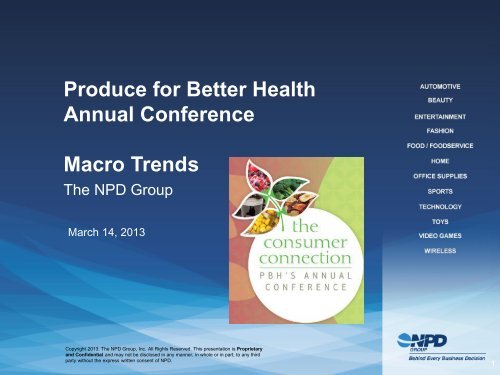
<strong>Produce</strong> <strong>for</strong> <strong>Better</strong> <strong>Health</strong><br />
Annual Conference<br />
Macro Trends<br />
The NPD Group<br />
March 14, 2013<br />
Copyright 2013. The NPD Group, Inc. All Rights Reserved. This presentation is Proprietary<br />
and Confidential and may not be disclosed in any manner, in whole or in part, to any third<br />
party without the express written consent of NPD.<br />
1
Background Regarding The Insights<br />
NPD provides syndicated and custom primary research to companies<br />
involved in the food and beverage industry.<br />
Two primary syndicated survey’s were used:<br />
National Eating Trends- 14 day diary from primary respondent in HH<br />
SnackTrack- yesterday snacking behavior <strong>for</strong> RTE foods (no cooking)<br />
Other sources of data from NPD’s supplemental services<br />
Topical Reports<br />
Snacking in America Report<br />
A Market <strong>for</strong> Functional Foods<br />
Generation Mom<br />
NET Follow Up Surveys<br />
<strong>Health</strong>Track<br />
Nutrient Intake<br />
The NPD Group, Inc. | Proprietary and Confidential
Home is the source of most of our meals and snacks<br />
% of Occasions by Where Obtained<br />
Home 80%<br />
Foodservice<br />
19%<br />
Note: This excludes meal skipping<br />
Source<br />
Unknown 1%<br />
Source: NPD’s Eating Patterns in America - Year Ending Feb. 2012: PBH 2013 CONFERENCE: NOT FOR ADDITIONAL DISTRIBUTION<br />
The NPD Group, Inc. | Proprietary and Confidential
Sourcing meals from home has become<br />
more important in recent years<br />
Percent of Occasions Coming from Home Supply<br />
78.0% 77.5% 77.0% 76.9%<br />
77.5% 77.0% 77.0% 77.5% 77.5% 77.1% 77.0% 77.4% 77.4% 77.9% 79.0%<br />
79.3%<br />
79.8%<br />
'96 '97 '98 '99 '00 '01 '02 '03 '04 '05 '06 '07 '08 '09 '10 '11 '12<br />
Note: This excludes meal skipping<br />
Source: NPD’s Eating Patterns in America PBH 2013 CONFERENCE: NOT FOR ADDITIONAL DISTRIBUTION<br />
The NPD Group, Inc. | Proprietary and Confidential
Fruit tops the list of foods and beverages<br />
consumed most often from the home<br />
Top items<br />
% of Occasions – Consumed In the home or Carried from Home<br />
1. Fruit<br />
2. Sandwiches (excluding frozen)<br />
3. Milk (excluding hot chocolate)<br />
4. Coffee<br />
5. Vegetables<br />
6. Carbonated Soft Drink<br />
7. RTE Cereal<br />
8. 100% Fruit Juice<br />
9. Tea<br />
10. Bread<br />
end dishes<br />
Source: NPD's National Eating Trends - 2 years through Nov. 2012PBH 2013 CONFERENCE: NOT FOR ADDITIONAL DISTRIBUTION<br />
The NPD Group, Inc. | Proprietary and Confidential<br />
5
The majority of the population consume fruits,<br />
vegetables or 100% fruit juice every day<br />
% of Individuals Who Consume on a Typical Day<br />
In the Home or Carried from Home<br />
Consume<br />
Do not<br />
consume<br />
All <strong>for</strong>ms and<br />
uses including<br />
juices<br />
Source: NPD's National Eating Trends - 2 years through Nov. 2012 PBH 2013 CONFERENCE: NOT FOR ADDITIONAL DISTRIBUTION<br />
The NPD Group, Inc. | Proprietary and Confidential
Among kids, milk edges out fruit as the top item<br />
Top Items<br />
% of Occasions – Consumed In the home or Carried from Home<br />
Kids
… <strong>for</strong> adults, coffee is king<br />
Top Items<br />
% of Occasions – Consumed In the home or Carried from Home<br />
Kids
Fruit is among the top growing items<br />
Top Growing Items During Past Decade (2012 – 2003)<br />
Change in % of Occasions – Consumed In the home or Carried from Home<br />
1. Yogurt (excluding frozen)<br />
2. Fruit<br />
3. Pizza<br />
4. Tea<br />
5. Bars (e.g. granola, energy)<br />
end dishes<br />
Source: NPD's National Eating Trends - 2 years through Nov. PBH 2013 CONFERENCE: NOT FOR ADDITIONAL DISTRIBUTION<br />
The NPD Group, Inc. | Proprietary and Confidential<br />
9
Over the long term, consumption of fruit is up<br />
somewhat while 100% juice consumption is down<br />
Annual Eatings per Capita - Consumed in the Home or Carried from Home<br />
2002 2003 2004 2005 2006 2007 2008 2009 2010 2011 2012<br />
Total Fruit Vegetables Juice<br />
All <strong>for</strong>ms<br />
and uses<br />
Source: NPD's National Eating Trends – years ending Nov. PBH 2013 CONFERENCE: NOT FOR ADDITIONAL DISTRIBUTION<br />
The NPD Group, Inc. | Proprietary and Confidential 10
Fruit and 100% juices are mainly consumed as an “end<br />
dish”. Vegetables have a higher share as an ingredient<br />
100%<br />
75%<br />
% of Eatings – Consumed in the Home or Carried from Home<br />
7%<br />
13%<br />
11%<br />
1%<br />
43%<br />
50%<br />
81%<br />
4%<br />
87%<br />
Ingredient<br />
Topping<br />
End Dish<br />
25%<br />
53%<br />
0%<br />
Fruit Vegetables Juice<br />
All <strong>for</strong>ms<br />
Source: NPD's National Eating Trends – 2yrs ending Nov.’12 PBH 2013 CONFERENCE: NOT FOR ADDITIONAL DISTRIBUTION<br />
The NPD Group, Inc. | Proprietary and Confidential 11
Store fresh is the dominant <strong>for</strong>m <strong>for</strong><br />
both fruits and vegetables<br />
Store Fresh<br />
% of Eatings – Consumed in the Home or Carried from<br />
Home<br />
100%<br />
75%<br />
77%<br />
50%<br />
53%<br />
25%<br />
0%<br />
Fruit<br />
Vegetables<br />
All uses<br />
Source: NPD's National Eating Trends – 2yrs ending Nov.’12 PBH 2013 CONFERENCE: NOT FOR ADDITIONAL DISTRIBUTION<br />
The NPD Group, Inc. | Proprietary and Confidential 12
Consumer preference <strong>for</strong> store fresh fruit<br />
has increased over time<br />
Fruit by Top Forms<br />
% of Eatings – Consumed in the Home or Carried from Home<br />
74.4% 74.8% 75.3% 75.3% 75.0% 74.6% 75.7% 76.6% 76.2% 76.7%<br />
10.5% 10.2% 10.0% 10.0% 9.6% 9.4% 8.8% 8.8% 9.1% 9.0%<br />
Nov-03 Nov-04 Nov-05 Nov-06 Nov-07 Nov-08 Nov-09 Nov-10 Nov-11 Nov-12<br />
Store Fresh Can / Jar<br />
All uses<br />
Source: NPD's National Eating Trends – 2yrs ending Nov.’12 PBH 2013 CONFERENCE: NOT FOR ADDITIONAL DISTRIBUTION<br />
The NPD Group, Inc. | Proprietary and Confidential 13
Frozen and store fresh vegetables have<br />
grown while canned has declined<br />
Vegetables by Top Forms<br />
% of Eatings – Consumed in the Home or Carried from Home<br />
51.8% 51.7% 51.4% 51.4% 51.5% 51.8% 52.5% 53.0% 52.4% 52.8%<br />
21.5% 20.9% 20.6% 20.7% 20.4% 20.1% 20.0% 19.2% 18.8% 19.1%<br />
10.1% 10.3% 10.5% 10.7% 11.5% 12.0% 11.9% 11.6% 11.8% 12.1%<br />
Nov-03 Nov-04 Nov-05 Nov-06 Nov-07 Nov-08 Nov-09 Nov-10 Nov-11 Nov-12<br />
Store Fresh Frozen Canned<br />
All uses<br />
Source: NPD's National Eating Trends – 2yrs ending Nov.’12 PBH 2013 CONFERENCE: NOT FOR ADDITIONAL DISTRIBUTION<br />
The NPD Group, Inc. | Proprietary and Confidential 14
Fruit, vegetable and 100% juice consumption<br />
declines and then rises with age<br />
Fruit, Vegetables, 100% Juice<br />
% of Occasions Consumed in the Home or Carried from Home<br />
0-9 Yr<br />
Olds<br />
10-19 Yr<br />
Olds<br />
20-29 Yr<br />
Olds<br />
30-39 Yr<br />
Olds<br />
40-49 Yr<br />
Olds<br />
50-59 Yr<br />
Olds<br />
60-69 Yr<br />
Olds<br />
70+ Yr<br />
olds<br />
All <strong>for</strong>ms and uses<br />
Source: NPD's National Eating Trends – 2yrs ending Nov.’12 PBH 2013 CONFERENCE: NOT FOR ADDITIONAL DISTRIBUTION<br />
The NPD Group, Inc. | Proprietary and Confidential 15
The age profile varies by category…<br />
% of Occasions Consumed in the Home or Carried from Home<br />
Fruit Vegetables Juice<br />
0-9 Yr<br />
Olds<br />
10-19 Yr<br />
Olds<br />
20-29 Yr<br />
Olds<br />
30-39 Yr<br />
Olds<br />
40-49 Yr<br />
Olds<br />
50-59 Yr<br />
Olds<br />
60-69 Yr<br />
Olds<br />
70+ Yr<br />
olds<br />
All <strong>for</strong>ms and uses<br />
Source: NPD's National Eating Trends – 2yrs ending Nov.’12 PBH 2013 CONFERENCE: NOT FOR ADDITIONAL DISTRIBUTION<br />
The NPD Group, Inc. | Proprietary and Confidential 16
<strong>Health</strong> oriented households<br />
consume more fruits, vegetables and 100% juice<br />
Fruit, Vegetables, 100% Juice (all <strong>for</strong>ms and uses)<br />
% of Occasions Consumed in the Home or Carried from Home<br />
Short Cut Fuelers Family Pleasers <strong>Health</strong> Strugglers Traditional <strong>Health</strong><br />
Followers<br />
Natural <strong>Health</strong><br />
Embracers<br />
Source: NPD's National Eating Trends – 2yrs ending Nov.’12 PBH 2013 CONFERENCE: NOT FOR ADDITIONAL DISTRIBUTION<br />
The NPD Group, Inc. | Proprietary and Confidential 17
SUMMARY The & KEY healthier INSIGHTS our actual eating habits, the more<br />
frequently we snack between meals<br />
Frequency of Snacking by NPD’s <strong>Health</strong>y Eating Index<br />
Annual Snack Meals per Capita<br />
Kids
Fruit is the most popular between meal snack<br />
Top items Consumed as a Between Meal Snack<br />
% of Occasions Consumed in the Home or Carried from Home<br />
1. Fruit<br />
2. Frozen Ice Cream/Novelties<br />
3. Cookies<br />
4. Candy/Gum<br />
5. Carbonated Soft Drink<br />
6. Chips<br />
7. Milk (excluding hot chocolate)<br />
8. Popcorn<br />
9. Crackers<br />
10. Cake / Snack Cakes<br />
end dishes<br />
Source: NPD's National Eating Trends – 2yrs ending Nov.’12 PBH 2013 CONFERENCE: NOT FOR ADDITIONAL DISTRIBUTION<br />
The NPD Group, Inc. | Proprietary and Confidential<br />
19
Do consumers think eating healthy means adding or<br />
taking something out of the diet? … it’s both<br />
% of Adults<br />
n = 1,921<br />
Equally<br />
"Add to" and<br />
"Take out"<br />
55%<br />
Add<br />
something<br />
to diet<br />
26%<br />
Take<br />
something<br />
out of diet<br />
19%<br />
Source: NPD’s Functional Foods & Beverages Custom Survey; June ’12 PBH 2013 CONFERENCE: NOT FOR ADDITIONAL DISTRIBUTION<br />
The NPD Group, Inc. | Proprietary and Confidential
Questions??<br />
Feel Free to Contact Me<br />
Thank You<br />
Howard Goldberg<br />
Director- Food & Beverage<br />
847.692.1736<br />
Howard.goldberg@npd.com<br />
The NPD Group, Inc. | Proprietary and Confidential