The WIC Fruit and Vegetable Cash Voucher - Produce for Better ...
The WIC Fruit and Vegetable Cash Voucher - Produce for Better ...
The WIC Fruit and Vegetable Cash Voucher - Produce for Better ...

You also want an ePaper? Increase the reach of your titles
YUMPU automatically turns print PDFs into web optimized ePapers that Google loves.
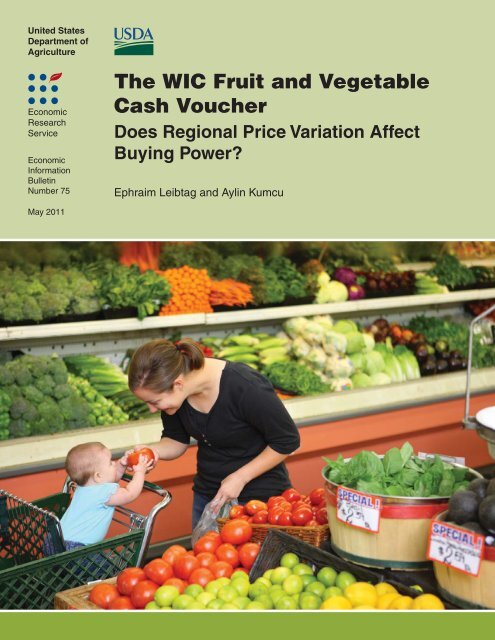
United StatesDepartment ofAgricultureEconomicResearchServiceEconomicIn<strong>for</strong>mationBulletinNumber 75<strong>The</strong> <strong>WIC</strong> <strong>Fruit</strong> <strong>and</strong> <strong>Vegetable</strong><strong>Cash</strong> <strong>Voucher</strong>Does Regional Price Variation AffectBuying Power?Ephraim Leibtag <strong>and</strong> Aylin KumcuMay 2011
wwwoVisit Our Website To Learn More!ww.ers.usda.govFor additional in<strong>for</strong>mation, see:www.ers.usda.gov/Data/<strong>Fruit</strong><strong>Vegetable</strong>Costs/www.ers.usda.gov/Briefing/CPIFoodAndExpenditures/Recommended citation <strong>for</strong>mat <strong>for</strong> this publication:Leibtag, Ephraim, <strong>and</strong> Aylin Kumcu. <strong>The</strong> <strong>WIC</strong> <strong>Fruit</strong> <strong>and</strong> <strong>Vegetable</strong> <strong>Cash</strong><strong>Voucher</strong>: Does Regional Price Variation Affect Buying Power? EIB-75.U.S. Dept. of Agriculture, Econ. Res. Serv. May 2011.Photo credit: Shutterstock.<strong>The</strong> U.S. Department of Agriculture (USDA) prohibits discrimination in all itsprograms <strong>and</strong> activities on the basis of race, color, national origin, age,disability, <strong>and</strong>, where applicable, sex, marital status, familial status, parentalstatus, religion, sexual orientation, genetic in<strong>for</strong>mation, political beliefs, reprisal,or because all or a part of an individual’s income is derived from any publicassistance program. (Not all prohibited bases apply to all programs.) Personswith disabilities who require alternative means <strong>for</strong> communication of programin<strong>for</strong>mation (Braille, large print, audiotape, etc.) should contact USDA’sTARGET Center at (202) 720-2600 (voice <strong>and</strong> TDD).To file a complaint of discrimination write to USDA, Director, Office of CivilRights, 1400 Independence Avenue, S.W., Washington, D.C. 20250-9410 orcall (800) 795-3272 (voice) or (202) 720-6382 (TDD). USDA is an equalopportunity provider <strong>and</strong> employer.
United StatesDepartmentof AgricultureEconomicIn<strong>for</strong>mationBulletinNumber 75May 2011A Report from the Economic Research Servicewww.ers.usda.gov<strong>The</strong> <strong>WIC</strong> <strong>Fruit</strong> <strong>and</strong> <strong>Vegetable</strong><strong>Cash</strong> <strong>Voucher</strong>Does Regional Price Variation AffectBuying Power?Ephraim Leibtag, eleibtag@ers.usda.govAylin Kumcu, akumcu@ers.usda.govAbstract<strong>The</strong> Special Supplemental Nutrition Program <strong>for</strong> Women, Infants, <strong>and</strong> Children (<strong>WIC</strong>)provides supplemental foods to low-income women, infants, <strong>and</strong> children at nutritionalrisk. Since October 2009, <strong>WIC</strong> packages have included a fixed-value voucher <strong>for</strong>purchasing fruits <strong>and</strong> vegetables. Although this should help increase fruit <strong>and</strong> vegetableconsumption <strong>for</strong> all <strong>WIC</strong> participants, regional price variation could lead to differentbuying power—<strong>and</strong> nutritional benefits—across the country. Using 2004-06 NielsenHomescan data, the authors examine the prices of fruits <strong>and</strong> vegetables (fresh, frozen,<strong>and</strong> canned) in 26 metropolitan market areas to determine how price variations affect thevoucher’s purchasing power. <strong>The</strong> authors find that the 20 most commonly purchased fruits<strong>and</strong> vegetables cost 30-70 percent more in the highest priced market areas than in thelowest, implying that <strong>WIC</strong> participants in more expensive areas might be able to purchasefewer fruits <strong>and</strong> vegetables than those living where these items are cheaper. <strong>The</strong> lowestpriced market <strong>for</strong> fruits <strong>and</strong> vegetables was the Nashville, Birmingham, Memphis, <strong>and</strong>Louisville area, while the highest was San Francisco.Keywords: <strong>WIC</strong>, fruit <strong>and</strong> vegetable voucher, fruit <strong>and</strong> vegetable prices, NielsenHomescan, geographic price variationAcknowledgments<strong>The</strong> authors would like to thank Helen Jensen, Professor of Economics, Iowa StateUniversity, Tatiana Andreyeva, Director of Economic Initiatives at the Rudd Center <strong>for</strong>Food Policy & Obesity at Yale University, <strong>and</strong> Elizabeth Frazao, Economic ResearchService, USDA, whose recommended changes greatly improved the report. <strong>The</strong> authorswould also like to thank Abebayehu Tegene, Elise Golan, <strong>and</strong> Laurian Unnevehr ofUSDA’s Economic Research Service <strong>for</strong> their comments on various drafts of the paper,Courtney Knauth <strong>for</strong> editorial assistance, <strong>and</strong> Curtia Taylor <strong>for</strong> design services.
SummaryWhat Is the Issue?A large portion of the eligible U.S. population takes part in the SpecialSupplemental Nutrition Program <strong>for</strong> Women, Infants, <strong>and</strong> Children (<strong>WIC</strong>),which provides supplemental foods, health care referrals, <strong>and</strong> nutrition educationto low-income pregnant, breastfeeding, <strong>and</strong> postpartum women <strong>and</strong> toinfants <strong>and</strong> children at nutritional risk. Despite this dietary boost, most <strong>WIC</strong>participants remain at nutritional risk, predisposing them to adverse healthconditions now <strong>and</strong> later in life. To reduce this risk, the Federal Governmentenhanced the nutritional value of <strong>WIC</strong> food packages in October 2009. <strong>The</strong>most significant addition was a fixed-value voucher to purchase fruits <strong>and</strong>vegetables, which previously had not been included in <strong>WIC</strong> packages. Butbecause food prices vary across the country, there is concern that the fixedvalueprovision of the vouchers may undercut their effectiveness <strong>for</strong> <strong>WIC</strong>participants in higher priced market areas. To assess the possible impact ofprice variation on the purchasing power of <strong>WIC</strong> fruit <strong>and</strong> vegetable vouchers,we examined the prices of individual fruits <strong>and</strong> vegetables at the metropolitan(metro) level across the United States.What Did the Study find?<strong>The</strong> purchasing power of fruit <strong>and</strong> vegetable vouchers differed substantiallyacross market areas due to significant price variation, implying that <strong>WIC</strong>participants in some areas will be unable to buy as many fruits <strong>and</strong> vegetablesas those living in other areas. Results of the study show that:• Most fruits <strong>and</strong> vegetables were 30-70 percent more expensive in theirhighest priced market than their lowest. However, the overall pricerange was wider: 26 percent <strong>for</strong> pears—the smallest price spread acrossmarkets—to 140 percent <strong>for</strong> grapefruit—the largest spread acrossmarkets.• <strong>The</strong> Metro South 2 market (Nashville, Birmingham, Memphis, <strong>and</strong>Louisville) tended to have the lowest average prices, while San Franciscotended to have the highest. Average prices were more than 20 percenthigher in San Francisco than in the Metro South 2 area.• <strong>The</strong> relative prices of the various fruits <strong>and</strong> vegetables held constantacross U.S. markets. <strong>The</strong> most expensive vegetables were peppers <strong>and</strong>tomatoes, <strong>and</strong> the most expensive fruits were strawberries <strong>and</strong> grapes.<strong>The</strong> lowest cost vegetables were cabbage <strong>and</strong> corn, while bananas <strong>and</strong>oranges were the lowest cost fruits.• A <strong>WIC</strong> participant with a $10 voucher could purchase 17 percent moretomatoes per month or 13 percent more apples per month in the lowestpriced market compared with the national average, while in the mostexpensive market she would be able to buy 15 percent fewer tomatoes <strong>and</strong>11 percent fewer apples compared with the national average.iii<strong>The</strong> <strong>WIC</strong> <strong>Fruit</strong> <strong>and</strong> <strong>Vegetable</strong> <strong>Cash</strong> <strong>Voucher</strong>: Does Regional Price Variation Affect Buying Power? / EIB-75Economic Research Service/USDA
How Was the Study Conducted?We used the 2004-06 Nielsen Homescan panel data <strong>for</strong> households, in whichrespondents recorded all of their purchases at a wide variety of food retailers,including traditional grocery stores <strong>and</strong> nontraditional stores, such as warehouseclubs <strong>and</strong> supercenters. We calculated the mean market-level prices of20 fresh <strong>and</strong> processed fruits <strong>and</strong> vegetables in 26 aggregate market areas.By comparing prices of the most commonly purchased fruits <strong>and</strong> vegetablesbased on national U.S. averages, we were able to quantify how many moreor fewer fruits <strong>and</strong> vegetables <strong>WIC</strong> participants in the various market areaswould be able to purchase. Finally, we constructed a price index to rankmarkets from least to most expensive.iv<strong>The</strong> <strong>WIC</strong> <strong>Fruit</strong> <strong>and</strong> <strong>Vegetable</strong> <strong>Cash</strong> <strong>Voucher</strong>: Does Regional Price Variation Affect Buying Power? / EIB-75Economic Research Service/USDA
Introduction<strong>The</strong> Special Supplemental Nutrition Program <strong>for</strong> Women, Infants, <strong>and</strong>Children (<strong>WIC</strong>) is a non-entitlement Federal food assistance program. Itprovides supplemental foods, health care referrals, <strong>and</strong> nutrition educationto low-income pregnant, breastfeeding, <strong>and</strong> nonbreastfeeding postpartumwomen <strong>and</strong> to infants <strong>and</strong> children who are found to be at nutritional risk.<strong>The</strong> goal of the program is to improve birth outcomes <strong>and</strong> support infant <strong>and</strong>child growth <strong>and</strong> development.<strong>WIC</strong> is one of the fastest growing food assistance programs, with $6.5billion dollars spent in fiscal year (FY) 2009 <strong>and</strong> 9.1 million people participatingeach month. Nearly 50 percent of all infants in the United States, 25percent of children aged 1-4, <strong>and</strong> 25 percent of pregnant, breastfeeding, <strong>and</strong>postpartum women participated in <strong>WIC</strong> in fiscal year 2009. <strong>The</strong> averagemonthly cost per person has been growing since the program began in 1972,reaching $42.40 in FY 2009 (U.S. Department of Agriculture, Food <strong>and</strong>Nutrition Service, 2010b). <strong>WIC</strong> offers seven food packages, 1 each specifyinga maximum monthly quantity of food that participants can purchase from<strong>WIC</strong>-authorized retailers, <strong>and</strong> including a voucher <strong>for</strong> fruits <strong>and</strong> vegetables,with the costs paid by the U.S. Department of Agriculture (USDA) (Oliveira,2009; Oliveira <strong>and</strong> Frazao, 2009).While <strong>WIC</strong> is entirely federally funded <strong>and</strong> the food package contents aredetermined at the national level, the program is administered by State agencies,who have limited autonomy to create rules <strong>for</strong> the food packages.USDA’s Food <strong>and</strong> Nutrition Service (FNS) designs the food packages <strong>and</strong> setsthe participation requirements, such as the maximum monthly food allowance<strong>and</strong> the income eligibility cutoff, but State agencies may restrict thebr<strong>and</strong>, container size, or <strong>for</strong>m of food that can be purchased. States may alsoadjust the income eligibility cutoff 2 in order to reduce administrative burdens<strong>and</strong> costs, as long as the adjustments remain within the Federal guidelines(Oliveira, 2009; Oliveira <strong>and</strong> Frazao, 2009). 3At the end of 2007, a <strong>WIC</strong> food package revision was announced, with agoal of better meeting <strong>WIC</strong> participants’ nutritional needs <strong>and</strong> more fullyaligning the food packages with the 2005 Dietary Guidelines <strong>for</strong> Americans<strong>and</strong> the infant feeding guidelines of the American Academy of Pediatrics.One of the most significant <strong>WIC</strong> revisions was the addition of a fixed-valuevoucher <strong>for</strong> fruits <strong>and</strong> vegetables. 4 Studies have shown that the fruits <strong>and</strong>vegetables Americans eat fall well below the recommended amounts <strong>and</strong>that, as a result, our diets lack important nutrients. This lack is especiallytrue <strong>for</strong> the <strong>WIC</strong>-eligible population, which is “at increased risk of morbidity<strong>and</strong> mortality from virtually every disorder listed among the leading causesof death in the United States (cardiovascular disease, cancer, diabetes, <strong>and</strong>digestive diseases)” (Committee on Dietary Risk Assessment in the <strong>WIC</strong>Program, 2002). <strong>The</strong> increased risk is in part due to low consumption offruits <strong>and</strong> vegetables <strong>and</strong> high consumption of saturated fats. <strong>The</strong> 2005Dietary Guidelines <strong>for</strong> Americans highlight a number of “Food Groupsto Encourage,” including an adequate amount <strong>and</strong> variety of fruits <strong>and</strong>vegetables. <strong>The</strong> Guidelines further recommend specific amounts of somevegetable categories, including those that are dark green, orange, <strong>and</strong> starchy1 <strong>The</strong> quantity <strong>and</strong> type of foodincluded in each package depend on thedietary needs of the four groups that areserved by <strong>WIC</strong>: infants, children ages1-4, pregnant women, <strong>and</strong> breastfeedingmothers.2 All State agencies currently setthe income eligibility cutoff at themaximum, 185 percent of the Federalpoverty limit.3 For example, the Federal requirements<strong>for</strong> all food packages allowparticipants to purchase 1 dozeneggs. In Cali<strong>for</strong>nia, however, browneggs, powdered or liquid eggs, <strong>and</strong>specialty eggs, such as organic, cagefreeor enriched, are excluded (U.S.Department of Agriculture, 2010;Cali<strong>for</strong>nia Department of PublicHealth, 2010).4 <strong>The</strong> monthly voucher amountdepends on participant characteristics;children receive $6 per month <strong>and</strong> allwomen receive $10 per month. (<strong>The</strong>sewere the figures as of April 2011.<strong>WIC</strong> hopes to increase the voucher <strong>for</strong>children to $8, as recommended by theIOM Committee to Review the <strong>WIC</strong>Food Packages (2006).)1<strong>The</strong> <strong>WIC</strong> <strong>Fruit</strong> <strong>and</strong> <strong>Vegetable</strong> <strong>Cash</strong> <strong>Voucher</strong>: Does Regional Price Variation Affect Buying Power? / EIB-75Economic Research Service/USDA
(U.S. Department of Health <strong>and</strong> Human Services <strong>and</strong> U.S. Department ofAgriculture, 2005).Two studies conducted by the USDA Center <strong>for</strong> Nutrition Policy <strong>and</strong>Promotion show that American consumption of whole fruits <strong>and</strong> of vegetablesis substantially below recommended amounts <strong>and</strong> that dark green <strong>and</strong> orangevegetables are among the important food categories in which Americansare most deficient (Guenther et al., 2008a, 2008b). Low-income individuals,in particular, consume significantly fewer vegetables, including dark green<strong>and</strong> orange varieties, than high-income individuals (Guenther et al., 2008b).Furthermore, a study by the Committee to Review the <strong>WIC</strong> Food Packages(2006) of the Institute of Medicine (IOM) found that priority targets wereincreased consumption of iron, vitamin E, potassium, <strong>and</strong> fiber <strong>and</strong> that fruit<strong>and</strong> vegetables should be included in the food packages to this end. 5Following the IOM Committee recommendations, the <strong>WIC</strong> food packageswere revised in 2007, <strong>and</strong> State agencies were required to implementthe new fruit <strong>and</strong> vegetable vouchers by October 2009 (U.S. Department ofAgriculture, 2007). <strong>The</strong> vouchers may be redeemed <strong>for</strong> any fruits or vegetablesexcept white potatoes <strong>and</strong> canned or frozen fruits <strong>and</strong> vegetables withadded sugar, sodium, or other ingredients with little nutritional value otherthan additives necessary <strong>for</strong> preservation. <strong>The</strong> vouchers are accepted at any<strong>WIC</strong>-authorized retailers, including some farmers’ markets. <strong>The</strong> primarygoal of the voucher is to increase fruit <strong>and</strong> vegetable intake among participantsin order to reduce the risk of disease, help decrease the prevalence ofobesity, improve nutrition through increased vitamin <strong>and</strong> mineral consumption,<strong>and</strong> encourage healthy long-term eating habits among children.Another goal of the voucher is to encourage participants to purchase anarray of fruits <strong>and</strong> vegetables in various <strong>for</strong>ms (fresh, canned, <strong>and</strong> frozen)(Committee to Review the <strong>WIC</strong> Food Packages, 2006). <strong>The</strong> reviewingcommittee recommended a fixed-value voucher rather than the quantityvoucher supplied in other Federal food packages in order to help containUSDA costs. <strong>WIC</strong> State agencies have some freedom in administering thefruit <strong>and</strong> vegetable vouchers, but all participants within a given categoryreceive the same dollar value in their vouchers. However, this fixed valuemay lead to large variations in quantities consumed <strong>and</strong> nutritional benefitsgained. One potential driver of these differences is variation in retail foodprices across the country.<strong>The</strong> Committee to Review the <strong>WIC</strong> Food Packages estimated that the $8 <strong>and</strong>$10 vouchers they recommended would provide approximately 9.76 poundsof fresh fruits <strong>and</strong> 12.2 pounds of vegetables. <strong>The</strong> committee report specifiesthat the intention is to provide this quantity of fruits <strong>and</strong> vegetables <strong>and</strong> thatthe value of the voucher “may need to be adjusted upward to account <strong>for</strong> localprices in some State agencies” (2006) to ensure that participants can purchasethe target amount.To evaluate the need <strong>for</strong> adjustment, the study authors analyze the potentialimpact of the new <strong>WIC</strong> cash vouchers <strong>for</strong> fruits <strong>and</strong> vegetables, using2004-06 household-level data that include all purchases of fruits <strong>and</strong> vegetables,in order to estimate how much can be purchased with the currentvoucher <strong>and</strong> how much this quantity varies across the United States. 6 We5 <strong>The</strong> committee was given the task ofevaluating the <strong>WIC</strong> food packages <strong>and</strong>suggesting changes. While the focuswas on improving health outcomesamong <strong>WIC</strong> participants, the committeewas also asked to ensure that theirsuggestions were culturally appropriate,cost-neutral, <strong>and</strong> efficient <strong>for</strong> nationwidedistribution <strong>and</strong> vendor checkout<strong>and</strong> would minimize administrativeburdens. <strong>The</strong>re<strong>for</strong>e, the study’s recommendedchanges allow individualsthe freedom to purchase fruits <strong>and</strong>vegetables according to their own preferencesthrough cash vouchers, whilemaintaining a system that is simple <strong>for</strong>vendors <strong>and</strong> is efficient <strong>for</strong> nationwidedistribution.6 Nielsen Homescan data after 2006no longer included detailed in<strong>for</strong>mationon produce that does not have auniversal product code, so more recentyears would not provide the neededlevel of detail to conduct this analysis.Although we lack current data, thetrends in relative prices across marketshas remained relatively stable over thepast 20 years, <strong>and</strong> we are confident thatthe results from 2004-06 data would beconsistent with the cross-market trends<strong>for</strong> more recent years.2<strong>The</strong> <strong>WIC</strong> <strong>Fruit</strong> <strong>and</strong> <strong>Vegetable</strong> <strong>Cash</strong> <strong>Voucher</strong>: Does Regional Price Variation Affect Buying Power? / EIB-75Economic Research Service/USDA
compare the most commonly purchased fruits <strong>and</strong> vegetables across metroareas in order to reflect consumers’ actual purchasing behavior <strong>and</strong> thechoices that are available to them. We find that average prices vary greatly <strong>for</strong>these common fruits <strong>and</strong> vegetables, allowing <strong>WIC</strong> participants to purchasedifferent amounts depending on where they live. We also find that this metrolevelvariation in the buying power of the vouchers is greater than State- orregional-level variation.Previous Studies on <strong>Fruit</strong> <strong>and</strong> <strong>Vegetable</strong> Price VariationA number of studies have examined fruit <strong>and</strong> vegetable prices <strong>and</strong> expendituresby low-income households <strong>and</strong> regional food price variation. Blisard,Stewart, <strong>and</strong> Jolliffe (2004) find that lower income households spend lesson fruits <strong>and</strong> vegetables than do higher income households ($3.59 versus$5.02 per month in 2000), <strong>and</strong> that unlike high-income households, lowincomehouseholds do not increase fruit <strong>and</strong> vegetable purchases when theyreceive small increases in income. Leibtag <strong>and</strong> Kaufman (2003) found that,compared with high-income households, low-income households spend 11.5percent less per pound on vegetables <strong>and</strong> 9.6 percent less per pound on fruitsbecause of economizing practices. <strong>The</strong>se households stretch their food dollarsby purchasing promotional items, a greater portion of private-label or fixedweightitems, <strong>and</strong> lower priced vegetables <strong>and</strong> fruits, such as bananas.Leibtag (2007) showed that food prices vary substantially across the country.<strong>The</strong> prices of a representative basket of food items in the West <strong>and</strong> Eastcensus regions are above the national average by 11 <strong>and</strong> 8 percent, respectively,while the prices of this basket in the South <strong>and</strong> Midwest census regionsare below the national average by 7 <strong>and</strong> 5 percent. In a study on the cost ofState <strong>WIC</strong> packages, Davis <strong>and</strong> Leibtag (2005) found that nearly 80 percentof the variation in cost was due to variation in food prices (as opposed todifferences in how each State administers the program). Some of the differencein food prices was mitigated by differences in caseload composition 7<strong>and</strong> cost-containment practices, so the actual difference in package costs wassometimes less than the difference implied from prices alone. This meansthat, in many cases, States with above-average food prices had more to gainfrom cost-containment practices than States with lower food prices.7 Caseload composition is definedas the distribution of <strong>WIC</strong> participantsby type in a given area (number ofpregnant women, post-partum women,infants, children, etc.).<strong>The</strong>se past studies examined price variation in large geographic areas such asState or census regions. However, such a high level of aggregation obscuresthe variation at the metro level. To address this gap in the literature, Toddet al. (2010) constructed a database of quarterly prices <strong>for</strong> 52 food-at-homecategories in 26 markets, using Nielsen Homescan data. <strong>The</strong>y found that foodprices varied greatly across metropolitan areas of the United States <strong>and</strong> thatthe variation between the lowest <strong>and</strong> highest priced markets could be as muchas three to four times greater than annual food price inflation. For example,the difference between the lowest <strong>and</strong> highest priced markets was 25 percent<strong>for</strong> canned soups <strong>and</strong> sauces <strong>and</strong> more than 100 percent <strong>for</strong> low-fat cheese.Todd et al. also found that some healthier foods are more expensive than theirunhealthy alternatives, but that this varies across markets.Our study builds on previous work by examining metropolitan-level pricevariation <strong>for</strong> individual fruits <strong>and</strong> vegetables at the market level. We quantifythe extent to which specific fruits <strong>and</strong> vegetable prices vary across markets;3<strong>The</strong> <strong>WIC</strong> <strong>Fruit</strong> <strong>and</strong> <strong>Vegetable</strong> <strong>Cash</strong> <strong>Voucher</strong>: Does Regional Price Variation Affect Buying Power? / EIB-75Economic Research Service/USDA
<strong>for</strong> example, how much more expensive are tomatoes in San Francisco than inNashville?Data <strong>and</strong> MethodologyWe use the 2004-06 Nielsen Homescan panel data of households to conductour analysis. (See appendix table A.1 <strong>for</strong> a comparison between NielsenHomescan data <strong>and</strong> Bureau of Labor Statistics average prices.) <strong>The</strong>se data arethe most recent available <strong>for</strong> this type of analysis, because in 2007 Nielsendiscontinued the collection of detailed data on non-universal product codedfruits <strong>and</strong> vegetables priced by the pound (“r<strong>and</strong>om weight”). <strong>The</strong> Nielsenpopulation universe is all non-grouped households (i.e., excluding institutionsor dorms) in the 48 continental States, in 52 metro areas that roughlycorrespond to the Census Bureau’s Metropolitan Statistical Areas (MSAs),<strong>and</strong> in 9 remaining non-metro areas. Due to limited sample size, we combinethe 52 metro markets into 26 aggregate market groups (see table 1 <strong>for</strong> the listof Nielsen markets in the aggregate groups). 8 Households record all of theirpurchases at a wide variety of stores, including traditional food retailers suchas grocery stores, nontraditional food retailers such as warehouse club stores<strong>and</strong> supercenters, <strong>and</strong> farmers’ markets.Nielsen Homescan data contain in<strong>for</strong>mation on food purchases <strong>and</strong> householdcharacteristics. Demographic in<strong>for</strong>mation collected from each participatinghousehold includes income range, household size <strong>and</strong> composition,<strong>and</strong> in<strong>for</strong>mation about household heads. Each household confirms or updatesthis in<strong>for</strong>mation in response to an annual survey. Householders who agree torecord all their food-related purchases are given a h<strong>and</strong>held scanner, whichthey use to enter in<strong>for</strong>mation about each purchase as they are unloadingtheir groceries at home. For items with a UPC code, data are automaticallyrecorded on such attributes as br<strong>and</strong> name, size <strong>and</strong> type of container, <strong>and</strong>specific flavor, <strong>for</strong>m, <strong>and</strong> type of the item. <strong>The</strong>se data are not collected <strong>for</strong>non-UPC items, such as fresh fruits <strong>and</strong> vegetables priced by the pound(“r<strong>and</strong>om weight” items). For scanned UPC items purchased from storesin Nielsen’s Scantrack database, the price is electronically imputed on aweekly basis as a weighted average of prices paid by all consumers, includingdiscounts from loyalty cards. Prices <strong>for</strong> items not in Scantrack are recordedby the household <strong>and</strong> are quality checked by comparing them with pricesof similar items purchased elsewhere. 9 In addition to price, in<strong>for</strong>mationsupplied by the household includes the type of store from which the item waspurchased (grocery store, warehouse club, convenience store, etc.) <strong>and</strong> thepurchase date. <strong>The</strong> household also records whether the item was on sale <strong>and</strong>whether coupons were used, which affect the final price of the item.8 For more in<strong>for</strong>mation on the aggregationof markets to market groups, seeTodd et al., 2010.9 For more details on the impact ofthis two-tiered price reporting system,see Einav et al., 2008.<strong>The</strong> Nielsen Homescan data consist of two samples: the total sample ofapproximately 40,000 households that record purchases of UPC items, <strong>and</strong>the smaller Fresh Foods Panel of approximately 8,000 households that recordpurchases of both UPC items <strong>and</strong> r<strong>and</strong>om weight items. Nielsen provides aseparate household weight <strong>for</strong> each sample based on 12 geographic areas <strong>and</strong>9 demographic variables in order to raise household data to the aggregateU.S. level (Muth et al., 2007). To compute one price <strong>for</strong> all <strong>for</strong>ms of a fruit orvegetable (canned, frozen, fresh UPC, <strong>and</strong> fresh r<strong>and</strong>om weight), we combinethe two samples by calculating an expenditure-share-weighted average priceof each <strong>for</strong>m.4<strong>The</strong> <strong>WIC</strong> <strong>Fruit</strong> <strong>and</strong> <strong>Vegetable</strong> <strong>Cash</strong> <strong>Voucher</strong>: Does Regional Price Variation Affect Buying Power? / EIB-75Economic Research Service/USDA
Table 1Aggregated market group <strong>and</strong> Nielsen marketsAggregate market groupHart<strong>for</strong>d-New HavenBostonUrban New York CityWestern NY/PAPhiladelphiaOther New YorkMetro Midwest 1ChicagoMetro OhioMetro Midwest 2North FloridaMetro South 1BaltimoreSouth FloridaAtlantaWashington, DCMetro South 2Metro South 3San AntonioMetro South 4Metro MountainSalt Lake CityNielsen markets included in the aggregate market groupHart<strong>for</strong>d-New Haven, CTBostonUrban New York CityPittsburgh, Buffalo, Albany, SyracusePhiladelphiaSuburban New York City, Exurban New YorkIndianapolis, Detroit, Milwaukee, Gr<strong>and</strong> RapidsChicagoCincinnati, Clevel<strong>and</strong>, ColumbusKansas City, Minneapolis, St. Louis, Des Moines, OmahaJacksonville, Orl<strong>and</strong>oRaleigh-Durham, Charlotte, RichmondBaltimoreMiami, TampaAtlantaWashington, DCNashville, Birmingham, Memphis, LouisvilleLittle Rock, Oklahoma City-TulsaSan AntonioHouston, Dallas, New OrleansDenver, PhoenixSalt Lake CityMetro Cali<strong>for</strong>niaLos AngelesMetro NorthwestSan FranciscoSan Diego, SacramentoLos AngelesSeattle, Portl<strong>and</strong>San FranciscoSource: In<strong>for</strong>mation reprinted from table 4 of Todd et al., 2010, p. 12.We calculate the aggregate mean price per pound 10 in each market <strong>for</strong>an individual fruit or vegetable, averaged across the <strong>for</strong>m of processing(canned, frozen, fresh UPC, <strong>and</strong> fresh r<strong>and</strong>om weight), season, <strong>and</strong> year. 11We compare individual items across regions rather than comparing a basketof preselected fruits <strong>and</strong> vegetables, because <strong>WIC</strong> participants are able tochoose among different fruits <strong>and</strong> vegetables <strong>and</strong> evidence suggests thatthey will purchase a wide variety with their vouchers (Committee to Reviewthe <strong>WIC</strong> Food Packages, 2006). Comparing individual items frees us fromhaving to make specific assumptions about consumer behavior in different10 Note that focusing on purchaseprices as opposed to costs of consumption(accounting <strong>for</strong> inedible waste suchas peelings <strong>and</strong> calculating a price perserving) would only affect our results ifthese adjustments were to vary withina fruit type across markets. Since wedo not believe this to be the case, weproceed with a presentation of purchaseprices that reflect differences in effectivepurchasing power of the voucher.11 Some items, such as heads oficeberg lettuce, are measured bycount, not ounces or pounds. <strong>The</strong>seitems are converted to pounds usingthe average weight of a medium-sizeditem, based on the USDA St<strong>and</strong>ardNational Nutrient Database <strong>for</strong>St<strong>and</strong>ard Reference (U.S. Departmentof Agriculture, 2009).5<strong>The</strong> <strong>WIC</strong> <strong>Fruit</strong> <strong>and</strong> <strong>Vegetable</strong> <strong>Cash</strong> <strong>Voucher</strong>: Does Regional Price Variation Affect Buying Power? / EIB-75Economic Research Service/USDA
markets or about nutritional content of specific fruits <strong>and</strong> vegetables ordifferent <strong>for</strong>ms (canned, frozen, or fresh).For our comparison, we selected the 10 fruits <strong>and</strong> 10 vegetables <strong>for</strong> whichthe highest quantities were purchased by Nielsen households between 2004<strong>and</strong> 2006. We investigated the following vegetables (in order of highest tolowest aggregate quantity purchased by all Nielsen households): tomatoes,onions, lettuce, green beans, corn, carrots, broccoli, cucumbers, peppers,<strong>and</strong> cabbage. We also investigated the following fruits (in order of highestto lowest amount purchased): bananas, apples, watermelons, oranges,grapes, strawberries, peaches, pineapples, pears, <strong>and</strong> grapefruit. <strong>The</strong>se 20items represent approximately 77 percent of all fruit <strong>and</strong> vegetable quantitiespurchased. This list would be similar if we selected the 10 fruits <strong>and</strong>10 vegetables with the highest expenditures rather than the most purchases,except that the vegetable expenditure list would include mushrooms insteadof cabbage, <strong>and</strong> the fruit expenditure list would include cherries instead ofgrapefruit.<strong>The</strong> mean market price <strong>for</strong> each item is calculated in two stages. <strong>The</strong> firststage determines the seasonal price, which is an expenditure-share-weightedaverage price of the <strong>for</strong>m of processing, according to equation 1. <strong>The</strong> secondstage is the average across seasons <strong>and</strong> years:∑∑∑∑∑( )(1)<strong>The</strong> subscripts index the following:• c = purchase• h = household• i = individual fruit or vegetable• f = <strong>for</strong>m• m = market• s = season• y = year._Ρmisy is the mean price in each market (m) <strong>for</strong> each item (i, fruit or vegetable)by season (s) by year (y); E isyfhc is the household (h) expenditure <strong>for</strong> a givenpurchase (c) of a <strong>for</strong>m of an item (f) in a given season <strong>and</strong> year; L isyfhc is thetotal number of pounds <strong>for</strong> this household purchase of a <strong>for</strong>m of an item in agiven season <strong>and</strong> year; <strong>and</strong> W his the household aggregation weight (projectionfactor) developed by Nielsen.<strong>The</strong> first fraction in equation 1 is the market-level mean price per pound <strong>for</strong>each <strong>for</strong>m of processing of each fruit <strong>and</strong> vegetable by season <strong>and</strong> year. <strong>The</strong>price each household paid <strong>for</strong> each <strong>for</strong>m of processing of each fruit <strong>and</strong> vegetableis calculated by dividing the sum of all expenditures on each purchaseby the sum of all pounds in each purchase in each season of each year. To6<strong>The</strong> <strong>WIC</strong> <strong>Fruit</strong> <strong>and</strong> <strong>Vegetable</strong> <strong>Cash</strong> <strong>Voucher</strong>: Does Regional Price Variation Affect Buying Power? / EIB-75Economic Research Service/USDA
aggregate to the market level, a weighted mean price per pound is calculatedusing the household aggregation weights developed by Nielsen.<strong>The</strong> second fraction in equation 1 is the average market expenditure share onthe different <strong>for</strong>ms of fruits <strong>and</strong> vegetables by households in the Fresh FoodsPanel. This share is calculated as the weighted sum of each household’sexpenditures on all <strong>for</strong>ms of processing divided by the total weighted sumof each household’s expenditures on that fruit or vegetable. <strong>The</strong> total meanmarket price of each fruit <strong>and</strong> vegetable by season by year is the sum of themarket prices of the four <strong>for</strong>ms of each fruit <strong>and</strong> vegetable multiplied by theirexpenditure shares. We report the comparison of mean market prices as asimple average of these prices across years <strong>and</strong> seasons.To determine which markets are more or less expensive, we create a quantityweightedprice index to rank each item, with the national average as the base.<strong>The</strong> quantity weight is the national share of aggregate pounds of each item, i,purchased out of all 20 items,(2)where L ihc is the total number of pounds of an item that a householdpurchased (in this case it refers to all purchases of that item, including all<strong>for</strong>ms, all seasons, <strong>and</strong> all 3 years from 2004 to 2006), <strong>and</strong> W his the householdaggregation weight (projection factor) developed by Nielsen. <strong>The</strong> indexranking R m is calculated according to equation 3,∑∑∑20(3)where m refers to the market; Q iis the national share of aggregate pounds ofeach item, i, purchased out of all 20 items according to equation 2; <strong>and</strong> P im isthe average price of each item in each market from equation 1.To create the index, we calculate one national quantity share <strong>for</strong> each of the20 items (equation 2) in order to compare the same combination of itemsacross markets, <strong>and</strong> then we multiply the national quantity share <strong>for</strong> each itemby the price of that item in each market. We sum these products across itemsto obtain a quantity-weighted average price <strong>for</strong> each market (the numeratorin equation 3). <strong>The</strong> base is the quantity-weighted average price, calculatedusing national average prices <strong>for</strong> each item (the denominator in equation 3).Thus, the index <strong>for</strong> each market is the quantity-weighted average market pricedivided by the national quantity-weighted average price, times 100.ResultsRegional Price VariationWe found a large amount of variation in the average price paid (per pound)in many markets across the United States (table 2). Most fruit <strong>and</strong> vegetableprices were 30 to 70 percent higher in the most expensive market than in thelowest priced market. <strong>The</strong> price spread across market areas <strong>for</strong> vegetables7<strong>The</strong> <strong>WIC</strong> <strong>Fruit</strong> <strong>and</strong> <strong>Vegetable</strong> <strong>Cash</strong> <strong>Voucher</strong>: Does Regional Price Variation Affect Buying Power? / EIB-75Economic Research Service/USDA
anged from 30 percent to 120 percent <strong>for</strong> lettuce <strong>and</strong> green beans, respectively,while fruit price variation ranged from 26 to 140 percent betweenth lowest <strong>and</strong> highest priced markets <strong>for</strong> pears <strong>and</strong> watermelon. In overallcomparison with the national average, we found that on average fruits <strong>and</strong>vegetables were 20 percent lower in the least expensive market <strong>and</strong> 25 percenthigher in the most expensive market. For example, green bean prices were 38percent less than the national average in the lowest priced market, <strong>and</strong> watermelonswere 43 percent less than the national average price in their lowestmarket. Pepper prices, on the other h<strong>and</strong>, were 37 percent higher than thenational average price in their most expensive market, <strong>and</strong> orange prices were47 percent higher than the national average in their most expensive market.Some general patterns emerged with respect to which items <strong>and</strong> markets werecheaper or more expensive across the country. Peppers <strong>and</strong> tomatoes wereTable 2Market prices <strong>for</strong> the 20 most popular fruits <strong>and</strong> vegetables, with the deviation of their minimum <strong>and</strong>maximum prices from national average, 2004-2006<strong>Vegetable</strong>s<strong>and</strong> fruitsNational averageof market pricesper lbMinimummarket priceper lbMaximummarket priceper lbDifference fromminimum tomaximumDifference fromnational averageto minimumDifference fromnational averageto maximumDollarsPercentTomatoes 1.66 1.42 1.98 39 -15 19Onions 1.33 0.95 1.68 77 -29 26Lettuce 1.01 0.89 1.17 30 -11 16Green beans 0.96 0.59 1.31 12 -38 36Corn 0.89 0.74 1.11 50 -17 25Carrots 1.18 0.99 1.38 39 -16 17Broccoli 1.34 1.10 1.61 46 -18 20Cucumbers 1.02 0.81 1.33 64 -21 30Peppers 1.72 1.18 2.35 100 -32 37Cabbage 0.52 0.42 0.70 68 -20 34Bananas 0.49 0.40 0.62 55 -19 26Apples 1.10 0.98 1.24 27 -12 12Watermelon 0.87 0.49 1.19 140 -43 37Oranges 0.85 0.72 1.25 73 -15 47Grapes 1.51 1.31 1.70 30 -14 12Strawberries 2.41 2.15 2.86 33 -11 19Peaches 1.13 0.95 1.40 47 -15 25Pineapples 1.29 0.99 1.63 65 -23 26Pears 1.06 0.94 1.18 26 -11 12Grapefruit 0.98 0.78 1.24 60 -21 27Note: All minimum <strong>and</strong> maximum prices are signifi cantly different from the national average at the 5-percent level. Prices are in current dollars.Source: Authors’ calculations using Nielsen Homescan data.8<strong>The</strong> <strong>WIC</strong> <strong>Fruit</strong> <strong>and</strong> <strong>Vegetable</strong> <strong>Cash</strong> <strong>Voucher</strong>: Does Regional Price Variation Affect Buying Power? / EIB-75Economic Research Service/USDA
usually the most expensive per pound of the 10 most popular vegetables ineach of the 26 markets. Onions <strong>and</strong> broccoli were next, followed by carrots<strong>and</strong> then by cucumbers, lettuce, green beans, <strong>and</strong> corn, while cabbage was byfar the cheapest vegetable in all 26 markets. Among the 10 fruits analyzed,strawberries were by far the most expensive. Grapes were next, followed bypineapples, peaches, apples, pears, grapefruit, watermelon, <strong>and</strong> oranges, inroughly that order. Bananas were the cheapest fruit in all 26 markets. 12 (Seeappendix table A.2 <strong>for</strong> comparison of mean prices of different <strong>for</strong>ms of allvegetables <strong>and</strong> all fruits.)<strong>The</strong> lowest priced market was the Metro South 2 market group (Nashville,Birmingham, Memphis, <strong>and</strong> Louisville), followed by Metro Ohio (Cincinnati,Clevel<strong>and</strong>, <strong>and</strong> Columbus) <strong>and</strong> Salt Lake City. San Francisco had the highestprices, followed by Hart<strong>for</strong>d-New Haven <strong>and</strong> Washington, DC. Prices inthe Metro South 2 were 9.2 percent lower than the national average, whileprices in the highest priced market, San Francisco, were 13.9 percent higherthan the national average, a spread of 23.1 percentage points between theleast <strong>and</strong> most expensive markets. (See table 3 <strong>for</strong> a full list of rankings.)Other markets that fall in the bottom quintile of prices include the MetroSouth 3 market group (Little Rock, Oklahoma City, <strong>and</strong> Tulsa) <strong>and</strong> the MetroMountain market group (Denver <strong>and</strong> Phoenix). Additional markets in the topquintile with San Francisco include Baltimore <strong>and</strong> the South Florida marketgroup (Miami <strong>and</strong> Tampa). This index ranking, which is based on whatconsumers actually purchased, indicates that although participants may beable to substitute among certain fruits <strong>and</strong> vegetables, substantial price variationremains across markets.12 In this study, we calculate pricesbased on total pounds purchased. Thatis, we do not address the number ofservings or the portion of the fruits <strong>and</strong>vegetables that can be consumed. Foran analysis of this issue, see Stewart etal. (2011).Price Variation <strong>and</strong> <strong>WIC</strong><strong>The</strong> substantial price differences between markets imply that the same-valuevoucher allows <strong>WIC</strong> participants to purchase substantially different amountsof fruits <strong>and</strong> vegetables depending on where they live. Using data from 1999,the Committee to Review the <strong>WIC</strong> Food Packages (2006) estimated that withthe monthly $8 <strong>and</strong> $10 vouchers, participants would be able to purchase 10<strong>and</strong> 12 pounds of fresh fruits <strong>and</strong> vegetables per month, respectively, correspondingto roughly 1 or 2 servings a day. 13 When we examine the nationalaverage prices of the 20 most commonly purchased fruits <strong>and</strong> vegetablesbetween 2004-06, however, we find that participants would be unable tostretch their vouchers this far unless they purchased only the cheapest fruits<strong>and</strong> vegetables. 14 Participants in markets with prices higher than the nationalaverage will have an even more difficult time purchasing 10-12 pounds offruits <strong>and</strong> vegetables per month, while those buying in markets with lowerthan average prices may be able to purchase more fruits <strong>and</strong> vegetables thanthe amount recommended (table 4, discussed in detail below).Green beans display one of the most dramatic differences between thehighest <strong>and</strong> lowest priced markets. <strong>The</strong>y are 36 percent cheaper in the lowestpriced market (Metro South 3—Little Rock, Oklahoma City, <strong>and</strong> Tulsa) thanthe national average <strong>and</strong> 38 percent more expensive in the highest pricedmarket (San Francisco). This difference translates to 37 cents per pound lessin Little Rock, Oklahoma City, <strong>and</strong> Tulsa <strong>and</strong> 35 cents per pound more in SanFrancisco. While these differences may seem relatively small, the nationalaverage <strong>for</strong> 1 pound of green beans is 96 cents. With a fixed-value voucher13 As mentioned above, the committee’sreport also suggests that thevoucher be adjusted upward in Stateswhere local prices prevent participantsfrom purchasing this amount with the$8 <strong>and</strong> $10 vouchers the committeerecommends.14 Our results are based on theaverage prices <strong>for</strong> all <strong>for</strong>ms of fruits<strong>and</strong> vegetables (fresh, canned, <strong>and</strong>frozen) since the national guidelines <strong>for</strong>the voucher allow all <strong>for</strong>ms. For mostof the items we examined, the cannedversion is the cheapest, followed byfresh r<strong>and</strong>om weight, then frozen, <strong>and</strong>finally UPC fresh items (see appendix.table 2).<strong>The</strong>re<strong>for</strong>e, the mean market price ofonly fresh items is the same or higher<strong>for</strong> all items (except onions) whencanned <strong>and</strong> frozen prices are excluded.9<strong>The</strong> <strong>WIC</strong> <strong>Fruit</strong> <strong>and</strong> <strong>Vegetable</strong> <strong>Cash</strong> <strong>Voucher</strong>: Does Regional Price Variation Affect Buying Power? / EIB-75Economic Research Service/USDA
Table 3Index ranking of markets from lowest to highest priced <strong>for</strong> the 20fruits <strong>and</strong> vegetables most frequently purchased by U.S. households,2004-06Aggregate market groupIndex rankingMetro South 2 90.8Metro Ohio 91.9Salt Lake City 92.2Metro Mountain 92.8Metro South 3 93.8San Antonio 93.8Metro Midwest 1 95.0Chicago 95.3Metro South 4 95.4Urban New York City 96.3Metro Midwest 2 96.4Los Angeles 97.4Western NY/PA 98.1Metro Northwest 99.9National average 100.0Atlanta 101.1Metro Cali<strong>for</strong>nia 101.7Mid-Atlantic 102.2Other New York City 103.4Boston 103.8Philadelphia 103.9North Florida 104.4South Florida 104.7Baltimore 108.8Washington, DC 110.9Hart<strong>for</strong>d-New Haven 111.9San Francisco 113.9Source: Authors’ calculations using Nielsen Homescan data.of $10, a <strong>WIC</strong> mother could hypothetically purchase 10.4 pounds of greenbeans each month at national average prices. However, she would be able topurchase 16.8 pounds of green beans if she were living in Little Rock, butonly 7.6 pounds if she were living in San Francisco.Tomato prices, on the other h<strong>and</strong>, display the least variation across markets. 15<strong>The</strong> national average price <strong>for</strong> 1 pound of tomatoes is $1.66. <strong>The</strong>y are15 Only lettuce has a smaller pricespread of 30 percent.10<strong>The</strong> <strong>WIC</strong> <strong>Fruit</strong> <strong>and</strong> <strong>Vegetable</strong> <strong>Cash</strong> <strong>Voucher</strong>: Does Regional Price Variation Affect Buying Power? / EIB-75Economic Research Service/USDA
Table 4Buying power of vouchers <strong>for</strong> fruit <strong>and</strong> vegetables in different markets, by weight<strong>Vegetable</strong>s <strong>and</strong>fruitsNationalaverage$6 voucher $10 voucherMarket withminimum pricePoundsMarket withmaximum priceNationalaveragecheapest in the Metro South 2 market (Nashville, Birmingham, Memphis,<strong>and</strong> Louisville) at $1.42, <strong>and</strong> they are the most expensive in San Franciscoat $1.98. A <strong>WIC</strong> mother could purchase 6 pounds of tomatoes each month,based on national average prices. She would be able to purchase 7 poundsof tomatoes if she were living in Nashville, but only 5.1 pounds in SanFrancisco.Market withminimum pricePoundsMarket withmaximum priceTomatoes 3.6 4.2 3.0 6.0 7.0 5.1Onions 4.5 6.3 3.6 7.5 10.5 6.0Lettuce 6.0 6.7 5.1 9.9 11.2 8.6Green beans 6.2 10.1 4.6 10.4 16.8 7.6Corn 6.7 8.1 5.4 11.2 13.4 9.0Carrots 5.1 6.0 4.4 8.5 10.1 7.3Broccoli 4.5 5.5 3.7 7.5 9.1 6.2Cucumbers 5.9 7.4 4.5 9.8 12.4 7.5Peppers 3.5 5.1 2.6 5.8 8.5 4.3Cabbage 11.5 14.4 8.5 19.1 24.0 14.2Bananas 12.3 15.1 9.7 20.4 25.1 16.2Apples 5.4 6.2 4.8 9.1 10.3 8.1Watermelon 6.9 12.1 5.1 11.5 20.2 8.4Oranges 7.1 8.3 4.8 11.8 13.9 8.0Grapes 4.0 4.6 3.5 6.6 7.7 5.9Strawberries 2.5 2.8 2.1 4.2 4.6 3.5Peaches 5.3 6.3 4.3 8.9 10.5 7.1Pineapples 4.6 6.1 3.7 7.7 10.1 6.1Pears 5.7 6.4 5.1 9.5 10.6 8.4Grapefruit 6.1 7.7 4.8 10.2 12.9 8.1Source: Authors’ calculations using Nielsen Homescan data.Comparing fruit prices in a similar way, we find that watermelons have thelargest price spread between the least <strong>and</strong> most expensive markets at 140percent. <strong>The</strong>y cost 87 cents per pound on average, but they cost 49 centsin the Metro Cali<strong>for</strong>nia market (San Diego <strong>and</strong> Sacramento) <strong>and</strong> $1.19 inBaltimore. Again, a <strong>WIC</strong> mother could use her $10 voucher to purchase 11.5pounds of watermelons at national average prices, but she would be able tobuy 20.2 pounds in San Diego <strong>and</strong> only 8.4 pounds in Baltimore. Apples, oneof the most popular fruits in our sample, have a price spread of 27 percent<strong>and</strong> cost $1.10 per pound on average. 16 Apples are cheapest in the Metro Ohio16 Only pears have a smaller pricespread at 26 percent.11<strong>The</strong> <strong>WIC</strong> <strong>Fruit</strong> <strong>and</strong> <strong>Vegetable</strong> <strong>Cash</strong> <strong>Voucher</strong>: Does Regional Price Variation Affect Buying Power? / EIB-75Economic Research Service/USDA
market (Cincinnati, Clevel<strong>and</strong>, <strong>and</strong> Columbus) at 98 cents, <strong>and</strong> they are mostexpensive in San Francisco <strong>and</strong> North Florida (Jacksonville <strong>and</strong> Orl<strong>and</strong>o)at $1.24. A <strong>WIC</strong> mother could buy 9.1 pounds of apples at national averageprices, but would be able to buy 10.3 pounds in Cincinnati <strong>and</strong> only 8.1pounds in Jacksonville.<strong>The</strong>se results indicate that participants in higher priced markets can purchasesubstantially smaller amounts of fruits <strong>and</strong> vegetables, even <strong>for</strong> items thatdisplay modest differences between the highest <strong>and</strong> lowest priced markets.Thus, while the voucher allows substitution between cheaper <strong>and</strong> more expensivefruits <strong>and</strong> vegetables, price variations mean that the <strong>WIC</strong> voucher buyssubstantially smaller amounts of many of the 20 fruits <strong>and</strong> vegetables studiedin some markets than in others.ConclusionRevising the <strong>WIC</strong> packages to include a fixed-value voucher <strong>for</strong> fruits <strong>and</strong>vegetables aims to encourage <strong>WIC</strong> participants to consume more fruits <strong>and</strong>vegetables, potentially decreasing both short- <strong>and</strong> long-term health risksfaced by pregnant <strong>and</strong> postpartum women, infants, <strong>and</strong> children. By examiningaggregate categories of food at the regional level, previous researchhas shown that food prices vary substantially across the country. <strong>The</strong> presentstudy shows that the prices of individual fruits <strong>and</strong> vegetables vary even moreat a more localized level. This price variation implies that <strong>WIC</strong> participantsin higher cost areas cannot purchase as many fruits <strong>and</strong> vegetables with theirfixed-value voucher as participants in lower priced areas, which could leadto differences in the nutritional benefits that the voucher is intended to makeavailable <strong>for</strong> <strong>WIC</strong> participants.12<strong>The</strong> <strong>WIC</strong> <strong>Fruit</strong> <strong>and</strong> <strong>Vegetable</strong> <strong>Cash</strong> <strong>Voucher</strong>: Does Regional Price Variation Affect Buying Power? / EIB-75Economic Research Service/USDA
ReferencesBlisard, Noel, Hayden Stewart, <strong>and</strong> Dean Jolliffe (2004). Low-IncomeHouseholds’ Expenditures on <strong>Fruit</strong>s <strong>and</strong> <strong>Vegetable</strong>s. AgriculturalEconomic Report Number 833, U.S. Department of Agriculture,Economic Research Service, May. http://www.ers.usda.gov/Briefing/FoodNutritionAssistance/ResearchFindings/.Cali<strong>for</strong>nia Department of Public Health, Cali<strong>for</strong>nia <strong>WIC</strong> Program(2010). “<strong>WIC</strong> Authorized Food List Shopping Guide.” April 5, 2010.Available at www.cdph.ca.gov/programs/wicworks/<strong>WIC</strong>%20Foods/<strong>WIC</strong>AuthorizedFoodListShoppinGuide-4-2010.pdf.Davis, David E., <strong>and</strong> Ephraim S. Leibtag (2005). Interstate Variation in <strong>WIC</strong>Food Package Costs: <strong>The</strong> Role of Food Prices, Caseload Composition,<strong>and</strong> Cost-Containment Practices. Food Assistance <strong>and</strong> Nutrition ResearchReport No. 41, U.S. Department of Agriculture, Economic ResearchService, January. http://www.ers.usda.gov/Briefing/FoodNutritionAssistance/2005FinalReport.pdf.Einav, Liran, Ephraim Leibtag, <strong>and</strong> Aviv Nevo (2008). On <strong>The</strong> Accuracyof Nielsen Homescan Data. U.S. Department of Agriculture, EconomicResearch Report 69, Economic Research Service, November. http://www.ers.usda.gov/Publications/ERR69/ERR69fm.pdf.Guenther, Patricia M., WenYen Juan, Jill Reedy, Patricia Britten, Mark Lino,Andrea Carlson, Hazel H. Hiza, <strong>and</strong> Susan M. Krebs-Smith (2008a).Diet Quality of Americans in 1995-1996 <strong>and</strong> 2001-2002 as Measuredby the Healthy Eating Index. Nutrition Insight 37, U.S. Department ofAgriculture, Center <strong>for</strong> Nutrition Policy <strong>and</strong> Promotion, August.Guenther, Patricia M., WenYen Juan, Mark Lino, Hazel A. Hiza, ThomasFungwe, <strong>and</strong> Richard Lucas (2008b). Diet Quality of Low-Income <strong>and</strong>Higher Income Americans in 2003-04 as Measured by the Healthy EatingIndex-2005. Nutrition Insight 42, U.S. Department of Agriculture, Center<strong>for</strong> Nutrition Policy <strong>and</strong> Promotion, December.Committee on Dietary Risk Assessment in the <strong>WIC</strong> Program, Food <strong>and</strong>Nutrition Board (2002). Dietary Risk Assessment in the <strong>WIC</strong> Program.Institute of Medicine, Washington, DC: <strong>The</strong> National Academies Press.Committee to Review the <strong>WIC</strong> Food Packages, Food <strong>and</strong> Nutrition Board(2006). <strong>WIC</strong> Food Packages: Time <strong>for</strong> a Change. Institute of Medicine,Washington, DC: <strong>The</strong> National Academies Press.Leibtag, Ephraim (2007). Stretching the Food Stamp Dollar: Regional PriceDifferences Affect Af<strong>for</strong>dability of Food. Economic In<strong>for</strong>mation BulletinNo. 29-2, U.S. Department of Agriculture, Economic Research Service,September. http://www.ers.usda.gov/publications/eib29/eib29-2/eib29-2.pdf.13<strong>The</strong> <strong>WIC</strong> <strong>Fruit</strong> <strong>and</strong> <strong>Vegetable</strong> <strong>Cash</strong> <strong>Voucher</strong>: Does Regional Price Variation Affect Buying Power? / EIB-75Economic Research Service/USDA
Leibtag, Ephraim, <strong>and</strong> Phil Kaufman (2003). Exploring Food PurchaseBehavior of Low-Income Households: How Do <strong>The</strong>y Economize? CurrentIssues in Economics of Food Markets, Agriculture In<strong>for</strong>mation BulletinNo. 747-07, U.S. Department of Agriculture, Economic Research Service,June. http://www.ers.usda.gov/publications/aib747/aib74707.pdf.Oliveira, Victor (2009). <strong>The</strong> Food Assistance L<strong>and</strong>scape: FY 2008 AnnualReport. Economic In<strong>for</strong>mation Bulletin No. 6-6, U.S. Department ofAgriculture, Economic Research Service, April. http://www.ers.usda.gov/Publications/EIB6-6/EIB6-6.pdf.Oliveira, Victor, <strong>and</strong> Elizabeth Frazao (2009). <strong>The</strong> <strong>WIC</strong> Program:Background, Trends, <strong>and</strong> Economic Issues, 2009 Edition. EconomicResearch Report No. 73, U.S. Department of Agriculture, EconomicResearch Service, April. http://www.ers.usda.gov/Publications/ERR73/ERR73Fm.pdf.Stewart, Hayden, Jeffery Hyman, Elizabeth Frazão, Jean Buzby, <strong>and</strong>Andi Carlson (2011). “Can Low-Income Americans Af<strong>for</strong>d To SatisfyMyPyramid <strong>Fruit</strong> <strong>and</strong> <strong>Vegetable</strong> Guidelines?” Journal of NutritionEducation <strong>and</strong> Behavior 43 (2011):173-79.Todd, Jessica E., Lisa Mancino, Ephraim Leibtag, <strong>and</strong> Christina Tripodo(2010). Methodology Behind the Quarterly Food-at-Home PriceDatabase. Technical Bulletin No. 1926, U.S. Department of Agriculture,Economic Research Service, April. http://www.ers.usda.gov/Publications/TB1926/TB1926.pdf.U.S. Department of Agriculture, Agricultural Research Service (2009).USDA National Nutrient Database <strong>for</strong> St<strong>and</strong>ard Reference, Release 22.Nutrient Data Laboratory Home Page. http://www.ars.usda.gov/ba/bhnrc/ndl.U.S. Department of Agriculture, Food <strong>and</strong> Nutrition Service, Women,Infants, <strong>and</strong> Children (2010). “<strong>WIC</strong> Food Packages – Maximum MonthlyAllowances.” http://www.fns.usda.gov/wic/benefits<strong>and</strong>services/foodpkgallowances.HTM.U.S. Department of Agriculture, Food <strong>and</strong> Nutrition Service (2007). “SpecialSupplemental Nutrition Program <strong>for</strong> Women, Infants <strong>and</strong> Children (<strong>WIC</strong>):Revisions in the <strong>WIC</strong> Food Packages; Interim Rule.” Federal Register 72(234), U.S. Department of Agriculture, 7 CFR Part 246. http://www.fns.usda.gov/wic/regspublished/wicfoodpkginterimrulepdf.pdf.U.S. Department of Agriculture, Food <strong>and</strong> Nutrition Service (2010). “<strong>WIC</strong>Program Participation <strong>and</strong> Costs.” August 31, 2010. http://www.fns.usda.gov/pd/wisummary.htm.U.S. Department of Health <strong>and</strong> Human Services <strong>and</strong> U.S. Department ofAgriculture (2005). Dietary Guidelines <strong>for</strong> Americans 2005. http://www.healthierus.gov/dietaryguidelines.14<strong>The</strong> <strong>WIC</strong> <strong>Fruit</strong> <strong>and</strong> <strong>Vegetable</strong> <strong>Cash</strong> <strong>Voucher</strong>: Does Regional Price Variation Affect Buying Power? / EIB-75Economic Research Service/USDA
AppendixAppendix table 1Comparison of Nielsen Homescan data; Bureau of Labor Statistics,Average Price Data; <strong>and</strong> Bureau of Labor Statistics, Consumer PriceIndex over time<strong>Vegetable</strong>s <strong>and</strong> <strong>Fruit</strong>sNielsen2004-06BLS2004-06BLS2010CPIchangeDollarsPercentTomatoes 1.66 1.65 1.74 6Lettuce 1.01 0.84 0.85 10Broccoli 1.34 1.32 1.55 15*Cabbage 0.52 0.59 0.62 6Bananas 0.49 0.50 0.58 16Apples 1.10 1.02 1.23 16Oranges 0.85 0.98 1.03 14Grapes 1.51 2.13 2.10 -1*Strawberries 2.41 2.13 2.03 -5*Peaches 1.13 1.55 1.75 12*Pears 1.06 1.14 1.26 9*Grapefruit 0.98 1.01 0.92 13*** BLS does not publish disaggregate CPI <strong>for</strong> these items. <strong>The</strong>se are percentage changes inaverage price from 2004-06 to 2010.** BLS does not publish disaggregate CPI <strong>for</strong> grapefruit. This is the percentage change in CPI<strong>for</strong> citrus fruit.Source: Authors’ calculations using Nielsen Homescan data; Bureau of Labor Statistics,Average Price Data; <strong>and</strong> Bureau of Labor Statistics, Consumer Price Index.Appendix table 2Market prices <strong>for</strong> four <strong>for</strong>ms of fruits <strong>and</strong> vegetables <strong>and</strong> deviation of minimum <strong>and</strong> maximum prices fromnational average, 2004-06ItemNationalaverage of marketprices per lbMinimummarket priceper lbMaximummarket priceper lbPercentpricedifferencePercentdifferencein minimumPercentdifference inmaximumDollars Dollars Percent PercentCanned 1.87 1.55 2.42 56 -17 30VeggiesFrozen 1.48 1.22 1.80 48 -18 22UPC 2.13 1.83 2.50 37 -14 18RW 1.13 0.98 1.34 37 -13 19Canned 1.32 1.16 1.64 42 -12 25<strong>Fruit</strong>UPC 1.53 1.33 1.78 34 -13 17RW 1.35 1.09 1.54 41 -20 14UPC = items marked with a universal product code; RW = raw weight.Source: Authors’ calculations using Nielsen Homescan data.15<strong>The</strong> <strong>WIC</strong> <strong>Fruit</strong> <strong>and</strong> <strong>Vegetable</strong> <strong>Cash</strong> <strong>Voucher</strong>: Does Regional Price Variation Affect Buying Power? / EIB-75Economic Research Service/USDA