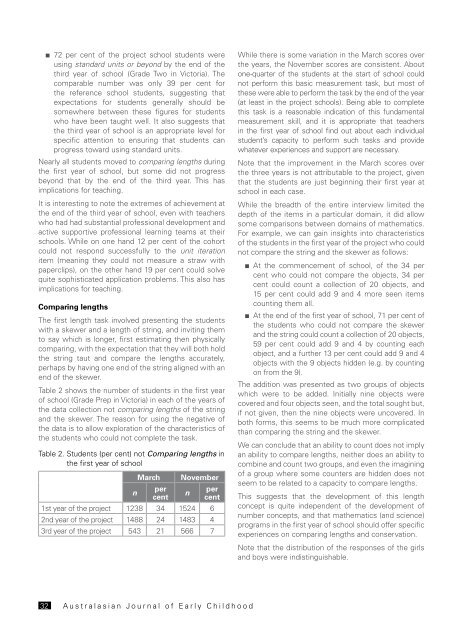
■■72 per cent <strong>of</strong> the project school students wereusing standard units or beyond by the end <strong>of</strong> thethird year <strong>of</strong> school (Grade Two in Victoria). Thecomparable number was only 39 per cent forthe reference school students, suggesting thatexpectations for students generally should besomewhere between these figures for studentswho have been taught well. It also suggests thatthe third year <strong>of</strong> school is an appropriate level forspecific attention to ensuring that students canprogress toward using standard units.Nearly all students moved to comparing lengths duringthe first year <strong>of</strong> school, but some did not progressbeyond that by the end <strong>of</strong> the third year. This hasimplications for teaching.It is interesting to note the extremes <strong>of</strong> achievement atthe end <strong>of</strong> the third year <strong>of</strong> school, even with teacherswho had had substantial pr<strong>of</strong>essional development andactive supportive pr<strong>of</strong>essional learning teams at theirschools. While on one hand 12 per cent <strong>of</strong> the cohortcould not respond successfully to the unit iterationitem (meaning they could not measure a straw withpaperclips), on the other hand 19 per cent could solvequite sophisticated application problems. This also hasimplications for teaching.Comparing lengthsThe first length task involved presenting the studentswith a skewer and a length <strong>of</strong> string, and inviting themto say which is longer, first estimating then physicallycomparing, with the expectation that they will both holdthe string taut and compare the lengths accurately,perhaps by having one end <strong>of</strong> the string aligned with anend <strong>of</strong> the skewer.Table 2 shows the number <strong>of</strong> students in the first year<strong>of</strong> school (Grade Prep in Victoria) in each <strong>of</strong> the years <strong>of</strong>the data collection not comparing lengths <strong>of</strong> the stringand the skewer. The reason for using the negative <strong>of</strong>the data is to allow exploration <strong>of</strong> the characteristics <strong>of</strong>the students who could not complete the task.Table 2. Students (per cent) not Comparing lengths inthe first year <strong>of</strong> schoolMarch Novembernpercentnpercent1st year <strong>of</strong> the project 1238 34 1524 62nd year <strong>of</strong> the project 1488 24 1483 43rd year <strong>of</strong> the project 543 21 566 7While there is some variation in the March scores overthe years, the November scores are consistent. Aboutone-quarter <strong>of</strong> the students at the start <strong>of</strong> school couldnot perform this basic measurement task, but most <strong>of</strong>these were able to perform the task by the end <strong>of</strong> the year(at least in the project schools). Being able to completethis task is a reasonable indication <strong>of</strong> this fundamentalmeasurement skill, and it is appropriate that teachersin the first year <strong>of</strong> school find out about each individualstudent’s capacity to perform such tasks and providewhatever experiences and support are necessary.Note that the improvement in the March scores overthe three years is not attributable to the project, giventhat the students are just beginning their first year atschool in each case.While the breadth <strong>of</strong> the entire interview limited thedepth <strong>of</strong> the items in a particular domain, it did allowsome comparisons between domains <strong>of</strong> mathematics.For example, we can gain insights into characteristics<strong>of</strong> the students in the first year <strong>of</strong> the project who couldnot compare the string and the skewer as follows:■■At the commencement <strong>of</strong> school, <strong>of</strong> the 34 percent who could not compare the objects, 34 percent could count a collection <strong>of</strong> 20 objects, and15 per cent could add 9 and 4 more seen itemscounting them all.■■At the end <strong>of</strong> the first year <strong>of</strong> school, 71 per cent <strong>of</strong>the students who could not compare the skewerand the string could count a collection <strong>of</strong> 20 objects,59 per cent could add 9 and 4 by counting eachobject, and a further 13 per cent could add 9 and 4objects with the 9 objects hidden (e.g. by countingon from the 9).The addition was presented as two groups <strong>of</strong> objectswhich were to be added. Initially nine objects werecovered and four objects seen, and the total sought but,if not given, then the nine objects were uncovered. Inboth forms, this seems to be much more complicatedthan comparing the string and the skewer.We can conclude that an ability to count does not implyan ability to compare lengths, neither does an ability tocombine and count two groups, and even the imagining<strong>of</strong> a group where some counters are hidden does notseem to be related to a capacity to compare lengths.This suggests that the development <strong>of</strong> this lengthconcept is quite independent <strong>of</strong> the development <strong>of</strong>number concepts, and that mathematics (and science)programs in the first year <strong>of</strong> school should <strong>of</strong>fer specificexperiences on comparing lengths and conservation.Note that the distribution <strong>of</strong> the responses <strong>of</strong> the girlsand boys were indistinguishable.32A u s t r a l a s i a n J o u r n a l o f E a r l y C h i l d h o o d
Quantifying lengths (unit iteration)The evidence on whether students could use unititeration to quantify a length was determined by whetherthey could ‘measure the straw using the paperclips’. Todo this, presumably, it is necessary for the students firstto realise that it is possible, next that they can line uppaperclips to match the length <strong>of</strong> the straw, that theycan align them accurately, that they use only the number<strong>of</strong> paperclips necessary, and finally that they can statethat the straw is four paperclips long. Table 3 presentsthe results <strong>of</strong> students in the second year <strong>of</strong> school(Grade One in Victoria) over the three years <strong>of</strong> the datacollection who could not solve the unit iteration task.Table 3. Students (per cent) in the second year <strong>of</strong>school not using Unit iterationMarch Novembernperperncentcent1st year <strong>of</strong> project 1233 60 1508 252nd year <strong>of</strong> project 1505 60 1512 343rd year <strong>of</strong> project 509 53 538 25The majority <strong>of</strong> students at the start <strong>of</strong> the year did notuse the paperclips iteratively to quantify the length <strong>of</strong>the straw. About half <strong>of</strong> these same students wereable to solve the item at the end <strong>of</strong> the year. By theend <strong>of</strong> the year there is a significant minority who stillcould not, indicating that it is an important challenge forstudents in the second year <strong>of</strong> school. Given that thereis substantial theoretical support for the importance<strong>of</strong> the concept as a prerequisite for formal measuring,this can be a key focus for teachers <strong>of</strong> students in thesecond year <strong>of</strong> school.Again, it was possible from the ENRP data to seekinsights into the characteristics <strong>of</strong> the students who didnot improve in the quantifying length task that involvedunit iteration by comparing their performance in otherdomains. Of these students:■■nearly all could count a collection <strong>of</strong> 20 objects■■half could count up and back by ones from variousstarting points■■one-third could count by 2, 5, and 10■■45 per cent could read, record and compare 2-digitnumbers■■66 per cent could count on, in responding to theitem requiring imagining objects to count them.So it seems the difficulties with using a unit iterativelyare not because <strong>of</strong> a lack <strong>of</strong> counting skills, or aninability to imagine, or a failure to work with thenumbers. In other words, this measurement skill isquite independent <strong>of</strong> number skills, and students needspecific experiences in using units iteratively once theyhave shown that they can compare lengths <strong>of</strong> objects.Using a standard unitThe students were asked to use a ruler to measure thelength <strong>of</strong> a straw and to give the length <strong>of</strong> the straw incentimetres. For this, presumably, the students mustknow what a ruler is for, know what the marks (cm inthis case) on the ruler are, be able to align the 0 on theruler with the end <strong>of</strong> the straw (or compensate by usinga different point <strong>of</strong> origin), and read the appropriatenumber that aligns with the end <strong>of</strong> the straw.Table 4 presents the data on the students who couldnot measure the straw with the ruler in the third year<strong>of</strong> school.Table 4. Students (per cent) in the third year <strong>of</strong> school notachieving the Using standard units growth pointnMarchpercentNovembernpercent1st year <strong>of</strong> project 1168 82 1448 402nd year <strong>of</strong> project 1554 77 1538 373rd year <strong>of</strong> project 1279 65 1243 29It seems there is a substantial number <strong>of</strong> studentswho could not perform the task at the beginning <strong>of</strong> thethird year <strong>of</strong> school (Grade Two in Victoria), and abouthalf <strong>of</strong> these students were able to measure the strawwith the ruler by the end <strong>of</strong> the year. So students inthe third year <strong>of</strong> school need specific experiences inmeasuring using standard units, and experiences needto be considered so as to create opportunities for theone-third <strong>of</strong> the students who may not achieve the skillunder normal circumstances.To gain some insights into the characteristics <strong>of</strong> thestudents who could not use the ruler to measure thestraw at the end the third year <strong>of</strong> school in the projectschools, the following is the performance <strong>of</strong> these 579students in the first year <strong>of</strong> the project on number tasksat the November interview:■■all could count a collection <strong>of</strong> 20 objects■■one-quarter could count by 2, 5, and 10 from anynumber■■79 per cent could read, create and compare twodigitnumbers, and 45 per cent could do this for3-digit numbers■■86 per cent could count on■■62 per cent could subtract a small single digitnumber■■43 per cent could use mental strategies for additionand subtraction■■21 per cent could solve multiplication problemswithout needing to see the objects.Vo l u m e 3 6 N u m b e r 3 S e p t e m b e r 2 011 33
- Page 3 and 4: 1.5 Display, download or print the
- Page 5 and 6: Volume 36 Number 3 September 2011Jo
- Page 7 and 8: Curriculum guidelines for early lit
- Page 9 and 10: ■■Know that print carries meani
- Page 14 and 15: Korean children’s cultural adjust
- Page 16 and 17: The Early Years Learning Framework
- Page 18: Kyung Min said listening in class w
- Page 21 and 22: immediately impact on children’s
- Page 23 and 24: Child participation in the early ye
- Page 25 and 26: their kindergarten day. A study by
- Page 27 and 28: the overall organisation, routines,
- Page 29 and 30: Council of Australian Governments (
- Page 31: Learning to measure length in the f
- Page 34 and 35: ■■a 40-minute, one-on-one inter
- Page 38 and 39: In other words, the difficulties th
- Page 40 and 41: An analysis of New Zealand’s chan
- Page 42 and 43: Before five also gave equivalent st
- Page 44 and 45: some evidence that curriculum effec
- Page 46 and 47: achievement; aiding transition to s
- Page 49 and 50: ‘It’s a mystery!’A case study
- Page 51: analysis of discourse the children
- Page 56 and 57: ange of objects on the floor (such
- Page 58 and 59: Observation and recording informati
- Page 60 and 61: ‘I’m making it different to the
- Page 62 and 63: Purpose and theoretical frameworkIn
- Page 64 and 65: The fingers were reaching out acros
- Page 66 and 67: Figure 7. ‘I take this lovely lad
- Page 68 and 69: Here, Rachel used substitution to r
- Page 70: Evaluating the feasibility, effecti
- Page 73 and 74: Table 2. Descriptive characteristic
- Page 75 and 76: The children in this study were fro
- Page 77 and 78: Vol. 36 No. 3 September 2011Austral
- Page 79 and 80: implement the curriculum effectivel
- Page 81 and 82: Table 2. Mean differences between H
- Page 83 and 84: can be regarded as one of the infor
- Page 85 and 86: Ganser, T. (2000). An ambitious vis
- Page 87 and 88:
(Buckhalt et al., 2009). Reduced qu
- Page 89 and 90:
invited families having difficulty
- Page 91 and 92:
Table 3. Mean hours of mother and f
- Page 93 and 94:
A reduction in night wakings might
- Page 95 and 96:
A preliminary exploration of childr
- Page 97 and 98:
adult support necessary for its eff
- Page 99 and 100:
Children’s cortisol and alpha-amy
- Page 102 and 103:
Connor, C., Son, S.-H., Hindman, A.
- Page 104 and 105:
Equity of access:Requirements of In
- Page 106 and 107:
excursions, which have been reporte
- Page 108 and 109:
We need a bus but we also need a st
- Page 110 and 111:
Appropriate child careIndigenous fa
- Page 112 and 113:
Australian Institute of Health and
- Page 114 and 115:
The Mosaic Approach relies on child
- Page 116 and 117:
participants (Altrichter, Posch, &
- Page 118 and 119:
distance. This involved trying to b
- Page 120 and 121:
Dockett, S., & Perry, B. (2003). Ch
- Page 122 and 123:
experiences (Bandura, 1997). Belief
- Page 124 and 125:
the curriculum while on their profe
- Page 126 and 127:
Exploring and evaluating levels of
- Page 128 and 129:
Level 2: Attending to feelingsThis
- Page 130 and 131:
This process to ensure coder stabil
- Page 132 and 133:
DiscussionStructured reflective pro
- Page 134 and 135:
Rock, T. C., & Levin, B. B. (2002).
- Page 136 and 137:
issues encountered in their caring
- Page 138 and 139:
pertaining to the impact and suppor
- Page 140 and 141:
Parents felt the policies involving
- Page 142 and 143:
and access suitable carers because
- Page 144 and 145:
Ievers, C. E., & Drotar, D. (1996).
- Page 146:
www.earlychildhoodaustralia.org.auE