Statistical Testing Using Automated Search - Crest
Statistical Testing Using Automated Search - Crest
Statistical Testing Using Automated Search - Crest

You also want an ePaper? Increase the reach of your titles
YUMPU automatically turns print PDFs into web optimized ePapers that Google loves.
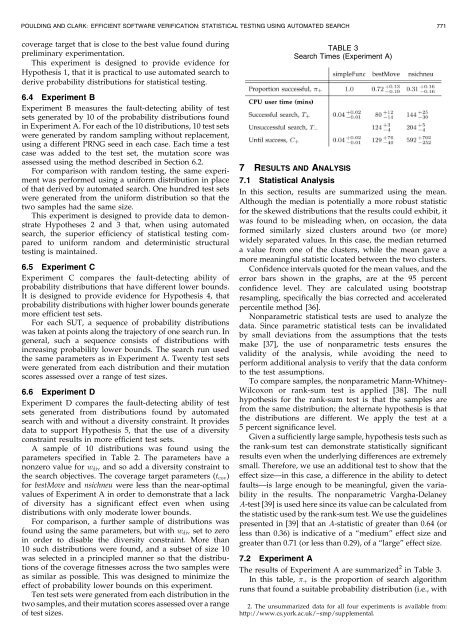
POULDING AND CLARK: EFFICIENT SOFTWARE VERIFICATION: STATISTICAL TESTING USING AUTOMATED SEARCH 771coverage target that is close to the best value found duringpreliminary experimentation.This experiment is designed to provide evidence forHypothesis 1, that it is practical to use automated search toderive probability distributions for statistical testing.6.4 Experiment BExperiment B measures the fault-detecting ability of testsets generated by 10 of the probability distributions foundin Experiment A. For each of the 10 distributions, 10 test setswere generated by random sampling without replacement,using a different PRNG seed in each case. Each time a testcase was added to the test set, the mutation score wasassessed using the method described in Section 6.2.For comparison with random testing, the same experimentwas performed using a uniform distribution in placeof that derived by automated search. One hundred test setswere generated from the uniform distribution so that thetwo samples had the same size.This experiment is designed to provide data to demonstrateHypotheses 2 and 3 that, when using automatedsearch, the superior efficiency of statistical testing comparedto uniform random and deterministic structuraltesting is maintained.6.5 Experiment CExperiment C compares the fault-detecting ability ofprobability distributions that have different lower bounds.It is designed to provide evidence for Hypothesis 4, thatprobability distributions with higher lower bounds generatemore efficient test sets.For each SUT, a sequence of probability distributionswas taken at points along the trajectory of one search run. Ingeneral, such a sequence consists of distributions withincreasing probability lower bounds. The search run usedthe same parameters as in Experiment A. Twenty test setswere generated from each distribution and their mutationscores assessed over a range of test sizes.6.6 Experiment DExperiment D compares the fault-detecting ability of testsets generated from distributions found by automatedsearch with and without a diversity constraint. It providesdata to support Hypothesis 5, that the use of a diversityconstraint results in more efficient test sets.A sample of 10 distributions was found using theparameters specified in Table 2. The parameters have anonzero value for w div and so add a diversity constraint tothe search objectives. The coverage target parameters (t cov )for bestMove and nsichneu were less than the near-optimalvalues of Experiment A in order to demonstrate that a lackof diversity has a significant effect even when usingdistributions with only moderate lower bounds.For comparison, a further sample of distributions wasfound using the same parameters, but with w div set to zeroin order to disable the diversity constraint. More than10 such distributions were found, and a subset of size 10was selected in a principled manner so that the distributionsof the coverage fitnesses across the two samples wereas similar as possible. This was designed to minimize theeffect of probability lower bounds on this experiment.Ten test sets were generated from each distribution in thetwo samples, and their mutation scores assessed over a rangeof test sizes.TABLE 3<strong>Search</strong> Times (Experiment A)7 RESULTS AND ANALYSIS7.1 <strong>Statistical</strong> AnalysisIn this section, results are summarized using the mean.Although the median is potentially a more robust statisticfor the skewed distributions that the results could exhibit, itwas found to be misleading when, on occasion, the dataformed similarly sized clusters around two (or more)widely separated values. In this case, the median returneda value from one of the clusters, while the mean gave amore meaningful statistic located between the two clusters.Confidence intervals quoted for the mean values, and theerror bars shown in the graphs, are at the 95 percentconfidence level. They are calculated using bootstrapresampling, specifically the bias corrected and acceleratedpercentile method [36].Nonparametric statistical tests are used to analyze thedata. Since parametric statistical tests can be invalidatedby small deviations from the assumptions that the testsmake [37], the use of nonparametric tests ensures thevalidity of the analysis, while avoiding the need toperform additional analysis to verify that the data conformto the test assumptions.To compare samples, the nonparametric Mann-Whitney-Wilcoxon or rank-sum test is applied [38]. The nullhypothesis for the rank-sum test is that the samples arefrom the same distribution; the alternate hypothesis is thatthe distributions are different. We apply the test at a5 percent significance level.Given a sufficiently large sample, hypothesis tests such asthe rank-sum test can demonstrate statistically significantresults even when the underlying differences are extremelysmall. Therefore, we use an additional test to show that theeffect size—in this case, a difference in the ability to detectfaults—is large enough to be meaningful, given the variabilityin the results. The nonparametric Vargha-DelaneyA-test [39] is used here since its value can be calculated fromthe statistic used by the rank-sum test. We use the guidelinespresented in [39] that an A-statistic of greater than 0.64 (orless than 0.36) is indicative of a “medium” effect size andgreater than 0.71 (or less than 0.29), of a “large” effect size.7.2 Experiment AThe results of Experiment A are summarized 2 in Table 3.In this table, þ is the proportion of search algorithmruns that found a suitable probability distribution (i.e., with2. The unsummarized data for all four experiments is available from:http://www.cs.york.ac.uk/~smp/supplemental.