Physics Whiteboard Problems – Velocity vs. Time
Physics Whiteboard Problems – Velocity vs. Time
Physics Whiteboard Problems – Velocity vs. Time

Create successful ePaper yourself
Turn your PDF publications into a flip-book with our unique Google optimized e-Paper software.
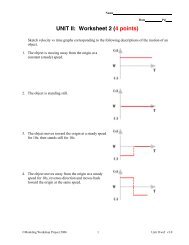
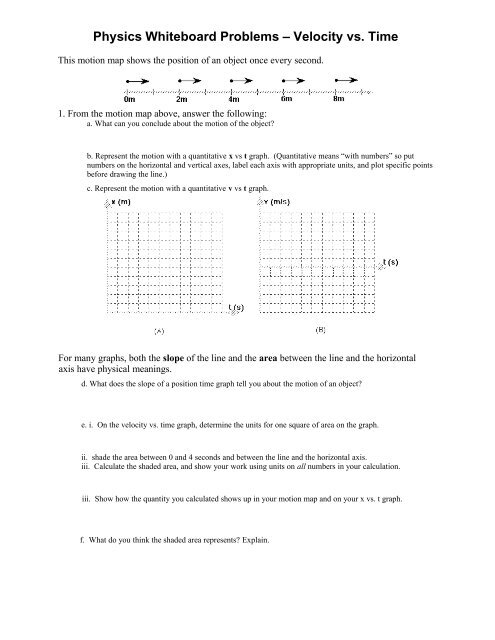
<strong>Physics</strong> <strong>Whiteboard</strong> <strong>Problems</strong> <strong>–</strong> <strong>Velocity</strong> <strong>vs</strong>. <strong>Time</strong>This motion map shows the position of an object once every second.1. From the motion map above, answer the following:a. What can you conclude about the motion of the object?b. Represent the motion with a quantitative x <strong>vs</strong> t graph. (Quantitative means “with numbers” so putnumbers on the horizontal and vertical axes, label each axis with appropriate units, and plot specific pointsbefore drawing the line.)c. Represent the motion with a quantitative v <strong>vs</strong> t graph.For many graphs, both the slope of the line and the area between the line and the horizontalaxis have physical meanings.d. What does the slope of a position time graph tell you about the motion of an object?e. i. On the velocity <strong>vs</strong>. time graph, determine the units for one square of area on the graph.ii. shade the area between 0 and 4 seconds and between the line and the horizontal axis.iii. Calculate the shaded area, and show your work using units on all numbers in your calculation.iii. Show how the quantity you calculated shows up in your motion map and on your x <strong>vs</strong>. t graph.f. What do you think the shaded area represents? Explain.
Wenn der Raubbau nicht gestoppt wird. Seit 1990 sind inRumänien etwa 366.000 Hektar Wald illegal abgeholzt worden <strong>–</strong>eine Fläche fast anderthalbmal so groß wie das Saarland.Besonders begehrt: alte Bäume wegen ihres harten Holzes undihrer Größe.O-Ton Jan Knorn, Geograf, Humboldt-Universität Berlin:Zehn, zwanzig, dreißig, vierzig, fünfzig, sechzig.O-Ton Frontal21:Ja, über hundert Jahre.O-Ton Jan Knorn, Geograf, Humboldt-Universität Berlin:Über hundert Jahre!Ständig begegnen uns Holztransporter. Mit der Privatisierunggroßer Staatswälder ist Rumänien zum größten HolzlieferantenEuropas geworden. Überall im Land haben sich europäischeKonzerne niedergelassen, die hunderttausende Kubikmeter Holzverarbeiten.Alle beteuern, nur legal geschlagenes Holz zu verwenden.Auch IKEA mit seiner Zentrale in Bukarest. Das Einrichtungshauslässt in Rumänien Möbel herstellen. Die internationaleOrganisation FSC überwache das Abholzen <strong>–</strong> aber offenbar nichtsehr gründlich.O-Ton Daniele Strecan, Pressesprecherin IKEA:Derzeit ist nur zwölf Prozent des Holzes, dass IKEA inRumänien verwendet, zertifiziert, weitere acht Prozentwerden von der FSC kontrolliert.Das heißt, achtzig Prozent des verarbeiteten Holzes hat keinFSC-Siegel. Und jeder weiß: Der illegale Holzhandel blüht.Wir sind mit Naturschützern verabredet. Pal Anton war Förster. Ererhebt schwere Vorwürfe gegen die Behörden, denn er warZeuge, wie eine ganze Bergkuppe abgeholzt wurde.O-Ton Pal Anton, Naturschützer:Ich war damals verpflichtet, mit der Polizei zusammen zuarbeiten, doch die steckte mit den Holzdieben unter einerDecke. Wenn wir die illegalen Einschläge meldeten, dannkonnte die Polizei die Täter nie fassen. Die hatten wohl einengewissen Anreiz, nichts dagegen zu unternehmen. Wir hattenalso nur Erfolg, wenn wir auf eigene Faust handelten.Doch das wurde gefährlich.O-Ton Pal Anton, Naturschützer:Wir mussten uns bewaffnen, mit Gewehren und Pistolen,denn auch die Diebe hatten sich bewaffnet, weil wir ihnen
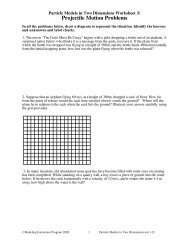
3. (a) Draw the velocity <strong>vs</strong> time graphs for an object whose motion produced the position <strong>vs</strong> time graphsshown below at left.b. Draw a motion map for this object.c. i. On the velocity <strong>vs</strong>. time graph, shade the area between the line and the horizontal axis andbetween 0 and 2 seconds as well as the area between 2 and 4 seconds.ii. Calculate the shaded areas, and show your work using units on all numbers in your calculation.iii. Show how the quantities you calculated show up on your x <strong>vs</strong>. t graph and your motion map.d. Do the results of this problem change your view of what the shaded area represents? Explain.e. Mathematicians use the phrase "area under the curve" to (somewhat inaccurately) describe theoperation of finding the area between (whether that's above or below) the line on the graph(whether its straight or curved) and the horizontal axis (regardless of what is represented on thataxis). In what ways is this similar to finding an area?In what ways is this different from finding an area?3
5. The graph below shows the velocity <strong>vs</strong>. time graph for a toy dune buggy which started 20cm from the edge ofits track. Assume that edge of the track is the origin.<strong>Velocity</strong> (cm/s)402001 2 3 4 5 t (s)6-20-40a. Determine the change in position from t = 2 sec to 3.5sec. Clearly indicate how thechange in position shows up on the velocity graph. Show your work and use units!b. Determine the change in position from t = 5sec to 6sec. Clearly indicate how thechange in position shows up on the velocity graph. Show your work and use units!c. Construct a quantitative position-time graph for the motion. Assume a position of 20cm att = 0. Be sure to accurately number the scale on the position axis.Position (cm)1 2 3 4 5 6 t (s)d. Draw a motion map for this motion. On your motion map, clearly indicate the displacementsdetermined in parts (a) and (b).5