Clustering and self-assembly in colloidal systems - Universiteit Utrecht
Clustering and self-assembly in colloidal systems - Universiteit Utrecht
Clustering and self-assembly in colloidal systems - Universiteit Utrecht
- No tags were found...

You also want an ePaper? Increase the reach of your titles
YUMPU automatically turns print PDFs into web optimized ePapers that Google loves.
<strong>Cluster<strong>in</strong>g</strong> <strong>and</strong> <strong>self</strong>-<strong>assembly</strong> <strong>in</strong><strong>colloidal</strong> <strong>systems</strong>
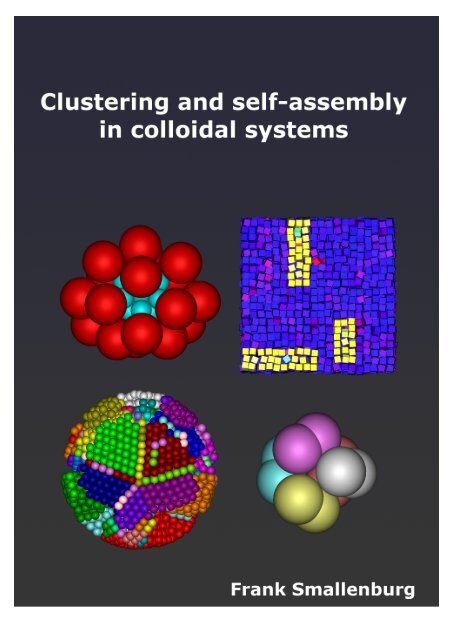
Cover: Snapshots of a <strong>colloidal</strong> micelle (top left), defects <strong>in</strong> a crystal of hard cubes (topright), a cluster of hard spheres compressed <strong>in</strong> spherical conf<strong>in</strong>ement (bottom left), <strong>and</strong> acluster of five hard dumbbells compressed <strong>in</strong> spherical conf<strong>in</strong>ement (bottom right). These<strong>systems</strong> are discussed <strong>in</strong> Chapters 10, 5, 9, <strong>and</strong> 8, respectively.ISBN: 978-90-393-5708-8
<strong>Cluster<strong>in</strong>g</strong> <strong>and</strong> <strong>self</strong>-<strong>assembly</strong> <strong>in</strong> <strong>colloidal</strong><strong>systems</strong>Clustervorm<strong>in</strong>g en zelforganisatie <strong>in</strong> colloïdale systemen(met een samenvatt<strong>in</strong>g <strong>in</strong> het Nederl<strong>and</strong>s)Proefschriftter verkrijg<strong>in</strong>g van de graad van doctor aan de <strong>Universiteit</strong> <strong>Utrecht</strong> op gezag van derector magnificus, prof. dr. G.J. van der Zwaan <strong>in</strong>gevolge het besluit van het college voorpromoties <strong>in</strong> het openbaar te verdedigen op ma<strong>and</strong>ag 9 januari 2012 des middags te 2.30uur.doorFrank Smallenburggeboren op 1 juni 1983 te Castricum.
Promotor:Prof. dr. ir. M. DijkstraThis research was supported by an NWO-Vici grant.
Contents1 Introduction 11.1 Colloids 11.1.1 Colloidal phases 11.1.2 Colloidal <strong>in</strong>teractions 21.2 Simulation methods 31.2.1 Monte Carlo 31.2.2 Event-driven molecular dynamics 51.3 Dipolar <strong>in</strong>teractions <strong>in</strong>duced by external fields 101.4 Outl<strong>in</strong>e of this thesis 122 Self-<strong>assembly</strong> of <strong>colloidal</strong> str<strong>in</strong>gs <strong>in</strong> a homogeneous external electric ormagnetic field 132.1 Introduction 142.2 Model <strong>and</strong> simulation methods 152.3 Monodisperse <strong>systems</strong> 162.4 Bidisperse <strong>systems</strong> 182.4.1 Flame-like <strong>and</strong> r<strong>in</strong>g-like clusters of small spheres 182.4.2 Alternat<strong>in</strong>g str<strong>in</strong>gs 212.5 Asymmetric dumbbells 222.6 Conclusions 272.7 Acknowledgements 282.8 Appendix: Experimental setup 283 Phase diagram of <strong>colloidal</strong> spheres <strong>in</strong> a biaxial electric or magnetic field 313.1 Introduction 323.2 Methods 333.3 Hard spheres <strong>in</strong> a biaxial field 373.4 Charged spheres <strong>in</strong> a biaxial field 393.5 Comparison with experiments 433.6 Conclusions 444 Colloidal cubes <strong>in</strong> an external electric or magnetic field 454.1 Introduction 464.2 Methods <strong>and</strong> model 464.3 Results 484.3.1 Phase diagram 48
4.3.2 Po<strong>in</strong>t-dipole approximation 514.4 Conclusions 524.5 Acknowledgements 535 Phase behavior <strong>and</strong> crystal vacancies <strong>in</strong> <strong>colloidal</strong> hard cubes 555.1 Introduction 565.2 Model <strong>and</strong> simulation methods 565.2.1 Overlap <strong>and</strong> collision detection 565.2.2 Free energy calculations 575.3 Order parameters <strong>and</strong> correlation functions 595.3.1 Positional order 605.3.2 Bond-orientational order 615.3.3 Orientational order 625.4 Results 635.5 Conclusions <strong>and</strong> discussion 715.6 Acknowledgements 726 Phase diagrams of <strong>colloidal</strong> spheres with a constant zeta-potential 736.1 Introduction 746.2 Model <strong>and</strong> theory 756.3 Effective charge <strong>and</strong> screen<strong>in</strong>g length 776.4 Effective <strong>in</strong>teractions <strong>and</strong> phase diagrams 796.5 Summary <strong>and</strong> conclusions 856.6 Acknowledgements 857 Crystal nucleation <strong>in</strong> b<strong>in</strong>ary hard-sphere mixtures: The effect of theorder parameter on the cluster composition 877.1 Introduction 887.2 Classical nucleation theory for multi-component <strong>systems</strong> 897.3 Free-energy barrier 947.4 Order parameter 957.5 A substitutional solid solution 987.6 An <strong>in</strong>terstitial solid solution 1037.7 Conclusions 1077.8 Acknowledgements 1098 Assembly of <strong>colloidal</strong> spheres <strong>and</strong> dumbbells through emulsion dropletevaporation 1118.1 Introduction 1128.2 Simulation Methods 1138.3 Results 1148.3.1 Spheres 1148.3.2 Symmetric dumbbells 1158.3.3 Asymmetric dumbbells 1178.4 Conclusions 1218.5 Acknowledgements 121
9 Crystallization of <strong>colloidal</strong> spheres <strong>in</strong> evaporat<strong>in</strong>g emulsion droplets 1239.1 Introduction 1249.2 Methods 1249.3 Results 1269.3.1 Colloidal hard spheres <strong>in</strong> a hard spherical cavity 1269.3.2 Colloidal hard spheres <strong>in</strong> a spherical cavity with a repulsive wallparticle<strong>in</strong>teraction 1309.3.3 Colloidal hard spheres <strong>in</strong> a hard spherical cavity with repulsiveparticle-particle <strong>in</strong>teractions 1309.4 Conclusions 1339.5 Acknowledgements 13310 Colloidal micelles from asymmetric hard dumbbells 13510.1 Introduction 13510.2 Theory 13610.2.1 Free-energy calculations 13610.2.2 Critical micelle concentration 13810.3 Model <strong>and</strong> methods 13910.3.1 Interactions 13910.3.2 Direct simulations 13910.3.3 Gr<strong>and</strong>-canonical Monte Carlo 13910.3.4 Effective density 14110.3.5 Experimental system 14210.4 Results 14310.4.1 Size ratio 0.76 14310.4.2 Size ratio 0.5 14910.4.3 Size ratio 0.3 14910.5 Discussion 14910.6 Conclusions 15110.7 Acknowledgements 152References 153Summary 166Samenvatt<strong>in</strong>g 170Acknowledgements 174List of publications 176
1Introduction1.1 ColloidsColloidal suspensions are <strong>systems</strong> that consist of microscopic particles dispersed <strong>in</strong> asolvent. These particles, or colloids, typically range from tens of nanometers to severalmicrometers <strong>in</strong> size. Both the particles <strong>and</strong> the solvent can be made out of a variety ofmaterials. Many common <strong>colloidal</strong> suspensions consist of solid particles <strong>in</strong> a liquid solvent,such as blood or pa<strong>in</strong>t. However, it is also possible to create a <strong>colloidal</strong> suspension outof two immiscible liquids, with the particles be<strong>in</strong>g formed by small droplets of one liquidsuspended <strong>in</strong> a cont<strong>in</strong>uous phase of the other. In this case, the suspension is calledan emulsion. For example, butter, salad dress<strong>in</strong>g <strong>and</strong> mayonnaise are emulsions wheredroplets of oil are suspended <strong>in</strong> a water-based solvent or vice versa. Alternatively, the<strong>colloidal</strong> particles can be small bubbles of gas suspended <strong>in</strong> a liquid medium, as <strong>in</strong> whippedcream or shav<strong>in</strong>g cream. In smoke the solvent is a gas <strong>in</strong>stead, conta<strong>in</strong><strong>in</strong>g either liquid orsolid particles.1.1.1 Colloidal phasesThe ma<strong>in</strong> factor that dist<strong>in</strong>guishes <strong>colloidal</strong> particles from other particles is not theirsize, but their dynamics: <strong>colloidal</strong> particles exhibit Brownian motion. When a particle issurrounded by either a liquid or gaseous solvent, thermal motion will cause the solventparticles to collide with it from all directions. If the particle is at rest with respect to therest of the solvent, the direction of the net force exerted on it by the solvent is r<strong>and</strong>omat any <strong>in</strong>stant of time, caus<strong>in</strong>g the particle to diffuse r<strong>and</strong>omly through the solvent.This r<strong>and</strong>om motion was named after Robert Brown, who observed it <strong>in</strong> 1827 when hestudied pollen gra<strong>in</strong>s suspended <strong>in</strong> water us<strong>in</strong>g a microscope,[1] <strong>and</strong> was only expla<strong>in</strong>edmuch later by Albert E<strong>in</strong>ste<strong>in</strong> <strong>and</strong> William Sutherl<strong>and</strong> <strong>in</strong> 1905.[2, 3] In pr<strong>in</strong>ciple, anyobject suspended <strong>in</strong> a gas or liquid will perform Brownian motion. However, typicallyBrownian forces are too weak to significantly affect particles larger than a few micrometers<strong>in</strong> diameter. Thus, unlike a system of larger particles (gra<strong>in</strong>s of s<strong>and</strong>, a box of marbles)which will generally rema<strong>in</strong> motionless unless some external force is applied to it, <strong>colloidal</strong><strong>systems</strong> are cont<strong>in</strong>ually <strong>in</strong> motion. Given enough time, this r<strong>and</strong>om motion allows thecolloids to explore all configurations available to them. As a result, after a sufficient
2 Chapter 1amount of equilibration time, <strong>colloidal</strong> particles can be expected to obey equilibriumstatistical physics, <strong>and</strong> can spontaneously form gas, liquid <strong>and</strong> solid phases, analogous tothose found <strong>in</strong> molecular <strong>systems</strong>. Comb<strong>in</strong>ed with the fact that <strong>colloidal</strong> particles canoften be observed <strong>in</strong> real space <strong>and</strong> real time us<strong>in</strong>g modern microscopy techniques, thismakes them an ideal model system for the behavior of atoms <strong>and</strong> molecules. Additionally,<strong>in</strong> many cases the <strong>in</strong>teractions between <strong>colloidal</strong> particles are relatively weak comparedto the thermal energy. As a result, entropy often plays an important role <strong>in</strong> the phasebehavior of colloids, stabiliz<strong>in</strong>g a range of liquid crystal phases, <strong>in</strong>clud<strong>in</strong>g nematic, smectic<strong>and</strong> cubatic phases, <strong>and</strong> plastic crystals.[4] By tun<strong>in</strong>g the size of the colloids, it is possibleto ensure that the <strong>in</strong>terparticle distance <strong>in</strong> <strong>colloidal</strong> crystals <strong>and</strong> liquid crystals is on theorder of the wavelength of visible light, open<strong>in</strong>g up the possibility of a variety of electroopticalapplications. [5–9] An example of the diffraction of light <strong>in</strong> a <strong>colloidal</strong> crystal canalso be seen <strong>in</strong> nature as the beautiful colors <strong>in</strong> opals, which consist of silica spheres of afew hundred micrometers arranged on a close-packed lattice. [10]1.1.2 Colloidal <strong>in</strong>teractionsS<strong>in</strong>ce <strong>colloidal</strong> particles have a well-def<strong>in</strong>ed thermodynamic equilibrium, a variety of methodscan be applied to predict their behavior either theoretically or with computer simulations,provided the <strong>in</strong>teractions between the colloids are known. In the simplest case,colloids <strong>in</strong>teract only via hard-core repulsions: <strong>in</strong> this case, each particle has a solid corethat cannot deform or overlap with other particles, but the colloids do not attract or repeleach other <strong>in</strong> any other way. For purely hard particles, the potential energy of the systemis not affected at all by the positions of the particles, so any phase transition that occurs<strong>in</strong> such a system is purely driven by entropy. The first example of this, the crystallizationof hard spheres, was demonstrated <strong>in</strong> 1957 by Wood <strong>and</strong> Jacobson [11] <strong>and</strong> Alder <strong>and</strong>Wa<strong>in</strong>wright. [12] Experimentally, the same phase behavior was shown experimentally byPusey <strong>and</strong> Van Megen us<strong>in</strong>g suspensions of poly(methylmethacrylate) particles at differentpack<strong>in</strong>g fractions. [13] Of course, <strong>colloidal</strong> particles need not be spherical. Morerecent synthesis techniques have allowed for the fabrication <strong>and</strong> study of colloids <strong>in</strong> avariety of shapes, <strong>in</strong>clud<strong>in</strong>g dumbbells, rods, platelets, polyhedral particles, superballs,<strong>and</strong> many more. Both simulations <strong>and</strong> experiments show that these anisotropic hard-coreparticle can <strong>self</strong>-assemble <strong>in</strong>to a range of liquid crystal phases, such as nematic, smectic<strong>and</strong> cubatic phases, as well as a range of crystal <strong>and</strong> plastic crystal structures.[4] Similarly,b<strong>in</strong>ary <strong>systems</strong> of hard spheres have been predicted to form a wide variety of crystalstructures, [14] <strong>and</strong> many more are likely to be accessibly <strong>in</strong> mixtures of particles withother shapes.Apart from their hard cores, <strong>colloidal</strong> particles can <strong>in</strong>teract <strong>in</strong> a variety of ways.Examples <strong>in</strong>clude charges, electric or magnetic dipole moments, depletion attractions<strong>in</strong>duced by other particles present <strong>in</strong> the solvent, <strong>and</strong> steric <strong>in</strong>teractions result<strong>in</strong>g frompolymer cha<strong>in</strong>s affixed to the particle surface. These <strong>in</strong>teractions open up an additionalrange of phases accessible to <strong>colloidal</strong> particles, as well as the potential form<strong>in</strong>g of f<strong>in</strong>iteclusters as a result of anisotropic attractions <strong>in</strong> “patchy particles”. [15, 16] In short, asexperimental control over the <strong>in</strong>teraction <strong>and</strong> shape of synthesized colloids improves, thevariety of structures that can be formed <strong>in</strong> <strong>colloidal</strong> <strong>systems</strong> will only cont<strong>in</strong>ue to <strong>in</strong>crease.
Introduction 3Predict<strong>in</strong>g what <strong>in</strong>teractions lead to which structures is useful not only to <strong>in</strong>crease ourunderst<strong>and</strong><strong>in</strong>g of the physics driv<strong>in</strong>g these <strong>systems</strong>, but also to help determ<strong>in</strong>e what typeof particle might be the most likely to yield specific desired structures. In this thesis, wewill use computer simulations to study a number of models for <strong>colloidal</strong> <strong>systems</strong> that arecurrently experimentally realizable <strong>and</strong>, where possible, compare the predicted behaviorwith experimental results.1.2 Simulation methodsIn the majority of the chapters <strong>in</strong> this thesis, computer simulations are used to studythe behavior of <strong>colloidal</strong> particles. The two ma<strong>in</strong> methods used are Monte Carlo (MC)simulations <strong>and</strong> Event-driven molecular dynamics (EDMD) simulations. While writ<strong>in</strong>g anEDMD simulation code is generally more <strong>in</strong>volved than writ<strong>in</strong>g an MC code for the samesystem, the <strong>in</strong>crease <strong>in</strong> speed can be significant, particularly for <strong>systems</strong> conta<strong>in</strong><strong>in</strong>g a largenumber of particles. For example, <strong>in</strong> chapter 5, where we calculate the equation of state<strong>in</strong> a system of 8000 cube-shaped particles us<strong>in</strong>g both MC <strong>and</strong> EDMD simulations, theEDMD simulations were seen to provide sufficiently accurate statistics roughly ten timesfaster. On the other h<strong>and</strong>, MC simulations can be adapted to a much larger variety ofproblems much more easily, such as <strong>systems</strong> with cont<strong>in</strong>uous <strong>in</strong>teractions, simulation boxeswith a variable box shape, <strong>and</strong> many biased sampl<strong>in</strong>g schemes.[17] In this thesis, bothmethods will be used, depend<strong>in</strong>g on the system under consideration <strong>and</strong> the quantitiesthe simulations should measure. Below, we will give a brief overview of both methods.1.2.1 Monte CarloMetropolis sampl<strong>in</strong>g Monte Carlo (MC) simulations are a commonly employed method tostudy the equilibrium behavior of many-body <strong>systems</strong>. Instead of follow<strong>in</strong>g the dynamicsof the system <strong>in</strong> a realistic way, a Monte Carlo simulation simply aims to sample the mostrelevant states of a system with sufficient accuracy to perform realistic measurements onthe distribution of result<strong>in</strong>g configurations.Consider a system of N particles, each <strong>in</strong>teract<strong>in</strong>g with other nearby particles via apair potential U p (r) <strong>and</strong> conf<strong>in</strong>ed to a volume V at temperature T . The probability of astate with a specific set of particle positions r N <strong>and</strong> momenta p N is simply proportionalto the Boltzmann factor correspond<strong>in</strong>g to the total energy U tot of the system:P (r N , p N ) ∝ exp ( −βU tot (r N , p N ) ) , (1.1)with β = 1/k B T <strong>and</strong> k B Boltzmann’s constant. Thus, the expectation value of a measurablequantity A <strong>in</strong> the system is then by the weighted average of A over all possiblestates <strong>in</strong> the system:〈A〉 =∫ drN ∫ dp N A(r N , p N )P (r N , p N )∫ drN ∫ . (1.2)dp N P (r N , p N )In most cases, the total energy of the system only depends on the momenta of the particles
4 Chapter 1via the k<strong>in</strong>etic energy U k<strong>in</strong> (p N ). The total energy can then be written as:U tot (r N , p N ) = U pot (r N ) + U k<strong>in</strong> (p N ) =N∑N∑i=0 j=i+1U p (r ij ) +N∑i=0p 2 i2m i, (1.3)where m i is the mass of particle i, r ij is the distance vector between particles i <strong>and</strong> j,<strong>and</strong> U pot (r N ) is the total potential energy of the system. If the quantity of <strong>in</strong>terest A is<strong>in</strong>dependent of the velocities of the particles, the <strong>in</strong>tegrals over the positions <strong>and</strong> momentacan be separated <strong>in</strong> both the numerator <strong>and</strong> denom<strong>in</strong>ator of Eq. 1.2, <strong>and</strong> the momentum<strong>in</strong>tegrals simply cancel:〈A〉 =∫ dr N A(r N ) exp ( −βU pot (r ) N )∫ . (1.4)drN exp (−βU pot (r N ))In practice, evaluat<strong>in</strong>g either of the <strong>in</strong>tegrals <strong>in</strong> this equation directly is impossible for<strong>systems</strong> with more than a few particles. However, the Metropolis scheme gives a way tocalculate 〈A〉 by only sampl<strong>in</strong>g the most important regions of phase space. The strategy ofthis scheme is to generate a Markov cha<strong>in</strong> of r<strong>and</strong>om configurations of the system <strong>in</strong> a waythat follows the Boltzmann distribution, <strong>and</strong> then simply average A over the generatedconfigurations. To do this, the simulation is <strong>in</strong>itialized with one possible configurationwith N particles <strong>in</strong> a volume V . Subsequently, a trial configuration is generated that isslightly different, for example by choos<strong>in</strong>g one of the particles at r<strong>and</strong>om <strong>and</strong> displac<strong>in</strong>git by a small amount d. To avoid bias<strong>in</strong>g the simulation, we can choose the displacementvector uniformly from a cubic volume centered around 0. The trial move is accepted asthe next configuration <strong>in</strong> the cha<strong>in</strong> with a probability:acc(o → n) = m<strong>in</strong>(1, exp −β[U pot (r n ) − U pot (r o )]), (1.5)where o <strong>and</strong> n denote the old <strong>and</strong> new configurations, respectively. If the trial move isrejected, the next configuration <strong>in</strong> the Markov cha<strong>in</strong> is the same as the old configuration.Given enough time, this scheme will <strong>in</strong> pr<strong>in</strong>ciple lead to a cha<strong>in</strong> of configurations thatsamples all of phase space, follow<strong>in</strong>g the Boltzmann distribution. The thermodynamicaverage of the quantity of <strong>in</strong>terest 〈A〉 can then be measured by averag<strong>in</strong>g its value overa sufficiently large set of these configurations.What we have described here is the most basic example of a Monte Carlo simulation<strong>in</strong> the canonical ensemble (at constant N, V , <strong>and</strong> T ). There are a wide variety ofways to adapt this simulation method to a variety of <strong>systems</strong> <strong>and</strong> ensembles, <strong>and</strong> all ofthese <strong>in</strong>volve the addition of new types of trial moves. For example, for the simulationof anisotropic particles moves have to be added that rotate the particle. To performsimulations at constant pressure, a move has to be <strong>in</strong>cluded that changes the volume ofthe simulation box. Other possible moves <strong>in</strong>clude cluster moves, particle <strong>in</strong>sertion <strong>and</strong>deletion, <strong>and</strong> swap moves that switch the positions of two particles. For a more detaileddescription of the Monte Carlo method, <strong>and</strong> the tricks <strong>and</strong> strategies that can be used <strong>in</strong>these simulations, see Ref. [17].
Introduction 51.2.2 Event-driven molecular dynamicsIn a Molecular Dynamics (MD) simulation, the dynamics of a system are taken explicitly<strong>in</strong>to account: movement of the particles is based on Newton’s Laws, which def<strong>in</strong>e theequations of motion for all particles <strong>in</strong> the system. While this does not mimic Brownianmotion, this method provides a different way of sampl<strong>in</strong>g configurations accord<strong>in</strong>g to theBoltzmann distribution. In normal (time-driven) Molecular Dynamics simulations, theequations of motion <strong>in</strong> the system are <strong>in</strong>tegrated <strong>in</strong> fixed time steps. Each time step,the velocities of the particles are changed based on the calculated forces act<strong>in</strong>g on them,<strong>and</strong> their positions change as a result of these velocities. However, for such a scheme,the forces on the particles cannot be <strong>in</strong>stantaneous, as they are between particles withdiscont<strong>in</strong>uous potentials. For example, the collision between two hard spheres happensat a specific po<strong>in</strong>t <strong>in</strong> time, <strong>and</strong> the force between the two particles is zero at every other<strong>in</strong>stant. Thus, if a f<strong>in</strong>ite fixed time step is used for the simulation, such a collisionwould only be detected when the particles already overlap. In contrast, Event-drivenmolecular dynamics (EDMD) simulations predict the moment of collision explicitly aheadof time, so that it can be h<strong>and</strong>led at the correct moment <strong>in</strong> the simulation.[18] In mostcases, this method is applied to <strong>systems</strong> where the free motion of the particles, i.e. theirmovement <strong>in</strong> the time between collisions, is simple, <strong>and</strong> can be resolved without theneed for numeric <strong>in</strong>tegration of the equations of motion. In practice, this correspondsto particles with <strong>in</strong>teraction potentials that either are purely hard, or consist of a f<strong>in</strong>itenumber of discont<strong>in</strong>uous energy levels (such as square wells). In these cases, the freemotion of the particles simply corresponds to the l<strong>in</strong>ear motion of the center of mass ofthe particle, <strong>and</strong> (if the particles are anisotropic) a constant rotation with fixed angularmomentum. In pr<strong>in</strong>ciple, cont<strong>in</strong>uous <strong>in</strong>teractions can be approximated with a set of<strong>in</strong>terfaces at small <strong>in</strong>tervals, although each extra <strong>in</strong>terface will slow down the simulationdue to the <strong>in</strong>crease <strong>in</strong> the number of <strong>in</strong>teraction events.In an EDMD simulation, time does not move forward <strong>in</strong> fixed <strong>in</strong>tervals. Instead, futureevents such as particle collisions are predicted, <strong>and</strong> the simulation jumps from event toevent, resolv<strong>in</strong>g them <strong>in</strong> chronological order. The simulation program ma<strong>in</strong>ta<strong>in</strong>s a list ofall predicted future events, <strong>and</strong> events are added to <strong>and</strong> removed from this list whenevera collision occurs. Typically, a cell list (or neighbor list [19]) is used to determ<strong>in</strong>e whichparticle pairs are likely to collide <strong>in</strong> the near future: the simulation box is devided <strong>in</strong>toa number of cells, such that only particles <strong>in</strong> neighbor<strong>in</strong>g cells can <strong>in</strong>teract.[17, 18] As aresult, events where a particle crosses from one cell to another are predicted <strong>and</strong> stored aswell. Additional event types can correspond to e.g. the sampl<strong>in</strong>g of measurable quantities(such as the pressure) or the effects of a thermostat (often used <strong>in</strong> order to ma<strong>in</strong>ta<strong>in</strong> aconstant temperature <strong>in</strong> an <strong>in</strong>teract<strong>in</strong>g system).Hard spheresIn this section, we will describe the implementation of an EDMD simulation of monodispersehard spheres. For the purposes of EDMD, hard spheres are an ideal system: collisionsbetween two particles can be detected analytically, mak<strong>in</strong>g the simulation bothsimpler <strong>and</strong> faster. The prediction of the collision time for two identical hard spheres isvery straightforward, as the particles perform simple l<strong>in</strong>ear motion between collisions. If
6 Chapter 1two particles are currently (at time t = 0) at a separation r ij = r i −r j , <strong>and</strong> have a relativevelocity v ij = v i − v j , the square of the distance d between them is a simple quadraticfunction of time:d(t) 2 = |r ij + v ij t| 2 . (1.6)For spherical particles, a collision occurs when the center-to-center distance is equal to theparticle diameter σ. Therefore, we are <strong>in</strong>terested <strong>in</strong> the solution of the quadratic equationd(t) 2 = σ 2 . If there are two roots to this equation, the particles are <strong>in</strong> contact betweenthe first <strong>and</strong> second solution. The first root is given by:t = −b − √ b 2 − vij(r 2 ij 2 − σ 2 ), (1.7)vij2with b = r ij · v ij . When the particles collide, the velocities of both particles change by anequal but opposite amount:δv i = −δv j = −br ij /σ 2 . (1.8)Here, we have assumed that the particles are perfectly frictionless, <strong>and</strong> that both energy<strong>and</strong> total momentum are conserved dur<strong>in</strong>g the collision. With these equations, we canboth predict <strong>and</strong> resolve collisions of two spheres. Similarly, predict<strong>in</strong>g the next time aspecific particle will cross over to the next cell is a matter of solv<strong>in</strong>g l<strong>in</strong>ear equations.With the ability to predict collisions <strong>and</strong> cell cross<strong>in</strong>gs, sett<strong>in</strong>g up a rough outl<strong>in</strong>e of thesimulation is straightforward:1. Initialize particle positions <strong>and</strong> velocities.2. Predict <strong>and</strong> store next cell cross<strong>in</strong>g for each particle.3. Predict <strong>and</strong> store collisions between particles currently <strong>in</strong> neighbor<strong>in</strong>g cells.4. F<strong>in</strong>d the first predicted event, <strong>and</strong> move time forward to that moment.5. In case of a cell cross<strong>in</strong>g, update the cell list, <strong>and</strong> predict <strong>and</strong> store collisions of thatparticle with those <strong>in</strong> the new neighbor<strong>in</strong>g cells.6. In case of a collision, update the particle velocities, delete all events related to bothcollid<strong>in</strong>g particles, <strong>and</strong> predict <strong>and</strong> store new collisions for both.7. In both cases, delete the old cell cross<strong>in</strong>g event <strong>and</strong> predict the new cell cross<strong>in</strong>g forthe particle(s) <strong>in</strong>volved <strong>in</strong> the event.8. Repeat steps 4 through 7.Note that to move time forward (step 4), there is no reason to update the positions of anyparticles that are not affected by the event that will now be resolved. Instead, we simplykeep track of the last moment each particle was updated, <strong>and</strong> its position <strong>and</strong> velocity atthat po<strong>in</strong>t, allow<strong>in</strong>g us to calculate its position at any time it will be needed.Whenever a collision (or other event) occurs, only the velocities of the particles <strong>in</strong>volvedchange. As a result, any events previously predicted that do not <strong>in</strong>volve those
Introduction 7particles rema<strong>in</strong> unchanged. On the other h<strong>and</strong>, a particle has several predicted collisionsassociated with it at any time, which all need to be discarded whenever the velocity of theparticle changes. While this may seem redundant, only keep<strong>in</strong>g track of the first collisionfor each particle is impractical, because that prediction may never happen if the othercollid<strong>in</strong>g particle is deflected by a third particle before the collision occurs. To efficientlydeal with the addition <strong>and</strong> deletion of events at every simulation step, we require a fastway to add <strong>and</strong> delete events from the event list. In addition, to be able to quickly f<strong>in</strong>dthe first scheduled event for every step, the list should be time-ordered. As it turns out,the b<strong>in</strong>ary tree data structure can fulfill these requirements.[18] In this structure, eachevent node <strong>in</strong> the tree is l<strong>in</strong>ked to one ’parent’ event <strong>and</strong> up to two ’children’: one on theleft, <strong>and</strong> one on the right (see Fig. 1.1). The left child event always takes place before theparent event, while the right child event happens at a later time than the parent. Thus,the first event <strong>in</strong> the tree is always on the far left, <strong>and</strong> can be found quickly by travers<strong>in</strong>gthe tree from the top, tak<strong>in</strong>g the left node down at every step until a node without a leftchild is reached. Similarly, when add<strong>in</strong>g an event to the tree, the correct location for itcan be found by start<strong>in</strong>g from the top, <strong>and</strong> either choos<strong>in</strong>g the left or right child at everystep based on whether the new event will take place after or before the current node. Assoon as an empty spot is found, the new event can be placed there. When delet<strong>in</strong>g anevent from the tree, any child events connected to it have to be rel<strong>in</strong>ked <strong>in</strong>to the tree,tak<strong>in</strong>g care to ma<strong>in</strong>ta<strong>in</strong> the chronological order of the nodes. Due to the structure ofthe event tree, any of these operations only affect a small part of the tree, <strong>and</strong> the timerequired to update the event tree is low, scal<strong>in</strong>g with the logarithm of the total numberof events.In order to allow for quick removal of all events related to a specific particle, eventsare also connected via doubly-l<strong>in</strong>ked lists that jo<strong>in</strong> all events related to the same particle,as <strong>in</strong>dicated by the colored arrows <strong>in</strong> Fig. 1.1. Because each event <strong>in</strong>volves at most twoparticles, each event is l<strong>in</strong>ked <strong>in</strong>to up to two of these lists. We use the cell cross<strong>in</strong>g eventrelated to each particle as the head of both l<strong>in</strong>ked lists. In other words, the cell cross<strong>in</strong>gevent for particle i is at the start of two l<strong>in</strong>ked lists: one for all events where particle i isthe first particle <strong>in</strong>volved (the solid l<strong>in</strong>es <strong>in</strong> Fig. 1.1), <strong>and</strong> one for all events where particlei is the second particle <strong>in</strong>volved (the dashed l<strong>in</strong>es). The cell lists we employ consist ofdoubly l<strong>in</strong>ked lists as well. Table 1.1 summarizes the data stored for each particle <strong>and</strong>each event.In an MD simulation, the temperature T is given by the average k<strong>in</strong>etic energy of theparticles:∑i12 mv2 i = 3 2 k BT. (1.9)In a system of purely hard particles at constant volume, conservation of energy willensure that the temperature is fixed. If particle <strong>in</strong>teractions are present or the energy <strong>in</strong>the system is otherwise able to change, a thermostat can be used to keep the temperatureconstant. The simplest version of this is the Andersen thermostat, where at fixed <strong>in</strong>tervalsone or more particles are chosen at r<strong>and</strong>om <strong>and</strong> given a new r<strong>and</strong>om velocity drawn froma Boltzmann distribution of velocities correspond<strong>in</strong>g to the desired temperature.
8 Chapter 1- empty -t = -1000collisiont = 1.2p1 = 3p2 = 5collisioncellt = 0.8t = 2.4p1 = 2p2 = 3p = 1- collision empty -measurecollisioncollisiont = t = -1000 0.6t = 1.0t = 1.8t = 3.2p1 = 1p1 = 5p1 = 1p2 = 4p2 = 4p2 = 2- empty cell -- collision empty -cellmeasuremeasurecollisiont = t = -1000 0.3t = t = -1000 0.9t = 1.1t = 2.0t = 3.0t = 4.0p = 2p1 = 3p2 = 5p = 4p1 = 3p2 = 4cellt = 0.5p = 3cellt = 2.5p = 5Figure 1.1: Illustration of the event tree structure for a small system. Each block representsan event: either a collision, cell cross<strong>in</strong>g, or measurement. The root event at the top is empty,<strong>and</strong> only serves as a start<strong>in</strong>g po<strong>in</strong>t for access<strong>in</strong>g the event tree. Left <strong>and</strong> right children of eachevent are represented by black arrows start<strong>in</strong>g at the bottom left <strong>and</strong> right corner of the block,respectively. The colored arrows denote the l<strong>in</strong>ked lists l<strong>in</strong>k<strong>in</strong>g events with the same particle aseither the first (solid l<strong>in</strong>es) or second (dashed l<strong>in</strong>es) particle <strong>in</strong>volved <strong>in</strong> an event, with differentcolors <strong>in</strong>dicat<strong>in</strong>g different particles.
Introduction 9ParticleEventLast update time t lastTime of eventPosition at t lastFirst particle <strong>in</strong>volvedVelocity at t lastSecond particle <strong>in</strong>volved (if any)Current cellParent eventNext particle <strong>in</strong> cellLeft child eventPrevious particle <strong>in</strong> cell Right child eventCell cross<strong>in</strong>g event Next <strong>and</strong> previous event related to particle 1Next <strong>and</strong> previous event related to particle 2Table 1.1: Data stored for each particle <strong>and</strong> event <strong>in</strong> a hard-sphere EDMD simulation.If we choose our unit of length, energy <strong>and</strong> mass to be σ, k B T <strong>and</strong> m, respectively,the unit of time τ is given by:√τ = mσ 2 /k B T , (1.10)<strong>and</strong> roughly corresponds to the time an average freely mov<strong>in</strong>g particle takes to reach adistance of σ.The pressure P <strong>in</strong> an EDMD simulation can be calculated from the total momentumtransfer between particles, us<strong>in</strong>g the virial expression for the pressure, by averag<strong>in</strong>g thesum of <strong>in</strong>terparticle forces over all particle pairs over a time <strong>in</strong>terval [t a , t b ]:P = ρk B T + 13V∫ tbt a∑i
10 Chapter 1if collisions have to be predicted numerically, EDMD can still be an efficient simulationmethod.[20, 21]To f<strong>in</strong>d the time of collision for two anisotropic particles, we def<strong>in</strong>e an overlap potentialwhich can dist<strong>in</strong>guish between overlapp<strong>in</strong>g <strong>and</strong> non-overlapp<strong>in</strong>g states. This overlappotential is a cont<strong>in</strong>uous function f(r 1 , Ω 1 , r 2 , Ω 2 ) of two particle positions r i <strong>and</strong> theirorientations Ω i , which is smaller than 0 if the two particles overlap, <strong>and</strong> larger than 0 ifthey are non-overlapp<strong>in</strong>g. Predict<strong>in</strong>g a collision is then equivalent to solv<strong>in</strong>g the equationf(r 1 (t), Ω 1 (t), r 2 (t), Ω 2 (t)) = 0, (1.14)where the dependencies of the particle positions <strong>and</strong> orientations on time are given bytheir free motion. Calculat<strong>in</strong>g the overlap potential for two particles is only required <strong>in</strong>the time <strong>in</strong>tervals where their circumscribed spheres overlap (or <strong>in</strong> other words, whenthe center-to-center distance between them is smaller than their maximum <strong>in</strong>teractionrange). Collisions between circumscribed spheres of two particles can be predicted exactlyas described above, <strong>and</strong> when such an event occurs the overlap potential f between thetwo particles <strong>and</strong> its time derivative are calculated on an evenly spaced grid of po<strong>in</strong>ts <strong>in</strong>time. If an overlap is detected, numerical root-f<strong>in</strong>d<strong>in</strong>g algorithms are used to determ<strong>in</strong>ethe time of collision. If the derivative df changes sign from negative to positive, a graz<strong>in</strong>gdtcollision may have been missed, <strong>and</strong> the m<strong>in</strong>imum of f is determ<strong>in</strong>ed numerically <strong>and</strong>checked for a possible collision.The only other major change required to simulate anisotropic particles is the resolutionof predicted collisions. In the case of rigid non-spherical particles, the <strong>in</strong>stantaneous forcebetween the particles follows not only from conservation of energy <strong>and</strong> momentum, butalso angular momentum. By aga<strong>in</strong> assum<strong>in</strong>g that the particles are perfectly frictionlessthe forces can be chosen perpendicular to the collid<strong>in</strong>g surfaces (or, <strong>in</strong> the case of acollision between two edges of sharp particles, perpendicular to both collid<strong>in</strong>g edges). Fora detailed description of the approach used for the prediction <strong>and</strong> resolution of collisions<strong>in</strong> the EDMD simulations employed <strong>in</strong> this thesis, see Ref. [20].1.3 Dipolar <strong>in</strong>teractions <strong>in</strong>duced by external fieldsOne type of <strong>in</strong>teraction that will be studied <strong>in</strong> several chapters <strong>in</strong> this thesis is a dipolar<strong>in</strong>teraction <strong>in</strong>duced by an external homogeneous electric field. In these <strong>systems</strong>, <strong>colloidal</strong>particles are suspended <strong>in</strong> a solvent with a different dielectric constant, <strong>and</strong> an electric fieldis applied to the sample us<strong>in</strong>g two electrodes. Due to the contrast <strong>in</strong> dielectric constantbetween the particles <strong>and</strong> the solvent, this <strong>in</strong>duces a dipole moment <strong>in</strong> each particle <strong>in</strong> thedirection of the field, lead<strong>in</strong>g to dipolar <strong>in</strong>teractions between the particles. As a result, theparticles tend to <strong>self</strong>-assemble <strong>in</strong>to str<strong>in</strong>g-like clusters parallel to the electric field at lowdensities, <strong>and</strong> the crystal structures formed at higher pack<strong>in</strong>g fractions can be changedby the presence of dipolar <strong>in</strong>teractions as well. These dipolar <strong>in</strong>teractions can be <strong>in</strong>ducedwith a magnetic field as well, if there is a difference between the magnetic susceptibilityof the particles <strong>and</strong> that of the solvent.To model the <strong>in</strong>teractions between particles with <strong>in</strong>duced dipole moments, we use theso-called po<strong>in</strong>t-dipole approximation: the dipole moment for each particle is assumed to
Introduction 11EσEEθrβu dip = −γ βu dip = γ/2Figure 1.2: Illustration of the dipolar <strong>in</strong>teraction <strong>in</strong> Eq. 1.15. The second <strong>and</strong> third pictureshow the configurations with the lowest <strong>and</strong> highest energy for two particles, respectively.be concentrated <strong>in</strong> the center of the particle as a po<strong>in</strong>t dipole. This approximation ignoresthe fact that <strong>in</strong> reality, all of the material <strong>in</strong> each particle will be polarized to some degree,lead<strong>in</strong>g to higher-order multipole <strong>in</strong>teractions at close range.[22] Additionally, the dipolemoment of each particles is considered to be dom<strong>in</strong>ated by the external field. In reality,the field generated by the dipole moment <strong>in</strong> one particle can <strong>in</strong>fluence the polarization<strong>in</strong> another particle <strong>and</strong> vice versa, chang<strong>in</strong>g the strength <strong>and</strong> direction of the dipolar<strong>in</strong>teractions. However, iteratively solv<strong>in</strong>g for the result<strong>in</strong>g polarizations of the colloids istoo time-consum<strong>in</strong>g to be practical <strong>in</strong> most simulations.The <strong>in</strong>teraction potential u dip between two aligned po<strong>in</strong>t dipoles is given by:βu dip (r, θ) = γ 2( σr) 3(1 − 3 cos 2 θ), (1.15)where r is the distance between the two po<strong>in</strong>t dipoles, θ is the angle between the vectorconnect<strong>in</strong>g the two particles <strong>and</strong> the direction of the dipole moments (<strong>and</strong> the externalfield), <strong>and</strong> σ is the unit of length <strong>in</strong> the system, usually chosen as the hard-core diameterof the particles. The prefactor γ determ<strong>in</strong>es the strength of the dipolar <strong>in</strong>teractions, <strong>and</strong><strong>in</strong> an experimental setup can be controlled by the strength of the external field. In thecase of spherical particles with diameter σ <strong>in</strong> a local electric field E loc :γ = (ɛ p − ɛ s ) 2 ɛ s πσ 3 |E loc | 2, (1.16)(ɛ p + 2ɛ s ) 2 8k B Twhere ɛ p <strong>and</strong> ɛ s denote the dielectric constant of the particle <strong>and</strong> the solvent, respectively.As seen <strong>in</strong> Eq. 1.15, the dipolar <strong>in</strong>teraction potential is proportional to r −3 . Thisslow decay can cause problems when simulat<strong>in</strong>g, as the potential energy of a particle <strong>in</strong>the system is strongly affected by the presence of particles far away. In order to dealwith these long-range <strong>in</strong>teractions, we make use of Ewald summations.[17, 23] In thistechnique, the calculation of the potential energy is split <strong>in</strong>to a long-ranged part which iscalculated <strong>in</strong> Fourier space, <strong>and</strong> a short-ranged part calculated <strong>in</strong> real space.The phase behavior of monodisperse hard <strong>and</strong> soft spheres with aligned dipolar <strong>in</strong>teractionshas been shown to conta<strong>in</strong> a str<strong>in</strong>g fluid, as well as hexagonally close-packed
12 Chapter 1(HCP), body-centered-tetragonal (BCT) <strong>and</strong> body-centered-orthogonal (BCO) crystalstructures.[24–26] In this thesis, we will <strong>in</strong>vestigate the effects of external fields on severalother <strong>systems</strong> <strong>in</strong>clud<strong>in</strong>g bidisperse spheres, asymmetric dumbbells, <strong>and</strong> cubes. In addition,we will study the phase behavior of spheres <strong>in</strong> a rapidly rotat<strong>in</strong>g (biaxial) electricfield.1.4 Outl<strong>in</strong>e of this thesisIn the rest of this thesis, we will study the <strong>self</strong>-<strong>assembly</strong> of a variety of <strong>systems</strong>. First,we <strong>in</strong>vestigate <strong>colloidal</strong> particles <strong>in</strong> external electric or magnetic field, where the <strong>in</strong>duceddipole <strong>in</strong>teractions are the ma<strong>in</strong> driv<strong>in</strong>g force beh<strong>in</strong>d the behavior of the system. Inchapter 2 we look at the str<strong>in</strong>g-like clusters formed <strong>in</strong> these fields, <strong>and</strong> compare theresults with both theory <strong>and</strong> experiments. In chapter 3 we study spherical particles <strong>in</strong>a biaxial field, lead<strong>in</strong>g to the formation of sheet-like structures. Chapter 4 describes thephase behavior of cube-shaped particles <strong>in</strong> an external field. In the next three chapters,we <strong>in</strong>vestigate bulk <strong>systems</strong> without external fields, start<strong>in</strong>g with a more detailed studyof the phase behavior of hard cubes <strong>in</strong> chapter 5. In chapter 6, we use a theoreticalapproach to predict the phase behavior of <strong>colloidal</strong> particles with a constant surfacepotential, <strong>and</strong> chapter 7 <strong>in</strong>vestigates the nucleation of a b<strong>in</strong>ary hard-sphere crystal phase.In the last three chapters we return to f<strong>in</strong>ite-sized clusters. Chapters 8 <strong>and</strong> 9 bothstudy the structures formed by colloids compressed with<strong>in</strong> an evaporat<strong>in</strong>g droplet, <strong>and</strong> <strong>in</strong>chapter 10 we exam<strong>in</strong>e <strong>colloidal</strong> micelles formed by asymmetric dumbbells with depletion<strong>in</strong>teractions.
2Self-<strong>assembly</strong> of <strong>colloidal</strong> str<strong>in</strong>gs <strong>in</strong>a homogeneous external electric ormagnetic fieldColloidal particles with a dielectric constant (magnetic susceptibility) mismatch with thesurround<strong>in</strong>g solvent acquire a dipole moment <strong>in</strong> a homogeneous external electric (magnetic)field. The result<strong>in</strong>g dipolar <strong>in</strong>teractions lead to aggregation of the particles <strong>in</strong>tostr<strong>in</strong>g-like clusters. We use Monte Carlo simulations to <strong>in</strong>vestigate the structure of the<strong>self</strong>-assembled str<strong>in</strong>g-like aggregates <strong>in</strong> <strong>systems</strong> of both monodisperse <strong>and</strong> bidisperse dipolarhard spheres, as well as dipolar hard asymmetric dumbbells. For monodisperse <strong>systems</strong>,we show that the str<strong>in</strong>g length distributions <strong>in</strong> the dilute regime are <strong>in</strong> quantitativeagreement with the predictions by the first-order thermodynamic perturbation theoryof Wertheim. In bidisperse system, the particles aggregate <strong>in</strong> different types of clustersdepend<strong>in</strong>g on the size ratio of the spheres. For highly asymmetric <strong>systems</strong>, the smallspheres form r<strong>in</strong>g-like <strong>and</strong> flame-like clusters around str<strong>in</strong>gs of large spheres, while forsize ratios closer to 1, alternat<strong>in</strong>g str<strong>in</strong>gs of both large <strong>and</strong> small spheres are observed.For asymmetric dumbbells, we <strong>in</strong>vestigate both the effect of size ratio <strong>and</strong> dipole momentratio, lead<strong>in</strong>g to a large variety of cluster shapes, <strong>in</strong>clud<strong>in</strong>g chiral clusters.
14 Chapter 22.1 IntroductionThe <strong>in</strong>teractions of <strong>colloidal</strong> particles <strong>in</strong> a suspension can be tuned by the applicationof an oscillat<strong>in</strong>g external electric or magnetic field. Due to the contrast of the dielectricconstant or magnetic susceptibility of the particles with that of the fluid, the particlesobta<strong>in</strong> a dipole moment parallel to the field l<strong>in</strong>es. At low field strengths, the result<strong>in</strong>gdipolar <strong>in</strong>teractions between the colloids cause the particles to <strong>self</strong>-assemble <strong>in</strong>to str<strong>in</strong>glikestructures along the field direction. These suspensions are called electro- (ER) ormagneto (MR) rheological fluids, as their rheological properties can be tuned by externalfields. [27, 28] These fluids can be used <strong>in</strong> a wide range of applications, e.g, hydraulicvalves, brakes, clutches [27], displays [29], <strong>and</strong> bullet-proof army vests. For <strong>systems</strong> ofmonodisperse hard spheres with <strong>in</strong>duced dipolar <strong>in</strong>teractions, the phase diagram is wellknown from both experiments <strong>and</strong> simulations.[24–26, 30, 31] A stable str<strong>in</strong>g fluid existsat low field strengths <strong>and</strong> at low pack<strong>in</strong>g fractions, while at higher field strengths, abody-centered-tetragonal (bct) crystal structure is formed.The str<strong>in</strong>g fluid can be compared to the formation of cha<strong>in</strong>-like aggregates <strong>in</strong> ferromagneticfluids, where the direction of the dipole moment of the particles is not fixedby an external field. The structure of these cha<strong>in</strong>s has been studied extensively, bothfor monodisperse <strong>and</strong> polydisperse <strong>systems</strong>.[32–36] In bidisperse or polydisperse <strong>systems</strong>,where the dipole moment scales with the particle volume, the larger particles dom<strong>in</strong>ate theformation of cha<strong>in</strong>s. Subsequently, the smaller particles can aggregate around these largespherestructures, thereby h<strong>in</strong>der<strong>in</strong>g the formation of longer cha<strong>in</strong>s.[37] Previous studiesshowed that the size polydispersity greatly <strong>in</strong>fluences the electrorheological response,which can even be enhanced <strong>in</strong> an equimolar mixtures of large <strong>and</strong> small spheres.[38]In highly asymmetric bidisperse <strong>systems</strong> of spheres with <strong>in</strong>duced dipolar <strong>in</strong>teractions,cluster<strong>in</strong>g leads to r<strong>in</strong>g-like <strong>and</strong> flame-like clusters of small spheres around str<strong>in</strong>gs of largespheres. Mixtures of more similarly sized particles can form str<strong>in</strong>gs conta<strong>in</strong><strong>in</strong>g both typesof spheres, sometimes regularly ordered. As the <strong>in</strong>teractions caus<strong>in</strong>g these structuresare <strong>in</strong>duced by an external field, this provides a way of obta<strong>in</strong><strong>in</strong>g a variety of structuresfrom spherical <strong>colloidal</strong> particles. A wider range of cluster shapes opens up if dipolarhard dumbbells are considered, with two spheres fused at a fixed distance. By tun<strong>in</strong>gthe size ratio <strong>and</strong> the ratio of dipole moments between the two parts of the dumbbell,a wide variety of structures can be formed. In earlier studies, various chiral structureswere observed <strong>in</strong> similar <strong>systems</strong>, both experimentally [39] <strong>and</strong> <strong>in</strong> simulations.[40] Moreimportantly, <strong>in</strong> a recent paper a new methodology has been presented to produce str<strong>in</strong>gsof various <strong>colloidal</strong> particles by apply<strong>in</strong>g electric fields, followed by thermal heat<strong>in</strong>g orseeded growth to make the str<strong>in</strong>gs permanent.[41] The authors also show that the length<strong>and</strong> even the flexibility of the beadcha<strong>in</strong>s can be controlled, <strong>and</strong> that the result<strong>in</strong>g <strong>systems</strong>can serve as <strong>colloidal</strong> analogues of charged <strong>and</strong> uncharged polymer cha<strong>in</strong>s with tunableflexibility. In this chapter, we use simulations to study the formation of str<strong>in</strong>gs <strong>in</strong> <strong>systems</strong>of aligned dipolar hard <strong>and</strong> charged spheres. In particular, we study the str<strong>in</strong>g lengthdistributions for monodisperse <strong>systems</strong>, the formation of r<strong>in</strong>ged <strong>and</strong> alternat<strong>in</strong>g str<strong>in</strong>gs <strong>in</strong>b<strong>in</strong>ary <strong>systems</strong>, <strong>and</strong> the structures formed <strong>in</strong> <strong>systems</strong> consist<strong>in</strong>g of asymmetric dumbbells.In the case of b<strong>in</strong>ary <strong>systems</strong>, the field strengths needed to form b<strong>in</strong>ary str<strong>in</strong>gs are oftenso high that the str<strong>in</strong>g fluid phase is metastable with respect to a broad phase coexistence
Self-<strong>assembly</strong> of <strong>colloidal</strong> str<strong>in</strong>gs <strong>in</strong> a homogeneous external electricor magnetic field 15between a dilute gas phase <strong>and</strong> a crystall<strong>in</strong>e phase. However, due to the lower mobility ofthe larger str<strong>in</strong>gs compared to the s<strong>in</strong>gle particles, the system can get k<strong>in</strong>etically trapped<strong>in</strong>to a metastable fluid for long time scales at low pack<strong>in</strong>g fractions. As a result, one canstudy the result<strong>in</strong>g str<strong>in</strong>gs out of equilibrium <strong>in</strong> both experiments <strong>and</strong> simulations. Wecompare our results with prelim<strong>in</strong>ary experimental observations.2.2 Model <strong>and</strong> simulation methodsWe exam<strong>in</strong>e both hard <strong>and</strong> charged colloids <strong>in</strong> an electric field. For homogeneous particlesof the same material, the dipole moment <strong>in</strong> an external field is proportional to its volume,lead<strong>in</strong>g to stronger dipole moments for larger particles. The dipole-dipole <strong>in</strong>teraction fortwo particles with diameters σ i <strong>and</strong> σ j is given by:βu dip (r ij , θ ij ) = γ ij2( σr ij) 3(1 − 3 cos 2 θ ij ) (2.1)where r ij = r i − r j is the center-of-mass distance vector between particles i <strong>and</strong> j, θ ij theangle of r ij with the dipole moment (oriented along the z-axis), <strong>and</strong> β = 1/k B T with k BBoltzmann’s constant <strong>and</strong> T the temperature. We use the particle diameter σ as unit oflength, which is chosen to be the diameter of the largest particle <strong>in</strong> the case of a b<strong>in</strong>arymixture.The factor γ ij is determ<strong>in</strong>ed by the strength of the electric field, which is chosen to beuniform along the z-axis:γ ij = πσ3 i σj 3 α 2 ɛ s |E loc | 2. (2.2)8k B T σ 3Here, α = (ɛ p −ɛ s )/(ɛ p +2ɛ s ) is the polarizability of the particles, ɛ s the dielectric constantof the solvent, ɛ p the dielectric constant of the particle, <strong>and</strong> E loc the local electric field.We def<strong>in</strong>e γ as the value of γ ij for two particles of the largest size present <strong>in</strong> the system.The hard-sphere <strong>in</strong>teraction is given by:{0, rij ≥ σβu hs (r ij ) =ij, (2.3)∞, r ij < σ ijwith σ ij = (σ i + σ j )/2. In the case of charged spheres, a Yukawa potential is used tomodel the charge repulsions. For the <strong>in</strong>teraction between particles of different sizes, weassume that the pair potential is given by the l<strong>in</strong>ear superposition approximation of theDLVO theory.[42, 43]⎧⎪⎨ exp(−κ(r ij − σ ij ))ɛβu Y (r ij ) = ij , r ij ≥ σ ijr ij /σ(2.4)⎪⎩∞, r ij < σ ijɛ ij =Z i Z j(1 + κσ i /2)(1 + κσ j /2)λ Bσ . (2.5)where Z i is the charge of particle i, κ −1 is the Debye screen<strong>in</strong>g length, <strong>and</strong> λ B =e 2 /4πɛ 0 ɛ s k B T is the Bjerrum length with e the elementary charge <strong>and</strong> ɛ 0 the vacuumpermittivity.
16 Chapter 2We performed Monte Carlo (MC) simulations <strong>in</strong> the NV T ensemble, i.e. we fixedthe number of particles N, the volume V <strong>and</strong> temperature T of the system. To h<strong>and</strong>lethe long-range dipolar <strong>in</strong>teractions, we use Ewald summations with conduct<strong>in</strong>g boundaryconditions.[17, 23] To improve equilibration <strong>and</strong> sampl<strong>in</strong>g speed <strong>in</strong> <strong>systems</strong> with str<strong>in</strong>gs,cluster moves were <strong>in</strong>troduced to move particles resid<strong>in</strong>g <strong>in</strong> a cyl<strong>in</strong>drical volume collectively.To ma<strong>in</strong>ta<strong>in</strong> detailed balance, cluster moves that would change the number ofparticles present <strong>in</strong> this cyl<strong>in</strong>drical volume were rejected.Additionally, we perform simulations of hard dumbbells, which we model as two fusedhard spheres <strong>in</strong>teract<strong>in</strong>g with the pair potential (2.1). Rotation moves were implementedto change the orientation of the dumbbells.2.3 Monodisperse <strong>systems</strong>We first <strong>in</strong>vestigate the str<strong>in</strong>g fluid regime for monodisperse dipolar hard spheres us<strong>in</strong>gNV T MC simulations of N = 1200 particles with diameter σ <strong>in</strong> a simulation box elongatedalong the field direction <strong>in</strong> order to accommodate long str<strong>in</strong>gs. We measured theprobability distribution function P (n) of str<strong>in</strong>g length n <strong>in</strong> the system for vary<strong>in</strong>g fieldstrength γ. In Fig. 2.1 we plot P (n) as a function of the number of particles n <strong>in</strong> a str<strong>in</strong>gfor γ = 5, 8, 9, 10 <strong>and</strong> 11, at a constant pack<strong>in</strong>g fraction η = πσ 3 N/6V = 7.1 · 10 −4 . Oursimulation results are denoted by the symbols. We clearly observe that the lengths of thestr<strong>in</strong>gs <strong>in</strong>crease with both dipole strength γ <strong>and</strong> pack<strong>in</strong>g fraction η, lead<strong>in</strong>g to percolat<strong>in</strong>gstr<strong>in</strong>gs at field strengths larger than γ ≃ 10. While two short str<strong>in</strong>gs repel each otherwhen they are parallel to one another, sufficiently long str<strong>in</strong>gs attract, <strong>and</strong> the attraction<strong>in</strong>creases as the str<strong>in</strong>gs become longer.[44] As a result, for high field strengths s<strong>in</strong>gle str<strong>in</strong>gsare no longer stable, <strong>and</strong> thicker str<strong>in</strong>gs are formed. At even higher <strong>in</strong>teraction strengths,the system forms crystall<strong>in</strong>e doma<strong>in</strong>s with a bct structure. In experiments, str<strong>in</strong>gs wereshown to <strong>self</strong>-assemble <strong>in</strong>to metastable sheet-like structures before crystalliz<strong>in</strong>g.[45]We compare our results with the first-order thermodynamic perturbation theory ofWertheim, which yields free energy predictions for associat<strong>in</strong>g fluids.[46–48] These freeenergy expressions can be used to predict the distribution of cluster sizes <strong>in</strong> equilibrium<strong>systems</strong>.[49] While the theory is more suitable for particles with short-ranged <strong>in</strong>teractions,it can also be used to describe the formation of str<strong>in</strong>gs <strong>in</strong> a dipolar system.To this end, we consider <strong>colloidal</strong> spheres with two b<strong>in</strong>d<strong>in</strong>g sites <strong>in</strong> diametricallyopposite positions. The first-order thermodynamic perturbation theory of Wertheim isbased on the assumption that each b<strong>in</strong>d<strong>in</strong>g site can only form one bond with anotherparticle <strong>and</strong> that pairs of particles can only be s<strong>in</strong>gle-bonded. These assumptions aresatisfied <strong>in</strong> the str<strong>in</strong>g fluid regime for monodisperse dipolar spheres, assum<strong>in</strong>g the pack<strong>in</strong>gfraction <strong>and</strong> field strength are low enough to ensure that all str<strong>in</strong>gs are well-separated.In this case, each particle can form a bond with at most two other particles. Accord<strong>in</strong>gto Wertheim theory the probability p b that an arbitrary b<strong>in</strong>d<strong>in</strong>g site is bonded can bedeterm<strong>in</strong>ed from the chemical equilibrium between two non-bonded particles <strong>and</strong> a dimercluster:p b= ρ∆, (2.6)(1 − p b )2where ∆ is calculated by <strong>in</strong>tegrat<strong>in</strong>g the Mayer function f(r) = exp(−βu dip (r)) − 1 over
Self-<strong>assembly</strong> of <strong>colloidal</strong> str<strong>in</strong>gs <strong>in</strong> a homogeneous external electricor magnetic field 17Pn0.100.080.060.040.02Γ ⩵ 58Γ ⩵ 910Γ ⩵ 110.000 5 10 15 20nFigure 2.1: Str<strong>in</strong>g length distribution P (n) with n the number of spheres <strong>in</strong> a str<strong>in</strong>g for afluid of dipolar hard spheres at pack<strong>in</strong>g fraction η = 7.1 · 10 −4 <strong>and</strong> for various field strengthγ as labeled. The symbols are obta<strong>in</strong>ed from simulations, the l<strong>in</strong>es show the predictions fromWertheim theory.the volume of a b<strong>in</strong>d<strong>in</strong>g site:[46–48]∫∆ = dr g(r)f(r) (2.7)≃site∫ θmax2πθ=0∫ rmaxdθ drf(r, θ)r 2 s<strong>in</strong> θ, (2.8)r=σwith g(r) the pair correlation function of a reference system at the same pack<strong>in</strong>g fraction.As the pack<strong>in</strong>g fractions for the studied str<strong>in</strong>g fluid <strong>systems</strong> are low, we use the ideal gasapproximation g(r) ≃ 1.As the <strong>in</strong>tegral <strong>in</strong> Eq. 2.8 is over the volume of a s<strong>in</strong>gle bond<strong>in</strong>g site, θ max is chosen tobe the edge of this bond<strong>in</strong>g site, where u dip (r, θ) = 0. The <strong>in</strong>tegral diverges logarithmicallyfor r → ∞, <strong>and</strong> therefore we have to choose a reasonable limit r max for the distance atwhich particles can still be considered bonded. We have set r max = 2σ.In addition, the number density of monomers is ρ 1 = ρ(1 − p b ) 2 , s<strong>in</strong>ce for a monomerboth sides are unbonded. Here we def<strong>in</strong>e ρ = N/V as the particle number density.Similarly, the number density ρ n of str<strong>in</strong>gs of length n isρ n = ρ(1 − p b ) 2 p n−1b , (2.9)as the first <strong>and</strong> last particle <strong>in</strong> the cha<strong>in</strong> have one unbonded site each. From Eq. 2.6, wecan easily determ<strong>in</strong>e p b once ∆ is known. Us<strong>in</strong>g the bond probability p b , we can determ<strong>in</strong>ethe cluster size distribution P (n):P (n) =ρ n∑ ∞i=1ρ i= (1 − p b )p n−1b , (2.10)where P (n) is the probability that a r<strong>and</strong>omly selected str<strong>in</strong>g has a length of n, <strong>and</strong>∑ ∞i=1ρ i = ρ(1 − p b ), obta<strong>in</strong>ed by summ<strong>in</strong>g the geometric series over all cha<strong>in</strong> lengths.
18 Chapter 2However, <strong>in</strong> our system there are correlations between nearby bonds, s<strong>in</strong>ce the attractivepotential of the dipoles extends beyond the distance of a s<strong>in</strong>gle particle. As a result,a particle is more likely to be attached to longer str<strong>in</strong>gs. If we assume that neighbor<strong>in</strong>gparticles <strong>in</strong> the str<strong>in</strong>g are at contact along the z-axis then the potential near the top of astr<strong>in</strong>g of length n is given by:u(r, n) =n−1 ∑i=0u dip (r − iẑ). (2.11)This potential can then be used to calculate ∆(n) us<strong>in</strong>g Eq. 2.8 with the Mayerfunction correspond<strong>in</strong>g to u n (r, n). Subsequently, we can write a recursive relation for ρ n :To calculate ρ 1 , we normalize this distribution us<strong>in</strong>gρ nρ n−1 ρ 1= ∆(n). (2.12)∞∑nρ n = ρ. (2.13)n=1We plot the theoretical results (solid l<strong>in</strong>es) along with the simulation results <strong>in</strong> Fig.2.1. The theoretical predictions fit the simulation data for low pack<strong>in</strong>g fractions <strong>and</strong>field strengths very well, as shown <strong>in</strong> Figure 2.1. We obta<strong>in</strong> agreement between theory<strong>and</strong> simulations as long as the simulated str<strong>in</strong>gs do not cluster together or span thesimulation box. As no fit parameters are required <strong>in</strong> the theory to match the simulationdata, Wertheim theory allows a direct quantitative prediction of the distribution of str<strong>in</strong>glengths <strong>in</strong> the dilute str<strong>in</strong>g fluid regime of hard dipolar spheres. In pr<strong>in</strong>ciple, it should alsobe straightforward to extend this theory to charged dipolar spheres, by add<strong>in</strong>g a Yukawarepulsion <strong>in</strong> Eq. 2.8.2.4 Bidisperse <strong>systems</strong>2.4.1 Flame-like <strong>and</strong> r<strong>in</strong>g-like clusters of small spheresWe now turn our attention to b<strong>in</strong>ary <strong>systems</strong> of large <strong>and</strong> small <strong>colloidal</strong> spheres withdiameters σ L <strong>and</strong> σ S , respectively, with a large size asymmetry. The dipolar <strong>in</strong>teractionsas given by Eq. 2.1 <strong>and</strong> 2.2 are much stronger between the large particles than between thesmall particles. As a result, the formation of str<strong>in</strong>gs will be dom<strong>in</strong>ated by the cluster<strong>in</strong>gof the large particles. Additionally, the small particles may aggregate with the cha<strong>in</strong>sformed by the large particles. Due to the <strong>in</strong>teractions between small <strong>and</strong> large particles, acircular attractive potential well arises for the small particles around the contact po<strong>in</strong>t oftwo large particles <strong>in</strong> the cha<strong>in</strong>, <strong>and</strong> consequently the small particles can get trapped <strong>in</strong>tothis well.[33] Figure 2.2 shows a typical snapshot of the str<strong>in</strong>gs formed <strong>in</strong> a Monte Carlosimulation, as well as a confocal snapshot <strong>and</strong> a scann<strong>in</strong>g electron microscopy picture ofsimilar clusters <strong>in</strong> an experimental setup, all at size ratio q = σ S /σ L = 0.25. For detailson the experimental setup, see the Appendix.
Self-<strong>assembly</strong> of <strong>colloidal</strong> str<strong>in</strong>gs <strong>in</strong> a homogeneous external electricor magnetic field 19At size ratio q = 0.25, a maximum of 14 small particles can fit geometrically <strong>in</strong> thiscircular well <strong>in</strong> such a way that each small particle is <strong>in</strong> contact with both large spheres.At q = 0.33, only up to 10 particles fit <strong>in</strong> this well. However, the repulsive <strong>in</strong>teractionsbetween the small particles reduce the number of small particles per r<strong>in</strong>g <strong>in</strong> the lowestenergy state. We calculate the potential energy due to the dipolar <strong>in</strong>teractions as afunction of the number of small particles <strong>in</strong> the circular well around the contact po<strong>in</strong>tbetween two large spheres <strong>in</strong> a str<strong>in</strong>g of 2 <strong>and</strong> 15 large spheres. We plot the results forq = 0.25 (top panel) <strong>and</strong> 0.33 (bottom panel) <strong>in</strong> Figure 2.3. We clearly observe that forboth size ratios the number of small particles <strong>in</strong> the lowest potential energy configuration<strong>in</strong>creases for longer str<strong>in</strong>g lengths due to a stronger attractive potential around the contactpo<strong>in</strong>ts <strong>in</strong> a str<strong>in</strong>g. We like to mention here that entropic effects favor a lower numberof particles per r<strong>in</strong>g, as this allows for more free volume or entropy both <strong>in</strong>side <strong>and</strong>outside the cluster. In addition, we f<strong>in</strong>d from Fig. 2.3 that for a size ratio q = 0.25, thesmall particles get trapped <strong>in</strong> this well for γ ≃ 50 as the potential energy is ∼ 0.02k B Tper particle for str<strong>in</strong>g length 15. For such high fields, the str<strong>in</strong>g fluid of large particlesis thermodynamically metastable with respect to a broad gas-solid transition. [26] Inexperiments, the large str<strong>in</strong>gs are partially stabilized by <strong>in</strong>homogeneities <strong>in</strong> the externalfield, caus<strong>in</strong>g the str<strong>in</strong>gs to stay <strong>in</strong> local areas of high field strength <strong>and</strong> prevent<strong>in</strong>g themfrom cluster<strong>in</strong>g together. In st<strong>and</strong>ard MC simulations (without any (unphysical) clustermoves), the cluster<strong>in</strong>g of str<strong>in</strong>gs is <strong>in</strong>hibited as the mobility of the <strong>self</strong>-assembled str<strong>in</strong>gs isextremely low. S<strong>in</strong>ce the <strong>in</strong>teractions with the small particles are much weaker, the smallspheres can still sample phase space, <strong>and</strong> can reach equilibrium with<strong>in</strong> the constra<strong>in</strong>tsgiven by the configuration of the larger particles.Due to the dipolar <strong>in</strong>teractions between the small <strong>and</strong> large spheres, the small spherescan also aggregate <strong>in</strong> a large potential well at the end of the cha<strong>in</strong>s (see the left sideof Fig. 2.2). The result<strong>in</strong>g aggregate of small particles is wider near the str<strong>in</strong>g of largeparticles. In addition, the fluctuations of the cluster are more pronounced far from thestr<strong>in</strong>gs, giv<strong>in</strong>g a flame-like shape to the cluster. Due to the larger <strong>and</strong> deeper potentialwell, a flame-like cluster will generally conta<strong>in</strong> more small spheres than a r<strong>in</strong>g-like cluster.In order to study the structure of the b<strong>in</strong>ary str<strong>in</strong>gs, we performed MC simulationsto study b<strong>in</strong>ary str<strong>in</strong>gs of dipolar hard spheres with a size ratio q = 0.25 <strong>and</strong> 0.33,both start<strong>in</strong>g from a homogeneous r<strong>and</strong>om <strong>in</strong>itial configuration, <strong>and</strong> from a configurationconta<strong>in</strong><strong>in</strong>g a s<strong>in</strong>gle str<strong>in</strong>g of large spheres <strong>in</strong> a sea of small spheres. For the simulationsstart<strong>in</strong>g from a r<strong>and</strong>om configuration, we used 100 large particles, <strong>and</strong> varied the numberof small particles from 100 to 600. The overall pack<strong>in</strong>g fraction was well below 1%(η L = 0.002), to keep the str<strong>in</strong>gs of large spheres from cluster<strong>in</strong>g. We <strong>in</strong>deed observe thatthe large particles <strong>self</strong>-assemble <strong>in</strong> l<strong>in</strong>ear str<strong>in</strong>gs parallel to the field direction <strong>and</strong> thatsmall particles form r<strong>in</strong>g-like <strong>and</strong> flame-like clusters around the str<strong>in</strong>gs of larger spheres.To determ<strong>in</strong>e the probability distribution of the number of small spheres <strong>in</strong> the r<strong>in</strong>g-likeclusters, we perform Monte Carlo simulations of a str<strong>in</strong>g of 15 large spheres at vary<strong>in</strong>gdensities of small spheres. While the large spheres were allowed to move <strong>in</strong> the simulation,field strengths were always sufficiently high to prevent the str<strong>in</strong>g from break<strong>in</strong>g.At the field strengths where the r<strong>in</strong>g-like clusters are regularly seen, the flame-likeclusters always appear as well. The presence of small particles near the ends of the str<strong>in</strong>gsof large spheres h<strong>in</strong>ders the formation of long str<strong>in</strong>gs <strong>in</strong> the simulation, as it can take a
20 Chapter 2Figure 2.2: Left: Part of a snapshot of a typical configuration of a str<strong>in</strong>g of 15 large particleswith r<strong>in</strong>gs of small particles, at size ratio q = σ S /σ L = 0.25. The field is along the vertical axis,<strong>and</strong> surround<strong>in</strong>g small particles have been removed. Middle: A confocal image <strong>and</strong> a scann<strong>in</strong>gelectron microscopy picture of an experimental system of str<strong>in</strong>gs with r<strong>in</strong>g-like <strong>and</strong> flame-likeclusters. The particles <strong>in</strong> the experiments are poly-(methylmetacrylate) (PMMA) spheres withdiameters σ L = 2.4µm <strong>and</strong> σ S = 0.6µm. The scalebar is 2 µm. Right: Typical snapshotof a bidisperse system of dipolar hard spheres at size ratio σ S /σ L = 0.8, with N S /N L = 10.Here, γ = 102, κσ S = 1.0, <strong>and</strong> Z 2 S λ B/σ S = 100. Most of the gaps between two large spheresconta<strong>in</strong> exactly one small sphere. The field is along the vertical axis. The picture at the bottomleft is a confocal image of a b<strong>in</strong>ary system of PMMA spheres with diameters σ L = 1.5µm <strong>and</strong>σ S = 1.05µm.Β UΓ0.000.050.100.15 0.200 2 4 6 8 10 12 14n r<strong>in</strong>gΒ UΓ0.000.050.100.150.200.25 0.300 2 4 6 8 10n r<strong>in</strong>gFigure 2.3: Potential energy of r<strong>in</strong>g-like clusters of small dipolar hard spheres adsorbed nearthe contact po<strong>in</strong>t of two large dipolar hard spheres, <strong>in</strong> a str<strong>in</strong>g consist<strong>in</strong>g of 2 large spheres ()<strong>and</strong> 15 large spheres (•) as a function of the number of small spheres <strong>in</strong> the r<strong>in</strong>g, i.e. n r<strong>in</strong>g .The size ratio between small <strong>and</strong> large spheres is q = σ S /σ L = 0.25 (left) <strong>and</strong> q = 0.33 (right).Interactions between the large particles are not <strong>in</strong>cluded <strong>in</strong> the potential energy.
Self-<strong>assembly</strong> of <strong>colloidal</strong> str<strong>in</strong>gs <strong>in</strong> a homogeneous external electricor magnetic field 21Pn0.50.40.30.20.10.087654931011100 150 200 250 300 350 400ΓPn0.70.60.50.40.30.20.10.065437880 100 120 140 160 180 200 220ΓFigure 2.4: Probability distribution function P (n) for a r<strong>in</strong>g-like cluster of n small dipolarparticles as a function of the field strength γ for a str<strong>in</strong>g of 15 large dipolar spheres, at smallparticle density η S = 1.9 · 10 −3 . The size ratios are q = 0.25 (left) <strong>and</strong> q = 0.33 (right).long time ( 10 5 MC cycles) for the small particles to be pushed away from two merg<strong>in</strong>gstr<strong>in</strong>gs. The r<strong>in</strong>g-like clusters can be seen <strong>in</strong> a wide range of field strengths, <strong>and</strong> theoccupancy of the r<strong>in</strong>g rises as γ <strong>in</strong>creases. Figure 2.4 shows the probability distributionof the r<strong>in</strong>g sizes as determ<strong>in</strong>ed from simulations at various field strengths, for size ratiosof 0.25 <strong>and</strong> 0.33. The plots show a cont<strong>in</strong>uous <strong>in</strong>crease of the number of small spheresper r<strong>in</strong>g as a function of γ, as well as a preference over a large range of field strengthsfor 8 particles per r<strong>in</strong>g at size ratio 0.25 <strong>and</strong> 6 at size ratio 0.33. It should be notedthat the total number of small particles <strong>in</strong> the system is constant, <strong>and</strong> trapp<strong>in</strong>g manysmall particles <strong>in</strong> the r<strong>in</strong>g-like <strong>and</strong> flame-like clusters decreases the density of free smallparticles. However, chang<strong>in</strong>g the density of small spheres did not change the probabilitydistribution functions significantly.For very high field strengths, we observe the formation of thicker r<strong>in</strong>g-like clustersof small spheres around the contact po<strong>in</strong>t between two large spheres. Due to the weakerpotential wells further away from the str<strong>in</strong>g, these thicker r<strong>in</strong>gs tend to be more disordered,<strong>and</strong> exchange small particles with the surround<strong>in</strong>g fluid at a faster rate.2.4.2 Alternat<strong>in</strong>g str<strong>in</strong>gsFor less asymmetric <strong>systems</strong>, we observe the formation of b<strong>in</strong>ary str<strong>in</strong>gs that consist ofalternat<strong>in</strong>g large <strong>and</strong> small particles. We studied the <strong>self</strong>-<strong>assembly</strong> of these str<strong>in</strong>gs forboth hard <strong>and</strong> charged dipolar particles, us<strong>in</strong>g MC simulations of <strong>systems</strong> with severalsize ratios <strong>and</strong> a range of stoichiometries. The electrostatic repulsions are describedby screened-Coulomb <strong>in</strong>teractions (see Eq. 2.4), where the charge Z is chosen to beproportional to the surface area of the spheres. In all cases, the total pack<strong>in</strong>g fractionwas below 1%. The simulations were performed <strong>in</strong> a rectangular box, elongated alongthe z-axis to allow for longer str<strong>in</strong>gs. All simulations are started from a r<strong>and</strong>om <strong>in</strong>itialconfiguration. On the right <strong>in</strong> Fig. 2.2 we show a typical snapshot of the str<strong>in</strong>gs formed<strong>in</strong> a system of charged particles, together with a confocal image of a short alternat<strong>in</strong>gstr<strong>in</strong>g taken from experiments.
22 Chapter 2The formation of alternat<strong>in</strong>g str<strong>in</strong>gs can be understood as the bond between a large<strong>and</strong> a small particle is significantly stronger than the bond between two small particles.In <strong>systems</strong> with many more small dipolar particles than large particles, the large particleswill first bond with a small number of small ones on each side shortly after the field isturned on. These clusters will then jo<strong>in</strong> to form longer str<strong>in</strong>gs, with several <strong>in</strong>terstitialsmall particles between the large ones. While <strong>in</strong> equilibrium the large particles are bonded<strong>in</strong> a str<strong>in</strong>g, the removal of the small particles is a slow process. The free energy barrier thatthese small particles have to overcome to escape the str<strong>in</strong>g is dependent on the number ofsmall particles between two large spheres, <strong>and</strong> is highest for one small particle with twolarge neighbors.For uncharged dipolar spheres, alternat<strong>in</strong>g str<strong>in</strong>gs were not observed with any regularity,as the potential energy differences are too small between configurations with one,two, or three small spheres <strong>in</strong> between two large ones. As a result, <strong>in</strong> sufficiently longsimulations all <strong>in</strong>terstitial small particles are removed from the str<strong>in</strong>gs, result<strong>in</strong>g <strong>in</strong> str<strong>in</strong>gsof large particles with small particles only at the ends.Interest<strong>in</strong>gly, simulations of charged particles show the <strong>self</strong>-<strong>assembly</strong> of alternat<strong>in</strong>gstr<strong>in</strong>gs that rema<strong>in</strong> stable on much longer time scales. S<strong>in</strong>ce the charge on each particlescales with the surface area, the bonds between the large spheres are relatively weaker,<strong>and</strong> hence configurations with more than one small particle between two large spheres <strong>in</strong>a str<strong>in</strong>g become less stable. While defects always appear, for <strong>in</strong>verse screen<strong>in</strong>g lengths onthe order of σ S <strong>and</strong> a size ratio of σ S /σ L = 0.8, the average number of small particlesbetween two large spheres <strong>in</strong> a str<strong>in</strong>g can be tuned by the field strength. In order to studythe field-strength dependence of the number of <strong>in</strong>terstitial small spheres n IS <strong>in</strong> betweena pair of large spheres <strong>in</strong> a str<strong>in</strong>g, we determ<strong>in</strong>e the probability distribution P (n IS ) forvary<strong>in</strong>g γ.Figure 2.5 shows the distribution of the number of small colloids between two largeones <strong>in</strong> the str<strong>in</strong>gs, for two different numbers of charges per colloid. The simulationsconsisted of N L = 50 large <strong>and</strong> N S = 500 small particles, at an overall pack<strong>in</strong>g fractionof 3.5 · 10 −3 . Increas<strong>in</strong>g the field strength <strong>in</strong>creases the number of small particles pergap, as the stronger attractions h<strong>in</strong>der the escape of small particles from the str<strong>in</strong>gs.Interest<strong>in</strong>gly, a large fraction of trimers, with one large particle s<strong>and</strong>wiched by two smallparticles, are also often seen <strong>in</strong> addition to the longer str<strong>in</strong>gs. While form<strong>in</strong>g alternat<strong>in</strong>gstr<strong>in</strong>gs is much easier with an added Yukawa repulsion, the formed configurations are stillmetastable states: if swap moves are <strong>in</strong>troduced <strong>in</strong>to the simulations, allow<strong>in</strong>g a large<strong>and</strong> small particle to switch positions, the alternat<strong>in</strong>g str<strong>in</strong>gs rapidly change <strong>in</strong>to str<strong>in</strong>gsconsist<strong>in</strong>g ma<strong>in</strong>ly of large spheres. However, without swap moves, these structures arestable even <strong>in</strong> long simulations, <strong>and</strong> the distribution of the number of small particlesbetween two larger ones is approximately constant after equilibration, as shown <strong>in</strong> Fig.2.6.2.5 Asymmetric dumbbellsF<strong>in</strong>ally, we <strong>in</strong>vestigate str<strong>in</strong>gs <strong>in</strong> a system of asymmetric hard dumbbells <strong>in</strong> an externalelectric field. Each dumbbell particle consists of a large <strong>and</strong> a small sphere, with diameters
Self-<strong>assembly</strong> of <strong>colloidal</strong> str<strong>in</strong>gs <strong>in</strong> a homogeneous external electricor magnetic field 231.01.0PnIS0.80.60.40.2n IS ⩵ 0n IS ⩵ 1n IS ⩵ 2n IS ⩵ 3n IS ⩵ 4PnIS0.80.60.40.2n IS ⩵ 0n IS ⩵ 1n IS ⩵ 2n IS ⩵ 3n IS ⩵ 40.052 54 56 58 60 62 64Γ0.094 96 98 100 102 104 106 108ΓFigure 2.5: Probability distribution function P (n IS ) of the number n IS of <strong>in</strong>terstitial smalldipolar particles between a pair of large dipolar spheres <strong>in</strong> a str<strong>in</strong>g, for κσ S = 1.00, η L = 6.3·10 −4 ,<strong>and</strong> η S = 2.9 · 10 −3 , as a function of the field strength γ. The size ratio is σ S /σ L = 0.8. Theparticle charge for the left <strong>and</strong> right plot are given by Z 2 S λ B/σ S = 50 <strong>and</strong> 100, respectively. Theblack circle <strong>in</strong>dicates the state po<strong>in</strong>t where the snapshot <strong>in</strong> Fig. 2.2 was taken.1.00.8PnIS0.60.40.20.0n IS ⩵ 0n IS ⩵ 1n IS ⩵ 2n IS ⩵ 3500 1000 1500 2000MC cycles1000Figure 2.6: Time dependence of the probability distributions P (n IS ) shown <strong>in</strong> Fig. 2.5, show<strong>in</strong>ghow n IS changes as a function of the number of MC cycles, where one MC cycle consists ofN S + N L trial moves of the particles. The same parameters were used as <strong>in</strong> Fig. 2.5, with byZ 2 S λ B/σ S = 50 <strong>and</strong> γ = 58.6.
24 Chapter 2σ L <strong>and</strong> σ S respectively, <strong>and</strong> a fixed separation distance d ≤ σ LS , where σ LS = (σ L +σ S )/2.Each of the spheres conta<strong>in</strong>s a po<strong>in</strong>t dipole at its center that <strong>in</strong>teracts with all others with<strong>in</strong>teraction potential:βu dip (r ij , θ ij ) = γp ip j2p 2 L( σr ij) 3(1 − 3 cos 2 θ ij ). (2.14)Here, the dipole strength p i for sphere i is determ<strong>in</strong>ed by the size of the sphere, <strong>and</strong> isequal to either p L or p S for small <strong>and</strong> large spheres, respectively. The relative <strong>in</strong>teractionstrengths for the two types of spheres is therefore controlled by the ratio p S /p L , while theabsolute <strong>in</strong>teraction strength is determ<strong>in</strong>ed by γ = γ LL , as def<strong>in</strong>ed <strong>in</strong> Eq. 2.2.Due to the <strong>in</strong>teraction between the two spheres <strong>in</strong> a s<strong>in</strong>gle dumbbell, a s<strong>in</strong>gle particlefavors an orientation aligned along the z-axis. Magnetic <strong>colloidal</strong> particles of this typehave been seen to form chiral structures <strong>in</strong> experimental <strong>systems</strong> where the smaller part ofthe dumbbell acquires a much stronger dipole moment <strong>in</strong> the external magnetic field.[39]Recently, a variety of helical structures has been characterized as global potential m<strong>in</strong>imafor clusters of asymmetric dumbbells consist<strong>in</strong>g of two Lennard-Jones particles <strong>and</strong> apo<strong>in</strong>t dipole directed across the axis between the spheres.[40]Similar to <strong>systems</strong> of dipolar spheres, asymmetric dipolar dumbbells form str<strong>in</strong>gsat low field strengths <strong>and</strong> pack<strong>in</strong>g fractions, which grow <strong>in</strong> length <strong>and</strong> thickness as γ<strong>in</strong>creases. We <strong>in</strong>vestigate the zero-temperature structure of these str<strong>in</strong>gs, <strong>and</strong> performMonte Carlo simulations to study the behavior at f<strong>in</strong>ite temperatures.We first consider hard dumbbells consist<strong>in</strong>g of two adjacent hard spheres at separationdistance d = σ LS . The structure of a s<strong>in</strong>gle str<strong>in</strong>g <strong>in</strong> the limit of strong fields (or zerotemperature) ma<strong>in</strong>ly depends on the size ratio of the dumbbell σ S /σ L , <strong>and</strong> the ratiobetween the dipole moments of the two spheres p S /p L . By compar<strong>in</strong>g the potential energyfor a number of possible configurations, we can draw a phase diagram of the predictedstructures as shown <strong>in</strong> Fig. 2.7. The c<strong>and</strong>idate structures considered were head-to-toe<strong>and</strong> head-to-head str<strong>in</strong>gs, buckled str<strong>in</strong>gs, columnar structures, <strong>and</strong> helical structures. Inthe head-to-toe or head-to-head configuration, all spheres are centered on a straight l<strong>in</strong>e,with the dumbbells oriented all <strong>in</strong> the same direction or alternat<strong>in</strong>g between ’up’ <strong>and</strong>’down’, respectively. The buckled str<strong>in</strong>gs consist of a central str<strong>in</strong>g of large spheres, withthe smaller spheres pushed to either the side or the end of the str<strong>in</strong>g. When the dipolemoment of the smaller spheres is sufficiently large, the central str<strong>in</strong>g consists of smallerspheres <strong>in</strong>stead. For size ratio σ S /σ L > 0.5, the larger spheres arrange <strong>in</strong>to two adjacentcolumns. For σ S /σ L < 0.5, the structure formed can either consist of two sets of thesecolumns, or helical structures, strongly depend<strong>in</strong>g on the size ratio.If the dipole moment of the spheres scales with the volume of the spheres, as would bethe case if both parts are made out of the same material, the large particles will have thethe stronger dipole moment. The dashed l<strong>in</strong>e <strong>in</strong> Fig. 2.7 shows the structures formed <strong>in</strong>this case. Depend<strong>in</strong>g on the size ratio, the str<strong>in</strong>g only takes two shapes: aligned dumbbells<strong>in</strong> head-to-head orientations, or a str<strong>in</strong>g of large particles with the small particles all onthe same side (except at the ends).We wish to remark here that it is possible that we missed some structures, whichcan change the phase diagram. In particular, for highly asymmetric dumbbells where thedipole moment of the small sphere is large, the potential energies of helical <strong>and</strong> columnar
Self-<strong>assembly</strong> of <strong>colloidal</strong> str<strong>in</strong>gs <strong>in</strong> a homogeneous external electricor magnetic field 25Figure 2.7: Left: Ground-state phase diagram for str<strong>in</strong>gs of 15 asymmetric dumbbells, asa function of size ratio q <strong>and</strong> dipole moment ratio p S /p L . The head-to-head configurationsconsist of alternat<strong>in</strong>g pairs of large <strong>and</strong> small spheres, while the buckled str<strong>in</strong>gs are str<strong>in</strong>gs oflarge particles with the small ones positioned at the contact po<strong>in</strong>ts of two large particles. Thecolumnar or helical structures consist of str<strong>in</strong>gs of small spheres with the large spheres arranged<strong>in</strong> multiple columns or <strong>in</strong> a helical structure. The dashed l<strong>in</strong>e illustrates dumbbells made out ofone material. Right: Cartoon of three dumbbell particles arranged <strong>in</strong> a str<strong>in</strong>g, with d chosensuch that the large part of the middle dumbbell touches the two small parts of its neighbours.structures are close together. S<strong>in</strong>ce we only calculated the potential energies of a limitedset of c<strong>and</strong>idate cluster configurations, with highly regular orientations of the particleswith<strong>in</strong> the str<strong>in</strong>g, the possibility of more irregular structures be<strong>in</strong>g favored cannot bediscounted. Therefore, the phase diagram shown <strong>in</strong> Fig. 2.7 is ma<strong>in</strong>ly a qualitative<strong>in</strong>dication of the expected cluster shapes. However, the structures <strong>in</strong> the ground-statephase diagram agree qualitatively with structures seen <strong>in</strong> simulations us<strong>in</strong>g high fieldstrengths.The boundaries between the different structures shift slightly based on the length ofthe str<strong>in</strong>g, but the observed structures seen rema<strong>in</strong> the same for longer str<strong>in</strong>gs. Whilechang<strong>in</strong>g center-of-mass distance d has some <strong>in</strong>fluence on the boundaries of these regimes,it does not seem to qualitatively change most of the <strong>self</strong>-assembled structures. However,chang<strong>in</strong>g d can strongly <strong>in</strong>fluence the columns <strong>and</strong> helices found at low size ratios withp L < p S .To further <strong>in</strong>vestigate the possibility of helical str<strong>in</strong>gs, we performed simulations ofhighly asymmetric dumbbells, where the dipole moment of the small spheres was much
26 Chapter 2Figure 2.8: Left: Structures result<strong>in</strong>g from the energy calculations, at various size ratios.Here, d = d t + 0.01, the same values as used <strong>in</strong> the simulations. The numbers <strong>in</strong>dicate the sizeratio. Both a side view <strong>and</strong> top view are shown for each size ratio. Right: Str<strong>in</strong>gs dipolarasymmetric dumbbells result<strong>in</strong>g from simulations start<strong>in</strong>g with a str<strong>in</strong>g consist<strong>in</strong>g of 50 particles,quenched to high field strengths, at various size ratios q as labeled <strong>and</strong> center-of-mass distanced = d t + 0.01.larger than that of the large spheres. For sufficiently high field strengths, the small sphereswill form a str<strong>in</strong>g, with the large spheres stick<strong>in</strong>g out to the sides. Depend<strong>in</strong>g on the sizeratio, these large spheres can form either columns around the central str<strong>in</strong>g, or helicalstructures. These chiral structures appear due to the frustrations caused by hard-core<strong>in</strong>teractions between the large spheres, which prevent them from l<strong>in</strong><strong>in</strong>g up along the fielddirection. By constra<strong>in</strong><strong>in</strong>g the large spheres to a narrow r<strong>in</strong>g-like volume around theirsmaller partners, these frustrations cannot be compensated by small deviations parallelto the str<strong>in</strong>g. This restriction can be obta<strong>in</strong>ed by choos<strong>in</strong>g the distance d between thetwo spheres of a dumbbell close to the m<strong>in</strong>imum value d t where the large particles touchesthe small spheres of nearby dumbbells <strong>in</strong> the str<strong>in</strong>g, as shown on the right <strong>in</strong> Fig. 2.7.For this case, the ground-state structures we obta<strong>in</strong>ed are shown on the left side of Fig.2.8 for six different size ratios.From the potential energy m<strong>in</strong>imization, we f<strong>in</strong>d that at size ratios just above σ L /σ s =0.5 the large form two columns close together <strong>and</strong> aligned parallel to the str<strong>in</strong>g. At slightlylarger size ratios, this configuration would lead to overlaps, <strong>and</strong> each column becomesbuckled. In this case, the two buckled columns tend to be on opposite sides of the str<strong>in</strong>g.For size ratio q < 0.47, the structure changes from columns to a double helix, decreas<strong>in</strong>g<strong>in</strong> pitch length as q decreases. Close to a size ratio of q = 0.33, the structure crossesover to three vertical columns, turn<strong>in</strong>g <strong>in</strong>to a triple helix once q < 1/3. For size ratiosq < 0.28, the large spheres will overlap <strong>in</strong> any configuration. At this po<strong>in</strong>t, the str<strong>in</strong>g of
Self-<strong>assembly</strong> of <strong>colloidal</strong> str<strong>in</strong>gs <strong>in</strong> a homogeneous external electricor magnetic field 27small particles will always be deformed.We now perform MC simulations to <strong>in</strong>vestigate the formation of these structures.To this end, we first carried out a normal simulation at low field strength, to allow thedumbbell particles to form str<strong>in</strong>gs of sufficient length. Subsequently, we quenched thesestr<strong>in</strong>gs to high field strengths, which should then mostly affect the positions of the largespheres along these str<strong>in</strong>gs. These simulations were performed at low pack<strong>in</strong>g fractionsη ≃ 0.01, with N = 200 dumbbell particles <strong>in</strong> the simulation box. For each size ratio, thedistance d between spheres was chosen just above d t to m<strong>in</strong>imize fluctuations of the largespheres parallel to the str<strong>in</strong>g. Due to the high field strengths, the formation of the str<strong>in</strong>gsis a process far out of equilibrium. The result<strong>in</strong>g str<strong>in</strong>g length distribution is thereforenot an equilibrium quantity that can be reliably measured from these simulations. S<strong>in</strong>cewe are mostly <strong>in</strong>terested <strong>in</strong> the configurations of <strong>in</strong>dividual str<strong>in</strong>gs after quench<strong>in</strong>g, thesesimulations can also be started from an <strong>in</strong>itial configuration conta<strong>in</strong><strong>in</strong>g one long str<strong>in</strong>g.When quench<strong>in</strong>g the system, the field strength is <strong>in</strong>creased <strong>in</strong> small steps (∆γ ≃ 1) dur<strong>in</strong>gthe simulation, eventually freez<strong>in</strong>g the system <strong>in</strong>to a local energy m<strong>in</strong>imum. At this po<strong>in</strong>t,we observe the result<strong>in</strong>g structures. Long str<strong>in</strong>gs form readily <strong>in</strong> <strong>systems</strong> with q > 0.4.For q < 0.4, the hard cores of the large spheres hamper the formation of str<strong>in</strong>gs of morethan four or five dumbbells. More asymmetric size ratios will also h<strong>in</strong>der reconfigurationswith<strong>in</strong> the str<strong>in</strong>g, as the hard-core <strong>in</strong>teractions severely limit the rotational freedom ofthe dumbbells. While chiral structures can be found <strong>in</strong> these simulations, defects <strong>and</strong>changes <strong>in</strong> the h<strong>and</strong>edness are regularly seen, s<strong>in</strong>ce both directions of chirality have equalprobability.On the right side of Fig. 2.8, we show snapshots from simulations start<strong>in</strong>g from an<strong>in</strong>itial configuration consist<strong>in</strong>g of a straight str<strong>in</strong>g of 50 r<strong>and</strong>omly oriented dumbbells.After quench<strong>in</strong>g, we observe that structures are formed similar to the predicted groundstatestructures, although defects <strong>in</strong> the structures exist <strong>in</strong> the structures result<strong>in</strong>g fromsimulations, as the system can get trapped <strong>in</strong> local energy m<strong>in</strong>ima dur<strong>in</strong>g the quench.In these simulations, the dipole moment of the small spheres is 5 times that of the largespheres, which is large enough to prevent break<strong>in</strong>g or bend<strong>in</strong>g of the str<strong>in</strong>g. While thesimulated str<strong>in</strong>gs show good agreement with the ground-state structures shown <strong>in</strong> Fig. 2.8,the spontaneous formation of regular chiral structures appears to be difficult. This may bea severe problem for experimentalists attempt<strong>in</strong>g to fabricate helical str<strong>in</strong>gs of asymmetricdumbbells by apply<strong>in</strong>g an external electric field. The difficulty can be expla<strong>in</strong>ed by the factthat the energy costs <strong>in</strong>volved <strong>in</strong> defects (which depend largely on next-nearest neighbor<strong>in</strong>teractions) are small compared to the ga<strong>in</strong> <strong>in</strong> entropy for additional disorder <strong>in</strong> thestr<strong>in</strong>g. Additionally, the free energy barrier that has to be overcome to change the localdirection of the chirality <strong>in</strong> a str<strong>in</strong>g is large, due to both hard-core <strong>in</strong>teractions <strong>and</strong>attractive forces.2.6 ConclusionsWe <strong>in</strong>vestigated the <strong>self</strong>-<strong>assembly</strong> <strong>and</strong> structure of str<strong>in</strong>gs <strong>in</strong> <strong>systems</strong> of <strong>colloidal</strong> particleswith dipole moments <strong>in</strong>duced by an external field. For dilute fluids of monodispersedipolar spheres dipoles, the distribution of str<strong>in</strong>g lengths can be effectively described
28 Chapter 2by a first order thermodynamic perturbation theory. This allows for a fast prediction ofexpected cluster sizes <strong>in</strong> str<strong>in</strong>g fluids, as long as str<strong>in</strong>gs do not cluster together. Potentially,this result could be used to obta<strong>in</strong> a rough estimate of the effective field strength <strong>in</strong>experimental <strong>systems</strong> if a str<strong>in</strong>g length distribution is known.In b<strong>in</strong>ary <strong>systems</strong>, str<strong>in</strong>gs of large particles with both r<strong>in</strong>g-like <strong>and</strong> flame-like clustersof small particles can be formed <strong>in</strong> highly asymmetric <strong>systems</strong>, where q = σ S /σ L ≪ 1.In <strong>systems</strong> with a size ratio of q = 0.8 alternat<strong>in</strong>g str<strong>in</strong>gs can be formed <strong>in</strong>stead. Whilethese structures are not thermodynamically stable, they persist <strong>in</strong> simulations on verylong timescales, <strong>and</strong> have been observed <strong>in</strong> experiments as well.Asymmetric hard dumbbells can form a variety of structures <strong>in</strong> an electric field. Whenthe particles are made out of a s<strong>in</strong>gle material, the lowest-energy structures are head-toheadstr<strong>in</strong>gs for nearly symmetric dumbbells, <strong>and</strong> buckled str<strong>in</strong>gs for more asymmetricparticles. However, <strong>in</strong> the case where the dipole moment of the small spheres is sufficientlyhigh, the lowest-energy structure consists of a str<strong>in</strong>g of small spheres, with the largespheres either positioned <strong>in</strong> multiple columns or <strong>in</strong> a helical structure around the str<strong>in</strong>g. Itshould be noted that defects are expected to be common <strong>in</strong> spontaneously formed clustersof dumbbells, due to the large free energy barriers <strong>in</strong>volved <strong>in</strong> chang<strong>in</strong>g the chirality ofthe helical structure.2.7 AcknowledgementsI would like to thank Rao Vutukuri for perform<strong>in</strong>g the experiments discussed <strong>in</strong> thischapter.2.8 Appendix: Experimental setupIn the experimental setups shown <strong>in</strong> Fig. 2.2, the <strong>colloidal</strong> dispersion consisted of equalamounts (1.8 wt%) of small <strong>and</strong> large PMMA spheres <strong>in</strong> CHB. The polymethylmethacrylate(PMMA)particles were synthesized by dispersion polymerization, covalently labelledwith the fluorescent dye 7-nitrobenzo-2-oxa-1, 3-diazol (NBD) or rhodam<strong>in</strong>e isothiocyanate(RITC) <strong>and</strong> sterically stabilized with poly(12-hydroxystearicacid) [50]. We usedboth suspensions with a size ratio of 0.25 (σ L = 2.40µm <strong>and</strong> σ S = 0.60µm) <strong>and</strong> size ratio0.7 (σ L = 1.50µm <strong>and</strong> σ S = 1.05µm). The particles were dispersed <strong>in</strong> a 3:1 wt/wt mixtureof cyclohexyl bromide (Fluka) <strong>and</strong> cis-decal<strong>in</strong> (Sigma), saturated with tetrabutylammoniumbromide (TBAB, Sigma). In this mixture, the particles were nearly density <strong>and</strong>refractive-<strong>in</strong>dex-matched, <strong>and</strong> they behaved like hard spheres [24]. All solvents were usedas received without any further purification. The solutions were placed <strong>in</strong> sample cellswith attached electrodes. After fill<strong>in</strong>g the cell with the <strong>colloidal</strong> suspension, we sealed atboth ends with UV-cur<strong>in</strong>g optical adhesive (Norl<strong>and</strong> no.68), <strong>and</strong> we studied particle dynamicsby means of confocal laser scann<strong>in</strong>g microscopy (Leica TCS SP2). An oscillat<strong>in</strong>gelectric field was applied us<strong>in</strong>g a function generator (Agilent, Model 3312 OA) <strong>and</strong> a wideb<strong>and</strong> voltage amplifier (Krohn-Hite, Model 7602M). Subsequently, the structures formed<strong>in</strong> the cell were permanently fixed us<strong>in</strong>g a thermal anneal<strong>in</strong>g method. The cell was then
Self-<strong>assembly</strong> of <strong>colloidal</strong> str<strong>in</strong>gs <strong>in</strong> a homogeneous external electricor magnetic field 29carefully opened <strong>and</strong> dried on a scann<strong>in</strong>g electron microscopy grid, <strong>and</strong> the rema<strong>in</strong><strong>in</strong>gclusters were imaged with a scann<strong>in</strong>g electron microscope (FEI, XL30FEG).
3Phase diagram of <strong>colloidal</strong> spheres<strong>in</strong> a biaxial electric or magneticfieldColloidal particles with a dielectric constant mismatch with the surround<strong>in</strong>g solvent <strong>in</strong>an external biaxial magnetic or electric field experience an “<strong>in</strong>verted” dipolar <strong>in</strong>teraction.We determ<strong>in</strong>e the phase behavior of such a system us<strong>in</strong>g Helmholtz free energy calculations<strong>in</strong> Monte Carlo simulations for <strong>colloidal</strong> hard spheres as well as for charged hardspheres <strong>in</strong>teract<strong>in</strong>g with a repulsive Yukawa potential. The phase diagram of <strong>colloidal</strong>hard spheres with “<strong>in</strong>verted” dipolar <strong>in</strong>teractions shows a gas-liquid transition, a hexagonalABC stacked crystal phase, <strong>and</strong> a stretched hexagonal-close-packed (hcp) crystal. Thephase diagram for charged spheres is very similar, but displays an additional layered-fluidphase. We compare our results with recent experimental observations.
32 Chapter 33.1 IntroductionThe phase behavior of <strong>colloidal</strong> particles <strong>in</strong> a suspension can be <strong>in</strong>fluenced by apply<strong>in</strong>g anoscillat<strong>in</strong>g external magnetic or electric field. If the magnetic susceptibility or dielectricconstant of the <strong>colloidal</strong> particles differs from that of the solvent, the particles will acquirea dipole moment along an external uniaxial field, lead<strong>in</strong>g to dipolar <strong>in</strong>teractions betweenthe particles. In this way, the <strong>colloidal</strong> <strong>in</strong>teractions can be tuned reversibly without hav<strong>in</strong>gto modify the chemistry of the <strong>colloidal</strong> particles or the solvents <strong>in</strong>volved. Hence, anexternal uniaxial electric or magnetic field leads to a greater control over the macroscopicphase behavior <strong>and</strong> structure of the <strong>colloidal</strong> system. The phase behavior of both hard<strong>and</strong> charged colloids with aligned dipolar <strong>in</strong>teractions obta<strong>in</strong>ed by apply<strong>in</strong>g an externaluniaxial field has been studied theoretically[51, 52] <strong>and</strong> experimentally[24, 25, 30, 31]extensively. In addition, the phase diagram of charged <strong>and</strong> uncharged dipolar hard sphereshas been determ<strong>in</strong>ed by free energy calculations us<strong>in</strong>g Monte-Carlo simulations.[26] In thiswork, it was shown that three new crystal structures, i.e., hexagonal-close-packed (hcp),body-centered-tetragonal (bct), <strong>and</strong> body-centered-orthorhombic (bco) phases, can bestabilized by apply<strong>in</strong>g an external uniaxial field. For completeness, we mention that thebehavior of <strong>colloidal</strong> particles with permanent dipole moments <strong>in</strong> external fields [53–55]<strong>and</strong> <strong>in</strong> conf<strong>in</strong>ement [56, 57], has been widely <strong>in</strong>vestigated as well.By apply<strong>in</strong>g multi-axial fields, more complicated anisotropic <strong>in</strong>teractions can be <strong>in</strong>duced,lead<strong>in</strong>g to the formation of more complex particle structures.[58] In this chapter,we determ<strong>in</strong>e the phase diagram of <strong>colloidal</strong> particles <strong>in</strong> an external biaxial electric ormagnetic field, which can be obta<strong>in</strong>ed by rotat<strong>in</strong>g or r<strong>and</strong>omly chang<strong>in</strong>g the field direction.Effectively, the particles have a rotat<strong>in</strong>g dipole moment <strong>in</strong> the plane of the rotat<strong>in</strong>gfield. If the frequency of the rotat<strong>in</strong>g field is sufficiently high, the particles experience arotationally or time averaged dipolar <strong>in</strong>teraction, lead<strong>in</strong>g to a net attraction <strong>in</strong> the planeof the biaxial field, <strong>and</strong> a repulsion perpendicular to the field. The time-averaged dipolar<strong>in</strong>teraction that the particles experience <strong>in</strong> a uniaxial field rotat<strong>in</strong>g <strong>in</strong> the xy-plane is just−1/2 times the dipolar <strong>in</strong>teraction <strong>in</strong> a uniaxial field oriented <strong>in</strong> the z-direction, <strong>and</strong> canbe regarded as a negative or “<strong>in</strong>verted” dipolar <strong>in</strong>teraction. In contrast to the relativelysimple dipolar <strong>in</strong>teraction, the “<strong>in</strong>verted” dipolar <strong>in</strong>teractions between the colloids giverise to a gas-liquid coexistence at low field strengths. At higher field strengths, largehexagonal sheets of particles form, eventually merg<strong>in</strong>g <strong>in</strong>to a crystal phase.Simulations of granular particles <strong>in</strong> various biaxial <strong>and</strong> multi-axial fields have been performedby Mart<strong>in</strong> et al.,[58–61] with a focus on k<strong>in</strong>etics <strong>and</strong> non-equilibrium structures, aswell as magnetic properties of the structures formed. The magnetic properties have alsobeen compared to experimental results measured <strong>in</strong> <strong>systems</strong> of magnetic field-structuredcomposites, formed by polymeriz<strong>in</strong>g the solvent while the particles are <strong>in</strong> the externalfield. [62] In a study of freely rotat<strong>in</strong>g permanent dipoles <strong>in</strong> a rotat<strong>in</strong>g field, Murashov<strong>and</strong> Patey showed the formation of sheet-like <strong>and</strong> layered structures for a range of angularvelocities of the external field, us<strong>in</strong>g Molecular Dynamics <strong>and</strong> Brownian Dynamicssimulations.[63] In these <strong>systems</strong>, the formation of layers highly depends on the momentof <strong>in</strong>ertia of the dipoles <strong>and</strong> the frequency of the rotat<strong>in</strong>g field. More recently, <strong>colloidal</strong><strong>systems</strong> <strong>in</strong> an external biaxial electric field have been <strong>in</strong>vestigated us<strong>in</strong>g confocal microscopy,[64] show<strong>in</strong>g the formation of large hexagonal sheet-like structures, which were
Phase diagram of <strong>colloidal</strong> spheres <strong>in</strong> a biaxial electric or magneticfield 33made permanent by thermal anneal<strong>in</strong>g. The formation of these sheets <strong>in</strong> two-dimensional<strong>systems</strong> has also been studied experimentally [65] with the particles conf<strong>in</strong>ed to an <strong>in</strong>terface.In this chapter, we <strong>in</strong>vestigate us<strong>in</strong>g Monte Carlo simulations the equilibrium phasebehavior of charged <strong>and</strong> uncharged <strong>colloidal</strong> hard spheres <strong>in</strong>teract<strong>in</strong>g with an “<strong>in</strong>verted”dipolar <strong>in</strong>teraction. Additionally, we map out the phase diagrams for both <strong>systems</strong> us<strong>in</strong>gfree energy calculations.3.2 MethodsWe perform Monte Carlo simulations <strong>in</strong> the canonical (NV T ) <strong>and</strong> isothermal-isobaric(NP T ) ensemble, where we fix the volume V <strong>and</strong> pressure P , respectively. In addition,we keep the number of particles N <strong>in</strong> the system fixed <strong>and</strong> the temperature T . We performsimulations of N = 384 − 432 particles. Larger <strong>systems</strong> were used for the layered-fluidphase <strong>and</strong> the low-density crystals to reduce f<strong>in</strong>ite-size effects. F<strong>in</strong>ite size effects werechecked by perform<strong>in</strong>g the same free energy calculation <strong>in</strong> a larger system (N = 900)at one po<strong>in</strong>t <strong>in</strong> each phase diagram. This caused the fluid-solid coexistence pack<strong>in</strong>gfractions to shift by less than 0.005 <strong>in</strong> both the charged <strong>and</strong> uncharged system, whichrema<strong>in</strong>s with<strong>in</strong> our statistical error bars.Cluster moves were <strong>in</strong>troduced to move or rotate clusters of particles at once <strong>in</strong> orderto speed up equilibration of the layered-fluid phase. In the <strong>in</strong>itial step of a cluster move,a r<strong>and</strong>om particle <strong>in</strong> the system is selected <strong>and</strong> taken as the center of the cluster. Weconstruct a cyl<strong>in</strong>drical volume around this particle with its symmetry axis aligned alongthe z-axis. The radius r c <strong>and</strong> height h are selected r<strong>and</strong>omly from a uniform distribution.For our simulations, we use 0 < r c < m<strong>in</strong>(L x , L y ) <strong>and</strong> 0 < h < σ. All particles positionedwith their center of mass <strong>in</strong> the cyl<strong>in</strong>der are considered to be part of the cluster <strong>and</strong>are moved collectively. In the case of a rotation move, the particles are rotated aroundthe central particle <strong>in</strong> the plane of the external field. In the case of a translation move,the particles are given the same r<strong>and</strong>om displacement dr. The number of particles <strong>in</strong>the cluster volume is counted before <strong>and</strong> after the cluster move. If any new particles arepresent <strong>in</strong> the cluster volume after the move, mov<strong>in</strong>g the same cluster <strong>in</strong> reverse wouldalso move these extra particles. As this would break detailed balance, any cluster moveswhere the number of particles <strong>in</strong> the chose cyl<strong>in</strong>der around the central particle changesare rejected. Eventually, the translation or rotation is accepted or rejected based on theBoltzmann factor exp(−β(U new − U old )).In our model, we assume an external rotat<strong>in</strong>g electric or magnetic field <strong>in</strong> the xy-planeof our system. The <strong>colloidal</strong> particles experience an “<strong>in</strong>verted” dipolar <strong>in</strong>teraction givenby:βu <strong>in</strong>v (r ij ) = − γ ( ) 3σ(1 − 3 cos 2 θ ij ), (3.1)4 r ijwhere r ij is the center-of-mass distance vector between particles i <strong>and</strong> j, θ ij denotes theangle that r ij forms with the z-axis, σ is the diameter of the particle, <strong>and</strong> β = 1/k B T withk B Boltzmann’s constant. In the case of an external electric field E, the dimensionless
34 Chapter 3prefactor γ <strong>in</strong> Eq. (3.1) is given byγ = πα2 ɛ s σ 3 |E| 28k B T(3.2)where α = (ɛ p − ɛ s )/(ɛ p + 2ɛ s ) is the dielectric contrast factor with ɛ p,s the dielectricconstants of the particles <strong>and</strong> the solvent, respectively. Similarly, <strong>in</strong> the case of an externalmagnetic field H, γ is written asγ = πα2 µ s σ 3 |H| 28k B T(3.3)where α = (µ p − µ s )/(µ p + 2µ s ) <strong>and</strong> µ p,s is the magnetic susceptibilities of the particles<strong>and</strong> the solvent, respectively. We note that for γ = 1, the maximum value of the pairpotential, i.e. 0.5k B T , is reached, when two adjacent particles are aligned along the z-axis. The m<strong>in</strong>imum value (-0.25k B T ) is obta<strong>in</strong>ed when both adjacent particles are <strong>in</strong> thexy-plane. In addition, the <strong>colloidal</strong> hard spheres <strong>in</strong>teract with a hard-sphere potentialgiven by{0, rij ≥ σβu hs (r ij ) =∞, r ij < σ , (3.4)while we use a repulsive hard-core Yukawa potential <strong>in</strong> the case of charged spheres⎧⎪⎨ ɛ exp[−κ(r ij − σ)], rβu Y (r ij ) = r ij /σij ≥ σ, (3.5)⎪⎩ ∞, r ij < σwhereɛ =Z 2(1 + κσ/2) 2 λ Bσ(3.6)is a constant prefactor depend<strong>in</strong>g on the <strong>colloidal</strong> charge number Z, Debye screen<strong>in</strong>glength κ −1 <strong>and</strong> Bjerrum length λ B = e 2 /ɛ s k B T with e the elementary charge. Eq. (3.5)is the pair potential given by the Derjagu<strong>in</strong>-L<strong>and</strong>au-Verwey-Overbeek theory for chargedcolloids.[42] We have neglected the Van der Waals attraction <strong>in</strong> Eq. (3.5) as we are<strong>in</strong>terested <strong>in</strong> refractive <strong>in</strong>dex matched <strong>systems</strong>. The repulsion <strong>in</strong>creases the distancebetween the layers of the crystal phase, <strong>and</strong> causes part of the liquid phase to formfluid-like layers.The Ewald summation is employed to calculate the long-range dipolar <strong>in</strong>teractions.[17,23] The calculation of the “<strong>in</strong>verted” dipolar <strong>in</strong>teractions us<strong>in</strong>g the Ewald summationmethod is largely identical to the method used for normal dipolar <strong>systems</strong>, with theexception of the term related to the boundary conditions. In this case, we assume conduct<strong>in</strong>gboundary conditions. We first note that the “<strong>in</strong>verted” dipolar <strong>in</strong>teraction, whichis formed by a time-averaged rotat<strong>in</strong>g dipolar <strong>in</strong>teraction <strong>in</strong> the xy-plane, is identicalto the averaged <strong>in</strong>teraction <strong>in</strong>duced by two perpendicular external uniaxial fields <strong>in</strong> thexy-plane. Hence, the total potential energy of the system is the average of two energycalculations. The correction factor can be derived by summ<strong>in</strong>g the effect of the boundaryconditions on both of these calculations.
Phase diagram of <strong>colloidal</strong> spheres <strong>in</strong> a biaxial electric or magneticfield 35For non-conduct<strong>in</strong>g boundary conditions, the total potential energy of a specific configuration{r N } of the “<strong>in</strong>verted” dipolar system U<strong>in</strong>vnc equals the average of the totalpotential energy of two dipolar <strong>systems</strong> with uniaxial fields <strong>in</strong> the x <strong>and</strong> y directions:U<strong>in</strong>v nc = U xnc + Uync2= − 1 2 U ncz . (3.7)For normal dipolar <strong>in</strong>teractions the difference between non-conduct<strong>in</strong>g <strong>and</strong> conduct<strong>in</strong>gboundary conditions is given by:[17]Ux,y,z cond = Ux,y,z nc − 2π M · M, (3.8)3Vwhere U cond is the <strong>in</strong>teraction with conduct<strong>in</strong>g boundary condition <strong>and</strong> M is the squareof the total dipole moment of the system, with M·M = γN 2 /2. Comb<strong>in</strong><strong>in</strong>g the difference<strong>in</strong> potential energy between conduct<strong>in</strong>g <strong>and</strong> non-conduct<strong>in</strong>g boundary conditions for thetwo dipolar <strong>systems</strong> with perpendicular uniaxial fields, yields:U<strong>in</strong>v cond = U xcond + Uycond2= U xnc + Uync− 2π γN 22 3V 2= − 1 2 U znc − 2π γN 23V 2= − 1 2 U condz− π VγN 2(3.9)(3.10)(3.11)2 . (3.12)As a result, we can calculate the potential energy of a biaxial system with conduct<strong>in</strong>gboundary conditions U<strong>in</strong>vcond from the energy of the same configuration <strong>in</strong> a system withnormal dipolar <strong>in</strong>teractions by multiply<strong>in</strong>g the energy by −1/2 <strong>and</strong> add<strong>in</strong>g the abovecorrection term −πγN 2 /2V .The Helmholtz free energies of the ABC stacked crystals were calculated us<strong>in</strong>g theE<strong>in</strong>ste<strong>in</strong> <strong>in</strong>tegration method.[17, 66] In addition, we calculate the Helmholtz free energyas a function of density by <strong>in</strong>tegrat<strong>in</strong>g the equation of state. We determ<strong>in</strong>e the coexist<strong>in</strong>gdensities with the fluid phase by employ<strong>in</strong>g the common tangent construction. Athigh densities, a coexistence between face-centered-cubic (fcc) <strong>and</strong> hexagonal-close-packed(hcp) crystal phases occurs. The free energy difference between these structures is on theorder of 10 −3 k B T , <strong>and</strong> therefore hard to measure with sufficient statistical accuracy us<strong>in</strong>gthis method. Instead, we use the hard-sphere crystal as a reference state for bothstructures, <strong>and</strong> calculate the free energy as a function of the <strong>in</strong>teraction strength by us<strong>in</strong>ga thermodynamic <strong>in</strong>tegration path consist<strong>in</strong>g of a gradual <strong>in</strong>crease <strong>in</strong> the field strength.For these crystals, only the free energy difference between hcp <strong>and</strong> fcc stack<strong>in</strong>g is needed,which was l<strong>in</strong>early <strong>in</strong>terpolated from literature values for this difference at coexistence <strong>and</strong>close pack<strong>in</strong>g [67]. Due to the narrow coexistence region, <strong>and</strong> a large estimated error <strong>in</strong>the free energy calculations, we only show one coexistence l<strong>in</strong>e between these high-densitycrystal phases. The estimated error <strong>in</strong> the coexistence field strength γ is on the order of0.5. For the fluid phase, the hard-sphere fluid (us<strong>in</strong>g the equation of state by Speedy [68])<strong>and</strong> ideal gas were used as reference states for the liquid <strong>and</strong> the gas, respectively.
36 Chapter 3For the free energy of the layered-fluid phase <strong>in</strong> the case of charged spheres, we use amethod similar to the one employed by Bolhuis <strong>and</strong> Frenkel for the smectic phase of hardspherocyl<strong>in</strong>ders.[69] Via a thermodynamic <strong>in</strong>tegration path, we relate the free energy ofthe layered fluid <strong>in</strong> the system of charged spheres with <strong>in</strong>verted dipolar <strong>in</strong>teractions to thefree energy of a hard sphere fluid. This <strong>in</strong>tegration is done <strong>in</strong> two steps. We first couplethe particles to their layers by apply<strong>in</strong>g an external s<strong>in</strong>usoidal potential while turn<strong>in</strong>g offthe <strong>in</strong>teractions. The result<strong>in</strong>g potential <strong>in</strong> the system depends on a switch<strong>in</strong>g coefficientλ:U(λ) = λU s<strong>in</strong> + (1 − λ)U <strong>in</strong>t , (3.13)=N∑λα s<strong>in</strong>(2πn l z i /L z ) + (1 − λ)U <strong>in</strong>t , (3.14)i=0with U s<strong>in</strong> <strong>and</strong> U <strong>in</strong>t the total energy <strong>in</strong> the system due to the external potential <strong>and</strong> theparticle <strong>in</strong>teractions, respectively. The factor α is the strength of the s<strong>in</strong>usoidal potential<strong>and</strong> is chosen such that the particles <strong>in</strong> the layer rema<strong>in</strong> disordered for all 0 < λ < 1.The number of layers n l <strong>and</strong> the height of the box L z are chosen such that they matchthe equilibrium layer spac<strong>in</strong>g measured from <strong>in</strong>dependent NP T simulations. The freeenergy difference between F <strong>in</strong>v − F s<strong>in</strong> the system with <strong>in</strong>verted dipolar <strong>in</strong>teractions <strong>and</strong>the system with the s<strong>in</strong>usoidal potential is given by:β(F <strong>in</strong>v − F s<strong>in</strong> ) =∫ 01dλ 〈U s<strong>in</strong> − U <strong>in</strong>t 〉 λ− ln V. (3.15)The result<strong>in</strong>g system consists of hard spheres conf<strong>in</strong>ed to layers by the external potential.To allow equilibration of the density with<strong>in</strong> the layers throughout the whole system,we use shifted boundary conditions, such that the fluid layers are <strong>in</strong>terconnected at theedges of the simulation box. In our simulation, a particle that leaves the simulation box<strong>in</strong> the x-direction, does not only enter the simulation box at the opposite face, but is alsoshifted <strong>in</strong> the z-direction by one fluid layer, i.e., by L z /n l . The direction of the shift isdeterm<strong>in</strong>ed by the direction <strong>in</strong> which the particle leaves the simulation box. In this way,the particles can diffuse throughout the whole system, as there is effectively one s<strong>in</strong>glelayer, which allows for the relaxation of the density with<strong>in</strong> each fluid layer. Of course, theenergy calculations should also <strong>in</strong>corporate this shift. For the Yukawa <strong>in</strong>teraction <strong>and</strong> thereal space contribution of the Ewald sums, this can be done by simply calculat<strong>in</strong>g the energyfrom the relevant image particles. For the reciprocal space contribution of the Ewaldsummation, we use the fact that the system is still periodic along x, but with a period n ltimes larger <strong>and</strong> with n l times more particles. S<strong>in</strong>ce the contributions from these extraparticles are the same as those <strong>in</strong> the orig<strong>in</strong>al box, but multiplied by a complex factor,the energy calculation does not require significant extra computer time.The free energy of the system of pure hard spheres <strong>in</strong> an external s<strong>in</strong>usoidal potentialcan be calculated <strong>in</strong> two ways. Turn<strong>in</strong>g off the potential, the system transforms gradually<strong>in</strong>to an isotropic hard-sphere fluid, which can be used as a reference state. The freeenergy difference between the hard sphere fluid <strong>and</strong> hard spheres <strong>in</strong> an external s<strong>in</strong>usoidalpotential can be calculated similar to Eq. 3.15, but without <strong>in</strong>verted dipolar <strong>in</strong>teractions.Comb<strong>in</strong><strong>in</strong>g the two steps, the free energy of the layered fluid can then be calculated as:βF <strong>in</strong>v = βF HS +∫ 10dλ 〈U s<strong>in</strong> 〉 HSλ+∫ 01dλ 〈U s<strong>in</strong> − U <strong>in</strong>t 〉 λ,
Phase diagram of <strong>colloidal</strong> spheres <strong>in</strong> a biaxial electric or magneticfield 37with F HS the free energy of a hard sphere fluid at the same density as the layered fluid,<strong>and</strong> with the first <strong>in</strong>tegral evaluated without <strong>in</strong>verted dipolar <strong>in</strong>teractions. Alternatively,if the strength of the external s<strong>in</strong>usoidal potential is sufficiently high, the particles arestrongly constra<strong>in</strong>ed to their layer <strong>and</strong> the system behaves effectively as a two-dimensionalhard-disk fluid with additional harmonic vibrations perpendicular to the plane, for whichone can calculate the free energy analytically. We checked that the free energies us<strong>in</strong>gboth methods are equal with<strong>in</strong> our statistical errorbars. However, s<strong>in</strong>ce <strong>in</strong>tegrat<strong>in</strong>g to ahard sphere fluid uses a shorter <strong>in</strong>tegration path, the numerical errors <strong>in</strong> this method aresmaller. Note that two <strong>in</strong>tegration paths are needed: <strong>in</strong> the first path, we switch off the<strong>in</strong>verted dipolar <strong>in</strong>teractions, but we have to switch on an external s<strong>in</strong>usoidal potential tokeep the symmetry of the fluid. In the second path, we turn off the s<strong>in</strong>usoidal potentialto obta<strong>in</strong> a homogeneous fluid phase.3.3 Hard spheres <strong>in</strong> a biaxial fieldWe plot the calculated phase diagram for hard spheres <strong>in</strong> a biaxial field <strong>in</strong> Fig. 3.1. In Fig.3.2, we show snapshots of the system <strong>in</strong> various phases, as denoted by the crosses <strong>in</strong> thephase diagram (Fig. 3.1). At γ = 0, the well-known hard-sphere fluid-fcc (hexagonal ABCstacked) phase behavior is recovered. As opposed to the normal dipolar hard spheres,[26]we f<strong>in</strong>d at γ ≃ 6 a gas-liquid coexistence for this system. We note that well-<strong>in</strong>side the gasliquidcoexistence region, system-size spann<strong>in</strong>g slabs of liquid <strong>and</strong> gas are formed, whichare aligned <strong>in</strong> the plane of the rotat<strong>in</strong>g field. Moreover, the system can phase separate<strong>and</strong>/or change phase very easily. It is tempt<strong>in</strong>g to speculate that these observations aredue to a strongly anisotropic gas-liquid <strong>in</strong>terfacial tension, which is much lower for theplane parallel to the biaxial field than the orthogonal planes.Additionally, we f<strong>in</strong>d two stable crystal structures <strong>in</strong> the phase diagram. At maximumpack<strong>in</strong>g the fcc crystal is favored for low field strengths due to the small free energydifference between fcc <strong>and</strong> hcp, where fcc is the most stable phase <strong>in</strong> the case of hardspheres (γ = 0). The orientation of the crystal phase with respect to the field has no effecton its energy when the crystal is not deformed, however, at non-zero field strengths, thecrystal is compressed <strong>in</strong> the plane of the field <strong>and</strong> stretched <strong>in</strong> the perpendicular direction,lead<strong>in</strong>g to a difference <strong>in</strong> free energy between the possible orientations for the crystal. Asa result, the stable structure consists of hexagonal sheets parallel to the field plane.The lowest-energy structure of this system is a close-packed hcp crystal, with thehexagonal planes perpendicular to the plane of the rotat<strong>in</strong>g field. The energy per particlefor this orientation (−1.48138(1)γkT ) is slightly lower than that of hcp with sheetsoriented parallel to the field (−1.48012(1)γkT ) or that of fcc (−1.48096(1)γkT , for anyorientation). Evidently, the free energy difference between fcc <strong>and</strong> hcp is very small forthe different orientations, <strong>and</strong> hcp is only stable <strong>in</strong> a small pocket at very high densities.At lower densities, the stable structure is fcc. We wish to remark here that the fcc <strong>and</strong>the hcp phases are not entirely symmetric, but are slightly stretched <strong>in</strong> the z-direction.Hence, the fcc phase is an ABC-stacked crystal of hexagonal sheets, oriented along thexy-plane, while <strong>in</strong> the hcp phase the hexagonal planes themselves are stretched. Stack<strong>in</strong>gdefects are likely to occur, s<strong>in</strong>ce the free energy loss is only on the order of 10 −3 kT γ per
38 Chapter 3Figure 3.1: Phase diagram for hard spheres <strong>in</strong> an external biaxial electric or magnetic field<strong>in</strong> the dipole moment strength γ versus pack<strong>in</strong>g fraction η representation. The black circlesdenote the po<strong>in</strong>ts where the phase boundaries were determ<strong>in</strong>ed, while the gray areas denote thecoexistence regions. The tiel<strong>in</strong>es that connect the coexist<strong>in</strong>g phases are vertical. The hexagonalABC stacked crystal phase can be regarded as an fcc crystal, which is stretched <strong>in</strong> the directionperpendicular to the field <strong>and</strong> is oriented with the hexagonal planes parallel to the plane of thebiaxial field, as illustrated by the two perpendicular arrows <strong>in</strong>dicat<strong>in</strong>g the plane of the field <strong>in</strong>the schematic picture. The stretched hcp is oriented with the hexagonal planes perpendicularto the biaxial field, as illustrated by the ⊗ <strong>and</strong> arrow <strong>in</strong> the picture, with ⊗ <strong>in</strong>dicat<strong>in</strong>g the axisperpendicular to the page, <strong>and</strong> is slightly stretched <strong>in</strong> the direction perpendicular to the field.The top axis shows the electric field strength correspond<strong>in</strong>g to the dipole moment strength γ,us<strong>in</strong>g the experimental values α = −0.22, ɛ s = 5.8ɛ 0 , σ = 2µm, <strong>and</strong> T = 300K.[64] The crossesdenote the po<strong>in</strong>ts where the snapshots <strong>in</strong> Fig. 3.2 were taken.
Phase diagram of <strong>colloidal</strong> spheres <strong>in</strong> a biaxial electric or magneticfield 39Figure 3.2: Left: Snapshots of typical simulation configurations for hard spheres with <strong>in</strong>verteddipolar <strong>in</strong>teractions. The arrows <strong>in</strong>dicate the two field directions, with ⊗ <strong>in</strong>dicat<strong>in</strong>g the axisperpendicular to the page. a) A low-density fluid at γ = 2, η = 0.11. b) A higher density fluid,with γ = 8 <strong>and</strong> η = 0.43. c) Crystall<strong>in</strong>e ABC-stacked hexagonal layers of spheres at η = 0.58<strong>and</strong> γ = 8. d) The stretched hcp crystal at γ = 9, η = 0.71. Note that the stretched hexagonalplanes are perpendicular to the field plane.Right: Equations of state for hard spheres with <strong>in</strong>verted dipolar <strong>in</strong>teractions at field strengthsγ = 6, 8, 18. The l<strong>in</strong>es are fits through the data, us<strong>in</strong>g dashed l<strong>in</strong>es for the crystals <strong>and</strong> solidl<strong>in</strong>es for the fluids. The green horizontal l<strong>in</strong>es show the coexistences. For γ = 8 <strong>and</strong> 18 thecoexistences with a gas at near-zero pressure have been omitted.particle at close pack<strong>in</strong>g, <strong>and</strong> becomes even lower at lower densities.Solitary sheets or rafts can appear at high field strengths whenever there are <strong>in</strong>sufficientparticles <strong>in</strong> the simulation box to form a box-spann<strong>in</strong>g sheet. However, if the fields arestrong enough to form these structures, <strong>and</strong> there are multiple sheets <strong>in</strong> the box, theywill jo<strong>in</strong> <strong>in</strong>to a crystal if their orientation matches, show<strong>in</strong>g that these structures are notstable on their own. Our phase diagram expla<strong>in</strong>s these f<strong>in</strong>d<strong>in</strong>gs as it displays <strong>in</strong>deed anenormous widen<strong>in</strong>g of the solid-gas transition for <strong>in</strong>creas<strong>in</strong>g γ. We note that the tiel<strong>in</strong>esthat connect the coexist<strong>in</strong>g phases are vertical <strong>in</strong> Fig. 3.1. Hence, the coexist<strong>in</strong>g gas <strong>and</strong>solid phases becomes progressively more dilute <strong>and</strong> dense, respectively, upon <strong>in</strong>creas<strong>in</strong>gγ, yield<strong>in</strong>g coexistence of a dense solid phase with a gas phase, which is extremely dilute.Equations of state for the fluid <strong>and</strong> fcc phases at field strengths γ = 6, 8, 18 are shownon the right side of Fig. 3.2. For γ = 6, a gas, liquid <strong>and</strong> solid branch are shown, withthe coexistences denoted by horizontal l<strong>in</strong>es. For γ = 8, only the liquid <strong>and</strong> solid branchare shown, as the liquid coexists with a gas at near zero density. At γ = 18, we show onlythe fcc branch, which aga<strong>in</strong> coexists with an extremely dilute gas.3.4 Charged spheres <strong>in</strong> a biaxial fieldThe <strong>colloidal</strong> particles that are used <strong>in</strong> experimental <strong>systems</strong> are often charged, due toionisable groups on their surfaces, which dissociate when suspended <strong>in</strong> a solvent. The bare
40 Chapter 3Coulombic repulsions between the <strong>colloidal</strong> particles are then screened by the ions <strong>in</strong> thesolvent, lead<strong>in</strong>g to a Yukawa or screened-Coulombic <strong>in</strong>teraction.[42] In our simulations,we choose an <strong>in</strong>verse screen<strong>in</strong>g length of κσ = 10, <strong>and</strong> surface charge Z 2 λ B /σ = 450. Thephase diagram for charged spheres <strong>in</strong> an external biaxial field is shown <strong>in</strong> Fig. 3.3. In Fig.3.4, we show the equations of state for three field strengths. For γ = 10, the fluid <strong>and</strong>crystal branch are shown. At γ = 16, the liquid <strong>and</strong> solid branch are shown, omitt<strong>in</strong>g thecoexistence with a gas at near zero pressure. For γ = 24, we aga<strong>in</strong> show only the crystalbranch, which also coexists with a gas at extremely low pressures.At γ = 0, we f<strong>in</strong>d a fluid-fcc (hexagonal ABC) coexistence with coexist<strong>in</strong>g pack<strong>in</strong>g fractionsη fluid = 0.31 <strong>and</strong> η fcc = 0.32. Additionally, we aga<strong>in</strong> f<strong>in</strong>d a gas-liquid coexistence,which is shifted to much lower densities compared to that of hard spheres. Moreover,the coexist<strong>in</strong>g liquid becomes <strong>in</strong>homogeneous for field strengths γ > 16, <strong>and</strong> system-sizespann<strong>in</strong>g fluid-like layers are formed with their orientations aligned <strong>in</strong> the plane of therotat<strong>in</strong>g field. Fig. 3.4c shows a typical configuration of a layered-fluid phase. The<strong>in</strong>homogeneous structure of the fluid phase can be expla<strong>in</strong>ed by the Yukawa repulsionbetween the particles, which not only <strong>in</strong>creases the distances between the particles with<strong>in</strong>each sheet, but also <strong>in</strong>duces a repulsion between neighbor<strong>in</strong>g sheets. Particles can diffusefrom one layer to another, but close to the triple po<strong>in</strong>t, this process slows down significantly.In addition, we also observe large fluctuations <strong>in</strong> the distances between adjacentsheets at low pressures, <strong>in</strong>dicat<strong>in</strong>g a low free energy cost to create an <strong>in</strong>terface betweenthe gas <strong>and</strong> the layered-fluid phase. Consequently, at low densities the system can easilyform small numbers of fluid layers, which are separated by a dilute gas phase. It is likelythat the same would happen <strong>in</strong> experiments at low pack<strong>in</strong>g fractions, especially when thesheets are too large to move easily. At low field strengths, a stable homogeneous liquidexists <strong>in</strong> between the layered-fluid phase <strong>and</strong> the stable crystal phase, but disappearswhen γ > 19. The transition between the layered-fluid phase <strong>and</strong> the isotropic liquidappears to be cont<strong>in</strong>uous as no hysteresis can be seen <strong>in</strong> the equation of state, <strong>and</strong> theamplitude <strong>in</strong> the density profile of the layers changes cont<strong>in</strong>uously with field strength<strong>and</strong> density. Exemplarily, the left side of Fig. 3.5 displays the pair correlation functionthat measures the positional order <strong>in</strong> the direction perpendicular to the field for vary<strong>in</strong>gpack<strong>in</strong>g fractions. We <strong>in</strong>deed observe clearly that the amplitude decreases cont<strong>in</strong>uouslywith <strong>in</strong>creas<strong>in</strong>g pack<strong>in</strong>g fraction.The lowest energy state of the system now depends on the field strength: at closepack<strong>in</strong>g <strong>and</strong> γ > 5.9168(2), the dipolar <strong>in</strong>teractions dom<strong>in</strong>ate the Yukawa <strong>in</strong>teractions,<strong>and</strong> hcp is the ground state. At lower field strengths, the Yukawa <strong>in</strong>teractions cause thesystem to favor the fcc phase. Due to the entropy difference for hard spheres betweenfcc <strong>and</strong> hcp (0.0011(1)kT per particle at close pack<strong>in</strong>g [67]), the phase transition betweenthe two structures appears at slightly higher field strength than γ = 5.9168, i.e., γ =8.4(4). We aga<strong>in</strong> note that the hexagonal planes of the fcc <strong>and</strong> hcp phase are parallel<strong>and</strong> perpendicular respectively to the plane of the biaxial field (xy-plane) <strong>and</strong> that bothstructures are stretched <strong>in</strong> the z-direction. Hence, the fcc phase is a hexagonal ABCstacked crystal phase, <strong>and</strong> the hcp is a slightly stretched hcp phase.We also f<strong>in</strong>d that the coexistence region between a dilute gas phase <strong>and</strong> the ABCstacked crystal becomes wider upon <strong>in</strong>creas<strong>in</strong>g γ. However, the density of the crystal atcoexistence is much lower than <strong>in</strong> the hard sphere case, ma<strong>in</strong>ly due to a larger distance
Phase diagram of <strong>colloidal</strong> spheres <strong>in</strong> a biaxial electric or magneticfield 41Figure 3.3: Same as Fig. 1, but for a system of charged spheres <strong>in</strong>teract<strong>in</strong>g with a Yukawa<strong>in</strong>teraction. The <strong>in</strong>verse screen<strong>in</strong>g length κσ = 10, <strong>and</strong> λ B Z 2 /σ = 450 (ɛ = 12.5). The layeredfluidphase consists of system-spann<strong>in</strong>g slabs of fluid aligned <strong>in</strong> the plane of the biaxial field.The crosses <strong>in</strong>dicate the positions <strong>in</strong> the phase diagram where the snapshots <strong>in</strong> Fig. 3.4 weretaken.between adjacent sheets (as shown <strong>in</strong> Fig. 3.4d). As the distance between the sheets<strong>in</strong>creases, the effect of the relative position <strong>and</strong> orientation between neighbor<strong>in</strong>g sheetson the potential energy reduces significantly, lead<strong>in</strong>g to a large amount of disorder <strong>in</strong> theposition <strong>and</strong> orientation of the sheets. We observe that the distance between the sheetscan fluctuate significantly dur<strong>in</strong>g our simulations at low densities. However, the crystalis still the stable phase. In the bulk limit, the entropy ga<strong>in</strong> from detach<strong>in</strong>g a sheet fromthe crystal would be dom<strong>in</strong>ated by the energy cost to detach an <strong>in</strong>f<strong>in</strong>ite sheet of particles.Consequently, the fcc crystal will be the thermodynamically stable phase <strong>in</strong> the bulk limit.In f<strong>in</strong>ite <strong>systems</strong>, however, the sheets will be translationally <strong>and</strong> rotationally disordered.The translational disorder can be clearly seen to appear <strong>in</strong> simulations: when a crystalphase is used as the <strong>in</strong>itial configuration, the layers of the crystal become disordereddur<strong>in</strong>g simulations at low density. Rotational disorder does not emerge <strong>in</strong> crystals <strong>in</strong>a rectangular periodic box, but is expected to appear <strong>in</strong> experimental <strong>systems</strong>. At lowpressures, the separations between the hexagonal sheets fluctuate substantially, result<strong>in</strong>g<strong>in</strong> large density fluctuations. It is likely that these fluctuations contribute to the disorderof the sheets as well.On the right side of Fig. 3.5 we plot the difference <strong>in</strong> potential energy per particleβ∆U of various stack<strong>in</strong>gs of the hexagonal crystall<strong>in</strong>e sheets <strong>in</strong> the crystal phase withABC stack<strong>in</strong>g, as a function of sheet distance ∆z for γ = 30. In addition, we plot thecontribution of the Yukawa <strong>in</strong>teraction to this potential energy difference, denoted by thedashed l<strong>in</strong>es, <strong>and</strong> we observe that the contribution from the dipolar <strong>in</strong>teraction dom<strong>in</strong>ates
42 Chapter 3Figure 3.4: Left: Snapshots of typical simulation configurations for charged spheres with <strong>in</strong>verteddipolar <strong>in</strong>teractions. The arrows <strong>in</strong>dicate the two field directions, with ⊗ <strong>in</strong>dicat<strong>in</strong>g theaxis perpendicular to the page. a) A low-density fluid at γ = 6, η = 0.05. b) A higher densityfluid, just above the l<strong>in</strong>e <strong>in</strong> the phase diagram mark<strong>in</strong>g the crossover between the homogeneous<strong>and</strong> layered fluids (γ = 16, η = 0.26). c) Layered fluid at γ = 18, η = 0.20. d) Crystall<strong>in</strong>eABC-stacked hexagonal layers of charged spheres at η = 0.32 <strong>and</strong> γ = 28.Right: Equations of state for charged spheres with <strong>in</strong>verted dipolar <strong>in</strong>teractions at fieldstrengths γ = 10, 16, 24. The l<strong>in</strong>es are fits through the data, us<strong>in</strong>g dashed l<strong>in</strong>es for the crystals<strong>and</strong> solid l<strong>in</strong>es for the fluids. The green horizontal l<strong>in</strong>es show the coexistences. Both the crystalat γ = 24 <strong>and</strong> the liquid at γ = 16 also coexist with an extremely dilute gas at near-zero density.Figure 3.5: Left: Pair correlation function <strong>in</strong> the z-direction (perpendicular to the biaxial field)of the layered-fluid phase with dipole moment strength γ = 17 for vary<strong>in</strong>g pack<strong>in</strong>g fractions.The amplitude decreases with <strong>in</strong>creas<strong>in</strong>g η, as denoted by the labels.Right: Difference <strong>in</strong> potential energy per particle ∆βU between a perfect crystal of ABCstacked hexagonal sheets <strong>and</strong> differently stacked sheets, at γ = 30 as a function of the centerto-centerdistance between the sheets ∆z. From left to right, the red, blue <strong>and</strong> black solid l<strong>in</strong>esdenote the comparison with AB hollow-site stack<strong>in</strong>g, AB bridge-site stack<strong>in</strong>g, <strong>and</strong> AA stack<strong>in</strong>g,respectively. The dashed l<strong>in</strong>es represent the contributions from the Yukawa <strong>in</strong>teractions to thetotal potential energy difference. The <strong>in</strong>set shows the sheet distance as a function of the pack<strong>in</strong>gfraction at γ = 30.
Phase diagram of <strong>colloidal</strong> spheres <strong>in</strong> a biaxial electric or magneticfield 43that of the Yukawa <strong>in</strong>teraction close to coexistence. We f<strong>in</strong>d that the total difference <strong>in</strong>potential energy decreases exponentially with sheet distance. The potential differences aredom<strong>in</strong>ated by the dipolar repulsions from nearby particles <strong>in</strong> the adjacent layer. Hence,hollow-site stack<strong>in</strong>gs have the lowest potential energy, while the AA stack<strong>in</strong>g correspondsto the highest one. In the <strong>in</strong>set, we plot typical sheet separations ∆z for equilibriumABC stacked crystals close to the coexistence density. In the <strong>in</strong>set, we plot typical sheetseparations ∆z for equilibrium ABC stacked crystals close to the coexistence density.We f<strong>in</strong>d that at a sheet distance of ∆z = 2.0σ, the difference <strong>in</strong> potential energy perparticle between ABC <strong>and</strong> AA stack<strong>in</strong>g is only 0.002 k B T per particle, while the differencecompared with other stack<strong>in</strong>gs is even smaller. As a result, we expect large amounts ofstack<strong>in</strong>g disorder <strong>in</strong> any low-density crystal.3.5 Comparison with experimentsRecently, <strong>colloidal</strong> <strong>systems</strong> <strong>in</strong> an external biaxial field have been studied experimentallyby Leunissen et al.[64] In these experiments, a biaxial field was applied by us<strong>in</strong>g twoperpendicular uniaxial electric fields <strong>and</strong> r<strong>and</strong>omly chang<strong>in</strong>g the field direction. A systemof colloids <strong>in</strong> suspension with large amounts of salt was used <strong>in</strong> order to approach theuncharged case. Field strengths were varied <strong>in</strong> a range approximately correspond<strong>in</strong>g to31 < γ < 170, <strong>and</strong> the pack<strong>in</strong>g fraction was η = 0.2. The particles were seen to organize<strong>in</strong>to large hexagonal sheets, with multiple doma<strong>in</strong>s, which generally did not merge <strong>in</strong>tothree-dimensional structures due to orientational disorder. However, close to the edge ofthe sample, where the orientation of the hexagonal structure was fixed by the wall, theyobserved an AB bridge-site stack<strong>in</strong>g of the sheets, which is <strong>in</strong> contradiction with our bulksimulations. Even <strong>in</strong> the case of charged particles, where we f<strong>in</strong>d substantial disorderbetween the sheets, there is a clear preference for hollow-site stack<strong>in</strong>g of the particles, ascan be seen <strong>in</strong> Fig. 3.5 on the right-h<strong>and</strong> side. As our simulations do not take <strong>in</strong>to accountthe effect of the walls, it seems likely that the electrodes <strong>in</strong> the experiments impose anorientation on the hexagonal planes. For <strong>systems</strong> of colloids <strong>in</strong> a uniaxial field, imagecharge effects have been shown to affect the orientation of sheet-like structures, lead<strong>in</strong>gto l<strong>in</strong>es of particles parallel to the electrode. [45] This effect is likely to occur here aswell. If the distance to the electrode is also the same for each sheet, the sheets can onlymove relative to their neighbors along the direction parallel to both the wall <strong>and</strong> one ofthe field directions. In this case, an AB bridge-site stack<strong>in</strong>g would <strong>in</strong>deed be the lowestenergystate (the right side of Fig. 3.5 illustrates the potential energy difference betweenAB bridge-site stack<strong>in</strong>g <strong>and</strong> AA stack<strong>in</strong>g). Further from the wall, no stack<strong>in</strong>g preferencewas clearly visible, which <strong>in</strong>deed agrees with the disorder seen <strong>in</strong> the simulations. Inthe experimental setup, the sheets are much larger than <strong>in</strong> the simulations, which slowsdown their motion considerably. In addition, the sheets can have multiple doma<strong>in</strong>s withdifferent orientations, <strong>and</strong> can be attached to the walls or other sheets, further prevent<strong>in</strong>gequilibration.
44 Chapter 33.6 ConclusionsIn conclusion, we have calculated the phase diagrams for uncharged <strong>and</strong> charged hardspheres <strong>in</strong> an external biaxial electric or magnetic field. In both <strong>systems</strong>, the <strong>in</strong>teraction<strong>in</strong>cluded a hard-core <strong>in</strong>teraction <strong>and</strong> an “<strong>in</strong>verted” dipolar <strong>in</strong>teraction with its strengthdeterm<strong>in</strong>ed by the field strength γ. In the charged sphere case, a Yukawa repulsion was<strong>in</strong>cluded as well, us<strong>in</strong>g κσ = 10.0 <strong>and</strong> λ B Z 2 /σ = 450. The phase behavior as a functionof the field strength <strong>and</strong> particle density shows a gas-liquid coexistence for both <strong>systems</strong>,as well as a number of crystal structures. All crystal structures found are distortions ofthe close-packed structures hcp <strong>and</strong> fcc, where the distortions are caused by a stretch<strong>in</strong>gof the crystal <strong>in</strong> the direction perpendicular to the plane of the biaxial field. Especially <strong>in</strong>the case of charged spheres, these deformation can be very strong, result<strong>in</strong>g <strong>in</strong> separationsbetween layers of particles on the order of 2σ. While free energy considerations show thateven at low densities the stable crystal structure is that of fcc, we expect a huge numberof planar defects present <strong>in</strong> the crystal as the potential energy differences are small. Inaddition to these structures, the system of charged spheres exhibits a layered-fluid phaseclose to the triple po<strong>in</strong>t. These layers are <strong>in</strong>ternally disordered, but the density profilesshow strong periodicity perpendicular to the plane of the rotat<strong>in</strong>g field.
4Colloidal cubes <strong>in</strong> an externalelectric or magnetic fieldElectric fields have proven to be a versatile tool for direct<strong>in</strong>g <strong>colloidal</strong> particles <strong>in</strong>to 1Dstr<strong>in</strong>gs, 2D sheets <strong>and</strong> 3D crystal structures. When a suspension of <strong>colloidal</strong> particlesis placed <strong>in</strong> an oscillat<strong>in</strong>g electric field, the contrast <strong>in</strong> dielectric constant between theparticles <strong>and</strong> the solvent <strong>in</strong>duces a dipole moment <strong>in</strong> each of the <strong>colloidal</strong> particles. Theresult<strong>in</strong>g dipole-dipole <strong>in</strong>teractions can strongly <strong>in</strong>fluence the phase behavior of the system.In addition, most anisotropic particles can be aligned <strong>in</strong> electric fields. However,<strong>in</strong> the case of cubes the potential energy of a s<strong>in</strong>gle cube-shaped particle <strong>in</strong> an electricfield is <strong>in</strong>dependent of its orientation. As a result, s<strong>in</strong>gle cubic particles do not align<strong>in</strong> such an external field. Alignment effects can still occur due to hard-core constra<strong>in</strong>tswhen multiple particles cluster <strong>in</strong>to a str<strong>in</strong>g or crystal phase. We <strong>in</strong>vestigate the phasebehavior of cube-shaped <strong>colloidal</strong> particles <strong>in</strong> electric fields, us<strong>in</strong>g Monte Carlo simulations.In addition to str<strong>in</strong>g fluid <strong>and</strong> orientationally ordered BCT phases, we observe acolumnar phase consist<strong>in</strong>g of hexagonally ordered str<strong>in</strong>gs of rotationally disordered cubes.By simulat<strong>in</strong>g the system for a range of pressures <strong>and</strong> electrical field strengths, we mapout an approximate phase diagram. Additionally, we study the effect of the po<strong>in</strong>t-dipoleapproximation on the alignment of cubes <strong>in</strong> str<strong>in</strong>g-like clusters.
46 Chapter 44.1 IntroductionIn the previous chapter, we studied the str<strong>in</strong>g-like clusters formed by spherical particles <strong>in</strong>an external electric or magnetic field. As shown there, external fields can strongly affectthe behavior of <strong>colloidal</strong> particles. Due to the difference <strong>in</strong> dielectric constant between thecolloids <strong>and</strong> the solvent, an external field <strong>in</strong>duces a dipole moment <strong>in</strong> each colloid, lead<strong>in</strong>gto anisotropic dipole-dipole <strong>in</strong>teractions. These <strong>in</strong>teractions can lead to <strong>self</strong>-<strong>assembly</strong> <strong>in</strong>toa variety of str<strong>in</strong>g-like clusters. In addition, the bulk phase behavior exhibits a bodycenteredtetragonal (BCT) <strong>and</strong> a hexagonally close-packed (HCP) crystal phase as wellas the face-centered cubic (FCC) crystal that also appears <strong>in</strong> hard-sphere <strong>systems</strong>.[26]While we limited ourselves to spherical <strong>and</strong> dumbbell particles <strong>in</strong> the previous chapter,the same method can be used to <strong>in</strong>duce dipolar <strong>in</strong>teractions <strong>in</strong> <strong>colloidal</strong> particles of anyshape. As seen <strong>in</strong> dumbbells, external electric fields can also be used to align anisotropicparticles along the direction of the field. This technique is commonly used <strong>in</strong> liquid-crystaldisplays by chang<strong>in</strong>g the director of the nematic phase us<strong>in</strong>g an electric field.Recently, methods to synthesize cubes on the micrometer [70, 71] <strong>and</strong> nanometerscale [72–74] have become available, generat<strong>in</strong>g <strong>in</strong>terest <strong>in</strong> the phase behavior of cubeshapedparticles. Several simulation studies have <strong>in</strong>vestigated the phase behavior of cubic<strong>and</strong> similar particles, result<strong>in</strong>g <strong>in</strong> phase diagrams for tetragonal parallelepipeds [75] <strong>and</strong><strong>colloidal</strong> superballs [76], as well as for a range of polyhedral shapes with vary<strong>in</strong>g degreesof anisotropy.[77] A simulation study on cubes with fixed dipole moments that rotatealong with the particle, as might be expected for semiconductor nanoparticles, showedthat these can <strong>self</strong>-assemble <strong>in</strong>to wires, sheets or r<strong>in</strong>g-like structures depend<strong>in</strong>g on theorientations of the dipoles with respect to the cubes.[78]In this chapter, we use Monte Carlo simulations to study the effect of external fieldson the phase behavior of dielectric <strong>colloidal</strong> cubes. In contrast with most anisotropicparticles, the orientation of a s<strong>in</strong>gle cube is not affected by external electric fields: thesymmetry of the particle causes its potential to be <strong>in</strong>dependent of its orientation. Asa result, <strong>colloidal</strong> cubes can rotate freely <strong>in</strong> the electric field. However, the hard-core<strong>in</strong>teractions between particles can lead to alignment when two or more particles are <strong>in</strong>close proximity, either due to a high pack<strong>in</strong>g fraction <strong>in</strong> the system, or as a result of thedipolar attractions <strong>in</strong>duced by the external field. By observ<strong>in</strong>g the behavior of the system<strong>in</strong> Monte Carlo simulations, we f<strong>in</strong>d both partial alignment of the particles <strong>in</strong> the str<strong>in</strong>gfluid <strong>and</strong> columnar crystal phases, <strong>and</strong> complete alignment <strong>in</strong> the BCT <strong>and</strong> simple cubiccrystal phases.4.2 Methods <strong>and</strong> modelWe model the <strong>colloidal</strong> cube-shaped particles as perfect hard cubes with edge length σ<strong>and</strong> one or more po<strong>in</strong>t dipoles <strong>in</strong>side each particle. The <strong>in</strong>teractions thus consist of adipolar <strong>in</strong>teraction between the cubes <strong>and</strong> a hard-core repulsion that prevents particlesfrom overlapp<strong>in</strong>g. In the case where each particle conta<strong>in</strong>s a s<strong>in</strong>gle dipole, the dipolar
Colloidal cubes <strong>in</strong> an external electric or magnetic field 47<strong>in</strong>teraction potential between two particles i <strong>and</strong> j is given by:βu dip (r ij , θ ij ) = γ 2( σr ij) 3(1 − 3 cos 2 θ ij ), (4.1)where r ij denotes the distance between the two particles <strong>and</strong> θ ij the angle between thedistance vector between the particles <strong>and</strong> the direction of the field. As <strong>in</strong> the previouschapter, the strength of the dipole <strong>in</strong>teraction is given by the field strength γ: the <strong>in</strong>teractionpotential between two particles separated by a distance σ along the field directionis −γk B T . The long-range <strong>in</strong>teractions were h<strong>and</strong>led us<strong>in</strong>g Ewald summations.[17, 23]To detect overlaps between two cubes, we used a triangle tesselation scheme. [79] Whilea cube-specific algorithm based on the separat<strong>in</strong>g axis theorem would likely be moreefficient, the difference is negligible compared to the computational cost of the Ewaldsummations used to calculate the potential energy.In the simplest approximation, the dipole <strong>in</strong>teractions are modeled by a s<strong>in</strong>gle po<strong>in</strong>tdipole <strong>in</strong> the middle of each cube. In this model, rotations do not affect the dipolar pair<strong>in</strong>teraction between two cubes, <strong>and</strong> rotational order can only emerge due to the hardcore<strong>in</strong>teractions. However, it is not clear that the <strong>in</strong>teraction between two cubes canbe approximated with two po<strong>in</strong>t dipoles: due to the external field, the full volume ofeach <strong>colloidal</strong> cube will be polarized, result<strong>in</strong>g <strong>in</strong> a more complex <strong>in</strong>teraction. While atlarge distances the <strong>in</strong>teraction between two particles should behave as a simple dipoledipole<strong>in</strong>teraction, there will be short-range deviations from this behavior. To <strong>in</strong>vestigatethis, we also studied cubes conta<strong>in</strong><strong>in</strong>g multiple dipoles arranged <strong>in</strong> a simple cubic latticealigned with the orientation of the particle. Thus, if a particle at position r conta<strong>in</strong>s n 3po<strong>in</strong>t dipoles, the positions of these dipoles are given by:r ijk = r + (2i + 1 − n)a + (2j + 1 − n)b + (2k + 1 − n)c, (4.2)where a, b <strong>and</strong> c denote the three (mutually perpendicular) edge directions of the particle,<strong>and</strong> 1 ≤ i, j, k ≤ n. Each po<strong>in</strong>t dipole <strong>in</strong>teracts with all others via Eq. 4.1, with the<strong>in</strong>teraction strength γ lowered by a factor n 3 to ensure that the <strong>in</strong>teractions betweenparticles at large distances are unchanged. Even with multiple po<strong>in</strong>t dipoles <strong>in</strong> eachparticle, the potential energy of a s<strong>in</strong>gle particle is orientation <strong>in</strong>dependent. However, theparticle pair <strong>in</strong>teraction is now a function of both the relative position of the two particles<strong>and</strong> their <strong>in</strong>dividual orientations.We <strong>in</strong>vestigate the phase behavior of this system by perform<strong>in</strong>g Monte Carlo simulations<strong>in</strong> the NP T ensemble, at a fixed number of particles N = 512, pressure P <strong>and</strong>temperature T . Simulations are performed <strong>in</strong> a series where the pressure is either <strong>in</strong>creasedor reduced slowly, lead<strong>in</strong>g to compression or expansion of the system. Dur<strong>in</strong>g thecompression runs, the simulations start from an <strong>in</strong>itial configuration <strong>in</strong> the fluid phase,<strong>and</strong> the pressure is <strong>in</strong>creased <strong>in</strong> small steps, up to pressures well past the expected coexistencepressure. Expansion runs start from an <strong>in</strong>itial configuration <strong>in</strong> one of the crystalphases likely to be stable for the field strength γ used <strong>in</strong> the simulations. Where needed,additional compression <strong>and</strong> decompression runs were performed us<strong>in</strong>g a different structureas the <strong>in</strong>itial configuration. From the phase transitions observed <strong>in</strong> both runs, wedeterm<strong>in</strong>ed the approximate phase boundaries of the system.
48 Chapter 4As the str<strong>in</strong>gs <strong>in</strong> the str<strong>in</strong>g fluid at high field strengths span the simulation box, it islikely that the phase behavior of the system <strong>in</strong> this regime is affected by f<strong>in</strong>ite size effects.To <strong>in</strong>vestigate this, the simulations for high field strengths (γ ≥ 12.5) <strong>and</strong> low pressures(P σ 3 /k B T < 1 ) were performed <strong>in</strong> a system of N = 1024 particles as well. No significantshift <strong>in</strong> the phase behavior was observed.To determ<strong>in</strong>e the transition from a simple cubic (sc) to a body-centered tetragonal(BCT) crystal structure, we performed simulations at constant pressure for a range offield strengths γ, start<strong>in</strong>g from either of the two phases. S<strong>in</strong>ce the system can easilyswitch between these structures, no clear hysteresis was visible <strong>in</strong> these simulations, <strong>and</strong>determ<strong>in</strong><strong>in</strong>g the approximate phase boundary was straightforward.4.3 Results4.3.1 Phase diagramAn approximate phase diagram for <strong>colloidal</strong> hard cubes <strong>in</strong> an electric field is shown <strong>in</strong>Fig. 4.1 as a function of the field strength γ <strong>and</strong> the pack<strong>in</strong>g fraction η. For this phasediagram, the dipole <strong>in</strong>teractions are modeled by a s<strong>in</strong>gle po<strong>in</strong>t dipole <strong>in</strong> the middle ofeach particle. The phase behavior bears close resemblance to that of dipolar hard spheres[26], with the ma<strong>in</strong> difference be<strong>in</strong>g the added hexagonal str<strong>in</strong>g phase. In addition, theFCC crystal structure that is stable at low field strengths for spheres is replaced by asimple cubic (SC) crystal <strong>in</strong> the case of cube-shaped particles. As the simple cubic <strong>and</strong>BCT structures pack equally well for cubes (η max = 1), the simple cubic structure onlyappears for a sufficiently low field strength.As <strong>in</strong> the case of hard spheres <strong>in</strong> an external field, a str<strong>in</strong>g fluid appears for lowfield strengths <strong>and</strong> low pack<strong>in</strong>g fractions. Neighbor<strong>in</strong>g cubes <strong>in</strong> a str<strong>in</strong>g are aligned suchthat the touch<strong>in</strong>g faces of the two cubes are approximately parallel, as this allows thepo<strong>in</strong>t dipoles to approach each other more closely. Because align<strong>in</strong>g the cubes along thisdirection carries an entropic cost, the field strengths required to form str<strong>in</strong>gs are slightlyhigher than those seen <strong>in</strong> the case of spheres. However, it should also be noted thatthe dipole moment <strong>in</strong>duced by an external field <strong>in</strong> cube-shaped particles will be strongerthan that of a sphere with diameter σ, due to its larger volume, provided the materialof the particle is the same. Therefore, the same value of γ for spheres <strong>and</strong> cubes doesnot correspond to the same external field strength. S<strong>in</strong>ce the cubes only conta<strong>in</strong> a s<strong>in</strong>glepo<strong>in</strong>t dipole, rotations along the field axis do not <strong>in</strong>fluence the potential energy of thesystem. As a result, the cubes do not align all faces with<strong>in</strong> a s<strong>in</strong>gle str<strong>in</strong>g: there is onlyalignment <strong>in</strong> one direction. Hard-core <strong>in</strong>teractions with neighbor<strong>in</strong>g str<strong>in</strong>gs or a wallcould cause the particles to align <strong>in</strong> all three directions, but this was only observed <strong>in</strong> thebody-centered-tetragonal crystal phase that appears at high pack<strong>in</strong>g fractions.The maximum pack<strong>in</strong>g fraction for sharp cubes is η = 1. At this pack<strong>in</strong>g fraction, allcubes are aligned along the same three axes, but a limited amount of freedom rema<strong>in</strong>sfor the positions of the particles. At η = 1, the lowest energy state is a body-centeredtetragonal (BCT) structure. This structure can be seen as a further aggregation of str<strong>in</strong>gsof cubes onto a square lattice, with all the particles aligned. Each str<strong>in</strong>g is shifted alongthe field direction with respect to its four neighbor<strong>in</strong>g str<strong>in</strong>gs by a distance equal to
Colloidal cubes <strong>in</strong> an external electric or magnetic field 491.00.8SCBCT0.6Η0.4Hexagonal0.2Str<strong>in</strong>gFluid0.00 5 10 15ΓFigure 4.1: Approximate phase diagram for <strong>colloidal</strong> hard cubes <strong>in</strong> an external electric ormagnetic field, as a function of the field strength γ <strong>and</strong> the pack<strong>in</strong>g fraction η. The blackpo<strong>in</strong>ts <strong>in</strong>dicate where phase boundaries were determ<strong>in</strong>ed based on the phases found <strong>in</strong> MCsimulations at constant pressure. The labels SC <strong>and</strong> BCT denote a simple cubic <strong>and</strong> bodycenteredtetragonal phase, respectively, while the hexagonal phase consists of str<strong>in</strong>gs of particlesarranged on a hexagonal lattice.
50 Chapter 4Figure 4.2: Left: Snapshot of the BCT phase, at γ = 15 <strong>and</strong> pressure βP σ 3 = 4 (η = 0.64).The external field po<strong>in</strong>ts along the vertical direction. Right: Snapshot of the hexagonal phase,at γ = 15 <strong>and</strong> βP σ 3 = 1 (η = 0.43). The field direction is perpendicular to the plane of view.half of the lattice spac<strong>in</strong>g. A typical snapshot of this structure is shown <strong>in</strong> Fig. 4.2.This structure is readily seen to form at high field strengths, regardless of the start<strong>in</strong>gconfiguration. However, for lower field strengths, the same start<strong>in</strong>g configuration can alsolead to a hexagonal order<strong>in</strong>g of str<strong>in</strong>gs, without alignment with respect to rotation alongthe field axis. In this case, the lowest energy state would likely have three of the sixneighbors of each str<strong>in</strong>g shifted up by a third of the <strong>in</strong>terparticle distance <strong>in</strong> a str<strong>in</strong>g, <strong>and</strong>the other three shifted down by the same amount, but this order is not clearly visible<strong>in</strong> the simulations so far. For an example, see Fig. 4.2. This configuration maximizesthe distance between str<strong>in</strong>gs, allow<strong>in</strong>g for larger orientational entropy at the cost of alower potential energy. It might be <strong>in</strong>terest<strong>in</strong>g to note that an added Yukawa repulsionwould likely further stabilize this phase, as this would <strong>in</strong>crease the distance between thestr<strong>in</strong>gs. In the limit of high field strengths, the hexagonal columnar phase is expected tovanish eventually: the BCT phase has a lower potential energy, <strong>and</strong> will coexist with adilute gas at sufficiently high <strong>in</strong>teraction strengths. Both the BCT phase <strong>and</strong> hexagonalphase were seen <strong>in</strong> experiments on neighborite cubes <strong>in</strong> an electric field as well, as shown<strong>in</strong> Fig. 4.3.[80] In the experimental snapshots of the hexagonal phase, the range of thepositional order <strong>in</strong> the str<strong>in</strong>gs appears to be limited. In our simulations, the range of thehexagonal order <strong>in</strong> the system was always at least equal to the system size, but it can notbe excluded that this may change for larger <strong>systems</strong>.When the field strength γ = 0, the stable crystal phase is a simple cubic crystal (SC).At low but f<strong>in</strong>ite fields, this structure rema<strong>in</strong>s stable, but becomes slightly distorted: thelattice is compressed along the field direction, actually lead<strong>in</strong>g to a simple tetragonallattice. As the distortions are small, this crystal is still labeled SC <strong>in</strong> Fig. 4.1.
Colloidal cubes <strong>in</strong> an external electric or magnetic field 51Figure 4.3: Experimental snapshots of a system of neighborite cubes.[80] In both snapshots, thefield direction is perpendicular to the plane of view. Left: For high field strengths (E rms ≃ 0.12V/µm), str<strong>in</strong>gs of particles order <strong>in</strong>to doma<strong>in</strong>s with a square lattice, likely correspond<strong>in</strong>g to aBCT structure. The scalebar is 4 µm. Right: At lower field strengths (E rms ≃ 0.08 V/µm),hexagonal doma<strong>in</strong>s are clearly visible. The scalebar is 3 µm.4.3.2 Po<strong>in</strong>t-dipole approximationIn simulations of the str<strong>in</strong>g fluid, cubic particles <strong>in</strong> str<strong>in</strong>gs show orientational disorder:while the top <strong>and</strong> bottom faces of neighbor<strong>in</strong>g particles are aligned <strong>in</strong> order to m<strong>in</strong>imizethe distance between them, particles are free to rotate around the field axis. This can beunderstood from the way the <strong>in</strong>teractions are modeled: s<strong>in</strong>ce the potential <strong>in</strong> Eq. 4.1 onlydepends on the positions of the centers of the particles, there is no way for it to align theparticles orientationally. In experiments performed on a dilute str<strong>in</strong>g fluid of cube-shapedparticles <strong>in</strong> an external electric field, particles with<strong>in</strong> the same str<strong>in</strong>g were seen to mostlyalign orientationally only at high field strengths (see chapter 7 of Ref. [81]). This suggeststhat weak align<strong>in</strong>g forces may exist as a result of the way the cube-shaped particles arepolarized <strong>in</strong> the external field.To <strong>in</strong>vestigate possible effects of different dipole moment distributions, we approximatethe polarization of the cube with multiple dipoles evenly spread through the particle. Todo this, we divide each cube <strong>in</strong>to n 3 smaller cubes, <strong>and</strong> place a weaker dipole <strong>in</strong> the middleof each smaller cube, result<strong>in</strong>g <strong>in</strong> a simple cubic lattice. As the total number of dipolesquickly becomes hard to simulate directly, we only performed simulations for the casewhere each cube conta<strong>in</strong>s n 3 = 2 3 = 8 po<strong>in</strong>t dipoles, but performed energy calculationsfor cubes conta<strong>in</strong><strong>in</strong>g up to n 3 = 7 3 po<strong>in</strong>t dipoles.It is <strong>in</strong>terest<strong>in</strong>g to note that even with multiple dipoles, a s<strong>in</strong>gle particle <strong>in</strong> an externalelectric field still has a potential energy that is <strong>in</strong>dependent of the orientation. Thus,particles will not align <strong>in</strong> the electric field purely due to their polarization with thisdistribution of dipoles. Note that this is not true for all possible dipole distributions <strong>in</strong>the cube.Secondly, if two cubes are placed on top of each other (as if they were <strong>in</strong> a str<strong>in</strong>g),the potential energy difference between different orientations turns out to be very small.For 8 dipoles <strong>in</strong> each cube, the difference between perfect alignment <strong>and</strong> the maximummisalignment (45 o ) is only around 0.04γk B T . While this difference will <strong>in</strong>duce alignment
52 Chapter 40.04 U at Γ⩵10.030.020.010.002 3 3 3 4 3 5 3 6 3 7 3Number of po<strong>in</strong>t dipolesFigure 4.4: Energy difference ∆U between the most favorable (aligned) <strong>and</strong> least favorable(misaligned) orientations of two particles at distance σ along the z-axis, for different numbers ofpo<strong>in</strong>t dipoles per particle. A cartoon depict<strong>in</strong>g the aligned <strong>and</strong> misaligned orientations is alsoshownat very high field strengths, the effect will be small below γ ≃ 25. Moreover, for particlesconta<strong>in</strong><strong>in</strong>g more than 8 po<strong>in</strong>t dipoles, the effect of rotations on the potential energydecreases with the number of dipoles (see Fig. 4.4). The energy difference appears tolevel off around 0.01k B T , which would <strong>in</strong>dicate that field strengths over γ ≃ 100 wouldbe needed to align particles with the electric field.To check this, we performed simulations of cubes conta<strong>in</strong><strong>in</strong>g 8 po<strong>in</strong>t dipoles, <strong>and</strong>studied alignment of particles <strong>in</strong> a str<strong>in</strong>g as a function of the field strength. Neighbor<strong>in</strong>gparticles were seen to align <strong>in</strong> str<strong>in</strong>gs at field strengths higher than γ ≃ 30, but forlower field strengths, no clear correlations <strong>in</strong> the orientations of neighbor<strong>in</strong>g particleswere visible. S<strong>in</strong>ce the energy calculations show that the alignment effect decreases <strong>in</strong>strength on <strong>in</strong>creas<strong>in</strong>g the number of po<strong>in</strong>t dipoles per particle, we conclude that for afield strength lower than γ = 30, us<strong>in</strong>g multiple po<strong>in</strong>t dipoles per particle is not likely tosignificantly <strong>in</strong>fluence the align<strong>in</strong>g of cubes <strong>in</strong> the str<strong>in</strong>g fluid phase or hexagonal columnarphase.4.4 ConclusionsIn summary, we used Monte Carlo simulations <strong>in</strong> the NP T ensemble to study the phasebehavior of hard <strong>colloidal</strong> cubes <strong>in</strong> an external electric or magnetic field. The result<strong>in</strong>gphase diagram conta<strong>in</strong>s BCT <strong>and</strong> SC crystal phases, a hexagonal columnar phase, <strong>and</strong>a str<strong>in</strong>g fluid phase. The dipolar <strong>in</strong>teractions were modeled as po<strong>in</strong>t-dipole <strong>in</strong>teractions.While the dipolar <strong>in</strong>teractions between <strong>colloidal</strong> cubes may not be perfectly describedby this approximation, spread<strong>in</strong>g out the dipole moment of the particle over multipleevenly spaced po<strong>in</strong>ts was shown to lead to only very small potential energy differencesfor the <strong>in</strong>teraction strengths studied here. However, for sufficiently high field strengths,align<strong>in</strong>g forces may arise between cubes <strong>in</strong> close proximity, lead<strong>in</strong>g to alignment <strong>in</strong> all
Colloidal cubes <strong>in</strong> an external electric or magnetic field 53three directions for particles that are part of the same str<strong>in</strong>g.4.5 AcknowledgementsI would like to thank Rao Vutukuri for perform<strong>in</strong>g the experiments on cubes mentioned<strong>and</strong> shown <strong>in</strong> this chapter, <strong>and</strong> Joost de Graaf for supply<strong>in</strong>g the overlap algorithm used<strong>in</strong> the Monte Carlo simulations. I would also like to thank Laura Filion for determ<strong>in</strong><strong>in</strong>gthe coexistence densities for hard cubes <strong>and</strong> for useful discussions <strong>and</strong> Bas Kwaadgras forperform<strong>in</strong>g calculations on the polarization of cube-shaped particles <strong>in</strong> an external field.
5Phase behavior <strong>and</strong> crystalvacancies <strong>in</strong> <strong>colloidal</strong> hard cubesIn this chapter we explore the phase behavior of <strong>colloidal</strong> hard cubes, us<strong>in</strong>g both MonteCarlo simulations <strong>and</strong> Event-Driven Molecular Dynamics simulations. In previous simulationstudies, these particles were seen to not only form fluid <strong>and</strong> simple cubic crystalphases, but also an <strong>in</strong>termediate cubatic phase at pack<strong>in</strong>g fractions 0.52 < η < 0.57.However, this cubatic phase still shows sign of significant positional order. We <strong>in</strong>vestigatethe order<strong>in</strong>g <strong>in</strong> this <strong>in</strong>termediate phase more closely <strong>and</strong> map out the phase behaviorof the hard-cube system us<strong>in</strong>g free energy calculations. Our simulations confirm thattruly long-range positional order is destroyed <strong>in</strong> simulations start<strong>in</strong>g from a simple cubicsystem with all lattice sites filled. However, spontaneous creation of extra layers <strong>in</strong> thecrystal suggest that a higher concentration of vacancies <strong>in</strong> the crystal could stabilize thestructure. We show that <strong>in</strong>corporat<strong>in</strong>g a sufficient number of vacancies <strong>in</strong> the crystalstructure allows the system to reta<strong>in</strong> its long-range order <strong>and</strong> to lower its pressure <strong>in</strong>comparison to the system without defects. The estimated equilibrium concentration ofvacancies slightly above coexistence is on the order of 6.4%, orders of magnitude higherthan the defect concentration <strong>in</strong> hard-sphere crystals.
56 Chapter 55.1 IntroductionIn recent years a variety of synthesis methods for the production of various polyhedralcolloids <strong>and</strong> nanoparticles have become available,[70, 72–74, 81, 82] spark<strong>in</strong>g new <strong>in</strong>terest<strong>in</strong> the phase behavior of these particle shapes. While <strong>in</strong> many of these <strong>systems</strong> boththe <strong>in</strong>teractions <strong>and</strong> shapes of the particles will play an important role <strong>in</strong> determ<strong>in</strong><strong>in</strong>gthe equilibrium phase behavior, a good start<strong>in</strong>g po<strong>in</strong>t for underst<strong>and</strong><strong>in</strong>g the behavior of<strong>in</strong>teract<strong>in</strong>g <strong>systems</strong> is the study of purely hard-core particles. For example, the hardspherephase behavior can be seen as a limit<strong>in</strong>g zero-<strong>in</strong>teraction (or high-temperature)case <strong>in</strong> the phase diagram of any <strong>in</strong>teract<strong>in</strong>g particle with a spherical hard core. Recently,Escobedo et al. used Monte Carlo (MC) simulations to study the phase behavior of sixspace-fill<strong>in</strong>g polyhedral shapes: truncated octahedra, rhombic dodecahedra, hexagonalprisms, triangular prisms, gyrobifastigiums <strong>and</strong> cubes.[77] They showed that the phasediagrams of the first three of these particles do not only conta<strong>in</strong> a fluid <strong>and</strong> a crystal phase,but also an <strong>in</strong>termediate plastic crystal or rotator phase, where long-range positional orderis still present, but some or all of the orientational order is lost. Conversely, for hard cubesthey confirmed the presence of an <strong>in</strong>termediate cubatic phase seen <strong>in</strong> earlier work, [75]where long-range positional order is lost, but the particles are still orientationally aligned<strong>in</strong> all three directions. However, they did observe layer<strong>in</strong>g of the particles <strong>in</strong> the cubaticphase, <strong>in</strong>dicat<strong>in</strong>g the presence of positional correlations over large distances <strong>in</strong> at leastone direction.In this chapter, we exam<strong>in</strong>e <strong>in</strong> more detail the phase behavior of <strong>colloidal</strong> hard cubes.While the stability of an isotropic fluid at low densities <strong>and</strong> a simple cubic crystal structureat high densities have already been firmly established, the existence <strong>and</strong> nature of an<strong>in</strong>termediate phase are not yet clear. We exam<strong>in</strong>e which phase coexists with the fluidphase <strong>and</strong> we <strong>in</strong>vestigate the positional <strong>and</strong> orientational order <strong>in</strong> this phase. Additionally,we perform free energy calculations to determ<strong>in</strong>e the coexistence densities. From thebehavior of the system slightly above coexistence, we conclude that the equilibrium phaseat this po<strong>in</strong>t is a crystal with both positional <strong>and</strong> orientational long-range order, but witha surpris<strong>in</strong>gly large number of vacancies. Free energy calculations on these defect-richcrystals show that the equilibrium concentration of crystal vacancies near coexistence isas high as 6.4%.5.2 Model <strong>and</strong> simulation methods5.2.1 Overlap <strong>and</strong> collision detectionThe model we study consists of perfectly sharp hard cubes with edge length σ. Aside fromhard-core <strong>in</strong>teractions, which prevent configurations with overlapp<strong>in</strong>g cubes, the particlesdo not <strong>in</strong>teract. To <strong>in</strong>vestigate the phase behavior of these particles, we use both MonteCarlo (MC) <strong>and</strong> event-driven molecular dynamics (EDMD) simulations. In both typesof simulation, overlaps are detected us<strong>in</strong>g an algorithm based on the separat<strong>in</strong>g axistheorem.[83] Accord<strong>in</strong>g to this theorem, for any two non-overlapp<strong>in</strong>g convex bodies thereexists an axis onto which both shapes can be projected without overlapp<strong>in</strong>g. In otherwords, if both shapes are projected onto this separat<strong>in</strong>g axis, the result<strong>in</strong>g two <strong>in</strong>tervals
Phase behavior <strong>and</strong> crystal vacancies <strong>in</strong> <strong>colloidal</strong> hard cubes 57on the axis are completely disjo<strong>in</strong>t. No such axis exists if the particles overlap. For twoconvex polyhedral particles, only a f<strong>in</strong>ite number of possible separat<strong>in</strong>g axes need to bechecked: <strong>in</strong> that case, the potential separat<strong>in</strong>g axes are either parallel to a normal of oneof the faces of either of the two particles, or perpendicular to the plane spanned by oneof the edges of the first particle <strong>and</strong> one of the edges of the second particle. If none ofthese directions correspond to a separat<strong>in</strong>g axis, the particles overlap.For a cube-shaped particle a, all face normals <strong>and</strong> edges are parallel to one of threeperpendicular axes u a,i of unit length, with i ∈ {1, 2, 3}. Thus, the fifteen potentialseparat<strong>in</strong>g axes for two cubes are given by u a,i , u b,i , <strong>and</strong> u a,i × u b,j . To calculate theprojection of both particles onto a potential separat<strong>in</strong>g axis L, it is convenient to take thecenter r a of particle a as the orig<strong>in</strong>, plac<strong>in</strong>g particle b at position d = r b − r a . Because theparticles are convex, it is sufficient to project the vertices of each particles onto L. Forparticle a, the positions of the vertices are given by: (±u a,1 ±u a,2 ±u a,3 )σ/2. The projectionsonto L are thus conta<strong>in</strong>ed <strong>in</strong> the <strong>in</strong>terval [−R a (L), R a (L)], withR a (L) = σ 23∑|u a,i · L| . (5.1)i=1Here, we have taken the separat<strong>in</strong>g axis L to be of unit length. Similarly, the projectionsof the vertices of particle b are <strong>in</strong> an <strong>in</strong>terval centered around d · L with radiusR b (L) = σ 23∑|u b,i · L| . (5.2)i=1If L is a separat<strong>in</strong>g axis, these <strong>in</strong>tervals are non-overlapp<strong>in</strong>g. In that case,d · L > R a (L) + R b (L). (5.3)If this <strong>in</strong>equality holds for any one of the potential separat<strong>in</strong>g axes, the two particles donot overlap. We can use Eq. 5.3 to design a distance function f for two particles:f(a, b) = maxL {d · L − (R a(L) + R b (L))} , (5.4)where the maximum is taken over all potential choices for L. The function f(a, b) is negativewhenever the particles a <strong>and</strong> b overlap, <strong>and</strong> positive when they do not. Additionally,the function is cont<strong>in</strong>uous as a function of translations <strong>and</strong> rotations of both particles. Topredict collisions <strong>in</strong> the EDMD simulations, we numerically f<strong>in</strong>d the roots of f as a functionof time, follow<strong>in</strong>g the methods used <strong>in</strong> Ref. [20]. An Andersen thermostat was usedto allow the total energy <strong>in</strong> the EDMD simulations to fluctuate: at fixed time <strong>in</strong>tervals,a r<strong>and</strong>om selection of particles are given a new velocity <strong>and</strong> angular velocity drawn froma Boltzmann distribution.[17]5.2.2 Free energy calculationsTo determ<strong>in</strong>e the Helmholtz free energy of the solid <strong>and</strong> fluid phases as a function ofthe density, we use thermodynamic <strong>in</strong>tegration.[17] When the free energy of a reference
58 Chapter 5density F (ρ 0 ) is known, the free energy as a function of number density F (ρ) can bedeterm<strong>in</strong>ed us<strong>in</strong>g the equation of state. In particular, the free energy is given byβF (ρ)N = βF (ρ ∫0) ρ P (ρ ′ )+ βNρ 0 (ρ ′ ) 2 dρ′ (5.5)where ρ is the density <strong>and</strong> β = 1/k B T with k B Boltzmann’s constant <strong>and</strong> T the temperature.To measure the chemical potential µ at a reference density ρ 0 for the fluid, we useWidom <strong>in</strong>sertion.[17] The free energy of the fluid at density ρ 0 is then given byβF f (ρ 0 )N= βµ(ρ 0 ) + βP (ρ 0)ρ(5.6)To determ<strong>in</strong>e the free energy of a crystal without vacancies, we use a variation onthe method <strong>in</strong>troduced by Frenkel <strong>and</strong> Ladd,[66] where particles are tied to their latticesites with spr<strong>in</strong>gs, transform<strong>in</strong>g the crystal <strong>in</strong>to a non-<strong>in</strong>teract<strong>in</strong>g E<strong>in</strong>ste<strong>in</strong> crystal for asufficiently high spr<strong>in</strong>g constant. In our case, we add an align<strong>in</strong>g potential as well toh<strong>and</strong>le the orientational degrees of freedom of the particles. Follow<strong>in</strong>g Ref. [84], theexternal potential applied to the system dur<strong>in</strong>g the E<strong>in</strong>ste<strong>in</strong> <strong>in</strong>tegration is given by:N∑[ 1 ∣ ∣∣riβU ext (λ) = λ − r 0 i=1σ 2 i ∣ 2 ]+ s<strong>in</strong> 2 Ψ a + s<strong>in</strong> 2 Ψ b(5.7)where λ is the strength of the external potential, <strong>and</strong> r 0 i is the position of the lattice siteassociated with particle i. The lattice sites are on a simple cubic lattice with N L latticesites <strong>and</strong> with the lattice vectors parallel to the x, y, <strong>and</strong> z-axes. The second term fixes theorientation of the particles. The angles Ψ a <strong>and</strong> Ψ b are def<strong>in</strong>ed as follows: let α j = u i,j · ˆx<strong>and</strong> β k = u i,k · ŷ such that αj 2 + βk 2 is maximized with j ≠ k. Then cos (Ψ i,a ) = α j <strong>and</strong>cos (Ψ i,b ) = β k .In the limit of high str<strong>in</strong>g constants λ, this potential transforms the crystal of cubes<strong>in</strong>to an E<strong>in</strong>ste<strong>in</strong> crystal, where both the particle positions <strong>and</strong> orientations are boundso tightly that particles never <strong>in</strong>teract. Note that the center of mass of the crystal isconstra<strong>in</strong>ed.For an E<strong>in</strong>ste<strong>in</strong> crystal with an unconstra<strong>in</strong>ed center of mass, the free energy is givenby:[17]βF e<strong>in</strong> (λ)= − 3 N 2 log π (5.8)λwhile the rotational free energy is [84]βF rot (λ)N= − log∫ exp(−λ [s<strong>in</strong> 2 Ψ a + s<strong>in</strong> 2 Ψ b ])dΩ∫ dΩ. (5.9)Here, the <strong>in</strong>tegral is taken over all possible orientations of a s<strong>in</strong>gle particle. The translational<strong>and</strong> orientational thermal de Broglie wavelength do not <strong>in</strong>fluence the phase behaviorof the system, <strong>and</strong> are both taken to be equal to our unit length σ. We evaluated this<strong>in</strong>tegral us<strong>in</strong>g Monte Carlo <strong>in</strong>tegration.
Phase behavior <strong>and</strong> crystal vacancies <strong>in</strong> <strong>colloidal</strong> hard cubes 59The full free energy of the crystal of hard cubes without vacancies can be writtenas:[85]βFN = βF e<strong>in</strong>(λ max )+ βF rot(λ max )+ βF <strong>in</strong>tNN N + 32N log λ maxπ − 3 log ρσ3log N +2N N , (5.10)where the last three terms are correction terms related to fix<strong>in</strong>g the center of mass of theE<strong>in</strong>ste<strong>in</strong> crystal <strong>and</strong> the <strong>in</strong>teract<strong>in</strong>g crystal. The free energy difference F <strong>in</strong>t between theE<strong>in</strong>ste<strong>in</strong> crystal <strong>and</strong> the <strong>in</strong>teract<strong>in</strong>g crystal, both with a fixed center of mass, is given by:βF <strong>in</strong>tN= − β N∫ λmax0〈∑ N ( 1 ∣ ∣∣ri− r 0 i=1σ 2 i ∣ 2 ) 〉+ s<strong>in</strong> 2 Ψ a + s<strong>in</strong> 2 Ψ b dλ. (5.11)λAs <strong>in</strong> Ref. [17, 85], we calculate the <strong>in</strong>tegral <strong>in</strong> Eq 5.11 us<strong>in</strong>g a Gauss-Legendre quadrature<strong>in</strong> comb<strong>in</strong>ation with MC simulations.To calculate the free energy of the system with vacancies, <strong>in</strong>stead of fix<strong>in</strong>g the particlesto a specific lattice site, we attach the particles to the their nearest lattice site.[86] In thiscase, the external potential applied to the system dur<strong>in</strong>g the E<strong>in</strong>ste<strong>in</strong> <strong>in</strong>tegration is:U ext (λ) = λN∑i=1( 1σ 2 ∣ ∣∣ri− r 0 (r i )∣∣ 2 + s<strong>in</strong> 2 Ψ i,a + s<strong>in</strong> 2 Ψ i,b)where r 0 (r i ) is the position of the lattice site nearest to r i .The free energy of the non<strong>in</strong>teract<strong>in</strong>g system isβF vace<strong>in</strong> (λ)N= βF e<strong>in</strong>(λ)N− log(5.12)N L !N!(N L − N)! + βF rot(λ)N , (5.13)where the first term is the translational free energy of a normal E<strong>in</strong>ste<strong>in</strong> crystal, the secondterm is the comb<strong>in</strong>atorial entropy associated with plac<strong>in</strong>g N particles on N L lattice sites,<strong>and</strong> the third term is the rotational free energy of the crystal, given by Eq. 5.9.The full free energy of the crystal of hard cubes with vacancies is then given by:βFNvacβFe<strong>in</strong> (λ max )= +NβFvac<strong>in</strong>tN(5.14)where F<strong>in</strong>tvac denotes the free energy difference between the E<strong>in</strong>ste<strong>in</strong> crystal <strong>and</strong> the crystalof hard cubes, <strong>and</strong> is analogous to Eq. 5.11 where the nearest lattice site is used <strong>in</strong> placeof a specific lattice site, <strong>and</strong> the center of mass of the system is unconstra<strong>in</strong>ed <strong>in</strong> thesimulations. To equilibrate the position of the center of mass, we <strong>in</strong>troduce Monte Carlomoves that collectively translate every particle <strong>in</strong> the system.[86] Additionally, movesthat translate a particle by exactly one lattice vector are <strong>in</strong>troduced <strong>in</strong> order to improvesampl<strong>in</strong>g of different distributions of vacancies over the crystal. For a system with fulllattice site occupancy (N = N L ), we obta<strong>in</strong> good agreement between the two methods.5.3 Order parameters <strong>and</strong> correlation functionsWe <strong>in</strong>vestigate three types of order<strong>in</strong>g <strong>in</strong> the system: positional order, orientational order,<strong>and</strong> bond-orientational order. For each type of order, we def<strong>in</strong>e an order parameter
60 Chapter 5G pair (a, b) for a particle pair (a, b), measur<strong>in</strong>g the amount of correlation between twoparticles. The global order 〈G〉 <strong>in</strong> a system is then def<strong>in</strong>ed as:〈G〉 2 = 1 ∑ N N∑G pair (a, b). (5.15)N 2a=1 b=1Additionally, we can <strong>in</strong>vestigate the decay of the correlation function of this order parameteras a function of distance:G(r) = 〈 G pair (a, b) 〉 〈 ∣ ∑ ∣ a,b G(a, b)δ(|r ab | − r) ∣ 〉 ∣(r) = ∑, (5.16)a,b δ(|r ab | − r)where δ(r) denotes the Kronecker delta function. In case of true long-range order, thecorrelation function 〈G pair (a, b)〉 (r) decays to a constant <strong>in</strong> the limit of large distances.For a sufficiently large system, this constant is related to the global order 〈G〉 <strong>in</strong> thesystem: [76]lim G(r) = r→∞ 〈G〉2 (5.17)If the order is only quasi-long-range, the correlation function <strong>in</strong>stead decays to 0 as a powerlaw. In the case of short-range order, the correlation function follows an exponential decayrelated to the correlation length <strong>in</strong> the system.5.3.1 Positional orderFor positional order, the order parameter of <strong>in</strong>terest isG pairpos (a, b) = exp(iK · (r a − r b )), (5.18)with K denot<strong>in</strong>g one of the reciprocal lattice vectors of the crystal structure. The correlationfunction G pos (r) can be calculated us<strong>in</strong>g Eq. 5.16, <strong>and</strong> the global positional order〈G pos 〉 can be written as:1 ∑〈G pos 〉 =exp(iK · r∣a )N∣ . (5.19)aLong range order is only present <strong>in</strong> the system if a reciprocal lattice vector K can befound for which G pos (r) decays to a constant at large distances. In our simulations, thesimulations start from a simple cubic crystal aligned with the cubic simulation box. Thelattice vectors are of length L/N 1/3 = ρ −1/3 , with L the length of the simulation box<strong>and</strong> ρ = N/V the number density of the system. Thus, unless the orientation of thecrystal changes dur<strong>in</strong>g the simulation, the first three reciprocal lattice vectors are vectorsof length 2πρ 1/3 along the x, y <strong>and</strong> z axes.The order parameter used for positional order is closely related to the Fourier transformof the positions of the particles <strong>in</strong> the system. We note that this is analogous to the dataobta<strong>in</strong>ed <strong>in</strong> light scatter<strong>in</strong>g experiments. In such an experiment, the <strong>in</strong>tensity of thelight scattered along a scatter<strong>in</strong>g vector k depends both on the shape of the particles
Phase behavior <strong>and</strong> crystal vacancies <strong>in</strong> <strong>colloidal</strong> hard cubes 61<strong>and</strong> the structure <strong>in</strong> the system, expressed by the form factor <strong>and</strong> the structure factor,respectively. The structure factor S(k) is given by:S(k) = 1 N〈∑ N〉N∑e ik·(ra−r b)a=1 b=1, (5.20)where k is the scatter<strong>in</strong>g vector, which corresponds to the difference between the scatteredwave vector <strong>and</strong> the <strong>in</strong>cident wave vector. Maxima <strong>in</strong> S(k) (<strong>and</strong> therefore <strong>in</strong> the scatter<strong>in</strong>gpattern) will occur wheneverk = av 1 + bv 2 + cv 3 , (5.21)where the vectors v i correspond to the three <strong>in</strong>dependent reciprocal lattice vectors ofthe crystal, <strong>and</strong> a, b <strong>and</strong> c are <strong>in</strong>tegers. In a cubic lattice, the reciprocal lattice vectorsare simply parallel to the basis vectors of the lattice <strong>in</strong> real space. To plot a scatter<strong>in</strong>gpattern, we choose our scatter<strong>in</strong>g vectors <strong>in</strong> a plane parallel to one of the crystal planes<strong>in</strong> the system: each k was taken to be a l<strong>in</strong>ear comb<strong>in</strong>ation of two of the three latticevectors of the crystal <strong>in</strong> the simulation. S<strong>in</strong>ce the orientation of the lattice was seen tochange dur<strong>in</strong>g the simulation, the direction of these lattice vectors was determ<strong>in</strong>ed fromthe orientations of the particles. Because the edge vectors of the particles are alignedwith the lattice vectors on average, a good estimate of direction of the lattice vectors canbe obta<strong>in</strong>ed by averag<strong>in</strong>g all edge vectors aligned <strong>in</strong> approximately the same direction.5.3.2 Bond-orientational orderThe bond-orientational order describes the correlations between the directions of bondsbetween neighbor<strong>in</strong>g particles <strong>in</strong> a system. To measure the order, we use a bondorientationalorder parameter based on spherical harmonics, which can also be used tof<strong>in</strong>d clusters of locally ordered particles <strong>in</strong> partially crystallized <strong>systems</strong>. [87] To measurethe local bond-order vector q l,m , a list of neighbors is constructed for each particle,conta<strong>in</strong><strong>in</strong>g all other particles with<strong>in</strong> a radial distance r c . The number of neighbors for aparticle i is denoted as N b (i). We then calculate q l,m (i) for each particle a asq l,m (a) = 1 N b (a)∑Y l,m (θ a,b , φ a,b ), (5.22)N b (a)b=1where Y l,m (θ, φ) are the spherical harmonics, with m ∈ [−l, l] <strong>and</strong> θ a,b <strong>and</strong> φ a,b are thepolar <strong>and</strong> azimuthal angles of the center-of-mass distance vector r ab = r b − r a , with r athe position vector of particle a. The correlation <strong>in</strong> bond-orientational order between twoparticles can then be def<strong>in</strong>ed as the <strong>in</strong>ner product between the normalized bond-ordervectors q l,m between two particles:d l (a, b) =⎛⎝l∑m=−ll∑m=−l|q l,m (a)| 2 ⎞q l,m (a)q ∗ l,m(b)⎠1/2 ⎛ ⎝l∑m=−l⎞ . (5.23)1/2|q l,m (b)| 2 ⎠
62 Chapter 5For a simple cubic crystal structure, we expect 4-fold bond-orientational order, <strong>and</strong> thereforechoose l = 4. Thus, as the order parameter for bond-orientational order, we use:G pairbond (a, b) = d 4(a, b). (5.24)The correlation function G bond (r) associated with this order parameter is calculated us<strong>in</strong>gEq. 5.16.Additionally, we can use G pairbond (a, b) to f<strong>in</strong>d clusters with local bond-orientational order.In order to do this, we calculate the <strong>in</strong>ner product d l of the bond orientational orderparameter q l,m (i) for each particle with that of each of its neighbors. If the dot productfor a pair of particles is larger than a cutoff value d c , the two particles are considered tobe connected. Thus, the number of connections for each particle is given by:ξ(i) =N b (i)∑j=1H(d l (i, j) − d c ), (5.25)where H is the Heaviside step function. Solid-like particles are def<strong>in</strong>ed as particles withat least ξ c connections. All other particles are considered liquid-like. After determ<strong>in</strong><strong>in</strong>gthe connections <strong>in</strong> the system, clusters of solid-like particles are identified as groups ofconnected solid-like particles.The clusters result<strong>in</strong>g from this algorithm depend on several parameters. Firstly,the symmetry <strong>in</strong>dex l for the bond orientational order parameter <strong>in</strong>dicates the degreeof symmetry detected by the order parameter, here chosen to be l = 4. Secondly, theneighbor cutoff r c should be large enough to <strong>in</strong>clude the nearest neighbors of each particle,but not so large that particles further away are <strong>in</strong>cluded <strong>in</strong> the algorithm. An estimatefor a reasonable value can be determ<strong>in</strong>ed from the radial distribution function g(r) of thecrystal structure under consideration: r c should be chosen between the first <strong>and</strong> secondpeaks of g(r). In the case of hard cubes, we chose r c = 1.55σ. F<strong>in</strong>ally, the dot-productcutoff d c <strong>and</strong> the cutoff for the number of neighbors ξ c should be chosen such that theorder parameter is able to make a clear dist<strong>in</strong>ction between the crystal <strong>and</strong> fluid phases.Here, we choose d c = 0.6 <strong>and</strong> ξ c = 3, result<strong>in</strong>g <strong>in</strong> only small clusters <strong>in</strong> the fluid phase<strong>and</strong> a large system-spann<strong>in</strong>g cluster <strong>in</strong> the crystal phase.5.3.3 Orientational orderFor the orientational order <strong>in</strong> the system, the order parameter used to calculate thecorrelation function G or (r) isG pairor (u a , u b ) = 1 33∑ [35(ua,j · u b,j ) 4 − 30(u a,j · u b,j ) 2 + 3 ] (5.26)j=1where u a,j denotes the jth axis of particle a. [76, 88] This order parameter will on averagebe equal to 1 for particles with perfect cubatic order, but may be higher if nematic orderis present. In this case, nematic order would <strong>in</strong>dicate that the cubes are not only aligned,but also have the same faces po<strong>in</strong>t<strong>in</strong>g <strong>in</strong> the same directions. As the six sides of a cubeare equivalent, nematic order should not be possible <strong>in</strong> the system, but s<strong>in</strong>ce particles
Phase behavior <strong>and</strong> crystal vacancies <strong>in</strong> <strong>colloidal</strong> hard cubes 63<strong>in</strong> the crystal phase are <strong>in</strong>itialized with the same orientation, this can lead to artificiallyhigh values of the order parameter. To remedy this, the three axes u a,i for each particlea are r<strong>and</strong>omly reordered before perform<strong>in</strong>g the calculations.Like the bond-orientational order parameter, we will also use G pairor (a, b) for f<strong>in</strong>d<strong>in</strong>gclusters exhibit<strong>in</strong>g local orientational order. For the purpose of f<strong>in</strong>d<strong>in</strong>g these clusters, twoparticles a <strong>and</strong> b are considered to be connected if their center-to-center distance r ab < r c<strong>and</strong> G 4 (u a , u b ) > G c . We use the same values for r c <strong>and</strong> ξ c as used <strong>in</strong> the local positionalorder parameter, <strong>and</strong> choose G c = 0.6. This choice of parameters results <strong>in</strong> clusters thatapproximately match the clusters found by the positional order algorithm <strong>in</strong> size.5.4 ResultsAs mentioned earlier, the phase behavior of hard cubes has been studied previously <strong>in</strong> Refs.[75, 77], us<strong>in</strong>g expansion <strong>and</strong> compression runs of MC simulations <strong>in</strong> the NP T -ensemble.They reported the observation of a fluid phase at low pack<strong>in</strong>g fractions, a coexistenceregion between a fluid <strong>and</strong> a cubatic phase for 0.45 < η < 0.52, <strong>and</strong> a cont<strong>in</strong>uous transitionfrom the cubatic phase to a simple cubic crystal structure at η = 0.57. Here, we willexam<strong>in</strong>e <strong>in</strong> more detail the phase behavior of hard cubes, <strong>and</strong> <strong>in</strong>vestigate <strong>in</strong> particularthe existence of the cubatic phase.To beg<strong>in</strong>, we determ<strong>in</strong>e the equation of state of the system us<strong>in</strong>g both EDMD (at constantnumber of particles N, volume V <strong>and</strong> temperature T ) <strong>and</strong> NP T MC simulations (atconstant pressure P ). The equation of state result<strong>in</strong>g from EDMD simulations is shown<strong>in</strong> Fig. 5.1. The results from MC simulations agreed very well with the EDMD simulations,but were more sensitive to statistical errors even for significantly longer simulationtimes. For the NP T MC simulations, the system was <strong>in</strong>itialized either with r<strong>and</strong>om positions<strong>and</strong> orientations at low densities for the fluid branch, or <strong>in</strong> a simple cubic crystalstructure for the solid branch. All EDMD simulations were started from a simple cubiclattice. While this requires the crystal to melt before fluid pressures can be measured, thephase transition between a fluid <strong>and</strong> a solid shows very little sign of hysteresis, <strong>and</strong> goodagreement between the fluid branches of the two simulation methods is reached. Due tothe free energy cost of creat<strong>in</strong>g a fluid-solid coexistence <strong>in</strong>side the simulation box, a smallpart of the equation of state for the metastable fluid <strong>and</strong> solid can still be measured. Asthe metastable extensions of both the fluid <strong>and</strong> solid branch are very short, i.e., the sp<strong>in</strong>odalpo<strong>in</strong>ts are very close to the b<strong>in</strong>odal ones, the transition is weakly first order, <strong>and</strong> thephase transformation proceeds either via nucleation <strong>and</strong> growth with a small nucleationbarrier or via sp<strong>in</strong>odal decomposition. In addition, one may argue that the surface tensionof the fluid-solid <strong>in</strong>terface of hard cubes should be small. From the equation of state, as<strong>in</strong>gle phase transition is clearly evident around βP σ 3 = 6. Furthermore, the equation ofstate shows good agreement with the one shown <strong>in</strong> Ref. [77].The equation of state <strong>in</strong> Fig. 5.1 shows no sign of a first-order phase transition from apossible cubatic phase to a crystal, suggest<strong>in</strong>g that a possible phase transition would becont<strong>in</strong>uous. If no first-order phase transition exists, the free energy of the solid branch canbe calculated via thermodynamic <strong>in</strong>tegration without tak<strong>in</strong>g <strong>in</strong>to account the possibility ofany discont<strong>in</strong>uous transitions. Perform<strong>in</strong>g free energy calculations on the fluid <strong>and</strong> crystal
64 Chapter 5ΒPΣ 33025201510500.0 0.2 0.4 0.6 0.8 1.0ΗFigure 5.1: Equations of state, βP σ 3 versus η as determ<strong>in</strong>ed us<strong>in</strong>g EDMD simulations ofN = 8000 particles. The fluid branch is shown <strong>in</strong> red while the solid branch is shown <strong>in</strong> blue.Almost no hysteresis of the two branches is seen.phases yielded a fluid-solid coexistence region between pack<strong>in</strong>g fractions η f = 0.450 <strong>and</strong>η s = 0.517, <strong>in</strong> excellent agreement with the approximate phase boundaries found <strong>in</strong> Ref.[77].In order to <strong>in</strong>vestigate the region near the coexistence region more closely, we performedEDMD simulations on <strong>systems</strong> of N = 64000 particles start<strong>in</strong>g from a simplecubic lattice. Coexistence between the fluid <strong>and</strong> solid phase can be observed directly forpack<strong>in</strong>g fractions 0.455 ≤ η ≤ 0.48. Snapshots of the coexistence are shown <strong>in</strong> Fig. 5.1.In these snapshots, crystall<strong>in</strong>e clusters were found us<strong>in</strong>g the local bond <strong>and</strong> orientationalorder parameters described <strong>in</strong> the previous section. Particles that were considered notto be part of a crystall<strong>in</strong>e cluster are displayed much smaller than their actual size, <strong>in</strong>order to show what parts of the system are solid-like. We f<strong>in</strong>d good agreement betweenthe located clusters based on orientational <strong>and</strong> bond order. This suggests that significantorientational order only occurs when bond order exists, <strong>and</strong> vice versa. Moreover, we f<strong>in</strong>dconfigurations with planar fluid-solid <strong>in</strong>terfaces, but also fluid droplets <strong>and</strong> tubes <strong>in</strong> thesolid phase <strong>and</strong> solid tubes <strong>in</strong> the fluid phase as the system tends to m<strong>in</strong>imize the surfacefree energy. Hence, the surface tension is small, but not zero.In Refs. [75, 77], the phase <strong>in</strong> coexistence with the fluid was identified as cubatic,based on the f<strong>in</strong>ite diffusion present <strong>in</strong> the system up to pack<strong>in</strong>g fraction η = 0.57. In oursimulations, part of the diffusion <strong>in</strong> the system appears to be caused by diffusion of entirerows of particles. In this way all particles <strong>in</strong> such a a row are shifted to the next latticesite by us<strong>in</strong>g the periodic boundary conditions of the system to shift all particles <strong>in</strong> thatrow to the next lattice site. If this would be the ma<strong>in</strong> source of diffusion, larger <strong>systems</strong>izes should strongly suppress this behavior, as the free energy barrier <strong>in</strong>volved <strong>in</strong> rowdiffusion scales with the number of particles <strong>in</strong> the row. We exam<strong>in</strong>ed the diffusion for<strong>systems</strong> of N = 1000, 8000 <strong>and</strong> 64000 particles, but found no significant f<strong>in</strong>ite size effects<strong>in</strong> the diffusion constants, as shown <strong>in</strong> Fig. 5.2. Closer looks at trajectories of particles
Phase behavior <strong>and</strong> crystal vacancies <strong>in</strong> <strong>colloidal</strong> hard cubes 65η G bond G or η G bond G or0.45 0.470.455 0.4750.46 0.480.465 0.485Table 5.1: Snapshots of EDMD simulations with N = 64000 hard cubes, at a range of pack<strong>in</strong>gfractions <strong>in</strong> the coexistence region. For each snapshot, clusters were determ<strong>in</strong>ed based on q 4 forpositional order <strong>and</strong> G 4 for orientational order. Particles <strong>in</strong> the largest solid cluster are shownat actual size, while all all other particles are displayed much smaller.
66 Chapter 5Diffusion0.030 N ⩵ 640000.025 N ⩵ 8000 N ⩵ 10000.0200.015 0.010 0.005 0.000 0.40 0.45 0.50 0.55 0.60 0.65 0.70ΗFigure 5.2: Diffusion coefficient D (<strong>in</strong> arbitrary units) as a function of the pack<strong>in</strong>g fraction forthree different system sizes.<strong>in</strong> the crystal suggest that the ma<strong>in</strong> cause of diffusion is accordeon-like motion of rowsof particles, where l<strong>in</strong>es of particles are compressed <strong>and</strong> stretched, allow<strong>in</strong>g particles tomove to a different lattice site.Under close exam<strong>in</strong>ation, the snapshots <strong>in</strong> Table 5.1 taken just above coexistence stillexhibit a significant amount of positional order. However, the direction of the crystal isseen to change dur<strong>in</strong>g the EDMD simulation: after a short equilibration time, the latticevectors are no longer aligned with the simulation box. This spontaneous misalignmentwas observed <strong>in</strong> EDMD simulations of <strong>systems</strong> of size N = 1000, 8000 <strong>and</strong> 64000, as wellas <strong>in</strong> MC simulations of N = 1000, 3375 <strong>and</strong> 8000 particles. The rotation of the latticeonly occurs at pack<strong>in</strong>g fractions lower than η ≃ 0.57, approximately correspond<strong>in</strong>g to theregion where a cubatic phase was identified <strong>in</strong> Refs. [75, 77]. However, it is not directlyclear that the structures found at these densities do not exhibit long-range order. Table5.2 shows scatter<strong>in</strong>g patterns for <strong>systems</strong> of N = 8000 particles at a range of densities nearcoexistence. A pattern of peaks <strong>in</strong>dicat<strong>in</strong>g cubic crystall<strong>in</strong>e order clearly starts emerg<strong>in</strong>gat the solid coexistence density of η s = 0.5. In the coexistence region, pockets of fluidare present <strong>in</strong> the system, significantly reduc<strong>in</strong>g the crystall<strong>in</strong>e order until only a r<strong>in</strong>gshapedmaximum rema<strong>in</strong>s at pack<strong>in</strong>g fraction η = 0.45 <strong>and</strong> lower, where the box no longerconta<strong>in</strong>s crystall<strong>in</strong>e clusters. While the crystall<strong>in</strong>e order <strong>in</strong>creases at higher densities, thepattern at η = 0.5 is already <strong>in</strong>dicative of a crystall<strong>in</strong>e structure.We now study the correlation functions related to the orientational, bond-orientational<strong>and</strong> positional order <strong>in</strong> the system at pack<strong>in</strong>g fractions slightly above coexistence. Inparticular, the existence of long-range positional order would <strong>in</strong>dicate the absence of acubatic phase. Figure 5.4 shows the correlation functions for the orientational order(G or (r)) <strong>and</strong> the bond-orientational order (G bond (r)) at η = 0.52. These functions clearlyreach a constant at large distances, <strong>and</strong> this behavior was seen to be consistent accrossall pack<strong>in</strong>g fractions above coexistence. A plot of the global positional order 〈G pos 〉as a function of η is shown on the right <strong>in</strong> Fig. 5.4. It is clear that both the bondorientational<strong>and</strong> orientational order are long-range <strong>in</strong> nature <strong>and</strong> <strong>in</strong>crease monotonically
Phase behavior <strong>and</strong> crystal vacancies <strong>in</strong> <strong>colloidal</strong> hard cubes 67Η ⩵ 0.44Η ⩵ 0.45Η ⩵ 0.46FFCΗ ⩵ 0.47Η ⩵ 0.48Η ⩵ 0.49CCCΗ ⩵ 0.5Η ⩵ 0.51Η ⩵ 0.52CCSΗ ⩵ 0.53Η ⩵ 0.54Η ⩵ 0.56SSSTable 5.2: Scatter<strong>in</strong>g patterns for a range of pack<strong>in</strong>g fractions η as labeled, measured <strong>in</strong> asystem of N = 8000 particles <strong>and</strong> averaged over 50 snapshots. The letter <strong>in</strong> the middle denoteswhether the sample is <strong>in</strong> the fluid phase (“F”), solid phase (“S”) or <strong>in</strong> the coexistence region(“C”), accord<strong>in</strong>g to the phase diagram obta<strong>in</strong>ed from free energy calculations. For the twolowest pack<strong>in</strong>g fractions, the color scale has been adjusted to show the structure <strong>in</strong> the fluidmore clearly.
68 Chapter 51.00.8Gposr0.60.40.20.00 5 10 15 20 25rFigure 5.3: Positional correlation functions G pos (r) as a function of r <strong>in</strong> <strong>systems</strong> of N = 64000hard cubes, for various pack<strong>in</strong>g fractions η. The thick l<strong>in</strong>e corresponds to η = 0.52, while theother l<strong>in</strong>es correspond to η = 0.54 (bottom), 0.56, 0.58, 0.64, 0.7, <strong>and</strong> 0.8 (top). Note that thecorrelation for η = 0.52 is higher than the one for η = 0.54 at large distances.with the pack<strong>in</strong>g fraction η. In Fig. 5.3, we present plots of the positional correlationfunction G pos (r) at a range of pack<strong>in</strong>g fractions above coexistence. At pack<strong>in</strong>g fractionsη > 0.56, the correlation functions reach a constant value, <strong>in</strong>dicat<strong>in</strong>g long-range positionalorder. However, at lower densities, the behavior is much less well def<strong>in</strong>ed, <strong>and</strong> differentsimulations at the same density can give differrent results. As seen from the cross<strong>in</strong>gof the l<strong>in</strong>es for η = 0.52 <strong>and</strong> η = 0.54, the correlation function does not necessarilydecay faster at lower pack<strong>in</strong>g fractions. For these plots, the reciprocal lattice vector Kwas chosen to correspond to a maximum <strong>in</strong> S(K). While chang<strong>in</strong>g this vector to othermaxima can change the behavior of the correlation function significantly, we did not f<strong>in</strong>dsigns of long-range positional order at pack<strong>in</strong>g fractions below η = 0.56. Comb<strong>in</strong>ed witha shorter-ranged positional order, this would correspond to a cubatic phase. However, theregion of pack<strong>in</strong>g fractions where no long-range positional order is observed is also theregion where the crystal orientation is seen to change dur<strong>in</strong>g the simulation. It is possiblethat the reorientation of the crystal structure <strong>in</strong> the simulation box <strong>in</strong>troduces defectsthat break the long-range order, <strong>and</strong> s<strong>in</strong>ce the rotation also slightly distorts the crystal,it seems unlikely that these rotated crystals correspond to the equilibrium state.To exam<strong>in</strong>e the rotated lattices <strong>in</strong> detail, we projected the particle positions on a plane,averag<strong>in</strong>g over a series of snapshots <strong>in</strong> a simulation of N = 64000 particles, at severalpack<strong>in</strong>g fractions around η = 0.54. As before, the simulations were started <strong>in</strong> a 40x40x40simple cubic crystal state. Surpris<strong>in</strong>gly, after equilibration we observed a clear lattice of41x41 peaks <strong>in</strong> several simulations. Project<strong>in</strong>g along a different axis confirmed that thecrystal sometimes formed extra layers <strong>in</strong> all three directions, <strong>in</strong>creas<strong>in</strong>g the total numberof lattice positions. As the number of particles <strong>in</strong> the system is constant, the numberof vacancies <strong>in</strong> the crystal is then approximately 7% of the number of lattice sites. Inother simulations, the lattice rotated, <strong>and</strong> formed extra lattice sites <strong>in</strong> the process. This
Phase behavior <strong>and</strong> crystal vacancies <strong>in</strong> <strong>colloidal</strong> hard cubes 69Gr0.80.60.4G or rG bond rG0.90.80.7G or G bond 0.20.60.00 5 10 15 20 25r0.50.50 0.55 0.60 0.65 0.70 0.75ΗFigure 5.4: Orientational <strong>and</strong> bond-orientational order <strong>in</strong> <strong>systems</strong> of N = 64000 particles.Left: Orientational <strong>and</strong> bond-order correlation functions G or (r) (light) <strong>and</strong> G bond (r) (dark) atpack<strong>in</strong>g fraction η = 0.52. Right: Global order parameters 〈G or 〉 (light) <strong>and</strong> 〈G bond 〉 (dark), ascalculated from the limit<strong>in</strong>g value of the correlation functions (see Eq. 5.17).behavior strongly suggests that the equilibrium concentration of vacancies is significantlyhigher <strong>in</strong> hard cubes than <strong>in</strong> e.g. hard spheres, where it is estimated to be 2.6·10 −4 .[89, 90]By perform<strong>in</strong>g EDMD simulations on <strong>systems</strong> with N L = 64000 lattice sites, butfewer particles, we observe that the rotation of the crystal lattice <strong>in</strong> the simulation boxcan be prevented by a sufficiently high defect concentration. Figure 5.5 shows the globalpositional order 〈G pos 〉 as a function of the fraction of defects α = (N L −N)/N L at pack<strong>in</strong>gfractions η = 0.52, 0.54 <strong>and</strong> 0.56. For η = 0.52, the positional order shows a clear peakat a defect concentration around 3%, which shift to lower numbers of vacancies as thedensity <strong>in</strong>creases. The positional order parameter correlation functions near the peak<strong>in</strong> the order parameter clearly reach a constant at high distances, <strong>in</strong>dicat<strong>in</strong>g long-rangeorder. Typical plots are shown on the right <strong>in</strong> Fig. 5.5. This strongly suggests that thephase which was previously identified as cubatic is simply a metastable state, <strong>in</strong> whichthe system gets trapped as the number of particles does not accomodate a crystal withan equilibrium number of vacancies <strong>in</strong> the simulation box. A lower free energy for asystem with a significant number of vacancies may also expla<strong>in</strong> the observations of latticereorientation <strong>in</strong> the simulation box: rotat<strong>in</strong>g the lattice is likely a relatively easy way forthe system to create a small number of defects without add<strong>in</strong>g a full extra layer to thecrystal. Additionally, the number of defects <strong>in</strong> the system will strongly affect the diffusion<strong>in</strong> the crystal. Hence, the sharp decrease <strong>in</strong> the diffusion constant around η = 0.56 <strong>in</strong> Fig.5.2 likely corresponds to the pack<strong>in</strong>g fraction above which the system was no longer ableto form vacancies spontaneously <strong>in</strong> the f<strong>in</strong>ite simulation box.We performed free energy calculations on crystals with a range of vacancy concentrations,as described <strong>in</strong> Section 5.2.2 above. Prelim<strong>in</strong>ary results for pack<strong>in</strong>g fractionη = 0.52 are shown <strong>in</strong> Fig. 5.6. As the number of vacancies <strong>in</strong>creases, the free energy ofthe system decreases significantly. From these results, the equilibrium defect concentrationseems to be on the order of 4%. Interest<strong>in</strong>gly, the free energy as a function of thedefect concentration is extremely flat near the equilibrium number of vacancies, <strong>in</strong>dicat<strong>in</strong>gthat significant fluctuations <strong>in</strong> the number of defects are possible without large freeenergy costs. To determ<strong>in</strong>e the equilibrium concentration of defects for higher densities,
70 Chapter 5Gglobal0.7Η ⩵ 0.560.60.50.40.30.20.1Η ⩵ 0.510.00.00 0.01 0.02 0.03 0.04 0.05 0.06ΑGposr1.00.80.60.40.20.00 5 10 15 20 25rFigure 5.5: Left: Global positional order 〈G pos 〉 as a function of the fraction of vacancies <strong>in</strong>the lattice, at pack<strong>in</strong>g fractions η = 0.51 (bottom, gray), 0.52 (red), 0.53 (green), 0.54 (black)<strong>and</strong> 0.56 (top, blue). The po<strong>in</strong>ts <strong>in</strong>dicate measurements of 〈G pos 〉 along the x, y <strong>and</strong> z axesseparately, while the l<strong>in</strong>es are averaged over all three directions. Each po<strong>in</strong>t is averaged over 20snapshots. Right: Positional order parameter correlation functions G pos (r) at η = 0.52 withα = (N L − N)/N L = 0.015 (bottom) <strong>and</strong> at η = 0.54 with α = 0.007 (top).6.616.600.080.06ΒPΣ 36.56Β F N6.596.58Α0.040.025.50.45 0.5 0.55Η6.570.00 0.01 0.02 0.03 0.04 0.05 0.06Α0.000.50 0.52 0.54 0.56 0.58 0.60ΗFigure 5.6: Left: Free energy as function of the defect concentration for a simple cubic crystalof hard cubes at constant pack<strong>in</strong>g fraction η = 0.52. The l<strong>in</strong>e is a fit through the po<strong>in</strong>ts, with am<strong>in</strong>imum at α = 0.04. Right: Equilibrium concentration of defects as a function of the pack<strong>in</strong>gfraction, as determ<strong>in</strong>ed by free energy calculations. The l<strong>in</strong>e is a fit to guide the eye. The <strong>in</strong>setshows the equation of state of the fluid (black), of the solid without vacancies (red), <strong>and</strong> of thesolid with an equilibrium concentration of vacancies (green). The coexistence as determ<strong>in</strong>ed byRef. [77] is depicted with a red dotted l<strong>in</strong>e, while the coexistence as determ<strong>in</strong>ed <strong>in</strong> this Letteris shown with a green dotted l<strong>in</strong>e.
Phase behavior <strong>and</strong> crystal vacancies <strong>in</strong> <strong>colloidal</strong> hard cubes 71we performed EDMD simulations to calculate the crystal equation of state for the samerange of defect concentrations, <strong>and</strong> used thermodynamic <strong>in</strong>tegration to calculate the freeenergy l<strong>and</strong>scape as a function of density <strong>and</strong> defect concentration. M<strong>in</strong>imiz<strong>in</strong>g the freeenergy at densities 0.51 ≤ η ≤ 0.6 showed that the expected defect concentration goesdown monotonously as the density <strong>in</strong>creases, as shown on the right <strong>in</strong> Fig. 5.6. Us<strong>in</strong>g them<strong>in</strong>imum <strong>in</strong> the free energy at each density, we performed a common tangent construction<strong>and</strong> calculated the coexistence densities to be η f = 0.45 <strong>and</strong> η m = 0.50 for the fluid <strong>and</strong>the solid, respectively. As can be expected, the decrease <strong>in</strong> free energy caused by thevacancies shifts the coexistence down compared to the defect-free crystal, as can be seen<strong>in</strong> the <strong>in</strong>set on the right-h<strong>and</strong> side <strong>in</strong> Fig. 5.6.5.5 Conclusions <strong>and</strong> discussionIn summary, we have studied the phase behavior of <strong>colloidal</strong> hard cubes us<strong>in</strong>g both MC<strong>and</strong> EDMD simulations. The result<strong>in</strong>g phase diagram consists only of a fluid phase <strong>and</strong>a simple cubic crystal phase, with a coexistence region between η f = 0.45 <strong>and</strong> η s = 0.50.Close to the solid coexistence density, the concentration of vacancies <strong>in</strong> the crystal phaseat a pack<strong>in</strong>g fraction just above coexistence is around 5%, which is extremely high whencompared to other <strong>systems</strong>. This high equilibrium defect concentration drives the systemto distortions <strong>and</strong> rotations of the crystal structure <strong>in</strong> order to form extra defects, lead<strong>in</strong>gto a less ordered metastable phase that was identified as a cubatic phase <strong>in</strong> earlier studies.[75, 77]It is possible that the high vacancy concentration is related to the relatively low freeenergy cost of plac<strong>in</strong>g a particle between two (otherwise empty) lattice positions <strong>in</strong> thesimple cubic crystal phase. In a hard-sphere crystal, for example, such a position wouldbe highly unlikely as it requires a significant displacement of neighbor<strong>in</strong>g particles. Thus,a vacancy <strong>in</strong> hard-sphere <strong>and</strong> similar crystals will generally be localized to a s<strong>in</strong>gle latticesite, <strong>and</strong> will occasionally hop as it is filled by a nearby particle. In contrast, the spaceof a vacancy <strong>in</strong> a hard-cube crystal can be smeared out over a longer row of particles,<strong>in</strong> such a way that each particle ga<strong>in</strong>s some extra free volume. While the particles arestill significantly more likely to f<strong>in</strong>d themselves <strong>in</strong> one of the lattice positions, the extraentropy provided by the defect can then be significantly higher than it would be <strong>in</strong> a hardspherecrystal. Consequently, one might also expect a f<strong>in</strong>ite equilibrium concentration ofvacancies <strong>in</strong> crystal structures of other particles where particle movement between latticesites is possible without significantly affect<strong>in</strong>g other nearby particles. While <strong>in</strong> simulationsof hard cubes the crystal was seen to spontaneously change its lattice to generate thesevacancies, this effect may be less strong <strong>in</strong> other <strong>systems</strong>, which makes it harder to f<strong>in</strong>dwhether or not the crystal phase exhibits a high equilibrium concentration of vacancies.However, for crystal structures such as the ones found for hexagonal <strong>and</strong> triangular prisms<strong>in</strong> Ref. [77], or the square lattice of hard squares 2D [91], the possibility of crystal vacanciesshould likely be taken <strong>in</strong>to account, as these could affect the region of stability for thecrystal phase.
72 Chapter 55.6 AcknowledgementsI would like to thank Laura Filion for her collaboration on this project, <strong>and</strong> for perform<strong>in</strong>gthe Monte Carlo simulations <strong>and</strong> free energy calculations discussed <strong>in</strong> this chapter. I wouldalso like to thank Matthieu Marechal for useful discussions.
6Phase diagrams of <strong>colloidal</strong> sphereswith a constant zeta-potentialWe study suspensions of <strong>colloidal</strong> spheres with a constant zeta-potential with<strong>in</strong> Poisson-Boltzmann theory, quantify<strong>in</strong>g the discharg<strong>in</strong>g of the spheres with <strong>in</strong>creas<strong>in</strong>g colloid density<strong>and</strong> decreas<strong>in</strong>g salt concentration. We use the calculated renormalized charge of thecolloids to determ<strong>in</strong>e their pairwise effective screened-Coulomb repulsions. We then calculatebulk phase diagrams <strong>in</strong> the colloid concentration-salt concentration representation,for various zeta-potentials, by a mapp<strong>in</strong>g onto published fits of phase boundaries of po<strong>in</strong>t-Yukawa <strong>systems</strong>. Although the result<strong>in</strong>g phase diagrams do feature face-centered cubic(fcc) <strong>and</strong> body-centered cubic (bcc) phases, they are dom<strong>in</strong>ated by a (re-entrant) fluidphase due to the <strong>colloidal</strong> discharg<strong>in</strong>g with <strong>in</strong>creas<strong>in</strong>g colloid concentration <strong>and</strong> decreas<strong>in</strong>gsalt concentration.
74 Chapter 66.1 IntroductionCharged <strong>colloidal</strong> particles suspended <strong>in</strong> a liquid electrolyte are <strong>in</strong>terest<strong>in</strong>g soft-matter<strong>systems</strong> that have generated fundamental as well as <strong>in</strong>dustrial attention for decades. [92]Underst<strong>and</strong><strong>in</strong>g the stability <strong>and</strong> phase behaviour of these <strong>systems</strong> as a function of colloidconcentration <strong>and</strong> ionic strength is an important theme <strong>in</strong> many of these studies. A keyrole is played by the electrostatic repulsions between the <strong>colloidal</strong> spheres, which are notonly capable of stabilis<strong>in</strong>g suspensions aga<strong>in</strong>st irreversible aggregation due to attractiveVan der Waals forces, [93] but are also the driv<strong>in</strong>g force for crystallisation, [94] providedthe surface charge on the colloids is high enough <strong>and</strong> the range of the repulsions longenough. [92–94] The classic theory that describes the electrostatic repulsions betweencharged <strong>colloidal</strong> particles <strong>in</strong> suspension goes back to the 1940’s, when Derjagu<strong>in</strong>, L<strong>and</strong>au,Verwey, <strong>and</strong> Overbeek (DLVO) found, with<strong>in</strong> l<strong>in</strong>ear screen<strong>in</strong>g theory, that suspendedspheres repel each other by screened-coulomb (Yukawa) <strong>in</strong>teractions. [42, 95] The strengthof these repulsions <strong>in</strong>creases with the square of the <strong>colloidal</strong> charge, <strong>and</strong> they decayexponentially with particle-particle separation on the length scale of the Debye screen<strong>in</strong>glength of the solvent. [96] This pairwise Yukawa form is a corner stone of colloid science,<strong>and</strong> can expla<strong>in</strong> a large number of observations. [92–94] For <strong>in</strong>stance, the experimentallyobserved crystallisation of charged <strong>colloidal</strong> spheres <strong>in</strong>to body-centered cubic (bcc) <strong>and</strong>face-centered cubic (fcc) phases upon <strong>in</strong>creas<strong>in</strong>g the <strong>colloidal</strong> pack<strong>in</strong>g fraction at low <strong>and</strong>high salt concentrations, [97–100] respectively, is <strong>in</strong> fair agreement with simulations ofYukawa <strong>systems</strong>. [101–104] Interest<strong>in</strong>gly, <strong>in</strong> these simulation studies, as well as <strong>in</strong> manyother studies, [105–109] the charge of the colloids is assumed to be <strong>in</strong>dependent of thecolloid density <strong>and</strong> the salt concentration.Experiments on deionized aqueous suspensions of highly charged spherical latex colloidswith ionizable sulphate groups showed <strong>in</strong>deed evidence for an effective charge that is<strong>in</strong>dependent of volume fraction us<strong>in</strong>g elasticity <strong>and</strong> conductivity measurements. [110–112]Differences between the effective charge obta<strong>in</strong>ed from conductivity <strong>and</strong> elasticity measurementswere attributed to either charge renormalization [105] or macro-ion shield<strong>in</strong>gdue to many-body effects. [113–115] Similar conclusions were obta<strong>in</strong>ed for silica particleswith ionizable carboxylate groups on the surface. [116]The constant-charge assumption was argued to break down, however, <strong>in</strong> some recentstudies where the electrostatic repulsions were argued to be reduced with <strong>in</strong>creas<strong>in</strong>g colloidconcentration. Biesheuvel, [117] for <strong>in</strong>stance, argues that experimental equilibriumsedimentation-diffusion profiles of charged silica spheres <strong>in</strong> ethanol at extremely low saltconcentrations [118] are better fitted by a charge-regulation model than by a constantchargemodel. [119] More recent evidence for a concentration-dependent <strong>colloidal</strong> chargestems from re-entrant melt<strong>in</strong>g <strong>and</strong> re-entrant freez<strong>in</strong>g observations of PMMA spheres <strong>in</strong>a solvent mixture of cis-decal<strong>in</strong>e <strong>and</strong> cyclohexyl bromide, i.e. the phase sequence upon<strong>in</strong>creas<strong>in</strong>g the colloid concentration is fluid-crystal-fluid-crystal. [120] In addition, directforce measurements between a s<strong>in</strong>gle pair of <strong>colloidal</strong> PMMA spheres <strong>in</strong> hexadecane, apair that is part of a triplet, <strong>and</strong> a pair that is part of a multiplet have very recentlyrevealed a significant reduction of the force with <strong>in</strong>creas<strong>in</strong>g number of neighbour<strong>in</strong>g particles.[121] Interest<strong>in</strong>gly, <strong>in</strong> the three experiments of Refs.[118, 120, 121] the solvent is anonpolar medium.
Phase diagrams of <strong>colloidal</strong> spheres with a constant zeta-potential 75In fact, the experimental f<strong>in</strong>d<strong>in</strong>gs of Ref.[121] could well be <strong>in</strong>terpreted <strong>and</strong> expla<strong>in</strong>ed <strong>in</strong>terms of constant-potential boundary conditions on the <strong>colloidal</strong> surfaces, rather than themore usual constant-charge assumption. Recently, electrophoresis experiments on PMMAspheres <strong>in</strong> a low-polar solvent that the charge per particle decreased as a function of thevolume fraction, while the surface potential appeared to rema<strong>in</strong> more or less constant.[122] This chapter addresses the consequence of constant-potential boundary conditionsfor the pack<strong>in</strong>g fraction-salt concentration phase diagram of Yukawa <strong>systems</strong> by calculat<strong>in</strong>gthe <strong>colloidal</strong> charge <strong>and</strong> the effective screen<strong>in</strong>g length for various zeta-potentialsas a function of salt- <strong>and</strong> colloid concentration. In the case of high zeta-potential thisrequires nonl<strong>in</strong>ear screen<strong>in</strong>g theory, <strong>and</strong> hence the renormalized rather than the bare <strong>colloidal</strong>charge determ<strong>in</strong>es the effective screened-Coulomb repulsions between the colloids.[98, 105, 108, 116, 123–127] For this reason we use the renormalized charge throughout.We also compare our constant-potential calculations with those of an explicit chargeregulationmodel, [128–133] <strong>and</strong> conclude that their results are qualitatively similar, <strong>and</strong>even quantitatively if they are considered as a function of an effective screen<strong>in</strong>g length.6.2 Model <strong>and</strong> theoryWe consider N <strong>colloidal</strong> spheres of radius a <strong>in</strong> a solvent of volume V , temperature T ,dielectric constant ɛ <strong>and</strong> Bjerrum length λ B = e 2 /ɛk B T . Here e is the elementary charge<strong>and</strong> k B the Boltzmann constant. The <strong>colloidal</strong> density is denoted by n = N/V <strong>and</strong>the pack<strong>in</strong>g fraction by η = (4π/3)na 3 . The suspension is presumed to be <strong>in</strong> osmoticcontact with a 1:1 electrolyte of Debye length κ −1 <strong>and</strong> total salt concentration 2ρ s . Weare <strong>in</strong>terested <strong>in</strong> suspensions of charged colloids of which the surface (zeta) potential ψ 0rather than the charge Ze is fixed. We will show that this constant-potential conditionmimics charge-regulation on the <strong>colloidal</strong> surfaces fairly accurately. The first goal ofthis article is to calculate Z as a function of η for fixed dimensionless comb<strong>in</strong>ations κa,a/λ B , <strong>and</strong> φ 0 ≡ eψ 0 /k B T . This result will then be used to quantify the effective Yukawa<strong>in</strong>teractions between pairs of colloids, <strong>and</strong> hence the phase boundaries between fluid,face-centered cubic (fcc) <strong>and</strong> body-centered cubic (bcc) crystall<strong>in</strong>e phases.In the actual suspension of constant-potential <strong>colloidal</strong> spheres, the charge distributionof each of the N colloids will be distributed heterogeneously over its surface due tothe proximity of other colloids <strong>in</strong> some directions. This leads to a tremendously complexmany-body problem that we simplify here by assum<strong>in</strong>g a spherically symmetric environmentfor each colloid, which is nevertheless expected to describe the average electrostaticproperties realistically. Below we will calculate the electrostatic potential ψ(r) at a radialdistance r from a charged <strong>colloidal</strong> sphere at a given zeta-potential ψ 0 , i.e. at a givenvalue ψ(a) = ψ 0 . The <strong>colloidal</strong> charge Ze then follows from Gauss’ lawψ ′ (a) = − Zeɛa 2 , (6.1)where a prime denotes a radial derivative.We first consider a s<strong>in</strong>gle colloid <strong>in</strong> the center of a spherical Wigner-Seitz cell of radiusR, such that the cell volume equals the volume per particle, (4π/3)R 3 = V/N, which
76 Chapter 6implies R = aη −1/3 . The radial coord<strong>in</strong>ate of the cell is called r. We write the ionicdensity profiles for r ∈ (a, R) as Boltzmann distributions ρ ± (r) = ρ s exp(∓φ(r)), withφ(r) = eψ(r)/k B T the dimensionless electrostatic potential. Together with the Poissonequation ∇ 2 φ = −4πλ B (ρ + (r) − ρ − (r)), this gives rise to the radially symmetric PBequation<strong>and</strong> boundary conditions (BC’s)φ ′′ (r) + 2 r φ′ (r) = κ 2 s<strong>in</strong>h φ(r), r ∈ (a, R); (6.2)φ(a) = φ 0 ; (6.3)φ ′ (R) = 0, (6.4)where a prime denotes a derivative with respect to r. Note that BC (6.4) implies chargeneutrality of the cell. Once the solution φ(r) is found for given η, κa, <strong>and</strong> φ 0 , e.g.numerically on a radial grid, the <strong>colloidal</strong> charge Z follows from Eq.(6.1), which we rewrite<strong>in</strong> dimensionless form asZλ B= −aφ ′ (a). (6.5)aFrom the numerical solutions that we will present below it turns out that Z decreasesmonotonically from a f<strong>in</strong>ite asymptotic low-η (large-R) value Z 0 to essentially 0 at η ≃ 1(or R ≃ a).With<strong>in</strong> l<strong>in</strong>ear-screen<strong>in</strong>g theory at low pack<strong>in</strong>g fraction, where s<strong>in</strong>h φ ≃ φ, the potentialdistribution can be solved for analytically, yield<strong>in</strong>g φ(r) = φ 0 a exp[−κ(r−a)]/r, such thatthe <strong>colloidal</strong> charge takes the asymptotic low-η <strong>and</strong> low-φ 0 valueZ 0 λ Ba= (1 + κa)φ 0 . (6.6)In the appendix we show that the discharg<strong>in</strong>g effect with <strong>in</strong>creas<strong>in</strong>g η, as found fromthe nonl<strong>in</strong>ear screen<strong>in</strong>g theory discussed above, can also be approximated with<strong>in</strong> l<strong>in</strong>earscreen<strong>in</strong>g theory, yield<strong>in</strong>gZ(η, κa) =Z 01 + η/η ∗ , η∗ = (κa)23(1 + κa) , (6.7)where η ∗ is a crossover pack<strong>in</strong>g fraction at which the <strong>colloidal</strong> charge has decayed to halfits dilute-limit value Z 0 given <strong>in</strong> Eq.(6.6). For typical numbers of experimental <strong>in</strong>terest,e.g. a/λ B = 100 <strong>and</strong> κa = 0.25, we then f<strong>in</strong>d Z 0 = 125φ 0 <strong>and</strong> η ∗ = 0.017. Withφ 0 ≃ 1 − 2, which corresponds to a surface potential of 25-50mV, we should expect a fewhundred charges <strong>in</strong> the dilute limit <strong>and</strong> a significant charge reduction for η 10 −2 .The constant-potential boundary condition that we employ here is supposed to mimiccharge-regulation on the <strong>colloidal</strong> surface through an association-dissociation equilibriumof chargeable groups on the surface. Here we consider, as a typical example, the reactionSA⇔ S + +A − where a neutral surface group SA dissociates <strong>in</strong>to a positively chargedsurface group S + <strong>and</strong> a released anion A − . The chemistry of such a reaction can becharacterised by a reaction constant K such that [S + ][A − ]/[SA]=K, where the squarebrackets <strong>in</strong>dicate concentrations <strong>in</strong> the vic<strong>in</strong>ity of the surface where the reaction takesplace. If we now realise that Z ∝ [S + ], we f<strong>in</strong>d for the usual case where [S + ] ≪[SA] that
Phase diagrams of <strong>colloidal</strong> spheres with a constant zeta-potential 77Z ∝ 1/[A − ]. For the case that the released anion is of the same species as the anion <strong>in</strong>the reservoir, such that [A − ] = ρ s exp[φ(a)], we thus haveZ = z exp(−φ(a)), (6.8)where the prefactor z, which is a measure for the surface chargeability, [134] accounts forthe chemistry, the surface-site areal density, <strong>and</strong> the total area of the surface betweenthe <strong>colloidal</strong> particle <strong>and</strong> the electrolyte solution. Note that Eq.(6.8) relates the (yetunknown) <strong>colloidal</strong> charge Z to the (yet unknown) zeta-potential φ(a), for a given z.A closed set of equations for charge-regulated colloids is obta<strong>in</strong>ed by comb<strong>in</strong><strong>in</strong>g the PBequation (6.2) with BC (6.4) at the boundary of a spherical Wigner-Seitz cell of radiusR, with BC (6.3) replaced byaφ ′ (a) = − λ Bzaexp(−φ(a)), (6.9)for some given chargeability z. The result<strong>in</strong>g solution φ(r) gives the zeta-potential φ(a)as well as the <strong>colloidal</strong> charge Z us<strong>in</strong>g Eq.(6.8). When compar<strong>in</strong>g the constant-potentialmodel with the ionic association-dissociation model, we will tune the chargeability z suchthat the low-η results for Z co<strong>in</strong>cide for both models.It is well known that nonl<strong>in</strong>ear screen<strong>in</strong>g effects, <strong>in</strong> particular counterion condensation<strong>in</strong> the vic<strong>in</strong>ity of a highly charged <strong>colloidal</strong> surface, reduce the effective <strong>colloidal</strong> chargethat dictates the screened-Coulomb <strong>in</strong>teractions between the colloids. [105, 108, 123–125, 135] The so-called renormalized <strong>colloidal</strong> charge, Z ∗ , can be calculated from theelectrostatic potential φ(r) as obta<strong>in</strong>ed from the nonl<strong>in</strong>ear PB equation by match<strong>in</strong>g thenumerically obta<strong>in</strong>ed solution at the edge of the cell to the analytically known solution ofa suitably l<strong>in</strong>earized problem. By extrapolat<strong>in</strong>g the solution of the l<strong>in</strong>earized problem tothe <strong>colloidal</strong> surface at r = a, one obta<strong>in</strong>s the effective charge by evaluat<strong>in</strong>g the derivativeat r = a us<strong>in</strong>g Eq.(6.5). Follow<strong>in</strong>g Trizac et al., [136] the renormalized charge Z ∗ can bewritten asZ ∗ λ Ba= − tanh φ D¯κa((¯κ 2 aR − 1) s<strong>in</strong>h[¯κ(R − a)] + ¯κ(R − a) cosh[¯κ(R − a)]) , (6.10)where the ‘Donnan’ potential is def<strong>in</strong>ed as φ D ≡ φ(R), i.e. the numerically found potentialat the boundary of the cell, <strong>and</strong> where the effective <strong>in</strong>verse screen<strong>in</strong>g length is√¯κ = κ cosh φ D . (6.11)Note that Z ∗ <strong>and</strong> ¯κ can be calculated for the constant-potential as well as the associationdissociationmodel <strong>in</strong> a spherical cell.6.3 Effective charge <strong>and</strong> screen<strong>in</strong>g lengthFor both the constant surface potential (CSP) <strong>and</strong> the association-dissociation (AD)model discussed above we calculated the bare <strong>colloidal</strong> charge Z, the effective (renormalized)charge Z ∗ , <strong>and</strong> the effective <strong>in</strong>verse screen<strong>in</strong>g length ¯κ <strong>in</strong> the geometry of spherical
78 Chapter 6Z Λ BaZ Λ Ba6420108642aΚ a ⩵ 3Κ a ⩵ 2Κ a ⩵ 1.5bΚ a ⩵ 0.5Κ a ⩵ 0.1Φ 0 ⩵ 1Φ 0 ⩵ 5010 4 10 3 10 2 10 1 10 0Η6.04.0Κ a2.00.04.0cd3.0Κ a2.0Κ a ⩵ 0.11.0Κ a ⩵ 0.5Κ a ⩵ 3Κ a ⩵ 2Κ a ⩵ 1.5Φ 0 ⩵ 1Φ 0 ⩵ 50.010 4 10 3 10 2 10 1 10 0ΗFigure 6.1: Left: The bare <strong>colloidal</strong> charge Z (cont<strong>in</strong>uous black curves) <strong>and</strong> the renormalizedcharge Z ∗ (dashed black curves), both <strong>in</strong> units of a/λ B (see text), as a function of the <strong>colloidal</strong>pack<strong>in</strong>g fraction η for several screen<strong>in</strong>g parameters κa, for constant surface potentials (a) φ 0 = 1<strong>and</strong> (b) φ 0 = 5. The red curves denote Z <strong>and</strong> Z ∗ as obta<strong>in</strong>ed from the association-dissociationmodel, with the chargeability z chosen such that the surface potential <strong>in</strong> the dilute limit η → 0equals φ 0 . Right: The effective <strong>in</strong>verse screen<strong>in</strong>g length ¯κ as a function of the pack<strong>in</strong>g fractionη for several reservoir screen<strong>in</strong>g parameters κa, for constant surface potentials (c) φ 0 = 1 <strong>and</strong>(d) φ 0 = 5 as represented by the black curves. The red curves denote ¯κ as obta<strong>in</strong>ed from theassociation-dissociation model, with the chargeability z chosen such that the surface potential<strong>in</strong> the dilute limit η → 0 equals φ 0 . Note that ¯κ = κ <strong>in</strong> all cases for η → 0.Wigner-Seitz cells. In Fig.6.1(a) <strong>and</strong> (b) we show Zλ B /a (full curves) <strong>and</strong> Z ∗ λ B /a (dashedcurves) as a function of pack<strong>in</strong>g fraction η, for two screen<strong>in</strong>g constants for both the CSPmodel (black curves) <strong>and</strong> the AD model (red curves), <strong>in</strong> (a) for fixed zeta-potential φ 0 = 1<strong>and</strong> <strong>in</strong> (b) for φ 0 = 5. In all cases the chargeability parameter z of the AD model is chosensuch as to agree with the CSP model <strong>in</strong> the low-density limit η → 0. For low pack<strong>in</strong>gfractions, the red <strong>and</strong> black curves show agreement for equal κa, by construction. Athigher η the agreement is only qualitative, <strong>and</strong> the charges predicted by the AD modelexceed those of the CSP model, which should not come as a surprise s<strong>in</strong>ce the former<strong>in</strong>terpolates between the constant-charge <strong>and</strong> the constant-potential model. The closeagreement between Z <strong>and</strong> Z ∗ for all κa at φ 0 = 1 <strong>in</strong> Fig.6.1(a) is also to be expected,s<strong>in</strong>ce φ 0 = 1 is not far <strong>in</strong>to the nonl<strong>in</strong>ear regime. By contrast, deep <strong>in</strong> the nonl<strong>in</strong>earregime of φ 0 = 5, as shown <strong>in</strong> Fig.6.1(b), there is a significant charge renormalizationeffect such that Z ∗ < Z by a factor of about 1.2 <strong>and</strong> 1.5 for κa = 0.1 <strong>and</strong> κa = 0.5,respectively. The merg<strong>in</strong>g of the red <strong>and</strong> the black curves at high-η <strong>in</strong> Fig.6.1(b) is dueto the reduction of the charge <strong>in</strong>to the l<strong>in</strong>ear-screen<strong>in</strong>g regime such that Z = Z ∗ . The<strong>in</strong>crease of Z ∗ with κ, as observed <strong>in</strong> both Fig.6.1(a) <strong>and</strong> (b), is <strong>in</strong> l<strong>in</strong>e with well-knowncharge-renormalization results, [105, 108, 123–125, 136] <strong>and</strong> with Eq. 6.6.
Phase diagrams of <strong>colloidal</strong> spheres with a constant zeta-potential 79In Fig.6.1(c) <strong>and</strong> (d) we plot, for the same zeta-potentials, the effective screen<strong>in</strong>gparameter ¯κ as a function of η for several reservoir screen<strong>in</strong>g constants κ. At low enoughη, where κR ≫ 1, the two screen<strong>in</strong>g constants are <strong>in</strong>dist<strong>in</strong>guishable from each other <strong>in</strong>all cases. The reason is that the cell is then large enough for the potential to decay toessentially zero at r = R, such that the asymptotic decay of φ(r) is governed completelyby the screen<strong>in</strong>g constant κ of the background (reservoir) salt concentration. At largerη, <strong>and</strong> hence smaller cells, φ(R) is no longer vanish<strong>in</strong>gly small <strong>and</strong> the ion concentrationsρ ± (R) at r = R deviate considerably from the ionic reservoir concentration ρ s . This largerionic concentration at the cell boundary, which represents an enhanced ion concentration<strong>in</strong> between the <strong>colloidal</strong> particles <strong>in</strong> the true many-body system, leads to a larger effectivescreen<strong>in</strong>g constant ¯κ with <strong>in</strong>creas<strong>in</strong>g η at a fixed κ, as is shown <strong>in</strong> Fig.6.1(c) <strong>and</strong> (d).Given that larger charges are obta<strong>in</strong>ed <strong>in</strong> the AD model than <strong>in</strong> the CSP model at highη, the number of counterions <strong>in</strong> the cell, <strong>and</strong> hence ¯κ, is also larger <strong>in</strong> the AD model.6.4 Effective <strong>in</strong>teractions <strong>and</strong> phase diagramsOnce the effective <strong>colloidal</strong> charge Z ∗ <strong>and</strong> the effective screen<strong>in</strong>g length ¯κ −1 have beendeterm<strong>in</strong>ed from the numerical solution of the PB equation <strong>in</strong> a spherical cell, either forconstant-potential or association-dissociation boundary conditions, the effective <strong>in</strong>teractionsu(r) between a pair of <strong>colloidal</strong> particles separated by a distance r follows, assum<strong>in</strong>gDLVO theory, as⎧⎪⎨ ∞, r < 2a;u(r)k B T = (⎪ Z ∗ ) 2exp(¯κa) exp(−¯κr)⎩ λ B , r > 2a,1 + ¯κa r(6.12)where we <strong>in</strong>clude a short-range hard-core repulsion for overlapp<strong>in</strong>g colloids <strong>and</strong> ignoreVan der Waals forces (which is justified for <strong>in</strong>dex-matched particles). Note that thepair potential u(r) depends on density-dependent parameters Z ∗ <strong>and</strong> ¯κ, <strong>and</strong> thereforeconta<strong>in</strong>s two many-body effects, (i) charge renormalization, <strong>and</strong> (ii) <strong>colloidal</strong> discharg<strong>in</strong>gwith <strong>in</strong>creas<strong>in</strong>g density. However, one could expect macro-ion shield<strong>in</strong>g as another manybodyeffect. [98, 116, 126, 137] In states where the pair <strong>in</strong>teraction u(r) is so weak thata fluid phase results, we expect the macro-ion shield<strong>in</strong>g to be weak; <strong>in</strong> crystall<strong>in</strong>e stateswith strong effective pair <strong>in</strong>teractions macro-ion shield<strong>in</strong>g could also be significant. Weexpect, however, that the strongest underly<strong>in</strong>g assumption <strong>in</strong> crystall<strong>in</strong>e states is thespherical cell employed <strong>in</strong> our calculations. The actual Wigner-Seitz cell <strong>in</strong> face-centeredcubic<strong>and</strong> body-centered-cubic crystal phases will probably generate an anisotropic chargedistribution on constant-potential colloids <strong>and</strong> hence anisotropic pair <strong>in</strong>teractions. Sucha problem could <strong>in</strong> pr<strong>in</strong>ciple be tackled with the numerical technique developed <strong>in</strong> Ref.[138], but due to its numerical <strong>in</strong>volvement such a study is left for future work. Below,we will f<strong>in</strong>d a surpris<strong>in</strong>gly large parameter regime, where a fluid phase is predicted, whichgives an a posteriori justification for the use of the relatively simple pair potential u(r) ofEq. (6.12).One could use this pair <strong>in</strong>teraction to simulate (or otherwise calculate) properties ofthe suspension <strong>in</strong> a given state-po<strong>in</strong>t, e.g. whether the system is <strong>in</strong> a fluid or crystall<strong>in</strong>e
80 Chapter 6state. We restrict our attention here to the limit<strong>in</strong>g case <strong>in</strong> which the <strong>colloidal</strong> particlesare sufficiently highly charged <strong>and</strong>/or sufficiently weakly screened, that the pair-potentialat contact satisfies u(2a) ≫ k B T , thereby effectively prevent<strong>in</strong>g direct particle-particlecontact. In this limit the suspension can be effectively regarded as a po<strong>in</strong>t-Yukawa systemthat can be completely characterised by only two dimensionless parameters U <strong>and</strong> λ forthe strength <strong>and</strong> the range of the <strong>in</strong>teractions, respectively. They are def<strong>in</strong>ed asU =( Z ∗ ) 2 ( )exp(¯κa) λ B 3η 1/31 + ¯κa a 4π(6.13)λ =( ) 3η −1/3¯κa ,4π(6.14)such that the po<strong>in</strong>t-Yukawa <strong>in</strong>teraction potential of <strong>in</strong>terest, <strong>in</strong> units of k B T , readsU exp(−λx)/x with x = r(N/V ) 1/3 the particle separation <strong>in</strong> units of the typical particlespac<strong>in</strong>g. Note that three dimensionless parameters would have been needed if hard-corecontact was not a low Boltzmann-weight configuration, e.g. then the contact-potentialβu(2a) (i.e. the <strong>in</strong>verse temperature), the dimensionless screen<strong>in</strong>g parameter κa, <strong>and</strong>the pack<strong>in</strong>g fraction η would be a natural choice. The mapp<strong>in</strong>g of the phase diagram ofthe po<strong>in</strong>t-Yukawa system onto hard-core Yukawa <strong>systems</strong> has been tested <strong>and</strong> verifiedexplicitly by computer simulation. [104]The po<strong>in</strong>t-Yukawa system has been studied by simulation <strong>in</strong> great detail over the years,[101–104] <strong>and</strong> by now it is well known this model features a disordered fluid phase <strong>and</strong> twocrystall<strong>in</strong>e phases (face-centered cubic (fcc) <strong>and</strong> body-centered cubic (bcc)). Their firstorderphase boundaries are well-documented, <strong>and</strong> can accurately be described by curves<strong>in</strong> the two-dimensional (λ, U) plane. Here, we employ the fits for the phase boundaries ofpo<strong>in</strong>t-Yukawa particles that were presented <strong>in</strong> Ref. [104], which were based on the resultsof Hamaguchi et al.. [103] The melt<strong>in</strong>g-freez<strong>in</strong>g l<strong>in</strong>e between the bcc crystal <strong>and</strong> the fluidis accurately fitted by<strong>and</strong> the bcc-fcc transition byln U = 4.670 − 0.04171λ + 0.1329λ 2 − 0.01043λ 3+ 4.343 · 10 −4 λ 4 − 6.924 · 10 −6 λ 5 , (6.15)for 0 ≤ λ ≤ 12,ln U = 97.65106 − 150.469699λ + 106.626405λ 2−41.67136λ 3 + 9.639931λ 4 − 1.3150249λ 5+0.09784811λ 6 − 0.00306396λ 7 , (6.16)for 1.85 ≤ λ ≤ 6.8.Here we exploit these empirical relations as follows. For given dimensionless colloid radiusa/λ B <strong>and</strong> screen<strong>in</strong>g constant κa, we calculate Z ∗ <strong>and</strong> ¯κa for various η for the CSP <strong>and</strong>
Phase diagrams of <strong>colloidal</strong> spheres with a constant zeta-potential 811Κ a1Κ a0.80.60.40.2aFluidΦ 0 ⩵ 1BCCFCC0.00. 0.1 0.2 0.3Η4321cBCCFCCΦ 0 ⩵ 3FluidFluid00. 0.1 0.2 0.3Η1Κ a1Κ a2.01.51.00.5bFluidBCCΦ 0 ⩵ 2FCCFluid0.00. 0.1 0.2 0.3Η201510dFluidΦ 0 ⩵ 51Κ a1010 3 10 2 10 15 BCCFluid FCC00. 0.1 0.2 0.3Η50FluidBCCΗFluidFCCFigure 6.2: Phase diagrams <strong>in</strong> the pack<strong>in</strong>g fraction-screen<strong>in</strong>g length (η, κ −1 ) representation forconstant-potential colloids (radius a/λ B = 100) <strong>in</strong>teract<strong>in</strong>g with the hard-core Yukawa potentialof Eq.(6.12), for surface potentials φ 0 = 1, 2, 3, <strong>and</strong> 5. The black l<strong>in</strong>es represent phase boundariesfor the constant-potential model, <strong>and</strong> the red dashed l<strong>in</strong>es for the association-dissociation modelwith the surface potential equal to φ 0 <strong>in</strong> the dilute limit. The dashed black l<strong>in</strong>es <strong>in</strong>dicateextrapolation of Eq.(6.15) beyond its strict regime of accuracy. The <strong>in</strong>set <strong>in</strong> the phase diagramfor φ 0 = 5 represents η on a logarithmic scale for clarity. The labels “Fluid”, “BCC”, <strong>and</strong> “FCC”denote the stable fluid, bcc, <strong>and</strong> fcc regions. We note that the very narrow fluid-fcc, fluid-bcc,<strong>and</strong> fcc-bcc coexistence regions are just represented by s<strong>in</strong>gle curves. The dotted blue curvesrepresent the estimated crossover-pack<strong>in</strong>g fraction η ∗ of Eq.(6.7), beyond which Z(η) < Z(0)/2.
82 Chapter 61Κ a1.51.00.5aBCCΦ 0 ⩵ 2FCCFluidFluid0.00. 0.1 0.2 0.3Η1Κ a8.06.04.02.0bBCCFluidφ 0 ⩵ 56 BCC51 4 Fluid3FCCΚ a 21010 4 10 3 10 2 10 1Η0.0FluidFCC0. 0.1 0.2 0.3ΗFigure 6.3: Phase diagrams <strong>in</strong> the pack<strong>in</strong>g fraction-effective screen<strong>in</strong>g length representation(η, (¯κa) −1 ), for a/λ B = 100, for constant-potential colloids with (a) φ 0 = 2 <strong>and</strong> (b) φ 0 = 5, aswell as for charge-regulated colloids. L<strong>in</strong>es, symbols, <strong>and</strong> colors as <strong>in</strong> Fig.6.2.the AD model <strong>in</strong> the spherical cell, as described <strong>in</strong> the previous section. These quantitiescan be used to compute the dimensionless Yukawa parameters U <strong>and</strong> λ from Eqs.(6.13)<strong>and</strong> (6.14), such that their phase <strong>and</strong> phase-boundaries are known from Eqs.(6.15) <strong>and</strong>(6.16).For a/λ B = 100, Fig.6.2 shows the phase diagrams that result from this po<strong>in</strong>t-Yukawamapp<strong>in</strong>g procedure <strong>in</strong> the (η, (κa) −1 ) representation, for the CSP model (black curves)with surface potentials (a) φ 0 = 1, (b) φ 0 = 2, (c) φ 0 = 3, (d) φ 0 = 5, <strong>and</strong> for thecorrespond<strong>in</strong>g AD model (red curves). The dashed l<strong>in</strong>es represent the phase boundaryfits of Eqs.(6.15) <strong>and</strong> (6.16) outside their strict λ-regime of applicability. We restrictattention to η < 0.3, as the po<strong>in</strong>t-Yukawa limit breaks down due to strong excludedvolumeeffects at higher pack<strong>in</strong>g fractions. An expected feature is the shift of the freez<strong>in</strong>gcurves to lower η for higher φ 0 , due to the higher (renormalized) charge <strong>and</strong> the strongerrepulsions at higher φ 0 . Due to the higher charges <strong>in</strong> the AD model, its crystallisationregimes (red curves) extend to somewhat lower η’s <strong>and</strong> longer screen<strong>in</strong>g lengths thanthose of the CSP model (black curves). However, the most strik<strong>in</strong>g feature of all thesephase diagrams is the huge extension of the fluid regime: at high <strong>and</strong> at low screen<strong>in</strong>glength there is no crystall<strong>in</strong>e phase at all (for η < 0.3), while at some <strong>in</strong>termediatesalt concentrations the crystal phases are s<strong>and</strong>wiched <strong>in</strong> between an ord<strong>in</strong>ary low-densityfluid <strong>and</strong> a re-entrant fluid phase. This re-entrant fluid regime becomes more prom<strong>in</strong>entwith <strong>in</strong>creas<strong>in</strong>g zeta-potential φ 0 . The underly<strong>in</strong>g physics of this f<strong>in</strong>ite-salt <strong>and</strong> f<strong>in</strong>ite-ηregime where bcc <strong>and</strong> fcc crystals exist is the discharg<strong>in</strong>g of the colloids with <strong>in</strong>creas<strong>in</strong>g η<strong>and</strong> decreas<strong>in</strong>g salt concentration: (i) although at high salt (small screen<strong>in</strong>g length) the<strong>colloidal</strong> charge is high, the screened-Coulomb <strong>in</strong>teraction is then so short-ranged thatthe system resembles a hard-sphere system that will only crystallize at η ≃ 0.5; (ii) at lowsalt (long screen<strong>in</strong>g length) the <strong>colloidal</strong> charge is too low to have seizable repulsions thatdrive crystallisation. Only at <strong>in</strong>termediate salt <strong>and</strong> <strong>in</strong>termediate <strong>colloidal</strong> pack<strong>in</strong>g thecharge is high enough <strong>and</strong> the screen<strong>in</strong>g sufficiently long-ranged to drive crystallisation.
Phase diagrams of <strong>colloidal</strong> spheres with a constant zeta-potential 83Figure 6.4: Maximum <strong>and</strong> m<strong>in</strong>imum effective screen<strong>in</strong>g lengths where bcc <strong>and</strong> fcc can be found,as a function of the surface potential, assum<strong>in</strong>g a constant surface potential for a/λ B = 100.The bcc regime is <strong>in</strong> between the two black l<strong>in</strong>es, <strong>and</strong> the fcc regime below the gray l<strong>in</strong>e. Thegray po<strong>in</strong>ts <strong>in</strong>dicate the results from the AD model.The dotted blue curves <strong>in</strong> Fig.6.2 represent the crossover pack<strong>in</strong>g fraction η ∗ of Eq.(6.7)beyond which the <strong>colloidal</strong> charge has been reduced to less than 50 percent of its dilutelimitvalue. Clearly, our expression for η ∗ <strong>in</strong>deed roughly co<strong>in</strong>cides with the onset of there-entrant fluid regime. Eq.(6.7) thus provides a quick guide to estimate where or whetherre-entrant melt<strong>in</strong>g is to be expected at all. Interest<strong>in</strong>gly, at φ 0 = 3, there are values for κa(albeit <strong>in</strong> a very narrow range) where a phase sequence fluid-bcc-fcc-bcc is predicted hereupon <strong>in</strong>creas<strong>in</strong>g the <strong>colloidal</strong> pack<strong>in</strong>g fraction, show<strong>in</strong>g a re-entrant bcc phase appear<strong>in</strong>gafter the fcc crystal. Moreover, for η > 0.5 one expects hard-sphere freez<strong>in</strong>g <strong>in</strong>to an fcc(or hcp) stack<strong>in</strong>g on the basis of hard-sphere <strong>in</strong>teractions, so the fcc phase is then alsore-entrant.Experimentally it is not always possible or convenient to characterise the screen<strong>in</strong>g <strong>in</strong>terms of the Debye length κ −1 of the (hypothetical) reservoir with which the suspensionwould be <strong>in</strong> osmotic equilibrium. For <strong>in</strong>stance, <strong>in</strong> conductivity measurements at f<strong>in</strong>itecolloid concentration one essentially measures the ionic strength of the sample, which isdirectly related to the effective screen<strong>in</strong>g constant ¯κ rather than κ. Also, any measurementof effective <strong>colloidal</strong> <strong>in</strong>teractions will yield ¯κ. Because of this accessibility of ¯κ, we replot<strong>in</strong> Fig.6.3 the phase diagrams for φ 0 = 2 <strong>and</strong> φ 0 = 5 of Fig.6.2, but now <strong>in</strong> the (η, (¯κa) −1 )representation. While the phase behavior <strong>in</strong> for example a sedimentation experiment willbe easier to compare to the phase diagrams shown <strong>in</strong> Fig. 6.2, the representation of Fig.6.3 could be useful <strong>in</strong> cases where no ion reservoir is present, while the effective screen<strong>in</strong>glength is known. Interest<strong>in</strong>gly, the CSP <strong>and</strong> AD model are much closer together <strong>in</strong> Fig.6.3 compared to Fig. 6.2, <strong>and</strong> the re-entrant fluid phase appears even more pronounced<strong>in</strong> this representation.In order to quantify <strong>in</strong> which f<strong>in</strong>ite salt-concentration regime bcc <strong>and</strong> fcc crystals areexpected <strong>in</strong> a <strong>colloidal</strong> concentration series 0 < η < 0.3, we analyse the maximum <strong>and</strong>
84 Chapter 6Figure 6.5: Phase diagrams <strong>in</strong> the pack<strong>in</strong>g fraction-screen<strong>in</strong>g length representation (η, (κa) −1 ),for constant-potential colloids with (a) φ 0 = 5 for a/λ B = 10 <strong>and</strong> (b) φ 0 = 1 <strong>and</strong> for a/λ B =1000. L<strong>in</strong>es <strong>and</strong> symbols as <strong>in</strong> Fig.6.2.m<strong>in</strong>imum values of ¯κa at which these two crystal phases can exist, as a function of thezeta-potential φ 0 , for a/λ B = 100. Fig. 6.4 shows the result<strong>in</strong>g screen<strong>in</strong>g-length regimes,both for bcc (black curves) <strong>and</strong> fcc (blue curve), where the lowest screen<strong>in</strong>g length forfcc crystals is set to zero because of the hard-sphere freez<strong>in</strong>g <strong>in</strong>to fcc at η = 0.5 evenfor 1/κa → 0 —of course we only restricted attention to η < 0.3 until now so strictlyspeak<strong>in</strong>g also the fcc phase should have had a nonvanish<strong>in</strong>g lower bound. Nevertheless,despite this small <strong>in</strong>consistency, Fig.6.4 clearly shows not only that a larger zeta-potentialgives rise to a larger crystal regime, but also that for all φ 0 there is a limit<strong>in</strong>g screen<strong>in</strong>glength beyond which neither fcc nor bcc crystals can exist, both for the CSP <strong>and</strong> the ADmodel.So far we focussed on a/λ B = 100, which <strong>in</strong> aqueous suspensions corresponds to a<strong>colloidal</strong> radius of about 70nm. However the <strong>colloidal</strong> size regime can easily be a factor10 larger or smaller, <strong>and</strong> for that reason we also consider the CSP model for a/λ B = 10<strong>and</strong> 1000. In Fig.6.5 we show the phase diagrams for the smaller colloids with φ 0 = 5<strong>in</strong> (a), <strong>and</strong> for larger colloids with φ 0 = 1 <strong>in</strong> (b). When compared to the larger colloids(a/λ B = 100), the phase diagram for the smaller colloids comes closest to the one shown<strong>in</strong> Fig.6.2(b) for φ 0 = 2, but the reentrant fluid has disappeared completely. Additionally,the smaller particles need a much higher potential to crystallize – the phase diagram fora/λ B = 10 at φ 0 = 1 does not show a crystal phase at all for η < 0.3. Similarly, the largercolloids require a much lower surface potential to resemble the phase diagram shown <strong>in</strong>Fig. 6.2(c). Additionally, the range of screen<strong>in</strong>g lengths where a reentrant fluid existsis much larger than for a/λ B = 100. Given that φ 0 = 5 is a rather high potential thatmay be difficult to achieve <strong>in</strong> reality while φ 0 = 1 is frequently occurr<strong>in</strong>g, one concludesthat re-entrant melt<strong>in</strong>g occurs <strong>in</strong> the largest salt-concentration regime <strong>and</strong> is hence easiestobservable by tun<strong>in</strong>g the salt, for larger colloids.
Phase diagrams of <strong>colloidal</strong> spheres with a constant zeta-potential 856.5 Summary <strong>and</strong> conclusionsWith<strong>in</strong> a spherical cell model we have calculated the bare charge Z, the renormalizedcharge Z ∗ , <strong>and</strong> the effective screen<strong>in</strong>g length ¯κ −1 of <strong>colloidal</strong> spheres at a constant zetapotentialφ 0 . We f<strong>in</strong>d from numerical solutions of the nonl<strong>in</strong>ear Poisson-Boltzmann equationthat these constant-potential colloids discharge with <strong>in</strong>creas<strong>in</strong>g pack<strong>in</strong>g fraction <strong>and</strong>ionic screen<strong>in</strong>g length, <strong>in</strong> fair agreement with analytical estimates for the dilute-limitcharge Z 0 <strong>in</strong> Eq.(6.6) <strong>and</strong> the typical crossover pack<strong>in</strong>g fraction η ∗ given <strong>in</strong> Eq.(6.7).We also show that the constant-potential assumption is a reasonably accurate descriptionof charge regulation by an ionic association-dissociation equilibrium on the <strong>colloidal</strong>surface. We use our nonl<strong>in</strong>ear calculations of Z ∗ <strong>and</strong> ¯κ to determ<strong>in</strong>e the effective screened-Coulomb <strong>in</strong>teractions between the colloids at a given state po<strong>in</strong>t, <strong>and</strong> we calculate thephase diagram for various zeta-potentials by a mapp<strong>in</strong>g onto empirical fits of simulatedphase diagrams of po<strong>in</strong>t-Yukawa fluids. This reveals a very limited regime of bcc <strong>and</strong> fcccrystals: <strong>in</strong> order to form crystals, the charge is only high enough <strong>and</strong> the repulsions onlylong-ranged enough <strong>in</strong> a f<strong>in</strong>ite <strong>in</strong>termediate regime of pack<strong>in</strong>g fraction <strong>and</strong> salt concentrations;at high η or low salt the spheres discharge too much, <strong>and</strong> at high salt the repulsionsare too short-ranged to stabilise crystals. In the salt-regime where crystals can exist, thedischarg<strong>in</strong>g mechanism gives rise to re-entrant phase behaviour, with phase sequencesfluid-bcc-fluid <strong>and</strong> even fluid-bcc-fcc-bcc (although <strong>in</strong> an extremely small regime) upon<strong>in</strong>creas<strong>in</strong>g the colloid concentration from extremely dilute to η = 0.3.The phase behaviour of constant-potential or charge-regulated colloids as reported hereis quite different from that of constant-charge colloids, for which the pairwise repulsionsdo not weaken with <strong>in</strong>creas<strong>in</strong>g volume fraction or decreas<strong>in</strong>g salt concentration. As aconsequence constant-charge colloids have a much larger parameter-regime where crystalsexist, <strong>and</strong> do not show the re-entrant behaviour. [101–104] The most direct comparisonis to be made with the constant-charge phase diagrams of Fig.2 <strong>and</strong> Fig.4 of Ref.[104],where the charge is fixed such that the surface potential at <strong>in</strong>f<strong>in</strong>ite dilution correspondsto φ 0 ≃ 1 <strong>and</strong> 2, respectively. Our theoretical f<strong>in</strong>d<strong>in</strong>gs can thus be used to ga<strong>in</strong> <strong>in</strong>sight<strong>in</strong>to the <strong>colloidal</strong> charg<strong>in</strong>g mechanism by study<strong>in</strong>g <strong>colloidal</strong> crystallisation regimes as afunction of pack<strong>in</strong>g fraction <strong>and</strong> salt concentration.6.6 AcknowledgementsI would like to thank René van Roij for his theoretical work on the cell model discussed<strong>in</strong> this chapter, <strong>and</strong> for many fruitful discussions <strong>and</strong> suggestions. I would also like tothank Niels Boon for perform<strong>in</strong>g the calculations on the association-dissociation model.AppendixAlthough it is numerically straightforward to solve the nonl<strong>in</strong>ear PB equation (6.2) withBC’s (6.3) <strong>and</strong> (6.4) <strong>in</strong> a spherical Wigner-Seitz cell of radius R, it may also be convenientto have analytic results that allow for quick estimates of the (order of) magnitude of the<strong>colloidal</strong> charge Z. A st<strong>and</strong>ard approach is to l<strong>in</strong>earise the s<strong>in</strong>h φ(r) term of Eq.(6.2),
86 Chapter 6e.g. with φ(r) − φ(R) as the small expansion parameter. The result<strong>in</strong>g solution is thenof the form φ(r) = A exp(−¯κr)/r + B exp(¯κr)/r + C, with ¯κ def<strong>in</strong>ed <strong>in</strong> Eq.(6.11), C =φ(R) − tanh φ(R), <strong>and</strong> with <strong>in</strong>tegration constants A <strong>and</strong> B fixed by the two BC’s. Thealgebra <strong>in</strong>volved is, however, not very transparent.A considerable simplification is achieved if we consider the so-called Jellium model,<strong>in</strong> which the central <strong>colloidal</strong> sphere is no longer considered to be surrounded by onlycations <strong>and</strong> anions <strong>in</strong> a f<strong>in</strong>ite cell, but <strong>in</strong>stead by cations, anions <strong>and</strong> other colloids withcharge Z (to be determ<strong>in</strong>ed). [123–125] A nonl<strong>in</strong>ear PB equation <strong>and</strong> BC’s can then bewritten, for r ≥ a,φ ′′ (r) + 2 r φ′ (r) = κ 2 s<strong>in</strong>h φ(r) − 4πλ B Zn; (6.17)φ(a) = φ 0 ; (6.18)φ ′ (∞) = 0, (6.19)where it is assumed that the ’other’ colloids are distributed homogeneously with densityn. From this one derives directly that the asymptotic potential is given bys<strong>in</strong>h φ(∞) = 4πλ BZnκ 2= 3η(Zλ B/a)(κa) 2 . (6.20)Now l<strong>in</strong>earis<strong>in</strong>g s<strong>in</strong>h φ(r) with φ(r) − φ(∞) as the small expansion parameter gives riseto the solutionφ(r) = φ(∞) + (φ 0 − φ(∞)) exp ( − ˜κ(r − a) ), (6.21)r/awhere the effective screen<strong>in</strong>g length ˜κ −1 is def<strong>in</strong>ed by√˜κ = κ cosh φ(∞). (6.22)We note that the average ion concentrations <strong>in</strong> the system, with<strong>in</strong> the present l<strong>in</strong>earisationscheme, is given by c ± = ρ s exp(∓φ(∞)), such that the correspond<strong>in</strong>g screen<strong>in</strong>g length˜κ −1 is given by ˜κ 2 = 4πλ B (c + + c − ). In other words, the effective screen<strong>in</strong>g length ˜κ <strong>and</strong>the asymptotic potential φ(∞) of this jellium model play exactly the same role as ¯κ <strong>and</strong>φ(R) that we <strong>in</strong>troduced before <strong>in</strong> the spherical cell. In particular, ¯κ −1 <strong>and</strong> ˜κ −1 can beseen as the actual screen<strong>in</strong>g length <strong>in</strong> the suspension (<strong>in</strong> contrast to the screen<strong>in</strong>g lengthκ −1 of the ion reservoir).From Eq.(6.21) the <strong>colloidal</strong> charge Z follows, us<strong>in</strong>g Eq.(6.5), as the solution of thetranscendental equationZλ B= (φ 0 − φ(∞))(1 + ¯κa), (6.23)awhere one should realise that both φ(∞) <strong>and</strong> ˜κ depend on Zλ B /a through Eqs.(6.20) <strong>and</strong>(6.22). It is possible to solve Eq.(6.23) explicitly <strong>in</strong> the dilute limit. For η = 0 one f<strong>in</strong>dsφ(∞) = 0 from Eq.(6.20), <strong>and</strong> hence Z = Z 0 given by Eq.(6.6). For f<strong>in</strong>ite but low-enoughη for which φ(∞) ≪ 1 one can ignore O(η 2 ) contributions, such that s<strong>in</strong>h φ(∞) ≃ φ(∞)<strong>and</strong> cosh φ(∞) ≃ 1, to f<strong>in</strong>d Eq.(6.7) from the <strong>self</strong>-consistency condition Eq.(6.23).
7Crystal nucleation <strong>in</strong> b<strong>in</strong>aryhard-sphere mixtures: The effect ofthe order parameter on the clustercompositionWe study crystal nucleation <strong>in</strong> a b<strong>in</strong>ary mixture of hard spheres <strong>and</strong> <strong>in</strong>vestigate thecomposition <strong>and</strong> size of the (non)critical clusters us<strong>in</strong>g Monte Carlo simulations. Inorder to study nucleation of a crystal phase <strong>in</strong> computer simulations, a one-dimensionalorder parameter is usually def<strong>in</strong>ed to identify the solid phase from the supersaturated fluidphase. We show that the choice of order parameter can strongly <strong>in</strong>fluence the compositionof noncritical clusters due to the projection of the Gibbs free-energy l<strong>and</strong>scape <strong>in</strong> the twodimensionalcomposition plane onto a one-dimensional order parameter. On the otherh<strong>and</strong>, the critical cluster is <strong>in</strong>dependent of the choice of the order parameter, due to thegeometrical properties of the saddle po<strong>in</strong>t <strong>in</strong> the free-energy l<strong>and</strong>scape, which is <strong>in</strong>variantunder coord<strong>in</strong>ate transformation. We <strong>in</strong>vestigate the effect of the order parameter on thecluster composition for nucleation of a substitutional solid solution <strong>in</strong> a simple toy model ofidentical hard spheres but tagged with different colors <strong>and</strong> for nucleation of an <strong>in</strong>terstitialsolid solution <strong>in</strong> a b<strong>in</strong>ary hard-sphere mixture with a diameter ratio q = 0.3. In bothcases, we f<strong>in</strong>d that the composition of noncritical clusters depends on the order parameterchoice, but are well expla<strong>in</strong>ed by the predictions from classical nucleation theory. Moreimportantly, we f<strong>in</strong>d that the properties of the critical cluster do not depend on the orderparameter choice.
88 Chapter 77.1 IntroductionThe process of nucleation <strong>in</strong> <strong>colloidal</strong> <strong>systems</strong> has attracted significant attention <strong>in</strong> recentyears, both <strong>in</strong> experimental <strong>and</strong> simulation studies. The framework with which phenomenalike these have been described traditionally is classical nucleation theory (CNT),which is based on the notion that a thermal fluctuation spontaneously generates a smalldroplet of the thermodynamically stable phase <strong>in</strong>to the bulk of the metastable phase. InCNT as developed by Volmer [139], Becker [140], <strong>and</strong> Zeldovich [141], the free energy offormation of small nuclei of the new phase <strong>in</strong> the parent phase is described by us<strong>in</strong>g the“capillary approximation”, i.e., the free energy to form a cluster of the new phase relativeto the homogeneous metastable phase is described by their difference <strong>in</strong> bulk free energy<strong>and</strong> a surface free-energy term that is given by that of a planar <strong>in</strong>terface between the twocoexist<strong>in</strong>g phases at the same temperature. Thus the droplet is assumed to be separatedfrom the metastable bulk by a sharp step-like <strong>in</strong>terface <strong>in</strong> CNT. The bulk free-energyterm is proportional to the volume of the droplet <strong>and</strong> represents the driv<strong>in</strong>g force to formthe new phase, while the surface free-energy cost to create an <strong>in</strong>terface is proportional tothe surface area of the cluster. Hence, small droplets with a large surface-to-volume ratiohave a large probability to dissolve, while droplets that exceed a critical size <strong>and</strong> crossthe free-energy barrier, can grow further to form the new stable bulk phase.CNT has successfully expla<strong>in</strong>ed simulation results for the nucleation of sphericalparticles, such as the fluid-solid <strong>and</strong> gas-liquid nucleation <strong>in</strong> Lennard-Jones <strong>systems</strong>[87, 142, 143] <strong>and</strong> crystal nucleation of hard spheres [144, 145]. A modified CNT has beenused to expla<strong>in</strong> the nucleation of anisotropic clusters of the nematic or solid phase (alsocalled tactoids) from a supersaturated isotropic phase of <strong>colloidal</strong> hard rods [146–148] <strong>and</strong>the nucleation of 2D assemblies of attractive rods [149, 150]. This state of affairs shouldbe contrasted with the case of b<strong>in</strong>ary nucleation for which various nucleation theorieshave been developed that differ substantially <strong>in</strong> the way they describe the composition ofthe cluster [151–153]. For <strong>in</strong>stance, Reiss assumed the surface tension to be <strong>in</strong>dependentof composition [151], while Doyle extended CNT by tak<strong>in</strong>g <strong>in</strong>to account a surface tensionthat depends on the cluster composition [154]. However, more than 20 years later, it wasshown by Renn<strong>in</strong>ger [155], Wilemski [156, 157], <strong>and</strong> Reiss [158] that Doyle’s derivationleads to thermodynamic <strong>in</strong>consistencies. A revised thermodynamically consistent classicalb<strong>in</strong>ary nucleation theory was developed by Wilemski <strong>in</strong> which the composition of thesurface layer <strong>and</strong> the <strong>in</strong>terior of the cluster could vary <strong>in</strong>dependently [156, 157]. However,<strong>in</strong> the case of strong surface enrichment effects, this approach can lead to unphysicalnegative particle numbers <strong>in</strong> the critical clusters [159, 160]. In addition, it was shown <strong>in</strong>Ref. [161] that the derivation by Wilemski starts off with the wrong equations, but theresult<strong>in</strong>g equations are correct. Moreover, b<strong>in</strong>ary nucleation can be accompanied withhuge fractionation effects, i.e., the compositions of the metastable phase <strong>and</strong> of the phaseto be nucleated can differ enormously from the compositions of the two coexist<strong>in</strong>g bulkphases. It is therefore unclear i) how to determ<strong>in</strong>e the surface free-energy term for a cluster,which is <strong>in</strong> quasi-equilibrium with a metastable parent phase with a composition thatis very different from those of the two coexist<strong>in</strong>g bulk phases, ii) whether the <strong>in</strong>terfacialtension depends on composition, curvature, <strong>and</strong> surface enrichment effects, <strong>and</strong> f<strong>in</strong>allyiii) whether or not one can use the capillary approximation <strong>in</strong> the first place to describe
Crystal nucleation <strong>in</strong> b<strong>in</strong>ary hard-sphere mixtures: The effect of theorder parameter on the cluster composition 89b<strong>in</strong>ary nucleation <strong>in</strong> <strong>systems</strong> where fractionation <strong>and</strong> surface activity of the species areimportant. To summarize, there is no straightforward generalization to multicomponent<strong>systems</strong> of classical nucleation theory that is thermodynamically consistent, does not leadto unphysical effects, <strong>and</strong> can be applied to small nuclei [153, 162].Numerical studies may shed light on this issue, as the nucleation barrier can be determ<strong>in</strong>eddirectly <strong>in</strong> computer simulations us<strong>in</strong>g the umbrella sampl<strong>in</strong>g technique [163, 164].In this method, an order parameter is chosen <strong>and</strong> configuration averages for sequential valuesof the order parameter are taken. While this makes it possible to measure propertiesof clusters with specific values for the order parameter, it should be noted that the resultscan depend on the choice of order parameter. In this chapter, we <strong>in</strong>vestigate whetherthe size <strong>and</strong> composition of (non)critical clusters can be affected by the order parameterchoice employed <strong>in</strong> simulation studies of multicomponent nucleation. For simplicity, wefocus here on crystal nucleation <strong>in</strong> b<strong>in</strong>ary hard-sphere mixtures, where surface activityof the species can be neglected, <strong>and</strong> we assume the surface tension to be composition<strong>in</strong>dependent. The chapter is organized as follows. In Sec. 7.2, we describe the generalnucleation theorem as derived by Oxtoby <strong>and</strong> Kashchiev [153], which does not rely on thecapillary approximation <strong>and</strong> can even be employed to describe small clusters. Start<strong>in</strong>gfrom the multicomponent nucleation theorem, it is straightforward to reproduce the usualCNT for b<strong>in</strong>ary nucleation, which is the focus <strong>in</strong> the rema<strong>in</strong>der of the chapter. In Sec.7.3 <strong>and</strong> 7.4, we def<strong>in</strong>e the (L<strong>and</strong>au) free energy as a function of an order parameter, <strong>and</strong>we describe the order parameter that is employed to study crystal nucleation. Additionally,we discuss the effect of order parameter choice on the nucleation barrier <strong>in</strong> moredetail. We present results for b<strong>in</strong>ary nucleation for a simple toy model of hard spheres <strong>in</strong>Sec. 7.5, <strong>and</strong> subsequently, we study the nucleation of an <strong>in</strong>terstitial solid solution <strong>in</strong> anasymmetric b<strong>in</strong>ary hard-sphere mixture <strong>in</strong> Sec. 7.6.7.2 Classical nucleation theory for multi-component<strong>systems</strong>We study the formation of a multicomponent spherical cluster of the new phase <strong>in</strong> asupersaturated homogeneous bulk phase α consist<strong>in</strong>g of species i = 1, 2, . . . . We note thatthe thermodynamic variables correspond<strong>in</strong>g to the metastable phase α are denoted by thesubscript α, whereas those correspond<strong>in</strong>g to the new phase do not carry an extra subscriptto lighten the notation. We first consider a homogeneous bulk phase α characterized byan entropy S o α, volume V o α , <strong>and</strong> particle numbers N o i,α Note that the superscripts denotethe orig<strong>in</strong>al bulk phase. The <strong>in</strong>ternal energy U o α of the orig<strong>in</strong>al bulk phase readsU o α = T o S o α − P o αV o α + ∑ µ o i,αN o i,α (7.1)with T o the temperature, P o α the bulk pressure, µ o i,α the bulk chemical potential of speciesi, <strong>and</strong> the summation runs over all species.Follow<strong>in</strong>g the derivation <strong>in</strong> Refs. [153, 162], we now consider a spherical cluster of thenew phase with a volume V separated from the orig<strong>in</strong>al phase by an arbitrarily chosenGibbs divid<strong>in</strong>g surface. The volume of the <strong>in</strong>terface is set to zero, <strong>and</strong> the particle numberof species i <strong>in</strong> the cluster is given by N i + N i,s , where N i is the number of particles of
90 Chapter 7species i <strong>in</strong> a volume V which is homogeneous <strong>in</strong> the new bulk phase, <strong>and</strong> N i,s is thesurface excess number of particles of species i that corrects for the difference between astep-like <strong>in</strong>terfacial density profile <strong>and</strong> the actual one. The surface excess number N i,sdepends on the choice of divid<strong>in</strong>g surface. The <strong>in</strong>ternal energy U of the result<strong>in</strong>g systemis then given byU = T S α + T S − P α V α − P V + Ψ + ∑ µ i,α N i,α +∑µi N i + ∑ µ i,s N i,s , (7.2)where P <strong>and</strong> S denote the bulk pressure <strong>and</strong> entropy of the nucleated phase, <strong>and</strong> µ i <strong>and</strong>µ i,s are the chemical potentials of species i <strong>in</strong> the new phase <strong>and</strong> the surface phase, Tis the temperature of the system with the cluster, <strong>and</strong> Ψ = Ψ({N i }, {N i,s }, V ) is thetotal surface energy of the spherical cluster. As the volume of the surface layer is zero,the correspond<strong>in</strong>g pressure is not def<strong>in</strong>ed. Note that we did not <strong>in</strong>clude the entropyassociated with choos<strong>in</strong>g the location of the cluster <strong>in</strong> the system. In other words, thecluster is placed at a specific location.The difference <strong>in</strong> the appropriate thermodynamic potential as a function of cluster sizedepends on the quantities that are kept fixed dur<strong>in</strong>g the nucleation process. If the nucleusis formed at constant temperature <strong>and</strong> constant total number of particles of each species i,<strong>and</strong> if we keep the pressure of the orig<strong>in</strong>al phase fixed, then T = T o , N i,α +N i +N i,s = Ni,α,o<strong>and</strong> Pα o = P α . The correspond<strong>in</strong>g Gibbs free energy of the <strong>in</strong>itial system G o α <strong>and</strong> that ofthe f<strong>in</strong>al system G are then given by the Legendre transformationG o α = Uα o − T o Sα o + PαV o α o = ∑ µ o i,αNi,αoG = U − T S + Pα(V o α + V )= (P o α − P)V + Ψ + ∑ µ i,α N i,α + ∑ µ i N i+ ∑ µ i,s N i,s . (7.3)If we now assume that the composition of the metastable phase α rema<strong>in</strong>s unchanged <strong>and</strong>we consider the Maxwell relation( )( )∂Vα∂µi,α= v i,α =(7.4)∂N i,α ∂P αT,P α,{N j≠i,α }T,{N i,α }with v i,α the partial particle volumes of species i <strong>in</strong> phase α, we f<strong>in</strong>d that at constantpressure, the chemical potential for each species i rema<strong>in</strong>s constant µ o i,α = µ i,α . Subsequently,we obta<strong>in</strong> for the change <strong>in</strong> Gibbs free energy ∆G = G − G o α when a nucleus isformed <strong>in</strong> the bulk of the orig<strong>in</strong>al phase:∆G = (P o α − P)V + Ψ + ∑ (µ i (P) − µ o i,α(P o α))N i +∑(µi,s − µ o i,α(P o α))N i,s . (7.5)Consequently, the Gibbs free energy ∆G of a grow<strong>in</strong>g cluster depends on the numberof particles N i <strong>and</strong> N i,s <strong>in</strong> the cluster <strong>and</strong> the surface energy of the cluster. Hence, onecan def<strong>in</strong>e a free-energy surface <strong>in</strong> the multi-dimensional composition plane with a saddle
Crystal nucleation <strong>in</strong> b<strong>in</strong>ary hard-sphere mixtures: The effect of theorder parameter on the cluster composition 91po<strong>in</strong>t that corresponds to the critical nucleus [151]. The conditions for the critical clusterread( ) ∂∆G= 0,∂N i V,{N j≠i },{N i,s }( ) ∂∆G= 0, (7.6)∂N i,s V,{N i },{N j≠i,s }( ) ∂∆G= 0.∂V{N i },{N i,s }To recover the chemical <strong>and</strong> mechanical equilibrium conditions, we use the aboveconditions as well as the Gibbs-Duhem equation <strong>and</strong> the Gibbs adsorption equation. TheGibbs-Duhem equation at constant temperature for the nucleated bulk phase is− V dP + ∑ N i dµ i = 0, (7.7)<strong>and</strong> the Gibbs adsorption equation for the surface at constant temperature isAdγ + ∑ N i,s dµ i,s = 0, (7.8)where we have employed Ψ = γA. Note that γ denotes the surface free energy per unitarea <strong>and</strong> A is the surface area of the cluster. The result<strong>in</strong>g equilibrium conditions for allparticle species i <strong>in</strong> the critical cluster, the surface, <strong>and</strong> the metastable parent phase arethen given byµ ∗ i (P ∗ ) = µ ∗ i,s = µ o i,α(P o α), (7.9)<strong>and</strong> for the pressure difference <strong>in</strong>side <strong>and</strong> outside the droplet we f<strong>in</strong>dP ∗ − P o α = ∂γ∗ A ∗∂V ∗ , (7.10)where ∗ denotes quantities associated with a system where a critical cluster is present.Hence, the composition of the critical cluster can be determ<strong>in</strong>ed from these saddle po<strong>in</strong>tconditions.In order to obta<strong>in</strong> the usual classical nucleation theory for multicomponent <strong>systems</strong>,we assume a spherical droplet with radius R. Note that the surface area is then A = 4πR 2 .In addition, we use the fact that the volume of a spherical droplet can be expressed <strong>in</strong>terms of the partial particle volumes v i of species i:V = 4 3 πR3 = ∑ N i v i . (7.11)Comb<strong>in</strong><strong>in</strong>g this with Eq. (7.10), we arrive at the generalised Laplace equation:P ∗ − P o α = 2γ∗R ∗+ [ ∂γ∗∂R ∗ ], (7.12)
92 Chapter 7where the square brackets denote a derivative associated with the displacement of thedivid<strong>in</strong>g surface. One can now choose the divid<strong>in</strong>g surface so that[ ∂γ∗∂R ∗ ]= 0, (7.13)<strong>and</strong> hence one recovers the usual Laplace equation. This choice for the divid<strong>in</strong>g surface,correspond<strong>in</strong>g to a specific value for R ∗ <strong>and</strong> γ ∗ , is called the surface of tension. In addition,if we use the Gibbs adsorption isotherm (7.8) <strong>and</strong> the Maxwell relation (7.4) for the bulkphase of the nucleated cluster, we f<strong>in</strong>d for the critical clusterdµ ∗ i,s = dµ ∗ i = v i dP (7.14)<strong>and</strong> []A ∂γ∗ = − ∑ [ ] ∂P∗N∂R ∗ i,s v i = 0, (7.15)∂R ∗which is the condition for a curvature <strong>in</strong>dependent surface tension. S<strong>in</strong>ce ∂P ∗ /∂R ∗ ≠ 0,Eq. (7.15) implies that the divid<strong>in</strong>g surface has to be chosen such that∑Ni,s v i = 0, (7.16)which is called the equimolar surface, as for one-component <strong>systems</strong> N i,s = 0, i.e. thenumber of particles <strong>in</strong> the cluster equals the number of particles <strong>in</strong> a uniform bulk phasewith the same volume. It is generally not possible <strong>in</strong> a multicomponent system to choosethe divid<strong>in</strong>g surface such that N i,s = 0 for all species. Thus, as v i is usually positive,N i,s < 0 for at least one of the species. This may lead to (unphysical) negative particlenumbers when N i + N i,s < 0 as noted <strong>in</strong> Refs. [159, 160]. However, as will be discussed<strong>in</strong> sections 7.5 <strong>and</strong> 7.6, there are cases <strong>in</strong> which the assumption N i,s = 0 for all i is valid.If the nucleated phase is assumed to be <strong>in</strong>compressible, one can <strong>in</strong>tegrate the Gibbs-Duhem equation (7.7) at constant temperature to arrive at<strong>and</strong> us<strong>in</strong>g Eq. (7.5), we f<strong>in</strong>dV(P o α − P) = ∑ (µ i (P o α) − µ i (P))N i , (7.17)∆G = γA + ∑ (µ i (P o α) − µ o i,α(P o α))N i +∑(µi,s − µ o i,α(P o α))N i,s . (7.18)Aga<strong>in</strong> us<strong>in</strong>g the Gibbs-Duhem equation at constant temperature <strong>and</strong> pressure <strong>and</strong> theGibbs adsorption isotherm, <strong>and</strong> m<strong>in</strong>imiz<strong>in</strong>g the free energy with respect to N i at fixed{N i,s }, we recover the Gibbs-Thomson (also called Kelv<strong>in</strong>) equations for multi-componentspherical critical clusters∆µ ∗ i = − 2γ∗ v iR ∗ , (7.19)
Crystal nucleation <strong>in</strong> b<strong>in</strong>ary hard-sphere mixtures: The effect of theorder parameter on the cluster composition 93where ∆µ ∗ i = µ ∗ i (Pα) o − µ o i,α(Pα). o The radius of the critical cluster R ∗ <strong>and</strong> the barrierheight ∆G ∗ readR ∗ = 2γ∗ v i|∆µ ∗ i |∆G ∗ = 4πR∗2 γ ∗3(7.20)= 16πγ∗33(∆µ ∗ i /v i ) 2 . (7.21)Us<strong>in</strong>g Eq. (7.20) or the Maxwell relation (7.4), one can show:v i ∆µ i = v j ∆µ j , (7.22)<strong>and</strong> the radius of the critical cluster R ∗ can be expressed <strong>in</strong> terms of the bulk compositionx i = N i / ∑ N i of the critical cluster <strong>and</strong> v = V/ ∑ N i :R ∗ =2γ∗ v∑xi |∆µ ∗ i | . (7.23)In order to study multi-component nucleation, MC simulations are often performed<strong>in</strong> the isobaric-isothermal ensemble, <strong>in</strong> which the number of particles N o 1,α <strong>and</strong> N o 2,α, thepressure of the orig<strong>in</strong>al bulk phase P o α, <strong>and</strong> the temperature T are kept fixed. One ofthe assumptions of classical nucleation theory is that the composition of the metastablebulk phase rema<strong>in</strong>s constant, while nucleat<strong>in</strong>g the new phase, see Eq. (7.4). In simulationsthis can only be achieved if the system is sufficiently large, i.e., the volume of themetastable bulk phase is much larger than that of the nucleat<strong>in</strong>g cluster. Especially, forb<strong>in</strong>ary (multicomponent) nucleation, where the composition of the stable phase is verydifferent from that of the metastable phase, this can lead to a huge depletion of one ofthe components <strong>in</strong> the metastable fluid phase, <strong>and</strong> therefore a change <strong>in</strong> composition.In order to circumvent this problem, simulation studies on b<strong>in</strong>ary nucleation are oftencarried out <strong>in</strong> the semi-gr<strong>and</strong> canonical ensemble [165, 166], i.e. the total number of particlesN o α = ∑ N o i,α, the chemical potential difference ∆µ o 12,α = µ o 2,α −µ o 1,α between the twospecies, the pressure P o α, <strong>and</strong> the temperature T are kept fixed of the orig<strong>in</strong>al bulk phase.The correspond<strong>in</strong>g thermodynamic potential is obta<strong>in</strong>ed by a Legendre transformationY (N, ∆µ 12 , P, T ) = G(N, N 2 , P, T ) − N 2 ∆µ 12 (7.24)Comb<strong>in</strong><strong>in</strong>g Eq. (7.3) with the conditions that the total number of particles are fixedN1,α o + N2,α o = N 1 + N 2 + N 1,α + N 2,α , the chemical potential difference <strong>in</strong> the metastablephase is kept fixed ∆µ o 12,α = ∆µ 12,α , constant pressure of the metastable phase Pα o =P α <strong>and</strong> constant temperature T = T o , we f<strong>in</strong>d for the correspond<strong>in</strong>g thermodynamicpotentialsY o α = G o α − N o 2,α∆µ o 12,α = µ o 1,α(N o 1,α + N o 2,α)Y = G − (N 2,α + N 2 )∆µ 12,α= (Pα o − P)V + Φ + µ 1,α (N 1,α + N 2,α ) +µ 1 (N 1 + N 2 ) − ∆µ 12 N 2 − ∆µ 12,α N 2 , (7.25)
94 Chapter 7where we have set the surface excess numbers N i,s to zero. Us<strong>in</strong>g the Maxwell equation( ) ∂µ1∂PN,∆µ 12 ,T=( ) ∂V∂N∆µ 12 ,P,T= v, (7.26)we f<strong>in</strong>d that due to constant pressure, the chemical potential of species 1 rema<strong>in</strong>s unchangedµ o 1,α = µ 1,α . Hence, we f<strong>in</strong>d that the change <strong>in</strong> free energy due to the formationof a nucleus ∆Y = Y − Y o α equals ∆G as given <strong>in</strong> Eq. (7.5) <strong>and</strong> the nucleation barrier canbe calculated <strong>in</strong> the semi-gr<strong>and</strong> canonical ensemble. Similarly, one can show that <strong>in</strong> anystatistical ensemble (gr<strong>and</strong> canonical, canonical, etc. ), the change <strong>in</strong> the correspond<strong>in</strong>gthermodynamic potential as a function of cluster size is always the same, provided thatthe metastable parent phase is sufficiently large. A similar result was also obta<strong>in</strong>ed by Oxtobyet al., who showed that the nucleation free-energy barriers <strong>in</strong> the isobaric-isothermal<strong>and</strong> gr<strong>and</strong> canonical ensemble are identical, i.e., ∆G = ∆Ω for a one-component system[167].7.3 Free-energy barrierWhile nucleation is an <strong>in</strong>herently non-equilibrium process, the assumption of local equilibriumis often made to describe the behavior of the system dur<strong>in</strong>g the nucleation process.In essence, this assumption states that the nucleus is <strong>in</strong> quasi-equilibrium with the parentphase for every cluster size. This is approximately true if the time required to reachan equilibrium distribution of clusters is short compared to the time needed to nucleate.After the system crosses the free-energy barrier, the cluster of the new phase grows toorapidly for this assumption to be accurate, but dur<strong>in</strong>g the nucleation process it<strong>self</strong>, localequilibrium has proven to be a useful assumption.In order to compute the free-energy barrier that separates the metastable phase fromthe stable phase, an order parameter Φ (or reaction coord<strong>in</strong>ate) should be def<strong>in</strong>ed thatquantifies how much the system has transformed to the new phase. A common orderparameter that is employed <strong>in</strong> nucleation studies is the size of the largest cluster <strong>in</strong> thesystem as def<strong>in</strong>ed by a certa<strong>in</strong> cluster criterion. In this chapter, we restrict ourselves tob<strong>in</strong>ary nucleation. From Eq. (7.18), we f<strong>in</strong>d that the Gibbs free energy ∆G of a grow<strong>in</strong>gb<strong>in</strong>ary cluster depends on the number of particles of species 1 <strong>and</strong> 2 <strong>in</strong> the cluster, <strong>and</strong>hence, one can def<strong>in</strong>e a free-energy surface <strong>in</strong> the (N 1 , N 2 )-plane with a saddle po<strong>in</strong>t thatcorresponds to the critical nucleus [151]. By project<strong>in</strong>g the phase space of the systemonto the (usually) one-dimensional order parameter, one can def<strong>in</strong>e the (L<strong>and</strong>au) Gibbsfree energy ∆G(Φ) as a function of this order parameter Φβ∆G(Φ) = G c − ln P (Φ), (7.27)where β = 1/k B T , k B Boltzmann’s constant, T the temperature, G c is a normalizationconstant generally taken to correspond to the free energy of the homogeneous metastablephase, <strong>and</strong> P (Φ) is the probability of observ<strong>in</strong>g an order parameter of value Φ. In asystem of N particles, at fixed pressure P , <strong>and</strong> constant temperature T , the probability
Crystal nucleation <strong>in</strong> b<strong>in</strong>ary hard-sphere mixtures: The effect of theorder parameter on the cluster composition 95P (Φ) is given by:P (Φ) =∫ dV∫ dr N exp[−β(U(r N ) + P V )]δ(Φ − Φ(r N ))∫ dV∫ drN exp[−β(U(r N ) + P V )](7.28)with V the volume of the system, U the potential energy, <strong>and</strong> δ the Kronecker deltafunction. The order parameter function Φ(r N ) is a function that assigns to each configurationr N of the system a value for the order parameter. The probability distributionP (Φ) can be obta<strong>in</strong>ed from Monte Carlo (MC) simulations via the umbrella sampl<strong>in</strong>gtechnique [163, 164]. In this method, an additional external potential U bias is added tothe system to bias the sampl<strong>in</strong>g towards configurations correspond<strong>in</strong>g to a certa<strong>in</strong> w<strong>in</strong>dowof order parameter values centered around Φ o . By <strong>in</strong>creas<strong>in</strong>g Φ o sequentially, the entirefree-energy barrier as a function of Φ can be sampled. The typical bias<strong>in</strong>g potential used<strong>in</strong> umbrella sampl<strong>in</strong>g simulations is given by:βU bias (r N ) = k(Φ(r N ) − Φ o ) 2 , (7.29)where the constants k <strong>and</strong> Φ o determ<strong>in</strong>e the width <strong>and</strong> location of the w<strong>in</strong>dow, <strong>and</strong> r Nare the positions of all N particles <strong>in</strong> the simulation.7.4 Order parameterIn order to follow a phase transformation, a cluster criterion is required that is able toidentify the new phase from the supersaturated phase. In this chapter, we focus on theformation of a solid cluster <strong>in</strong> a supersaturated fluid phase. In order to study crystalnucleation, the local bond-order parameter is used to differentiate between liquid-like <strong>and</strong>solid-like particles <strong>and</strong> a cluster algorithm is employed to identify the solid clusters [87].In the calculation of the local bond order parameter a list of “neighbours” is determ<strong>in</strong>edfor each particle. The neighbours of particle i <strong>in</strong>clude all particles with<strong>in</strong> a radial distancer c of particle i, <strong>and</strong> the total number of neighbours is denoted N b (i). A bond orientationalorder parameter q l,m (i) for each particle is then def<strong>in</strong>ed asq l,m (i) = 1 N b (i)∑Y l,m (θ i,j , φ i,j ), (7.30)N b (i)j=1where Y l,m (θ, φ) are the spherical harmonics, m ∈ [−l, l] <strong>and</strong> θ i,j <strong>and</strong> φ i,j are the polar <strong>and</strong>azimuthal angles of the center-of-mass distance vector r ij = r j − r i with r i the positionvector of particle i. Solid-like particles are identified as particles for which the number ofconnections per particle ξ(i) is at least ξ c <strong>and</strong> whereξ(i) =N b (i)∑j=1H(d l (i, j) − d c ), (7.31)
96 Chapter 7H is the Heaviside step function, d c is the dot-product cutoff, <strong>and</strong>d l (i, j) =⎛⎝l∑m=−ll∑m=−l|q l,m (i)| 2 ⎞q l,m (i)q ∗ l,m(j)⎠1/2 ⎛ ⎝l∑m=−l⎞ . (7.32)1/2|q l,m (j)| 2 ⎠A cluster conta<strong>in</strong>s all solid-like particles which have a solid-like neighbour <strong>in</strong> the samecluster. Thus each particle can be a member of only one cluster.The parameters conta<strong>in</strong>ed <strong>in</strong> this algorithm <strong>in</strong>clude the neighbour cutoff r c , the dotproductcutoff d c , the critical value for the number of solid-like neighbours ξ c , <strong>and</strong> thesymmetry <strong>in</strong>dex for the bond orientational order parameter l. The hard-sphere crystalsconsidered here are expected to have r<strong>and</strong>om hexagonal order, thus the symmetry <strong>in</strong>dexis chosen to be 6 <strong>in</strong> the present study.This choice of order parameter Φ, def<strong>in</strong>ed as the number of solid-like particles <strong>in</strong>the largest crystall<strong>in</strong>e cluster, has been used to study crystal nucleation <strong>in</strong> various onecomponent<strong>systems</strong>, e.g., Lennard-Jones <strong>systems</strong> [87], hard-sphere <strong>systems</strong> [144], <strong>and</strong>Yukawa <strong>systems</strong> [168].On the other h<strong>and</strong>, for b<strong>in</strong>ary <strong>systems</strong>, a variety of crystal structures can appear <strong>in</strong>the bulk phase diagram, e.g., substitutionally ordered (superlattice) crystal structureswith vary<strong>in</strong>g stoichiometries, substitutionally disordered solid solutions, <strong>in</strong>terstitial solidsolutions, crystall<strong>in</strong>e phases of species 1 with a dispersed fluid of species 2, etc. Nucleationof a substitutionally disordered solid solution <strong>and</strong> a crystal with the CsCl structure hasbeen studied <strong>in</strong> a b<strong>in</strong>ary mixture of hard spheres us<strong>in</strong>g the total number of particles <strong>in</strong>the largest crystall<strong>in</strong>e cluster as an order parameter, i.e. Φ = N 1 + N 2 [165]. This orderparameter has also been employed <strong>in</strong> a crystal nucleation study of a substitutionallydisordered face-centered cubic crystal <strong>and</strong> a crystal with the CsCl structure of oppositelycharged colloids [169], <strong>and</strong> nucleation of the NaCl salt crystal from its melt us<strong>in</strong>g thesymmetry <strong>in</strong>dex l = 4 <strong>in</strong>stead of l = 6 for the bond orientational order parameter [170].However, one can also def<strong>in</strong>e other l<strong>in</strong>ear comb<strong>in</strong>ations of N 1 <strong>and</strong> N 2 as an order parameter.When the partial particle volumes of the two species are very different, one canemploy the volume of the largest crystall<strong>in</strong>e cluster Φ = V = N 1 v 1 + N 2 v 2 as an orderparameter. While, if the crystal structure consists of only one species, say species 1, withthe other species r<strong>and</strong>omly dispersed, the number of particles of species 1 <strong>in</strong> the largestcrystall<strong>in</strong>e cluster would be more appropriate to use as an order parameter Φ = N 1 . Onthe other h<strong>and</strong>, one can also use the stoichiometry n of the AB n superlattice structureto def<strong>in</strong>e the order parameter Φ = N 1 + N 2 /n <strong>in</strong> order to prevent a strong bias towardsone of the species. More generally, if the cluster size is measured by the order parameterΦ = N 1 +λN 2 , the sensitivity of the order parameter to particles of species 2 can be tunedvia the parameter λ. For λ = 1, this corresponds to the total number of particles <strong>in</strong> thecluster, while for λ = 0, this corresponds to the number of particles of type 1.As already mentioned above, the umbrella sampl<strong>in</strong>g technique is often employed todeterm<strong>in</strong>e the probability distribution P (Φ) <strong>and</strong> the Gibbs free energy ∆G(Φ). To thisend, a bias<strong>in</strong>g potential is <strong>in</strong>troduced to sample configurations with certa<strong>in</strong> values forthis order parameter Φ. In this chapter, we <strong>in</strong>vestigate the effect of the choice of order
Crystal nucleation <strong>in</strong> b<strong>in</strong>ary hard-sphere mixtures: The effect of theorder parameter on the cluster composition 97parameter on the properties of the clusters dur<strong>in</strong>g nucleation <strong>in</strong> a b<strong>in</strong>ary mixture of hardspheres, where we assume that the surface excess numbers of species i are negligible.Us<strong>in</strong>g Eq. (7.18), we now write down explicitly the change <strong>in</strong> Gibbs free energy for b<strong>in</strong>arynucleation∆G = γA + ∆µ 1 N 1 + ∆µ 2 N 2 , (7.33)where ∆µ i = µ i (Pα) o − µ o i,α(Pα). o The Gibbs free energy ∆G depends on the particle numbersN 1 <strong>and</strong> N 2 <strong>and</strong> the composition of the critical cluster can be determ<strong>in</strong>ed from the saddlepo<strong>in</strong>t conditions for ∆G. The free-energy surface <strong>in</strong> the two-dimensional compositionplane (N 1 , N 2 ) is projected <strong>in</strong> umbrella sampl<strong>in</strong>g MC simulations onto a one-dimensionalorder parameter, e.g. Φ = N 1 + λN 2 . Hence, the projected ∆G(Φ) <strong>and</strong> the averaged (orprojected) cluster composition of noncritical clusters both depend on the order parameter.We note that this is not an artifact of the umbrella sampl<strong>in</strong>g MC simulations, butmerely the projection of a correctly measured equilibrium distribution. To determ<strong>in</strong>e theaveraged composition of noncritical spherical clusters with radius R as a function of Φ,we can m<strong>in</strong>imize ∆G with respect to N 2 while keep<strong>in</strong>g the order parameter Φ fixed:( ) ∂∆G= ∆µ 2 − λ∆µ 1 + 2γv 1(ω − λ) = 0, (7.34)∂N 2 RΦwhere ω = v 2 /v 1 . If we use the umbrella sampl<strong>in</strong>g technique <strong>in</strong> MC simulations todeterm<strong>in</strong>e the Gibbs free energy ∆G(Φ) as a function of Φ, one can easily determ<strong>in</strong>e theslope of the barrier from the simulations, which is equal tod∆GdΦ = (∆µ 2 + 2γv ( )1R ω) ∂N2+∂Φ(∆µ 1 + 2γv ( )1R ) ∂N1(7.35)∂Φwith∂N 1∂Φ∂x1 − x − λN∂Φ=1 − x + λx∂N 2∂Φ =(7.36)x + N ∂x∂Φ1 − x + λx , (7.37)where we def<strong>in</strong>e the composition x = N 2 /N <strong>and</strong> N = N 1 + N 2 . Comb<strong>in</strong><strong>in</strong>g Eqs. (7.34)<strong>and</strong> (7.35) yieldsω∆µ 1 − ∆µ 2 = (ω − λ) d∆GdΦ . (7.38)We wish to make a few remarks here. First, we recover the Gibbs-Thomson equationsfor the critical cluster (7.19) when we set d∆G/dΦ <strong>in</strong> Eq. (7.35) to zero, <strong>and</strong> we recoverEq. (7.22) from Eq. (7.38) for critical clusters. Consequently, the size <strong>and</strong> composition ofthe critical cluster are <strong>in</strong>dependent of the choice of λ. This can also be understood fromthe fact that the saddlepo<strong>in</strong>t <strong>in</strong> the free-energy l<strong>and</strong>scape is <strong>in</strong>variant under coord<strong>in</strong>ate
98 Chapter 7transformations. As long as the top of the nucleation barrier corresponds to this saddlepo<strong>in</strong>t, the average properties of the cluster will be dom<strong>in</strong>ated by the configurations aroundthis saddlepo<strong>in</strong>t, regardless of the chosen order parameter. While most reasonable choicesof order parameter fulfill this requirement, it is possible to design order parameters thatshift the top of the barrier away from the saddle po<strong>in</strong>t. In this case, the clusters at thetop of the barrier are non-critical clusters, <strong>and</strong> rates calculated from the result<strong>in</strong>g freeenergy barrier are unreliable. It is important to note that a different choice of orderparameter can change the height of the nucleation barrier, s<strong>in</strong>ce the barrier height isdeterm<strong>in</strong>ed by the fraction of phase space mapped to the same order parameter valueat the top of the barrier. However, this effect should be small, as the probability off<strong>in</strong>d<strong>in</strong>g a cluster at the top of the nucleation barrier is dom<strong>in</strong>ated by the probability ofbe<strong>in</strong>g <strong>in</strong> the saddle po<strong>in</strong>t of the free-energy l<strong>and</strong>scape. For noncritical clusters, we clearlyf<strong>in</strong>d that the slope of the barrier, <strong>and</strong> hence the composition of the cluster, depends onthe choice of order parameter via λ. Below, we study the effect of the choice of orderparameter for a simple toy model of hard spheres <strong>and</strong> for the nucleation of an <strong>in</strong>terstitialsolid solution <strong>in</strong> an asymmetric b<strong>in</strong>ary hard-sphere mixture. It is <strong>in</strong>terest<strong>in</strong>g to comparethis to past studies <strong>in</strong>vestigat<strong>in</strong>g one-component <strong>systems</strong> with higher-dimensional orderparameters [171, 172]. For the Lennard-Jones system, Moroni et al., have shown that thenumber of particles <strong>in</strong> the cluster alone is <strong>in</strong>sufficient to provide a good prediction forthe probability a cluster will grow out to a large crystal [171]. Us<strong>in</strong>g a two-dimensionalorder parameter, they observed a strong correlation between the crystall<strong>in</strong>ity <strong>and</strong> thesize of clusters with a 50% probability of grow<strong>in</strong>g out. Specifically, clusters with a largeamount of face-centered-cubic (fcc) order<strong>in</strong>g require much smaller sizes to grow out thanthose with more body-centered-cubic (bcc) order<strong>in</strong>g. They found that this correlationwas not visible <strong>in</strong> the two-dimensional free-energy l<strong>and</strong>scape, <strong>and</strong> argued that the shape<strong>and</strong> structure of a nucleus could determ<strong>in</strong>e whether it will grow out. However, we notethat the two-dimensional order parameter is still a projection from a higher-dimensionalphase space. Thus, the properties of non-critical clusters likely depend on the choice ofthis order parameter as well.7.5 A substitutional solid solutionIn order to obta<strong>in</strong> more <strong>in</strong>sight <strong>in</strong> the effect of order parameter choice on the clustercomposition of noncritical clusters, we first <strong>in</strong>vestigate b<strong>in</strong>ary crystal nucleation <strong>in</strong> a toymodel of hard spheres. Here, we consider a system consist<strong>in</strong>g of two species of hard sphereswith identical sizes, but tagged with different colors, say species 1 is red <strong>and</strong> species 2 isblue. Obviously, the stable solid phase to be nucleated is a substitutional disordered facecentered-cubic(fcc) crystal phase with the red <strong>and</strong> blue particles r<strong>and</strong>omly distributed onan fcc lattice. Refs. [144, 145] showed that the nucleation barriers for pure hard spheresare well-described by the predictions from classical nucleation theory, where because ofthe condition of the equimolar surface, the surface excess number N s = 0. It is thereforesafe to neglect the surface excess numbers for the present model as well. In addition, itis clear that the partial particle volumes v i <strong>and</strong> volume per particle v are identical, <strong>and</strong>ω = v 2 /v 1 = 1. Us<strong>in</strong>g the Gibbs-Thomson equations for a b<strong>in</strong>ary critical cluster (7.19),
Crystal nucleation <strong>in</strong> b<strong>in</strong>ary hard-sphere mixtures: The effect of theorder parameter on the cluster composition 99G kBT12108642 Λ⩵1Λ⩵0.5 0 50 100 150 200Figure 7.1: Gibbs free energy ∆G(Φ)/k B T as a function of order parameter Φ = N 1 + λN 2 fora b<strong>in</strong>ary mixture of red (species 1) <strong>and</strong> blue (species 2) hard spheres with equal diameter σ asobta<strong>in</strong>ed from umbrella sampl<strong>in</strong>g MC simulations at a reduced pressure of P ∗ = P o ασ 3 /k B T = 17with λ = 1 <strong>and</strong> λ = 0.5.we f<strong>in</strong>d that the supersaturation ∆µ ∗ 1 = ∆µ ∗ 2 = −2γ ∗ v/R ∗ , <strong>and</strong> hence the compositionof the critical cluster follows straightforwardly from the bulk chemical potentials µ ∗ 1(Pα)o<strong>and</strong> µ ∗ 2(Pα), o which depends on the bulk chemical potentials of the orig<strong>in</strong>al bulk phase <strong>and</strong>the supersaturation.As already mentioned above, the composition of noncritical clusters depends on thechoice of order parameter, i.e., the projection of the two-dimensional composition planeonto a one-dimensional order parameter Φ. Us<strong>in</strong>g Eq. (7.38), we f<strong>in</strong>d that for λ = 1,the composition of noncritical cluster is determ<strong>in</strong>ed by the supersaturation ∆µ 1 = ∆µ 2<strong>and</strong> the bulk chemical potentials of the orig<strong>in</strong>al bulk phase. For λ = 0, we only measurethe number of particles of one color, say red, <strong>in</strong> the cluster. However, a thermodynamicaverage of all clusters with N 1 red particles also <strong>in</strong>cludes all post-critical clusters withmany blue particles, <strong>and</strong> as a result, the order parameter fails to work for λ = 0. Fornon-zero values of λ, the ensemble of clusters of each size is well-def<strong>in</strong>ed, <strong>and</strong> we canperform umbrella sampl<strong>in</strong>g MC simulations to measure the average cluster composition.In order to keep the composition of the metastable fluid fixed, we perform MonteCarlo simulations on a b<strong>in</strong>ary mixture with N = 1000 hard spheres <strong>in</strong> the semi-gr<strong>and</strong>canonical ensemble. Both species of hard spheres are identical <strong>in</strong> size with diameter σ,<strong>and</strong> are either tagged red (species 1) or blue (species 2). The simulations were carried out<strong>in</strong> a cubic box with periodic boundary conditions <strong>and</strong> the Metropolis sampl<strong>in</strong>g consists ofparticle displacements <strong>and</strong> volume changes, <strong>and</strong> attempts to switch the identity (color)of the particles. The acceptance rule for the identity swap moves is determ<strong>in</strong>ed by thechemical potential difference ∆µ o 12,α [165, 166]. We use the umbrella sampl<strong>in</strong>g techniqueto determ<strong>in</strong>e the nucleation barrier ∆Y = ∆G as a function of an order parameterΦ = N 1 + λN 2 , where N 1 (N 2 ) denotes the number of red (blue) solid-like particles <strong>in</strong> thelargest crystall<strong>in</strong>e cluster <strong>in</strong> the system as determ<strong>in</strong>ed by the local bond-order parameter<strong>and</strong> cluster criterion described <strong>in</strong> Sec. 7.4 with cutoff radius r c = 1.3σ, dot-product
100 Chapter 70.60x0.550.500.450.40 Λ⩵1 Λ⩵0.5TheorySteady State0 20 40 60 80 100 120 140Figure 7.2: Composition x = N 2 /N of the largest crystall<strong>in</strong>e cluster as a function of orderparameter Φ = N 1 + λN 2 for a b<strong>in</strong>ary mixture of red (species 1) <strong>and</strong> blue (species 2) hardspheres with equal diameter σ as obta<strong>in</strong>ed from umbrella sampl<strong>in</strong>g simulations at pressureP ∗ = P o ασ 3 /k B T = 17 with λ = 1 (red circles) <strong>and</strong> λ = 0.5 (green squares). For comparison,we plot the theoretical prediction (7.38) us<strong>in</strong>g the measured nucleation barrier of Fig. 7.1(black solid l<strong>in</strong>e) <strong>and</strong> the composition determ<strong>in</strong>ed from a steady-state cluster size distributionfor λ = 0.5 (blue dashed l<strong>in</strong>e). The critical cluster size is Φ ≃ 79 <strong>and</strong> 96 for λ = 0.5 <strong>and</strong> 1,respectively.cutoff d c = 0.7, <strong>and</strong> number of solid bonds ξ c ≥ 6. We first calculate the nucleationbarrier for λ = 1, for which the order parameter Φ is simply the total number of solid-likeparticles <strong>in</strong> the largest cluster. We set the reduced pressure P ∗ = Pασ o 3 /k B T = 17, <strong>and</strong>∆µ o 12,α = 0, which corresponds on average to an equimolar mixture of red <strong>and</strong> blue hardspheres for the metastable fluid phase. We plot the result<strong>in</strong>g nucleation barriers ∆G asa function of Φ <strong>in</strong> Fig. 7.1. We note that the nucleation barrier for λ = 1 is equivalentto the nucleation barrier for a pure system of hard spheres [144, 145]. In addition, weshow the composition of the largest cluster as a function of Φ <strong>in</strong> Fig. 7.2. We f<strong>in</strong>dthat the averaged composition x = N 2 /N = 0.5 as it should be s<strong>in</strong>ce ∆µ 1 = ∆µ 2 <strong>and</strong>the bulk chemical potentials of the metastable fluid are equal µ o 1,α = µ o 2,α. Us<strong>in</strong>g theb<strong>in</strong>omial coefficients <strong>and</strong> the measured one-dimensional free-energy barrier, we determ<strong>in</strong>ethe two-dimensional free-energy l<strong>and</strong>scape ∆G(N 1 , N 2 )/k B T = − ln P (N 1 , N 2 ) from theprobability distribution function( )NP (N 1 , N 2 ) = exp[−∆G(N 1 + N 2 )/k B T ] 2 N . (7.39)N 1Fig. 7.3 presents a contour plot of the two-dimensional free-energy l<strong>and</strong>scape β∆G(N 1 , N 2 )as a function of N 1 <strong>and</strong> N 2 . Exemplarily, we also plot isol<strong>in</strong>es for the order parameterΦ = N 1 +λN 2 for λ = 1 <strong>and</strong> 0.5 to show the projection of the two-dimensional compositionplane onto a one-dimensional order parameter.In order to check the effect of order parameter choice <strong>in</strong> the bias<strong>in</strong>g potential (7.29) onthe nucleation barrier <strong>and</strong> the composition of the clusters, we also calculate the nucleation
Crystal nucleation <strong>in</strong> b<strong>in</strong>ary hard-sphere mixtures: The effect of theorder parameter on the cluster composition 101barrier for λ = 0.5 at the same reduced pressure. We plot the nucleation barrier <strong>in</strong> Fig.7.1 <strong>and</strong> the averaged composition of the cluster as a function of Φ <strong>in</strong> Fig. 7.2. Whilethe barrier height is not significantly affected by the choice of order parameter <strong>in</strong> thebias<strong>in</strong>g potential, <strong>in</strong> agreement with our predictions <strong>in</strong> Sec. 7.4, the critical cluster “size”as measured by Φ, i.e. ≃ 79 <strong>and</strong> 96 for λ = 0.5 <strong>and</strong> 1, respectively, depends on the orderparameter choice as expected. In addition, we determ<strong>in</strong>e the theoretical prediction for thecluster composition us<strong>in</strong>g Eq. (7.38). Us<strong>in</strong>g the measured slope of the nucleation barrierfrom Fig. 7.1, we obta<strong>in</strong> the chemical potential difference ∆µ 12 (Φ) of species 1 <strong>and</strong> 2 <strong>in</strong>the cluster from Eq. (7.38). Us<strong>in</strong>g Eq. (7.39), we f<strong>in</strong>dP (N 1 , N 2 ) ∝ 2 N N!N 2 !(N − N 2 )! exp[−βN 2∆µ 12 (Φ)] (7.40)from which we determ<strong>in</strong>e the most probable (or averaged) composition:x = 1 − exp[−β∆µ 12 (Φ)]. (7.41)The theoretical prediction for the composition is plotted <strong>in</strong> Fig. 7.2. We f<strong>in</strong>d goodagreement with the measured composition, except for very small cluster sizes, where wedo not expect CNT to match our nucleation barriers. For comparison, we also plot thesame predictions for the nucleation paths <strong>in</strong> Fig. 7.3. We clearly observe that the twonucleation paths cross at the saddle po<strong>in</strong>t yield<strong>in</strong>g the same size <strong>and</strong> composition of thecritical cluster for both order parameters, as expected.F<strong>in</strong>ally, we also determ<strong>in</strong>e the composition of the clusters from the steady-state distribution.In <strong>systems</strong> where the nucleation of the new phase is measured directly, either <strong>in</strong>experiments or simulations, the measured cluster size distribution corresponds to a steadystatedistribution rather than an equilibrium distribution. The steady-state distributionobserved dur<strong>in</strong>g the nucleation process is different from the equilibrium distribution, asclusters that exceed the critical cluster size dur<strong>in</strong>g the steady-state process will cont<strong>in</strong>ueto grow further. The steady-state distribution depends both on the free-energy l<strong>and</strong>scape<strong>and</strong> the dynamics of the system, <strong>and</strong> <strong>in</strong>cludes a flux across the free-energy barrier,whereas the equilibrium distribution can only be determ<strong>in</strong>ed by prevent<strong>in</strong>g the systemfrom nucleat<strong>in</strong>g, i.e, constra<strong>in</strong><strong>in</strong>g the maximum cluster size by e.g. umbrella sampl<strong>in</strong>g MCsimulations. While the equilibrium <strong>and</strong> steady-state distributions are <strong>in</strong> good agreementfor small cluster sizes, they disagree strongly for postcritical cluster sizes, i.e., when thesystem crosses the free-energy barrier. In particular, the equilibrium cluster size distributionshows a m<strong>in</strong>imum correspond<strong>in</strong>g with the maximum <strong>in</strong> the free-energy barrier, <strong>and</strong>the steady-state distribution generally decreases cont<strong>in</strong>uously (even) beyond the criticalcluster size.We calculate the cluster composition from the steady-state distribution for our b<strong>in</strong>arymixture of hard spheres. To this end, we determ<strong>in</strong>e the free energy as a function ofcluster size N 1 <strong>and</strong> N 2 from Eq. (7.39) us<strong>in</strong>g a fit to the free-energy barrier obta<strong>in</strong>ed fromumbrella sampl<strong>in</strong>g MC simulations with λ = 1. The dynamics of the cluster are described
102 Chapter 7by the follow<strong>in</strong>g rates:k +,1N 1 ,N 2= 1k +,2N 1 ,N 2= 1k −,1N 1 ,N 2= exp[−β(G(N 1 − 1, N 2 ) − G(N 1 , N 2 ))]k −,2N 1 ,N 2= exp[−β(G(N 1 , N 2 − 1) − G(N 1 , N 2 ))].Here, k +(−),iN 1 ,N 2is the rate associated with add<strong>in</strong>g (remov<strong>in</strong>g) a particle of species i to (from)the nucleus consist<strong>in</strong>g of N 1 <strong>and</strong> N 2 particles. Hence, clusters can only grow or shr<strong>in</strong>k byone particle at a time with a rate determ<strong>in</strong>ed by the correspond<strong>in</strong>g free-energy difference.In order to determ<strong>in</strong>e the steady-state cluster size distribution, we set a limit to the steadystatedistribution by def<strong>in</strong><strong>in</strong>g a maximum cluster size, which exceeds the critical clustersize. As a barrier cross<strong>in</strong>g can be considered as a one-way event, subsequent nucleationevents should start aga<strong>in</strong> from the metastable fluid phase. To this end, we impose thatthe addition of an extra particle to a nucleus with this maximum cluster size falls back tosize zero. We note that this step is not reversible, <strong>and</strong> results <strong>in</strong> slightly modified ratesfor nuclei with the maximum cluster size <strong>and</strong> for clusters of zero size. With the exceptionof these steps, the dynamics obey detailed balance.In order to determ<strong>in</strong>e the steady-state distribution, we set the rate at which clustersof size (N 1 , N 2 ) are created to zero. Hence, the flux with which clusters of size (N 1 , N 2 )are created should balance the flux with which clusters of this size disappear:P ss (N 1 , N 2 ) ∑ i(k +,iN 1 ,N 2+ k −,iN 1 ,N 2) =P ss (N 1 + 1, N 2 )k −,1N 1 +1,N 2+ P ss (N 1 − 1, N 2 )k +,1N 1 −1,N 2+P ss (N 1 , N 2 + 1)k −,2N 1 ,N 2 +1 + P ss (N 1 , N 2 − 1)k +,2N 1 ,N 2 −1.Here, P ss (N 1 , N 2 ) denotes the steady-state cluster size distribution. The equations forcluster size zero <strong>and</strong> the maximum cluster size are slightly different due to a flux of clustersfrom maximum to zero cluster size. By solv<strong>in</strong>g this set of l<strong>in</strong>ear equations numerically,we obta<strong>in</strong> the steady-state distribution. Subsequently, the average cluster compositioncan be obta<strong>in</strong>ed from the steady-state distribution by averag<strong>in</strong>g over clusters with equalΦ = N 1 + λN 2 . The result<strong>in</strong>g cluster composition is shown <strong>in</strong> Fig. 7.2 for λ = 0.5.S<strong>in</strong>ce the two-dimensional steady-state cluster size distribution, which is symmetric <strong>in</strong>N 1 <strong>and</strong> N 2 decreases monotonically with cluster size, the result<strong>in</strong>g projected compositionis always lower than 0.5 <strong>and</strong> matches well with the cluster compositions obta<strong>in</strong>ed fromumbrella sampl<strong>in</strong>g MC simulations <strong>and</strong> the theoretical prediction, except at small clustersizes as expected. Moreover, <strong>in</strong> the limit of large (postcritical) clusters, the cluster growthrate approaches a constant for the current choice of dynamics, result<strong>in</strong>g <strong>in</strong> a nearly flatsteady-state cluster size distribution <strong>and</strong> a cluster composition of 0.5.In conclusion, we have shown us<strong>in</strong>g a simple model for a b<strong>in</strong>ary mixture of hardspheres that the composition of the critical cluster does not depend on the choice oforder parameter, while the composition of noncritical clusters is affected by the orderparameter. This is a direct consequence of the projection of the two-dimensional freeenergyl<strong>and</strong>scape onto a one-dimensional order parameter, say Φ = N 1 + λN 2 , which
Crystal nucleation <strong>in</strong> b<strong>in</strong>ary hard-sphere mixtures: The effect of theorder parameter on the cluster composition 103N210080604020Λ⩵0.5Λ⩵180 k B T70 k B T60 k B T50 k B T40 k B T30 k B T20 k B T10 k B T0 k B T00 20 40 60 80 100N 1Figure 7.3: Contour plot of the two-dimensional free-energy l<strong>and</strong>scape ∆G(N 1 , N 2 )/k B T as afunction of N 1 <strong>and</strong> N 2 . We also plot a few isol<strong>in</strong>es for the order parameter Φ = N 1 + λN 2 forλ = 0.5 <strong>and</strong> 1 (dashed l<strong>in</strong>es), <strong>and</strong> we plot the nucleation path (solid l<strong>in</strong>es labeled with λ = 1<strong>and</strong> λ = 0.5) for the two order parameters that we considered as predicted by (7.38). The twonucleation paths cross at the saddle po<strong>in</strong>t correspond<strong>in</strong>g to the critical cluster size.<strong>in</strong>fluence directly the projected (L<strong>and</strong>au) ∆G(Φ) <strong>and</strong> the averaged (or projected) clustercomposition. Moreover, as the umbrella sampl<strong>in</strong>g method allows us to equilibrate thesystem for various values of the order parameter, the system can be regarded to be <strong>in</strong>local equilibrium for each value of the order parameter. The nucleation paths that thesystem then follows rema<strong>in</strong> close to the m<strong>in</strong>imum free-energy path (see Fig. 7.3), <strong>and</strong> thusthe height of the nucleation barrier is largely unaffected by the choice of order parameter.7.6 An <strong>in</strong>terstitial solid solutionWe consider crystal nucleation of an <strong>in</strong>terstitial solid solution <strong>in</strong> a highly asymmetricb<strong>in</strong>ary mixture of large <strong>and</strong> small hard spheres with size ratio q = σ 2 /σ 1 = 0.3, where σ 1(2)denotes the diameter of species 1 (large spheres) <strong>and</strong> 2 (small spheres). The <strong>in</strong>terstitialsolid solution consists of a face-centered-cubic crystal phase of large spheres with a r<strong>and</strong>omoccupancy of the octahedral holes by small spheres, <strong>and</strong> hence the composition of the<strong>in</strong>terstitial solid solution can vary from x = N 2 /N ∈ [0, 1] [173]. As the volume of thissolid phase is not largely affected by the density of small spheres, we set the partial particlevolume v 2 <strong>and</strong> ω = v 2 /v 1 to zero. Us<strong>in</strong>g Eq. (7.38), we f<strong>in</strong>d the follow<strong>in</strong>g relation if thesystem is <strong>in</strong> local equilibrium at fixed order parameter Φ = N 1 + λN 2∆µ 2 = λ d∆GdΦ . (7.42)
104 Chapter 7For λ = 0, the order parameter Φ = N 1 measures only the large spheres <strong>in</strong> the cluster,<strong>and</strong> the cluster composition of both critical <strong>and</strong> noncritical clusters is determ<strong>in</strong>ed by thechemical equilibrium condition for the small spheres <strong>in</strong> the cluster <strong>and</strong> the metastablefluid phase, i.e., ∆µ 2 = 0. For λ = 1, when all particles <strong>in</strong> the clusters are countedby the order parameter Φ = N 1 + N 2 , the composition of precritical clusters will havea higher density of small particles compared to the chemical equilibrium condition forthe small particles <strong>in</strong> the cluster <strong>and</strong> the metastable fluid phase, as the slope of thenucleation barrier is positive, <strong>and</strong> similarly postcritical clusters will have a lower densityof small particles. For both order parameters, we f<strong>in</strong>d that the critical cluster satisfiesthe Gibbs-Thomson equation (7.19), <strong>and</strong> thus for a partial particle volume v 2 = 0, weobta<strong>in</strong> chemical equilibrium for the small particles <strong>in</strong> the critical cluster <strong>and</strong> the fluidphase <strong>in</strong>dependent of the order parameter choice.As the composition <strong>and</strong> size of the critical cluster are not affected by the choice oforder parameter, we set λ = 0 <strong>in</strong> order to <strong>in</strong>vestigate whether or not we observe diffusiveequilibrium for species 2 for all noncritical clusters. To keep the composition of the fluidfixed, it would be convenient to use aga<strong>in</strong> Monte Carlo simulations <strong>in</strong> the semi-gr<strong>and</strong>canonical (NP T − ∆µ 12,α ) ensemble. However, the acceptance probability of chang<strong>in</strong>gsmall spheres <strong>in</strong>to large spheres is extremely small, which makes the equilibration time ofthe simulation prohibitively long, even when we use the augmented semigr<strong>and</strong> ensemblepresented <strong>in</strong> Ref. [165], where the diameter of the particles is changed gradually <strong>in</strong>different stages. In order to solve this problem, we determ<strong>in</strong>e the free-energy barrierus<strong>in</strong>g the umbrella sampl<strong>in</strong>g technique <strong>in</strong> isothermal-isobaric MC simulations, <strong>in</strong> whichthe pressure Pα, o the temperature T , <strong>and</strong> the particle numbers N1,α o <strong>and</strong> N2,α o are keptfixed of the orig<strong>in</strong>al metastable bulk phase. We perform successive simulations for eachw<strong>in</strong>dow, but <strong>in</strong> such a way that the composition x o α = N 2,α /(N1,α+N o 2,α) o of the metastablefluid phase is on average kept fixed dur<strong>in</strong>g the growth of the nucleus. To this end, we firstmeasure the <strong>in</strong>stantaneous composition x α of the fluid phase <strong>in</strong> the <strong>in</strong>itial configurationfor the successive umbrella sampl<strong>in</strong>g w<strong>in</strong>dows centered around a new order parametervalue Φ. If the composition of the fluid has changed more than 0.1%, we resize r<strong>and</strong>omparticles <strong>in</strong> the fluid phase dur<strong>in</strong>g an equilibration run until the fluid phase reaches itsorig<strong>in</strong>al composition x o α. We then start the production run to measure the probabilitydistribution function P (Φ) <strong>and</strong> the correspond<strong>in</strong>g part of the free-energy barrier <strong>in</strong> anormal isobaric-isothermal MC simulation. We assume that the composition of the fluidphase dur<strong>in</strong>g MC simulations of a s<strong>in</strong>gle umbrella sampl<strong>in</strong>g w<strong>in</strong>dow does not changesignificantly, s<strong>in</strong>ce the cluster size is approximately constant. In order to determ<strong>in</strong>e thecomposition of the fluid phase, we first determ<strong>in</strong>e the largest crystall<strong>in</strong>e cluster <strong>in</strong> thesystem by us<strong>in</strong>g the local bond-order parameter <strong>and</strong> cluster criterion as described <strong>in</strong> Sec.7.4 with cutoff radius r c = 1.1σ 1 , dot-product cutoff d c = 0.7, <strong>and</strong> number of solid bondsξ c ≥ 6. The composition of the fluid is def<strong>in</strong>ed as x α = (N2,α−N o 2 )/(N2,α+N o 1,α−N o 2 −N 1 )where N 1 is the number of large spheres <strong>in</strong> the cluster <strong>and</strong> N 2 is the number of smallspheres which have at least 6 neighbors of large spheres <strong>in</strong> the cluster with<strong>in</strong> cut-offdistance r c = 1.1σ 1 . N1,α o <strong>and</strong> N2,α o denote the total number of large <strong>and</strong> small spheres <strong>in</strong>the MC simulation.In addition, we determ<strong>in</strong>e the composition of the solid nucleus x = N 2 /N. In order toavoid surface effects <strong>and</strong> defects <strong>in</strong> the crystal structure of the solid nucleus, we determ<strong>in</strong>e
Crystal nucleation <strong>in</strong> b<strong>in</strong>ary hard-sphere mixtures: The effect of theorder parameter on the cluster composition 105the fraction of octahedral holes that is occupied by a small sphere <strong>in</strong> the fcc lattice ofthe large spheres <strong>in</strong> the solid cluster. An octahedral hole is def<strong>in</strong>ed as a set of 6 largeparticles, where each particle is a neighbour of 4 other particles <strong>in</strong> the same set, <strong>and</strong> theoctahedral hole is occupied by a small particle if all 6 large particles are with<strong>in</strong> a cutoffradius of 0.22σ 1 of the center-of-mass of this small sphere.We first determ<strong>in</strong>e the nucleation barrier <strong>in</strong> a normal N1,αN o 2,αP o αT o MC simulationus<strong>in</strong>g the umbrella sampl<strong>in</strong>g technique for system sizes Nα o = N1,α o + N2,α o = 3000, 6000,<strong>and</strong> 9000 particles. The <strong>in</strong>itial fluid composition is set to x o α = 0.5 <strong>and</strong> reduced pressureP ∗ = βPασ o 1 3 = 25. We plot the Gibbs free energy ∆G/k B T as a function of the numberof large spheres N 1 <strong>in</strong> the largest crystall<strong>in</strong>e cluster <strong>in</strong> Fig. 7.4. We observe that thenucleation barrier height <strong>and</strong> critical cluster size decreases upon <strong>in</strong>creas<strong>in</strong>g system size.This can be expla<strong>in</strong>ed by a change <strong>in</strong> the composition of the metastable fluid phase dur<strong>in</strong>gthe growth of a crystall<strong>in</strong>e cluster. In Fig. 7.5, we plot the composition of the metastablefluid phase as a function of the cluster size N 1 for the various system sizes. We clearly f<strong>in</strong>dthat the fluid composition changes significantly dur<strong>in</strong>g the growth of a solid nucleus forsmaller system sizes. In order to corroborate this result, we perform umbrella sampl<strong>in</strong>gMC simulations <strong>in</strong> which the composition of the metastable fluid phase is kept fixed <strong>in</strong>each successive umbrella sampl<strong>in</strong>g w<strong>in</strong>dow us<strong>in</strong>g the method as described above. Thecomposition of the fluid phase is <strong>in</strong>deed kept fixed by this method as shown <strong>in</strong> Fig. 7.5.The nucleation barrier as obta<strong>in</strong>ed by fix<strong>in</strong>g the composition of the metastable fluid phaseis presented <strong>in</strong> Fig. 7.4. As the nucleation barrier calculated at fixed fluid compositionshould correspond to an <strong>in</strong>f<strong>in</strong>itely large system size, we plot the barrier heights ∆G ∗ /k B Tas a function of 1/Nα o with Nα o = N1,α o + N2,α. o We f<strong>in</strong>d that the barrier height dependsl<strong>in</strong>early on 1/Nα o with<strong>in</strong> errorbars. Moreover, extrapolat<strong>in</strong>g the barrier heights obta<strong>in</strong>edfrom N1,αN o 2,αP o αT o MC simulations to the thermodynamic limit, we f<strong>in</strong>d that the f<strong>in</strong>ite-sizecorrected barrier height agrees well with<strong>in</strong> errorbars with the barrier height determ<strong>in</strong>edfrom umbrella sampl<strong>in</strong>g MC simulations with fixed fluid composition correspond<strong>in</strong>g to an<strong>in</strong>f<strong>in</strong>itely large system size. In addition, we plot the composition of the solid cluster as afunction of cluster size N 1 <strong>in</strong> Fig. 7.5, <strong>and</strong> we f<strong>in</strong>d no strong dependence of the clustercomposition on system size.F<strong>in</strong>ally, we determ<strong>in</strong>e the composition of (non)critical clusters for the nucleation ofthe <strong>in</strong>terstitial solid solution for four different fluid compositions x o α = 0.2, 0.5, 0.7 <strong>and</strong>0.8 at statepo<strong>in</strong>ts well-<strong>in</strong>side the fluid-solid coexistence region us<strong>in</strong>g umbrella sampl<strong>in</strong>gMC simulations with fixed fluid composition <strong>and</strong> system size Nα o = 3000. Follow<strong>in</strong>g Ref.[165], the “supercool<strong>in</strong>g” was kept fixed, i.e., Pα/P o coex ∗ = 1.2, where Pcoex ∗ is the pressure atthe bulk fluid-solid coexistence at the correspond<strong>in</strong>g fluid composition. We note howeverthat these statepo<strong>in</strong>ts correspond to different values for the supersaturation, <strong>and</strong> cantherefore lead to significantly different barrier heights. We determ<strong>in</strong>e the Gibbs freeenergybarrier <strong>and</strong> the cluster composition as a function of cluster size N 1 us<strong>in</strong>g umbrellasampl<strong>in</strong>g MC simulations, <strong>and</strong> plot the results <strong>in</strong> Fig. 7.6 <strong>and</strong> 7.7 for the four differentfluid compositions. In Fig. 7.7, the dashed l<strong>in</strong>es <strong>in</strong>dicate the compositions predicted byEq. (7.42) with λ = 0, i.e., chemical equilibrium for species 2 <strong>in</strong> the clusters <strong>and</strong> themetastable fluid phase. For comparison, we also plot the composition of the coexist<strong>in</strong>gsolid phase at Pα. o We clearly observe that the measured cluster compositions obta<strong>in</strong>edfrom umbrella sampl<strong>in</strong>g MC simulations are <strong>in</strong> good agreement with the predictions from
106 Chapter 74030N αo= 3000 fixed fluid compositionN αo= 3000N αo= 6000∆G/k BToN α = 90003420323010280 0.0001 0.0002 0.0003 0.0004o1/N α00 50 100 150 200N 1∆G * /k BTFigure 7.4: a) Gibbs free energy ∆G/k B T as a function of number of large particles N 1 <strong>in</strong>the largest crystall<strong>in</strong>e cluster us<strong>in</strong>g normal N1 oN 2 o P T MC simulations <strong>and</strong> isobaric-isothermalMC simulations with fixed fluid composition x α = 0.5, <strong>and</strong> pressure P ∗ = βPασ o 1 3 = 25. b)Free-energy barrier height ∆G ∗ /k B T as a function of 1/Nα.ox (cluster)x α(fluid)0.20.100.530.520.510.5N αo= 3000 fixed fluid compositionN αo= 3000N αo= 6000N αo= 90000.490 50 100 150 200N 1Figure 7.5: The composition of the largest crystall<strong>in</strong>e cluster x = N 2 /N (top) <strong>and</strong> themetastable fluid phase x α (bottom) as a function of cluster size N 1 . The green l<strong>in</strong>es denotes thesimulation <strong>in</strong> which the composition of the fluid was reset to the orig<strong>in</strong>al value at the start ofeach US w<strong>in</strong>dow. The other l<strong>in</strong>es correspond to normal N1,α o N 2,α o P αT o MC simulations, wherethe overall composition of the system is kept fixed for various system sizes.
Crystal nucleation <strong>in</strong> b<strong>in</strong>ary hard-sphere mixtures: The effect of theorder parameter on the cluster composition 107CNT for cluster sizes larger than 30, which predicts chemical equilibrium for the smallspheres <strong>in</strong> the cluster <strong>and</strong> the metastable parent phase. If we now take a closer look atthe statepo<strong>in</strong>t def<strong>in</strong>ed by x o α = 0.2 <strong>and</strong> Pα/P o coex ∗ = 1.2 for the metastable fluid phase,we f<strong>in</strong>d from Ref. [173] that the composition of the coexist<strong>in</strong>g fluid <strong>and</strong> solid phase afterfull phase separation should be x ≃ 0.47 <strong>and</strong> 0.15, respectively. Interest<strong>in</strong>gly, we f<strong>in</strong>dthat the composition of the nucleat<strong>in</strong>g clusters is much lower (x ≃ 0.07) than that ofthe coexist<strong>in</strong>g bulk crystal phase. Hence, the phase separation is ma<strong>in</strong>ly driven by thenucleation of large spheres while ma<strong>in</strong>ta<strong>in</strong><strong>in</strong>g chemical equilibrium for the smaller speciesthroughout the whole system. Only when the chemical potential of the large spheres <strong>in</strong>the metastable fluid is sufficiently low due to a depletion of large spheres as a result ofcrystal nucleation <strong>and</strong> crystal growth, small spheres will diffuse <strong>in</strong>to the crystal phase <strong>in</strong>order to <strong>in</strong>crease the composition of the solid phase. However, we note that the chemicalequilibrium condition for the smaller species only holds for the present order parameterchoice Φ = N 1 , whereas any other choice of order parameter would certa<strong>in</strong>ly yield differentresults for the cluster composition.For highly asymmetric b<strong>in</strong>ary hard-sphere mixtures, where the stable solid phase correspondsto a fcc of large spheres with a dispersed fluid of small particles, one wouldnaively expect that the small particles are always <strong>in</strong> chemical equilibrium dur<strong>in</strong>g thenucleation process. Hence, <strong>in</strong> order to study crystal nucleation <strong>in</strong> highly asymmetric mixtures,one can employ an effective pairwise depletion potential description as described <strong>in</strong>Ref. [174–176] provided that three- <strong>and</strong> higher-body <strong>in</strong>teractions are negligible <strong>and</strong> thedepletion potentials are determ<strong>in</strong>ed at fixed chemical potential of the small spheres. Suchan effective pair potential approach was employed <strong>in</strong> a nucleation study <strong>in</strong> the vic<strong>in</strong>ityof a critical isostructural solid-solid transition <strong>in</strong> a b<strong>in</strong>ary mixture of hard spheres withsize ratio q = σ 2 /σ 1 = 0.1, but this study showed accord<strong>in</strong>g to the authors a breakdownof classical nucleation theory [177]. It would be <strong>in</strong>terest<strong>in</strong>g to <strong>in</strong>vestigate whether ornot the breakdown is caused by the (false) assumption of chemical equilibrium of smallspheres dur<strong>in</strong>g the nucleation process. For less asymmetric b<strong>in</strong>ary hard-sphere mixtures,where the small spheres cannot diffuse freely <strong>in</strong> the solid cluster, chemical equilibriumof the smaller species is harder to ma<strong>in</strong>ta<strong>in</strong>, especially when the nucleated crystal phasehas long-range crystall<strong>in</strong>e order for both species as <strong>in</strong> the case of a superlattice structurewhere the chemical potentials of the two species are not <strong>in</strong>dependent as it is determ<strong>in</strong>edby the stoichiometry of the crystal structure. It would be <strong>in</strong>terest<strong>in</strong>g to <strong>in</strong>vestigate atwhich size ratio <strong>and</strong> pressures this crossover occurs.7.7 ConclusionsIn this chapter, we have studied crystal nucleation <strong>in</strong> a b<strong>in</strong>ary mixture of hard spheres<strong>and</strong> we have <strong>in</strong>vestigated what the effect is of the choice of order parameter on the composition<strong>and</strong> size of both critical <strong>and</strong> noncritical clusters. We have studied nucleation ofa substitutional solid solution <strong>in</strong> a simple toy model of identical hard spheres but taggedwith different colors <strong>and</strong> we <strong>in</strong>vestigate the nucleation of an <strong>in</strong>terstitial solid solution <strong>in</strong>a b<strong>in</strong>ary hard-sphere mixture with a diameter ratio q = 0.3. In order to study nucleationof a crystal phase <strong>in</strong> computer simulations, a one-dimensional order parameter is usually
108 Chapter 7605040∆G/k BT302010x o = 0.8, P * = 47x o = 0.7, P * = 37.5x o = 0.5, P * = 25x o = 0.2, P * = 17.500 50 100 150 200 250 300N 1Figure 7.6: Gibbs free energy ∆G/k B T as a function of cluster size N 1 for four different fluidcompositions x o α = 0.2, 0.5, 0.7, <strong>and</strong> 0.8 for a b<strong>in</strong>ary mixture of hard spheres with size ratio 0.3at 20% supercool<strong>in</strong>g, i.e., Pα/P o coex ∗ = 1.2 with Pcoex ∗ the bulk coexistence pressure.x (cluster)0.50.40.30.2xoα= 0.8ox α= 0.7xoα= 0.5ox α= 0.20.100 50 100 150 200 250N 1Figure 7.7: Cluster compositions x = N 2 /N as a function of cluster size N 1 for four differentfluid compositions x o α = 0.2, 0.5, 0.7, <strong>and</strong> 0.8 for a b<strong>in</strong>ary mixture of hard spheres with size ratio0.3 at supercool<strong>in</strong>g Pα/P o coex ∗ = 1.2. The long dashed l<strong>in</strong>es denote the composition predictedby CNT, which corresponds to chemical equilbrium of species 2 <strong>in</strong> the solid clusters <strong>and</strong> themetastable fluid phase, while the dotted l<strong>in</strong>es denote the composition of the coexist<strong>in</strong>g bulkcrystal phase.
Crystal nucleation <strong>in</strong> b<strong>in</strong>ary hard-sphere mixtures: The effect of theorder parameter on the cluster composition 109def<strong>in</strong>ed to identify the solid phase from the supersaturated fluid phase. We have shownthat the choice of order parameter can strongly <strong>in</strong>fluence the composition of noncriticalclusters, as the free-energy l<strong>and</strong>scape <strong>in</strong> the two-dimensional composition plane (N 1 , N 2 )is projected onto a one-dimensional order parameter, say Φ = N 1 +λN 2 , <strong>in</strong> umbrella sampl<strong>in</strong>gMC simulations. This is supported by the good agreement that we found betweenour results on the composition of noncritical clusters obta<strong>in</strong>ed from umbrella sampl<strong>in</strong>gMC simulations <strong>and</strong> the predictions from CNT for the nucleation of a substitutional solidsolution <strong>in</strong> a toy model. While the effect is clearly visible <strong>in</strong> the case of a b<strong>in</strong>ary system, itshould occur more generally whenever a higher-dimensional free-energy l<strong>and</strong>scape is projectedonto a s<strong>in</strong>gle order parameter. For the nucleation of an <strong>in</strong>terstitial solid solution<strong>in</strong> a highly asymmetric hard-sphere system, we found that the composition of noncriticalclusters is determ<strong>in</strong>ed by the chemical equilibrium condition of the small spheres <strong>in</strong> thecluster <strong>and</strong> the fluid phase, as the partial particle volume of the small spheres <strong>in</strong> the solidphase can be neglected. We compared the composition of the noncritical clusters obta<strong>in</strong>edfrom umbrella sampl<strong>in</strong>g MC simulations <strong>and</strong> the theoretical prediction from CNT, <strong>and</strong>found aga<strong>in</strong> good agreement. More importantly, we f<strong>in</strong>d that the barrier height <strong>and</strong> thecomposition of the critical cluster are not significantly affected by the choice of orderparameter. As a result, critical clusters <strong>and</strong> the barrier height should be comparable evenwith different order parameters.7.8 AcknowledgementsI would like to thank Ran Ni for calculat<strong>in</strong>g the free energy barriers for the nucleation ofthe ISS phase, Laura Filion for calculat<strong>in</strong>g the phase diagram of the b<strong>in</strong>ary hard spheresystem at size ration 0.3, <strong>and</strong> both of them for many long <strong>and</strong> fruitful discussions.
8Assembly of <strong>colloidal</strong> spheres <strong>and</strong>dumbbells through emulsiondroplet evaporationIn this chapter, we exam<strong>in</strong>e the clusters formed by particles conf<strong>in</strong>ed to emulsion droplets.By slow evaporation of the droplets, small numbers of particles can be forced together<strong>in</strong>to densely packed clusters. We use Monte Carlo simulations to <strong>in</strong>vestigate clusters ofboth spheres <strong>and</strong> dumbbells, model<strong>in</strong>g the evaporation process as two separate steps: acompression step <strong>in</strong> which the particles are forced <strong>in</strong>to a dense pack<strong>in</strong>g due to sphericalconf<strong>in</strong>ement, <strong>and</strong> a subsequent second step that m<strong>in</strong>imizes the second moment of the massdistribution of the cluster. This second step mimics the rearrangements of the cluster<strong>in</strong> the f<strong>in</strong>al stages of evaporation, where the shape of the emulsion droplet is strongly<strong>in</strong>fluenced by the particles. While only hard-core <strong>in</strong>teractions are taken <strong>in</strong>to account,comparisons between clusters obta<strong>in</strong>ed from simulations <strong>and</strong> experimental snapshots leadus to conclude that good agreement is found when us<strong>in</strong>g this simple model.
112 Chapter 88.1 IntroductionAs spherical <strong>colloidal</strong> particles are often considered as a model system for atoms, a logicalextension would be model<strong>in</strong>g clusters of <strong>colloidal</strong> spheres as <strong>colloidal</strong> molecules.[178]Various methods have been proposed for the fabrication of <strong>colloidal</strong> molecules,[179] e.g.by geometrical conf<strong>in</strong>ement of <strong>colloidal</strong> spheres <strong>and</strong> capillary forces, [180] by controlledcoagulation, [181, 182] or by coalescence of colloids with liquid protrusions. [183, 184]Emulsion droplet evaporation, was <strong>in</strong>troduced by Manoharan et al. a number of yearsago. [185] In this method, emulsion droplets conta<strong>in</strong><strong>in</strong>g small numbers of particles aresuspended <strong>in</strong> a liquid. By evaporat<strong>in</strong>g the solvent <strong>in</strong> the emulsion droplets, the size of thedroplets can be slowly reduced, caus<strong>in</strong>g the particles <strong>in</strong> each droplet to be compressed <strong>in</strong>todensely packed clusters. For clusters of up to around 16 particles, it has been shown thatthis method leads to well-def<strong>in</strong>ed cluster shapes that are largely consistent across various<strong>systems</strong> with different particles <strong>and</strong> solvents. [186, 187] By separat<strong>in</strong>g these clusters basedon their size, this process can yield largely monodisperse anisotropic build<strong>in</strong>g blocks thatcould be useful <strong>in</strong> eng<strong>in</strong>eer<strong>in</strong>g a range of complex structures. For example, it has beensuggested that the tetrahedral clusters commonly seen <strong>in</strong> these experiments could be usedto create crystals with a diamond lattice, potentially allow<strong>in</strong>g for structures with usefuloptical properties.[188–191]The structure of the particles <strong>in</strong> an emulsion droplet suspended <strong>in</strong> a liquid is determ<strong>in</strong>ednot only by the <strong>in</strong>teractions between the particles, but also on the droplet volume<strong>and</strong> the particle-droplet (γ pd ), particle-liquid (γ pl ) <strong>and</strong> droplet-liquid (γ dl ) surface tensions.The particle configuration <strong>and</strong> droplet shape can be determ<strong>in</strong>ed from m<strong>in</strong>imiz<strong>in</strong>gthe total surface energy. [192] While the surface tensions <strong>and</strong> <strong>in</strong>teraction potentials <strong>in</strong> experimentsare often not exactly known, the uniqueness of the structures found <strong>in</strong> differentexperiments suggests that they do not depend strongly on the details of the underly<strong>in</strong>gsystem. Indeed, Ref [192] shows that the clusters are unique over a whole range of contactangles <strong>and</strong> are mostly determ<strong>in</strong>ed by geometrical constra<strong>in</strong>ts. The contact angle θ is givenby Young’s equation <strong>and</strong> depends on the three surface tensions:γ dl cos θ = γ pl − γ pd . (8.1)Interest<strong>in</strong>gly, for cluster sizes N ≤ 11, the clusters observed closely correspond to theparticle configurations that m<strong>in</strong>imize the second moment M 2 of the mass distribution:N∑M 2 = |r i − r 0 | 2 , (8.2)i=1with r 0 the center of mass of the cluster, <strong>and</strong> r i the position of the center of particle i.[185,192, 193] For larger clusters, the clusters that m<strong>in</strong>imize this second moment generallyhave a central particle, a feature absent <strong>in</strong> the experimentally observed structures. Asthe particles <strong>in</strong> experiments were seen to stick to the surface of the emulsion droplets atall times dur<strong>in</strong>g the evaporation process, it was suggested by Manoharan et al.[185] thatthe structures were formed <strong>in</strong> two steps. The colloids first reach an optimal close pack<strong>in</strong>gconf<strong>in</strong>ed to the surface of a sphere, <strong>and</strong> are then pulled towards the center by capillaryforces while the particles are restricted to a cont<strong>in</strong>uous <strong>and</strong> smooth surface. In agreement
Assembly of <strong>colloidal</strong> spheres <strong>and</strong> dumbbells through emulsion dropletevaporation 113with the observed clusters, this last step reduces the second mass moment, but preventsany spheres from end<strong>in</strong>g up on the <strong>in</strong>side of the cluster. Lauga <strong>and</strong> Brenner [192] showedthat this process can be accurately modeled with simulations of particles attached to adeformable surface, yield<strong>in</strong>g the experimentally observed structures for all sizes N ≤ 12.Additionally, they argued that the uniqueness of these pack<strong>in</strong>gs can be understood fromgeometrical considerations: the close-packed configurations where all particles are conf<strong>in</strong>edto the surface of a sphere are unique for almost all N, <strong>and</strong> <strong>in</strong> nearly all cases the forceconstra<strong>in</strong>ts <strong>in</strong> the system limit the cluster to a s<strong>in</strong>gle mode of rearrangement, result<strong>in</strong>g <strong>in</strong>a s<strong>in</strong>gle f<strong>in</strong>al configuration.The emulsion evaporation method has been applied to a variety of <strong>systems</strong>, <strong>in</strong>clud<strong>in</strong>gnanoparticles [194–196] <strong>and</strong> <strong>colloidal</strong> spheres mixed with either smaller particles [196, 197]or polymers [198]. In this chapter, we use simulations to <strong>in</strong>vestigate the clusters formed byboth symmetric <strong>and</strong> asymmetric <strong>colloidal</strong> dumbbells <strong>in</strong> evaporat<strong>in</strong>g droplets, <strong>and</strong> comparethe results with experimental results. In the experiments, PMMA (poly-methylmethacrylate)dumbbell particles were produced via an overswell<strong>in</strong>g method. [199] Theresult<strong>in</strong>g particles were dispersed <strong>in</strong> aqueous emulsion droplets suspended <strong>in</strong> an oil phase.After evaporation of the droplets, small clusters of dumbbells rema<strong>in</strong>. The structure ofthese clusters has been studied us<strong>in</strong>g Scann<strong>in</strong>g Electron Microscopy (SEM), <strong>and</strong> showsa larger variety of cluster shapes than those found <strong>in</strong> clusters of spherical particles. Weperformed simulations on a simple model for these droplets where both the particles <strong>and</strong><strong>in</strong>terface are modeled purely as hard-core <strong>in</strong>teractions. When compar<strong>in</strong>g the structures result<strong>in</strong>gfrom the simulations with those found <strong>in</strong> the experiments, we f<strong>in</strong>d good agreementfor the symmetric dumbbells if the dumbbell particles <strong>in</strong> the simulations are constra<strong>in</strong>edto the droplet <strong>in</strong>terface. For the asymmetric dumbbells, we f<strong>in</strong>d that the larger spheresdom<strong>in</strong>ate the cluster shape, <strong>and</strong> we recover the same structures seen <strong>in</strong> clusters of sphereswith no specific order<strong>in</strong>g of the smaller spheres of the dumbbells.8.2 Simulation MethodsWe study the behavior of <strong>colloidal</strong> particles <strong>in</strong> an emulsion dropet dur<strong>in</strong>g the evaporationof the solvent. In the experimental setup, the particle-particle <strong>and</strong> particle-wall <strong>in</strong>teractionsare difficult to determ<strong>in</strong>e <strong>and</strong> will probably change dur<strong>in</strong>g the evaporation process.We assume that the particles are conf<strong>in</strong>ed <strong>in</strong> a spherical cavity that shr<strong>in</strong>ks dur<strong>in</strong>g theevaporation of the droplets. As a first approximation, we model the particles <strong>and</strong> thedroplet <strong>in</strong>terface by hard <strong>in</strong>teractions. As a result, no deformations of the wall from itsspherical shape occur, which is justified <strong>in</strong> the first stage of the evaporation process, i.e.before pack<strong>in</strong>g constra<strong>in</strong>ts become important.We simulate both spherical <strong>and</strong> dumbbell particles. In both cases, our unit of lengthis taken to be σ, the diameter of the largest sphere size. The dumbbells are modeled astwo partially overlapp<strong>in</strong>g hard spheres with diameter ratio q = σ S /σ, at a fixed distanced between the centers. For both <strong>systems</strong>, the center of mass of each sphere is conf<strong>in</strong>edto a spherical simulation box with hard walls. Dur<strong>in</strong>g the simulations, the pressure isslowly <strong>in</strong>creased from P ∗ = P σ 3 /k B T = 1 to 20 to mimic the evaporation of the droplet.At P ∗ = 20, the particles no longer have enough freedom of movement to rearrange, but
114 Chapter 8still vibrate. To fix the structure, the pressure is then <strong>in</strong>creased to P ∗ = 100, effectivelylead<strong>in</strong>g to a fully jammed state.In our simulations, we consider two different regimes for the particle wettability. Inthe non-wett<strong>in</strong>g regime (contact angle cos θ = 1), the particles can move freely with<strong>in</strong> thespherical cavity under the constra<strong>in</strong>t that the particles do not overlap with each other orthe droplet <strong>in</strong>terface. For f<strong>in</strong>ite wettability (−1 < cos θ < 1), the particles are attached atthe droplet <strong>in</strong>terface by an adsorption free energy [200] which we model by conf<strong>in</strong><strong>in</strong>g thecenter of mass of the particles to a th<strong>in</strong> spherical shell with thickness d S = 0.1σ S at thedroplet surface, where σ S is the diameter of the smallest sphere <strong>in</strong> the system. We f<strong>in</strong>dthat the f<strong>in</strong>al structure of the cluster is not affected by the shell thickness d S , providedthat d S ≪ σ S .Manoharan et al. suggested [185] that after reach<strong>in</strong>g this spherical pack<strong>in</strong>g stage,further evaporation of the droplet <strong>in</strong>duces a reorganization of the particles due to theattractive Van der Waals <strong>in</strong>teractions, which reduces the second moment of the massdistribution <strong>in</strong> the system. To model the second stage of the evaporation process, weuse the jammed spherical clusters obta<strong>in</strong>ed from the spherical compression simulations,remove the spherical conf<strong>in</strong>ement, <strong>and</strong> use a st<strong>and</strong>ard Monte Carlo scheme to m<strong>in</strong>imizeM 2 . In this simulation, the total energy of the system is taken to be proportional to M 2 ,with a dimensionless proportionality constant α that is <strong>in</strong>creased slowly to anneal thecluster to a local potential energy m<strong>in</strong>imum:N sβU(r N ∑s ) = α m i |r i − r 0 | 2 /σ 2 , (8.3)i=1with β = 1/k B T , k B Boltzmann’s constant, T the temperature, σ the sphere diameter,<strong>and</strong> N s the number of spheres <strong>in</strong> the cluster. In the case of dumbbell particles, each sphereis counted separately <strong>in</strong> the summation. The (dimensionless) mass m i is only importantif multiple sphere sizes appear <strong>in</strong> the system, <strong>and</strong> is taken to be 1 for the largest spheresize <strong>in</strong> the system. The strength of the potential α is <strong>in</strong>creased from 100 to 1000, at whichpo<strong>in</strong>t no further reorganization is observed. The system is then quenched at α = 10000 toremove any further vibrations. For the results presented below, both the compression <strong>and</strong>anneal<strong>in</strong>g parts of the simulation consist of 8 · 10 6 Monte Carlo cycles. We also performedsimulations with lower compression <strong>and</strong> anneal<strong>in</strong>g rates, but found similar results for thef<strong>in</strong>al clusters.8.3 Results8.3.1 SpheresSeveral experimental studies have shown that <strong>colloidal</strong> spheres conf<strong>in</strong>ed to emulsiondroplets form unique clusters for sizes N ≤ 16 upon slow evaporation. [185–187] Asa test of our method, we first apply it to clusters of spherical particles, with cluster sizes2 ≤ N ≤ 16. We study the result<strong>in</strong>g pack<strong>in</strong>g of spheres <strong>in</strong> a shr<strong>in</strong>k<strong>in</strong>g spherical cavity fornon-wettable particles <strong>and</strong> wettable particles which are adsorbed at the <strong>in</strong>terface. Subsequently,we employ the result<strong>in</strong>g spherical pack<strong>in</strong>gs <strong>in</strong> MC simulations to m<strong>in</strong>imize M 2 ,
Assembly of <strong>colloidal</strong> spheres <strong>and</strong> dumbbells through emulsion dropletevaporation 115thereby mimick<strong>in</strong>g the f<strong>in</strong>al stage of the evaporation process. We present the results ofthe pack<strong>in</strong>g before <strong>and</strong> after m<strong>in</strong>imiz<strong>in</strong>g M 2 for both wettable <strong>and</strong> non-wettable particles<strong>in</strong> Table 8.1. We f<strong>in</strong>d that the cluster configuration for cluster size N = 4 <strong>and</strong> 6, area tetrahedron <strong>and</strong> an octahedron respectively, <strong>in</strong>dependent of the particle wettability orM 2 m<strong>in</strong>imization. For N = 5, 7, 8, 9 <strong>and</strong> 10, we f<strong>in</strong>d that the configurations are <strong>in</strong>dependentof the particle wettability, but different structures are observed before <strong>and</strong> afterthe M 2 m<strong>in</strong>imization. The f<strong>in</strong>al configurations are the triangular dipyramid (N = 5),pentagonal dipyramid (N = 7), snub disphenoid (N = 8), triaugmented triangular prism(N = 9), <strong>and</strong> the gyroelongated square dipyramid (N = 10). The configurations forN = 11, 13, 14, 15 <strong>and</strong> 16 are all different <strong>and</strong> depend on the particle wettability <strong>and</strong> theM 2 m<strong>in</strong>imization. For N = 12, we f<strong>in</strong>d that the configurations depend on the particlewettability, but not on the M 2 m<strong>in</strong>imization.We now compare the result<strong>in</strong>g structures with the experiments on polystyrene, silica<strong>and</strong> PMMA spheres <strong>in</strong> toluene or hexane droplets suspended <strong>in</strong> water by Manoharan[185] <strong>and</strong> the experiments on water-borne polystyrene <strong>and</strong> silica spheres <strong>in</strong> water-<strong>in</strong>oilemulsions by Cho.[187] Dur<strong>in</strong>g the evaporation process, the polystyrene, silica <strong>and</strong>PMMA spheres <strong>in</strong> Ref. [185, 186] are attached at the droplet <strong>in</strong>terface <strong>and</strong> as expectedthe observed clusters with N ≤ 12 match with our predictions for wettable particles afterM 2 m<strong>in</strong>imization, with one exception: for cluster size N = 11, the non-convex structureseen by Manoharan only appears for non-wettable particles.In the experiments by Cho, [187] the water-borne particles form the same clusters asobserved <strong>in</strong> Ref. [185, 186], but additional isomeric structures were found for N = 7, 8,<strong>and</strong> 11. As the isomeric clusters correspond to the optimal sphere pack<strong>in</strong>gs for particles<strong>in</strong>teract<strong>in</strong>g with a Coulomb potential, it was argued by Cho that the electrostatic repulsionbetween the polystyrene <strong>and</strong> silica spheres caused the formation of these Coulombclusters: the stronger electrostatic repulsion between the particles prevents the reorganizationof the cluster <strong>in</strong> the second stage of the evaporation process. [187] The isomericclusters for N = 7 <strong>and</strong> 8 agree well with our predictions before the M 2 m<strong>in</strong>imizationwhich are <strong>in</strong>dependent of the wettability of the particles. For N = 11, the two isomericstructures found correspond to those we found for wettable particles before <strong>and</strong> after M 2m<strong>in</strong>imization (for silica <strong>and</strong> polystyrene spheres, respectively).For larger clusters (N > 12), no clear match between simulations <strong>and</strong> experiments canbe found. Nonetheless, it is clear that for sufficiently small clusters, our method providesa good <strong>in</strong>dication of the types of structures that can be expected <strong>in</strong> clusters formed byevaporation of emulsion droplets with spherical particles.8.3.2 Symmetric dumbbellsWhile spheres already provide a variety of cluster shapes depend<strong>in</strong>g on the number of particlesper cluster, new structures can be obta<strong>in</strong>ed by replac<strong>in</strong>g the spheres with anisotropicparticles. As a simple example, we consider <strong>colloidal</strong> dumbbells.In the experiments by Peng et al.,[201] both symmetric <strong>and</strong> asymmetric <strong>colloidal</strong>dumbbells were synthesized <strong>and</strong> dispersed <strong>in</strong> emulsion droplets. After evaporat<strong>in</strong>g theemulsion droplets, the result<strong>in</strong>g clusters were observed via Scann<strong>in</strong>g Electron Microscopy(SEM). The symmetric dumbbells consisted of two spheres, each with a diameter σ =
116 Chapter 8N Non-wettable Wettable Mano- Chobefore after before after haran Polyst. Silica4 a a a a a5 a b a b b6 a a a a a7 a b a b b a8 a b a b b a a9 a b a b b10 a b a b b11 a b c d b d c12 a a b b b13 a b c d e14 a b c d e15 a b c d e16 a b c dTable 8.1: Structures found from simulations of spherical particles <strong>in</strong> evaporat<strong>in</strong>g droplets,<strong>and</strong> experimental results. The first column shows the number of particles N. The next twocolumns show the results if the particles are not conf<strong>in</strong>ed to the droplet <strong>in</strong>terface, both before<strong>and</strong> after m<strong>in</strong>imiz<strong>in</strong>g M 2 . The fourth <strong>and</strong> fifth column show the configurations result<strong>in</strong>g fromfix<strong>in</strong>g the particles to the droplet <strong>in</strong>terface. The last columns show the experimental results byManoharan et al.[185] <strong>and</strong> the additional structures seen by Cho et al. [187]The letters denote structures that are (almost) the same for the same cluster size.
Assembly of <strong>colloidal</strong> spheres <strong>and</strong> dumbbells through emulsion dropletevaporation 1171.42 µm, <strong>and</strong> a distance d = 0.5σ between the two centers. In the experiments, thedumbbells formed a series of structures different from those found when us<strong>in</strong>g sphericalparticles, often with several different configurations per cluster size.We performed simulations of hard dumbbells with sizes correspond<strong>in</strong>g to the experimentalsystem us<strong>in</strong>g the same methods as we used for spheres. In contrast to clusters ofspherical particles, but <strong>in</strong> agreement with the experimental snapshots, these simulationsresult <strong>in</strong> multiple isomeric configurations. Even with slow compression speeds, the systemcan reach several dist<strong>in</strong>ct states. Interest<strong>in</strong>gly, for cluster sizes N = 3 <strong>and</strong> 6, two mirroredstructures appear with a different chirality, a property that is absent <strong>in</strong> the clusters ofspherical particles.In the experimental setup, the particles were seen to stick to the oil-water <strong>in</strong>terfacebefore the evaporation of the emulsion droplets. In our simulations, we <strong>in</strong>deed f<strong>in</strong>d betteragreement with the experimental snapshots <strong>in</strong> the case of particles with f<strong>in</strong>ite wettability:for small cluster sizes (N < 5) wettability does not affect the structures formed, but forall larger cluster sizes N ≥ 5 good agreement was only found for wettable particles. Table8.2 shows the configurations obta<strong>in</strong>ed from simulations of wettable particles, matchedwith experimental snapshots where possible. For cluster sizes N = 2 <strong>and</strong> 4, only onecluster shape is found, with no significant changes after M 2 m<strong>in</strong>imization. Cluster sizesN = 3 <strong>and</strong> 6 both show a s<strong>in</strong>gle structure as well, but each has an isomer that is itsmirror image. Both structures show rotational symmetry over a 120 ◦ angle. For N = 6,the cluster deforms slightly dur<strong>in</strong>g M 2 m<strong>in</strong>imization, but stays qualitatively the same.For cluster size N = 5, only a s<strong>in</strong>gle (highly asymmetric) structure is found, with somereorganization dur<strong>in</strong>g the f<strong>in</strong>al m<strong>in</strong>imization step. For all clusters up to size N = 6, almostall experimental snapshots agree well with the structures found before M 2 m<strong>in</strong>imization,<strong>and</strong> the small changes dur<strong>in</strong>g the m<strong>in</strong>imization step do not break this agreement. Forlarger clusters (N ≥ 7), we still f<strong>in</strong>d good agreement between the spherical pack<strong>in</strong>gs <strong>and</strong>experiments, although a number of different isomeric structures can also result from thesame simulations. While one of the experimental snapshots for N = 8 was best matchedby a configuration after M 2 m<strong>in</strong>imization, this m<strong>in</strong>imization step generally reduced theagreement between simulation <strong>and</strong> experiment. Moreover, the f<strong>in</strong>al configurations oftenshowed a clearly visible central particle <strong>in</strong> the cluster (such as the one shown for N = 10<strong>in</strong> Table 8.2), which was absent <strong>in</strong> the experimental snapshots.Apart from cluster sizes N = 2, 3, 4 <strong>and</strong> 6, the clusters obta<strong>in</strong>ed from symmetricdumbbells do not appear symmetric themselves. While it seems likely the larger clustersizes would behave more or less as spherical particles with some degree of surface roughnesswhen used as <strong>colloidal</strong> build<strong>in</strong>g blocks, these smaller clusters sizes could well provide amore <strong>in</strong>terest<strong>in</strong>g phase behavior.8.3.3 Asymmetric dumbbellsThe same experiment was applied to asymmetric <strong>colloidal</strong> dumbbells, where one of thetwo spheres <strong>in</strong> each dumbbell is smaller than the other. In this case, the diameters of thesmaller <strong>and</strong> larger spheres were σ S = 1.03µm <strong>and</strong> σ = 1.42µm, respectively, correspond<strong>in</strong>gto a size ratio of q = 0.73. The centers of the two spheres are d = 0.37σ apart. For theseparticles, an even larger variety was observed <strong>in</strong> the result<strong>in</strong>g clusters, particularly <strong>in</strong> the
118 Chapter 8N Sim. Exp. Sim. Exp. M 2 Exp.2 a a a3 a a a a a4 a a a a a5 a a a a a6 a a a a a7 a a a a b8 a b c c9 a a b10 a b11 a a b b cTable 8.2: Comparison of experimental clusters of symmetric dumbbells with simulation resultsof wettable particles. The first column shows the number of dumbbells N <strong>in</strong> the cluster. Thesecond <strong>and</strong> fourth columns show configurations result<strong>in</strong>g from simulations, next to similar configurationsobserved <strong>in</strong> experiments <strong>in</strong> the third <strong>and</strong> fifth column (where available). The fourthcolumn shows the results after m<strong>in</strong>imiz<strong>in</strong>g M 2 from a typical spherically packed configuration,compared with a match<strong>in</strong>g experimental cluster <strong>in</strong> the last column cluster size N = 8. Theletters <strong>in</strong>dicate clusters with (almost) the same structure.
Assembly of <strong>colloidal</strong> spheres <strong>and</strong> dumbbells through emulsion dropletevaporation 119position<strong>in</strong>g of the small spheres. Table 8.3 shows two experimental snapshots for eachcluster size 2 ≤ N ≤ 12. Apparently, the locations of the smaller parts of the dumbbellsare not strongly determ<strong>in</strong>ed by the forces that form the cluster. In fact, regardless ofthe positions of the small spheres, the configurations of large spheres closely resemble thestructures found <strong>in</strong> clusters of spherical particles, as shown by the last column <strong>in</strong> Table8.3.When apply<strong>in</strong>g the same simulation method to this system, the configurations foundafter the compression step do not agree with the experimental snapshots for either wettableor non-wettable particles. Clear differences <strong>in</strong> the positions of the large spheres canbe seen, <strong>and</strong> the small spheres generally still have limited freedom of movement before M 2m<strong>in</strong>imization, rather than be<strong>in</strong>g mechanically arrested due to contacts with other spheresas seen <strong>in</strong> the experimental snapshots. When m<strong>in</strong>imiz<strong>in</strong>g the second moment of the massdistribution, the result<strong>in</strong>g configuration is <strong>in</strong>fluenced by the mass ratio m S /m L of thesmall <strong>and</strong> large spheres. Of course, as the m<strong>in</strong>imization of M 2 is only an empirical modelfor the f<strong>in</strong>al stages of droplet evaporation, the “mass” <strong>in</strong> this context is not physicallyl<strong>in</strong>ked to the real mass of the sphere. Simply lett<strong>in</strong>g the mass of each sphere scale withits volume, such that m S /m L = σ 3 S/σ 3 , generally leads to configurations with the smallerspheres preferentially resid<strong>in</strong>g <strong>in</strong> the center of the cluster, which deviates from the experimentalobservations. Reduc<strong>in</strong>g the effect of the positions of small spheres on M 2 yieldsmuch better agreement with the experimental observations. The result<strong>in</strong>g clusters are<strong>in</strong>dependent of the exact mass ratio, as long as 0 < m S /m L ≪ σ 3 S/σ 3 : all that appearsto be required is a strong preference for large spheres to be near the center of the cluster,<strong>and</strong> a weak contribution of the small spheres to prevent any freedom of movement <strong>in</strong>the f<strong>in</strong>al configuration. In Table 8.3, the simulation results for wettable particles withm S /m L = 0.1σ 3 S/σ 3 are shown both before <strong>and</strong> after M 2 m<strong>in</strong>imization. For all clustersizes shown, the structure of the large spheres <strong>in</strong> the f<strong>in</strong>al configuration agrees with thoseseen <strong>in</strong> experiments, with the positions of the small particles vary<strong>in</strong>g between differentsimulation runs <strong>and</strong> experimental snapshots.The effect of particle wettability is largely the same as <strong>in</strong> the case of spherical particles:for all cluster sizes N ≤ 10, the large spheres end up <strong>in</strong> the same configuration after M 2m<strong>in</strong>imization. For cluster size N = 11, we now see both the convex <strong>and</strong> non-convexconfigurations appear, regardless of particle wettability. However, at cluster size N = 12non-wettable particles show a central particle that is absent <strong>in</strong> the experimental snapshots,result<strong>in</strong>g <strong>in</strong> slightly better overall agreement if the particles are assumed to be wettable.In short, asymmetric dumbbells at this size ratio do not seem to mean<strong>in</strong>gfully affect theconfiguration of large spheres <strong>in</strong> the result<strong>in</strong>g clusters when compared to spherical particles.However, for small clusters, the presence of the small spheres could still significantlyaffect the phase behavior of the newly formed <strong>colloidal</strong> build<strong>in</strong>g blocks. For example, thesmall spheres will likely have a strong <strong>in</strong>fluence on the densest pack<strong>in</strong>g crystal phases forthese cluster sizes.
120 Chapter 8N Sim. M 2 Exp. Exp. Sph.23456789101112Table 8.3: Comparison simulation results for wettable asymmetric dumbbells (size ratio 0.73)with experimental snapshots. The first column shows the number of dumbbells N <strong>in</strong> the cluster.The second column shows a typical configuration after the compression step, <strong>and</strong> the thirdcolumn the result<strong>in</strong>g configuration after m<strong>in</strong>imiz<strong>in</strong>g M 2 , us<strong>in</strong>g a mass ratio m S /m L = 0.1σ 3 S σ3 .The next two columns show experimental snapshots of two different clusters. Note that <strong>in</strong> bothsimulations <strong>and</strong> experiments, there are variations <strong>in</strong> the positions of the small spheres. The lastcolumn shows the pack<strong>in</strong>g of spherical particles that corresponds to the configuration of largespheres <strong>in</strong> the observed clusters.
Assembly of <strong>colloidal</strong> spheres <strong>and</strong> dumbbells through emulsion dropletevaporation 1218.4 ConclusionsIn summary, we have <strong>in</strong>vestigated the effect of a shr<strong>in</strong>k<strong>in</strong>g spherical conf<strong>in</strong>ement on <strong>systems</strong>of both wettable <strong>and</strong> non-wettable <strong>colloidal</strong> particles, as a simple model for particlestrapped <strong>in</strong> evaporat<strong>in</strong>g emulsion droplets. After compression, the second moment of themass distribution M 2 of the obta<strong>in</strong>ed spherical pack<strong>in</strong>g was m<strong>in</strong>imized. For sphericalparticles, this technique results <strong>in</strong> clusters that show good agreement with those found<strong>in</strong> earlier experimental studies. When apply<strong>in</strong>g the same method to symmetric <strong>colloidal</strong>dumbbells, we obta<strong>in</strong>ed clusters very similar to those <strong>in</strong> an experimental setup even beforethe M 2 m<strong>in</strong>imization step, particularly for wettable particles. This suggests thatthe structures found for this system are ma<strong>in</strong>ly determ<strong>in</strong>ed by the densest pack<strong>in</strong>g ofdumbbells on a spherical surface.For asymmetric dumbbells with size ratio q = 0.73, the larger spheres strongly dom<strong>in</strong>atesthe process that shapes the cluster: <strong>in</strong> the result<strong>in</strong>g configurations the large spheresform the same structures as observed <strong>in</strong> clusters of spherical particles, while the smallspheres can be found <strong>in</strong> a variety of configurations. To model this, a relatively small effectivemass m S ≪ m L σS/σ 3 3 has to be assigned to the small spheres <strong>in</strong> the M 2 m<strong>in</strong>imizationstep.For almost all clusters considered, fix<strong>in</strong>g the particles to the droplet <strong>in</strong>terface dur<strong>in</strong>gthe compression step yields either the same results or a configuration <strong>in</strong> closer agreementwith experimental snapshots. From the available experimental data, the model usedappears to be able to give good qualitative predictions for possible structures of clustersformed <strong>in</strong> emulsion droplet evaporation experiments for particles consist<strong>in</strong>g of one or morespheres.8.5 AcknowledgementsI would like to thank Bo Peng for perform<strong>in</strong>g all of the experimental work on <strong>colloidal</strong>dumbbells discussed <strong>in</strong> this chapter.
9Crystallization of <strong>colloidal</strong> spheres<strong>in</strong> evaporat<strong>in</strong>g emulsion dropletsThe slow evaporation of emulsion droplets conta<strong>in</strong><strong>in</strong>g colloids or nanoparticles providesa straightforward method of produc<strong>in</strong>g compact clusters. The structure of the clustersresult<strong>in</strong>g from this process is determ<strong>in</strong>ed both by the bulk phase behavior of the particles<strong>and</strong> the conf<strong>in</strong><strong>in</strong>g effects of the droplet <strong>in</strong>terface. In this chapter, we study crystallizationof hard spheres <strong>in</strong> an evaporat<strong>in</strong>g droplet, modeled as a slowly shr<strong>in</strong>k<strong>in</strong>g spherical wallconf<strong>in</strong><strong>in</strong>g the cluster, <strong>and</strong> compare our results with experimental observations of clustersof nanoparticles. The orientation of the crystall<strong>in</strong>e doma<strong>in</strong>s that appear <strong>in</strong> the cluster isstrongly <strong>in</strong>fluenced by the presence of the conf<strong>in</strong><strong>in</strong>g wall, lead<strong>in</strong>g to frustrations betweenmultiple doma<strong>in</strong>s that grow <strong>in</strong>ward from the droplet <strong>in</strong>terface to the center of the cluster.Suppress<strong>in</strong>g surface order<strong>in</strong>g on the droplet <strong>in</strong>terface by add<strong>in</strong>g a long-range repulsivewall-particle potential limits cluster growth on the surface of the cluster <strong>and</strong> leads tomuch larger cont<strong>in</strong>uous crystal doma<strong>in</strong>s. Additionally, we <strong>in</strong>vestigate the effect of <strong>systems</strong>ize <strong>and</strong> square-shoulder repulsions between the particles on the crystallization process,but f<strong>in</strong>d no qualitative differences <strong>in</strong> the result<strong>in</strong>g crystal doma<strong>in</strong>s.
124 Chapter 99.1 IntroductionEmulsion droplet evaporation has proven to be a useful experimental method for produc<strong>in</strong>gcompact clusters of either colloids or nanoparticles. [185, 194–196] In the previouschapter, we <strong>in</strong>vestigated the structures formed by <strong>colloidal</strong> spheres <strong>and</strong> dumbbells on thesurface of small evaporat<strong>in</strong>g emulsion droplets. The small number of particles (N < 16)on these droplets lead to largely monodisperse clusters for each cluster size with a welldef<strong>in</strong>edshape. In this case, the behavior of the particles is dom<strong>in</strong>ated by the presenceof the spherical conf<strong>in</strong>ement. In larger clusters, the bulk phase behavior of the particlesstarts to play an important role. In the limit of sufficiently large droplets, the <strong>in</strong>fluence ofthe droplet <strong>in</strong>terface is negligible, <strong>and</strong> the behavior of the particles is determ<strong>in</strong>ed by theslowly <strong>in</strong>creas<strong>in</strong>g density of the system. Assum<strong>in</strong>g the evaporation rate is low enough toallow the particles to reach equilibrium dur<strong>in</strong>g the evaporation of the droplet, the systemwill follow the bulk phase behavior of the particles. For example, if the colloids <strong>in</strong>sidethe droplets can be effectively described as hard spheres, we expect a face-centered-cubic(FCC) structure to appear at high densities, with possible stack<strong>in</strong>g errors lead<strong>in</strong>g to r<strong>and</strong>omhexagonally close-packed (RHCP) structures. In a bulk system, these crystals wouldnucleate at r<strong>and</strong>om locations, but the presence of an <strong>in</strong>terface can significantly affect thenucleation of crystals. In particular, it is well known that flat <strong>in</strong>terfaces assist crystal formation,strongly <strong>in</strong>creas<strong>in</strong>g nucleation rates.[202] The same effect has been demonstratedfor both concave <strong>and</strong> convex spherical surfaces with a sufficiently large radius of curvaturecompared to the particle diameter.[203] As a result, the presence of spherical conf<strong>in</strong>ementis expected to <strong>in</strong>crease the rate of crystal nucleation at the edge of the droplet, potentiallylead<strong>in</strong>g to multiple doma<strong>in</strong>s aligned with the droplet <strong>in</strong>terface at different locations.In this chapter, we <strong>in</strong>vestigate the crystallization of hard spheres conf<strong>in</strong>ed <strong>in</strong> evaporat<strong>in</strong>gemulsion droplets modeled as a shr<strong>in</strong>k<strong>in</strong>g spherical conf<strong>in</strong>ement, us<strong>in</strong>g Event-DrivenMolecular Dynamics (EDMD) simulations. We compare our results with experimentalf<strong>in</strong>d<strong>in</strong>gs <strong>in</strong> <strong>systems</strong> of nanoparticles <strong>in</strong> droplets of cyclohexane suspended <strong>in</strong> an aqueoussolution. In particular, we study the shape <strong>and</strong> size of the crystall<strong>in</strong>e doma<strong>in</strong>s formeddur<strong>in</strong>g the evaporation process, <strong>and</strong> <strong>in</strong>vestigate the effect of the number of particles onthe result<strong>in</strong>g crystall<strong>in</strong>ity. Additionally, we <strong>in</strong>vestigate the effect of a repulsive potentialbetween the particles, <strong>and</strong> study the order<strong>in</strong>g of the spheres at the surface of the cluster.9.2 MethodsWe study the behavior of <strong>colloidal</strong> hard spheres with diameter σ <strong>in</strong> a shr<strong>in</strong>k<strong>in</strong>g sphericalconf<strong>in</strong>ement, for system sizes <strong>in</strong> the range of 2000 to 64000 particles. The pair <strong>in</strong>teractionof the particles is given by{∞,βU HS rij < σ(r ij ) =0, r ij ≥ σ , (9.1)with r ij the center-of-mass distance between particles i <strong>and</strong> j. In addition, we exam<strong>in</strong>e theeffect of a square-shoulder repulsion potential U rep added to the hard-sphere potential:{ɛ, r < qβU rep (r) =0, r ≥ q , (9.2)
Crystallization of <strong>colloidal</strong> spheres <strong>in</strong> evaporat<strong>in</strong>g emulsion droplets125where q is the <strong>in</strong>teraction range, ɛ denotes the height of the repulsive shoulder, <strong>and</strong>β = 1/k B T with k B Boltzmann’s constant <strong>and</strong> T the temperature of the system.We employ Event-Driven Molecular Dynamics simulations, as described <strong>in</strong> Chapter1. The diameter σ of the spheres is taken as our unit √of length, <strong>and</strong> the mass m of theparticles as the unit of mass. The time unit is τ = mσ 2 /k B T . The emulsion droplet<strong>in</strong>terface is implemented as a hard spherical wall with a radius R that l<strong>in</strong>early decreases<strong>in</strong> time at rate v R . The center of mass of each particle is conf<strong>in</strong>ed to the to the sphericalcavity by a wall-particle potential{∞, r ≥ RβU wall (r) =0, r < R , (9.3)with r the distance of the center of mass of the particle to the center of the cavity.Simulations are started <strong>in</strong> a homogeneous r<strong>and</strong>om configuration at a low pack<strong>in</strong>g fractionη = Nσ 3 /8R 3 ≃ 0.3. S<strong>in</strong>ce crystallization is only expected to beg<strong>in</strong> at significantlyhigher pack<strong>in</strong>g fractions, the system is first compressed relatively quickly to a higher pack<strong>in</strong>gfraction η = 0.45, well below the hard-sphere crystallization po<strong>in</strong>t at η = 0.492.[17]Snapshots of the system at this pack<strong>in</strong>g fraction did not show any sign of crystallization.To keep the temperature of the system constant dur<strong>in</strong>g compression, we use an Andersenthermostat: at regular <strong>in</strong>tervals dur<strong>in</strong>g the simulation, a r<strong>and</strong>om selection of particlesare selected <strong>and</strong> given new velocities taken from a Boltzmann distribution. As the systemapproaches a jammed state, both the pressure <strong>and</strong> the amount of energy added to thesystem per time unit due to compression <strong>in</strong>crease more <strong>and</strong> more rapidly. As a result, atsome po<strong>in</strong>t the <strong>in</strong>crease <strong>in</strong> temperature is faster than can be controlled by the thermostat,<strong>and</strong> the number of collisions per time unit diverges due to the faster movement of theparticles, slow<strong>in</strong>g down the speed of the simulation until it has effectively stopped. Atthis po<strong>in</strong>t, the simulation is ended, <strong>and</strong> we compare the f<strong>in</strong>al snapshots with experimentalresults.To <strong>in</strong>troduce wall-particle <strong>in</strong>teraction <strong>in</strong> the system, spherical <strong>in</strong>terfaces correspond<strong>in</strong>gto steps <strong>in</strong> potential energy can be added to the system. In our simulations, we approximateseveral cont<strong>in</strong>uous wall-particle <strong>in</strong>teraction potentials us<strong>in</strong>g 30 concentric spherical<strong>in</strong>terfaces at distance R i from the center of the cavity, with i = 1, . . . , 30. The <strong>in</strong>terfacesare evenly spaced between the outermost shell at distance R 30 = R from the center, <strong>and</strong>the <strong>in</strong>nermost shell at R 1 = R − 4σ. The outer <strong>in</strong>terface still functions as a hard conf<strong>in</strong>ement,while the potential energy of a particle at a distance r from the center of the cavityis given byThe values of ɛ walli⎧⎪⎨βU wall (r) =⎪⎩∞, r ≥ Rɛ walli , R i < r ≥ R i+1 . (9.4)0, r < R 1are based on a cont<strong>in</strong>uous particle-wall potential V wall (r), such thatɛ walli = βV wall (R i ) (9.5)We <strong>in</strong>vestigate the crystall<strong>in</strong>e doma<strong>in</strong>s <strong>in</strong>side the cluster us<strong>in</strong>g the orientational bondorderparameter q 6 , as described <strong>in</strong> Chapter 7. The bond length cutoff was chosen to ber c = 1.4σ, the bond order cutoff d c = 0.6, <strong>and</strong> the m<strong>in</strong>imum number of neighbors required
126 Chapter 9for a particle to be considered crystall<strong>in</strong>e was ξ c = 7. Additionally, crystall<strong>in</strong>e doma<strong>in</strong>sare dist<strong>in</strong>guished by the requirement that the dot product between the q-vectors of twoparticles <strong>in</strong> the same doma<strong>in</strong> is at least d dom = 0.9.We compare our results to an experimental system of nanoparticles consist<strong>in</strong>g of aniron oxide (FeO) core surrounded by a shell of iron cobalt oxide (CoFe 2 O 4 ), which <strong>in</strong> turnis coated with a layer of surfactant (oleic acid). The surfactant layer functions like a softshell prevent<strong>in</strong>g aggregation. These particles are synthesized accord<strong>in</strong>g to the methoddescribed <strong>in</strong> Ref. [204]. The particles have a core diameter of 6.5 nm <strong>and</strong> a polydispersityof 2% (not <strong>in</strong>clud<strong>in</strong>g the soft shell, which makes them more monodisperse). Measurements<strong>in</strong> 2D images of crystall<strong>in</strong>e doma<strong>in</strong>s give a typical <strong>in</strong>terparticle distance of 9.5 nm. Thiswould imply that the thickness of the soft shell is on the order of 1.5 nm, not tak<strong>in</strong>g <strong>in</strong>toaccount the effects of compression. Additionally, we <strong>in</strong>vestigated larger particles with acore diameter of 18 nm.To form clusters, we suspend 7 mg of nanoparticles <strong>in</strong> 2 ml of cyclohexane. Thissuspension is added to a mixture of 10 ml of purified water, 400 mg of Dextran (2M)<strong>and</strong> 70 mg of sodium dodecyl sulphate. The prepared solution is sheared at 7500 rpm ata radius of 2.5 cm with a space of 0.1 mm result<strong>in</strong>g <strong>in</strong> a nearly monodisperse emulsion.The emulsion is heated to 80 ◦ C for 4 hours to evaporate the cyclohexane <strong>and</strong> the rema<strong>in</strong><strong>in</strong>gclusters are washed three times by centrifug<strong>in</strong>g <strong>and</strong> redispers<strong>in</strong>g <strong>in</strong> ultrapure water.Analysis was performed us<strong>in</strong>g a Tecnai20 electron microscope. The sample was depositedon a TEM-grid together with 18 nm gold markers, <strong>and</strong> cooled to -180 ◦ C us<strong>in</strong>g liquidnitrogen. The sample was then heated to -85 ◦ C under high vacuum <strong>in</strong> order to sublimatethe water <strong>and</strong> freeze dry the clusters. This was done to preserve the shape <strong>and</strong> structureof the clusters <strong>and</strong> to prevent capillary forces dur<strong>in</strong>g dry<strong>in</strong>g. The images were taken aftercool<strong>in</strong>g the sample down aga<strong>in</strong> to a temperature of -180 ◦ C.To analyze the crystal structure of the result<strong>in</strong>g clusters, we determ<strong>in</strong>ed the 3D coord<strong>in</strong>atesof the nanoparticles us<strong>in</strong>g electron tomography. Crystall<strong>in</strong>e clusters are thendetected us<strong>in</strong>g the same method as applied to the simulated clusters. To account forerrors <strong>in</strong> the measurement of the particle positions, the cluster criterion is chosen to beless strict, us<strong>in</strong>g ξ c = 4 <strong>and</strong> d dom = 0.85.9.3 Results9.3.1 Colloidal hard spheres <strong>in</strong> a hard spherical cavityTo <strong>in</strong>vestigate the effects of the rate of compression on the cluster, we simulate <strong>systems</strong>of N = 4000 hard spheres <strong>in</strong>side a spherical shell, for a range of compression speedsv R . Typical snapshots for a low compression speed v R = 10 −5 σ/τ are shown <strong>in</strong> Fig.9.1. Different crystall<strong>in</strong>e doma<strong>in</strong>s are <strong>in</strong>dicated with different colors, with light bluedenot<strong>in</strong>g particles <strong>in</strong> a fluid environment. For compression speeds higher than 10 −3 σ/τ,the amount of crystall<strong>in</strong>e order is significantly less, as the system has less time to arrange<strong>in</strong>to an ordered configuration dur<strong>in</strong>g the compression. Vary<strong>in</strong>g the compression speedbelow v R = 10 −4 σ/τ does not significantly affect the result<strong>in</strong>g configuration.When observ<strong>in</strong>g the crystallization of the cluster dur<strong>in</strong>g the simulation, crystall<strong>in</strong>eclusters are always seen to appear at the edge of the droplet, aided by the presence of
Crystallization of <strong>colloidal</strong> spheres <strong>in</strong> evaporat<strong>in</strong>g emulsion droplets127the conf<strong>in</strong><strong>in</strong>g <strong>in</strong>terface. At pack<strong>in</strong>g fractions near the fluid coexistence density (η f =0.492[17]), several crystall<strong>in</strong>e layers are already observed at the edge, form<strong>in</strong>g a basis forfurther crystal growth as the density of the system <strong>in</strong>creases. As a result, crystals growout more or less cont<strong>in</strong>uously with <strong>in</strong>creas<strong>in</strong>g density: no real nucleation effect is requiredfor further crystallization, <strong>and</strong> the crystal grows <strong>in</strong>wards from multiple direction at once,result<strong>in</strong>g <strong>in</strong> several wedge-shaped crystall<strong>in</strong>e doma<strong>in</strong>s with different orientations po<strong>in</strong>t<strong>in</strong>gtowards the center of the cluster.While the wedge-shaped doma<strong>in</strong>s are locally aligned with the wall, the curvature ofthe spherical surface frustrates the first two crystall<strong>in</strong>e layers, caus<strong>in</strong>g these to becomeless ordered. Thus, <strong>in</strong> Fig. 9.1, the crystall<strong>in</strong>e doma<strong>in</strong>s start several layers away from thedroplet surface. This can be compared with a similar effect seen <strong>in</strong> nucleation of hardspheres at the <strong>in</strong>terface of a convex spherical seed particle, where the result<strong>in</strong>g crystalnucleus was even seen to detach from the surface after a sufficiently large cluster size wasreached. [203] We observed similar wedge-shaped doma<strong>in</strong>s <strong>in</strong> the experimental system, asshown on the left <strong>in</strong> Fig. 9.2. A typical electron microscopy snapshot is also shown.In some of the clusters <strong>in</strong> both the experiments <strong>and</strong> simulations, the wedge-shapedclusters show signs of icosahedral symmetry. Figure 9.3 shows both a snapshot of acluster of N = 4000 hard spheres <strong>and</strong> an experimental cluster. In both clusters, five-foldsymmetry of the crystall<strong>in</strong>e doma<strong>in</strong>s can clearly be seen from multiple directions. Whilenot all doma<strong>in</strong>s are perfectly tetrahedral, they can be seen to form 20 roughly equalclusters arranged <strong>in</strong>to an icosahedron.While the <strong>in</strong>terparticle <strong>and</strong> particle-wall <strong>in</strong>teractions <strong>in</strong> the experimental system arenot likely to be strictly hard-core, the qualitative agreement between experiments <strong>and</strong>simulations suggests that the structures formed <strong>in</strong> clusters produced via emulsion dropletevaporation can be modeled effectively by a simple hard-sphere approximation <strong>in</strong> at leastsome cases. As a result, we can use this model to study the effects of system size <strong>and</strong>wall-particle <strong>in</strong>teractions on the structure of the cluster, <strong>and</strong> to study the order<strong>in</strong>g ofparticles on the cluster surface <strong>in</strong> more detail.In clusters conta<strong>in</strong><strong>in</strong>g more particles, the larger radius of curvature of the droplet surfaceallows the orientation of the crystal to change direction more or less cont<strong>in</strong>uouslyaround almost the entire crystal surface, as shown <strong>in</strong> Fig. 9.4 for clusters of N = 10000<strong>and</strong> 64000 particles. This effect appears to be stronger for larger clusters. In addition,the number of crystall<strong>in</strong>e layers formed near the droplet edge before the crystal doma<strong>in</strong>sextend further <strong>in</strong>wards is larger than <strong>in</strong> smaller clusters. However, the frustrations causedby the surface curvature still lead to disordered areas with<strong>in</strong> the cluster. Dur<strong>in</strong>g compression,the crystallization progresses slowly from the droplet <strong>in</strong>terface towards the middleas the pack<strong>in</strong>g fraction <strong>in</strong>creases. For these larger clusters, no icosahedral symmetry wasobserved.We <strong>in</strong>vestigated the order<strong>in</strong>g of particles on the surface of the cluster by perform<strong>in</strong>g Delaunaytriangulation to determ<strong>in</strong>e the number of nearest neighbors of each particles.[205]In this analysis, a particle was considered to be on the droplet surface if its center ofmass was less than half of the particle diameter away from the surface (r > R − σ/2).In Fig.9.5, we show snapshots of clusters where the surface particles are colored basedon the number of nearest neighbors. Most particles have 6 neighbors (purple), but defectsof particles with 4 (yellow), 5 (p<strong>in</strong>k) or 7 (red) neighbors can be seen as well. For
128 Chapter 9Figure 9.1: Typical configurations of N = 4000 hard spheres compressed <strong>in</strong> a hard sphericalcavity at a compression rate v R = 10 −5 σ/τ obta<strong>in</strong>ed from EDMD simulations. The picture onthe left shows the outside of the cluster, while the picture on the right shows a cut throughthe middle of the cluster, with the different colors show<strong>in</strong>g different wedge-shaped crystall<strong>in</strong>edoma<strong>in</strong>s. Particles identified as fluid-like are colored light blue.Figure 9.2: Left: Crystall<strong>in</strong>e doma<strong>in</strong>s found experimentally <strong>in</strong> two clusters of nanoparticleswith a core diameter of 18 nm, after evaporat<strong>in</strong>g the emulsion droplet. Only the particles thatare part of a crystall<strong>in</strong>e doma<strong>in</strong>s are shown. Right: Typical electron microscopy image of twoclusters of nanoparticles. The clusters are around 320 nm <strong>in</strong> diameter.
Crystallization of <strong>colloidal</strong> spheres <strong>in</strong> evaporat<strong>in</strong>g emulsion droplets129Figure 9.3: Icosahedral symmetry <strong>in</strong> a cluster of N = 4000 hard spheres compressed <strong>in</strong> sphericalconf<strong>in</strong>ement (left) <strong>and</strong> an experimental cluster of nanoparticles with a core diameter of 7 nm(right). The five-fold symmetry is visible from many directions. Only particles that are part ofa crystall<strong>in</strong>e cluster are shown.N = 10000, outsideN = 10000, <strong>in</strong>sideN = 64000, outsideN = 64000, <strong>in</strong>sideFigure 9.4: Left: Typical configurations <strong>in</strong> a system of N = 10000 (top) <strong>and</strong> N = 64000 (bottom)hard spheres compressed <strong>in</strong> a hard spherical cavity at a compression rate v R = 10 −3 σ/τ,obta<strong>in</strong>ed from EDMD simulations. In this case, a large crystall<strong>in</strong>e doma<strong>in</strong> (red) changes orientationcont<strong>in</strong>uously over the entire surface of the cluster, <strong>and</strong> grows <strong>in</strong>ward at multiple locationswith different orientations. The pictures on the left show the outside of the clusters, while thepictures on the right show a cut through the middle of the clusters, with the different colorsshow<strong>in</strong>g different crystal doma<strong>in</strong>s.
130 Chapter 9larger clusters (N = 10000 <strong>and</strong> 64000), these defects are clustered <strong>in</strong> 12 roughly evenlyspaced locations over the spherical surface. For comparison, the bottom right pictureshows the surface order<strong>in</strong>g on a hollow spherical shell, where the particles were conf<strong>in</strong>edto the droplet surface by a strong wall-particle square well attraction with a well widthof 0.1σ. In this case, long scars of particles with alternat<strong>in</strong>gly 5 or 7 neighbors can beseen at several po<strong>in</strong>ts on the sphere. Both the formation of these scars <strong>and</strong> the necessityof form<strong>in</strong>g at least 12 surface defects are well-known behavior for spherical pack<strong>in</strong>gs ofspheres [206]. It is <strong>in</strong>terest<strong>in</strong>g to note that a cluster with icosahedral symmetry wouldals lead to at least 12 evenly spaced defects, as an icosahedron has 12 po<strong>in</strong>ts where fivedoma<strong>in</strong>s touch.Depend<strong>in</strong>g on the system, strong attractions between the particles <strong>and</strong> the droplet<strong>in</strong>terface can occur <strong>in</strong> experiments. In some cases, the droplet evaporation can even result<strong>in</strong> hollow shells of particles, <strong>in</strong>dicat<strong>in</strong>g that the particles are firmly adsorbed to the<strong>in</strong>terface between the two solvents. If we <strong>in</strong>troduce a sufficiently strong, short-rangedattractive potential between the wall <strong>and</strong> the particles <strong>in</strong> our simulations, the same behaviorcan be observed. Here, the attractive force is modeled by a square well attractionwith width of 0.1σ <strong>and</strong> a well depth that is sufficiently large to prevent particles fromescap<strong>in</strong>g. Particles form a s<strong>in</strong>gle layer at the <strong>in</strong>terface, result<strong>in</strong>g <strong>in</strong> an ordered hexagonalpattern after compression.9.3.2 Colloidal hard spheres <strong>in</strong> a spherical cavity with a repulsivewall-particle <strong>in</strong>teractionIn some experimentally observed droplets of nanoparticles, we also observe doma<strong>in</strong>s thatspan a much larger part of the cluster. While it is not clear why the experimental systemis more ordered <strong>in</strong> these cases, it is important to note that neither the particle-wallnor the particle-particle <strong>in</strong>teractions are perfectly hard <strong>in</strong> the experimental system. To<strong>in</strong>vestigate the effects of this, we performed simulations where the particles were repelledfrom the droplet <strong>in</strong>terface. When the cont<strong>in</strong>uous wall-particle repulsion is short-ranged(V wall (r) ∝ σ n /(R − r) n , with n ≥ 2), the result<strong>in</strong>g clusters are not significantly affected,<strong>and</strong> conta<strong>in</strong> the same wedge-shaped crystal doma<strong>in</strong>s. However, <strong>in</strong> the case of a longrange<strong>in</strong>teraction (βV wall (r) = 32σ/(R − r)), the effects of the <strong>in</strong>terface on nucleationare suppressed <strong>and</strong> wedge-shaped doma<strong>in</strong>s no longer form. Instead, the orientation ofthe crystall<strong>in</strong>e order is often constant throughout the cluster, although cases with two orthree doma<strong>in</strong>s are seen as well. An example is shown <strong>in</strong> Fig. 9.6. In this case, nucleationat the droplet <strong>in</strong>terface is suppressed sufficiently to allow a s<strong>in</strong>gle nucleus to grow to thesize of the droplet before more crystal doma<strong>in</strong>s can form.9.3.3 Colloidal hard spheres <strong>in</strong> a hard spherical cavity with repulsiveparticle-particle <strong>in</strong>teractionsTo <strong>in</strong>vestigate the possible effects of steric repulsions between the spheres, we performedEDMD simulations on hard particles <strong>in</strong>teract<strong>in</strong>g with a square-shoulder <strong>in</strong>teraction potential,as described above. Figure 9.7 shows the result<strong>in</strong>g configurations of a cluster ofN = 4000 particles, with a shoulder width of q = 0.05σ. No qualitative differences <strong>in</strong>
Crystallization of <strong>colloidal</strong> spheres <strong>in</strong> evaporat<strong>in</strong>g emulsion droplets131N = 4000 N = 10000N = 64000N = 2000, hollowFigure 9.5: Surface order <strong>in</strong> clusters of hard spheres <strong>in</strong> compressed <strong>in</strong> hard spherical conf<strong>in</strong>ement,with N = 4000, 10000, <strong>and</strong> 64000 particles. For comparison, a hollow cluster of N = 2000particles with strongly attractive wall-particle <strong>in</strong>teractions is also shown. The colors denote thenumber of neighbors <strong>in</strong> the Delaunay triangulation. Purple particles have 6 nearest neighborson the surface, while defects most commonly lead to particles with 4 (yellow), 5 (p<strong>in</strong>k) <strong>and</strong> 7(red) neighbors.the result<strong>in</strong>g doma<strong>in</strong>s was observed for a range of shoulder heights 0.5 < ɛ < 5, <strong>and</strong> forshoulder widths q/σ = 0.02, 0.05 <strong>and</strong> 0.1. While it is possible that smoother potentialssignificantly affect the crystallization process <strong>in</strong> the cluster, the formation of wedge-shapeddoma<strong>in</strong>s appears to be at least <strong>in</strong>sensitive to the pair potentials tried here.
132 Chapter 9Simulations:Experiments:Figure 9.6: Crystall<strong>in</strong>e doma<strong>in</strong>s <strong>in</strong> clusters obta<strong>in</strong>ed from simulations (top two pictures) <strong>and</strong>experiments (bottom two pictures). For the simulations, N = 4000 hard spheres were compressedwith a long-range repulsive wall-particle <strong>in</strong>teraction βV wall ∝ 1/r <strong>and</strong> compressionrates v R = 10 −4 σ/τ (left) <strong>and</strong> 10 −5 σ/τ (right). In all snapshots, different colors denote differentcrystall<strong>in</strong>e doma<strong>in</strong>s, <strong>and</strong> only the particles identified as solid-like are shown. The experimentalclusters consisted of nanoparticles with a core diameter of 7 nm.ɛ = 1 ɛ = 2 ɛ = 3 ɛ = 4Figure 9.7: Crystall<strong>in</strong>e doma<strong>in</strong>s <strong>in</strong> <strong>systems</strong> of N = 4000 hard spheres <strong>in</strong>teract<strong>in</strong>g with a squareshoulder repulsion <strong>in</strong> a hard spherical cavity, with ɛ = 1 (left), 2, 3, <strong>and</strong> 4 (right). No qualitativedifferences <strong>in</strong> the doma<strong>in</strong>s was observed.
Crystallization of <strong>colloidal</strong> spheres <strong>in</strong> evaporat<strong>in</strong>g emulsion droplets1339.4 ConclusionsIn summary, we have <strong>in</strong>vestigated the effect of shr<strong>in</strong>k<strong>in</strong>g spherical conf<strong>in</strong>ement on <strong>systems</strong>of <strong>colloidal</strong> hard spheres, as a simple model for particles trapped <strong>in</strong> evaporat<strong>in</strong>gemulsion droplets. In the presence of a hard conf<strong>in</strong><strong>in</strong>g <strong>in</strong>terface, crystallization <strong>in</strong> theclusters always starts at the surface of the cluster, lead<strong>in</strong>g to crystall<strong>in</strong>e order with differentorientations along the droplet edge. In sufficiently small <strong>systems</strong> (N ≃ 4000), thedoma<strong>in</strong>s change orientation discont<strong>in</strong>uously, lead<strong>in</strong>g to wedge-shaped crystall<strong>in</strong>e doma<strong>in</strong>sgrow<strong>in</strong>g <strong>in</strong>ward from the surface. These doma<strong>in</strong>s show good qualitative agreement withthose seen <strong>in</strong> experiments on droplets conta<strong>in</strong><strong>in</strong>g nanoparticles. In both experiments <strong>and</strong>simulations, icosahedral order<strong>in</strong>g of tetragonal doma<strong>in</strong>s was observed. In simulations ofclusters conta<strong>in</strong><strong>in</strong>g more particles (N = 10000 or larger), the larger spherical conf<strong>in</strong>ementallows the hard-sphere crystal to change orientation cont<strong>in</strong>uously, lead<strong>in</strong>g to a large crystall<strong>in</strong>edoma<strong>in</strong> <strong>in</strong> the shape of a spherical shell, which grows <strong>in</strong>wards at several po<strong>in</strong>tswith different orientations. Even <strong>in</strong> this case, the <strong>in</strong>ternal part of the cluster shows alarge degree of disorder, <strong>and</strong> icosahedral order<strong>in</strong>g of the crystall<strong>in</strong>e doma<strong>in</strong>s was not observedfor these larger clusters. Larger clusters do show a more ordered surface, withdefects <strong>in</strong> the surface order<strong>in</strong>g often largely restricted to twelve evenly spaced clusters. Insmall clusters, this surface order is destroyed by the doma<strong>in</strong> boundaries of the underly<strong>in</strong>gcrystall<strong>in</strong>e structure.If a long-range repulsion between the droplet <strong>in</strong>terface <strong>and</strong> the particles is implemented<strong>in</strong> the simulations, the <strong>in</strong>ternal order of the generated clusters <strong>in</strong>creases significantly.This soft potential almost completely prevents order<strong>in</strong>g of particles on the surface dur<strong>in</strong>gcompression, mak<strong>in</strong>g crystallization along the surface much more difficult than <strong>in</strong> thecase of a hard wall or short-ranged repulsion. As a result, crystallization occurs at onlya s<strong>in</strong>gle location <strong>in</strong> the cluster, lead<strong>in</strong>g to a much larger degree of crystall<strong>in</strong>e order <strong>in</strong>the result<strong>in</strong>g crystal. In the experiments these more ordered clusters appear to be morecommon <strong>in</strong> <strong>systems</strong> with smaller nanoparticles. It is likely that any <strong>in</strong>teractions withthe droplet <strong>in</strong>terface are also relatively longer ranged <strong>in</strong> this case: <strong>in</strong> the case of smallerparticles both the size of the surfactants <strong>in</strong> the system <strong>and</strong> the range of any electrostatic<strong>in</strong>teractions are larger compared to the size of a s<strong>in</strong>gle nanoparticle.F<strong>in</strong>ally, we <strong>in</strong>vestigated the effects of square shoulder repulsions between the spheres,but found no significant differences <strong>in</strong> the result<strong>in</strong>g crystall<strong>in</strong>e doma<strong>in</strong>s for the parameterrange we studied. While more complex <strong>in</strong>teractions could <strong>in</strong>fluence doma<strong>in</strong> formation,our simulations suggest that the most direct route of <strong>in</strong>fluenc<strong>in</strong>g crystallization <strong>in</strong> clustersformed via emulsion droplet evaporation <strong>in</strong>volves chang<strong>in</strong>g the <strong>in</strong>teractions between theparticles <strong>and</strong> the droplet surface.9.5 AcknowledgementsI would like to thank Bart de Nijs for perform<strong>in</strong>g the experiments on nanoparticles discussed<strong>in</strong> this chapter.
10Colloidal micelles from asymmetrichard dumbbellsIn <strong>colloidal</strong> <strong>systems</strong>, effective depletion attractions between particles can be <strong>in</strong>duced bythe addition of depletants to the suspension. These <strong>in</strong>teractions can be suppressed by arough surface coat<strong>in</strong>g of smaller particles. In the case of <strong>colloidal</strong> dumbbells consisist<strong>in</strong>gof one smooth sphere <strong>and</strong> one coated sphere, the depletion attractions are effectivelylimited to the uncoated spheres. The result<strong>in</strong>g <strong>in</strong>teractions can <strong>in</strong>duce the formation ofclusters, but the aggregation is h<strong>in</strong>dered by the presence of the non-<strong>in</strong>teract<strong>in</strong>g spheres.This causes the dumbbells to <strong>self</strong>-assemble <strong>in</strong>to micelle-like clusters, with the attractiveparts <strong>in</strong> the center <strong>and</strong> the rough spheres on the edges. Hence, the particles can act as asimple model system for surfactants. In this chapter, we study cluster size distributions<strong>in</strong> these <strong>systems</strong> us<strong>in</strong>g both Monte Carlo simulations <strong>and</strong> free-energy calculations, <strong>and</strong>compare the results to distributions measured <strong>in</strong> an experimental system. Direct MonteCarlo simulations start<strong>in</strong>g from a homogeneous state give rise to cluster distributions thatare <strong>in</strong> good agreement with those found <strong>in</strong> experiments. However, it is clear that thesesimulations do not reach full equilibrium, as the slow exchange of particles between clustersgives rise to extremely long equilibration times. Our free-energy calculations demonstratethat the equilibrium size distribution shows a strong preference for specific cluster sizeslarger than those that readily form via <strong>self</strong>-<strong>assembly</strong>, suggest<strong>in</strong>g strong non-equilibriumeffects on the clusters aris<strong>in</strong>g <strong>in</strong> these <strong>systems</strong>.10.1 IntroductionDue to recent advances <strong>in</strong> <strong>colloidal</strong> synthesis techniques, the variety of <strong>colloidal</strong> particleswith anisotropic <strong>in</strong>teractions has <strong>in</strong>creased considerably. [4] These new colloids can beused as the <strong>colloidal</strong> build<strong>in</strong>g blocks for a wide range of structures. In particular, <strong>colloidal</strong>particles with site-specific <strong>in</strong>teractions, so-called ’patchy particles’ have received a largeamount of attention over the last few years. [15, 207] Patchy particles have already beenshown to give rise to <strong>in</strong>terest<strong>in</strong>g phase behavior, lead<strong>in</strong>g to both clusters <strong>and</strong> crystalswith structures that can be tuned by modify<strong>in</strong>g the number <strong>and</strong> positions of the patcheson each colloid,[16, 49, 208, 209] as well as equilibrium gel-like structures.[210] A specialcase of these patchy particles is formed by particles with only a s<strong>in</strong>gle attractive patch.
136 Chapter 10Spherical colloids of this type, often referred to as Janus particles, have already beenshown to form both micelle-like <strong>and</strong> vesicle-like structures. [211, 212]In this chapter, we <strong>in</strong>vestigate asymmetric <strong>colloidal</strong> dumbbells where the smallersphere <strong>in</strong> each particle acts as a s<strong>in</strong>gle attractive patch as a result of depletion <strong>in</strong>teractions.By giv<strong>in</strong>g the surface of the larger spheres a rough coat<strong>in</strong>g, all depletion <strong>in</strong>teractionsaside from those between the smaller spheres are strongly suppressed, effectivelyleav<strong>in</strong>g only specific attractions between the smaller smooth spheres. As a result, theseparticles form clusters that resemble micelles formed by surfactant molecules: the smoothspheres are positioned on the <strong>in</strong>side of the cluster <strong>and</strong> surrounded by a layer of the largerrough spheres. The size of these clusters is strongly determ<strong>in</strong>ed by the geometry of thedumbbells: <strong>in</strong> the absence of rough spheres, clusters could grow without limit, <strong>and</strong> anyattractions sufficiently strong to cause significant cluster formation would lead to a phaseseparation <strong>in</strong> the system. In the case of dumbbells, however, add<strong>in</strong>g more particles to thecluster also <strong>in</strong>creases the number of purely repulsive rough spheres on the outside of thecluster. These rough spheres <strong>in</strong> turn limit the number of bonds that a smooth particlecan form <strong>and</strong> reduce the freedom of movement of the other large spheres <strong>in</strong> the cluster,mak<strong>in</strong>g larger clusters less favorable. As this effect is stronger for relatively larger roughspheres, more asymmetric dumbbells tend to form smaller clusters.We study the cluster sizes <strong>and</strong> shapes formed <strong>in</strong> <strong>systems</strong> of these dumbbells us<strong>in</strong>g freeenergycalculations, <strong>and</strong> compare them with those seen <strong>in</strong> experiments, as well as withdirect simulations start<strong>in</strong>g from a homogeneous <strong>in</strong>itial configuration. In particular, we<strong>in</strong>vestigate the effect of <strong>colloidal</strong> number density, <strong>in</strong>teraction range, <strong>in</strong>teraction strength,<strong>and</strong> dumbbell size ratio on the clusters formed <strong>in</strong> equilibrium, <strong>and</strong> the effects of thedynamics of the system on the formation of these clusters.10.2 Theory10.2.1 Free-energy calculationsWe consider a system of N dumbbells <strong>in</strong> a volume V at temperature T . These dumbbells<strong>in</strong>teract with hard-core <strong>in</strong>teractions <strong>and</strong> depletion attractions <strong>and</strong> tend to form micellesunder the constra<strong>in</strong>t that the total number of dumbbells satisfies∞∑N = N n , (10.1)n=1where N n is the number of micelles consist<strong>in</strong>g of n dumbbells. For sufficiently dilutemicelle fluids the system can be modeled as an ideal gas of clusters, non-<strong>in</strong>teract<strong>in</strong>g butcapable of exchang<strong>in</strong>g particles. This allows us to write the canonical partition functionZ(N, V, T ), as:Z(N, V, T ) =Q n =∞∏Q Nnnn=1N n !1(4π) n Λ 3n n!∫Vdr n ∫(10.2)dω n exp(−βU(r n , ω n ))c(r n ), (10.3)
Colloidal micelles from asymmetric hard dumbbells 137where Q n is the <strong>in</strong>ternal configurational <strong>in</strong>tegral of a cluster of n dumbbells, β = 1/k B Twith k B Boltzmann’s constant, Λ 3 is the thermal volume of a dumbbell particle, r n denotesthe positions of the attractive spheres of the dumbbells <strong>in</strong> the cluster, <strong>and</strong> ω n theorientations of the dumbbell particles. The function c(r n ) equals 1 if the smooth spheresat positions r n form a s<strong>in</strong>gle cluster <strong>and</strong> is 0 otherwise. We consider two particles to bepart of the same cluster if their smooth spheres are close enough to attract each other.S<strong>in</strong>ce the partition function for a monomer is Q 1 = V/Λ 3 , we can rewrite Eq. 10.3 as:∞∏ (V/Λ 3 ( )) Nn NnQnQ =(10.4)N n ! Q 1n=1Here, Q n /Q 1 is the ratio of the partition function of a cluster of n particles to that of acluster of a s<strong>in</strong>gle particle. Due to the restriction that the cluster be connected, this nolonger depends on the volume of the box, as long as V is large enough to accomodate anycluster. The Helmholtz free energy reads:F (N, V, T, {N 1 , . . . , N n }) = −k B T log Z(N, V, T ) (10.5)[ (∞∑Nn= N n k B T logQ ) ]V Λ3 1− 1 (10.6)Q nn=1For an ideal gas of these particles, with only clusters of size 1, the Helmholtz free energyreduces to that of an ideal gas of monomers βF/N = log(ρΛ 3 ) − 1, with ρ = N/V theparticle density.The ratio Q n /Q 1 can be measured us<strong>in</strong>g a gr<strong>and</strong>-canonical (µV T ) Monte Carlo simulation(GCMC).[213] By impos<strong>in</strong>g the constra<strong>in</strong>t of hav<strong>in</strong>g only a s<strong>in</strong>gle cluster <strong>in</strong> aGCMC simulation, the probability P (n) of observ<strong>in</strong>g a cluster of size n reads:P (n)P (1)= Q nQ 1exp[βµ(n − 1)], (10.7)Hence, the ratio Q n /Q 1 can be directly obta<strong>in</strong>ed for all n from the GCMC simulation.In pr<strong>in</strong>ciple, Q n /Q 1 is <strong>in</strong>dependent of µ, although simulations at different values of µcan be used to sample all cluster sizes. We can now m<strong>in</strong>imize the Helmholtz free energyfunctional F (N, V, T, {N 1 , . . . , N n })of the cluster gas with respect to the distribution N n ,while satisfy<strong>in</strong>g the normalization constra<strong>in</strong>t 10.1:()∂∞∑F − µ nN n = µ n − µ0, (10.8)∂N nn=1with µ = µ 1 a Lagrange multiplier. This yields:( ) ∂Fµ n =∂N nComb<strong>in</strong><strong>in</strong>g Eqs. 10.8 <strong>and</strong> 10.1 givesV,T,N 1 ,...N n−1 ,N n+1 ,...= k B T log(Nn Q )V Λ3 1Q n(10.9)ρ n Λ 3 = (ρ 1 Λ 3 ) n Q nQ 1(10.10)with ρ the overall particle density <strong>in</strong> the system <strong>and</strong> ρ n is the number density of clustersof size n. The result<strong>in</strong>g polynomial equation <strong>in</strong> ρ 1 Λ 3 has only one solution for ρ 1 ≥ 0,which depends cont<strong>in</strong>uously on ρ. In other words, no phase transitions will occur.
138 Chapter 1010.2.2 Critical micelle concentrationAs is generally the case for adsorption equilibria <strong>and</strong> micelle-like <strong>systems</strong>, the monomerdensity ρ 1 as a function of the particle density crosses over from a l<strong>in</strong>ear regime to a nearlyconstant value as the density <strong>in</strong>creases. As an example, consider a system where only onecluster size appears consist<strong>in</strong>g of n particles. Insert<strong>in</strong>g Eq. 10.10 <strong>in</strong>to 10.1 gives:This can be rewritten as:whereρ 1 Λ 3 + nρ n 1Λ 3n Q nQ 1= ρΛ 3 . (10.11)( ) nρ 1 ρ1+ n = ρ , (10.12)ρ 0 ρ 0 ρ 0ρ 0 ≡(QnQ 1) 1/(n−1)Λ −3 . (10.13)When the density of the system is low, i.e. ρ ≪ ρ 0 , the density of monomers is approximatelyequal to the system density, as the second term <strong>in</strong> Eq. 10.12 is negligible comparedto the first one. In this regime, the entropy the particles lose by bond<strong>in</strong>g is much largerthan the potential energy difference ga<strong>in</strong>ed by form<strong>in</strong>g a cluster. However, for largerdensities clusters appear, <strong>and</strong> the density of monomers will be more or less constant.The crossover density between these regimes is often referred to as the critical micelleconcentration (cmc). For sufficiently large micelles (n ≫ 1), the density of monomers isapproximately equal to the cmc when ρ ≫ ρ cmc . While the density ρ 0 def<strong>in</strong>ed here is agood <strong>in</strong>dication of the critical micelle concentration, calculation of the cmc becomes moredifficult <strong>in</strong> <strong>systems</strong> with an equilibrium between multiple cluster sizes, such as the onestudied here. In addition, due to the relatively small cluster sizes (n < 30) consideredhere the density of monomers cont<strong>in</strong>ues to <strong>in</strong>crease slowly as a function of density even ifthe majority of the system consists of dumbbells, without reach<strong>in</strong>g a clear limit<strong>in</strong>g valuethat could be used as a cmc.In this chapter, we use a commonly used def<strong>in</strong>ition of the cmc that corresponds tothe po<strong>in</strong>t where exactly half of the particles <strong>in</strong> the system are part of a cluster. Thus,at ρ = ρ cmc , ρ 1 = ρ/2. As an additional cluster<strong>in</strong>g criterion, we also determ<strong>in</strong>e theheat capacity as a function of the <strong>in</strong>teraction strength ɛ. The heat capacity at constantvolume c V = (dU/dT ) Vcorresponds to the change <strong>in</strong> energy if the temperature <strong>in</strong>creasesby a small amount. In the regime where the number of clusters <strong>in</strong>creases strongly withdecreas<strong>in</strong>g temperature, the heat capacity is maximal. In our system, a decrease <strong>in</strong> thetemperature is equivalent to an <strong>in</strong>crease <strong>in</strong> the <strong>in</strong>teraction strength ɛ, as ɛ is measured <strong>in</strong>units of k B T . Thus, c V ∝ − ( )dU, <strong>and</strong> a maximum <strong>in</strong> the heat capacity corresponds to adɛ Vm<strong>in</strong>imum <strong>in</strong> (dU/dɛ) V. By comb<strong>in</strong><strong>in</strong>g measurements of the average potential energy percluster size from GCMC simulations with the cluster size distribution, we can calculatethe total potential energy per particle for different values of ɛ, <strong>and</strong> f<strong>in</strong>d the maximum <strong>in</strong>the heat capacity.
Colloidal micelles from asymmetric hard dumbbells 13910.3 Model <strong>and</strong> methods10.3.1 InteractionsThe particles are modeled by hard-core asymmetric dumbbells with only depletion attractionsbetween the smooth sides. Any rema<strong>in</strong><strong>in</strong>g depletion <strong>in</strong>teraction between therough spheres, <strong>and</strong> any charges on the particles are neglected. For the hard-core <strong>in</strong>teractions,the rough <strong>and</strong> smooth spheres have diameters σ R <strong>and</strong> σ, respectively, <strong>and</strong> are adistance d apart. The rough spheres only <strong>in</strong>teract with other spheres (smooth or rough)via hard-core <strong>in</strong>teractions. The depletion potential between the smooth spheres is givenby [214, 215]⎧∞, r ≤ σ⎪⎨ r 3βU depl (r) =⎪⎩−ɛ2q 3 − 3r2q +1σ 32q 3 − 3σ2q +1,σ < r ≤ q0, r > q, (10.14)where r is the distance between the small spheres of two dumbbells. The <strong>in</strong>teractionpotential is described by two parameters, an <strong>in</strong>teraction range q <strong>and</strong> <strong>in</strong>teraction strengthɛ. The range of attraction is q = σ+σ pol , with σ pol the diameter of the polymer responsiblefor the depletion <strong>in</strong>teractions. For two smooth spheres <strong>in</strong> contact, the potential well depthis ɛk B T , with ɛ given byσ 3− 3σ2qɛ = φ + 13 2qp q 3 . (10.15)(q − σ) 3Here, φ p = πσ 3 polN pol /6V is the pack<strong>in</strong>g fraction of polymers <strong>in</strong> a reservoir <strong>in</strong> chemicalequilibrium with the system <strong>and</strong> N pol is the number of polymers.10.3.2 Direct simulationsWe study this model us<strong>in</strong>g both direct Monte Carlo simulations <strong>and</strong> free-energy calculations.In the direct Monte Carlo simulations, we simulate a system of N = 1000 particlesat constant density ρ <strong>and</strong> temperature T . We directly measure the cluster size distributiondur<strong>in</strong>g the simulation. The <strong>in</strong>itial configuration consists of particles with r<strong>and</strong>omorientations <strong>and</strong> positions, effectively lead<strong>in</strong>g to a system of monomers. The simulationis then equilibrated for at least 10 7 MC cycles. To improve mobility of clusters with morethan one particle, cluster moves are <strong>in</strong>troduced which collectively move all particles thatare part of the same cluster. Particles are considered to be part of the same cluster if thecenter-of-mass distance between their smooth spheres is less than the attraction range q.10.3.3 Gr<strong>and</strong>-canonical Monte CarloTo measure the cluster free energies f n , we simulate s<strong>in</strong>gle clusters at constant chemicalpotential µ <strong>and</strong> temperature T , allow<strong>in</strong>g only moves that result <strong>in</strong> a s<strong>in</strong>gle cluster. Inaddition to perform<strong>in</strong>g normal translation <strong>and</strong> rotation moves, we <strong>in</strong>sert <strong>and</strong> removeparticles accord<strong>in</strong>g to a st<strong>and</strong>ard GCMC scheme, but restrict the system to s<strong>in</strong>gle clusters.The box volume has no <strong>in</strong>fluence on the outcome of the simulation, as <strong>in</strong>sertions are only
140 Chapter 10accepted near the cluster. To prevent <strong>in</strong>sertions too far away from the cluster, the trial<strong>in</strong>sertion moves can <strong>in</strong> pr<strong>in</strong>ciple be restricted to a small region around the cluster, as longas no valid <strong>in</strong>sertions (that would not result <strong>in</strong> more than one cluster) are excluded. Whilethis could be done by restrict<strong>in</strong>g the <strong>in</strong>sertions to a sufficiently large spherical volumearound the center of mass of the cluster, a better solution is to only <strong>in</strong>sert particles <strong>in</strong>sidethe attractive wells of particles already <strong>in</strong> the cluster.Ideally, we would like to attempt <strong>in</strong>sertions such that the center of the smooth sphereof the new particle is restricted to a volume v w , correspond<strong>in</strong>g to the union of all attractivewells <strong>in</strong> the cluster. The attractive well for each particle is the spherical shell where thedistance r to the center of the smooth sphere satisfies σ < r < q. Any <strong>in</strong>sertions outsidethis volume would be rejected due to the s<strong>in</strong>gle-cluster constra<strong>in</strong>t, <strong>and</strong> are therefore notuseful.To generate a uniformly r<strong>and</strong>om position <strong>in</strong> v w , we proceed as follows: when <strong>in</strong>sert<strong>in</strong>ga particle, we first r<strong>and</strong>omly select a particle already present <strong>in</strong> the cluster. Subsequently,we choose a r<strong>and</strong>om location <strong>in</strong>side the attractive well of this particle for the center ofthe smooth sphere of the particle. However, as the attractive wells of multiple particlescan overlap, the probability of attempt<strong>in</strong>g a particle <strong>in</strong>sertion at a position where kwells overlap is biased by this method. To correct for this bias, an <strong>in</strong>sertion move <strong>in</strong>tok overlapp<strong>in</strong>g wells is only attempted with a probability 1/k, <strong>and</strong> is otherwise rejected.Us<strong>in</strong>g this method, the probability of select<strong>in</strong>g a position for the trial particle that satisfiesthe s<strong>in</strong>gle-cluster criterion is v w /vn, where v = 4π 3 (q3 − σ 3 ) is the volume of the attractivewell around one particle. Compared to <strong>in</strong>sert<strong>in</strong>g <strong>in</strong>to a fixed volume of size V , thisimproves the acceptance of <strong>in</strong>sertion moves by a factor V/nv. The position of the roughsphere is simply chosen by generat<strong>in</strong>g a r<strong>and</strong>om orientation for the particle.To ma<strong>in</strong>ta<strong>in</strong> detailed balance, the acceptance rules for <strong>in</strong>sertion <strong>and</strong> deletion moveshave to be modified slightly. We require thatP (n)α(n → n + 1)acc(n → n + 1) = P (n + 1)α(n + 1 → n)acc(n + 1 → n), (10.16)where P (n) is the probability of f<strong>in</strong>d<strong>in</strong>g exactly n particles <strong>in</strong> the system, α(i → j) isthe probability of attempt<strong>in</strong>g a move that changes the number of particles from i to j,<strong>and</strong> acc(i → j) is the acceptance probability of such a move. In our simulation, thenumber of <strong>in</strong>sertion <strong>and</strong> deletion moves <strong>in</strong> our simulations is the same. However, s<strong>in</strong>cethe probability of choos<strong>in</strong>g a valid location for a particle <strong>in</strong>sertion is now larger by a factorV/nv, this is equivalent to <strong>in</strong>creas<strong>in</strong>g the number of particle <strong>in</strong>sertions attempted by thesame factor. Thus,α(n → n + 1) = V α(n + 1 → n). (10.17)nvIn the gr<strong>and</strong>-canonical ensemble, the probability density function P (r n , ω n ; n) for f<strong>in</strong>d<strong>in</strong>gthe system <strong>in</strong> a state with n particles at positions r n <strong>and</strong> with orientations ω n is given byP (r n , ω n ; n) ∝ exp(βµn)V nΛ 3n n!exp(−βU(r n , ω n ))c(r n ), (10.18)As a result, the acceptance probabilities for <strong>in</strong>sert<strong>in</strong>g <strong>and</strong> remov<strong>in</strong>g particles should obeyacc(n → n + 1)acc(n + 1 → n) = vn exp(βµ)VV Λ 3 (n + 1) exp(−β[U(rn+1 , ω n+1 ) − U(r n , ω n )]), (10.19)
Colloidal micelles from asymmetric hard dumbbells 141with the additional constra<strong>in</strong>t that the particles should still form a s<strong>in</strong>gle cluster after the<strong>in</strong>sertion or deletion. This leads to the follow<strong>in</strong>g acceptance rules for particle <strong>in</strong>sertion<strong>and</strong> deletion:acc(n → n + 1) = m<strong>in</strong>acc(n + 1 → n) = m<strong>in</strong>[[1,]nvΛ 3 (n + 1) exp(β[µ − U(rn+1 , ω n+1 ) + U(r n , ω n )])1, Λ3 nnv exp(−β[µ − U(rn , ω n ) + U(r n+1 , ω n+1 )])]c(r n ).(10.20)Here, we have left out the constra<strong>in</strong>t c(r n+1 ) <strong>in</strong> the case of particle <strong>in</strong>sertion, as <strong>in</strong>sertionsare only performed on valid location. Note that the rejection of <strong>in</strong>sertions <strong>in</strong>to overlapp<strong>in</strong>gpotential wells are not <strong>in</strong>cluded <strong>in</strong> this acceptance rule.In pr<strong>in</strong>ciple, the choice of µ <strong>in</strong> the GCMC simulations does not matter for the result<strong>in</strong>gprobability distribution. However, <strong>in</strong> order to sample clusters of all relevant sizes properly,one can perform simulations at different values of µ. In practice, it is not straightforwardto determ<strong>in</strong>e the value of µ that allows a good sampl<strong>in</strong>g of cluster sizes, <strong>and</strong> it turns outto be more practical to set µ to 0 <strong>and</strong> to use an Umbrella Sampl<strong>in</strong>g scheme to samplethe cluster distribution.[17] An extra energy term U US (n) = k(n − n 0 ) 2 is added to thepotential energy function, which biases the cluster size n towards a target value n 0 . Theprobabilities P bias (n) measured <strong>in</strong> these simulations have to be corrected to obta<strong>in</strong> theunbiased probabilities:P (n) ∝ exp(k(n − n 0 ) 2 )P bias (n), (10.21)with a proportionality constant depend<strong>in</strong>g on the target cluster size n 0 . From simulationswith different values of n 0 the full probability distribution P (n) can be calculated.At high <strong>in</strong>teraction strengths, reorganization of the cluster is a slow process, due to thenumber of bonds that have to be broken to reach a new configuration. To speed up equilibration<strong>and</strong> sampl<strong>in</strong>g, we employ the parallel temper<strong>in</strong>g method.[17] In one simulation,we simulate a number of separate clusters at different <strong>in</strong>teraction strengths ɛ. The differentclusters do not <strong>in</strong>teract <strong>in</strong> any way, but a new Monte Carlo move is <strong>in</strong>troduced thatswaps configurations of two different <strong>in</strong>teraction strengths. The acceptance probability ofsuch a move is only based on the difference <strong>in</strong> total energy, <strong>in</strong>clud<strong>in</strong>g the US potential. Tomaximize the acceptance of these swap moves, the centers of the US w<strong>in</strong>dows are tuned(dur<strong>in</strong>g equilibration) such that all clusters conta<strong>in</strong> roughly the same average number ofparticles.10.3.4 Effective densityIn our assumption that a fluid of micelles can be treated as an ideal gas of clusters, weslightly underestimate the density of larger clusters. Analogous to Wertheim theory, wecan estimate a first-order correction by us<strong>in</strong>g the radial distribution function g(r) of a ofa system with only hard-core <strong>in</strong>teractions (i.e. ɛ = 0) at the same density. To do this,we assume that the system ma<strong>in</strong>ly consists of free dumbbells <strong>and</strong> calculate the effective
142 Chapter 100.2Η ⩵ 0.1, Ε ⩵ 6 k B T0.2Η ⩵ 0.1, Ε ⩵ 7 k B TPn0.1Pn0.10.0 2 4 6 8 10 12 14n0.0 2 4 6 8 10 12 14nFigure 10.1: Comparison of cluster distributions calculated us<strong>in</strong>g free energy calculations(blue l<strong>in</strong>es) with distributions from direct simulations (red po<strong>in</strong>ts) at a pack<strong>in</strong>g fraction η = 0.1,<strong>in</strong>teraction range q = 1.1σ <strong>and</strong> <strong>in</strong>teraction strength ɛ = 6 k B T <strong>and</strong> 7 k B T . The solid l<strong>in</strong>es showthe calculated distributions after rescal<strong>in</strong>g the density us<strong>in</strong>g Eq. 10.23. For the dashed l<strong>in</strong>es thedensity has not been rescaled.density ρ eff of particles <strong>in</strong>side the potential well:ρ eff = ρ ∫ qσ drr2 g(r)∫ qσ drr2 (10.22)≃ ρg(σ), (10.23)where <strong>in</strong> the second step we have assumed that g(r) is approximately constant over the(short-ranged) attractive well. Hence, the excluded-volume effects <strong>in</strong> the system lead to aslightly higher effective density near the particles, <strong>and</strong> we expect that at least for <strong>systems</strong>dom<strong>in</strong>ated by monomers us<strong>in</strong>g the effective density ρ eff rather than ρ should lead tobetter predictions of the cluster size distributions. In the limit of low densities, ρ eff → ρ.We performed s<strong>in</strong>gle-cluster simulations on rough-smooth dumbbells with size ratioσ/σ R = 0.5, <strong>and</strong> compared the cluster distributions result<strong>in</strong>g from the calculated freeenergies to those found <strong>in</strong> direct simulations. The distance between the two spheres of eachdumbbell was chosen such that the spheres touch <strong>and</strong> do not overlap, i.e. d = (σ + σ R )/2.Figure 10.1 compares distributions from direct simulations (red po<strong>in</strong>ts) with those fromfree-energy calculations both before rescal<strong>in</strong>g (dashed blue l<strong>in</strong>es) <strong>and</strong> after (solid bluel<strong>in</strong>es), for <strong>in</strong>teraction range q = 1.1σ <strong>and</strong> pack<strong>in</strong>g fraction η = 0.1. For the <strong>in</strong>teractionstrengths shown, the rescaled version clearly results <strong>in</strong> a better prediction. At lowerdensities, the difference between the two l<strong>in</strong>es decreases significantly. At higher <strong>in</strong>teractionstrength, equilibration issues <strong>in</strong> the direct simulations make comparisons more difficult.10.3.5 Experimental systemWe compare our results to the experiments performed by Kraft et al.[216] The experimentalsystem consisted of polystyrene dumbbell particles synthesized follow<strong>in</strong>g a modifiedmethod of Kim et al. [217] Spherical colloids with a diameter of 2.41 µm were synthesized,washed, <strong>and</strong> redispersed <strong>in</strong> an aqueous solvent. Dur<strong>in</strong>g this step, small polystyreneparticles (0.18 nm <strong>in</strong> diameter) were adsorbed onto the colloid surface, form<strong>in</strong>g a rough
Colloidal micelles from asymmetric hard dumbbells 143coat<strong>in</strong>g. A spherical protrusion with a diameter of 1.11µm was then created on eachparticle us<strong>in</strong>g an overswell<strong>in</strong>g method, lead<strong>in</strong>g to asymmetric dumbbell particles with arough sphere diameter of σ R = 2.92 µm, a dumbbell size ratio of σ/σ R = 0.76, <strong>and</strong> a totalparticle length of 4.9 µm, correspond<strong>in</strong>g to a distance d = 0.79σ between the spheres.To <strong>in</strong>duce depletion <strong>in</strong>teractions, dextran polymers were added at several concentrations.While NaCl was added to the system to screen the electrostatic <strong>in</strong>teractions, some of thecharge repulsion rema<strong>in</strong>s between the particles. As a result, it is difficult to calculate theeffective <strong>in</strong>teraction strength from the concentration of polymers. However, the size ofthe polymer (σ p = 38 nm) <strong>and</strong> the pack<strong>in</strong>g fraction of the system (η = 0.003) are known,<strong>and</strong> we expect that the electrostatic repulsions will ma<strong>in</strong>ly affect the effective strengthof the <strong>in</strong>teraction, without strongly <strong>in</strong>fluenc<strong>in</strong>g the behavior of the system. Thus, the<strong>in</strong>teraction strength ɛ will be our only fitt<strong>in</strong>g parameter when compar<strong>in</strong>g distributionsfrom simulations or free-energy calculations to the experimental results.10.4 Results10.4.1 Size ratio 0.76In order to compare with experimental results, we choose the size ratio between thesmooth <strong>and</strong> rough spheres to be σ/σ R = 0.76, at a distance d = 0.79σ between thespheres. We performed s<strong>in</strong>gle-cluster simulations to calculate cluster distributions fora range of <strong>in</strong>teraction strengths ɛ <strong>and</strong> <strong>in</strong>teraction ranges q. We measured the averagecluster size as a function of these two parameters, at a fixed pack<strong>in</strong>g fraction η = 0.003(correspond<strong>in</strong>g to the pack<strong>in</strong>g fraction used <strong>in</strong> the experimental setup). As an illustrationof the clusters formed, Fig. 10.2 shows both experimental <strong>and</strong> simulation snapshots ofclusters up to size n = 15. Figure 10.3 shows the average cluster size as a function of<strong>in</strong>teraction range q <strong>and</strong> <strong>in</strong>teraction strength ɛ, as well as the most common cluster size <strong>in</strong>the distribution calculated from the free energy calculations. The po<strong>in</strong>ts correspond<strong>in</strong>gto the cmc (def<strong>in</strong>ed as the po<strong>in</strong>t where exactly half of all particles are part of a cluster)<strong>and</strong> the maximum <strong>in</strong> the heat capacity are denoted by a white <strong>and</strong> blue l<strong>in</strong>e, respectively.Despite small differences, both criteria provide good estimates of the <strong>in</strong>teraction strengthwhere cluster<strong>in</strong>g becomes significant. At this po<strong>in</strong>t, we observe a sharp crossover betweena system consist<strong>in</strong>g of only small clusters <strong>and</strong> <strong>systems</strong> dom<strong>in</strong>ated by large clusters withcluster size n ≃ 20. This is <strong>in</strong> sharp contrast with the distributions found <strong>in</strong> directsimulations, where the cluster distribution peaks around n = 13. We note that thedirect simulations are <strong>in</strong> closer agreement with the experimental results at this size ratio.The left side of Figure 10.4 shows a comparison between cluster size distributions fromexperimental results (bars), direct simulations (black circles), <strong>and</strong> free-energy calculations(colored l<strong>in</strong>es). In both types of simulations, the <strong>in</strong>teraction range q = 1.02σ <strong>and</strong> pack<strong>in</strong>gfraction η = 0.003 were chosen to match the experimental parameters. For the directsimulation, the <strong>in</strong>teraction strength ɛ = 10 k B T was tuned to approximately match thefirst peak <strong>in</strong> the distribution function. The free-energy calculations are shown for a rangeof <strong>in</strong>teraction strengths. While reasonable agreement between direct simulations <strong>and</strong>experiments can be seen, the free-energy calculations clearly predict either much largerclusters or no clusters at all. While the distribution is <strong>in</strong>fluenced by the <strong>in</strong>teraction
144 Chapter 10Figure 10.2: Comparison between experimental snapshots of clusters (left) <strong>and</strong> clusters seen<strong>in</strong> the direct Monte Carlo simulations (right).strength, clusters around size 10 never appear <strong>in</strong> significant quantities. On the right, Fig.10.4 shows the effect of the number density on the distribution. While the number ofclusters formed strongly depends on the pack<strong>in</strong>g fraction, the peaks <strong>in</strong> the distribution donot shift. As Fig. 10.3 already suggests, vary<strong>in</strong>g the <strong>in</strong>teraction range does not strongly<strong>in</strong>fluence the cluster size either.While the MC simulation used to generate the distribution shown <strong>in</strong> Fig. 10.4 wasallowed to equilibrate for 10 8 MC cycles, the potential energy of the system was still seen todecrease slowly over time. Clearly, the equilibration of cluster sizes <strong>in</strong> the system happenson timescales much longer than those that can reasonably be simulated directly. This alsoexpla<strong>in</strong>s the marked difference between the direct simulations <strong>and</strong> free-energy calculations:the direct simulations have not yet reached equilibrium. While we do not have such clear<strong>in</strong>dications of change over time <strong>in</strong> the experimental setup, the match between experiments<strong>and</strong> direct simulations strongly suggests that the experimental system is likely far out ofequilibrium as well.The reason for this slow equilibration can be found <strong>in</strong> the rate at which particlesattach <strong>and</strong> detach from the clusters. The free-energy barrier between a monomer <strong>and</strong>larger clusters is shown <strong>in</strong> Fig. 10.5. While the free-energy barrier is 15 k B T <strong>in</strong> height,mak<strong>in</strong>g the growth from cluster size 1 to 20 a rare event, it is important to note that
Colloidal micelles from asymmetric hard dumbbells 145Figure 10.3: Left: Average cluster size as a function of the <strong>in</strong>teraction range q <strong>and</strong> <strong>in</strong>teractionstrength ɛ, for size ratio σ/σ R = 0.76, <strong>and</strong> pack<strong>in</strong>g fraction η = 0.003. Right: Most commoncluster size (ignor<strong>in</strong>g monomers) as a function of the q <strong>and</strong> ɛ for the same system. In both plots,the white <strong>and</strong> blue l<strong>in</strong>es (here nearly on top of eachother) show the cmc <strong>and</strong> the maximum ofthe heat capacity, respectively.Pn0.60.50.40.30.20.111.0 k B T10.0 k B T9.85 k B T9.0 k B T8.0 k B T0.00 5 10 15 20 25nPn1.00.80.60.40.2Ρ1Σ 310⨯10 58⨯10 56⨯10 5 4⨯10 52⨯10 500.000.020.040.060.080.10Η0.00 5 10 15 20 25 30nFigure 10.4: Left: Comparison of experimental results (bars) <strong>and</strong> direct simulations (•) withequilibrium cluster size distributions of dumbbells consist<strong>in</strong>g of a rough <strong>and</strong> a smooth spherewith size ratio σ/σ R = 0.76, pack<strong>in</strong>g fraction η = 0.003 <strong>and</strong> polymer size σ p /σ = 0.02. Inthe direct simulations, ɛ = 10 k B T , <strong>and</strong> for the free-energy calculations ɛ varies from ɛ = 8 to11 k B T , denoted by the colored l<strong>in</strong>es. Right: Cluster size distribution for the same system,with the <strong>in</strong>teraction strength fixed at ɛ = 9.85 k B T , at four different pack<strong>in</strong>g fractions η =0.0001, 0.001, 0.01, <strong>and</strong> 0.1. The <strong>in</strong>set shows the monomer concentration as a function of thepack<strong>in</strong>g fraction, with the colored dots <strong>in</strong>dicat<strong>in</strong>g the po<strong>in</strong>ts correspond<strong>in</strong>g to the distributions<strong>in</strong> the ma<strong>in</strong> figure. The black square denotes the cmc, where exactly half of the dumbbells arepart of a cluster.
146 Chapter 1015Ε ⩵ 9.85 k B T F nkBT10500 5 10 15 20 25nFigure 10.5: Free-energy barrier between small <strong>and</strong> large clusters, at ɛ = 9.85 <strong>and</strong> q = 1.02σ.For this <strong>in</strong>teraction strength, the chemical potential corresponds to the experimental pack<strong>in</strong>gfraction η = 0.003.the diffusion of even a s<strong>in</strong>gle dumbbell <strong>in</strong> or out of a cluster is a slow process as well.To attach to a cluster, the smooth part of a dumbbell has to come with<strong>in</strong> a very shortdistance of the attractive core of that cluster, which is surrounded by repulsive roughspheres. S<strong>in</strong>ce mov<strong>in</strong>g the new dumbbell <strong>in</strong>to this outer shell restricts the movement ofall nearby particles, the accompany<strong>in</strong>g entropy loss effectively forms an additional freeenergybarrier between two consecutive cluster sizes, which becomes higher for <strong>in</strong>creas<strong>in</strong>gcluster size. Conversely, to remove a particle from a cluster, a large potential energybarrier has to be overcome due to the break<strong>in</strong>g of one or more bonds. For larger clusters,remov<strong>in</strong>g a particle from a cluster requires the break<strong>in</strong>g of at least three bonds, if notmore. As this corresponds to a potential energy barrier on the order of 30 k B T , this is anextremely rare event. The slow process of add<strong>in</strong>g or remov<strong>in</strong>g a particle from a cluster islikely responsible for the slow equilibration of the direct simulations: while small clustersup to size 10 are quickly formed, the timescale required to reach a cluster of 20 particlesis simply prohibitively long.Snapshots of clusters of the most common sizes <strong>in</strong> the equilibrium distributions areshown <strong>in</strong> Fig. 10.6. Cluster size 22 corresponds to a very low potential energy due tothe large number of bonds per particle. However, as the rough spheres have very littlefreedom of movement the entropy of such a cluster is low as well. As a result, this typeof cluster only appears at very high <strong>in</strong>teraction strength ɛ. The structure of these largerclusters is generally based on one or more tetrahedral structures of smooth spheres, withthree spheres at each edge of the tetrahedron. These are shown <strong>in</strong> p<strong>in</strong>k <strong>in</strong> the figure. Inpr<strong>in</strong>ciple, this type of structure can be extended <strong>in</strong>def<strong>in</strong>itely, with each smooth sphere <strong>in</strong>contact with on average 7.5 other smooth spheres. The shape of such a structure is shown<strong>in</strong> Fig. 10.7. By reduc<strong>in</strong>g the number of tetrahedrons <strong>in</strong> the structure, <strong>and</strong> remov<strong>in</strong>gthe edge particles with only 3 neighbours, the result<strong>in</strong>g clusters match the lowest-energyclusters observed for sizes 16, 20, 24, <strong>and</strong> 28. However, particularly for larger clusters,these structures are extremely difficult to form both <strong>in</strong> experiments <strong>and</strong> direct simulations.
Colloidal micelles from asymmetric hard dumbbells 147Figure 10.6: Snapshots of the most commonly seen configurations of micelles of size n = 20,22, <strong>and</strong> 23, <strong>in</strong> a system of dumbbells with size ratio σ/σ R = 0.76. The two first columns showthe clusters from two angles, with the rough spheres hidden. In the column on the right, thered spheres are the rough spheres, <strong>and</strong> the blue spheres are smooth.Figure 10.7: C<strong>and</strong>idate for the shape of lowest potential energy clusters as the clustersize<strong>in</strong>creases. Discount<strong>in</strong>g boundary effects, each sphere has 7.5 neighbours on average.
148 Chapter 10Figure 10.8: Left: Average cluster size as a function of the <strong>in</strong>teraction range q <strong>and</strong> <strong>in</strong>teractionstrength ɛ, for size ratio σ/σ R = 0.5, <strong>and</strong> a pack<strong>in</strong>g fraction of η = 0.01. Right: The mostcommon cluster size <strong>in</strong> the same system, ignor<strong>in</strong>g monomers. In both plots, the white <strong>and</strong> bluel<strong>in</strong>es (now nearly on top of eachother) show the cmc <strong>and</strong> the maximum of the heat capacity,respectively.Figure 10.9: Snapshots of the most common configurations of micelles of size n = 12, 16, <strong>and</strong>19, <strong>in</strong> a system of dumbbells with size ratio σ/σ R = 0.5. The two first columns show the clustersfrom two angles, without the rough spheres. In the column on the right, the rough spheres aredenoted by the red spheres <strong>and</strong> the smooth spheres by the blue ones.
Colloidal micelles from asymmetric hard dumbbells 14910.4.2 Size ratio 0.5As seen <strong>in</strong> the previous section, changes to either the <strong>in</strong>teraction details or the dumbbelldensity can be used to <strong>in</strong>fluence the amount of cluster<strong>in</strong>g <strong>in</strong> the system, while the clustersizes that appear are largely unaffected by these parameters. However, as we will demonstrate<strong>in</strong> the rema<strong>in</strong>der of this chapter, the geometry of the dumbbell particles does havea strong <strong>in</strong>fluence on the cluster size distribution, by chang<strong>in</strong>g the preferred curvatureof the micelle surface. A similar effect was seen <strong>in</strong> the study of clusters of cone-shapedparticles, where larger cone angles were shown to lead to smaller cluster sizes.[218] Similarly,for the dumbbells <strong>in</strong>vestigated <strong>in</strong> this chapter, larger rough spheres will stabilizesmaller micelles. In this section, we study the clusters formed <strong>in</strong> <strong>systems</strong> of dumbbellswith a size ratio of σ/σ R = 0.5. The distance between the two spheres was chosen tobe d = (σ + σ R )/2. Figure 10.8 shows the average <strong>and</strong> most common cluster sizes as afunction of the <strong>in</strong>teraction range q <strong>and</strong> <strong>in</strong>teraction strength ɛ, for a fixed pack<strong>in</strong>g fractionη = 0.01. In this case, the system clearly favors clusters of sizes n = 12, 16 <strong>and</strong> 19. Themost common configurations are shown <strong>in</strong> Fig. 10.8, both with <strong>and</strong> without the roughspheres. The <strong>in</strong>terior of the clusters shows crystall<strong>in</strong>e order, <strong>in</strong>creas<strong>in</strong>g the number ofbonded pairs of spheres <strong>in</strong> the cluster. The rough spheres still have a large amount offreedom of movement for most clusters, although some order is seen <strong>in</strong> the cluster of sizen = 19.10.4.3 Size ratio 0.3For size ratio σ/σ R = 0.3, the rough spheres severely limit the number of particles <strong>in</strong>a cluster, <strong>and</strong> clusters larger than size n = 8 are rare. Figure 10.10 shows the averagecluster size as a function of the <strong>in</strong>teraction range q <strong>and</strong> <strong>in</strong>teraction strength ɛ, as well asthe most common cluster sizes. For this size ratio, the particles ma<strong>in</strong>ly formed clusters ofsize n = 6 or 7, with structures typically correspond<strong>in</strong>g to those also seen <strong>in</strong> small clustersof attractive spherical particles. In particular, the smooth spheres <strong>in</strong> the clusters shown<strong>in</strong> Fig. 10.11 are <strong>in</strong> a configuration that m<strong>in</strong>imizes the potential energy for sphericalparticles with short-ranged <strong>in</strong>teractions. [219]10.5 DiscussionUs<strong>in</strong>g Monte Carlo simulations, we have stidied the cluster size distribution for a systemconsist<strong>in</strong>g of dumbbells. The dumbbell particle consists of a smooth sphere withdiameter σ <strong>and</strong> a surface-coated rough sphere with a diameter σ R . The distance betweenthe rough <strong>and</strong> the smooth sphere is equal to d = (σ + σ R )/2, i. e. the spheres are atcontact. We assume hard-sphere <strong>in</strong>teractions between the rough <strong>and</strong> smooth spheres <strong>and</strong>the smooth spheres <strong>in</strong>teract with with an attractive Asakura-Oosawa depletion <strong>in</strong>teraction.By tun<strong>in</strong>g the size ratio of the dumbbells, the size of the clusters can be tuned,assum<strong>in</strong>g equilibrium can be reached. At least up to a size ratio of σ/σ R = 0.76, the generalbehavior of the system does not seem to change qualitatively, although this shouldhappen at larger size ratios, where lamellar structures <strong>and</strong> wide phase coexistences wouldbe likely. In particular, <strong>in</strong> <strong>systems</strong> of purely spherical particles (σ/σ R → ∞), a gas-liquid
150 Chapter 10Figure 10.10: Left: Average cluster size as a function of the <strong>in</strong>teraction range q <strong>and</strong> <strong>in</strong>teractionstrength ɛ, for size ratio σ/σ R = 0.3, <strong>and</strong> a pack<strong>in</strong>g fraction of η = 0.01. The white <strong>and</strong> bluel<strong>in</strong>es show the cmc <strong>and</strong> the maximum of the heat capacity, respectively. Right: The mostcommon cluster size n > 1 <strong>in</strong> the same system.Figure 10.11: Typical clusters of size n = 6 <strong>and</strong> 7 for size ratio σ/σ R = 0.3. For each size,the rough spheres <strong>in</strong> the two pictures on the left are hidden to show the structure of the smoothspheres.
Colloidal micelles from asymmetric hard dumbbells 151coexistence appears <strong>in</strong> the phase diagram for sufficiently long <strong>in</strong>teraction ranges (aroundq/σ ≃ 1.5 [220]). For <strong>colloidal</strong> dumbbells with size ratio σ/σ R = 0.76, this coexistenceappears to be strongly suppressed: no noticeable gas-liquid coexistence was observed upto q/σ = 3 (much longer than physically reasonable for depletion <strong>in</strong>teractions) at anydensity or <strong>in</strong>teraction strength over a wide range <strong>in</strong> Gibbs ensemble Monte Carlo simulations.Instead, either crystall<strong>in</strong>e or fluid-like droplets form with a layer of rough sphereson the outside. While it is possible that it is simply very difficult to equilibrate thesesimulations, it appears that the wide coexistence region is suppressed by the formationof micelles. In sufficiently dense <strong>systems</strong>, a transition to another fluid phase (possiblysimilar to the vesicle phase found <strong>in</strong> spherical Janus particles [211]) could still occur, butfurther study of the system would be required to map out the full phase behavior.The structure of the clusters formed shows similarities between all studied size ratios.For small cluster sizes (up to around 10), the smooth spheres form structures similarto those that m<strong>in</strong>imize the potential energy of spherical particles with short-rangedattractions.[221] However, for larger cluster sizes, the rough spheres prevent configurationswhere a smooth sphere is not on the surface of the cluster. Additionally, the presenceof the rough spheres <strong>in</strong>creases the attraction strength needed to form clusters, s<strong>in</strong>ce thecolloids lose rotational as well as translational freedom by jo<strong>in</strong><strong>in</strong>g a cluster. Higher <strong>in</strong>teractionstrengths cause a preference for more compact clusters, with as many bondsas possible, although this effect is somewhat dim<strong>in</strong>ished by the fact that these compactclusters further <strong>in</strong>hibit the rotational entropy of the particles. For the range of <strong>in</strong>teractionstrengths studied <strong>in</strong> this chapter, a variety of cluster shapes was observed for each clustersize. While the most commonly observed structure often corresponds to the lowest-energystate for that particular cluster size, higher energy configurations are still common, <strong>and</strong>the most common cluster size does not always correspond to the largest number of bonds.Clearly, entropic effects still play an important role <strong>in</strong> determ<strong>in</strong><strong>in</strong>g the structure of theclusters.To prevent the prohibitively long equilibration times <strong>in</strong>volved <strong>in</strong> form<strong>in</strong>g the largerclusters <strong>in</strong> these <strong>systems</strong>, the best strategy would be to focus on reduc<strong>in</strong>g the large energybarriers <strong>in</strong>volved <strong>in</strong> cluster reorganization <strong>and</strong> breakup. This can be done by simplyreduc<strong>in</strong>g the volume fraction of depletants <strong>in</strong> the system (i.e. lower<strong>in</strong>g the <strong>in</strong>teractionstrength ɛ), <strong>and</strong> compensat<strong>in</strong>g for the reduced cluster formation by either <strong>in</strong>creas<strong>in</strong>g the<strong>colloidal</strong> pack<strong>in</strong>g fraction η or the <strong>in</strong>teraction range q. Another option would be to reducethe cluster size by tun<strong>in</strong>g the size ratio, lead<strong>in</strong>g to a smaller number of bonds per particle.10.6 ConclusionsWe <strong>in</strong>vestigated the distribution of cluster sizes <strong>in</strong> <strong>systems</strong> of hard-core asymmetric dumbbells,with depletion <strong>in</strong>teractions between the smaller spheres <strong>in</strong> each dumbbell. We f<strong>in</strong>dthat the number of clusters depends strongly on the pack<strong>in</strong>g fraction, but the cluster sizeis largely <strong>in</strong>dependent of the pack<strong>in</strong>g fraction, <strong>in</strong>teraction range <strong>and</strong> <strong>in</strong>teraction strength.Instead, chang<strong>in</strong>g the size ratio of the dumbbells imposes a preferred curvature on themicelle surface <strong>and</strong> therefore allows for tun<strong>in</strong>g of the cluster size: more asymmetric dumbbellslead to smaller clusters. We compared our results with both Monte Carlo simulations
152 Chapter 10start<strong>in</strong>g from a homogeneous <strong>in</strong>itial configuration, <strong>and</strong> experimental observations. We observeda strong discrepancy between the predicted equilibrium cluster size distribution <strong>and</strong>those <strong>in</strong> both the direct MC simulations <strong>and</strong> experiments. We conclude that both thedirect simulations <strong>and</strong> experiments are far out of equilibrium, due to the prohibitivelylong time scales <strong>in</strong>volved <strong>in</strong> the break<strong>in</strong>g of bonds once they are formed.10.7 AcknowledgementsI would like to thank Daniela Kraft <strong>and</strong> Willem Kegel for their experimental work on thissystem, <strong>and</strong> Ran Ni for perform<strong>in</strong>g the direct Monte Carlo simulations discussed <strong>in</strong> thischapter.
References[1] R. Brown, A brief account of microscopical observations made <strong>in</strong> the months of june, july<strong>and</strong> august, 1827, on the particles conta<strong>in</strong>ed <strong>in</strong> the pollen of plants, <strong>and</strong> on the generalexistence of active molecules <strong>in</strong> organic <strong>and</strong> <strong>in</strong>organic bodies, Phil. Mag. 4, 181 (1828).[2] W. Sutherl<strong>and</strong>, A dynamical theory of diffusion for non-electrolytes <strong>and</strong> the molecularmass of album<strong>in</strong>, Phil. Mag. 9, 781 (1905).[3] A. E<strong>in</strong>ste<strong>in</strong>, Über die von der molekulark<strong>in</strong>etischen theorie der wärme geforderte bewegungvon <strong>in</strong> ruhenden flüssigkeiten suspendierten teilchen, Ann. Phys. (Leipz.) 322, 549 (1905).[4] S. C. Glotzer <strong>and</strong> M. J. Solomon, Anisotropy of build<strong>in</strong>g blocks <strong>and</strong> their <strong>assembly</strong> <strong>in</strong>tocomplex structures, Nature Materials 6, 557 (2007).[5] A.-P. Hynn<strong>in</strong>en, J. H. J. Thijssen, E. C. M. Vermolen, M. Dijkstra, <strong>and</strong> A. Van Blaaderen,Self-<strong>assembly</strong> route for photonic crystals with a b<strong>and</strong>gap <strong>in</strong> the visible region, Nature Materials6, 202 (2007).[6] E. A. Kamenetzky, L. G. Magliocco, <strong>and</strong> H. P. Panzer, Structure of solidified <strong>colloidal</strong>array laser filters studied by cryogenic transmission electron microscopy, Science 263, 207(1994).[7] Y. A. Vlasov, X.-Z. Bo, J. C. Sturm, <strong>and</strong> D. J. Norris, On-chip natural <strong>assembly</strong> of siliconphotonic b<strong>and</strong>gap crystals, Nature 414, 289 (2001).[8] J. G. C. Ve<strong>in</strong>ot, H. Yan, S. M. Smith, J. Cui, Q. Huang, <strong>and</strong> T. J. Marks, Fabrication <strong>and</strong>properties of organic light-emitt<strong>in</strong>g “nanodiode” arrays, Nano Letters 2, 333 (2002).[9] J. H. Holtz <strong>and</strong> S. A. Asher, Polymerized <strong>colloidal</strong> crystal hydrogel films as <strong>in</strong>telligentchemical sens<strong>in</strong>g materials, Nature 389, 829 (1997).[10] J. V. S<strong>and</strong>ers, Close-packed structures of spheres of two different sizes i. observations onnatural opal, Philosophical Magaz<strong>in</strong>e, Part A 42, 705 (1980).[11] W. W. Wood <strong>and</strong> J. D. Jacobson, Prelim<strong>in</strong>ary results from a recalculation of the MonteCarlo equation of state of hard spheres, J. Chem. Phys. 27, 1207 (1957).[12] B. J. Alder <strong>and</strong> T. E. Wa<strong>in</strong>wright, Phase transition for a hard sphere system, J. Chem.Phys. 27, 1208 (1957).[13] P. Pusey <strong>and</strong> W. Van Megen, Phase behaviour of concentrated suspensions of nearly hard<strong>colloidal</strong> spheres, Nature 320, 340 (1986).[14] L. Filion <strong>and</strong> M. Dijkstra, Prediction of b<strong>in</strong>ary hard-sphere crystal structures, Phys. Rev.E 79, 046714 (2009).[15] A. B. Pawar <strong>and</strong> I. Kretzschmar, Fabrication, <strong>assembly</strong>, <strong>and</strong> application of patchy particles,Macromolecular Rapid Communications 31, 150 (2010).[16] Z. Zhang <strong>and</strong> S. C. Glotzer, Self-<strong>assembly</strong> of patchy particles, Nano Letters 4, 1407 (2004).[17] D. Frenkel <strong>and</strong> B. Smit, Underst<strong>and</strong><strong>in</strong>g Molecular Simulations: From Algorithms to Applications(Academic Press, 2002).[18] D. C. Rapaport, The event-driven approach to n-body simulation, Progress of TheoreticalPhysics Supplement 178, 5 (2009).
154 References[19] A. Donev, S. Torquato, <strong>and</strong> F. H. Still<strong>in</strong>ger, Neighbor list collision-driven molecular dynamicssimulation for nonspherical hard particles. I. Algorithmic details, Journal of ComputationalPhysics 202, 737 (2005).[20] L. H. de la Peña, R. van Zon, J. Schofield, <strong>and</strong> S. B. Opps, Discont<strong>in</strong>uous moleculardynamics for semiflexible <strong>and</strong> rigid bodies, J. Chem. Phys 126, 074105 (2007).[21] A. Donev, S. Torquato, <strong>and</strong> F. H. Still<strong>in</strong>ger, Neighbor list collision-driven molecular dynamicssimulation for nonspherical hard particles. II. Applications to ellipses <strong>and</strong> ellipsoids,Journal of Computational Physics 202, 765 (2005).[22] T. B. Jones, R. D. Miller, K. S. Rob<strong>in</strong>son, <strong>and</strong> W. Y. Fowlkes, Multipolar <strong>in</strong>teractions ofdielectric spheres, Journal of Electrostatics 22, 231 (1989).[23] P. P. Ewald, Die Berechnung optischer und elektrostatischer Gitterpotentiale, Annalen derPhysik 369, 253 (1921).[24] A. Yethiraj <strong>and</strong> A. Van Blaaderen, A <strong>colloidal</strong> model system with an <strong>in</strong>teraction tunablefrom hard sphere to soft <strong>and</strong> dipolar, Nature 421, 513 (2003).[25] A. Yethiraj, J. H. J. Thijssen, A. Wouterse, <strong>and</strong> A. van Blaaderen, Large-Area Electric-Field-Induced Colloidal S<strong>in</strong>gle Crystals for Photonic Applications, Advanced materials 16,596 (2004).[26] A.-P. Hynn<strong>in</strong>en <strong>and</strong> M. Dijkstra, Phase diagram of dipolar hard <strong>and</strong> soft spheres: Manipulationof <strong>colloidal</strong> crystal structures by an external field, Phys. Rev. Lett. 94, 138303(2005).[27] M. Parthasarathy <strong>and</strong> D. J. Kl<strong>in</strong>genberg, Electrorheology: mechanisms <strong>and</strong> models, MaterialsScience <strong>and</strong> Eng<strong>in</strong>eer<strong>in</strong>g: R: Reports 17, 57 (1996).[28] R. Tao, Super-strong magnetorheological fluids, Journal of Physics: Condensed Matter 13,R979 (2001).[29] W. Wen, C. Weisbuch, D. M. Phuong, G. Lu, W. Ge, C. T. Chan, <strong>and</strong> P. Sheng, Neutralnanoparticle-based display, Nanotechnology 16, 598 (2005).[30] T.-J. Chen, R. N. Zitter, <strong>and</strong> R. Tao, Laser diffraction determ<strong>in</strong>ation of the crystall<strong>in</strong>estructure of an electrorheological fluid, Phys. Rev. Lett. 68, 2555 (1992).[31] U. Dassanayake, S. Fraden, <strong>and</strong> A. van Blaaderen, Structure of electrorheological fluids, J.Chem. Phys 112, 3851 (2000).[32] C. Holm, A. Ivanov, S. Kantorovich, E. Pyanz<strong>in</strong>a, <strong>and</strong> E. Reznikov, Equilibrium propertiesof a bidisperse ferrofluid with cha<strong>in</strong> aggregates: theory <strong>and</strong> computer simulations, Journalof Physics Condensed Matter 18, 2737 (2006).[33] J. P. Huang, Z. W. Wang, <strong>and</strong> C. Holm, Structure <strong>and</strong> magnetic properties of mono- <strong>and</strong>bi-dispersed ferrofluids as revealed by simulations, Journal of Magnetism <strong>and</strong> MagneticMaterials 289, 234 (2005).[34] M. Klokkenburg, R. P. A. Dullens, W. K. Kegel, B. H. Erné, <strong>and</strong> A. P. Philipse, Quantitativereal-space analysis of <strong>self</strong>-assembled structures of magnetic dipolar colloids, Phys.Rev. Lett. 96, 037203 (2006).[35] P. J. Camp <strong>and</strong> G. N. Patey, Structure <strong>and</strong> scatter<strong>in</strong>g <strong>in</strong> <strong>colloidal</strong> ferrofluids, Phys. Rev.E 62, 5403 (2000).[36] A. O. Ivanov <strong>and</strong> S. S. Kantorovich, Structure of cha<strong>in</strong> aggregates <strong>in</strong> ferrocolloids, ColloidJournal 65, 166 (March 2003).
References 155[37] Z. Wang <strong>and</strong> C. Holm, Structure <strong>and</strong> magnetic properties of polydisperse ferrofluids: Amolecular dynamics study, Phys. Rev. E 68, 041401 (2003).[38] H. See, A. Kawai, <strong>and</strong> F. Ikazaki, The effect of mix<strong>in</strong>g particles of different size on theelectrorheological response under steady shear flow, Rheologica Acta 41, 55 (2002).[39] D. Zerrouki, J. Baudry, D. P<strong>in</strong>e, P. Chaik<strong>in</strong>, <strong>and</strong> J. Bibette, Chiral <strong>colloidal</strong> clusters.,Nature 455, 380 (2008).[40] D. Chakrabarti, S. N. Fejer, <strong>and</strong> D. J. Wales, Rational design of helical architectures,Proceed<strong>in</strong>gs of the National Academy of Sciences 106, 20164 (2009).[41] H. R. Vutukuri, A. F. Demirörs, B. Peng, P. D. J. van Oostrum, A. Imhof, <strong>and</strong> A. vanBlaaderen, Colloidal analogues of charged <strong>and</strong> uncharged polymer cha<strong>in</strong>s with tunable stiffness,Submitted (2011).[42] E. J. W. Verwey <strong>and</strong> J. T. G. Overbeek, Theory of the Stability of Lyotropic Colloids(Elsevier, 1948).[43] G. M. Bell, S. Lev<strong>in</strong>e, <strong>and</strong> L. N. McCartney, Approximate methods of determ<strong>in</strong><strong>in</strong>g thedouble-layer free energy of <strong>in</strong>teraction between two charged <strong>colloidal</strong> spheres, Journal ofColloid <strong>and</strong> Interface Science 33, 335 (1970).[44] A. Satoh, R. W. Chantrell, S.-I. Kamiyama, <strong>and</strong> G. N. Coverdale, Three dimensionalMonte Carlo simulations of thick cha<strong>in</strong>like clusters composed of ferromagnetic f<strong>in</strong>e particles,Journal of Colloid <strong>and</strong> Interface Science 181, 422 (1996).[45] U. Dassanayake, S. Fraden, <strong>and</strong> A. van Blaaderen, Structure of electrorheological fluids, J.Chem. Phys. 112, 3851 (2000).[46] M. S. Wertheim, Fluids with highly directional attractive forces. i. statistical thermodynamics,Journal of Statistical Physics 35, 19 (1984).[47] M. S. Wertheim, Fluids with highly directional attractive forces. ii. thermodynamic perturbationtheory <strong>and</strong> <strong>in</strong>tegral equations, Journal of Statistical Physics 35, 35 (1984).[48] M. S. Wertheim, Fluids with highly directional attractive forces. III. multiple attractionsites, Journal of Statistical Physics 42, 459 (1986).[49] F. Sciort<strong>in</strong>o, E. Bianchi, J. F. Douglas, <strong>and</strong> P. Tartaglia, Self-<strong>assembly</strong> of patchy particles<strong>in</strong>to polymer cha<strong>in</strong>s: A parameter-free comparison between wertheim theory <strong>and</strong> MonteCarlo simulation, J. Chem. Phys. 126, 194903 (2007).[50] G. Bosma, C. Pathmamanoharan, E. H. A. de Hoog, W. K. Kegel, A. van Blaaderen, <strong>and</strong>H. N. W. Lekkerkerker, Preparation of monodisperse, fluorescent pmma-latex colloids bydispersion polymerization, J. Colloid Interf. Sci. 245, 292 (2002).[51] B. Groh <strong>and</strong> S. Dietrich, Crystal structures <strong>and</strong> freez<strong>in</strong>g of dipolar fluids, Phys. Rev. E63, 021203 (2001).[52] S. Klapp <strong>and</strong> F. Forstmann, Phase behavior of aligned dipolar hard spheres: Integralequations <strong>and</strong> density functional results, Phys. Rev. E 60, 3183 (1999).[53] J. Jordanovic <strong>and</strong> S. H. L. Klapp, Field-<strong>in</strong>duced layer formation <strong>in</strong> dipolar nanofilms,Phys. Rev. Lett. 101, 038302 (2008).[54] G. M. Range <strong>and</strong> S. H. L. Klapp, Density-functional study of model bidisperse ferrocolloids<strong>in</strong> an external magnetic field, J. Chem. Phys 122, 224902 (2005).[55] S. H. L. Klapp, Dipolar fluids under external perturbations, Journal of Physics: CondensedMatter 17, R525 (2005).
156 References[56] S. H. L. Klapp <strong>and</strong> M. Schoen, Spontaneous orientational order <strong>in</strong> conf<strong>in</strong>ed dipolar fluidfilms, J. Chem. Phys 117, 8050 (2002).[57] S. Klapp <strong>and</strong> M. Schoen, Ferroelectric states of a dipolar fluid conf<strong>in</strong>ed to a slit-pore,Journal of molecular liquids 109, 55 (2004).[58] J. E. Mart<strong>in</strong>, R. A. Anderson, <strong>and</strong> C. P. Tigges, Simulation of the athermal coarsen<strong>in</strong>g ofcomposites structured by a uniaxial field, J. Chem. Phys 108, 3765 (1998).[59] J. E. Mart<strong>in</strong>, R. A. Anderson, <strong>and</strong> C. P. Tigges, Simulation of the athermal coarsen<strong>in</strong>g ofcomposites structured by a biaxial field, J. Chem. Phys 108, 7887 (1998).[60] J. E. Mart<strong>in</strong>, R. A. Anderson, <strong>and</strong> C. P. Tigges, Thermal coarsen<strong>in</strong>g of uniaxial <strong>and</strong> biaxialfield-structured composites, J. Chem. Phys 110, 4854 (1999).[61] J. E. Mart<strong>in</strong>, R. A. Anderson, <strong>and</strong> R. L. Williamson, Generat<strong>in</strong>g strange magnetic <strong>and</strong>dielectric <strong>in</strong>teractions: Classical molecules <strong>and</strong> particle foams, J. Chem. Phys 118, 1557(2003).[62] J. E. Mart<strong>in</strong>, E. Ventur<strong>in</strong>i, J. Od<strong>in</strong>ek, <strong>and</strong> R. A. Anderson, Anisotropic magnetism <strong>in</strong>field-structured composites, Phys. Rev. E 61, 2818 (2000).[63] V. V. Murashov <strong>and</strong> G. N. Patey, Structure formation <strong>in</strong> dipolar fluids driven by rotat<strong>in</strong>gfields, J. Chem. Phys 112, 9828 (2000).[64] M. E. Leunissen, H. R. Vutukuri, <strong>and</strong> A. van Blaaderen, Direct<strong>in</strong>g Colloidal Self-Assemblywith Biaxial Electric Fields, Advanced Materials 21, 3116 (2009).[65] N. Elsner, C. P. Royall, B. V<strong>in</strong>cent, <strong>and</strong> D. R. E. Snoswell, Simple models for twodimensionaltunable <strong>colloidal</strong> crystals <strong>in</strong> rotat<strong>in</strong>g ac electric fields, J. Chem. Phys 130,154901 (2009).[66] D. Frenkel <strong>and</strong> A. J. C. Ladd, New Monte Carlo method to compute the free energy ofarbitrary solids. Application to the fcc <strong>and</strong> hcp phases of hard spheres, J. Chem. Phys 81,3188 (1984).[67] P. G. Bolhuis, D. Frenkel, S. C. Mau, <strong>and</strong> D. A. Huse, Entropy difference between crystalphases, Nature 388, 235 (1997).[68] R. J. Speedy, Pressure of the metastable hard-sphere fluid, Journal of Physics: CondensedMatter 9, 8591 (1997).[69] P. Bolhuis <strong>and</strong> D. Frenkel, Trac<strong>in</strong>g the phase boundaries of hard spherocyl<strong>in</strong>ders, J. Chem.Phys 106, 666 (1997).[70] T. Sugimoto <strong>and</strong> K. Sakata, Preparation of monodisperse pseudocubic [alpha]-fe2o3 particlesfrom condensed ferric hydroxide gel, Journal of Colloid <strong>and</strong> Interface Science 152,587 (1992).[71] L. Rossi, S. Sacanna, W. T. M. Irv<strong>in</strong>e, P. M. Chaik<strong>in</strong>, D. J. P<strong>in</strong>e, <strong>and</strong> A. P. Philipse,Cubic crystals from cubic colloids, Soft Matter 7, 4139 (2011).[72] C. J. Murphy, T. K. Sau, A. M. Gole, C. J. Orendorff, J. Gao, L. Gou, S. E. Hunyadi,<strong>and</strong> T. Li, Anisotropic metal nanoparticles: Synthesis, <strong>assembly</strong>, <strong>and</strong> optical applications,The Journal of Physical Chemistry B 109, 13857 (2005). PMID: 16852739.[73] Z. Pu, M. Cao, J. Yang, K. Huang, <strong>and</strong> C. Hu, Controlled synthesis <strong>and</strong> growth mechanismof hematite nanorhombohedra, nanorods <strong>and</strong> nanocubes, Nanotechnology 17, 799 (2006).[74] C. Su, H. Wang, <strong>and</strong> X. Liu, Controllable fabrication <strong>and</strong> growth mechanism of hematitecubes, Crystal Research <strong>and</strong> Technology 46, 209 (2011).
References 157[75] B. S. John, C. Juhl<strong>in</strong>, <strong>and</strong> F. A. Escobedo, Phase behavior of <strong>colloidal</strong> hard perfect tetragonalparallelepipeds, J. Chem. Phys 128, 044909 (2008).[76] R. D. Batten, F. H. Still<strong>in</strong>ger, <strong>and</strong> S. Torquato, Phase behavior of <strong>colloidal</strong> superballs:Shape <strong>in</strong>terpolation from spheres to cubes, Phys. Rev. E 81, 061105 (2010).[77] U. Agarwal <strong>and</strong> F. A. Escobedo, Mesophase behaviour of polyhedral particles, NatureMaterials (2011).[78] X. Zhang, Z. Zhang, <strong>and</strong> S. C. Glotzer, Simulation study of dipole-<strong>in</strong>duced <strong>self</strong>-<strong>assembly</strong>of nanocubes, The Journal of Physical Chemistry C 111, 4132 (2007).[79] J. de Graaf, R. van Roij, <strong>and</strong> M. Dijkstra, Dense regular pack<strong>in</strong>gs of irregular nonconvexparticles, Phys. Rev. Lett. 107, 155501 (2011).[80] H. R. Vutukuri, et al., To be published (2011).[81] H. R. Vutukuri, Complex <strong>colloidal</strong> structures by <strong>self</strong>-<strong>assembly</strong> <strong>in</strong> electric fields (PhD Thesis,2012).[82] Y. Sun <strong>and</strong> Y. Xia, Shape-controlled synthesis of gold <strong>and</strong> silver nanoparticles, Science298, 2176 (2002).[83] E. G. Golshte<strong>in</strong> <strong>and</strong> N. V. Tretyakov, Modified Lagrangians <strong>and</strong> Monotone Maps <strong>in</strong> Optimization(Wiley, 1996).[84] E. G. Noya, C. Vega, J. P. K. Doye, <strong>and</strong> A. A. Louis, Phase diagram of model anisotropicparticles with octahedral symmetry, J. Chem. Phys. 127, 054501 (2007).[85] J. M. Polson, E. Trizac, S. Pronk, <strong>and</strong> D. Frenkel, F<strong>in</strong>ite-size corrections to the freeenergies of crystall<strong>in</strong>e solids, J. Chem. Phys. 112, 5339 (2000).[86] B. M. Mladek, P. Charbonneau, C. N. Likos, D. Frenkel, <strong>and</strong> G. Kahl, Multiple occupancycrystals formed by purely repulsive soft particles, J. of Phys.: Cond. Matt. 20, 494245(2008).[87] P. R. ten Wolde, M. J. Ruiz-Montero, <strong>and</strong> D. Frenkel, Numerical calculation of the rateof crystal nucleation <strong>in</strong> a lennard-jones system at moderate undercool<strong>in</strong>g, J. Chem. Phys.104, 9932 (1996).[88] J. A. C. Veerman <strong>and</strong> D. Frenkel, Phase behavior of disklike hard-core mesogens, Phys.Rev. A 45, 5632 (1992).[89] C. H. Bennett <strong>and</strong> B. J. Alder, Studies <strong>in</strong> molecular dynamics. ix. vacancies <strong>in</strong> hard spherecrystals, J. Chem. Phys. 54, 4796 (1971).[90] R. Speedy <strong>and</strong> H. Reiss, Cavities <strong>in</strong> the hard sphere fluid <strong>and</strong> crystal <strong>and</strong> the equation ofstate, Molecular Physics 72, 999 (1991).[91] K. W. Wojciechowski <strong>and</strong> D. Frenkel, Tetratic phase <strong>in</strong> the planar hard square system?,Computational Methods <strong>in</strong> Science <strong>and</strong> Technology 10, 235 (2004).[92] R. J. Hunter, Foundations of colloid science, second edition (Oxford University Press,2001).[93] J. Israelachvili, Intermolecular <strong>and</strong> surface forces, second edition (Academic Press, 1991).[94] J. L. Barrat <strong>and</strong> J. P. Hansen, Basic concepts for simple <strong>and</strong> complex fluids (CambridgeUniversity Press, 2003).[95] B. Derjagu<strong>in</strong> <strong>and</strong> L. L<strong>and</strong>au, Acta Physicochim. USSR 14, 633 (1941).
158 References[96] J. C. Crocker <strong>and</strong> D. G. Grier, Microscopic measurement of the pair <strong>in</strong>teraction potentialof charge-stabilized colloid, Phys. Rev. Lett. 73, 352 (1994).[97] E. B. Sirota, H. D. Ou-Yang, S. K. S<strong>in</strong>ha, P. M. Chaik<strong>in</strong>, J. D. Axe, <strong>and</strong> Y. Fujii, Completephase diagram of a charged <strong>colloidal</strong> system: A synchro- tron x-ray scatter<strong>in</strong>g study, Phys.Rev. Lett. 62, 1524 (1989).[98] Y. Monovoukas <strong>and</strong> A. P. Gast, The experimental phase diagram of charged <strong>colloidal</strong>suspensions, Journal of Colloid <strong>and</strong> Interface Science 128, 533 (1989).[99] T. Okubo, Phase transition between liquid-like <strong>and</strong> crystal-like structures of deionized<strong>colloidal</strong> suspensions, J. Chem. Soc., Faraday Trans. 86, 2871 (1990).[100] T. Okubo, Melt<strong>in</strong>g temperature of <strong>colloidal</strong> crystals of polystyrene spheres, J. Chem. Phys95, 3690 (1991).[101] M. O. Robb<strong>in</strong>s, K. Kremer, <strong>and</strong> G. S. Grest, Phase diagram <strong>and</strong> dynamics of Yukawa<strong>systems</strong>, J. Chem. Phys 88, 3286 (1988).[102] E. J. Meijer <strong>and</strong> D. Frenkel, Melt<strong>in</strong>g l<strong>in</strong>e of Yukawa system by computer simulation, J.Chem. Phys 94, 2269 (1991).[103] S. Hamaguchi, R. T. Farouki, <strong>and</strong> D. H. E. Dub<strong>in</strong>, Triple po<strong>in</strong>t of Yukawa <strong>systems</strong>, Phys.Rev. E 56, 4671 (1997).[104] A.-P. Hynn<strong>in</strong>en <strong>and</strong> M. Dijkstra, Phase diagrams of hard-core repulsive Yukawa particles,Phys. Rev. E 68, 021407 (2003).[105] S. Alex<strong>and</strong>er, P. M. Chaik<strong>in</strong>, P. Grant, G. J. Morales, P. P<strong>in</strong>cus, <strong>and</strong> D. Hone, Chargerenormalization, osmotic pressure, <strong>and</strong> bulk modulus of <strong>colloidal</strong> crystals: Theory, J.Chem. Phys 80, 5776 (1984).[106] M. E. Leunissen, C. G. Christova, A. Hynn<strong>in</strong>en, C. P. Royall, A. I. Campbell, A. Imhof,M. Dijkstra, R. van Roij, <strong>and</strong> A. van Blaaderen, Ionic <strong>colloidal</strong> crystals of oppositelycharged particles, Nature 437, 235 (2005).[107] J. Dobnikar, Y. Chen, R. Rzehak, <strong>and</strong> H. H. von Grünberg, Many-body <strong>in</strong>teractions <strong>and</strong>the melt<strong>in</strong>g of <strong>colloidal</strong> crystals, J. Chem. Phys 119, 4971 (2003).[108] B. Zoetekouw <strong>and</strong> R. van Roij, Nonl<strong>in</strong>ear screen<strong>in</strong>g <strong>and</strong> gas-liquid separation <strong>in</strong> suspensionsof charged colloids, Phys. Rev. Lett. 97, 258302 (2006).[109] Y. Lev<strong>in</strong>, Electrostatic correlations: from plasma to biology, Reports on Progress <strong>in</strong> Physics65, 1577 (2002).[110] P. Wette, H. J. Schöpe, <strong>and</strong> T. Palberg, Experimental determ<strong>in</strong>ation of effective charges<strong>in</strong> aqueous suspensions of <strong>colloidal</strong> spheres, Colloids Surf., A 222, 311 (2003).[111] P. Wette, H. J. Schöpe, <strong>and</strong> T. Palberg, Comparison of <strong>colloidal</strong> effective charges fromdifferent experiments, J. Chem. Phys 116, 10981 (2002).[112] D. Hess<strong>in</strong>ger, M. Evers, <strong>and</strong> T. Palberg, Independent ion migration <strong>in</strong> suspensions ofstrongly <strong>in</strong>teract<strong>in</strong>g charged <strong>colloidal</strong> spheres, Phys. Rev. E 61, 5493 (2000).[113] M. Brunner, C. Bech<strong>in</strong>ger, W. Strepp, V. Lobask<strong>in</strong>, <strong>and</strong> H. H. von GrÃijnberg, Densitydependentpair <strong>in</strong>teractions <strong>in</strong> 2d, EPL (Europhysics Letters) 58, 926 (2002).[114] C. Russ, H. H. von Grünberg, M. Dijkstra, <strong>and</strong> R. van Roij, Three-body forces betweencharged <strong>colloidal</strong> particles, Phys. Rev. E 66, 011402 (2002).
References 159[115] R. Kle<strong>in</strong>, H. H. von Grünberg, C. Bech<strong>in</strong>ger, M. Brunner, <strong>and</strong> V. Lobask<strong>in</strong>, Macroionshield<strong>in</strong>g <strong>and</strong> state-dependent pair potentials <strong>in</strong> <strong>colloidal</strong> suspensions, Journal of Physics:Condensed Matter 14, 7631 (2002).[116] P. Wette, I. Klassen, D. Holl<strong>and</strong>-Moritz, D. M. Herlach, H. J. Schöpe, N. Lorenz, H. Reiber,T. Palberg, <strong>and</strong> S. V. Roth, Communications: Complete description of re-entrant phasebehavior <strong>in</strong> a charge variable <strong>colloidal</strong> model system, J. Chem. Phys 132, 131102 (2010).[117] P. M. Biesheuvel, Evidence for charge regulation <strong>in</strong> the sedimentation of charged colloids,Journal of Physics: Condensed Matter 16, L499 (2004).[118] M. Rasa, B. H. ErnÃľ, B. Zoetekouw, R. van Roij, <strong>and</strong> A. P. Philipse, Macroscopic electricfield <strong>and</strong> osmotic pressure <strong>in</strong> ultracentrifugal sedimentationâĂŞdiffusion equilibria ofcharged colloids, Journal of Physics: Condensed Matter 17, 2293 (2005).[119] R. van Roij, Defy<strong>in</strong>g gravity with entropy <strong>and</strong> electrostatics: sedimentation of chargedcolloids, Journal of Physics: Condensed Matter 15, S3569 (2003).[120] C. P. Royall, M. E. Leunissen, A.-P. Hynn<strong>in</strong>en, M. Dijkstra, <strong>and</strong> A. van Blaaderen, Reentrantmelt<strong>in</strong>g <strong>and</strong> freez<strong>in</strong>g <strong>in</strong> a model system of charged colloids, J. Chem. Phys 124,244706 (2006).[121] J. W. Merrill, S. K. Sa<strong>in</strong>is, <strong>and</strong> E. R. Dufresne, Many-body electrostatic forces between<strong>colloidal</strong> particles at vanish<strong>in</strong>g ionic strength, Phys. Rev. Lett. 103, 138301 (2009).[122] T. Vissers, A. Imhof, F. Carrique, Á. Delgado, <strong>and</strong> A. van Blaaderen, Electrophoresis ofconcentrated <strong>colloidal</strong> dispersions <strong>in</strong> low-polar solvents, Journal of colloid <strong>and</strong> <strong>in</strong>terfacescience (2011).[123] E. Trizac, L. Bocquet, <strong>and</strong> M. Aubouy, Simple approach for charge renormalization <strong>in</strong>highly charged macroions, Phys. Rev. Lett. 89, 248301 (2002).[124] E. Trizac <strong>and</strong> Y. Lev<strong>in</strong>, Renormalized jellium model for charge-stabilized <strong>colloidal</strong> suspensions,Phys. Rev. E 69, 031403 (2004).[125] T. E. Colla, Y. Lev<strong>in</strong>, <strong>and</strong> E. Trizac, A <strong>self</strong>-consistent renormalized jellium approach forcalculat<strong>in</strong>g structural <strong>and</strong> thermodynamic properties of charge stabilized <strong>colloidal</strong> suspensions,J. Chem. Phys 131, 074115 (2009).[126] A. Toyotama, T. Sawada, J. Yamanaka, <strong>and</strong> K. Kitamura, Reentrant behavior <strong>in</strong> the orderdisorderphase transition of a charged monodisperse latex, Langmuir 19, 3236 (2003).[127] L. F. Rojas-Ochoa, R. Castañeda Priego, V. Lobask<strong>in</strong>, A. Stradner, F. Scheffold, <strong>and</strong>P. Schurtenberger, Density dependent <strong>in</strong>teractions <strong>and</strong> structure of charged <strong>colloidal</strong> dispersions<strong>in</strong> the weak screen<strong>in</strong>g regime, Phys. Rev. Lett. 100, 178304 (2008).[128] B. W. N<strong>in</strong>ham <strong>and</strong> V. A. Parsegian, Electrostatic potential between surfaces bear<strong>in</strong>g ionizablegroups <strong>in</strong> ionic equilibrium with physiologic sal<strong>in</strong>e solution, Journal of TheoreticalBiology 31, 405 (1971).[129] D. Y. C. Chan <strong>and</strong> D. J. Mitchell, The free energy of an electrical double layer, Journalof Colloid <strong>and</strong> Interface Science 95, 193 (1983).[130] S. H. Behrens <strong>and</strong> M. Borkovec, Electric double layer <strong>in</strong>teraction of ionizable surfaces:Charge regulation for arbitrary potentials, J. Chem. Phys 111, 382 (1999).[131] T. Gisler, S. F. Schulz, M. Borkovec, H. Sticher, P. Schurtenberger, B. D’Aguanno, <strong>and</strong>R. Kle<strong>in</strong>, Underst<strong>and</strong><strong>in</strong>g <strong>colloidal</strong> charge renormalization from surface chemistry: Experiment<strong>and</strong> theory, J. Chem. Phys 101, 9924 (1994).
160 References[132] H. H. von Grünberg, Chemical charge regulation <strong>and</strong> charge renormalization <strong>in</strong> concentrated<strong>colloidal</strong> suspensions, Journal of Colloid <strong>and</strong> Interface Science 219, 339 (1999).[133] I. Popa, P. S<strong>in</strong>ha, M. F<strong>in</strong>essi, P. Maroni, G. Papastavrou, <strong>and</strong> M. Borkovec, Importance ofcharge regulation <strong>in</strong> attractive double-layer forces between dissimilar surfaces, Phys. Rev.Lett. 104, 228301 (2010).[134] N. Boon <strong>and</strong> R. van Roij, Charge regulation <strong>and</strong> ionic screen<strong>in</strong>g of patchy surfaces, J.Chem. Phys 134, 054706 (2011).[135] T. Palberg, W. Mönch, F. Bitzer, R. Piazza, <strong>and</strong> T. Bell<strong>in</strong>i, Freez<strong>in</strong>g transition for colloidswith adjustable charge: A test of charge renormalization, Phys. Rev. Lett. 74, 4555 (1995).[136] E. Trizac, L. Bocquet, M. Aubouy, <strong>and</strong> H. H. von Grünberg, Alex<strong>and</strong>er’s prescription for<strong>colloidal</strong> charge renormalization, Langmuir 19, 4027 (2003).[137] M. Dijkstra <strong>and</strong> R. van Roij, Vapour-liquid coexistence for purely repulsive po<strong>in</strong>t-Yukawafluids, Journal of Physics: Condensed Matter 10, 1219 (1998).[138] N. Boon, E. C. Gallardo, S. Zheng, E. Eggen, M. Dijkstra, <strong>and</strong> R. van Roij, Screen<strong>in</strong>gof heterogeneous surfaces: charge renormalization of janus particles, Journal of Physics:Condensed Matter 22, 104104 (2010).[139] M. Volmer <strong>and</strong> A. Weber, Keimbildung <strong>in</strong> übersättigten gebilden, Z. Phys. Chem. 119, 277(1926).[140] R. Becker <strong>and</strong> W. Dör<strong>in</strong>g, K<strong>in</strong>etische beh<strong>and</strong>lung der keimbildung <strong>in</strong> übersättigtendämpfern., Ann. Phys. 24, 719 (1935).[141] Y. B. Zeldovich, Theory of new-phase formation: cavitation, Zh. Eksp. Teor. Fiz. 12, 525(1942).[142] P. R. ten Wolde, M. J. Ruiz-Montero, <strong>and</strong> D. Frenkel, Numerical evidence for bcc order<strong>in</strong>gat the surface of a critical fcc nucleus, Phys. Rev. Lett. 75, 2714 (1995).[143] P. R. ten Wolde <strong>and</strong> D. Frenkel, Computer simulation study of gas?liquid nucleation <strong>in</strong> alennard-jones system, J. Chem. Phys. 109, 9901 (1998).[144] S. Auer <strong>and</strong> D. Frenkel, Prediction of absolute crystal-nucleation rate <strong>in</strong> hard-sphere colloids,Nature 409, 1020 (2001).[145] L. Filion, M. Hermes, R. Ni, <strong>and</strong> M. Dijkstra, Crystal nucleation of hard spheres us<strong>in</strong>gmolecular dynamics, umbrella sampl<strong>in</strong>g, <strong>and</strong> forward flux sampl<strong>in</strong>g: A comparison ofsimulation techniques, J. Chem. Phys. 133, 244115 (2010).[146] A. Cuetos <strong>and</strong> M. Dijkstra, K<strong>in</strong>etic pathways for the isotropic-nematic phase transition <strong>in</strong>a system of <strong>colloidal</strong> hard rods: A simulation study, Phys. Rev. Lett. 98, 095701 (2007).[147] A. Cuetos, R. van Roij, <strong>and</strong> M. Dijkstra, Isotropic-to-nematic nucleation <strong>in</strong> suspensionsof <strong>colloidal</strong> rods, Soft Matter 4, 757 (2008).[148] R. Ni, S. Belli, R. van Roij, <strong>and</strong> M. Dijkstra, Glassy dynamics, sp<strong>in</strong>odal fluctuations, <strong>and</strong>the k<strong>in</strong>etic limit of nucleation <strong>in</strong> suspensions of <strong>colloidal</strong> hard rods, Phys. Rev. Lett. 105,088302 (2010).[149] D. Frenkel <strong>and</strong> T. Schill<strong>in</strong>g, Smectic filaments <strong>in</strong> <strong>colloidal</strong> suspensions of rods, Phys. Rev.E 66, 041606 (2002).[150] A. Patti <strong>and</strong> M. Dijkstra, Do multilayer crystals nucleate <strong>in</strong> suspensions of <strong>colloidal</strong> rods?,Phys. Rev. Lett. 102, 128301 (2009).
References 161[151] H. Reiss, The k<strong>in</strong>etics of phase transitions <strong>in</strong> b<strong>in</strong>ary <strong>systems</strong>, J. Chem. Phys. 18, 840(1950).[152] J. W. Cahn <strong>and</strong> J. E. Hilliard, Free energy of a nonuniform system. III. nucleation <strong>in</strong> atwo-component <strong>in</strong>compressible fluid, J. Chem. Phys. 31, 688 (1959).[153] D. W. Oxtoby <strong>and</strong> D. Kashchiev, A general relation between the nucleation work <strong>and</strong> thesize of the nucleus <strong>in</strong> multicomponent nucleation, J. Chem. Phys. 100, 7665 (1994).[154] G. J. Doyle, Self-nucleation <strong>in</strong> the sulfuric acid-water system, J. Chem. Phys. 35, 795(1961).[155] R. G. Renn<strong>in</strong>ger, F. C. Hiller, <strong>and</strong> R. C. Bone, Comment on “Self-nucleation <strong>in</strong> the sulfuricacid-water system”, J. Chem. Phys. 75, 1584 (1981).[156] G. Wilemski, Composition of the critical nucleus <strong>in</strong> multicomponent vapor nucleation, J.Chem. Phys. 80, 1370 (1984).[157] G. Wilemski, Revised classical b<strong>in</strong>ary nucleation theory for aqueous alcohol <strong>and</strong> acetonevapors, J. of Phys. Chem. 91, 2492 (1987).[158] P. Mirabel <strong>and</strong> H. Reiss, Resolution of the “Renn<strong>in</strong>ger-Wilemski problem” concern<strong>in</strong>g theidentification of heteromolecular nuclei, Langmuir 3, 228 (1987).[159] Y. Viisanen, R. Strey, A. Laaksonen, <strong>and</strong> M. Kulmala, Measurement of the molecularcontent of b<strong>in</strong>ary nuclei. II. use of the nucleation rate surface for water-ethanol, J. Chem.Phys. 100, 6062 (1994).[160] A. Laaksonen, M. Kulmala, <strong>and</strong> P. E. Wagner, On the cluster compositions <strong>in</strong> the classicalb<strong>in</strong>ary nucleation theory, J. Chem. Phys. 99, 6832 (1993).[161] P. G. Debenedetti <strong>and</strong> H. Reiss, Reversible work of formation of an embryo of a new phasewith<strong>in</strong> a uniform macroscopic mother phase, J. Chem. Phys. 108, 5498 (1998).[162] A. Laaksonen, R. McGraw, <strong>and</strong> H. Vehkamäki, Liquid-drop formalism <strong>and</strong> free-energysurfaces <strong>in</strong> b<strong>in</strong>ary homogeneous nucleation theory, J. Chem. Phys. 111, 2019 (1999).[163] G. M. Torrie <strong>and</strong> J. P. Valleau, Monte Carlo free energy estimates us<strong>in</strong>g non-boltzmannsampl<strong>in</strong>g: Application to the sub-critical lennard-jones fluid, Chemical Physics Letters 28,578 (1974).[164] J. S. van Duijneveldt <strong>and</strong> D. Frenkel, Computer simulation study of free energy barriers<strong>in</strong> crystal nucleation, J. Chem. Phys. 96, 4655 (1992).[165] S. Punnathanam <strong>and</strong> P. A. Monson, Crystal nucleation <strong>in</strong> b<strong>in</strong>ary hard sphere mixtures: AMonte Carlo simulation study, J. Chem. Phys. 125, 024508 (2006).[166] P. R. ten Wolde <strong>and</strong> D. Frenkel, Numerical study of gas?liquid nucleation <strong>in</strong> partiallymiscible b<strong>in</strong>ary mixtures, J. Chem. Phys. 109, 9919 (1998).[167] D. W. Oxtoby <strong>and</strong> R. Evans, Nonclassical nucleation theory for the gas-liquid transition,J. Chem. Phys. 89, 7521 (1988).[168] S. Auer <strong>and</strong> D. Frenkel, Crystallization of weakly charged <strong>colloidal</strong> spheres: a numericalstudy, Journal of Physics: Condensed Matter 14, 7667 (2002).[169] E. Sanz, C. Valeriani, D. Frenkel, <strong>and</strong> M. Dijkstra, Evidence for out-of-equilibrium crystalnucleation <strong>in</strong> suspensions of oppositely charged colloids, Phys. Rev. Lett. 99, 055501(2007).
162 References[170] C. Valeriani, E. Sanz, <strong>and</strong> D. Frenkel, Rate of homogeneous crystal nucleation <strong>in</strong> moltennacl, J. Chem. Phys. 122, 194501 (2005).[171] D. Moroni, P. R. ten Wolde, <strong>and</strong> P. G. Bolhuis, Interplay between structure <strong>and</strong> size <strong>in</strong> acritical crystal nucleus, Phys. Rev. Lett. 94, 235703 (2005).[172] P. R. Wolde <strong>and</strong> D. Frenkel, Enhancement of prote<strong>in</strong> crystal nucleation by critical densityfluctuations, Science 277, 1975 (1997).[173] L. Filion, M. Hermes, R. Ni, E. C. M. Vermolen, A. Kuijk, C. G. Christova, J. C. P.Stiefelhagen, T. Vissers, A. van Blaaderen, <strong>and</strong> M. Dijkstra, Self-<strong>assembly</strong> of a <strong>colloidal</strong><strong>in</strong>terstitial solid solution with tunable sublattice dop<strong>in</strong>g, Phys. Rev. Lett. 107, 168302(2011).[174] M. Dijkstra, R. van Roij, <strong>and</strong> R. Evans, Phase behavior <strong>and</strong> structure of b<strong>in</strong>ary hard-spheremixtures, Phys. Rev. Lett. 81, 2268 (1998).[175] M. Dijkstra, R. van Roij, <strong>and</strong> R. Evans, Direct simulation of the phase behavior of b<strong>in</strong>aryhard-sphere mixtures: Test of the depletion potential description, Phys. Rev. Lett. 82, 117(1999).[176] M. Dijkstra, R. van Roij, <strong>and</strong> R. Evans, Phase diagram of highly asymmetric b<strong>in</strong>ary hardspheremixtures, Phys. Rev. E 59, 5744 (1999).[177] A. Cacciuto, S. Auer, <strong>and</strong> D. Frenkel, Breakdown of classical nucleation theory nearisostructural phase transitions, Phys. Rev. Lett. 93, 166105 (2004).[178] A. van Blaaderen, Colloidal molecules <strong>and</strong> beyond, Science 301, 470 (2003).[179] E. Duguet, A. Désert, A. Perrozab, <strong>and</strong> S. Rava<strong>in</strong>e, Design <strong>and</strong> elaboration of <strong>colloidal</strong>molecules: an overview, Chem. Soc. Rev. 40, 941 (2011).[180] Y. Y<strong>in</strong> <strong>and</strong> Y. Xia, Self-<strong>assembly</strong> of monodispersed spherical colloids <strong>in</strong>to complex aggregateswith well-def<strong>in</strong>ed sizes, shapes, <strong>and</strong> structures, Adv. Mater. 13, 267 (2001).[181] C. M. Liddell <strong>and</strong> C. J. Summers, Nonspherical zns <strong>colloidal</strong> build<strong>in</strong>g blocks for threedimensionalphotonic crystals, J. Coll. Int. Sci. 274, 103 (2004).[182] P. Johnson, C. van Kats, <strong>and</strong> A. van Blaaderen, Synthesis of <strong>colloidal</strong> silica dumbbells,Langmuir 21, 11510 (2005).[183] D. Kraft, W. Vlug, C. Van Kats, A. Van Blaaderen, A. Imhof, <strong>and</strong> W. Kegel, Self-<strong>assembly</strong>of colloids with liquid protrusions, J. Am. Chem. Soc. 131, 1182 (2008).[184] D. J. Kraft, J. Groenewold, <strong>and</strong> W. K. Kegel, Colloidal molecules with well-controlledbond angles, Soft Matter 5, 3823 (2009).[185] V. N. Manoharan, M. T. Elsesser, <strong>and</strong> D. J. P<strong>in</strong>e, Dense pack<strong>in</strong>g <strong>and</strong> symmetry <strong>in</strong> smallclusters of microspheres, Science 301, 483 (2003).[186] G.-R. Yi, V. Manoharan, E. Michel, M. Elsesser, S.-M. Yang, <strong>and</strong> D. P<strong>in</strong>e, Colloidalclusters of silica or polymer microspheres, Adv. Mater. 16, 1204 (2004).[187] Y.-S. Cho, G.-R. Yi, S.-H. Kim, D. J. P<strong>in</strong>e, <strong>and</strong> S.-M. Yang, Colloidal clusters of microspheresfrom water-<strong>in</strong>-oil emulsions, Chem. Mater. 17, 5006 (2005).[188] Y. Y<strong>in</strong> <strong>and</strong> Y. Xia, Self-<strong>assembly</strong> of monodispersed spherical colloids <strong>in</strong>to complex aggregateswith well-def<strong>in</strong>ed sizes, shapes, <strong>and</strong> structures, Adv. Mater. 13, 267 (2001).[189] Y. Lu, Y. Y<strong>in</strong>, <strong>and</strong> Y. Xia, Three-dimensional photonic crystals with non-spherical colloidsas build<strong>in</strong>g blocks, Adv. Mater. 13, 415 (2001).
References 163[190] V. N. Manoharan, M. T. Elsesser, <strong>and</strong> D. J. P<strong>in</strong>e, Dense pack<strong>in</strong>g <strong>and</strong> symmetry <strong>in</strong> smallclusters of microspheres, Science 301, 483 (2003).[191] G. R. Yi, T. Thorsen, V. N. Manoharan, M. J. Hwang, S. J. Jeon, D. J. P<strong>in</strong>e, S. R. Quake,<strong>and</strong> S. M. Yang, Generation of uniform <strong>colloidal</strong> assemblies <strong>in</strong> soft microfluidic devices,Advanced Materials 15, 1300 (2003).[192] E. Lauga <strong>and</strong> M. P. Brenner, Evaporation-driven <strong>assembly</strong> of <strong>colloidal</strong> particles, Phys.Rev. Lett. 93, 238301 (2004).[193] V. N. Manoharan, Colloidal spheres conf<strong>in</strong>ed by liquid droplets: Geometry, physics, <strong>and</strong>physical chemistry, Solid State Comm. 139, 557 (2006).[194] F. Bai, D. Wang, Z. Huo, W. Chen, L. Liu, X. Liang, C. Chen, X. Wang, Q. Peng, <strong>and</strong>Y. Li, A versatile bottom-up <strong>assembly</strong> approach to <strong>colloidal</strong> spheres from nanocrystals,Angew<strong>and</strong>te Chemie International Edition 46, 6650 (2007).[195] S.-H. Kim, Y.-S. Cho, S.-J. Jeon, T. H. Eun, G.-R. Yi, <strong>and</strong> S.-M. Yang, Microsphereswith tunable refractive <strong>in</strong>dex by controlled <strong>assembly</strong> of nanoparticle, Adv. Mater. 20, 3268(2008).[196] Y.-S. Cho, G.-R. Yi, S.-H. Kim, M. T. Elsesser, D. R. Breed, <strong>and</strong> S.-M. Yang, Homogeneous<strong>and</strong> heterogeneous b<strong>in</strong>ary <strong>colloidal</strong> clusters formed by evaporation-<strong>in</strong>duced <strong>self</strong>-<strong>assembly</strong><strong>in</strong>side droplets, J. Coll. Int. Sci. 318, 124 (2008).[197] Y.-S. Cho, G.-R. Yi, J.-M. Lim, S.-H. Kim, V. N. Manoharan, D. J. P<strong>in</strong>e, <strong>and</strong> S.-M. Yang,Self-organization of bidisperse colloids <strong>in</strong> water droplets, J. Am.. Chem. Soc. 127, 15968(2005).[198] K. L<strong>in</strong>, C.-C. C. L. Lai, <strong>and</strong> H. Chen, Assembly of microspheres with polymers by evaporat<strong>in</strong>gemulsion droplets, Phys. Rev. E 78, 041408 (2008).[199] B. Peng, A. van Blaaderen, <strong>and</strong> A. Imhof, Synthesis of non-spherical PMMA colloids withanistropic protrusions, To be published (2012).[200] P. Pieranski, Two-dimensional <strong>in</strong>terfacial <strong>colloidal</strong> crystals, Phys. Rev. Lett. 45, 569(1980).[201] B. Peng, F. Smallenburg, M. Dijkstra, A. van Blaaderen, <strong>and</strong> A. Imhof, To be published(2012).[202] S. Auer <strong>and</strong> D. Frenkel, L<strong>in</strong>e tension controls wall-<strong>in</strong>duced crystal nucleation <strong>in</strong> hardspherecolloids, Phys. Rev. Lett. 91, 015703 (2003).[203] A. Cacciuto, S. Auer, <strong>and</strong> D. Frenkel, Onset of heterogeneous crystal nucleation <strong>in</strong> <strong>colloidal</strong>suspensions, Nature 428, 404 (2004).[204] M. I. Bodnarchuk, M. V. Kovalenko, H. Groiss, R. Resel, M. Reissner, G. Hesser,R. T. Lechner, W. Ste<strong>in</strong>er, F. SchÃďffler, <strong>and</strong> W. Heiss, Exchange-coupled bimagneticwüstite/metal ferrite core/shell nanocrystals: Size, shape, <strong>and</strong> compositional control, Small5, 2247 (2009).[205] R. J. Renka, Algorithm 772: Stripack: Delaunay triangulation <strong>and</strong> voronoi diagram onthe surface of a sphere, ACM Trans. Math. Softw. 23, 416 (1997).[206] A. R. Bausch, M. J. Bowick, A. Cacciuto, A. D. D<strong>in</strong>smore, M. F. Hsu, D. R. Nelson,M. G. Nikolaides, A. Travesset, <strong>and</strong> D. A. Weitz, Gra<strong>in</strong> boundary scars <strong>and</strong> sphericalcrystallography, Science 299, 1716 (2003).[207] S. C. Glotzer, Some <strong>assembly</strong> required, Science 306, 419 (2004).
164 References[208] E. Bianchi, P. Tartaglia, E. L. Nave, <strong>and</strong> F. Sciort<strong>in</strong>o, Fully solvable equilibrium <strong>self</strong><strong>assembly</strong>process: F<strong>in</strong>e-tun<strong>in</strong>g the clusters size <strong>and</strong> the connectivity <strong>in</strong> patchy particle<strong>systems</strong>, J. Phys. Chem. B 111, 11765 (2007).[209] A. W. Wilber <strong>and</strong> J. P. K. Doyle, Reversible <strong>self</strong>-<strong>assembly</strong> of patchy particles <strong>in</strong>to monodisperseicosahedral clusters, J. Chem. Phys. 127, 085106 (2007).[210] E. Bianchi, J. Largo, P. Tartaglia, E. Zaccarelli, <strong>and</strong> F. Sciort<strong>in</strong>o, Phase diagram of patchycolloids: Towards empty liquids, Phys. Rev. Lett. 97, 168301 (2006).[211] F. Sciort<strong>in</strong>o, A. Giacometti, <strong>and</strong> G. Pastore, Phase diagram of janus particles, Phys. Rev.Lett. 103, 237801 (2009).[212] R. Erhardt, A. B oker, H. Zettl, H. Kaya, W. Pyckhout-H<strong>in</strong>tzen, G. Krausch, V. Abetz,<strong>and</strong> A. H. E. Müller, Janus micelles, Macromolecules 34, 1069 (2001).[213] R. Pool <strong>and</strong> P. G. Bolhuis, Accurate free energies of micelle formation, The Journal ofPhysical Chemistry B 109, 6650 (2005).[214] S. Asakura <strong>and</strong> F. Oosawa, On <strong>in</strong>teraction between two bodies immersed <strong>in</strong> a solution ofmacromolecules, Journal of Chemical Physics 22, 1255 (1954).[215] S. Asakura <strong>and</strong> F. Oosawa, Interaction between particles suspended <strong>in</strong> solutions of macromolecules,Journal of Polymer Science 33, 183 (1958).[216] D. J. Kraft, R. Ni, F. Smallenburg, M. Hermes, K. Yoon, D. A. Weitz, A. van Blaaderen,J. Groenewold, M. Dijkstra, <strong>and</strong> W. K. Kegel, Surface roughness directed <strong>self</strong>-<strong>assembly</strong> of<strong>colloidal</strong> micelles, To be published (2011).[217] J. Kim, R. J. Larsen, <strong>and</strong> D. A. Weitz, Synthesis of nonspherical <strong>colloidal</strong> particles withanisotropic properties, J. Am. Chem. Soc. 128, 14374 (2006).[218] T. Chen, Z. Zhang, <strong>and</strong> S. C. Glotzer, A precise pack<strong>in</strong>g sequence for <strong>self</strong>-assembled convexstructures, Proc. Natl. Acad. Sci. U.S.A. 104, 717 (2007).[219] N. Arkus, V. N. Manoharan, <strong>and</strong> M. P. Brenner, M<strong>in</strong>imal energy clusters of hard sphereswith short range attractions, Phys. Rev. Lett. 103, 118303 (2009).[220] M. Dijkstra, J. M. Brader, <strong>and</strong> R. Evans, Phase behaviour <strong>and</strong> structure of model colloidpolymermixtures, Journal of Physics: Condensed Matter 11, 10079 (1999).[221] G. Meng, N. Arkus, M. P. Brenner, <strong>and</strong> V. N. Manoharan, The free-energy l<strong>and</strong>scape ofclusters of attractive hard spheres, Science 327, 560 (2010).
SummaryA <strong>colloidal</strong> dispersion consists of small particles called colloids, typically tens of nanometersto a few micrometers <strong>in</strong> size, suspended <strong>in</strong> a solvent. Collisions with the much smallerparticles <strong>in</strong> the solvent cause colloids to perform Brownian motion: r<strong>and</strong>omly directedmovements that cause the particles to diffuse through the system. In pr<strong>in</strong>ciple, this motionallow the system of particles to explore all configurations available to them, sampl<strong>in</strong>gall of phase space accord<strong>in</strong>g to the Boltzmann distribution. Analogous to molecular <strong>and</strong>atomic <strong>systems</strong>, <strong>colloidal</strong> <strong>systems</strong> can form disordered gas <strong>and</strong> liquid phases, as well asmore ordered phases such as crystals, liquid crystals, or f<strong>in</strong>ite-sized aggregates. S<strong>in</strong>ce theparticles form these phases based purely on their own <strong>in</strong>teraction <strong>and</strong> the Brownian motionthat results from thermal fluctuations <strong>in</strong> their solvent, the process of form<strong>in</strong>g theseordered structures is called <strong>self</strong>-<strong>assembly</strong>. In this thesis, we study the <strong>self</strong>-<strong>assembly</strong> of avariety of <strong>colloidal</strong> <strong>systems</strong>. We attempt to determ<strong>in</strong>e what structures can be expectedto form, <strong>in</strong>vestigate the order <strong>and</strong> stability of these phases, <strong>and</strong> exam<strong>in</strong>e the nucleationof <strong>self</strong>-assembled crystals. To do this, we make use of computers to simulate the behaviorof <strong>colloidal</strong> particles <strong>in</strong> suspension. Depend<strong>in</strong>g on the system under consideration, weperform either Monte Carlo simulations or event-driven molecular dynamics.In the first few chapters of this thesis, we looked at the behavior of <strong>colloidal</strong> particles<strong>in</strong> an external electric or magnetic field. Typically, <strong>colloidal</strong> particles have a dielectricconstant that is different from that of the solvent material. If such a solution is placed <strong>in</strong>a homogeneous electric field, each particle obta<strong>in</strong>s a dipole moment parallel to the field,lead<strong>in</strong>g to dipole-dipole <strong>in</strong>teractions between the particles. Additionally, the field affectsthe orientation of most anisotropic particles, typically caus<strong>in</strong>g them to align their longestaxis parallel to the electric field. Similarly, if a contrast <strong>in</strong> the magnetic susceptibilityexists between the colloids <strong>and</strong> their solvent, magnetic fields can be used to <strong>in</strong>duce thesedipolar <strong>in</strong>teractions <strong>in</strong>stead. S<strong>in</strong>ce the <strong>in</strong>duced dipole moments have the same direction foreach colloid <strong>in</strong> the system, the system favors configurations where particles are assembled<strong>in</strong>to str<strong>in</strong>g-like clusters along the field direction.In Chapter 2, we study the shape <strong>and</strong> length of these str<strong>in</strong>gs <strong>in</strong> several <strong>systems</strong>. Formonodisperse spheres, we measure the length of the str<strong>in</strong>gs observed at low pack<strong>in</strong>g fractions,<strong>and</strong> show that the results can be accurately predicted us<strong>in</strong>g Wertheim’s perturbationtheory. If two sizes of spheres are used, the structure of the clusters depends strongly onthe size ratio: for highly asymmetric mixtures (size ratio 0.33 or smaller), small particlescluster <strong>in</strong> r<strong>in</strong>g-like <strong>and</strong> flame-like formations around str<strong>in</strong>gs of larger colloids, whilespheres of nearly equal size can form str<strong>in</strong>gs that consist of both species. Around a sizeratio of 0.8, str<strong>in</strong>gs consist<strong>in</strong>g of regularly alternat<strong>in</strong>g large <strong>and</strong> small particles have beenobserved <strong>in</strong> experiments. We are able to see these <strong>in</strong> our simulations as well, but only ifa charge repulsion between the particles is <strong>in</strong>cluded <strong>in</strong> the model. While neither types ofbidisperse str<strong>in</strong>gs studied <strong>in</strong> Chapter 2 are likely to be thermodynamically stable, bothexperiments <strong>and</strong> simulations show that particles can be trapped <strong>in</strong> such str<strong>in</strong>gs for longperiods of time. Recently developed techniques for mak<strong>in</strong>g such str<strong>in</strong>gs permanent couldthus allow for the production of novel composite particles out of these clusters. F<strong>in</strong>ally, we
Summary 167exam<strong>in</strong>e the str<strong>in</strong>gs formed by asymmetric dumbbells <strong>in</strong> an external field. In this case, we<strong>in</strong>vestigate the effects of the size difference between the particles as well as the difference<strong>in</strong> dipole strength. For sufficiently strong <strong>in</strong>teractions between the smaller spheres <strong>in</strong> eachdumbbell, various chiral clusters can be formed.Chapter 3 discusses the phase behavior of <strong>colloidal</strong> spheres <strong>in</strong> a biaxial electric ormagnetic field: a field with a direction that is constantly <strong>and</strong> rapidly rotat<strong>in</strong>g with<strong>in</strong>a fixed plane. Due to the rapid oscillations of the field, the dipole-dipole <strong>in</strong>teractionsbetween the particles at each <strong>in</strong>stant average out to what is effectively an <strong>in</strong>verted dipolar<strong>in</strong>teraction: particles attract each other <strong>in</strong> the plane of the field, but repel <strong>in</strong> the directionperpendicular to that. As a result, sheet-like rather than str<strong>in</strong>g-like clusters are formed,<strong>and</strong> the phase behavior of the system changes significantly. Us<strong>in</strong>g free energy calculations,we map out the phase diagram of both charged <strong>and</strong> uncharged spheres <strong>in</strong> a biaxial field.Both phase diagrams <strong>in</strong>clude a gas-liquid coexistence, <strong>and</strong> stretched face-centered-cubic(fcc) <strong>and</strong> hexagonally-close-packed (hcp) crystal structures. In addition, the chargedspheres <strong>in</strong> a biaxial field exhibit a strongly layered fluid phase.As already shown <strong>in</strong> Chapter 2, apply<strong>in</strong>g external fields to non-spherical particlescan lead to <strong>in</strong>terest<strong>in</strong>g new structures. In Chapter 4, we <strong>in</strong>vestigate the phase behaviorof <strong>colloidal</strong> cubes <strong>in</strong> an external electric field, aga<strong>in</strong> observ<strong>in</strong>g the formation of str<strong>in</strong>glikeclusters, as well as a columnar phase of hexagonally ordered str<strong>in</strong>gs of particles,<strong>and</strong> a body-centered-tetragonal (bct) crystal phase, where all particles are aligned, <strong>and</strong>the str<strong>in</strong>gs are arranged on a square lattice. Colloidal cubes have also recently beensynthesized experimentally, <strong>and</strong> both hexagonal <strong>and</strong> square order were observed <strong>in</strong> asystem of these cubes <strong>in</strong> an external electric field.In Chapter 5, we cont<strong>in</strong>ue our <strong>in</strong>vestigation of <strong>colloidal</strong> cubes, this time without anexternal field. This seem<strong>in</strong>gly simple system of purely hard cubes has been the subject ofseveral studies, <strong>and</strong> its phase behavior was reported to conta<strong>in</strong> a cubatic phase, where theorientations of the particles show long-range order, but the positions are not correlatedover large distances. Us<strong>in</strong>g molecular dynamics simulations, we <strong>in</strong>vestigate the regimewhere this cubatic phase was observed more closely, <strong>and</strong> observe the spontaneous formationof crystal vacancies <strong>in</strong> simulations started <strong>in</strong> the (simple cubic) crystal face. Freeenergy calculations show the stability of a crystal phase with a strik<strong>in</strong>gly high vacancyconcentration, which near the fluid-solid coexistence is orders of magnitude larger thanthat found <strong>in</strong> e.g. hard-sphere <strong>systems</strong>.In several of the chapters <strong>in</strong>volv<strong>in</strong>g dipolar <strong>in</strong>teractions, we have made use of screenedCoulomb potentials to describe the <strong>in</strong>teractions of charged particles <strong>in</strong> solution. In a<strong>colloidal</strong> solution, particles often obta<strong>in</strong> a charge as a result of ions either attach<strong>in</strong>g to thecolloids out of the solvent, or detach<strong>in</strong>g from the colloid surface. In either case, the totalcharge of the suspension should still be zero: the solvent conta<strong>in</strong>s ions of the oppositecharge compensat<strong>in</strong>g for the charge of the particles. Due to electrostatic attractions, theseparticles are attracted to the colloids, <strong>and</strong> form a layer around each colloid that decreases(“screens”) the repulsion between the like-charged colloids. If the surface potentials of thecolloids are sufficiently weak, <strong>and</strong> the double layers of different particles do not stronglyaffect each other, the screened Coulomb potential provides a good model for the result<strong>in</strong>g<strong>in</strong>teractions between the colloids. However, <strong>in</strong> denser or more strongly <strong>in</strong>teract<strong>in</strong>g <strong>systems</strong>,the effective charge <strong>and</strong> screen<strong>in</strong>g length may depend on the presence of other nearby
168 Summaryparticles. In Chapter 6, we use a simple cell model to estimate these parameters for<strong>colloidal</strong> particles with a constant surface potential, <strong>and</strong> calculate phase diagrams basedon the result<strong>in</strong>g <strong>in</strong>teractions. Depend<strong>in</strong>g on the surface potentials, the phase diagramsshow a reentrant fluid phase: for <strong>in</strong>creas<strong>in</strong>g density, the system returns to a fluid stateafter crystalliz<strong>in</strong>g due to a decrease <strong>in</strong> the effective charge.In Chapter 7, we study the nucleation of crystals <strong>in</strong> b<strong>in</strong>ary <strong>systems</strong> of hard spheres.The way small fluctuations <strong>in</strong> a metastable fluid can lead to the nucleation of a more stablephase is traditionally described by classical nucleation theory, which describes the freeenergy of a cluster as a function of its size. Determ<strong>in</strong><strong>in</strong>g the size of a cluster <strong>in</strong> simulationsrequires the def<strong>in</strong>ition of an order parameter that dist<strong>in</strong>guishes the nucleus from thesurround<strong>in</strong>g fluid. Even for monodisperse fluids, the choice of order parameter has some<strong>in</strong>fluence on the structure of the observed clusters. For example, if the order parameter isstrict, only well-ordered clusters will be seen, with the outer layers of disordered particlesexcluded from the cluster. This is not an artifact <strong>in</strong> the simulations, but rather theresult of the way the same clusters are described. We study the effect of the choice oforder parameter <strong>in</strong> b<strong>in</strong>ary <strong>systems</strong>, <strong>and</strong> compare the result<strong>in</strong>g theoretical predictions withsimulations done on two model <strong>systems</strong>, one where the two species were the same size,<strong>and</strong> only artificially labeled as two different species, <strong>and</strong> one with two different sizes ofhard spheres.Chapters 8 <strong>and</strong> 9 <strong>in</strong>vestigate the behavior of particles <strong>in</strong> evaporat<strong>in</strong>g emulsion droplets.Experimentally, the evaporation of droplets can be used to force <strong>colloidal</strong> particles suspended<strong>in</strong>side the droplets to form roughly spherical clusters. If this technique is usedon small numbers of spheres (up to around 16), there is generally one specific shapefor clusters of each size, readily reproducible even <strong>in</strong> significantly different experimental<strong>systems</strong>. For a few cluster sizes, two or three options exist for the result<strong>in</strong>g shape. InChapter 8, we model the formation of these clusters with a very simple model, wherehard spheres are compressed <strong>in</strong> spherical conf<strong>in</strong>ement. Additionally, we <strong>in</strong>vestigate theclusters formed by small numbers of symmetric or asymmetric dumbbells, <strong>and</strong> comparethe results to experiments. Chapter 9 <strong>in</strong>vestigates the evaporation of droplets conta<strong>in</strong><strong>in</strong>gmore particles, yield<strong>in</strong>g clusters consist<strong>in</strong>g of thous<strong>and</strong>s of spheres. In this case, multiplecrystal doma<strong>in</strong>s nucleate <strong>and</strong> grow <strong>in</strong>wards from the conf<strong>in</strong><strong>in</strong>g walls. We compare theshape of these wedge-shaped doma<strong>in</strong>s with crystal doma<strong>in</strong>s observed <strong>in</strong> recent experimentson clusters of nanoparticles, <strong>and</strong> f<strong>in</strong>d good agreement. Additionally, we <strong>in</strong>vestigatethe effects of wall-particle <strong>and</strong> particle-particle repulsions.F<strong>in</strong>ally, Chapter 10 describes the use of asymmetric dumbbells as a <strong>colloidal</strong> modelsystem for micelles. In surfactant <strong>systems</strong>, micelles are formed by large molecules withone hydrophilic side <strong>and</strong> one hydrophobic side. When placed <strong>in</strong> water, these surfactantscluster together <strong>in</strong>to micelles, where the hydrophobic parts are surrounded by a shell ofhydrophilic material. Similar clusters can be formed by asymmetric dumbbells, where onlythe smaller spheres <strong>in</strong> each dumbbell attract each other. Such a system can be realizedexperimentally us<strong>in</strong>g depletion <strong>in</strong>teractions: by apply<strong>in</strong>g a rough coat<strong>in</strong>g to the largersphere <strong>in</strong> each dumbbell, it is possible to ensure that only the smaller spheres attract. Westudy the cluster size distribution <strong>in</strong> such <strong>systems</strong>, <strong>and</strong> exam<strong>in</strong>e the shape of the result<strong>in</strong>gclusters. Comparisons between free energy calculations, direct Monte Carlo simulations,<strong>and</strong> experiments suggest that the short <strong>in</strong>teraction range required <strong>in</strong> this approach leads
Summary 169to very slow equilibration of the system, with non-equilibrium effects strongly limit<strong>in</strong>gthe cluster size.
Samenvatt<strong>in</strong>gColloïden zijn microscopisch kle<strong>in</strong>e deeltjes (normaal gesproken tussen enkele tientallennanometers en een paar micrometer <strong>in</strong> grootte), beduidend groter dan atomen en demeeste moleculen, maar te kle<strong>in</strong> om met het blote oog te zien. Een colloïdale suspensiebestaat uit een oplosmiddel waar<strong>in</strong> dit soort deeltjes zijn opgelost. In veel gevallen gaathet hier om vaste deeltjes <strong>in</strong> een vloeistof (denk bijvoorbeeld aan pigmentdeeltjes <strong>in</strong> verfof <strong>in</strong>kt), maar de deeltjes kunnen ook gevormd worden door kle<strong>in</strong>e gasbelletjes (scheerschuim)of druppeltjes van een <strong>and</strong>ere vloeistof (mayonaise). Een van de belangrijksteredenen dat colloïdale systemen <strong>in</strong>teressant zijn is de chaotische beweg<strong>in</strong>g van de colloïden:als je zulke deeltjes onder een microscoop bekijkt, zie je dat ze cont<strong>in</strong>u <strong>in</strong> beweg<strong>in</strong>g zijnen willekeurig van richt<strong>in</strong>g ver<strong>and</strong>eren. Deze zogenaamde Brownse beweg<strong>in</strong>gen, genoemdnaar Robert Brown, die dit gedrag bestudeerde <strong>in</strong> 1827, zijn het gevolg van de beweg<strong>in</strong>gvan de moleculen <strong>in</strong> het oplosmiddel, die voortdurend van alle kanten tegen het deeltjebotsen. Hoewel de bots<strong>in</strong>gen van verschillende kanten elkaar tegenwerken, en elke bots<strong>in</strong>gop zich maar we<strong>in</strong>ig energie overdraagt op het deeltje, zijn colloïdale deeltjes licht genoegom door dit bombardement van moleculen voortdurend <strong>in</strong> beweg<strong>in</strong>g te blijven. Hoeweldit effect ook plaats v<strong>in</strong>dt voor grotere deeltjes (mensen worden immers ook voortdurendvan alle kanten geraakt door moleculen <strong>in</strong> de lucht), zijn de verplaats<strong>in</strong>gen voor deeltjesgroter dan een paar micrometer <strong>in</strong> het algemeen verwaarloosbaar kle<strong>in</strong>.Brownse beweg<strong>in</strong>g heeft belangrijke gevolgen voor de structuur van een colloïdalesuspensie. Denk bijvoorbeeld aan een enkel deeltje, iets zwaarder dan de omr<strong>in</strong>gendevloeistof. Zwaartekracht zal dit deeltje naar beneden trekken, en zonder Brownse beweg<strong>in</strong>gzou het uite<strong>in</strong>delijk op de bodem blijven liggen. Een deeltje dat licht genoeg is kanechter door Brownse beweg<strong>in</strong>g alsnog omhoog geduwd worden, en <strong>in</strong> pr<strong>in</strong>cipe de hele metvloeistof gevulde ruimte verkennen. De zwaartekracht zal er nog steeds voor zorgen dathet deeltje vaker bij de bodem te v<strong>in</strong>den is dan ver erv<strong>and</strong>aan, al kan dit effect tenietworden gedaan door deeltjes te maken uit een materiaal met dezelfde dichtheid als hetoplosmiddel. De kansverdel<strong>in</strong>g voor de hoogte van het systeem kan eenvoudig bepaaldworden uit de potentiële energie van het deeltje op elke hoogte: hoe hoger de energie, hoeonwaarschijnlijker het is om het deeltje op die hoogte te v<strong>in</strong>den. In de praktijk bevattencolloïdale systemen grote aantallen deeltjes, en het aantal mogelijke configuraties <strong>in</strong> eensysteem is dan enorm groot. In dit geval wordt het gedrag van de deeltjes sterk beïnvloeddoor de <strong>in</strong>teracties tussen de deeltjes: deeltjes met dezelfde lad<strong>in</strong>g stoten elkaar bijvoorbeeldaf, en zullen dus het liefst ver uit elkaar blijven om de energie van het systeemte m<strong>in</strong>imaliseren. Zulke afstotende (of aantrekkende) krachten kunnen leiden tot de vorm<strong>in</strong>gvan kristalstructuren, waar<strong>in</strong> de afst<strong>and</strong> tussen naburige deeltjes zo groot (of juistzo kle<strong>in</strong>) mogelijk is. Zelfs zonder dit soort <strong>in</strong>teracties kunnen kristallen gevormd worden:een systeem van harde bollen kan bijvoorbeeld kristalliseren omdat, bij voldoende hogedichtheden, er maar we<strong>in</strong>ig ongeordende configuraties bestaan waar<strong>in</strong> de deeltjes niet overlappen,vergeleken met configuraties waar<strong>in</strong> de deeltjes (ongeveer) op een kristalroosterzijn geordend. Met <strong>and</strong>ere woorden, het is makkelijker bollen dicht op elkaar te pakkenals ze netjes zijn opgestapeld. Niet alleen de energie van configuraties is dus van belang,
Samenvatt<strong>in</strong>g 171maar ook het aantal manieren waarop een toest<strong>and</strong> gevormd kan worden. De entropievan het systeem <strong>in</strong> een bepaalde toest<strong>and</strong> is een maat voor dit aantal mogelijkheden.Dit samenspel tussen energie en entropie kan leiden tot een rijk fasegedrag <strong>in</strong> colloïdalesystemen: niet alleen kunnen colloïden kristallen vormen, maar ook vloeistoffen en gassen.Daarnaast kunnen anisotrope colloïden (die dus niet bolvormig zijn) zich <strong>in</strong> verschillendetoest<strong>and</strong>en bev<strong>in</strong>den waar<strong>in</strong> ze niet geordend op een kristalrooster zijn geplaatst, maarbijvoorbeeld wel allemaal dezelfde kant op wijzen: zogenaamde vloeibare kristallen. Hetomgekeerde is ook mogelijk: een kristal van colloïden die vrij rond kunnen draaien wordtwel een plastisch kristal genoemd.Om te voorspellen <strong>in</strong> welke toest<strong>and</strong> een colloïdaal systeem zich onder bepaalde omst<strong>and</strong>ighedenwaarschijnlijk zal bev<strong>in</strong>den moet <strong>in</strong> pr<strong>in</strong>cipe reken<strong>in</strong>g gehouden worden metalle mogelijke configuraties van een systeem. In de praktijk maakt het grote aantal mogelijkhedenexacte bereken<strong>in</strong>gen meestal onmogelijk voor systemen van meer dan een paardeeltjes. In plaats daarvan gebruiken we vaak computersimulaties om configuraties tegenereren die voorkomen met dezelfde kansverdel<strong>in</strong>g als waar<strong>in</strong> ze <strong>in</strong> werkelijkheid voorzouden komen. In dit proefschrift wordt daarbij gebruik gemaakt van twee simulatiemethoden:Monte Carlo simulaties en moleculaire dynamica. In Monte Carlo simulaties wordeneen reeks configuraties gemaakt door telkens de vorige configuratie een kle<strong>in</strong> beetje tever<strong>and</strong>eren door bijvoorbeeld een deeltje willekeurig te verplaatsen, en de wijzig<strong>in</strong>g af tewijzen of te accepteren op basis van het energieverschil tussen de oude en de nieuwe configuratie.Simulaties die gebruik maken van moleculaire dynamica berekenen de beweg<strong>in</strong>genvan de deeltjes <strong>in</strong> het systeem op basis van de krachten tussen de deeltjes en de wettenvan Newton. Hoewel voor geen van beide simulatiemethoden de dynamica van de deeltjesprecies overeenkomt met die <strong>in</strong> een colloïdaal systeem, kan aangetoond worden dat hetfasegedrag van een systeem onafhankelijk is van de manier waarop de deeltjes bewegen,aangenomen dat het systeem zich <strong>in</strong> een evenwichtstoest<strong>and</strong> bev<strong>in</strong>dt. Hierdoor kunnencomputersimulaties gebruikt worden om het gedrag van colloïdale systemen te voorspellenen te verklaren, aangenomen dat we op de hoogte zijn van de <strong>in</strong>teracties tussen de deeltjes,en van eventuele externe factoren die het systeem beïnvloeden. In sommige gevallen kunnenzulke simulaties gebruikt worden om directe waarnem<strong>in</strong>gen <strong>in</strong> het systeem te doen,maar <strong>in</strong> veel gevallen is het nauwkeuriger om simulaties toe te passen voor met<strong>in</strong>gen diegebruikt worden <strong>in</strong> het berekenen van de vrije energie van de verschillende fasen: eenmaat voor de relatieve waarschijnlijkheid om een systeem <strong>in</strong> een bepaalde toest<strong>and</strong> aante treffen.In de eerste paar hoofdstukken van dit proefschrift bestuderen we het gedrag vancolloïden <strong>in</strong> externe elektrische of magnetische velden. Beide velden hebben ongeveerdezelfde werken op de colloïdale deeltjes: ze wekken een dipoolmoment op <strong>in</strong> elk deeltje,dat er voor zorgt dat de deeltjes zich gaan gedragen als kle<strong>in</strong>e parallele magneetjes. Bij eenverticaal veld trekken twee deeltjes elkaar dus aan als ze boven elkaar liggen, maar stotenelkaar af als ze zich naast elkaar bev<strong>in</strong>den. Dit heeft als gevolg dat de deeltjes zichzelfordenen <strong>in</strong> kett<strong>in</strong>gvormige clusters parallel aan de veldricht<strong>in</strong>g, die zich bij hoge dichthedenweer ordenen <strong>in</strong> een kristalstructuur. In hoofdstuk 2 bekijken we de structuur en lengtevan deze kett<strong>in</strong>gen <strong>in</strong> systemen van bolvormige deeltjes, en bestuderen we het effecten vanhet mengen van deeltjes van twee verschillende grootten. In hoofdstuk 3 modelleren weeen iets <strong>and</strong>er extern veld, waarvan de richt<strong>in</strong>g met hoge snelheid ronddraait. Hierdoor
172 Samenvatt<strong>in</strong>gworden de <strong>in</strong>teracties tussen de deeltjes precies omgedraaid, zodat ze hexagonale vlakkenvan deeltjes vormen <strong>in</strong> plaats van kett<strong>in</strong>gen. We berekenen het fasegedrag van dit systeemzowel voor geladen als ongeladen deeltjes. In hoofdstuk 4 bekijken we weer een elektrischveld <strong>in</strong> een constante richt<strong>in</strong>g, maar ditmaal met kubusvormige deeltjes. De meeste van decolloïdale systemen <strong>in</strong> deze hoofdstukken zijn recentelijk ook experimenteel gerealiseerd,en we vergelijken onze resultaten met de structuren die zijn waargenomen <strong>in</strong> experimenteleobservaties.Hoofdstuk 5 kijkt <strong>in</strong> meer detail naar het fasegedrag van kubussen, ditmaal zonderlad<strong>in</strong>g en externe velden. Zonder de aanwezigheid van <strong>in</strong>teracties speelt alleen de entropieeen rol voor het fasegedrag. Eerder onderzoek aan dit systeem gaf het vermoeden dathet een zogenaamde kubatische fase zou vertonen (waar<strong>in</strong> de deeltjes niet op een kristalroosterzitten, maar wel allemaal ongeveer dezelfde oriëntatie hebben). Onze simulaties enbereken<strong>in</strong>gen wijzen hier niet op, maar tonen de stabiliteit aan van een kristalfase waar<strong>in</strong>een verrassend hoog aantal lege plekken op het kristalrooster zitten. Hoewel bekend wasdat kristallen <strong>in</strong> evenwicht vrijwel altijd een kle<strong>in</strong>e hoeveelheid van zulke defecten bevatten,kan de concentratie <strong>in</strong> dit systeem ruim 100 keer groter zijn dan <strong>in</strong> bijvoorbeeldkristallen van harde bollen. Daarnaast bleek dat het toevoegen van defecten aan eenkristal, tegengesteld aan wat je zou verwachten, de mate van orde <strong>in</strong> het systeem kanverhogen.In hoofdstuk 6 bekijken we hoe de <strong>in</strong>teractie tussen geladen bollen ver<strong>and</strong>ert als dedichtheid van het systeem toeneemt, en berekenen we de effecten daarvan op het fasegedrag.Omdat de effectieve lad<strong>in</strong>g van dit soort deeltjes verm<strong>in</strong>dert als de dichtheid toeneemt,kan het voorkomen dat een systeem als functie van een toenemende dichtheid eersteen vloeibare fase, dan een kristal, dan weer een vloeibare fase, en uite<strong>in</strong>delijk weer eenkristalfase vertoont.Hoofdstuk 7 beh<strong>and</strong>elt de vorm<strong>in</strong>g van kristallen <strong>in</strong> mengsels van harde bollen mettwee verschillende diameters. Kristallisatie beg<strong>in</strong>t <strong>in</strong> veel gevallen met een proces datnucleatie wordt genoemd: ergens <strong>in</strong> de vloeistof ontstaat als gevolg van Brownse beweg<strong>in</strong>geen gebiedje waar de deeltjes meer geordend zijn dan <strong>in</strong> hun omgev<strong>in</strong>g. Een erg kle<strong>in</strong>ekristalvormige nucleus is <strong>in</strong> pr<strong>in</strong>cipe niet stabiel als gevolg van de oppervlaktespann<strong>in</strong>g,waardoor grenslagen tussen kristal en vloeistof <strong>in</strong> het systeem de entropie van een systeemverm<strong>in</strong>deren. Als zo’n nucleus echter groter wordt dan een zekere kritieke grootte, dankan hij uitgroeien tot een groot kristal. Omdat zulke gevallen van nucleatie meestal vrijzeldzaam zijn <strong>in</strong> een systeem dat kle<strong>in</strong> genoeg is om op een computer te kunnen simuleren,zijn er speciale methoden nodig om nucleatie <strong>in</strong> simulaties te bekijken. Een methodedaarvoor is Umbrella Sampl<strong>in</strong>g, waarbij simulaties uitgevoerd worden met de restrictiedat de grootste kristalcluster <strong>in</strong> het systeem (ongeveer) een specifiek aantal deeltjes moetbevatten. Door zulke simulaties te comb<strong>in</strong>eren kan dan berekend worden hoe groot eenkritieke cluster is, en hoe vaak zo’n cluster voorkomt. Hoe je de grootte van een clusterbepaalt is hierbij erg belangrijk, en <strong>in</strong> dit hoofdstuk bekeken we hoe de keuze van eenmethode daarvoor de gemeten resultaten kan beïnvloeden.In hoofdstuk 8 en 9 bestuderen we het gedrag van bollen en dumbbells (deeltjes diebestaan uit twee bollen die aan elkaar vastzitten) <strong>in</strong> verdampende druppels. In recentonderzoek worden verdampende druppels regelmatig gebruikt kle<strong>in</strong>e deeltjes samen tepersen tot al dan niet geordende clusters. De structuur van de clusters wordt bepaald
Samenvatt<strong>in</strong>g 173door onder <strong>and</strong>ere de vorm van de deeltjes, en de <strong>in</strong>teracties tussen de w<strong>and</strong> en de deeltjes.We bekeken verschillende simpele modellen om de structuur van de resulterendeclusters te voorspellen, en vergeleken onze resultaten met observaties <strong>in</strong> experimentelesystemen. Voor grote aantallen (duizenden) bollen kan dit leiden tot <strong>in</strong>teressant gevormdekristaldome<strong>in</strong>en, die als taartpunten <strong>in</strong> elkaar passen. Voor kle<strong>in</strong>ere aantallen bollenen dumbbells zijn de gevormde clusters vaak zeer reproduceerbaar, en komen de experimenteleen gesimuleerde structuren goed overeen.Het laatste hoofdstuk kijkt opnieuw naar clusters van dumbbells, ditmaal gevormddoor aantrekkende krachten tussen de deeltjes: elke dumbbell bestaat uit een grote en eenkle<strong>in</strong> bol, en de kle<strong>in</strong>ere bollen trekken elkaar op korte afst<strong>and</strong> aan. Hierdoor ontstaanzogenaamde colloïdale micellen: clusters waar<strong>in</strong> de kle<strong>in</strong>e bollen <strong>in</strong> het midden zitten,terwijl de grotere de buitenkant afschermen. Door deze afscherm<strong>in</strong>g is het lastig omnieuwe deeltjes aan een besta<strong>and</strong>e cluster toe te voegen, en het berekenen van de vrijeenergie van clusters van verschillende formaten tonen dan ook aan dat <strong>in</strong> veel gevallen hetvoor directe simulaties aan dergelijke systemen vrijwel onmogelijk is om een evenwichtstoest<strong>and</strong>te bereiken. De uitwissel<strong>in</strong>g van deeltjes tussen clusters wordt uite<strong>in</strong>delijk zotraag dat de clusters nooit de grootte bereiken die ze <strong>in</strong> een evenwichtstoest<strong>and</strong> zoudenhebben. Vergelijk<strong>in</strong>gen met een experimenteel systeem waar<strong>in</strong> dezelfde clusters werdengeproduceerd suggereren dat daar hetzelfde gebeurt.In het kort hebben we dus een reeks colloiïdale systemen bestudeerd die nu of <strong>in</strong>de nabije toekomst ook experimenteel gerealiseerd kunnen worden, en geprobeerd tevoorspellen welke structuren deze systemen zullen vormen. Hoewel directe praktischetoepass<strong>in</strong>gen van dit onderzoek niet makkelijk te v<strong>in</strong>den zullen zijn, wordt er <strong>in</strong> hetdagelijks leven op genoeg plaatsen van colloïden gebruik gemaakt om ervoor te zorgen dateen beter begrip van het gedrag van zulke deeltjes nuttig kan zijn. Daarnaast is er grote<strong>in</strong>teresse <strong>in</strong> het gebruik van colloïdale structuren voor de manipulatie van licht, bijvoorbeeld<strong>in</strong> zogenaamde optische schakel<strong>in</strong>gen. Doordat de deeltjesafst<strong>and</strong> <strong>in</strong> een colloïdaalkristal dezelfde orde van grootte hebben als de golflengte van zichtbaar licht, kunnen ditsoort kristallen <strong>in</strong> pr<strong>in</strong>cipe gebruikt worden om lichtsignalen met grote nauwkeurigheid temanipuleren, afhankelijk van de kristalstructuur. Ook voor het maken van deze fotonischekristallen zijn voorspell<strong>in</strong>gen over de manieren waarop colloïdale deeltjes zichzelf kunnenordenen van groot belang.
AcknowledgementsF<strong>in</strong>ally, I would like to extend my thanks to all the people who have helped me br<strong>in</strong>g thisthesis <strong>in</strong>to be<strong>in</strong>g. Four years of research is a long time, <strong>and</strong> it would not have been nearlyas <strong>in</strong>terest<strong>in</strong>g, fun, <strong>and</strong> satisfy<strong>in</strong>g without the support <strong>and</strong> company of those around me.First of all, the Soft Condensed Matter group <strong>in</strong> <strong>Utrecht</strong> is, by any measure, a wonderfulgroup to work <strong>in</strong>. Marjole<strong>in</strong>, of course this thesis could not have been made withoutyou: thank you for your excellent supervision. Your great <strong>in</strong>terest <strong>in</strong> my work, your swiftresponses, the door to your office that was always open, <strong>and</strong> our many <strong>in</strong>terest<strong>in</strong>g discussionsmade do<strong>in</strong>g research <strong>in</strong> <strong>Utrecht</strong> <strong>in</strong>to the highly <strong>in</strong>terest<strong>in</strong>g, educational, <strong>and</strong> funexperience that it has been for me. Additionally, I should thank you, Alfons, Arnout <strong>and</strong>René for br<strong>in</strong>g<strong>in</strong>g together a great group of researchers that comb<strong>in</strong>e theory, experiments<strong>and</strong> simulations <strong>in</strong>to many collaborations. I may have learned as much from our comb<strong>in</strong>edworkdiscussions as from my own research!Next, I would like to thank my officemates over the last years. Laura, Emmanuela,Ran, Anjan: thank you all for many lively discussions, debates, <strong>and</strong> arguments, on awide variety of subjects. Statistical physics, nucleation, weird bugs <strong>in</strong> our codes, detailedbalance, the politics <strong>in</strong> various countries, cultural differences between the Dutch <strong>and</strong>others, <strong>and</strong> many other topics... I could not wish for a nicer or more <strong>in</strong>terest<strong>in</strong>g office!Both <strong>in</strong>side <strong>and</strong> outside the Soft Condensed Matter group there are many peoplewho deserve my thanks for their collaboration <strong>and</strong> help with many th<strong>in</strong>gs. Michiel, notthe least for his work on the visualization program that has been <strong>in</strong>credibly useful tome <strong>and</strong> many others. Matthieu, for all his helpful advice on free energy calculations,simulation methods, <strong>and</strong> many other th<strong>in</strong>gs. Laura, for all her work on hard cubes, formore discussions <strong>in</strong> the office than I can count, <strong>and</strong> her help <strong>in</strong> improv<strong>in</strong>g the language<strong>in</strong> many of my writ<strong>in</strong>gs. Ran, for his work on nucleation, <strong>and</strong> for all the times wefilled the whiteboard dur<strong>in</strong>g our useful discussions. Chantal, whose tips <strong>and</strong> code forEwald summations helped me get started four years ago. Bart, for his collaboration onnanoparticles <strong>in</strong> emulsion droplets. Bo, for the fabrication of the small clusters of spheres<strong>and</strong> dumbbells <strong>in</strong> similar droplets. B<strong>in</strong>g, whose droplets are filled with rods <strong>in</strong>stead, <strong>and</strong><strong>in</strong>spired some of my simulations not shown <strong>in</strong> this thesis. Rao, whose experimental workwas the ma<strong>in</strong> <strong>in</strong>spiration for simulations on particles <strong>in</strong> external fields, <strong>and</strong> who evenmanaged to drag me <strong>in</strong>to the lab on a few occasions! Peter <strong>and</strong> Djamel, try<strong>in</strong>g to figureout the <strong>in</strong>teractions between charged particles with both of you was a lot of fun. Johan<strong>and</strong> Ahmet, our work on clusters of oppositely charged colloids has not quite made itonto paper yet, but hopefully it still will. Teun, thanks for many <strong>in</strong>terest<strong>in</strong>g chats bothon oppositely charged colloids <strong>and</strong> your simulations of patchy particles. Joost, thank youfor supply<strong>in</strong>g me with a Monte Carlo code for cubes, <strong>and</strong> for all your work that madethe group run more smoothly. Niels, for your calculations <strong>and</strong> help on particles with aconstant surface potential. René I would like to thank for his help on this project aswell, for organiz<strong>in</strong>g the theory workdiscusions, <strong>and</strong> for giv<strong>in</strong>g several of the best scientifictalks I’ve seen so far. Alfons, for several fruitful collaborations, as well as many helpfultips <strong>and</strong> discussions on many occasions. Both Andrei Petoukhov <strong>and</strong> Arnout for helpful
Acknowledgements 175tips on scatter<strong>in</strong>g patterns. Willem Kegel <strong>and</strong> Daniela for their beautiful experiments on<strong>colloidal</strong> micelles. Gerard Barkema, for supervis<strong>in</strong>g my Master’s research, which showedme how <strong>in</strong>terest<strong>in</strong>g <strong>and</strong> enjoyable physics research can be. Henk Mos <strong>and</strong> his colleagues,for keep<strong>in</strong>g our simulation cluster runn<strong>in</strong>g. And everyone else who I’ve come <strong>in</strong> touchwith while work<strong>in</strong>g, who contributed to the work discussions, <strong>and</strong> who showed me a bitof their views on the world of soft matter... thank you all!Of course, work is not the only th<strong>in</strong>g <strong>in</strong> life, <strong>and</strong> I would also like to thank those thathave helped me take my m<strong>in</strong>d away from it <strong>in</strong> the past years. For this, too, the group hasbeen great. Any trips with (part of) the group, large <strong>and</strong> small, were always pleasant: notonly Wadlopen, which was def<strong>in</strong>itely a great experience, but also bik<strong>in</strong>g at the Veluwe,play<strong>in</strong>g m<strong>in</strong>igolf, a visit to the Eftel<strong>in</strong>g, or a museum <strong>in</strong> Rotterdam, skat<strong>in</strong>g trips, d<strong>in</strong>ner<strong>in</strong> a park, or along the Lek... My thanks to those who helped organize these trips <strong>and</strong>those who came along! I also greatly enjoyed many of the (sometimes bizarre) coffee tablediscussions <strong>in</strong> our group, <strong>and</strong> the many cakes <strong>and</strong> cookies that have come by dur<strong>in</strong>g theseover the years. My thanks to anyone who contributed to either of these, <strong>and</strong> especiallyto the bak<strong>in</strong>g skills of Joost <strong>and</strong> Johan! Laura, Anjan, Ran, Joost, Helene, <strong>and</strong> manyothers, thank you for the enjoyable d<strong>in</strong>ners <strong>and</strong> lunches we shared. And Teun, Anjan <strong>and</strong>Helene, my thanks for gett<strong>in</strong>g me <strong>in</strong>to the climb<strong>in</strong>g hall on a not-quite-regular basis!Uite<strong>in</strong>delijk nog maar een al<strong>in</strong>ea <strong>in</strong> het Nederl<strong>and</strong>s. Ten eerste, voor al mijn vriendendie me de afgelopen jaren hebben vermaakt met spelletjes en uitjes, hartelijk dank! Tim,bedankt voor het ruimschoots verbreden van mijn ervar<strong>in</strong>gen met muziek, en vele bekekenseries en films (ondanks af en toe een ’cheap cop-out’...). Laura, ook jij nogmaals hartelijkbedankt voor meer dan ik hier kan noemen. Zowel Tim als Laura wil ik natuurlijk ookgraag bedanken voor het komen opdraven als paranimfen! En ten slotte, mijn dank aanJoke en Ed, mijn ouders. Zonder jullie was ik nooit zo ver gekomen.
List of publicationsThis thesis is based on the follow<strong>in</strong>g publications:• F. Smallenburg, L. Filion, M. Marechal <strong>and</strong> M. Dijkstra, Vacancy-stabilized crystall<strong>in</strong>eorder <strong>in</strong> hard cubes, arXiv: 1111.3466, submitted (Chapter 5)• D. J. Kraft, R. Ni, F. Smallenburg, M. Hermes, K. Yoon, D. A. Weitz, A. vanBlaaderen, J. Groenewold, M. Dijkstra <strong>and</strong> W. K. Kegel, Surface Roughness directedSelf-Assembly of Patchy Particles <strong>in</strong>to Colloidal Micelles, under review (Chapter 10)• R. Ni, F. Smallenburg, L. Filion <strong>and</strong> M. Dijkstra, Crystal nucleation <strong>in</strong> b<strong>in</strong>ary hardspheremixtures: the effect of order parameter on the cluster composition, Mol. Phys.109, 1213 (2011) (Chapter 7)• F. Smallenburg, N. Boon, M. Kater, M. Dijkstra <strong>and</strong> R. van Roij, Phase diagrams of<strong>colloidal</strong> spheres with a constant zeta-potential, J. Chem. Phys. 134, 074505 (2011)(Chapter 6)• F. Smallenburg <strong>and</strong> M. Dijkstra, Phase diagram of <strong>colloidal</strong> spheres <strong>in</strong> a biaxialelectric or magnetic field, J. Chem. Phys. 132, 204508 (2010) (Chapter 3)Other publications:• D. El Masri, P. van Oostrum, F. Smallenburg, T. Vissers, A. Imhof, M. Dijkstra <strong>and</strong>A. van Blaaderen, Phase diagrams of <strong>colloidal</strong> spheres with a constant zeta-potential,Soft Matter 7, 3462 (2011)• L. Filion, M. Marechal, B. van Oorschot, D. Pelt, F. Smallenburg, <strong>and</strong> M. Dijkstra,Efficient Method for Predict<strong>in</strong>g Crystal Structures at F<strong>in</strong>ite Temperature: VariableBox Shape Simulations, Phys. Rev. Lett. 103, 188302 (2009)• F. Smallenburg <strong>and</strong> G. T. Barkema, Universality class of the pair contact processwith diffusion, Phys. Rev. E 78, 031129 (2008)