Mathematics: Graphing Terry's Success - Terry Fox Foundation
Mathematics: Graphing Terry's Success - Terry Fox Foundation
Mathematics: Graphing Terry's Success - Terry Fox Foundation

You also want an ePaper? Increase the reach of your titles
YUMPU automatically turns print PDFs into web optimized ePapers that Google loves.
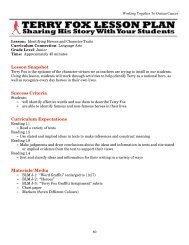
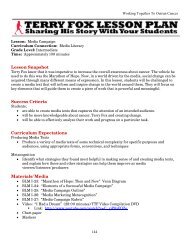
Working Together To Outrun CancerLesson: <strong>Graphing</strong> <strong>Terry</strong>’s <strong>Success</strong>Grade Level: JuniorTime: Approximately 100 minutesLesson Snapshot<strong>Terry</strong> <strong>Fox</strong> has had a direct impact on cancer research as well as improved survival rates. In this lesson,students will analyze data from The <strong>Terry</strong> <strong>Fox</strong> <strong>Foundation</strong> and select an appropriate graph to showhow <strong>Terry</strong> <strong>Fox</strong> has directly affected improvements in cancer research and survival.<strong>Success</strong> CriteriaStudents;• will work with data• will accurately select an appropriate graph to demonstrate dataCurriculum ExpectationsData Management and Probability• Collect and organize discrete or continuous primary data and secondary data and display thedata in charts, tables and graphs that have appropriate titles, labels, and scales using a variety oftoolsMaterials/Media• BLM J-9: “Cancer Research: It’s Working”• BLMJ-10: “Data Management & Donations”• BLMJ-11: “<strong>Graphing</strong> <strong>Terry</strong>’s <strong>Success</strong>”• Access to graphing software and/or graphing chart paperLesson DeliverySetting the Stage• Discuss cancer with the class. Explain as simply as possible what cancer is, and discuss how ithas affected the class. ie, who knows someone who has had it etc.• Discuss the changes in cancer. What could have changed? How do you think success rates havechanged?• Put statistics sheet up on Elmo, Smartboard etc and discuss the changes in cancer for both menand women since <strong>Terry</strong> was diagnosed.94
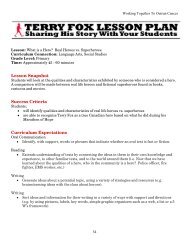
Working Together To Outrun CancerCore Learning Activity• Distribute print materials that include data discussed as a class. Hand out BLM J-8 as aguideline to help them with this activity.Application of Information• Using data presented in class, students will present their findings and information on a graphthey deem to be the best choice.• Remind students that their assignment guideline will remind them of the rules of graphing.• Students will either create the graph using graphing chart paper and/or graphing software.AssessmentUse rubric BLM J-8 to assess this assignment.Extension ActivityUse publishing software to create a pamphlet for the <strong>Terry</strong> <strong>Fox</strong> <strong>Foundation</strong> to demonstrate data andstatistics.95
Working Together To Outrun Cancer96BLM-J9
Working Together To Outrun Cancer97BLM-J10
<strong>Graphing</strong> <strong>Terry</strong>’s <strong>Success</strong>Follows<strong>Graphing</strong> RulesAccurate DataNeatness andAccuracyMy graph follows all ofthe graphing rules: hasX and Y labels, a clearlegend, straight linesand a clear and specifictitle.The information on mygraph is very accurateand precise andcorrectly demonstratestrue facts about the<strong>Terry</strong> <strong>Fox</strong> <strong>Foundation</strong>.Working Together To Outrun CancerLevel Four Level Three Level Two Level OneMy graph follows most My graph follows someof these graphing rules: of these graphing rules:has X and Y labels, a has X and Y labels, aclear legend, straight clear legend, straightlines and a clear and lines and a clear andspecific title.specific title.specific title.My graph is doneneatly, data is graphedaccurately and I haveadded eye catchingcolour and detail.The information on mygraph is accurate andprecise, and correctlydemonstrates true factsabout the <strong>Terry</strong> <strong>Fox</strong><strong>Foundation</strong>.My graph is doneneatly, and my data isgraphed accurately.The information in mygraph is somewhataccurate and precise,and demonstrates somefacts about the <strong>Terry</strong><strong>Fox</strong> <strong>Foundation</strong>.My graph is completedwith some neatness andmy data is mostlyaccurate.My graph follows fewof these graphing rules:has X and Y labels, aclear legend, straightlines and a clear andThe information in mygraph is not accurateand precise, and doesnot accuratelydemonstrate facts aboutthe <strong>Terry</strong> <strong>Fox</strong><strong>Foundation</strong>.My graph is completedmessily, and my data issometimes inaccurate.<strong>Graphing</strong> <strong>Terry</strong>’s <strong>Success</strong>Follows<strong>Graphing</strong> RulesAccurate DataNeatness andAccuracyLevel Four Level Three Level Two Level OneMy graph follows most My graph follows someof these graphing rules: of these graphing rules:has X and Y labels, a has X and Y labels, aclear legend, straight clear legend, straightlines and a clear and lines and a clear andspecific title.specific title.specific title.My graph follows all ofthe graphing rules: hasX and Y labels, a clearlegend, straight linesand a clear and specifictitle.The information on mygraphs is very accurateand precise andcorrectly demonstratestrue facts about the<strong>Terry</strong> <strong>Fox</strong> <strong>Foundation</strong>.My graph is doneneatly, data is graphedaccurately and I haveadded eye catchingcolour and detail.The information on mygraph is accurate andprecise, and correctlydemonstrates true factsabout the <strong>Terry</strong> <strong>Fox</strong><strong>Foundation</strong>.My graph is doneneatly, and my data isgraphed accurately.The information in mygraph is somewhataccurate and precise,and demonstrates somefacts about the <strong>Terry</strong><strong>Fox</strong> <strong>Foundation</strong>.My graph is completedwith some neatness andmy data is mostlyaccurate.My graph follows fewof these graphing rules:has X and Y labels, aclear legend, straightlines and a clear andThe information in mygraph is not accurateand precise, and doesnot accuratelydemonstrate facts aboutthe <strong>Terry</strong> <strong>Fox</strong><strong>Foundation</strong>.My graph is completedmessily, and my data issometimes inaccurate.98BLM-J11