

(OPPE) Using Automatically Captured Electronic Anesthesia Data
(OPPE) Using Automatically Captured Electronic Anesthesia Data
(OPPE) Using Automatically Captured Electronic Anesthesia Data

Create successful ePaper yourself
Turn your PDF publications into a flip-book with our unique Google optimized e-Paper software.
The Joint Commission Journal on Quality and Patient Safety<br />
Sample Ongoing Professional Practice Evaluation (<strong>OPPE</strong>) Report<br />
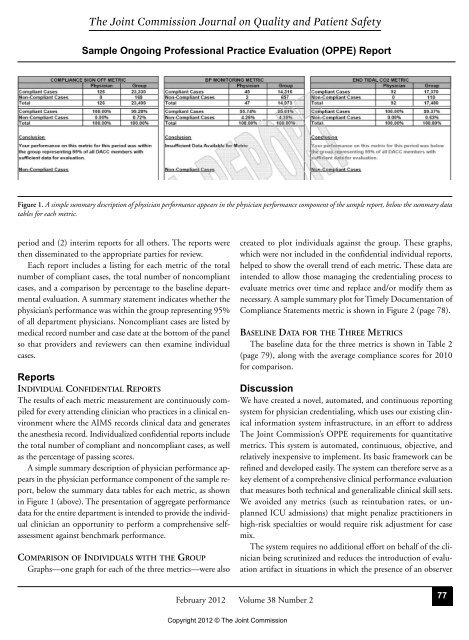
Figure 1. A simple summary description of physician performance appears in the physician performance component of the sample report, below the summary data<br />
tables for each metric.<br />
period and (2) interim reports for all others. The reports were<br />
then disseminated to the appropriate parties for review.<br />
Each report includes a listing for each metric of the total<br />
number of compliant cases, the total number of noncompliant<br />
cases, and a comparison by percentage to the baseline departmental<br />
evaluation. A summary statement indicates whether the<br />
physician’s performance was within the group representing 95%<br />
of all department physicians. Noncompliant cases are listed by<br />
medical record number and case date at the bottom of the panel<br />
so that providers and reviewers can then examine individual<br />
cases.<br />
Reports<br />
INDIVIDUAL CONFIDENTIAL REPORTS<br />
The results of each metric measurement are continuously compiled<br />
for every attending clinician who practices in a clinical environment<br />
where the AIMS records clinical data and generates<br />
the anesthesia record. Individualized confidential reports include<br />
the total number of compliant and noncompliant cases, as well<br />
as the percentage of passing scores.<br />
A simple summary description of physician performance appears<br />
in the physician performance component of the sample report,<br />
below the summary data tables for each metric, as shown<br />
in Figure 1 (above). The presentation of aggregate perfor mance<br />
data for the entire department is intended to provide the individual<br />
clinician an opportunity to perform a comprehensive selfassessment<br />
against benchmark performance.<br />
COMPARISON OF INDIVIDUALS WITH THE GROUP<br />
Graphs—one graph for each of the three metrics—were also<br />
created to plot individuals against the group. These graphs,<br />
which were not included in the confidential individual reports,<br />
helped to show the overall trend of each metric. These data are<br />
intended to allow those managing the credentialing process to<br />
evaluate metrics over time and replace and/or modify them as<br />
necessary. A sample summary plot for Timely Documentation of<br />
Compliance Statements metric is shown in Figure 2 (page 78).<br />
BASELINE DATA FOR THE THREE METRICS<br />
The baseline data for the three metrics is shown in Table 2<br />
(page 79), along with the average compliance scores for 2010<br />
for comparison.<br />
Discussion<br />
We have created a novel, automated, and continuous reporting<br />
system for physician credentialing, which uses our existing clinical<br />
information system infrastructure, in an effort to address<br />
The Joint Commission’s <strong>OPPE</strong> requirements for quantitative<br />
metrics. This system is automated, continuous, objective, and<br />
relatively inexpensive to implement. Its basic framework can be<br />
refined and developed easily. The system can therefore serve as a<br />
key element of a comprehensive clinical performance evaluation<br />
that measures both technical and generalizable clinical skill sets.<br />
We avoided any metrics (such as reintubation rates, or unplanned<br />
ICU admissions) that might penalize practitioners in<br />
high-risk specialties or would require risk adjustment for case<br />
mix.<br />
The system requires no additional effort on behalf of the clinician<br />
being scrutinized and reduces the introduction of evaluation<br />
artifact in situations in which the presence of an observer<br />
February 2012 Volume 38 Number 2<br />
Copyright 2012 © The Joint Commission<br />
77