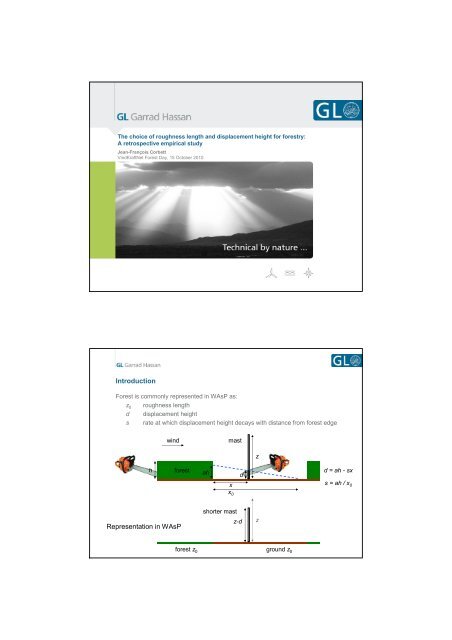
Introduction Representation in WAsP
Introduction Representation in WAsP
Introduction Representation in WAsP

Create successful ePaper yourself
Turn your PDF publications into a flip-book with our unique Google optimized e-Paper software.
The choice of roughness length and displacement height for forestry:A retrospective empirical studyJean-François CorbettV<strong>in</strong>dKraftNet Forest Day, 15 October 2010<strong>Introduction</strong>Forest is commonly represented <strong>in</strong> <strong>WAsP</strong> as:z 0 roughness lengthd displacement heights rate at which displacement height decays with distance from forest edgew<strong>in</strong>dmastzhforestahdd = ah - sxxs = ah / x 0x 0<strong>Representation</strong> <strong>in</strong> <strong>WAsP</strong>shorter mastz-dzforest z 0ground z 0
Site selectionSite 4Site 6MethodFor each siteFor each (z 0,d) schemeAdjust <strong>WAsP</strong> roughness mapFor each mast pair on siteFor each displacement height decay rate sFor <strong>in</strong>itiation mast and target mast• Calculate distance to trees and result<strong>in</strong>g displacement height <strong>in</strong> 360directions.• Take 30°-average displacement height <strong>in</strong> each of 12 sectors• d = average of sector displacement heights, weighted by sector frequency.• Mast height is reduced from z to z -dNext mast<strong>WAsP</strong> calculation from <strong>in</strong>itiation mast to target mast (each with displaced height)Mean w<strong>in</strong>d speed difference: <strong>WAsP</strong>-calculated – MeasuredFor displacement height decay rate sNext mast pairNext (z 0,d) schemeNext site
Results: ”bad” mast pairs <strong>in</strong>cludedRMS errors are much largerDisplacement height decay rate has a dramatic effect: The slower the decay, the betterNo clear w<strong>in</strong>ner, a couple of clear losersWhat determ<strong>in</strong>es who w<strong>in</strong>s and who loses?Comparison of canopy models ("bad" mast pairs <strong>in</strong>cluded)RMS error on mean w<strong>in</strong>d speed9.0%8.0%7.0%all mast pairs6.0%5.0%4.0%3.0%2.0%1.0%good mast pairs only0.0%0 10 20 30 40 50 60<strong>WAsP</strong> manual z0=0.4m<strong>WAsP</strong> manual z0=0.8mCurrent GHJarvis et al.GarratKaimal&F<strong>in</strong>niganESDU1/s Displacement height <strong>in</strong>verse decay rateDisplacement height and roughness length8.0%8.0%7.0%7.0%Kaimal &F<strong>in</strong>niganRMS error on mean w<strong>in</strong>d speed6.0%5.0%4.0%3.0%2.0%1.0%R 2 = 0.55R 2 = 0.61R 2 = 0.32all pairs,s=1:15all pairs,s=1:50goodpairs,s=1:15RMS error on mean w<strong>in</strong>d speed6.0%5.0%4.0%3.0%2.0%1.0%R 2 = 0.11R 2 = 0.13R 2 = 0.69all pairs,s=1:15all pairs,s=1:50goodpairs,s=1:150.0%0.6 0.8 1 1.2d/h0.0%0.2 0.4 0.6 0.8 1 1.2 1.4 1.6 1.8z0 (m) for tree height = 12.5 m
Displacement height and roughness length8.0%8.0%7.0%7.0%RMS error on mean w<strong>in</strong>d speed6.0%5.0%4.0%3.0%2.0%1.0%R 2 = 0.70R 2 = 0.86R 2 = 0.53all pairs,s=1:15all pairs,s=1:50goodpairs,s=1:15RMS error on mean w<strong>in</strong>d speed6.0%5.0%4.0%3.0%2.0%1.0%R 2 = 0.002R 2 = 0.05z 0<strong>in</strong>dependent of hR 2 = 0.30all pairs,s=1:15all pairs,s=1:50goodpairs,s=1:150.0%0.6 0.8 1 1.2d/h0.0%0.2 0.4 0.6 0.8 1 1.2z0 (m) for tree height = 12.5 mConclusionsParameterDisplacementheightdDisplacementheight decay ratesRoughness lengthz 0Best canopymodel <strong>in</strong> thisstudyOptimal for ”good” sitesmast not too low relative to treesgood <strong>in</strong>fo on distance to forestHigh, 0.9 to 1.0 hWeak trendSweet spot around1:15Low, 0.4 to 0.5 m or 0.03 to 0.04 hWeak trendSlight advantage when z 0proportional to h ?ESDU with s=1:15d = h – 4.3 z 0(1-λ) ≈ 0.93 hz 0= 0.033 h = 0.41 m (12.5 m trees)RMS error on MWS: 1.5%Optimal for”bad”/mixed/unknown sitesHigh, 0.9 to 1.0 hStrong trendThe slower the better1:50No trend to speak ofCurrent GH with s=1:50d = 1.00 hz 0= 0.50 mRMS error on MWS: 3.2%
ConclusionsHigh displacement and slow decay may allow for a ”hedg<strong>in</strong>g of bets”:Mast displacement height is less sensitive to errors on the distance from the trees.”Differential error” between <strong>in</strong>itiation and target mast is reduced on average.This analysis benefits from prior knowledge of the w<strong>in</strong>d regime at the target site.Without such prior knowledge, it is not quite as easy to discrim<strong>in</strong>ate between ”good”and ”bad” masts, and thus to determ<strong>in</strong>e when we should buy the costly ”high-d,low-s <strong>in</strong>surance”Can the conclusions from this study be appliedto other sites?to other ways of calculat<strong>in</strong>g the displacement height?Future workF<strong>in</strong>ish calculations us<strong>in</strong>g Raupach and Choudhury canopy modelsPopulate with a few more sites – good and bad!Further explore (d/h, z 0 , s) parameter spaces = 1:100, 1:200…. 1:∞ as a tactical <strong>in</strong>surance device?Extreme hedg<strong>in</strong>g of bets for bad mastsCalculate a separate displacement height for each sector, apply sector-wiseWhen calculat<strong>in</strong>g d, <strong>in</strong>clude trees located immediately downw<strong>in</strong>dw<strong>in</strong>d
Thanks for you attention!