Introduction Representation in WAsP
Introduction Representation in WAsP
Introduction Representation in WAsP

You also want an ePaper? Increase the reach of your titles
YUMPU automatically turns print PDFs into web optimized ePapers that Google loves.
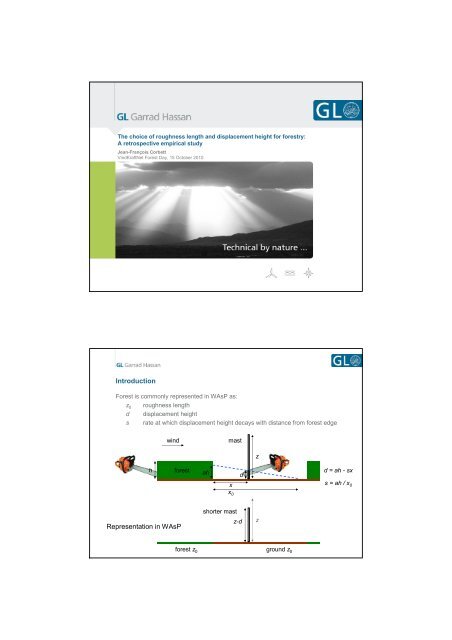
The choice of roughness length and displacement height for forestry:A retrospective empirical studyJean-François CorbettV<strong>in</strong>dKraftNet Forest Day, 15 October 2010<strong>Introduction</strong>Forest is commonly represented <strong>in</strong> <strong>WAsP</strong> as:z 0 roughness lengthd displacement heights rate at which displacement height decays with distance from forest edgew<strong>in</strong>dmastzhforestahdd = ah - sxxs = ah / x 0x 0<strong>Representation</strong> <strong>in</strong> <strong>WAsP</strong>shorter mastz-dzforest z 0ground z 0
Site selectionSite 4Site 6MethodFor each siteFor each (z 0,d) schemeAdjust <strong>WAsP</strong> roughness mapFor each mast pair on siteFor each displacement height decay rate sFor <strong>in</strong>itiation mast and target mast• Calculate distance to trees and result<strong>in</strong>g displacement height <strong>in</strong> 360directions.• Take 30°-average displacement height <strong>in</strong> each of 12 sectors• d = average of sector displacement heights, weighted by sector frequency.• Mast height is reduced from z to z -dNext mast<strong>WAsP</strong> calculation from <strong>in</strong>itiation mast to target mast (each with displaced height)Mean w<strong>in</strong>d speed difference: <strong>WAsP</strong>-calculated – MeasuredFor displacement height decay rate sNext mast pairNext (z 0,d) schemeNext site
Results: ”bad” mast pairs <strong>in</strong>cludedRMS errors are much largerDisplacement height decay rate has a dramatic effect: The slower the decay, the betterNo clear w<strong>in</strong>ner, a couple of clear losersWhat determ<strong>in</strong>es who w<strong>in</strong>s and who loses?Comparison of canopy models ("bad" mast pairs <strong>in</strong>cluded)RMS error on mean w<strong>in</strong>d speed9.0%8.0%7.0%all mast pairs6.0%5.0%4.0%3.0%2.0%1.0%good mast pairs only0.0%0 10 20 30 40 50 60<strong>WAsP</strong> manual z0=0.4m<strong>WAsP</strong> manual z0=0.8mCurrent GHJarvis et al.GarratKaimal&F<strong>in</strong>niganESDU1/s Displacement height <strong>in</strong>verse decay rateDisplacement height and roughness length8.0%8.0%7.0%7.0%Kaimal &F<strong>in</strong>niganRMS error on mean w<strong>in</strong>d speed6.0%5.0%4.0%3.0%2.0%1.0%R 2 = 0.55R 2 = 0.61R 2 = 0.32all pairs,s=1:15all pairs,s=1:50goodpairs,s=1:15RMS error on mean w<strong>in</strong>d speed6.0%5.0%4.0%3.0%2.0%1.0%R 2 = 0.11R 2 = 0.13R 2 = 0.69all pairs,s=1:15all pairs,s=1:50goodpairs,s=1:150.0%0.6 0.8 1 1.2d/h0.0%0.2 0.4 0.6 0.8 1 1.2 1.4 1.6 1.8z0 (m) for tree height = 12.5 m
Displacement height and roughness length8.0%8.0%7.0%7.0%RMS error on mean w<strong>in</strong>d speed6.0%5.0%4.0%3.0%2.0%1.0%R 2 = 0.70R 2 = 0.86R 2 = 0.53all pairs,s=1:15all pairs,s=1:50goodpairs,s=1:15RMS error on mean w<strong>in</strong>d speed6.0%5.0%4.0%3.0%2.0%1.0%R 2 = 0.002R 2 = 0.05z 0<strong>in</strong>dependent of hR 2 = 0.30all pairs,s=1:15all pairs,s=1:50goodpairs,s=1:150.0%0.6 0.8 1 1.2d/h0.0%0.2 0.4 0.6 0.8 1 1.2z0 (m) for tree height = 12.5 mConclusionsParameterDisplacementheightdDisplacementheight decay ratesRoughness lengthz 0Best canopymodel <strong>in</strong> thisstudyOptimal for ”good” sitesmast not too low relative to treesgood <strong>in</strong>fo on distance to forestHigh, 0.9 to 1.0 hWeak trendSweet spot around1:15Low, 0.4 to 0.5 m or 0.03 to 0.04 hWeak trendSlight advantage when z 0proportional to h ?ESDU with s=1:15d = h – 4.3 z 0(1-λ) ≈ 0.93 hz 0= 0.033 h = 0.41 m (12.5 m trees)RMS error on MWS: 1.5%Optimal for”bad”/mixed/unknown sitesHigh, 0.9 to 1.0 hStrong trendThe slower the better1:50No trend to speak ofCurrent GH with s=1:50d = 1.00 hz 0= 0.50 mRMS error on MWS: 3.2%
ConclusionsHigh displacement and slow decay may allow for a ”hedg<strong>in</strong>g of bets”:Mast displacement height is less sensitive to errors on the distance from the trees.”Differential error” between <strong>in</strong>itiation and target mast is reduced on average.This analysis benefits from prior knowledge of the w<strong>in</strong>d regime at the target site.Without such prior knowledge, it is not quite as easy to discrim<strong>in</strong>ate between ”good”and ”bad” masts, and thus to determ<strong>in</strong>e when we should buy the costly ”high-d,low-s <strong>in</strong>surance”Can the conclusions from this study be appliedto other sites?to other ways of calculat<strong>in</strong>g the displacement height?Future workF<strong>in</strong>ish calculations us<strong>in</strong>g Raupach and Choudhury canopy modelsPopulate with a few more sites – good and bad!Further explore (d/h, z 0 , s) parameter spaces = 1:100, 1:200…. 1:∞ as a tactical <strong>in</strong>surance device?Extreme hedg<strong>in</strong>g of bets for bad mastsCalculate a separate displacement height for each sector, apply sector-wiseWhen calculat<strong>in</strong>g d, <strong>in</strong>clude trees located immediately downw<strong>in</strong>dw<strong>in</strong>d
Thanks for you attention!