Tracking metropolitan America into the 21st century - Population ...
Tracking metropolitan America into the 21st century - Population ...
Tracking metropolitan America into the 21st century - Population ...

You also want an ePaper? Increase the reach of your titles
YUMPU automatically turns print PDFs into web optimized ePapers that Google loves.
Metropolitan Policy Program<strong>Tracking</strong> Metropolitan <strong>America</strong><strong>into</strong> <strong>the</strong> <strong>21st</strong> Century:A Field Guide to <strong>the</strong> New Metropolitanand Micropolitan Definitions“An overhaul of<strong>the</strong> widely-recognized<strong>metropolitan</strong>classificationsystem by <strong>the</strong> federalgovernmentwill refashion <strong>the</strong>way research isconducted andfederal dollarsare spent.”William H. Frey, Jill H. Wilson, Alan Berube, and Audrey SingerFindingsAn overhaul of <strong>the</strong> widely-recognized <strong>metropolitan</strong> classification system by <strong>the</strong> federal Office ofManagement and Budget (OMB) will refashion <strong>the</strong> way research is conducted and federal dollarsare spent. The new system, designed to capture <strong>21st</strong>-<strong>century</strong> settlement patterns, alters <strong>the</strong>names, types, and boundaries for <strong>metropolitan</strong> areas and creates new “micropolitan” areas. Acomparison of this new system with its older counterpart, reveals that:■ The new classification system positions <strong>the</strong> Metropolitan Statistical Area as <strong>the</strong> standardtool for analysis across <strong>metropolitan</strong> geographies. The old system, by contrast, requiredusers to combine a mix of three categories of <strong>metropolitan</strong> areas (MSAs and CMSAs orPMSAs) to get complete coverage of <strong>metropolitan</strong> <strong>America</strong>. At <strong>the</strong> same time, <strong>the</strong> new systemprovides researchers with more choices for analyzing trends within <strong>metropolitan</strong> areas.■ New micropolitan areas, toge<strong>the</strong>r with <strong>the</strong>ir <strong>metropolitan</strong> area counterparts, increase <strong>the</strong>reach of OMB’s statistical areas to encompass 93 percent of U.S. population and 46 percentof its land area. States with <strong>the</strong> most micropolitan areas are not necessarily <strong>the</strong> largest:Texas, Ohio, and North Carolina lead all o<strong>the</strong>rs; South Dakota has more than California; andNew Jersey has none.■ Under <strong>the</strong> new system, 81 of <strong>the</strong> nation’s 102 largest <strong>metropolitan</strong> areas have undergonechanges in territory and population. The most common changes involved <strong>the</strong> addition ofnew counties to an existing <strong>metropolitan</strong> area, and <strong>the</strong> combination of two or more metroareas to form a new, larger metropolis.■ Both <strong>metropolitan</strong> and micropolitan areas contain principal cities, which replace centralcities in <strong>the</strong> new names given to <strong>the</strong>se areas. Roughly 40 percent of <strong>the</strong> combined <strong>metropolitan</strong>population lived in principal cities in 2000, compared to 35 percent in central cities.■ The new definitions alter <strong>the</strong> social and economic attributes of many <strong>metropolitan</strong> areas,as well as <strong>the</strong>ir national rankings on <strong>the</strong>se attributes. For instance, New York has replacedLos Angeles as <strong>the</strong> nation’s most populous <strong>metropolitan</strong> area. San Francisco drops from fourthto fourteenth in <strong>metropolitan</strong> rankings of college degree attainment.Not simply statistical arcana, OMB-defined <strong>metropolitan</strong> and micropolitan areas have real-worldimplications for public- and private-sector research, for federal programs—think Medicare, Section8 housing assistance—and for how big-city and small-town residents view <strong>the</strong> places that<strong>the</strong>y live. This survey provides both casual and expert users with a “field guide” to <strong>the</strong> new systemand its potential impacts in each of <strong>the</strong>se areas.November 2004 • The Brookings Institution The Living Cities Census Series 1
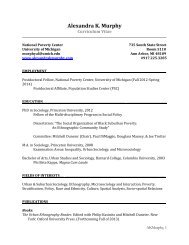
IntroductionThe term “<strong>metropolitan</strong> area” isone of <strong>the</strong> few statisticalterms that is also familiar incommon conversation. A <strong>metropolitan</strong>area is not a political jurisdictionwith a mayor or policedepartment, but ra<strong>the</strong>r an economicallyand socially linked collection oflarge and small communities. Residingin a <strong>metropolitan</strong> area provides identificationwith a well understoodbroader community, often elicitingcivic pride promoted by local chambersof commerce and economicdevelopment commissions. Regionalnewspapers, sports teams and culturalinstitutions all serve to reify <strong>the</strong> existenceof <strong>the</strong> <strong>metropolitan</strong> area. Moreover,<strong>the</strong> <strong>metropolitan</strong> designation ofan area confers on it something of anurbane or cosmopolitan status, placingit in a league with o<strong>the</strong>r areas as a recognizedeconomic region.Such commonly-held perceptions of<strong>metropolitan</strong> areas are reflected in rigorousstatistical definitions of <strong>the</strong> <strong>metropolitan</strong>concept, developed by <strong>the</strong>federal government’s Office of Managementand Budget (OMB). Federalagencies such as <strong>the</strong> U.S. CensusBureau use <strong>the</strong>se standards to collectand disseminate area-based statisticsin publications such as <strong>the</strong> UnitedStates Statistical Abstract. They areincorporated <strong>into</strong> federal and statepolicies to allocate public resources tolocal areas. They are also used widelyin <strong>the</strong> private sector and <strong>the</strong> researchcommunity to identify consumer markets,labor markets, and housing markets.And OMB-defined <strong>metropolitan</strong>areas are often ranked in <strong>the</strong> popularpress and publications such as <strong>the</strong>Places Rated Almanac.The federal government defined<strong>metropolitan</strong> statistical areas as earlyas <strong>the</strong> late 1940s, 1 and has updated<strong>the</strong>m several times, primarily to take<strong>into</strong> account shifts in demographictrends and modest changes in nomenclature.2 However, in <strong>the</strong> early 1990sFigure 1. Old versus New TerminologyOLDConsolidated Metropolitan Statistical Area (CMSA)Primary Metropolitan Statistical Area (PMSA)Metropolitan Statistical Area (MSA)Central CityNew England County Metropolitan Area (NECMA)NEWMetropolitan Statistical Area (MetroSA)Micropolitan Statistical Area (MicroSA)Combined Statistical Area (CSA)Metropolitan DivisionPrincipal CityNew England City and Town Area (NECTA)Source: OMBOMB initiated a decade-long effort toreassess <strong>the</strong> <strong>metropolitan</strong> classificationsystem, in light of <strong>the</strong> manychanges in U.S. settlement patternsthat had taken place over <strong>the</strong> previous50 years. 3The original <strong>metropolitan</strong> statisticalarea concept was predicated on <strong>the</strong>model of a large central city of over50,000 residents that served as a hubof social and economic activity for surroundingcounties. Toge<strong>the</strong>r, <strong>the</strong> cityand counties formed a stand-alone<strong>metropolitan</strong> area. Over <strong>the</strong> past fivedecades, however, <strong>the</strong> decentralizationof both employment and population inmany urban areas have served to disperse<strong>the</strong> “core” well beyond <strong>the</strong>largest city <strong>into</strong> smaller clusters of previously“suburban” communities. As<strong>metropolitan</strong> populations expanded, itbecame evident that hierarchies wereforming within <strong>metropolitan</strong> areas.Large <strong>metropolitan</strong> areas developedsomewhat self-contained sub-areas(e.g., Newark or Long Island within<strong>the</strong> greater New York region); andexisting, neighboring <strong>metropolitan</strong>areas became, for some purposes, partof a larger super-region (e.g., Washington,D.C. and Baltimore). It alsobecame apparent that many communities,considered too small to be part ofa <strong>metropolitan</strong> area, should none<strong>the</strong>lessbe recognized as part of <strong>the</strong> settlementsystem, ra<strong>the</strong>r than be omittedcompletely.After a series of commissioned studies,convenings with user communities,and interagency meetings, OMB’swide-ranging effort in <strong>the</strong> 1990sresulted in <strong>the</strong> adoption of <strong>the</strong> newstandards for <strong>metropolitan</strong> andmicropolitan areas. OMB has urged allfederal agencies that collect and publishdata for <strong>the</strong>se areas to use <strong>the</strong>most recent definitions.The changes are quite significant,not only in terminology, but also in <strong>the</strong>geographic sweep of classified areas,(Figure 1). Figure 2 displays <strong>the</strong> <strong>metropolitan</strong>or non<strong>metropolitan</strong> status ofU.S. counties according to <strong>the</strong> old andnew standards. Under <strong>the</strong> old system,only 20 percent of <strong>the</strong> country’s territorywas defined. The new standardsdouble <strong>the</strong> coverage, classifying 46percent of U.S. land area. Micropolitanareas—a new classification—account for most of <strong>the</strong> increasedcoverage and fill in a noticeable portionof <strong>the</strong> “empty” space across <strong>the</strong>country.Given <strong>the</strong>se significant changes,2November 2004 • The Brookings InstitutionThe Living Cities Census Series
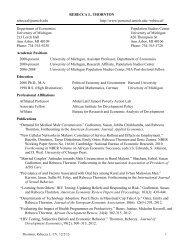
<strong>the</strong> MSA/CMSA combined list (276areas, including 258 MSAs and 18CMSAs), which was favored by OMBand <strong>the</strong> Census Bureau, or <strong>the</strong>MSA/PMSA combined list (331 areas,including 258 MSAs and 73 PMSAs),which common practice tended tofavor. Statistical rankings including<strong>metropolitan</strong> growth rates, crime statistics,employment patterns and qualityof life indicators in publicationssuch as <strong>the</strong> popular The Places RatedAlmanac used <strong>the</strong> MSA/PMSA system,as have most publications in Brookings’Living Cities Census Series. For<strong>the</strong> remainder of this report, we willalso use MSAs and PMSAs as benchmarksfor comparison with <strong>the</strong> newsystem.An additional choice faced analystsof <strong>metropolitan</strong> areas in <strong>the</strong> six NewEngland states. OMB defined MSAs,PMSAs, and CMSAs for <strong>the</strong>se states,as well as an alternative set of areasknown as New England County MetropolitanAreas (NECMAs). New EnglandMSAs, CMSAs, and PMSAs werebased on city and town componentsra<strong>the</strong>r than counties, but many analystswere unable to obtain relevantinformation at <strong>the</strong> town level. Hence,NECMAs were developed as countybasedcounterparts to New England’sconventional metro areas. Manynational analyses, <strong>the</strong>refore, usedMSAs, CMSAs, and PMSAs, outsideof New England, along with NECMAsinside <strong>the</strong> region.Finally, <strong>the</strong> previous standards didnot define any settlements outside of<strong>the</strong> <strong>metropolitan</strong> areas. All of <strong>the</strong> residualcounties in <strong>the</strong> United States (ortowns in New England) were labeled“non-<strong>metropolitan</strong>.” Some analystschose to use individual counties as ameans of distinguishing areas withinnon<strong>metropolitan</strong> territory. 10 Researchersat <strong>the</strong> Department of Agriculture createdRural-Urban Continuum Codes(“Beale Codes”) to distinguish amongnon-<strong>metropolitan</strong> counties based on<strong>the</strong>ir urban population and adjacencyto <strong>metropolitan</strong> areas. 11Metro Area Choices under <strong>the</strong>New StandardsFor those interested in comparing<strong>metropolitan</strong> areas across <strong>the</strong> country,<strong>the</strong>re is now really only one choice:<strong>the</strong> Metropolitan Statistical Area(designated in this paper as MetroSA).Although <strong>the</strong> new system allows forsome hierarchical choices for analysesof individual areas (discussed below),inter-<strong>metropolitan</strong> analyses are bestconducted using <strong>the</strong> MetroSA, whichnow is based exclusively on countylevelcomponents in both New Englandand non-New England states.MetroSAs are defined using somewhatdifferent criteria than <strong>the</strong> old MSAs,CMSAs, and PMSAs. As a consequence,both <strong>the</strong> size and number of<strong>metropolitan</strong> areas have changed.According to <strong>the</strong> new standards,<strong>metropolitan</strong> area central counties,which form <strong>the</strong> basis for determiningoutlying counties via commuting patterns,are now determined exclusivelyby <strong>the</strong>ir overlap with urban areas of allsizes so that <strong>the</strong> more restrictive“urbanized areas or cities of 50,000 ormore” criterion is no longer part of<strong>the</strong>ir definition. 12 The extent of urbanareas has also changed, due to populationgrowth and new definitional criteria.Toge<strong>the</strong>r, <strong>the</strong>se changes haveincreased <strong>the</strong> number of central counties,thus enlarging <strong>the</strong> potential commutingfields of many large<strong>metropolitan</strong> areas. 13At <strong>the</strong> same time, new commutingcriteria for adding outlying counties toa region’s central counties are morerestrictive than those used previously.Thus, 41 counties which previouslyserved as outlying counties of <strong>metropolitan</strong>areas do not qualify as suchunder <strong>the</strong> new rules, but have nowbecome part of new micropolitanareas.One result of <strong>the</strong> change in criteriafor defining <strong>metropolitan</strong> areas is that<strong>the</strong> larger MetroSAs are more comparablein size and area to <strong>the</strong> formerCMSAs than to <strong>the</strong> former PMSAs. 14As a consequence, users who areaccustomed to employing <strong>the</strong>PMSA/MSA definitions under <strong>the</strong> oldsystem will find that <strong>the</strong> number of<strong>metropolitan</strong> areas with populationsexceeding one million drops from 61to 49 in <strong>the</strong> new system. At <strong>the</strong> sametime, <strong>the</strong> number of <strong>metropolitan</strong>areas with populations less than250,000 rises from 149 to 195. Yet,<strong>the</strong> 49 large MetroSAs comprise about<strong>the</strong> same share of <strong>the</strong> U.S. population—53percent—as <strong>the</strong> 61 largeMSAs/PMSAs (Figure 4). At <strong>the</strong> o<strong>the</strong>rend of <strong>the</strong> size spectrum, <strong>the</strong> 195small Metro SAs comprise only aslightly larger share of U.S. populationthan <strong>the</strong> 149 small MSAs/PMSAs (10percent versus 8 percent).Altoge<strong>the</strong>r, <strong>the</strong> new standardsdescribe 361 MetroSAs, comparedto 331 MSAs/PMSAs under <strong>the</strong> oldsystem.As with <strong>the</strong> previous standards,OMB defines an alternative set ofareas in <strong>the</strong> six New England states.Unlike <strong>the</strong> old standards, however,<strong>the</strong>se alternative areas are defined at<strong>the</strong> city and town level and are calledNew England City and Town Areas(NECTAs). MetroSAs in New Englandare comprised of counties, makingcounties <strong>the</strong> basic “buildingblocks” of <strong>metropolitan</strong> areas bothinside and outside <strong>the</strong> New Englandstates.Finally, <strong>the</strong> most recognizablechange with <strong>the</strong> new standards is <strong>the</strong>identification of smaller “<strong>metropolitan</strong>like”communities. These new areas,called micropolitan areas, define meaningful“core-based” areas with corestoo small to qualify as MetroSAs. Theyare discussed in finding B.The New Hierarchy Options forLocal AreasWhile <strong>the</strong> new standards provide a singleunit, <strong>the</strong> MetroSA, for comparing<strong>metropolitan</strong> areas across <strong>the</strong> country,<strong>the</strong>y provide additional choices when<strong>the</strong> focus turns to local areas (Figure5). Combined Statistical Areas(CSAs) represent two or more adjoin-November 2004 • The Brookings Institution The Living Cities Census Series 5
Figure 4. Number of Metro Areas by <strong>Population</strong> Size, 2000,(and Share of <strong>Population</strong> by Metro Size)400350300250200150100500Figure 5. New Hierarchy Options for Local AreasMETROPOLITAN331149 (8.0%)121 (20.2%)61 (52.2%)Old PMSAs/MSAsUnder 250KMetropolitanStatisticalAreasMetropolitanDivisions250K to 1 millionSource: Authors’ calculations of Census 2000 data and OMBCombinedStatisticalAreas(two or more metrosand/or micros)New MetroSAsMicropolitanStatisticalAreasOver 1 millionNOT METROPOLITANNote: These options are not available for all 361 <strong>metropolitan</strong> areas and 573 micropolitan areas.There are 120 combined statistical areas that encompass 163 <strong>metropolitan</strong> and 153 micropolitanareas. Twenty-nine <strong>metropolitan</strong> divisions exist within 11 metroplitan areas.Source: OMB361194 (9.9%)118 (19.7%)49 (53.0%)ing MetroSAs or MicroSAs. Theyrange in size from <strong>the</strong> two-county Clovis-Portales,NM CSA (population63,000), which consists of <strong>the</strong> ClovisMicroSA and <strong>the</strong> Portales MicroSA, to<strong>the</strong> 30-county New York-Newark-Bridgeport, NY-NJ-CT-PA CombinedStatistical Area (population21,361,797), made up of six MetroSAsand one MicroSA. OMB designatesCSAs where certain cross-area commutinglevels are met, and in specifiedcircumstances where local input favors<strong>the</strong> designation. There are currently123 CSAs (those associated with <strong>the</strong>greater Atlanta area, Dallas–Ft. Wortharea, and New York area are illustratedbelow). Just over half (198) of all MetroSAsare located in a CSA.These areas are primarily useful forlocal analyses, as <strong>the</strong>y give users amore expansive way to define <strong>the</strong>irparticular region. CSAs are ill-suitedfor cross-<strong>metropolitan</strong> analyses, since<strong>the</strong>y are very different analytic unitsthan MetroSAs.The o<strong>the</strong>r <strong>metropolitan</strong> innovationin <strong>the</strong> new standards that may assistlocal area analyses is <strong>the</strong> MetropolitanDivision. OMB designated MetropolitanDivisions within each of 11MetroSAs with populations of over2,500,000, and <strong>the</strong>y reflect single ormulti-county areas with close commutingties. Examples include <strong>the</strong>Washington-Arlington-Alexandria,DC-VA-MD-WV Metropolitan Divisionand Be<strong>the</strong>sda-Frederick-Gai<strong>the</strong>rsburg,MD Metropolitan Divisionwithin <strong>the</strong> Washington-Arlington-Alexandria, DC-VA-MD-WV MetropolitanStatistical Area, and <strong>the</strong>Dallas-Plano-Irving, TX MetropolitanDivision and Fort Worth-Arlington, TXMetropolitan Division within <strong>the</strong> Dallas-FortWorth-Arlington, TX MetropolitanStatistical Area.These Metropolitan Divisions, ascomponents of MetroSAs, somewhatresemble PMSAs under <strong>the</strong> old system.However, because only a few verylarge MetroSAs contain MetropolitanDivisions, while PMSAs were much6November 2004 • The Brookings InstitutionThe Living Cities Census Series
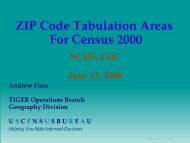
Table 1. Geographic and Demographic Coverage, Old and New StandardsNumber Share of National <strong>Population</strong> Share ofOLD STANDARDS of Counties Land Area in 2000 National <strong>Population</strong>Metropolitan 848 20% 226,207,070 80.4%Non-<strong>metropolitan</strong> 2293 80% 55,214,836 19.6%NEW STANDARDSMetropolitan 1089 25.3% 232,579,940 82.6%Micropolitan 690 20.3% 29,412,298 10.5%Non-core-based 1362 54.4% 19,429,668 6.9%Source: Census 2000 and OMBmore common, Metropolitan Divisionsare less practical geographic units fornationwide analyses. The highermetro-wide population threshold toestablish Metropolitan Divisions (atleast 2.5 million) versus that to establishPMSAs (at least 1 million) meansthat <strong>the</strong> new system contains 29 MetropolitanDivisions within 11 MetroSAs,compared to 73 PMSAs within18 CMSAs under <strong>the</strong> old system. Still,Metropolitan Divisions provideincreased flexibility for local analyses.In some <strong>metropolitan</strong> areas, <strong>the</strong>n,users are able to choose among a <strong>metropolitan</strong>hierarchy that includes allthree types of areas: CSAs, MetroSAs,and Metropolitan Divisions.B. New micropolitan areas, toge<strong>the</strong>rwith <strong>the</strong>ir <strong>metropolitan</strong> area counterparts,increase <strong>the</strong> reach of OMB’sstatistical areas to encompass 93percent of U.S. population and 46percent of its land area.The micropolitan statistical area(designated in this paper as MicroSA)is perhaps <strong>the</strong> most innovative conceptcreated with <strong>the</strong> new standards. OMBdeveloped MicroSAs in response toarguments that smaller communitieslocated outside of metro areasdeserved recognition as self-containedsettlements. They are defined in a parallelmanner to MetroSAs in that <strong>the</strong>yare core-based, meaning <strong>the</strong>y consistof one or more counties centered on acontiguous urban area. MicroSAs andMetroSAs differ primarily in <strong>the</strong> populationof <strong>the</strong>ir core areas: between10,000 and 50,000 for MicroSAs, andat least 50,000 for MetroSAs. SomeMicroSAs have larger populationsthan <strong>the</strong> smallest MetroSAs, but areclassified as <strong>the</strong> former because <strong>the</strong>ircore urban areas have less than50,000 people. MicroSAs range in sizefrom about 13,000 (Andrews, TX) toover 180,000 (Torrington, CT), andMetroSAs range in size from just over50,000 (Carson City, NV) to 18.3 million(New York-Nor<strong>the</strong>rn New Jersey-Long Island, NY-NJ-PA).The new standards define 573MicroSAs in addition to <strong>the</strong> 361 MetroSAs.The 573 MicroSAs incorporate690 counties, indicating that <strong>the</strong>majority of <strong>the</strong>se areas include justone county. Because of <strong>the</strong> way <strong>the</strong>ywere defined, OMB refers to bothtypes of areas as core-based statisticalareas (CBSAs). Toge<strong>the</strong>r, <strong>the</strong>secore-based areas cover a much largershare of <strong>the</strong> nation’s population andlandmass than <strong>metropolitan</strong> areasalone under <strong>the</strong> old standards. Thecombined MetroSAs and MicroSAsnow comprise 93 percent of U.S. populationand 46 percent of its land area.In comparison, <strong>the</strong> old <strong>metropolitan</strong>areas comprised 80 percent of <strong>the</strong>nation’s population and just 20 percentof its land area (Table 1).For analysts used to distinguishingbetween <strong>metropolitan</strong> and non<strong>metropolitan</strong>populations, MicroSAs belongto <strong>the</strong> latter category. However, <strong>the</strong>yrepresent only part of <strong>the</strong> nation’snon<strong>metropolitan</strong> territory. The remainingportion of non<strong>metropolitan</strong> landassumes <strong>the</strong> somewhat cumbersometerm, “non-core-based areas.” BecauseMicroSAs comprise 60 percent of <strong>the</strong>total non-<strong>metropolitan</strong> population, it isnow less appropriate to think of <strong>the</strong>nonmetropolian population as wholly“rural.”Researchers from <strong>the</strong> CensusBureau and o<strong>the</strong>r federal agencies willincorporate <strong>the</strong> new micropolitan areaconcept <strong>into</strong> a range of national statistics,opening up a whole new field ofstudy for demographers, planners, andpolicy makers. The location and profileof MicroSAs is quite varied. Table2 shows that states housing <strong>the</strong> largestnumber of MicroSAs are not <strong>the</strong>nation’s largest states, but are heavilyconcentrated in <strong>the</strong> Midwest andSouth, and comprise a larger share ofoverall population <strong>the</strong>re. Texas, Ohio,North Carolina, Indiana, and Georgialead all o<strong>the</strong>r states in <strong>the</strong> number ofmicropolitan areas, whereas <strong>the</strong> highlyurbanized states of Massachusetts,Rhode Island and New Jersey do nothave any. Small states with numerouscounties like Iowa, Nebraska, andSouth Dakota each have moreMicroSAs than California.Recent analyses by Lang (2004) andNovember 2004 • The Brookings InstitutionThe Living Cities Census Series7
Table 2. Number ofMicroSAs by StateRank State Micros1 Texas 412 Ohio 293 North Carolina 264 Indiana 255 Georgia 246 Illinois 237 Pennsylvania 218 Missouri 209 Mississippi 2010 Tennessee 2011 Michigan 1812 Minnesota 1813 Kentucky 1714 Louisiana 1715 Oklahoma 1716 Kansas 1517 New York 1518 Iowa 1519 Arkansas 1420 New Mexico 1421 Oregon 1322 South Carolina 1323 Wisconsin 1324 Alabama 1325 Florida 1126 Nebraska 1027 South Dakota 928 Washington 929 California 930 Idaho 831 Colorado 732 Wyoming 733 West Virginia 634 New Hampshire 635 Arizona 536 Montana 537 North Dakota 538 Vermont 539 Utah 540 Maryland 441 Nevada 442 Alaska 343 Hawaii 344 Virginia 345 Connecticut 246 Maine 247 Delaware 148 District of Columbia 049 Massachusetts 050 New Jersey 051 Rhode Island 0Source: OMBNote: Micropolitan areas that cross stateboundaries are counted once in each state.Frey (2004a) highlight <strong>the</strong> variationsin micropolitan area demographic profiles.They find that <strong>the</strong> fastest-growingMicroSAs are located nearby largegrowing MetroSAs, while <strong>the</strong> moreremote MicroSAs are generally smallerand slow-growing. Overall, MicroSApopulations tend to be older, poorer,more conservative, less educated, andless racially diverse than <strong>the</strong>ir <strong>metropolitan</strong>counterparts. 15C. Under <strong>the</strong> new system, 81 of <strong>the</strong>nation’s 102 largest <strong>metropolitan</strong>areas have undergone changes interritory and population.Analysts and even casual observersfirst encountering <strong>the</strong> new <strong>metropolitan</strong>areas will likely ask: How differentare <strong>the</strong> new standards from <strong>the</strong> oldones? The simple answer is: quite abit. The changes are especially pronouncedin <strong>the</strong> nation’s larger <strong>metropolitan</strong>areas, which form <strong>the</strong> focus ofmany Brookings Metropolitan PolicyProgram analyses. This section firstdescribes <strong>the</strong> changes from <strong>the</strong> old tonew systems at <strong>the</strong> county level, <strong>the</strong>nexplores how those county transitionsre-shaped <strong>the</strong> nation’s largest <strong>metropolitan</strong>areas.County ShiftsBecause both <strong>the</strong> old and new systemsare county-based, it is possible to view<strong>the</strong> extent of change between <strong>the</strong> twosystems from <strong>the</strong> county level. Between<strong>the</strong> systems, counties could make sixpossible transitions, shown in Table 3.Of <strong>the</strong> 3,141 counties that make up<strong>the</strong> United States, a plurality (43 percent)remained “undefined”—that is,<strong>the</strong>y were non-<strong>metropolitan</strong> under <strong>the</strong>old system and are non-core-basedunder <strong>the</strong> new system. They include<strong>the</strong> vast number of small, rural countiesfound mostly in <strong>the</strong> interior states.The next largest proportion of counties(26 percent) remained <strong>metropolitan</strong>between <strong>the</strong> old and new systems, andof <strong>the</strong>se <strong>the</strong> vast majority (92 percent)remained within <strong>the</strong> same <strong>metropolitan</strong>area. So roughly 70 percent ofcounties retained a comparable classificationin <strong>the</strong> transition to <strong>the</strong> newstandards.O<strong>the</strong>r counties changed classificationdue to <strong>the</strong> introduction of <strong>the</strong>micropolitan concept, new rules fordefining <strong>metropolitan</strong> areas, changesin commuting patterns, or simple populationgrowth and decentralization.Counties that changed from non-<strong>metropolitan</strong>to micropolitan were fairlycommon, accounting for 21 percentof all counties and nearly 10 percentof U.S. population. Nine percent ofU.S. counties jumped from non-<strong>metropolitan</strong>to <strong>metropolitan</strong> status. Farsmaller proportions moved down <strong>the</strong>hierarchy from <strong>metropolitan</strong> tomicropolitan (1 percent) and from<strong>metropolitan</strong> to non-core-based status(just 5 counties).As a result of <strong>the</strong>se transitions, agreater share of <strong>the</strong> nation’s populationis now considered <strong>metropolitan</strong>(83 percent, up from 80 percent). Onnet, 242 counties moved from non<strong>metropolitan</strong>to <strong>metropolitan</strong> standing(46 from <strong>metropolitan</strong> to non-<strong>metropolitan</strong>and 288 from non-<strong>metropolitan</strong>to <strong>metropolitan</strong>). Some becamepart of <strong>the</strong> 44 new <strong>metropolitan</strong> areasannounced under <strong>the</strong> new system,while o<strong>the</strong>rs were added onto <strong>the</strong>fringe of existing <strong>metropolitan</strong> areas.Of <strong>the</strong> 46 counties that changed statusfrom <strong>metropolitan</strong> to non-<strong>metropolitan</strong>,only five did not becomepart of a MicroSA. The 41 previously<strong>metropolitan</strong> counties that becamemicropolitan did not necessarily shrinkin size, but generally failed to meet<strong>the</strong> new more stringent commutingthreshold for inclusion in <strong>metropolitan</strong>areas.Metropolitan ShiftsDespite <strong>the</strong> fact that a majority of <strong>the</strong>nation’s counties have effectively <strong>the</strong>same designations under <strong>the</strong> new system,<strong>the</strong> county composition of most of<strong>the</strong> nation’s largest <strong>metropolitan</strong> areaschanged in some way. In fact, 81 of <strong>the</strong>102 <strong>metropolitan</strong> areas with popula-The Living Cities Census Series
Table 3. County TransitionsPercent of <strong>Population</strong> Percent ofOld Classification New Classification Number Counties in 2000 <strong>Population</strong>Metropolitan Metropolitan 801 25.5 223,113,722 79.3Metropolitan Micropolitan 41 1.3 2,856,237 1.0Metropolitan Non-core-based 5 0.2 105,216 0.0Non-<strong>metropolitan</strong> Metropolitan 288 9.2 9,466,218 3.4Non-<strong>metropolitan</strong> Micropolitan 649 20.7 26,556,061 9.4Non-<strong>metropolitan</strong> Non-core-based 1357 43.2 19,324,452 6.9Source: Authors’ calculations of OMB and Census 2000 dataTable 4. Metropolitan Transitions, Metros with 500,000 orGreater <strong>Population</strong>, 2000Transition Type Number of Metros Percent of Top 102Geographical Changes:Added counties (net) 29 28.4Removed counties (net) 13 12.7Split <strong>into</strong> two or more metros 9 8.8Combined <strong>into</strong> one metro 23 22.5Changed in more than one way 7 6.9Stayed <strong>the</strong> same 21 20.6Total 102 100.0<strong>Population</strong> Changes:*Gained <strong>Population</strong> 56 54.9Lost <strong>Population</strong> 25 24.5Same <strong>Population</strong> 21 20.6Total 102 100.0*As measured by comparing total metro population in 2000 according to <strong>the</strong> old and newdefinitions.Source: Authors’ calculations of OMB datations of at least 500,000 under <strong>the</strong> oldsystem are defined somewhat differentlyunder <strong>the</strong> new system. As aresult, two-thirds (56) of <strong>the</strong> 81 metrosgained population, while <strong>the</strong> rest (25)lost population. Here, we provide illustrativeexamples of <strong>the</strong> several differentways in which <strong>metropolitan</strong> areas havebeen redefined by <strong>the</strong> new standards.Table 4 shows <strong>the</strong> extent of each of<strong>the</strong>se types of changes among <strong>the</strong> 102metro areas when we compare <strong>the</strong> oldMSAs/PMSAs to <strong>the</strong> new MetroSAs.Adding Counties to MetroAreas—AtlantaTwenty-nine of <strong>the</strong> 102 largest <strong>metropolitan</strong>areas experienced a net additionof counties in <strong>the</strong> transition to <strong>the</strong>new system. Most of <strong>the</strong>se metro areasare located in <strong>the</strong> middle and sou<strong>the</strong>rnregions of <strong>the</strong> country, where populationis growing and spreading outquickly. 16Atlanta offers <strong>the</strong> most dramaticexample of a <strong>metropolitan</strong> area withadditional counties in its definition.Metropolitan Atlanta is undergoingrapid population growth, mostly in itssuburbs, which grew by 44 percent in<strong>the</strong> 1990s. The new definition ofmetro Atlanta reflects this sprawlingsuburban pattern and offers more thanone choice for delineating <strong>the</strong> area.Under <strong>the</strong> old standards, Atlanta was asingle MSA made up of 20 counties.The new system creates <strong>the</strong> 28-countyAtlanta-Sandy Springs-Marietta, GAMetroSA (<strong>the</strong> original 20 countiesplus eight additional ones). It alsogives <strong>the</strong> option of using <strong>the</strong> 33-county Atlanta-Sandy Springs-Gainesville Combined StatisticalArea (CSA), which includes <strong>the</strong>Gainesville MetroSA (one county),and four MicroSAs (one county each)(Figure 6).Removing Counties from MetroAreas—Knoxville, Las Vegas,and Washington, D.C.Most of <strong>the</strong> 13 <strong>metropolitan</strong> areas thatexperienced a net loss of counties arelocated in <strong>the</strong> eastern half of <strong>the</strong>United States. In <strong>the</strong> West, only LasVegas, NV lost counties from its <strong>metropolitan</strong>definition.As noted earlier, <strong>the</strong> vast majorityof counties removed from <strong>metropolitan</strong>areas became part of micropolitanareas, so <strong>the</strong>y do not necessarily representareas that are losing population.In almost all cases in whichmicropolitan areas are created on <strong>the</strong>outskirts of <strong>metropolitan</strong> areas, Com-November 2004 • The Brookings Institution The Living Cities Census Series 9
DurhamMetroSAFigure 8. Raleigh-Durham-Cary Combined Statistical AreaOrangeChathamPersonDurhamWakeJohnstonFranklinRaleigh-CaryMetroSADunn MicroSA Old MSA counties (6)HarnettNew Raleigh-Cary MetroSAcounties (3)New Durham MetroSAcounties (4)O<strong>the</strong>r CSA ComponentsMicro counties (1)Source: OMBFigure 9. Dallas-Fort Worth Combined Statistical AreaGainesville MicroSACookeDallas-Fort Worth-Arlington MetroSASeparating a Metro Area <strong>into</strong>Two or More New Areas—Raleigh-DurhamOf <strong>the</strong> 102 largest MSAs/PMSAs, ninesplit <strong>into</strong> two or more metro areasunder <strong>the</strong> new system. These metroareas are scattered around <strong>the</strong> country.Similar to those metro areas that lostcounties, <strong>the</strong> cleaving of <strong>the</strong>se metroareas reflects <strong>the</strong> stricter commutingthresholds under <strong>the</strong> new system, andperhaps an emerging economic independenceseparating formerly closeknitneighbors.Under <strong>the</strong> old standards, <strong>the</strong> areaof North Carolina known as <strong>the</strong>“research triangle”—<strong>the</strong> Raleigh-Durham-Chapel Hill, NC MSA–consistedof six counties. The newstandards split <strong>the</strong> triangle <strong>into</strong> two<strong>metropolitan</strong> areas: <strong>the</strong> Durham, NCMetroSA and <strong>the</strong> Raleigh-Cary MetroSA.Toge<strong>the</strong>r, <strong>the</strong> two metro areasconsist of <strong>the</strong> same six counties plusone additional county in <strong>the</strong> Durhammetro area. The Raleigh-Durham-Cary, NC CSA combines <strong>the</strong>se twoMetroSAs with <strong>the</strong> new one-countyDunn, NC MicroSA (Figure 8). LikeRaleigh-Durham, <strong>the</strong> new standardsalso split <strong>the</strong> former Vallejo-Fairfield-Napa, CA PMSA <strong>into</strong> two MetroSAs,and <strong>the</strong> Grand Rapids-Muskegon-Holland, MI MSA <strong>into</strong> three MetroSAsand one MicroSA.Minerall WellsMicroSAPalo P<strong>into</strong>GranburyMicroSAParkerHoodWiseSomervellOld Dallas PMSA counties (8)Old Fort Worth-Arlington PMSA counties (4)New Dallas-Fort Worth-Arlington MetroSA counties (12)O<strong>the</strong>r CSA ComponentsMicro counties (5)Source: OMBTarrantJohnsonOld Dallas-Fort Worth CMSADentonDeltaCollinHuntRockwallDallasKaufmanA<strong>the</strong>ns MicroSAEllisHendersonCombining Two or More MetroAreas <strong>into</strong> One Area—Dallas-Ft. Worth and New YorkTwenty-three MSAs and PMSAs under<strong>the</strong> old system combined with neighboringareas to form new, larger MetroSAs.In Dallas-Fort Worth, <strong>the</strong> combinationproduced a region with severaldifferent layers. Under <strong>the</strong> old standards,Dallas-Fort Worth, TX was a12-county CMSA, divided <strong>into</strong> twoPMSAs: Dallas (with eight counties)and Fort Worth-Arlington (with fourcounties) (Figure 9). The new standardscreate <strong>the</strong> unified Dallas-FortWorth-Arlington, TX MetroSA, comprisedof 12 counties (two of whichNovember 2004 • The Brookings Institution The Living Cities Census Series 11
most cases, <strong>the</strong> result is a longername, sometimes incorporating placesnot well-known to outsiders. The NewOrleans, LA MSA, for example, is now<strong>the</strong> New Orleans-Metairie-Kenner, LAMetropolitan Statistical Area.A city’s inclusion in its <strong>metropolitan</strong>area’s title may promote name recognitionand enhance its status. Scottsdale,Arizona, for example, gained prominenceby entering <strong>the</strong> title of <strong>the</strong>Phoenix-Mesa <strong>metropolitan</strong> area. WhileScottsdale did not meet <strong>the</strong> old populationthreshold, its rank as <strong>the</strong> thirdlargest principal city in <strong>the</strong> Phoenixarea thrust it <strong>into</strong> <strong>the</strong> new <strong>metropolitan</strong>title. 25 Places like Naperville and Joliet,Illinois in <strong>the</strong> Chicago metro area, andCarlsbad and San Marcos, California in<strong>the</strong> San Diego metro area, realized similarbenefits from <strong>the</strong> change in namingconvention.The order of city names in a <strong>metropolitan</strong>area title is also significant,since sometimes <strong>the</strong> first-named city is<strong>the</strong> only one used to refer to a <strong>metropolitan</strong>area. In <strong>the</strong> case of <strong>the</strong> Norfolk-VirginiaBeach-Newport News,VA-NC MSA, <strong>the</strong> city of Norfolk hasbeen eclipsed by Virginia Beach,switching <strong>the</strong> order of <strong>the</strong> two in <strong>the</strong>new MetroSA title. Without changingits geographical components, <strong>the</strong> Ventura,CA PMSA became <strong>the</strong> Oxnard-Thousand Oaks-Ventura MetroSA.And in Austin, Texas, Round Rockreplaced San Marcos as <strong>the</strong> secondnamedcity in <strong>the</strong> <strong>metropolitan</strong> areatitle, thanks to <strong>the</strong> more streamlinedrules for defining principal cities (versuscentral cities). 26Figure 12. Share of Core-Based <strong>Population</strong> in Central orPrincipal Cities, 200064.5%60.2%Old Metropolitan AreasNew Metropolitan AreasNew Micropolitan Areas35.5%39.8%33.2%Central CitiesSuburbsPrincipal CitiesSuburbsE. The new definitions alter <strong>the</strong>social and economic attributes ofmany <strong>metropolitan</strong> areas, as well as<strong>the</strong>ir national rankings on <strong>the</strong>seattributes.The new standards provide one standardchoice for analyzing or ranking<strong>metropolitan</strong> areas across <strong>the</strong> country,but several ways for local analysts todefine <strong>the</strong>ir area. In this section, wefirst compare <strong>the</strong> options available for66.8%Source: OMB and Census 2000Principal CitiesOutlying Areas14November 2004 • The Brookings InstitutionThe Living Cities Census Series
Table 5. Title Changes for Selected Metropolitan AreasFormer TitleAustin-San Marcos, TX MSABoulder-Longmont, CO PMSABryan-College Station, TX MSAChicago, IL PMSAFort Myers-Cape Coral, FL MSAHouston, TX PMSALas Vegas, NV-AZ MSALos Angeles-Long Beach, CA PMSAMinneapolis-St. Paul, MN-WI MSANew Orleans, LA MSANew York, NY PMSANorfolk-Virginia Beach-Newport News, VA-NC MSAPhoenix-Mesa, AZ MSASan Diego, CA MSASan Francisco, CA PMSASan Jose, CA PMSAVentura, CA PMSAWashington, DC-MD-VA-WV PMSACurrent TitleAustin-Round Rock, TX MetroSABoulder, CO MetroSACollege Station-Bryan, TX MetroSA*Chicago-Naperville-Joliet, IL-IN-WI MetroSACape Coral-Fort Myers, FL MetroSA*Houston-Baytown-Sugar Land, TX MetroSALas Vegas-Paradise, NV MetroSALos Angeles-Long Beach-Santa Ana, CA MetroSAMinneapolis-St. Paul-Bloomington, MN-WI MetroSANew Orleans-Metairie-Kenner, LA MetroSANew York-Nor<strong>the</strong>rn New Jersey-Long Island, NY-NJ-PA MetroSAVirginia Beach-Norfolk-Newport News, VA-NC MetroSA*Phoenix-Mesa-Scottsdale, AZ MetroSASan Diego-Carlsbad-San Marcos, CA MetroSASan Francisco-Oakland-Fremont, CA MetroSASan Jose-Sunnyvale-Santa Clara, CA MetroSAOxnard-Thousand Oaks-Ventura, CA MetroSA*Washington-Arlington-Alexandria, DC-VA-MD-WV MetroSA* Order of place names in <strong>the</strong> <strong>metropolitan</strong> area title changed.Source: OMBTable 6. Comparing “Old” and “New” New York<strong>Population</strong> Income Race/Ethnicity EducationHouseholds Householdswith Annual with Annual Asian- Less than BA or<strong>Population</strong> Income Income Pacific HS Higher(millions) Below $25K Above $75K White Hispanic Black Islander Education EducationOld DefinitionCMSA 21.1 25.5% 32.4% 56.2% 18.2% 16.1% 6.7% 20.7% 30.5%PMSA 9.3 32.7% 25.6% 39.6% 25.1% 22.7% 9.0% 26.0% 29.2%New DefinitionCSA 21.3 25.5% 32.3% 56.6% 18.1% 16.0% 6.7% 20.6% 30.4%MetroSA 18.3 26.2% 32.0% 53.4% 19.5% 17.0% 7.3% 21.3% 30.3%Division 11.3 31.0% 27.0% 42.4% 25.0% 20.3% 8.9% 25.2% 29.4%Source: Census 2000 and OMBNovember 2004 • The Brookings Institution The Living Cities Census Series 15
analysis in one large region, New York,and compare <strong>the</strong> region’s attributesunder <strong>the</strong> old and new systems. We<strong>the</strong>n contrast demographic rankings of<strong>metropolitan</strong> areas using <strong>the</strong> MetroSAconcept to those provided by <strong>the</strong> oldMSAs and PMSAs.Local Choices and Changes—New YorkAs was <strong>the</strong> case under <strong>the</strong> old standards,<strong>the</strong> choice a user makes indefining a local area for study can significantlyaffect <strong>the</strong> results. For NewYork, <strong>the</strong>re are now three ways todefine <strong>the</strong> metro area, ra<strong>the</strong>r than two(Finding C). Table 6 compares populationsizes and socio-economic attributesfor <strong>the</strong> former New York CMSAand PMSA with <strong>the</strong> new CSA, MetroSA,and Metropolitan Division containingNew York City. The formerCMSA and <strong>the</strong> current CSA are similarin size, while <strong>the</strong> former PMSA issimilar to <strong>the</strong> current metro division.Interestingly, <strong>the</strong> current MetroSA,<strong>the</strong> geography likely to be used mostoften, has no parallel in <strong>the</strong> old standards.Whereas <strong>the</strong> former PMSAcomprised only 44 percent of <strong>the</strong>CMSA’s population, <strong>the</strong> current MetroSAaccounts for 86 percent of <strong>the</strong>CSA. Even <strong>the</strong> smaller geographicalunit, <strong>the</strong> division, makes up more thanhalf of its CSA’s population.It is not surprising <strong>the</strong>n, that <strong>the</strong>reare noticeable differences between <strong>the</strong>profile of <strong>the</strong> “new” New York (MetroSA)and <strong>the</strong> “old” New York(PMSA). The MetroSA is wealthier,whiter, more educated, and has ahigher percentage of its population inmarried-couple households. These differencesreflect <strong>the</strong> new area’s reach<strong>into</strong> <strong>the</strong> far suburbs of nor<strong>the</strong>rn andcentral New Jersey, Long Island, andeven eastern Pennsylvania. By far, <strong>the</strong>greatest disparity between <strong>the</strong> two<strong>metropolitan</strong> area definitions appearsin race and ethnicity attributes.The new MetroSA is majority non-Hispanic white (53 percent), while <strong>the</strong>old PMSA was only 40-percent white.National Changes—MetropolitanRankingsNew York presents one of <strong>the</strong> moreextreme examples of how <strong>the</strong> new classificationsystem may alter our understandingof who lives in particular<strong>metropolitan</strong> areas. But significantchanges are also evident in o<strong>the</strong>r partsof <strong>the</strong> nation, where new metro areaswere created, expanded, or combined.The demographic consequences of<strong>the</strong> new system are apparent across<strong>the</strong> nation’s largest metro areas, too.Table 7 presents rankings of old andnew metro areas (MSAs/PMSAs/NEC-MAs vs. MetroSAs) by population,income, and educational attributesusing Census 2000 data. One immediatelyapparent change is that New Yorkreplaces Los Angeles as <strong>the</strong> most populated<strong>metropolitan</strong> area in <strong>the</strong> country,with nearly 6 million more peoplethan its West Coast counterpart. Dallas,meanwhile, jumps from tenth tofifth, due to its combination with FortWorth. Although Detroit’s populationincreases slightly, its rank declinesfrom sixth to ninth. Miami makes it<strong>into</strong> <strong>the</strong> top ten (from twenty-fourth),thanks to its new grouping with FortLauderdale and West Palm Beach,while Atlanta just misses <strong>the</strong> top ten,falling to eleventh in rank.The new system also alters ra<strong>the</strong>rsignificantly <strong>the</strong> list of wealthiestmetro areas, as measured by <strong>the</strong> shareof households with annual incomeabove $75,000. Formerly, half of <strong>the</strong>top 12 metro areas were in <strong>the</strong> greaterNew York region, but since four of<strong>the</strong>se are now incorporated <strong>into</strong> <strong>the</strong>New York MetroSA, <strong>the</strong>y leave roomfor o<strong>the</strong>r metro areas to move up <strong>the</strong>list. Hartford and Anchorage, forinstance, now break <strong>into</strong> <strong>the</strong> top 15.Simultaneously, <strong>the</strong> combination offormer PMSAs <strong>into</strong> <strong>the</strong> New York-Nor<strong>the</strong>rn New Jersey-Long IslandMetroSA moved New York up in <strong>the</strong>wealth rankings from fifty-one totwelve.On <strong>the</strong> share of adults with at leasta bachelor’s degree, many collegetowns are among <strong>the</strong> highest-rankedmetro areas under both <strong>the</strong> old andnew systems, but some ordering didchange. The Ann Arbor MetroSAretained only <strong>the</strong> one county from itsold PMSA that contains <strong>the</strong> Universityof Michigan, elevating it from nineteenthto second in <strong>the</strong> ranking. IowaCity, meanwhile, added ano<strong>the</strong>rcounty outside <strong>the</strong> University of Iowa,dropping it from second to eighth.Likewise, Bloomington, IN, and Madison,WI, each added two counties to<strong>the</strong>ir <strong>metropolitan</strong> definitions, causing<strong>the</strong>m to fall out of <strong>the</strong> top 15. AndIthaca, NY, one of <strong>the</strong> 49 new <strong>metropolitan</strong>areas and home to CornellUniversity, now ranks third. Perhaps<strong>the</strong> most notable change in <strong>the</strong> educationalrankings is <strong>the</strong> drop San Franciscotakes from fourth to fourteenth,due to its combination with Oakland.In summary, <strong>the</strong>se examples demonstratethat <strong>the</strong> rules governing <strong>metropolitan</strong>area definitions may greatlyinfluence our understanding of whichregions are biggest, richest, or brightest.Discussion and ImplicationsThe real-world implications of<strong>the</strong> new <strong>metropolitan</strong> classificationsdiscussed here haveyet to be realized, in large partbecause many individuals and organizationsare still relying on <strong>the</strong> old (andin some cases, even earlier) definitionsin research and practice. Brookings’own studies that use Census 2000data still employ <strong>the</strong> older definitionsthat were in effect at <strong>the</strong> time of <strong>the</strong>census. The slow pace at which <strong>the</strong>new definitions are being put to usereflects in part OMB’s adoption ofnovel concepts like micropolitan statisticalareas, <strong>metropolitan</strong> divisions,and combined statistical areas. Revisionsduring <strong>the</strong> 1990s, by contrast,merely updated existing concepts withnew population data. In any case,whatever effects <strong>the</strong> new classificationshave, <strong>the</strong>y are likely to occur16November 2004 • The Brookings InstitutionThe Living Cities Census Series
Table 7. Rankings of Old and New Metropolitan Areas, 2000OLD (MSAs/PMSAs/NECMAs)NEW (MetroSAs)Rank Name Total <strong>Population</strong> (thousands) Rank Name Total <strong>Population</strong> (thousands)1 Los Angeles-Long Beach, CA PMSA 9,519 1 New York-Nor<strong>the</strong>rn New Jersey-Long Island,NY-NJ-PA 18,3232 New York, NY PMSA 9,314 2 Los Angeles-Long Beach-Santa Ana, CA 12,3663 Chicago, IL PMSA 8,273 3 Chicago-Naperville-Joliet, IL-IN-WI 9,0984 Boston, MA-NH NECMA 6,058 4 Philadelphia-Camden-Wilmington, PA-NJ-DE-MD 5,6875 Philadelphia, PA-NJ PMSA 5,101 5 Dallas-Fort Worth-Arlington, TX 5,1626 Detroit, MI PMSA 4,442 6 Miami-Fort Lauderdale-Miami Beach, FL 5,0087 Washington, DC-MD-VA-WV PMSA 4,923 7 Washington-Arlington-Alexandria, DC-VA-MD-WV 4,7968 Houston, TX PMSA 4,178 8 Houston-Baytown-Sugar Land, TX 4,7159 Atlanta, GA MSA 4,112 9 Detroit-Warren-Livonia, MI 4,45310 Dallas, TX PMSA 3,519 10 Boston-Cambridge-Quincy, MA-NH 4,39111 Nassau-Suffolk, NY PMSA 2,754 11 Atlanta-Sandy Springs-Marietta, GA 4,24812 Riverside-San Bernardino, CA PMSA 3,255 12 San Francisco-Oakland-Fremont, CA 4,12413 Minneapolis-St. Paul, MN-WI MSA 2,969 13 Riverside-San Bernardino-Ontario, CA 3,25514 San Diego, CA MSA 2,814 14 Phoenix-Mesa-Scottsdale, AZ 3,25215 St. Louis, MO-IL MSA 2,604 15 Seattle-Tacoma-Bellevue, WA 3,044Rank Name Households with Income over $75K (%) Rank Name Households with Income over $75K (%)1 San Jose, CA PMSA 49.6 1 San Jose-Sunnyvale-Santa Clara, CA 49.32 Nassau-Suffolk, NY PMSA 45.0 2 Bridgeport-Stamford-Norwalk, CT 43.63 Middlesex-Somerset-Hunterdon, 43.6 3 Washington-Arlington-Alexandria, DC-VA-MD-WV 40.7NJ PMSA4 San Francisco, CA PMSA 42.3 4 San Francisco-Oakland-Fremont, CA 39.95 Washington, DC-MD-VA-WV PMSA 40.1 5 Oxnard-Thousand Oaks-Ventura, CA 37.86 Bergen-Passaic, NJ PMSA 38.9 6 Trenton-Ewing, NJ 36.17 Oakland, CA PMSA 38.1 7 Boulder, CO 35.38 Ventura, CA PMSA 37.8 8 Santa Cruz-Watsonville, CA 34.69 Orange County, CA PMSA 37.4 9 Boston-Cambridge-Quincy, MA-NH 34.310 Newark, NJ PMSA 37.0 10 Ann Arbor, MI 32.811 Bridgeport, CT NECMA 36.2 11 Anchorage, AK 32.112 Trenton, NJ PMSA 36.1 12 New York-Nor<strong>the</strong>rn New Jersey-Long Island, NY-NJ-PA 32.013 Boulder-Longmont, CO PMSA 35.3 13 Vallejo-Fairfield, CA 31.814 Santa Cruz-Watsonville, CA PMSA 34.6 14 Napa, CA 31.815 Monmouth-Ocean, NJ PMSA 34.4 15 Hartford-West Hartford-East Hartford, CT 31.7Rank Name Bachelor’s Degree or Higher (%) Rank Name Bachelor’s Degree or Higher (%)1 Boulder-Longmont, CO PMSA 52.4 1 Boulder, CO 52.42 Iowa City, IA MSA 47.6 2 Ann Arbor, MI 48.13 Corvallis, OR MSA 47.4 3 Ithaca, NY 47.54 San Francisco, CA PMSA 43.6 4 Corvallis, OR 47.45 Lawrence, KS MSA 42.7 5 Ames, IA 44.56 Washington, DC-MD-VA-WV PMSA 41.8 6 Lawrence, KS 42.77 Columbia, MO MSA 41.7 7 Washington-Arlington-Alexandria, DC-VA-MD-WV 42.58 Madison, WI MSA 40.6 8 Iowa City, IA 42.09 San Jose, CA PMSA 40.5 9 Bridgeport-Stamford-Norwalk, CT 39.910 Charlottesville, VA MSA 40.1 10 Columbia, MO 39.911 Santa Fe, NM MSA 39.9 11 San Jose-Sunnyvale-Santa Clara, CA 39.812 Bloomington, IN MSA 39.6 12 Fort Collins-Loveland, CO 39.513 Fort Collins-Loveland, CO MSA 39.5 13 Durham, NC 38.814 Raleigh-Durham-Chapel Hill, NC MSA 38.9 14 San Francisco-Oakland-Fremont, CA 38.815 Gainesville, FL MSA 38.7 15 Charlottesville, VA 38.3Source: Census 2000 and OMB
over time as users gradually adapt tothis new system.Moving to <strong>the</strong> new classificationscheme is, at its root, a statistical policychange—not a programmatic one.In fact, in its guidance announcing <strong>the</strong>revised definitions, OMB cautionsgovernment agencies against employing<strong>the</strong> definitions to develop andimplement “nonstatistical programsand policies without full considerationof <strong>the</strong> effects of using <strong>the</strong>se definitionsfor such purposes.” Yet as <strong>the</strong> new systemgains acceptance and wider use,policymakers, researchers, and even<strong>the</strong> man on <strong>the</strong> street may confront anew way of looking at <strong>the</strong> world—or atleast <strong>the</strong>ir particular corners of it.Below we discuss <strong>the</strong> effects that<strong>the</strong>se new <strong>metropolitan</strong> standards willhave on federal policy, research, and<strong>the</strong> public at large.Federal PolicyThe federal government’s use of <strong>the</strong><strong>metropolitan</strong> area concept for purposeso<strong>the</strong>r than mere statisticalreporting is widespread. This shouldnot be surprising, since <strong>the</strong> distincteconomic character metro areas aredesigned to exhibit makes <strong>the</strong>m goodapproximations for labor markets,commuter sheds, and air-qualityregions. The U.S. Code alone—<strong>the</strong>federal government’s body of law—contains over 60 unique mentions of<strong>the</strong> phrase “<strong>metropolitan</strong> statisticalarea.”Policymakers really put <strong>the</strong> conceptto work, though, in <strong>the</strong> implementationof federal laws through regulation.Nearly every major federalagency—from those involved in agricultureto homeland security to education—overseesone or more programsthat make use of OMB-defined <strong>metropolitan</strong>areas. Federal agencies typicallyuse <strong>the</strong> <strong>metropolitan</strong> areaconcept as a basis for reporting information,to establish program eligibility,and/or to set program features; anexample of each is offered here. 271. As a basis for reporting information—HomeMortgageDisclosureUnder <strong>the</strong> regulations that implement<strong>the</strong> Home Mortgage DisclosureAct (HMDA), federally-insureddepository institutions must collectinformation on applications forhome mortgage loans. In addition tocharacteristics of <strong>the</strong> applicant, <strong>the</strong>institution must collect informationabout <strong>the</strong> property to which <strong>the</strong>application relates, including itslocation by <strong>metropolitan</strong> area, state,county, and census tract. Institutionsmust compile and report thisinformation to <strong>the</strong> appropriatebanking regulators (e.g., <strong>the</strong> FederalReserve, <strong>the</strong> Comptroller of <strong>the</strong>Currency, etc.) annually. Metropolitanareas typically represent <strong>the</strong>marketplaces within which banksand thrifts operate, and thus serveas important geographic frames forevaluating lending performanceunder o<strong>the</strong>r laws related to HMDA,such as fair lending laws and <strong>the</strong>Community Reinvestment Act. As<strong>metropolitan</strong> areas change and growin size, banks and thrifts must<strong>the</strong>refore change <strong>the</strong>ir informationand reporting procedures to bring<strong>the</strong>ir data—and lending practices—<strong>into</strong> line with <strong>the</strong> new <strong>metropolitan</strong>definitions.2. To establish program eligibilityor applicability—Locality PayProgramU.S. law requires federal pay ratesto be comparable with non-federalpay rates for <strong>the</strong> same level of workwithin <strong>the</strong> same local area, and forany existing pay disparities betweenfederal and non-federal employeesto be eliminated. “Locality payareas” are places where <strong>the</strong> FederalSalary Council (FSC) has determinedthat wage rates should beadjusted. There are a total of 32locality pay areas, 31 of which coincidegenerally with <strong>metropolitan</strong>area definitions, and one thatencompasses <strong>the</strong> remainder of <strong>the</strong>United States. A review of <strong>the</strong>revised <strong>metropolitan</strong> standards by<strong>the</strong> FSC in December 2003 recommendedthat locality pay areas use<strong>the</strong> new <strong>metropolitan</strong> standards,and where available, <strong>the</strong> combinedstatistical area. Micropolitan areaswill not be used unless <strong>the</strong>y are partof a combined <strong>metropolitan</strong> statisticalarea. As a result of boundarychanges to several <strong>metropolitan</strong>areas under <strong>the</strong> new standards, <strong>the</strong>number of federal employees subjectto locality pay adjustments maychange. Final regulations on implementing<strong>the</strong> new locality pay areaswill be issued by OPM in January2005.3. To set program features—MedicarePerhaps no federal program attractsmore attention to OMB’s <strong>metropolitan</strong>definitions than Medicare. Thisis largely because many of <strong>the</strong> paymentsmade to providers underMedicare rely on cost data specificto <strong>the</strong> geography in which aprovider is located. A hospital’s locationinside or outside a <strong>metropolitan</strong>area is used as an eligibility criterionfor various special Medicaredesignations that can raise reimbursementrates. 28 The most notableexample of metro area usage withinMedicare policy derives from programreimbursement for hospitals’operating costs based on prospectivelyset rates specific to eachpatient diagnosis. In making paymentsto a particular hospital, <strong>the</strong>Center for Medicare and MedicaidServices (CMS) adjusts each diagnosticrate by a wage index applicableto <strong>the</strong> area in which <strong>the</strong> hospitalis located, in order to account forgeographic differences in <strong>the</strong> laborcosts hospitals bear. CMS defines<strong>the</strong>se areas using OMB <strong>metropolitan</strong>areas (MSAs, PMSAs, andNECMAs), and uses survey data toupdate <strong>the</strong> index annually for all18November 2004 • The Brookings InstitutionThe Living Cities Census Series
<strong>metropolitan</strong> areas and statewidenon-<strong>metropolitan</strong> areas. Generally,<strong>the</strong> wage index is higher in urbanareas and lower in rural ones, sowhe<strong>the</strong>r a hospital is located in a<strong>metropolitan</strong> area receives a greatdeal of scrutiny. 29Recognizing <strong>the</strong> significantimpact that <strong>the</strong> new <strong>metropolitan</strong>standards will have on <strong>the</strong> calculationof <strong>the</strong> wage index, CMS hasalready analyzed <strong>the</strong> changes toeach hospital’s wage index thatwould result from: (a) constructingseparate indexes for hospitalslocated in each MetroSA, metrodivision, MicroSA, and statewidenon-CBSA; and (b) leaving hospitalsin MicroSAs as part of a generalizedstatewide rural index. 30 The proposedrule opts for consideringMicroSAs and statewide non-CBSAs toge<strong>the</strong>r, in large partbecause moving to MicroSA-specificindexes could result in large onetimechanges to many hospitals’payments, and because manyMicroSAs are home to only onehospital, thus limiting <strong>the</strong> averagingeffect of <strong>the</strong> index across providers.Whichever path CMS eventuallyadopts, OMB’s <strong>metropolitan</strong> standardswill continue to play a highprofilerole in shaping <strong>the</strong> details ofMedicare program operations.Among <strong>the</strong>se three types of usages,federal policymakers employ metroareas most often in <strong>the</strong> same manneras <strong>the</strong> “locality pay program” example—toestablish whe<strong>the</strong>r, by virtue ofits location, an individual or communityis eligible for a particular program,or certain regulations apply toindividuals, businesses, or governments.Programs that use metro-areacharacteristics in formulas, as withMedicare, are rarer. 31 However, someagencies use <strong>the</strong> standards in morethan one of <strong>the</strong>se ways. In fact, <strong>the</strong>locality pay program uses metro areadefinitions to designate whe<strong>the</strong>r a<strong>metropolitan</strong> area is part of <strong>the</strong> programand <strong>the</strong>n indexes pay levelsaccording to local wages.None<strong>the</strong>less, <strong>the</strong> decision to change<strong>metropolitan</strong> definitions can have farreachingconsequences for <strong>the</strong>se typesof programs, and, as a result, someagencies are cautious about adopting<strong>the</strong> new standards. The Department ofHousing and Urban Development(HUD), for example, is responsible forannually publishing “Fair MarketRents” (FMRs) or payment standardsfor <strong>the</strong>ir major housing assistance program(commonly known as Section 8).When HUD announced <strong>the</strong> proposedFY2005 FMRs, which used <strong>the</strong> new<strong>metropolitan</strong> standards, <strong>the</strong>y receivedpublic comments from key interestgroups expressing concern that <strong>the</strong>new definitions produced drasticchanges in FMRs in some communities.As a result, HUD decided not toswitch immediately to <strong>the</strong> new OMB<strong>metropolitan</strong> definitions.The impacts that <strong>the</strong> new definitionswill have on federal programs arestill unclear overall, and will dependnot only on <strong>the</strong> particular characteristicsof <strong>the</strong> <strong>metropolitan</strong> areas undergoingchanges, but also on howlawmakers and rulemakers integrate<strong>the</strong> new concepts <strong>into</strong> existing systems.In this regard, OMB recentlyoffered more explicit guidance to federalagencies that use <strong>metropolitan</strong>areas for nonstatistical purposes. 32OMB urges agencies that had usedPMSAs to now consider using MetroDivisions, which it describes as <strong>the</strong>“comparable geographic units of classification.”In addition, it suggests thatin cases where old metro areas divided<strong>into</strong> more than one new metro area,<strong>the</strong> CSA may form a “more appropriategeographic unit for analytic andprogram purposes.” Whe<strong>the</strong>r agencieswill take <strong>the</strong>se suggestions to heart, orwill opt for more straightforward usageof MetroSAs alone, may in <strong>the</strong> enddictate <strong>the</strong> pace at which <strong>the</strong> new definitionsare adopted, and <strong>the</strong> extent towhich programmatic changes result.November 2004 • The Brookings Institution The Living Cities Census Series 19
ResearchAs OMB’s suggestions indicate, oneimplication of <strong>the</strong> new <strong>metropolitan</strong>classification system is thatresearchers now have more choices.Under <strong>the</strong> old system, <strong>metropolitan</strong>researchers typically analyzed MSAstoge<strong>the</strong>r with ei<strong>the</strong>r CMSAs orPMSAs. The new system offersresearchers, at <strong>the</strong> local level, <strong>the</strong>opportunity to examine MetroSAs,metro divisions, CSAs, and MicroSAs.In addition, <strong>the</strong> growth of <strong>metropolitan</strong><strong>America</strong> has produced a greaternumber of MetroSAs than MSAs andPMSAs, and more <strong>metropolitan</strong> principalcities than central cities.A potentially expansive researchcommunity, including federal and stateagencies, nonprofit research organizations,and private-sector marketresearchers, will use <strong>the</strong> new <strong>metropolitan</strong>classifications. The federal statisticalagencies <strong>the</strong>mselves willinfluence <strong>the</strong> speed at which o<strong>the</strong>rresearchers move towards <strong>the</strong> new system,and <strong>the</strong> choices that researchersmake within that system. Some agencieslike <strong>the</strong> Bureau of EconomicAnalysis have already begun to releasedata that conform to <strong>the</strong> new <strong>metropolitan</strong>and micropolitan definitions.Many, like <strong>the</strong> Bureau of Labor Statisticsand <strong>the</strong> National Center forHealth Statistics, have yet to make <strong>the</strong>transition, in part because <strong>the</strong>ir mostrecent data releases pre-date <strong>the</strong> June2003 announcement of <strong>the</strong> new classificationsystem.The greater number of choices availableto researchers under <strong>the</strong> new systemmay carry both advantages anddisadvantages. On <strong>the</strong> one hand,researchers may now have access todata that conform more closely to <strong>the</strong>irgeographic areas of interest. On <strong>the</strong>o<strong>the</strong>r hand, as different <strong>metropolitan</strong>researchers choose to focus on differentclassifications, it may become moredifficult to compare across <strong>the</strong>ir findings.Some, as OMB suggests, maychoose to work with <strong>metropolitan</strong> divisionsfor comparability with PMSAs. 33O<strong>the</strong>rs may work with MetroSAsalone, or in combination withMicroSAs. Rural experts may focusonly on non-CBSAs, or on non-CBSAstoge<strong>the</strong>r with MicroSAs. This flexibilitycan enrich <strong>the</strong> field of inquiry, but itwill become even more important forresearchers to state <strong>the</strong>ir methodologyclearly and explain why <strong>the</strong>y have chosen<strong>the</strong>ir particular geographic frame.As discussed above, it is advised thatnational rankings of <strong>metropolitan</strong> areasand micropolitan areas employ <strong>the</strong>MetroSAs and MicroSAs, ra<strong>the</strong>r thanCSAs or <strong>metropolitan</strong> divisions.Regardless of <strong>the</strong>ir views on <strong>the</strong>classification system itself, researchersshould welcome <strong>the</strong> new <strong>metropolitan</strong>definitions for <strong>the</strong>ir basis in up-to-datecensus data on population, urbanization,and commuting patterns. Thesenew areas likely exhibit a greaterdegree of economic and social cohesiontoday than do <strong>the</strong> old <strong>metropolitan</strong>definitions, which were rootedprimarily in 1990 census data. Thenew methods for defining <strong>metropolitan</strong>areas and principal cities are alsosimpler than under <strong>the</strong> old system,and help resolve some of <strong>the</strong> odderoutcomes apparent in <strong>the</strong> 1999 definitions(like King George County, VAappearing in <strong>the</strong> Washington, DCmetro area).What changes might <strong>the</strong> new systemproduce in actual researchresults? In this survey, we offer a lookat how certain demographic and economicindicators at <strong>the</strong> <strong>metropolitan</strong>level differ when viewed through <strong>the</strong>old and new lenses. For <strong>the</strong> most part,<strong>the</strong> notable differences are limited to afew large <strong>metropolitan</strong> areas thatunderwent significant definitionalchanges, like New York, San Francisco,Dallas, and Raleigh-Durham. Inmany o<strong>the</strong>r areas like Atlanta, Portland,Wichita, and Washington, <strong>the</strong>addition, subtraction, or “relegation”to micropolitan of smaller counties at<strong>the</strong> <strong>metropolitan</strong> fringe does not domuch to influence <strong>the</strong> overall empiricalpicture.20November 2004 • The Brookings InstitutionThe Living Cities Census Series
Popular UsageThe new system may, at least over <strong>the</strong>long run, exert as much influence onour popular understanding of <strong>metropolitan</strong>areas as on our researchunderstanding. Popular notions of<strong>metropolitan</strong> areas are shaped not onlyby what geographies <strong>the</strong>y contain, butalso by name recognition. Both maycontribute to <strong>the</strong> economic and socialidentity of local residents, businesses,and governments.With respect to <strong>the</strong>ir geographicmakeup, it is not surprising that <strong>the</strong>new <strong>metropolitan</strong> definitions are still“off <strong>the</strong> radar” in large swaths of <strong>metropolitan</strong><strong>America</strong>, given that <strong>the</strong> policyand research communities have yetto completely embrace <strong>the</strong> changes. Inpart, this is because institutions likeregional media and chambers of commercemediate between what <strong>the</strong> federalgovernment decides is a<strong>metropolitan</strong> area, and what averagecitizens consider to be <strong>the</strong>ir region.Newspaper “Metro” sections, forinstance, typically report on jurisdictionsin which <strong>the</strong>y have a substantialsubscriber base. Thus, news in TheWashington Post covers roughly 14counties, ra<strong>the</strong>r than <strong>the</strong> 18 that makeup <strong>the</strong> Washington-Arlington-Alexandria,DC-MD-VA-WV Metro SA. TheMid-<strong>America</strong> Regional Council, <strong>the</strong><strong>metropolitan</strong> planning organization forgreater Kansas City, is composed ofeight counties, while <strong>the</strong> new KansasCity, MO-KS Metropolitan StatisticalArea contains 15 counties.At <strong>the</strong> same time, several of <strong>the</strong>metro areas that underwent significantchanges might find more local receptivitythan <strong>the</strong>ir older versions. The oldNew York PMSA, consisting of <strong>the</strong> fivecity boroughs and three upstate NYcounties, bore little relation to <strong>the</strong>average citizen’s conception of <strong>the</strong>metro area. The revised New YorkMetro SA, which captures suburbanLong Island and much of nor<strong>the</strong>rnNew Jersey, probably comes muchcloser. Similarly, <strong>the</strong> Los Angelesmetro area, which before includedonly Los Angeles County, now takes inOrange County as well, better reflecting<strong>the</strong> economic ties between <strong>the</strong>setwo jurisdictions.Names, however, seem to carry evenmore weight than geographic compositionin <strong>the</strong> public eye. The status ofsuburban places like Sandy Springs,GA (Atlanta), Sugar Land, TX (Houston),Edison, NJ (New York), andNaperville, IL (Chicago) was thusimmediately elevated when <strong>the</strong>y eachfound a spot in <strong>the</strong>ir respective metroarea’s name. 34 While some of thoseplaces might earn greater acceptanceas a result—Sandy Springs is currentlyin a pitched battle to incorporate as acity—o<strong>the</strong>rs caused confusion and dismay.Consultations with local officialsresulted in OMB changing <strong>the</strong> NewYork-Newark-Edison, NY-NJ-PA MetroSAto <strong>the</strong> New York-Nor<strong>the</strong>rn NewJersey-Long Island, NY-NJ-PA MetroSAin December 2003. Public opinionsimultaneously dislodgedCheektowaga and Tonawanda, NY,both principal cities in <strong>the</strong> Buffalometro area, from that area’s name infavor of <strong>the</strong> fourth-largest principalcity, Niagara Falls, which is both atourist destination and source ofregional identity.Of course, <strong>the</strong> power of a name iseven more evident in micropolitanareas, and new <strong>metropolitan</strong> areas.Hundreds of smaller counties andtowns formerly part of “rural <strong>America</strong>”suddenly acquired <strong>the</strong>ir own identity,and increased attention fromresearchers and businesses. 35 Evencounties that formerly resided at <strong>the</strong>fringe of large <strong>metropolitan</strong> areas, likeAshtabula, OH (formerly in <strong>the</strong> Clevelandmetro area) and Nye, NV (formerlyin <strong>the</strong> Las Vegas metro area),may gain more stature from a micropolitanlabel than <strong>the</strong>y lost in separatingfrom a <strong>metropolitan</strong> center.These examples of definitionalchanges demonstrate that federal statisticalpolicy can impact how we liveand work. In <strong>the</strong> end, both researchand policy have an important role toplay in bridging <strong>the</strong> gap between <strong>the</strong>statistical versions of <strong>metropolitan</strong>areas and <strong>the</strong> popular notions of <strong>the</strong>regions in which <strong>metropolitan</strong> residentslive. To <strong>the</strong> extent that researchcan narrow this gap over time, <strong>metropolitan</strong>-levelresearch will providegreater insights for government andbusiness decisions. OMB’s new <strong>metropolitan</strong>classification system thus presentsboth a unique challenge and afresh opportunity for <strong>metropolitan</strong>research to make a real-world impact.November 2004 • The Brookings Institution The Living Cities Census Series 21
Appendix A. Definitions of Metropolitan ConceptsOld StandardsMetropolitan Statistical Areas (MSAs) contained cities or urbanized areas with at least 50,000 people. Counties wereincluded or excluded in <strong>the</strong> MSA based on employment, commuting, and population density criteria. There were 258MSAs in effect for Census 2000.Primary Metropolitan Statistical Areas (PMSAs) consisted of those counties or groups of counties within a large<strong>metropolitan</strong> area (at least one million people) that contained at least 100,000 people and met criteria for separate designations.There were 73 PMSAs in effect for Census 2000.Consolidated Metropolitan Statistical Areas (CMSAs) consisted of a <strong>metropolitan</strong> area with at least 1 million peoplein which two or more primary <strong>metropolitan</strong> areas (PMSAs) had been identified. There were 18 CMSAs in effect forCensus 2000.New England County Metropolitan Areas (NECMAs) were defined as county-based alternatives to <strong>the</strong> standard cityandtown-based <strong>metropolitan</strong> areas in <strong>the</strong> six New England states (Connecticut, Maine, Massachusetts, New Hampshire,Rhode Island, and Vermont). There were 12 NECMAs in effect for Census 2000.Central cities were defined for each MSA and CMSA. The largest incorporated place (or, in a few cases, Census designatedplace) in a <strong>metropolitan</strong> area was automatically designated a central city. Additional cities were included if <strong>the</strong>ymet population and employment criteria. There were 554 central cities in effect for Census 2000.New StandardsCore-Based Statistical Areas (CBSAs) contain a substantial population nucleus (<strong>the</strong> “core”) toge<strong>the</strong>r with adjacentcommunities having a high degree of social and economic integration with that core. CBSAs are defined as <strong>metropolitan</strong>or micropolitan depending on <strong>the</strong> size of <strong>the</strong>ir core.Metropolitan Statistical Areas (MetroSAs) contain at least one urbanized area with at least 50,000 people (<strong>the</strong>“core”). Counties are included or excluded in <strong>the</strong> metro based on commuting criteria. There are 361 MetroSAs.Metropolitan statistical areas of 2.5 million or more may be divided <strong>into</strong> <strong>metropolitan</strong> divisions. Metropolitan divisionsconsist of one or more counties that represent an employment center plus adjacent counties with strong commutingties to <strong>the</strong> core. There are eleven MetroSAs with divisions, for a total of twenty-nine divisions.Micropolitan Statistical Areas (MicroSAs) contain at least one urban cluster with between 10,000 and 50,000 people(<strong>the</strong> “core”). Counties are included or excluded in <strong>the</strong> micropolitan area based on commuting criteria. There are 573micros.New England City and Town Areas (NECTAs) are defined as conceptually similar to <strong>the</strong> county-based <strong>metropolitan</strong>and micropolitan areas, but with cities and towns as <strong>the</strong> building blocks ra<strong>the</strong>r than counties. There are 21 <strong>metropolitan</strong>NECTAs and 22 micropolitan NECTAs.Metropolitan statistical areas and micropolitan statistical areas may be joined to form combined statistical areas(CSAs). CSAs consist of two or more adjacent CBSAs (<strong>metropolitan</strong> or micropolitan or a combination of both) thatmeet employment interchange criteria. There are 120 CSAs.Principal cities are defined for each CBSA. The largest city in a CBSA is automatically designated a principal city.O<strong>the</strong>r cities may be designated if <strong>the</strong>y meet certain criteria for population and employment. There are 1255 principalcities.22November 2004 • The Brookings InstitutionThe Living Cities Census Series
Appendix B. Comparing Old and New Standards*Old StandardsNew StandardsLevels/Categories and Metropolitan statistical areas based on total populations of at leastTerminology1,000,000 (level A), 250,000 to 999,999 (level B), 100,000 to 249,999(level C), and less than 100,000 (level D), respectively. Metropolitanstatistical areas of 1,000,000 or more population can be designated asconsolidated <strong>metropolitan</strong> statistical areas if local opinion is in favorand component primary <strong>metropolitan</strong> statistical areas can be identified.Building BlocksCounties and equivalent entities throughout <strong>the</strong> U.S. and Puerto Rico,except in New England, where cities and towns are used to define <strong>metropolitan</strong>areas. County based alternative provided for <strong>the</strong> New Englandstates.Qualification of Areas City of at least 50,000 population, or Census Bureau defined urbanizedarea of at least 50,000 population in a <strong>metropolitan</strong> area of at least100,000 population.Qualification of Central Any county that includes a central city or at least 50% of <strong>the</strong> populationof a central city that is located in a qualifier urbanized area. AlsoCountiesany county in which at least 50% of <strong>the</strong> population is located in a qualifierurbanized area.Qualification of Outlying Combination of commuting and measures of settlement structure:Counties50% or more of employed workers commute to <strong>the</strong> centralcounty/counties of a <strong>metropolitan</strong> statistical area and: 25 or more personsper square mile (ppsm), or at least 10% or 5,000 of <strong>the</strong> populationlives in a qualifier urbanized area; OR40% to 50% of employed workers commute to <strong>the</strong> central county/countiesof a <strong>metropolitan</strong> statistical area and: 35 or more ppsm, or at least10% or 5,000 of <strong>the</strong> population lives in a qualifier urbanized area; OR25% to 40% of employed workers commute to <strong>the</strong> central county/countiesof a <strong>metropolitan</strong> statistical area and: 35 ppsm and one of <strong>the</strong> following:(1) 50 or more ppsm, (2) at least 35% urban population, (3) atleast 10% or 5,000 of population lives in a qualifier urbanized area; OR15% to 25% of employed workers commute to <strong>the</strong> central county/countiesof a <strong>metropolitan</strong> statistical area and: 50 or more ppsm and two of<strong>the</strong> following: (1) 60 or more ppsm, (2) at least 35% urban population,(3) population growth rate of at least 20%, (4) at least 10% or 5,000 ofpopulation lives in a qualifier urbanized area; OR15% to 25% of employed workers commute to <strong>the</strong> central county/countiesof a <strong>metropolitan</strong> statistical area and less than 50 ppsm and two of<strong>the</strong> following: (1) at least 35% urban population, (2) population growthrate of at least 20%, (3) at least 10% or 5,000 of population lives in aqualifier urbanized area; ORat least 2,500 of <strong>the</strong> population lives in a central city located in a qualifierurbanized area of a <strong>metropolitan</strong> statistical area.If a county qualifies as outlying to two or more <strong>metropolitan</strong> areas, it isassigned to <strong>the</strong> area to which commuting is greatest; if <strong>the</strong> relevant commutingpercentages are within 5 points of each o<strong>the</strong>r, local opinion is considered.*Source: Michael R. Ratcliffe, U.S. Census BureauMetropolitan statistical areas based around at least one Census Bureaudefined urbanized area of 50,000 or more population, and micropolitanstatistical areas, based around at least one urban cluster of 10,000 to49,999 population. A <strong>metropolitan</strong> statistical area with a single core ofat least 2,500,000 population can be subdivided <strong>into</strong> component <strong>metropolitan</strong>divisions. Collectively, <strong>the</strong> <strong>metropolitan</strong> and micropolitan statisticalareas are termed Core Based Statistical Areas (CBSAs).Counties and equivalent entities throughout <strong>the</strong> U.S. and Puerto Rico.City and town based areas, conceptually similar to <strong>the</strong> county basedareas, provided for <strong>the</strong> New England states.Census Bureau defined urban area of at least 10,000 population andless than 50,000 population for micropolitan statistical area designation.Census Bureau defined urbanized area of at least 50,000 for <strong>metropolitan</strong>statistical area designation.Any county in which at least 50% of <strong>the</strong> population is located in urbanareas of at least 10,000 population, or that has within its boundaries apopulation of at least 5,000 located in a single urban area of at least10,000 population.Commuting ties:At least 25% of <strong>the</strong> employed residents of <strong>the</strong> county work in <strong>the</strong> centralcounty/counties of a CBSA; or at least 25% of <strong>the</strong> employment in<strong>the</strong> county is accounted for by workers residing in <strong>the</strong> centralcounty/counties of <strong>the</strong> CBSA.A county that qualifies as outlying to two or more CBSAs is included in<strong>the</strong> area with which it has <strong>the</strong> strongest commuting tie.November 2004 • The Brookings Institution The Living Cities Census Series 23
Appendix B. Comparing Old and New Standards (continued)Old StandardsNew StandardsMerging Statistical AreasCentral Cities/PrincipalCitiesPrimary Metropolitan StatisticalAreas/MetropolitanDivisionsIf a county qualifies as a central county of one <strong>metropolitan</strong> statisticalarea and as an outlying county on <strong>the</strong> basis of commuting to a centralcounty of ano<strong>the</strong>r <strong>metropolitan</strong> statistical area, both counties becomecentral counties of a single <strong>metropolitan</strong> statistical area.Central cities include <strong>the</strong> largest city in a <strong>metropolitan</strong> statisticalarea/consolidated <strong>metropolitan</strong> statistical area AND each city of at least250,000 population or at least 100,000 workers AND each city of atleast 25,000 population and at least 75 jobs per 100 workers and lessthan 60% out commuting AND each city of at least 15,000 populationthat is at least 1/3 <strong>the</strong> size of largest central city and meets employmentratio and commuting percentage above AND <strong>the</strong> largest city of 15,000population or more that meets employment ratio and commuting percentageabove and is in a secondary noncontiguous urbanized areaAND each city in a secondary noncontiguous urbanized area that is atleast 1/3 <strong>the</strong> size of largest central city in that urbanized area and hasat least 15,000 population and meets employment ratio and commutingpercentage above.Primary <strong>metropolitan</strong> statistical areas outside New England consist ofone or more counties within <strong>metropolitan</strong> areas that have a total populationof 1 million or more. Specifically, <strong>the</strong>se primary <strong>metropolitan</strong> statisticalareas consist of: (A) One or more counties designated as astandard <strong>metropolitan</strong> statistical area on January 1, 1980, unless localopinion does not support continued separate designation.(B) One or more counties for which local opinion strongly supportsseparate designation, provided one county has: (1) at least 100,000population; (2) at least 60 percent of its population urban; (3) less than35 percent of its resident workers working outside <strong>the</strong> county; and (4)less than 2,500 population of <strong>the</strong> largest central city in <strong>the</strong> <strong>metropolitan</strong>statistical area.(C) A set of two or more contiguous counties for which local opinionstrongly supports separate designation, provided at least one countyalso could qualify as a primary <strong>metropolitan</strong> statistical area in section(B), and (1) each county meets requirements (B)(1), (B)(2), and (B)(4)and less than 50 percent of its resident workers work outside <strong>the</strong>county; (2) each county has a commuting interchange of at least 20percent with <strong>the</strong> o<strong>the</strong>r counties in <strong>the</strong> set; and (3) less than 35 percentof <strong>the</strong> resident workers of <strong>the</strong> set of counties work outside <strong>the</strong> area.Each county in <strong>the</strong> <strong>metropolitan</strong> area not included within a centralcore under sections (A) through (C), is assigned to <strong>the</strong> contiguous primary<strong>metropolitan</strong> statistical area to whose central core commuting isgreatest, provided this commuting is: (1) at least 15 percent of <strong>the</strong>county’ s resident workers; (2) at least 5 percentage points higher than<strong>the</strong> commuting flow to any o<strong>the</strong>r primary <strong>metropolitan</strong> statistical areacentral core that exceeds 15 percent; and(3) larger than <strong>the</strong> flow to <strong>the</strong> county containing <strong>the</strong> <strong>metropolitan</strong>area’s largest central city.Two adjacent CBSAs are merged to form one CBSA if <strong>the</strong> centralcounty/counties (as a group) of one CBSA qualify as outlying to <strong>the</strong>central county/counties (as a group) of <strong>the</strong> o<strong>the</strong>r.Principal cities include <strong>the</strong> largest incorporated place with a populationof 10,000 or more or, if no incorporated place of at least 10,000 is present,<strong>the</strong> largest incorporated place or census designated place in <strong>the</strong>CBSA AND each place of at least 250,000 population or in which atleast 100,000 persons work AND each place with a population of atleast 50,000, but less than 250,000 in which employment meets orexceeds <strong>the</strong> number of employed residents AND each place with a populationthat is at least 10,000 and 1/3 <strong>the</strong> size of <strong>the</strong> largest place, andin which employment meets or exceeds <strong>the</strong> number of employed residents.Metropolitan divisions consist of one or more counties within <strong>metropolitan</strong>statistical areas that have a single core of 2.5 million or more population.A county is identified as a main county of a <strong>metropolitan</strong> division if 65percent or more of its employed residents work within <strong>the</strong> county and<strong>the</strong> ratio of its employment to its number of employed residents is atleast .75.A county is identified as a secondary county of a <strong>metropolitan</strong> divisionif 50 percent or more, but less than 65 percent, of its employed residentswork within <strong>the</strong> county and <strong>the</strong> ratio of its employment to itsnumber of employed residents is at least .75 .A main county automatically serves as <strong>the</strong> basis for a <strong>metropolitan</strong> division.For a secondary county to qualify as <strong>the</strong> basis for forming a <strong>metropolitan</strong>division, it must join with ei<strong>the</strong>r a contiguous secondary countyor a contiguous main county with which it has <strong>the</strong> highest employmentinterchange measure of 15 or more.After all main counties and sceondary counties have been identifiedand grouped (if appropriate), each additional county that already hasqualified for <strong>the</strong> <strong>metropolitan</strong> statistical area is included in <strong>the</strong> metro-24November 2004 • The Brookings InstitutionThe Living Cities Census Series
Appendix B. Comparing Old and New Standards (continued)Old StandardsNew StandardsPrimary Metropolitan StatisticalAreas/MetropolitanDivisionsCombining StatisticalAreasTitlesIf a county has qualifying commuting ties to two or more primary <strong>metropolitan</strong>statistical area central cores and <strong>the</strong> relevant values arewithin 5 percentage points of each o<strong>the</strong>r, local opinion is considered.Two adjacent <strong>metropolitan</strong> statistical areas are combined as a single<strong>metropolitan</strong> statistical area if: (A) <strong>the</strong> total population of <strong>the</strong> combinationis at least one million and (1) <strong>the</strong> commuting interchange between<strong>the</strong> two <strong>metropolitan</strong> statistical areas is equal to at least 15% of <strong>the</strong>employed workers residing in <strong>the</strong> smaller <strong>metropolitan</strong> statistical area,or equal to at least 10% of <strong>the</strong> employed workers residing in <strong>the</strong> smaller<strong>metropolitan</strong> statistical area and <strong>the</strong> urbanized area of a central city ofone <strong>metropolitan</strong> statistical area is contiguous with <strong>the</strong> urbanized areaof a central city of <strong>the</strong> o<strong>the</strong>r <strong>metropolitan</strong> statistical area or a centralcity in one <strong>metropolitan</strong> statistical area is included in <strong>the</strong> same urbanizedarea as a central city in <strong>the</strong> o<strong>the</strong>r <strong>metropolitan</strong> statistical area;AND (2) at least 60% of <strong>the</strong> population of each <strong>metropolitan</strong> statisticalarea is urban. (B) <strong>the</strong> total population of <strong>the</strong> combination is less thanone million and (1) <strong>the</strong>ir largest central cities are within 25 miles ofone ano<strong>the</strong>r, or <strong>the</strong> urbanized areas are contiguous; AND (2) <strong>the</strong>re isdefinite evidence that <strong>the</strong> two areas are closely integrated economicallyand socially; AND (3) local opinion in both areas supports combination.Titles of <strong>metropolitan</strong> statistical areas include <strong>the</strong> names of up to threecentral cities in order of descending population size. Local opinion isconsidered under specified conditions.Titles of primary <strong>metropolitan</strong> statistical areas include <strong>the</strong> names of upto three cities in <strong>the</strong> primary <strong>metropolitan</strong> statistical area that havequalified as central cities. If <strong>the</strong>re are no central cities, <strong>the</strong> title willinclude <strong>the</strong> names of up to three counties in <strong>the</strong> primary <strong>metropolitan</strong>statistical area in order of descending population size.Titles of consolidated <strong>metropolitan</strong> statistical areas include <strong>the</strong> namesof up to three central cities or counties in <strong>the</strong> consolidated <strong>metropolitan</strong>statistical area. The first name will be <strong>the</strong> largest central city in <strong>the</strong>consolidated <strong>metropolitan</strong> statistical area; <strong>the</strong> remaining two nameswill be <strong>the</strong> first city or county name that appears in <strong>the</strong> title of <strong>the</strong>remaining primary <strong>metropolitan</strong> statistical area with <strong>the</strong> largest totalpopulation and <strong>the</strong> first city or county name that appears in <strong>the</strong> title of<strong>the</strong> primary <strong>metropolitan</strong> statistical area with <strong>the</strong> next largest total population.Regional designations can be substituted for <strong>the</strong> second andthird names if <strong>the</strong>re is strong local support.politan division associated with <strong>the</strong> main/secondary county to which <strong>the</strong>county at issue has <strong>the</strong> highest employment interchange measure.Counties within a <strong>metropolitan</strong> division must be contiguous.Two adjacent CBSAs are combined if <strong>the</strong> employment interchange ratebetween <strong>the</strong> two areas is at least 25. The employment interchange rateis <strong>the</strong> sum of <strong>the</strong> percentage of employed residents of <strong>the</strong> CBSA with<strong>the</strong> smaller total population who work in <strong>the</strong> CBSA with <strong>the</strong> larger totalpopulation and <strong>the</strong> percentage of employment in <strong>the</strong> CBSA with <strong>the</strong>smaller total population that is accounted for by workers residing in <strong>the</strong>CBSA with <strong>the</strong> larger total population. Adjacent CBSAs that have anemployment interchange rate of at least 15 and less than 25 may combineif local opinion in both areas favors combination. The combiningCBSAs also retain separate recognition.Titles of CBSAs include <strong>the</strong> names of up to three principal cities inorder of descending population size.Titles of <strong>metropolitan</strong> divisions include <strong>the</strong> names of up to three principalcities in <strong>the</strong> <strong>metropolitan</strong> division in order of descending populationsize. If <strong>the</strong>re are no principal cities, <strong>the</strong> title includes <strong>the</strong> names of upto three counties in <strong>the</strong> <strong>metropolitan</strong> division in order of descendingpopulation size.Titles of combined statistical areas include <strong>the</strong> name of <strong>the</strong> largest principalcity in <strong>the</strong> largest CBSA that combines, followed by <strong>the</strong> names ofup to two additional principal cities in <strong>the</strong> combination in order ofdescending population size, or a suitable regional name, provided thatcombined statistical area title does not duplicate <strong>the</strong> title of a component<strong>metropolitan</strong> or micropolitan statistical area or <strong>metropolitan</strong> division.Local opinion will be considered when determining <strong>the</strong> titles ofcombined statistical areas.November 2004 • The Brookings Institution The Living Cities Census Series 25
Appendix C. Metropolitan Statistical Areas with <strong>Population</strong>s of 500,000 orGreater, New Standards, 2000Rank Metropolitan Statistical Area <strong>Population</strong> in 20001 New York-Nor<strong>the</strong>rn New Jersey-Long Island, NY-NJ-PA 18,323,0022 Los Angeles-Long Beach-Santa Ana, CA 12,365,6273 Chicago-Naperville-Joliet, IL-IN-WI 9,098,3164 Philadelphia-Camden-Wilmington, PA-NJ-DE-MD 5,687,1475 Dallas-Fort Worth-Arlington, TX 5,161,5446 Miami-Fort Lauderdale-Miami Beach, FL 5,007,5647 Washington-Arlington-Alexandria, DC-VA-MD-WV 4,796,1838 Houston-Baytown-Sugar Land, TX 4,715,4079 Detroit-Warren-Livonia, MI 4,452,55710 Boston-Cambridge-Quincy, MA-NH 4,391,34411 Atlanta-Sandy Springs-Marietta, GA 4,247,98112 San Francisco-Oakland-Fremont, CA 4,123,74013 Riverside-San Bernardino-Ontario, CA 3,254,82114 Phoenix-Mesa-Scottsdale, AZ 3,251,87615 Seattle-Tacoma-Bellevue, WA 3,043,87816 Minneapolis-St. Paul-Bloomington, MN-WI 2,968,80617 San Diego-Carlsbad-San Marcos, CA 2,813,83318 St. Louis, MO-IL 2,698,68719 Baltimore-Towson, MD 2,552,99420 Pittsburgh, PA 2,431,08721 Tampa-St. Petersburg-Clearwater, FL 2,395,99722 Denver-Aurora, CO 2,157,75623 Cleveland-Elyria-Mentor, OH 2,148,14324 Cincinnati-Middletown, OH-KY-IN 2,009,63225 Portland-Vancouver-Beaverton, OR-WA 1,927,88126 Kansas City, MO-KS 1,836,03827 Sacramento—Arden-Arcade—Roseville, CA 1,796,85728 San Jose-Sunnyvale-Santa Clara, CA 1,735,81929 San Antonio, TX 1,711,70330 Orlando, FL 1,644,56131 Columbus, OH 1,612,69432 Providence-New Bedford-Fall River, RI-MA 1,582,99733 Virginia Beach-Norfolk-Newport News, VA-NC 1,576,37034 Indianapolis, IN 1,525,10435 Milwaukee-Waukesha-West Allis, WI 1,500,74136 Las Vegas-Paradise, NV 1,375,76537 Charlotte-Gastonia-Concord, NC-SC 1,330,44838 New Orleans-Metairie-Kenner, LA 1,316,51039 Nashville-Davidson—Murfreesboro, TN 1,311,78940 Austin-Round Rock, TX 1,249,76341 Memphis, TN-MS-AR 1,205,20442 Buffalo-Niagara Falls, NY 1,170,11143 Louisville, KY-IN 1,161,97544 Hartford-West Hartford-East Hartford, CT 1,148,61845 Jacksonville, FL 1,122,75046 Richmond, VA 1,096,95747 Oklahoma City, OK 1,095,42148 Birmingham-Hoover, AL 1,052,23826November 2004 • The Brookings InstitutionThe Living Cities Census Series
Appendix C. Metropolitan Statistical Areas with <strong>Population</strong>s of 500,000 orGreater, New Standards, 2000 (continued)Rank Metropolitan Statistical Area <strong>Population</strong> in 200049 Rochester, NY 1,037,83150 Salt Lake City, UT 968,85851 Bridgeport-Stamford-Norwalk, CT 882,56752 Honolulu, HI 876,15653 Tulsa, OK 859,53254 Dayton, OH 848,15355 Tucson, AZ 843,74656 Albany-Schenectady-Troy, NY 825,87557 New Haven-Milford, CT 824,00858 Fresno, CA 799,40759 Raleigh-Cary, NC 797,07160 Omaha-Council Bluffs, NE-IA 767,04161 Oxnard-Thousand Oaks-Ventura, CA 753,19762 Worcester, MA 750,96363 Grand Rapids-Wyoming, MI 740,48264 Allentown-Bethlehem-Easton, PA-NJ 740,39565 Albuquerque, NM 729,64966 Baton Rouge, LA 705,97367 Akron, OH 694,96068 Springfield, MA 680,01469 El Paso, TX 679,62270 Bakersfield, CA 661,64571 Toledo, OH 659,18872 Syracuse, NY 650,15473 Columbia, SC 647,15874 Greensboro-High Point, NC 643,43075 Poughkeepsie-Newburgh-Middletown, NY 621,51776 Knoxville, TN 616,07977 Little Rock-North Little Rock, AR 610,51878 Youngstown-Warren-Boardman, OH-PA 602,96479 Sarasota-Bradenton-Venice, FL 589,95980 Wichita, KS 571,16681 McAllen-Edinburg-Pharr, TX 569,46382 Stockton, CA 563,59883 Scranton—Wilkes-Barre, PA 560,62584 Greenville, SC 559,94085 Charleston-North Charleston, SC 549,03386 Colorado Springs, CO 537,48487 Harrisburg-Carlisle, PA 509,07488 Madison, WI 501,774November 2004 • The Brookings Institution The Living Cities Census Series 27
Endnotes1. In 1947, <strong>the</strong> Bureau of <strong>the</strong> Budget (predecessorof <strong>the</strong> current Office of Managementand Budget), in coordination with<strong>the</strong> Census Bureau, <strong>the</strong> Bureau of LaborStatistics and o<strong>the</strong>r agencies coordinatedefforts to define <strong>the</strong> initial Standard MetropolitanAreas (SMAs). They were formedon <strong>the</strong> basis of a large population nucleustoge<strong>the</strong>r with adjacent components (counties,or in New England, towns). Prior tothis time, <strong>metropolitan</strong>-like entities weredefined variously by different agencies withnames such as “<strong>metropolitan</strong> districts,”“industrial areas,” “labor market areas,”and “<strong>metropolitan</strong> counties” (Fitzsimmonsand Ratcliffe, 2004).2. Subsequent to <strong>the</strong> identification of StandardMetropolitan Areas (SMAs) in 1949,different terms and slight changes in definitionswere incorporated to establish <strong>the</strong>basic areas as Standard Metropolitan StatisticalAreas (SMSAs) in 1958, and MetropolitanStatistical Areas (MSAs) in 1983(Frey and Speare, 1995). Concepts associatedwith larger <strong>metropolitan</strong> regions(groupings of <strong>metropolitan</strong> areas) identifiedfor use in previous censuses included: <strong>the</strong>Standard Consolidated Area, used in <strong>the</strong>1960 Census; <strong>the</strong> Standard ConsolidatedStatistical Area (SCSA), identified in 1975for use in <strong>the</strong> 1980 Census; and <strong>the</strong> ConsolidatedMetropolitan Statistical Area(CMSA) in 1983 (see Frey and Speare,1995).3. Fitzsimmons and Ratcliffe, 2004.4. This survey does not attempt to review allof <strong>the</strong> substantive and technical decisionsmade during this extensive effort (seeOffice of Management and Budget, 2000a;Fitzimmons and Ratcliffe, 2004; and U.S.General Accounting Office, 2004).5. Note that we are comparing metro areaswhere old <strong>metropolitan</strong> standards wereused to define areas with pre-2000 populationand commuting data; to <strong>the</strong> new standardswhich were used to define areas with2000 Census commuting data and 2000Census and 2002 population estimatedata. Thus, some changes to metro areasresult solely from changes to OMB’s classificationsystem; o<strong>the</strong>rs reflect populationand economic dynamics taking place over<strong>the</strong> course of <strong>the</strong> 1990s.6. Metropolitan areas have also been definedfor <strong>the</strong> territory of Puerto Rico, but <strong>the</strong>ywill be omitted from our comparisons.7. The US Census Bureau defines as urbanany densely settled area that has a populationof at least 2,500. All territory notincluded in an urbanized area of 50,000 ormore people or an urban cluster of 2,500to 49,999 people (<strong>the</strong> two types of urbanareas) is considered rural.8. See, for example, Brown and Swanson,2004.9. See, for example, Frey and Berube, 2002.10. Johnson, 1999.11. “Measuring Rurality: Rural-Urban ContinuumCodes.” USDA Economic ResearchService, www.ers.usda.gov/briefing/rurality/RuralUrbCon/(accessed August 2004).12. While <strong>the</strong> existence of an urbanized areaover 50,000 is required for each MetroSA,<strong>the</strong> central counties are defined in terms ofmore expansive urban populations, includingboth urbanized areas and smaller urbanclusters. Central cities are no longer partof <strong>the</strong> new definitions.13. The previous criteria for adding outlyingcounties included both density and commutingrequirements. The new criteriahave dropped <strong>the</strong> density requirements butmade <strong>the</strong> commuting requirements morestringent. (See Appendix B for details.) Aconsequence of <strong>the</strong> more stringent commutingrequirements was <strong>the</strong> eliminationof outlying counties that would have qualifiedunder <strong>the</strong> old system; however, insome cases new counties with low populationdensities now qualify as outlying countiesunder <strong>the</strong> new standards where <strong>the</strong>ywould have been omitted under <strong>the</strong> previousones.14. The new system does not define a PMSAcounterpart for large areas with populationsexceeding one million (as was <strong>the</strong>case for CMSAs in <strong>the</strong> old system). However,for 11 MetroSAs, with populationsexceeding 2.5 million, <strong>the</strong> new system creates“<strong>metropolitan</strong> divisions,” which insome cases approximate <strong>the</strong> formerPMSAs. These are discussed later in <strong>the</strong>text.15. Frey, 2004a.16. Springfield, MA and Providence, RI were<strong>the</strong> only New England metros to experiencea net addition of counties.17. For instance, <strong>the</strong> county seat of fully ruralKing George County, VA, is a full 70 milesfrom <strong>the</strong> District of Columbia. In 2000,only 3 percent of <strong>the</strong> county’s workerscommuted to D.C.28November 2004 • The Brookings InstitutionThe Living Cities Census Series
18. Of <strong>the</strong> 22 metro areas under <strong>the</strong> old systemthat have combined in <strong>the</strong> new system,fully seven are located in <strong>the</strong> New Yorkregion.19. This change has brought recognition tolarge suburban economic centers and hasbrought places <strong>into</strong> titles that never wouldhave been able to qualify in <strong>the</strong> past (forinstance, Paradise, NV; Sandy Springs, GA;and Towson, MD).20. Additional principal cities within a <strong>metropolitan</strong>area include any with more than250,000 people or 100,000 workers. Placeswith more than 50,000 can also be principalcities if <strong>the</strong> number of jobs located<strong>the</strong>re meets or exceeds <strong>the</strong> number ofemployed residents. Finally, principal citiesalso include places with more than 10,000people that are at least one-third <strong>the</strong> size of<strong>the</strong> largest place in <strong>the</strong> metro area, andthat have at least as many jobs as employedresidents.21. See, e.g., William H. Frey, “Melting PotSuburbs: A Census 2000 Study of SuburbanDiversity” (Washington: BrookingsInstitution, 2001); Alan Berube andWilliam H. Frey, “A Decade of MixedBlessings: Urban and Suburban Poverty inCensus 2000” (Washington: BrookingsInstitution, 2002); Audrey Singer, “TheRise of New Immigrant Gateways” (Washington:Brookings Institution, 2004).22. See Frey 2004b for a critique of employingthis practice to designate <strong>the</strong> suburbanpopulation.23. At <strong>the</strong> same time, many Brookings analyseshave employed a modified set of centralcities in <strong>the</strong> largest <strong>metropolitan</strong> areas, recognizingonly cities that appear within <strong>the</strong><strong>metropolitan</strong> area name—and in somecases, only those that exceed certain populationthresholds. See, e.g., William H.Frey and Alan Berube, “City Families, SuburbanSingles: An Emerging HouseholdStory from Census 2000” (Washington:Brookings Institution, 2002); Roberto Suroand Audrey Singer, “Latino Growth in Metropolitan<strong>America</strong>: Changing Patterns,New Locations” (Washington: BrookingsInstitution, 2002). This approach discountedsmall employment centers in largeregions, such as Frederick, MD (Washington–BaltimoreCMSA) and Port Huron,MI (Detroit CMSA); future Brookingsanalyses may employ a similar approachwith principal cities.24. There are some exceptions to this rule,where local opinion favored a differentname. See Discussion.25. According to <strong>the</strong> old standards, <strong>metropolitan</strong>area names included <strong>the</strong> largest centralcity and each additional city with at least250,000 persons. Under <strong>the</strong> new standards,<strong>the</strong> names of <strong>the</strong> second and thirdlargest principal cities are included in <strong>metropolitan</strong>area titles.26. Under <strong>the</strong> old standards, Austin and SanMarcos were <strong>the</strong> two central cities in <strong>the</strong>Austin, TX MSA. Round Rock was not acentral city because it did not have anemployment/residence ratio of at least 0.75and at least 40 percent of its employed residentsworking within <strong>the</strong> city. Under <strong>the</strong>new standards, Round Rock qualifies as aprincipal city because its population is over50,000 and its employment/residence ratiois at least 1.0. Because San Marcos’ populationis less than 50,000, and it does nothave both an employment/residence ratioof at least 1.0 and a population of at leastone-third that of Austin’s, it did not qualifyas a principal city and was thus droppedfrom <strong>the</strong> <strong>metropolitan</strong> area title.27. State laws and regulations make use ofOMB-defined <strong>metropolitan</strong> areas as well,but we focus on federal policy here to keep<strong>the</strong> scope reasonable, and to comment onpolicies potentially applicable to all metroareas.28. Many of <strong>the</strong>se special designations affordrural hospitals additional reimbursement.29. In fact, CMS oversees a Medicare GeographicClassification Review Board toconsider special circumstances underwhich hospitals designated as “rural” canpetition to receive an “urban” designation,and vice versa.30. Federal Register 69 (96) (May 18, 2004):28249–28252.31. This is somewhat at odds with <strong>the</strong> notionthat as metro areas grow larger, <strong>the</strong>ybecome eligible for more federal funds.See, e.g, Chris Poynter, “Louisville makesgains on federal map; Area’s growth opendoors for more funding, businesses.”Louisville Courier-Journal, June 10, 2003,p. 1A.32. Office of Management and Budget,“Update of Statistical Area Definitions andAdditional Guidance on Their Uses.” OMBBulletin No. 04-03 (February 18, 2004).33. One private-sector firm, ACCRA, hasalready adopted Metropolitan Divisions toanalyze cost-of-living differences amongU.S. <strong>metropolitan</strong> areas. ACCRA andFargo Cass County Economic DevelopmentCorporation, 2004. “ACCRA Cost ofLiving Index.”34. Haya El Nasser, “Metro area’s suburbsmake name for <strong>the</strong>mselves.” USA Today,July 22, 2003, p. A3.35. Laurent Belsie, “Small rural towns get newname—and new attention.” Christian ScienceMonitor, June 20, 3003, p. 2.November 2004 • The Brookings Institution The Living Cities Census Series 29
ReferencesBrown, David L. and Louis E. Swanson,eds., 2004. Challenges for Rural<strong>America</strong> in <strong>the</strong> Twenty-First Century.University Park: Pennsylvania StateUniversity Press.Fitzsimmons, James D. and MichaelR. Ratcliffe, 2004. “Reflections on <strong>the</strong>Review of Metropolitan Area Standardsin <strong>the</strong> United States, 1990-2000” in Tony Champion and GraemeHugo, eds., New Forms of Urbanization:Beyond <strong>the</strong> Urban-RuralDichotomy. Burlington, Vermont: AshgatePublishing.Frey, William H. 2003. “Metro Magnetsfor International and DomesticMigrants.” Washington: BrookingsInstitution.——. 2004a. “Micropolitan <strong>America</strong>:Small is Interesting.” Charticle,Milken Institute Review, SecondQuarter, April.——. 2004b. “The Fading of City-Suburband Metro-Nonmetro Distinctionsin <strong>the</strong> United States.” in Tony Championand Graeme Hugo, eds., NewForms of Urbanization: Beyond <strong>the</strong>Urban-Rural Dichotomy. Burlington,Vermont: Ashgate Publishing.Frey, William H. and Alan Berube,2002. “City Families and SuburbanSingles: An Emerging HouseholdStory” in Bruce Katz and Robert E.Lang, eds., Redefining Urban and Suburban<strong>America</strong>: Evidence from Census2000, Volume 1. Washington: Brookings.Frey, William H. and Alden Speare,1995. “Metropolitan Areas as FunctionalCommunities” in Donald C.Dahmann and James D. Fitzsimmons,eds., Metropolitan And NonmetropoolitanAreas: New Approaches To GeographicDefinition. Working Paper No.12. Washington DC: US CensusBureau.Johnson, Kenneth M., 1999. “TheRural Rebound.” PRB Reports on<strong>America</strong>. Washington, DC: <strong>Population</strong>Reference Bureau.Lang, Robert E. and Dawn Dhavale.2004. “Micropolitan <strong>America</strong>: A BrandNew Geography.” Census Note 05:01.Metropolitan Institute at VirginiaTech.Savageau, David. 2000. Places RatedAlmanac. Foster City, California: IDBBooks Worldwide.Office of Management and Budget,1998. “Alternative Approaches toDefining Metropolitan and Non<strong>metropolitan</strong>Areas.” Federal Register. Vol.63, No. 244, December 21.Office of Management and Budget,1999. Bulletin 99–04. June 30.Office of Management and Budget,2000. “Standards for Defining Metropolitanand Micropolitan StatisticalAreas.” Federal Register. Vol. 65, No.249, December 27.Office of Management and Budget,2003. Bulletin No. 03–04. June 6.Office of Management and Budget,2004. Bulletin 04–03. Feb. 18.U.S. General Accounting Office,2004. Metropolitan Statistical Areas:New Standards and Their Impact onSelected Federal Programs. June,2004. Report GAO-04-758. Availableat http://www.gao.gov/new.items/d04758.pdf.30November 2004 • The Brookings InstitutionThe Living Cities Census Series
AcknowledgmentsThe authors express <strong>the</strong>ir gratitude to Michael Ratcliffe, Elizabeth Grieco,and Amy Liu for <strong>the</strong>ir comments on earlier drafts of <strong>the</strong> paper and to CathySun for her technical assistance.For More Information:William H. FreyVisiting FellowThe Brookings Institution Metropolitan Policy Program(202) 797-6292Frey’s co-authors, also with <strong>the</strong> Metropolitan Policy Program, are ResearchAnalyst Jill H. Wilson, Fellow Alan Berube, and Immigration FellowAudrey Singer.For General Information:The Brookings Institution Metropolitan Policy Program(202) 797-6139www.brookings.edu/metroNovember 2004 • The Brookings Institution The Living Cities Census Series 31
About <strong>the</strong> Living Cities Census SeriesCensus 2000 provides a unique opportunity to define <strong>the</strong> shape of urban and <strong>metropolitan</strong>policy for <strong>the</strong> coming decade. With support from Living Cities: The National CommunityDevelopment Initiative, <strong>the</strong> Brookings Institution Metropolitan Policy Programhas launched <strong>the</strong> Living Cities Census Series, a major three-year effort to illustrate howurban and suburban <strong>America</strong> has changed in <strong>the</strong> last two decades. As a part of this effort,Brookings is conducting comparative analyses of <strong>the</strong> major social, economic, and demographictrends for U.S. <strong>metropolitan</strong> areas, as well as a special effort to provide censusinformation and analysis in a manner that is tailored to <strong>the</strong> cities involved in <strong>the</strong> LivingCities initiative.Living Cities: The National Community Development Initiative is a partnership ofleading foundations, financial institutions, nonprofit organizations, and <strong>the</strong> federal governmentthat is committed to improving <strong>the</strong> vitality of cities and urban communities.Living Cities funds <strong>the</strong> work of community development corporations in 23 cities anduses <strong>the</strong> lessons of that work to engage in national research and policy development.Visit Living Cities on <strong>the</strong> web at www.livingcities.org55 West 125th Street • 11th Floor • New York, NY 10027Tel: 646-442-2200 • Fax: 646-442-2239www.livingcities.orgThe Brookings Institution1775 Massachusetts Avenue, NW • Washington D.C. 20036-2188Tel: 202-797-6000 • Fax: 202-797-6004www.brookings.eduDirect: 202-797-6139 • Fax/direct: 202-797-2965www.brookings.edu/metro