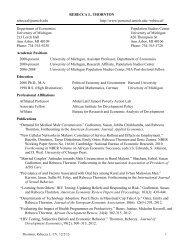
Table 2. Number ofMicroSAs by StateRank State Micros1 Texas 412 Ohio 293 North Carolina 264 Indiana 255 Georgia 246 Illinois 237 Pennsylvania 218 Missouri 209 Mississippi 2010 Tennessee 2011 Michigan 1812 Minnesota 1813 Kentucky 1714 Louisiana 1715 Oklahoma 1716 Kansas 1517 New York 1518 Iowa 1519 Arkansas 1420 New Mexico 1421 Oregon 1322 South Carolina 1323 Wisconsin 1324 Alabama 1325 Florida 1126 Nebraska 1027 South Dakota 928 Washington 929 California 930 Idaho 831 Colorado 732 Wyoming 733 West Virginia 634 New Hampshire 635 Arizona 536 Montana 537 North Dakota 538 Vermont 539 Utah 540 Maryland 441 Nevada 442 Alaska 343 Hawaii 344 Virginia 345 Connecticut 246 Maine 247 Delaware 148 District of Columbia 049 Massachusetts 050 New Jersey 051 Rhode Island 0Source: OMBNote: Micropolitan areas that cross stateboundaries are counted once in each state.Frey (2004a) highlight <strong>the</strong> variationsin micropolitan area demographic profiles.They find that <strong>the</strong> fastest-growingMicroSAs are located nearby largegrowing MetroSAs, while <strong>the</strong> moreremote MicroSAs are generally smallerand slow-growing. Overall, MicroSApopulations tend to be older, poorer,more conservative, less educated, andless racially diverse than <strong>the</strong>ir <strong>metropolitan</strong>counterparts. 15C. Under <strong>the</strong> new system, 81 of <strong>the</strong>nation’s 102 largest <strong>metropolitan</strong>areas have undergone changes interritory and population.Analysts and even casual observersfirst encountering <strong>the</strong> new <strong>metropolitan</strong>areas will likely ask: How differentare <strong>the</strong> new standards from <strong>the</strong> oldones? The simple answer is: quite abit. The changes are especially pronouncedin <strong>the</strong> nation’s larger <strong>metropolitan</strong>areas, which form <strong>the</strong> focus ofmany Brookings Metropolitan PolicyProgram analyses. This section firstdescribes <strong>the</strong> changes from <strong>the</strong> old tonew systems at <strong>the</strong> county level, <strong>the</strong>nexplores how those county transitionsre-shaped <strong>the</strong> nation’s largest <strong>metropolitan</strong>areas.County ShiftsBecause both <strong>the</strong> old and new systemsare county-based, it is possible to view<strong>the</strong> extent of change between <strong>the</strong> twosystems from <strong>the</strong> county level. Between<strong>the</strong> systems, counties could make sixpossible transitions, shown in Table 3.Of <strong>the</strong> 3,141 counties that make up<strong>the</strong> United States, a plurality (43 percent)remained “undefined”—that is,<strong>the</strong>y were non-<strong>metropolitan</strong> under <strong>the</strong>old system and are non-core-basedunder <strong>the</strong> new system. They include<strong>the</strong> vast number of small, rural countiesfound mostly in <strong>the</strong> interior states.The next largest proportion of counties(26 percent) remained <strong>metropolitan</strong>between <strong>the</strong> old and new systems, andof <strong>the</strong>se <strong>the</strong> vast majority (92 percent)remained within <strong>the</strong> same <strong>metropolitan</strong>area. So roughly 70 percent ofcounties retained a comparable classificationin <strong>the</strong> transition to <strong>the</strong> newstandards.O<strong>the</strong>r counties changed classificationdue to <strong>the</strong> introduction of <strong>the</strong>micropolitan concept, new rules fordefining <strong>metropolitan</strong> areas, changesin commuting patterns, or simple populationgrowth and decentralization.Counties that changed from non-<strong>metropolitan</strong>to micropolitan were fairlycommon, accounting for 21 percentof all counties and nearly 10 percentof U.S. population. Nine percent ofU.S. counties jumped from non-<strong>metropolitan</strong>to <strong>metropolitan</strong> status. Farsmaller proportions moved down <strong>the</strong>hierarchy from <strong>metropolitan</strong> tomicropolitan (1 percent) and from<strong>metropolitan</strong> to non-core-based status(just 5 counties).As a result of <strong>the</strong>se transitions, agreater share of <strong>the</strong> nation’s populationis now considered <strong>metropolitan</strong>(83 percent, up from 80 percent). Onnet, 242 counties moved from non<strong>metropolitan</strong>to <strong>metropolitan</strong> standing(46 from <strong>metropolitan</strong> to non-<strong>metropolitan</strong>and 288 from non-<strong>metropolitan</strong>to <strong>metropolitan</strong>). Some becamepart of <strong>the</strong> 44 new <strong>metropolitan</strong> areasannounced under <strong>the</strong> new system,while o<strong>the</strong>rs were added onto <strong>the</strong>fringe of existing <strong>metropolitan</strong> areas.Of <strong>the</strong> 46 counties that changed statusfrom <strong>metropolitan</strong> to non-<strong>metropolitan</strong>,only five did not becomepart of a MicroSA. The 41 previously<strong>metropolitan</strong> counties that becamemicropolitan did not necessarily shrinkin size, but generally failed to meet<strong>the</strong> new more stringent commutingthreshold for inclusion in <strong>metropolitan</strong>areas.Metropolitan ShiftsDespite <strong>the</strong> fact that a majority of <strong>the</strong>nation’s counties have effectively <strong>the</strong>same designations under <strong>the</strong> new system,<strong>the</strong> county composition of most of<strong>the</strong> nation’s largest <strong>metropolitan</strong> areaschanged in some way. In fact, 81 of <strong>the</strong>102 <strong>metropolitan</strong> areas with popula-The Living Cities Census Series
Table 3. County TransitionsPercent of <strong>Population</strong> Percent ofOld Classification New Classification Number Counties in 2000 <strong>Population</strong>Metropolitan Metropolitan 801 25.5 223,113,722 79.3Metropolitan Micropolitan 41 1.3 2,856,237 1.0Metropolitan Non-core-based 5 0.2 105,216 0.0Non-<strong>metropolitan</strong> Metropolitan 288 9.2 9,466,218 3.4Non-<strong>metropolitan</strong> Micropolitan 649 20.7 26,556,061 9.4Non-<strong>metropolitan</strong> Non-core-based 1357 43.2 19,324,452 6.9Source: Authors’ calculations of OMB and Census 2000 dataTable 4. Metropolitan Transitions, Metros with 500,000 orGreater <strong>Population</strong>, 2000Transition Type Number of Metros Percent of Top 102Geographical Changes:Added counties (net) 29 28.4Removed counties (net) 13 12.7Split <strong>into</strong> two or more metros 9 8.8Combined <strong>into</strong> one metro 23 22.5Changed in more than one way 7 6.9Stayed <strong>the</strong> same 21 20.6Total 102 100.0<strong>Population</strong> Changes:*Gained <strong>Population</strong> 56 54.9Lost <strong>Population</strong> 25 24.5Same <strong>Population</strong> 21 20.6Total 102 100.0*As measured by comparing total metro population in 2000 according to <strong>the</strong> old and newdefinitions.Source: Authors’ calculations of OMB datations of at least 500,000 under <strong>the</strong> oldsystem are defined somewhat differentlyunder <strong>the</strong> new system. As aresult, two-thirds (56) of <strong>the</strong> 81 metrosgained population, while <strong>the</strong> rest (25)lost population. Here, we provide illustrativeexamples of <strong>the</strong> several differentways in which <strong>metropolitan</strong> areas havebeen redefined by <strong>the</strong> new standards.Table 4 shows <strong>the</strong> extent of each of<strong>the</strong>se types of changes among <strong>the</strong> 102metro areas when we compare <strong>the</strong> oldMSAs/PMSAs to <strong>the</strong> new MetroSAs.Adding Counties to MetroAreas—AtlantaTwenty-nine of <strong>the</strong> 102 largest <strong>metropolitan</strong>areas experienced a net additionof counties in <strong>the</strong> transition to <strong>the</strong>new system. Most of <strong>the</strong>se metro areasare located in <strong>the</strong> middle and sou<strong>the</strong>rnregions of <strong>the</strong> country, where populationis growing and spreading outquickly. 16Atlanta offers <strong>the</strong> most dramaticexample of a <strong>metropolitan</strong> area withadditional counties in its definition.Metropolitan Atlanta is undergoingrapid population growth, mostly in itssuburbs, which grew by 44 percent in<strong>the</strong> 1990s. The new definition ofmetro Atlanta reflects this sprawlingsuburban pattern and offers more thanone choice for delineating <strong>the</strong> area.Under <strong>the</strong> old standards, Atlanta was asingle MSA made up of 20 counties.The new system creates <strong>the</strong> 28-countyAtlanta-Sandy Springs-Marietta, GAMetroSA (<strong>the</strong> original 20 countiesplus eight additional ones). It alsogives <strong>the</strong> option of using <strong>the</strong> 33-county Atlanta-Sandy Springs-Gainesville Combined StatisticalArea (CSA), which includes <strong>the</strong>Gainesville MetroSA (one county),and four MicroSAs (one county each)(Figure 6).Removing Counties from MetroAreas—Knoxville, Las Vegas,and Washington, D.C.Most of <strong>the</strong> 13 <strong>metropolitan</strong> areas thatexperienced a net loss of counties arelocated in <strong>the</strong> eastern half of <strong>the</strong>United States. In <strong>the</strong> West, only LasVegas, NV lost counties from its <strong>metropolitan</strong>definition.As noted earlier, <strong>the</strong> vast majorityof counties removed from <strong>metropolitan</strong>areas became part of micropolitanareas, so <strong>the</strong>y do not necessarily representareas that are losing population.In almost all cases in whichmicropolitan areas are created on <strong>the</strong>outskirts of <strong>metropolitan</strong> areas, Com-November 2004 • The Brookings Institution The Living Cities Census Series 9