Radionuclide analysis in the soil of Kumaun ... - Current Science
Radionuclide analysis in the soil of Kumaun ... - Current Science
Radionuclide analysis in the soil of Kumaun ... - Current Science

Create successful ePaper yourself
Turn your PDF publications into a flip-book with our unique Google optimized e-Paper software.
RESEARCH COMMUNICATIONS<br />
<strong>Radionuclide</strong> <strong>analysis</strong> <strong>in</strong> <strong>the</strong> <strong>soil</strong> <strong>of</strong><br />
<strong>Kumaun</strong> Himalaya, India, us<strong>in</strong>g<br />
gamma ray spectrometry<br />
R. C. Ramola 1, *, V. M. Choubey 2 , Ganesh Prasad 1 ,<br />
G. S. Gusa<strong>in</strong> 1 , Z. Tosheva 3 and A. Kies 3<br />
1 Department <strong>of</strong> Physics, H. N. B. Garhwal University,<br />
Badshahi Thaul Campus, Tehri Garhwal 249 199, India<br />
2 Wadia Institute <strong>of</strong> Himalayan Geology, Dehradun 248 001, India<br />
3 Laboratoire Physique des Radiations, Universite du Luxembourg,<br />
162A avenue de la Faiencerie, L-1511 Luxembourg<br />
Environmental release <strong>of</strong> low levels <strong>of</strong> radioactivity<br />
can occur as a consequence <strong>of</strong> normal radionuclides<br />
present <strong>in</strong> <strong>the</strong> earth’s crust. We present here <strong>the</strong><br />
results <strong>of</strong> a survey undertaken <strong>in</strong> 2003 on <strong>the</strong> radionuclide<br />
concentration <strong>in</strong> different rock formations <strong>in</strong> <strong>the</strong><br />
eastern part <strong>of</strong> <strong>Kumaun</strong> Himalaya. The activity concentration<br />
and gamma-absorbed dose rates <strong>of</strong> <strong>the</strong><br />
terrestrial radionuclides caused by 226 Ra, 232 Th and<br />
40 K were determ<strong>in</strong>ed <strong>in</strong> <strong>the</strong> <strong>soil</strong> samples collected from<br />
<strong>the</strong> eastern part <strong>of</strong> <strong>Kumaun</strong> Himalaya. The mean concentration<br />
<strong>of</strong> 238 U and 232 Th <strong>in</strong> <strong>the</strong> earth’s crust varied<br />
from 0.5 to 5 ppm (6 to 60 Bq/kg) and 2 to 20 ppm<br />
(8 to 80 Bq/kg) respectively. The reported activity<br />
concentration for <strong>the</strong> different rock formations varied<br />
from 32.6 to 1305.5 Bq/kg for 238 U, 16.3 to 136.3 Bq/kg<br />
for 232 Th and 124.6 to 1758.0 Bq/kg for 40 K. The distribution<br />
<strong>of</strong> <strong>the</strong> radionuclides varied with rock type<br />
due to different chemical properties <strong>of</strong> <strong>the</strong> measured<br />
radionuclides and <strong>the</strong> rocks. The result shows that<br />
high activity levels were found <strong>in</strong> Saryu Formation<br />
consist<strong>in</strong>g <strong>of</strong> augen–gneiss, granite <strong>in</strong>terbedded with<br />
schists and flaggy quartzite. The total air-absorbed<br />
dose rate <strong>in</strong> air above 1 m height was calculated from<br />
<strong>the</strong> three radionuclides ( 226 Ra, 232 Th and 40 K), which<br />
varied from 39.1 to 226.8 nGy h –1 . The <strong>in</strong>ternal and<br />
external health-hazard <strong>in</strong>dices were calculated based<br />
on <strong>the</strong> concentration <strong>of</strong> 226 Ra, 232 Th and 40 K. Strong<br />
positive correlations were observed between 235 U and<br />
226 Ra, 232 Th and 226 Ra, 40 K and 232 Th as well as 40 K and<br />
226 Ra. However, no significant correlation was observed<br />
between 238 U and 226 Ra because <strong>of</strong> radioactive disequilibrium<br />
between <strong>the</strong>m.<br />
Keywords: Dose rate, external hazard <strong>in</strong>dex, geological<br />
formations, radionuclides.<br />
THE pr<strong>in</strong>cipal orig<strong>in</strong>s <strong>of</strong> ioniz<strong>in</strong>g radiation exposure are<br />
natural sources. The spatial distribution <strong>of</strong> natural radiation<br />
is highly variable and dependent on <strong>the</strong> local geologic<br />
formations 1 . The levels <strong>of</strong> radioactivity <strong>in</strong> water and<br />
<strong>soil</strong> are important ma<strong>in</strong>ly because <strong>of</strong> two pr<strong>in</strong>cipal radiological<br />
effects. The first is <strong>the</strong> external irradiation <strong>of</strong> <strong>the</strong><br />
body by gamma rays emitted from radionuclides present<br />
*For correspondence. (e-mail: rcramola@gmail.com)<br />
906<br />
<strong>in</strong> <strong>the</strong> area, and <strong>the</strong> second is <strong>in</strong>ternal irradiation <strong>of</strong> lung<br />
by alpha-emitt<strong>in</strong>g, short-lived decay products <strong>of</strong> radon<br />
and thoron 1–3 . The average crustal abundances <strong>of</strong> uranium<br />
and thorium are 1.8 and 7.2 ppm (ref. 4). In igneous<br />
rocks, uranium concentration <strong>in</strong>creases with <strong>the</strong> degree <strong>of</strong><br />
del<strong>in</strong>eation; very low uranium concentrations occur <strong>in</strong><br />
ultrabasic rocks (0.014 ppm) and higher concentrations <strong>in</strong><br />
granites (2–15 ppm) 5,6 and pegmatites. Guthrie and<br />
Kleeman 7 studied chang<strong>in</strong>g uranium distribution <strong>in</strong> deuterically<br />
altered granite dur<strong>in</strong>g wea<strong>the</strong>r<strong>in</strong>g. Waite and<br />
Payne 8 found that oxidation and o<strong>the</strong>r types <strong>of</strong> alteration<br />
altered <strong>the</strong> primary uranium m<strong>in</strong>erals chemically, such as<br />
uran<strong>in</strong>ite produc<strong>in</strong>g uranyl silicates. Guthrie and Kleeman<br />
7 observed no net loss <strong>of</strong> uranium <strong>in</strong> moderately<br />
wea<strong>the</strong>red granites, but that pr<strong>of</strong>ound wea<strong>the</strong>r<strong>in</strong>g resulted<br />
<strong>in</strong> mobilization <strong>of</strong> uranium. Langmuir and Herman 9<br />
observed that thorium <strong>in</strong> rocks is found at similar sites as<br />
those <strong>of</strong> uranium, zircon and o<strong>the</strong>r m<strong>in</strong>erals. In metamorphic<br />
rocks, <strong>the</strong> uranium and thorium abundances and distributions<br />
are dependent on <strong>the</strong> source rock 6 . Higher<br />
uranium concentrations are also associated with deposits<br />
that conta<strong>in</strong> heavy m<strong>in</strong>erals, such as placer deposits 10 .<br />
Radium isotopes are produced by <strong>the</strong> decay <strong>of</strong> 238 U, 235 U<br />
and 232 Th. The presence <strong>of</strong> radium is not affected by<br />
long-term processes, due to its cont<strong>in</strong>uous production and<br />
relatively short half-life 11 , but <strong>the</strong> disequilibrium between<br />
238 U and 226 Ra is <strong>of</strong>ten observed as a result <strong>of</strong> different<br />
mobilities <strong>in</strong> <strong>soil</strong>, rock and aquifers.<br />
The natural radioactivity <strong>of</strong> <strong>soil</strong> samples is usually<br />
determ<strong>in</strong>ed from <strong>the</strong> 226 Ra, 232 Th and 40 K contents 12 . Due to<br />
<strong>the</strong> spatial variation <strong>in</strong> external gamma dose rate, it is essential<br />
to measure <strong>the</strong> radionuclide content <strong>in</strong> surround<strong>in</strong>g<br />
<strong>soil</strong> samples. These doses vary depend<strong>in</strong>g upon <strong>the</strong> concentrations<br />
<strong>of</strong> <strong>the</strong> natural radionuclides, 238 U, 232 Th, <strong>the</strong>ir<br />
daughter products and 40 K, present <strong>in</strong> <strong>the</strong> <strong>soil</strong>s and rocks,<br />
which <strong>in</strong> turn depend upon <strong>the</strong> local geology <strong>of</strong> each<br />
region <strong>in</strong> <strong>the</strong> world 13,14 . Nation-wide surveys have been<br />
carried out to determ<strong>in</strong>e natural radionuclides, radium<br />
equivalent activity and <strong>the</strong> result<strong>in</strong>g doses 3,15–18 .<br />
Studies <strong>in</strong> <strong>the</strong> Himalayan region have shown that <strong>the</strong><br />
tectonic processes, types <strong>of</strong> rocks and geohydrological<br />
characteristics <strong>of</strong> rock mass control <strong>the</strong> concentration <strong>of</strong><br />
radon <strong>in</strong> <strong>soil</strong> and water 19 . The aim <strong>of</strong> <strong>the</strong> present study<br />
was to f<strong>in</strong>d out <strong>the</strong> variation <strong>of</strong> radionuclides <strong>in</strong> different<br />
lithotectonic units <strong>in</strong> <strong>the</strong> eastern part <strong>of</strong> <strong>Kumaun</strong> Himalaya.<br />
The role <strong>of</strong> various rock types and associated<br />
tectonic features was also considered <strong>in</strong> <strong>the</strong> <strong>in</strong>terpretation<br />
<strong>of</strong> distribution <strong>of</strong> radionuclides. This communication also<br />
presents <strong>the</strong> argument about distribution <strong>of</strong> radionuclides<br />
and <strong>in</strong>terpretation <strong>of</strong> data and <strong>the</strong>ir relation to <strong>the</strong> <strong>in</strong>ternal<br />
and external hazard <strong>in</strong>dices <strong>in</strong> <strong>the</strong> study area for <strong>the</strong><br />
general public.<br />
The study area lies <strong>in</strong> <strong>the</strong> eastern part <strong>of</strong> <strong>Kumaun</strong><br />
Himalaya. The geology <strong>of</strong> <strong>the</strong> area has been studied <strong>in</strong><br />
detail by a number <strong>of</strong> workers 20–23 . The study area falls <strong>in</strong><br />
<strong>the</strong> subtropical Lesser Himalayan belt <strong>in</strong> <strong>the</strong> eastern part<br />
CURRENT SCIENCE, VOL. 100, NO. 6, 25 MARCH 2011
RESEARCH COMMUNICATIONS<br />
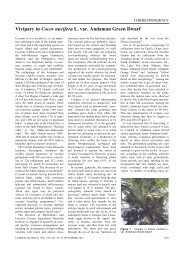
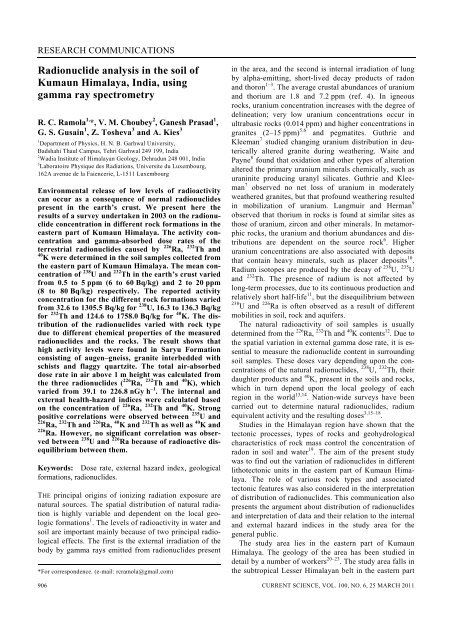
Figure 1. Geological map <strong>of</strong> <strong>the</strong> eastern part <strong>of</strong> <strong>Kumaun</strong> Himalaya show<strong>in</strong>g <strong>soil</strong> sample location.<br />
<strong>of</strong> <strong>Kumaun</strong> Himalaya. In general, <strong>the</strong> rocks are characterized<br />
by multiple deformations result<strong>in</strong>g <strong>in</strong> superimposed<br />
fold<strong>in</strong>g and repeated fault<strong>in</strong>g and thrust<strong>in</strong>g. The rocks<br />
exposed <strong>in</strong> <strong>the</strong> area, from south to north, belong to <strong>the</strong><br />
Saryu Formation <strong>of</strong> Almora Group (sericite–chlorite<br />
schist, amphibolite, mylonitized granite gneiss, augen<br />
gneiss with schist and <strong>in</strong>truded granite, garnetiferous<br />
mica schist and micaceous wea<strong>the</strong>red quartzite, and<br />
granodiorite <strong>in</strong> <strong>the</strong> Champawat area), Rautgara Formation<br />
(muddy quartzite and green–purple slates), Deoban Formation<br />
(predom<strong>in</strong>antly dolomitic limestone, slates and<br />
phyllites), Mandhali Formation (pyretic slates, argillaceous<br />
and dolomitic limestone) and Ber<strong>in</strong>ag Formation<br />
(massive white, pale, purple and green quartzite with<br />
metamorphosed basalt and tuffites). The Ber<strong>in</strong>ag Thrust<br />
separates <strong>the</strong> rocks <strong>of</strong> Ber<strong>in</strong>ag Formation from Deoban<br />
Formation, whereas rocks <strong>of</strong> <strong>the</strong> Ber<strong>in</strong>ag Formation are<br />
separated from <strong>the</strong> Saryu Formation (granites, gneisses<br />
and porphyrites) <strong>in</strong> <strong>the</strong> Askot area by <strong>the</strong> Askot Thrust. In<br />
<strong>the</strong> nor<strong>the</strong>rn part, <strong>the</strong> Deoban and Rautgara formations<br />
are separated from <strong>the</strong> Saryu Formation by <strong>the</strong> Chiplakot<br />
Thrust. The meso-to-epi grade para and orthogneisses,<br />
schist, calc-silicate, marble, granites and <strong>the</strong>ir mylonitic<br />
equivalent form <strong>the</strong> Munsiari Formation, which constitutes<br />
<strong>the</strong> root zone rocks <strong>of</strong> <strong>the</strong> far-travelled detached<br />
pieces (nappe and klippe) <strong>in</strong> <strong>the</strong> Lesser Himalaya. The<br />
Munsiari Thrust separates <strong>the</strong> rocks <strong>of</strong> <strong>the</strong> Saryu Formation<br />
from <strong>the</strong> underly<strong>in</strong>g Deoban Formation (Figure 1).<br />
The <strong>soil</strong> samples were collected from a depth <strong>of</strong> 60 cm<br />
<strong>in</strong> 1000 ml plastic beakers, keep<strong>in</strong>g <strong>in</strong> view that <strong>the</strong> top<br />
layer <strong>soil</strong> is removed by leach<strong>in</strong>g process. After collection,<br />
under laboratory conditions, organic material, pebbles,<br />
roots and vegetation were separated from <strong>the</strong> <strong>soil</strong><br />
sample and all samples were crushed <strong>in</strong> small lumps<br />
mechanically. Then <strong>the</strong> samples were fully dried <strong>in</strong> an<br />
electric furnace at 110°C, for about a day. Then dried<br />
samples were converted <strong>in</strong>to f<strong>in</strong>e powder us<strong>in</strong>g an automatic<br />
crusher, homogenized and sieved. The 150 μm<br />
mesh size fraction <strong>of</strong> <strong>the</strong> sample was used for <strong>the</strong> present<br />
study. The prepared samples were transferred to <strong>the</strong> standard<br />
500 ml Mar<strong>in</strong>elli beakers that were hermetically<br />
sealed for <strong>the</strong> uniform distribution <strong>of</strong> 220 Rn and 222 Rn<br />
daughter products <strong>in</strong> <strong>the</strong> <strong>soil</strong> samples to ignore any accumulation<br />
on <strong>the</strong> surface <strong>of</strong> <strong>the</strong> <strong>soil</strong>. The conta<strong>in</strong>ers were<br />
stored for a period <strong>of</strong> one month before gamma spectrometric<br />
<strong>analysis</strong>, so as to allow <strong>the</strong> establishment <strong>of</strong> secular<br />
equilibrium between 226 Ra, 232 Th and <strong>the</strong>ir daughter<br />
products 24–27 . Prior to measurement <strong>of</strong> <strong>the</strong> samples, <strong>the</strong><br />
environmental gamma background at <strong>the</strong> laboratory site<br />
was determ<strong>in</strong>ed with an empty cyl<strong>in</strong>drical Mar<strong>in</strong>elli<br />
CURRENT SCIENCE, VOL. 100, NO. 6, 25 MARCH 2011 907
RESEARCH COMMUNICATIONS<br />
beaker under identical conditions. The conta<strong>in</strong>ers were<br />
placed coaxially with <strong>the</strong> detector for determ<strong>in</strong>ation <strong>of</strong><br />
efficiency and <strong>the</strong> same geometry was used for <strong>the</strong><br />
sample and background measurements. It was later subtracted<br />
from <strong>the</strong> measured gamma-ray spectra <strong>of</strong> each<br />
sample.<br />
Gamma spectroscopy was used for <strong>the</strong> measurement <strong>of</strong><br />
specific activity <strong>of</strong> <strong>the</strong> <strong>soil</strong> samples, as this is a nondestructive<br />
method and provides <strong>in</strong>formation for almost<br />
all natural radionuclides <strong>of</strong> <strong>in</strong>terest due to its excellent<br />
separation capabilities. O<strong>the</strong>r advantages are that it is a<br />
less time-consum<strong>in</strong>g method compared to chemical<br />
methods and cheaper compared to <strong>the</strong> new methods like<br />
mass spectrometry.<br />
High purity germanium (HPGe) detector was used for<br />
<strong>the</strong> measurement <strong>of</strong> specific activity <strong>of</strong> <strong>the</strong> <strong>soil</strong> samples<br />
due to its excellent properties such as: (i) lower impurity<br />
concentration and (ii) greater axial uniformity <strong>of</strong> <strong>the</strong><br />
impurity concentration over several centimetres. The<br />
measurements were made with Be w<strong>in</strong>dow and p-type<br />
HPGe top detectors with specifications 45% and 43%<br />
relative efficiency and resolution <strong>of</strong> 0.67/1.8 and<br />
0.8/1.87 keV for 122 and 1332 keV peaks respectively.<br />
The detector was cooled down by liquid nitrogen, and its<br />
warm-up sensor was coupled to <strong>the</strong> high-voltage detector<br />
bias supply, which was equipped with a remote shutdown<br />
feature. The signals were processed by <strong>the</strong> ma<strong>in</strong> amplifier<br />
<strong>in</strong>corporated with an efficient pile-up rejector and a<br />
multi-channel buffer consist<strong>in</strong>g <strong>of</strong> an analogue-to-digital<br />
converter. An advanced multi-channel analyser with<br />
MAESTRO-32 s<strong>of</strong>tware enabled data acquisition, storage,<br />
display and onl<strong>in</strong>e <strong>analysis</strong> <strong>of</strong> <strong>the</strong> acquired gamma<br />
spectra. The shield<strong>in</strong>g was made <strong>of</strong> Pb, Cu and Cd, which<br />
was able to suppress <strong>the</strong> background gamma radiation<br />
present at <strong>the</strong> laboratory site. The energy calibration <strong>of</strong><br />
<strong>the</strong> detector was done with <strong>the</strong> help <strong>of</strong> <strong>the</strong> source <strong>of</strong><br />
133 Ba, 137 Cs and 60 Co. The efficiency calibration for <strong>the</strong><br />
system was carried out us<strong>in</strong>g secondary standard source<br />
<strong>of</strong> uranium ore <strong>in</strong> geometry available for sample count<strong>in</strong>g.<br />
Efficiency values were plotted aga<strong>in</strong>st energy for a<br />
particular geometry and fitted by least square method to<br />
an empirical relation that takes <strong>in</strong>to account <strong>the</strong> nature <strong>of</strong><br />
<strong>the</strong> efficiency curve for <strong>the</strong> HPGe detector. The efficiency<br />
calibration was cross-checked by <strong>the</strong> certified reference<br />
materials (IAEA-314) obta<strong>in</strong>ed from AQCS/IAEA,<br />
Austria 28 . All measurements <strong>of</strong> <strong>the</strong> samples, background<br />
and standards were done <strong>in</strong> <strong>the</strong> same sample to detector<br />
geometry for 24 h.<br />
The <strong>of</strong>fl<strong>in</strong>e <strong>analysis</strong> <strong>of</strong> each gamma ray spectrum was<br />
carried out by a dedicated s<strong>of</strong>tware program (Gamma<br />
Vision-32), which performs a simultaneous fit and multiple<br />
peak de-convolution to all <strong>the</strong> statistically significant<br />
photo-peaks appear<strong>in</strong>g <strong>in</strong> <strong>the</strong> spectrum. A menu-driven<br />
report gave <strong>in</strong>formation about centroid channel, energy,<br />
background counts, net area counts, width <strong>of</strong> identified<br />
and unidentified peaks, and <strong>in</strong>tensity and mean activity <strong>of</strong><br />
908<br />
<strong>the</strong> radionuclides present <strong>in</strong> <strong>the</strong> sample and <strong>the</strong> standard<br />
deviation. Activity concentration <strong>of</strong> 232 Th radionuclide<br />
was determ<strong>in</strong>ed from <strong>the</strong> average concentrations <strong>of</strong> shortlived<br />
daughter radionuclides 212 Pb and 228 Ac (238.6 and<br />
911.1 keV). 238 U was determ<strong>in</strong>ed from <strong>the</strong> average concentration<br />
<strong>of</strong> 214 Pb and 214 Bi (351.9 and 609.3 keV) us<strong>in</strong>g<br />
general practices 29,30 . To assess <strong>the</strong> isotopic composition<br />
<strong>of</strong> uranium <strong>in</strong> <strong>soil</strong> samples <strong>the</strong> overlapp<strong>in</strong>g gamma emissions<br />
from different nuclides have to be identified and<br />
resolved 24 . S<strong>in</strong>ce 238 U dose not emit suitable gamma rays<br />
which can be directly measured us<strong>in</strong>g gamma ray spectrometry,<br />
it is usually determ<strong>in</strong>ed through its daughter products<br />
<strong>in</strong> equilibrium. Thorium-234 has a short half-life<br />
(24.1 d) and mean life (34.7 d) and so comes <strong>in</strong>to secular<br />
equilibrium with 238 U and emits low-energy photons with<br />
low yield at <strong>the</strong> energies 63.29 keV (3.8%), 92.35 keV<br />
(2.72%) and 92.78 keV (2.69%). The multiple photopeaks<br />
from <strong>the</strong> latter two energy photons cannot be<br />
resolved easily, and so <strong>the</strong> 63.29 keV peak was used for<br />
<strong>the</strong> determ<strong>in</strong>ation <strong>of</strong> 238 U. In <strong>the</strong> present work, <strong>the</strong> 234m Pa<br />
was not used to derive 238 U activity from <strong>the</strong> <strong>soil</strong> samples<br />
because <strong>of</strong> its short half-life (6.7 h); also, it is always <strong>in</strong><br />
equilibrium with its parent 234 Th and emits 1001.03 keV<br />
photons with very low yield (0.837%) 25 . The determ<strong>in</strong>ation<br />
<strong>of</strong> 235 U was difficult because it emits several photons;<br />
<strong>the</strong> only photons that can be used for <strong>the</strong> determ<strong>in</strong>ation <strong>of</strong><br />
235 U are those at <strong>the</strong> energy <strong>of</strong> 185.72 keV. The common<br />
approach for <strong>the</strong> subtraction <strong>of</strong> <strong>the</strong> contribution <strong>of</strong> <strong>the</strong><br />
186 keV l<strong>in</strong>e from <strong>the</strong> 238 U series was used for <strong>the</strong> determ<strong>in</strong>ation<br />
<strong>of</strong> 235 U activity. 226 Ra activity can be derived<br />
<strong>in</strong>directly from <strong>the</strong> weighted average <strong>of</strong> <strong>the</strong> activities <strong>of</strong><br />
two photo-peaks <strong>of</strong> 214 Pb (295.2 and 352.0 keV) and three<br />
photo-peaks <strong>of</strong> 214 Bi (609.3, 1120.3 and 1764.5 keV), and<br />
directly from <strong>the</strong> 186.25 keV photons. These two methods<br />
agree with<strong>in</strong> <strong>the</strong> total uncerta<strong>in</strong>ty <strong>of</strong> <strong>the</strong> measurements 31 .<br />
Here <strong>the</strong> <strong>in</strong>tense gamma rays <strong>of</strong> 214 Pb and 214 Bi were used<br />
for <strong>the</strong> determ<strong>in</strong>ation <strong>of</strong> 226 Ra activity 24 . However, true<br />
measurement <strong>of</strong> 40 K and 137 Cs concentrations was made<br />
by <strong>the</strong>ir own gamma rays at 1460.8 and 661.6 keV<br />
respectively. The specific activity <strong>of</strong> ith nuclide from <strong>the</strong><br />
respective energy peak can be calculated by <strong>the</strong> follow<strong>in</strong>g<br />
formula:<br />
Ai = NE/(tγ εM), (1)<br />
where NE is <strong>the</strong> net peak area <strong>of</strong> a peak at energy Ε, ε <strong>the</strong><br />
detection efficiency at energy Ε, t <strong>the</strong> count<strong>in</strong>g live-time,<br />
γ <strong>the</strong> gamma-ray yield per dis<strong>in</strong>tegration <strong>of</strong> <strong>the</strong> specific<br />
nuclide for a transition at energy E, and M <strong>the</strong> mass (kg)<br />
<strong>of</strong> <strong>the</strong> measured sample. For more than one peak hav<strong>in</strong>g<br />
<strong>the</strong> same energy range <strong>of</strong> <strong>analysis</strong>, <strong>the</strong> peak activities<br />
were averaged and <strong>the</strong> result<strong>in</strong>g weighted average gave <strong>the</strong><br />
activity <strong>of</strong> <strong>the</strong> nuclide. The uncerta<strong>in</strong>ties arise due to a<br />
number <strong>of</strong> factors like volume <strong>of</strong> <strong>the</strong> samples, type-B-like<br />
calibration, peak area determ<strong>in</strong>ation and sample counts.<br />
The comb<strong>in</strong>ed uncerta<strong>in</strong>ties <strong>of</strong> all <strong>the</strong>se factors did not<br />
CURRENT SCIENCE, VOL. 100, NO. 6, 25 MARCH 2011
exceed 7–8% for 226 Ra and 232 Th. The comb<strong>in</strong>ed uncerta<strong>in</strong>ties<br />
for 40 K were about 20% due to <strong>the</strong> contribution <strong>of</strong><br />
228 Ac at 1459.2 keV with gamma-ray l<strong>in</strong>e <strong>of</strong> 40 K <strong>in</strong> <strong>the</strong><br />
same region. To validate this method, <strong>the</strong> certified reference<br />
samples (IAEA-312 and 313) <strong>of</strong> known activities<br />
were measured 28,32 . The HPGe detector has a th<strong>in</strong> Be<br />
w<strong>in</strong>dow which is more sensitive to <strong>the</strong> co<strong>in</strong>cidences and<br />
uncerta<strong>in</strong>ties <strong>of</strong> approximately same energy l<strong>in</strong>es. To<br />
m<strong>in</strong>imize <strong>the</strong> uncerta<strong>in</strong>ties only isolated gamma l<strong>in</strong>es<br />
were analysed and measurements were repeated at least<br />
twice for a s<strong>in</strong>gle sample. The low level detection for<br />
226 Ra, 232 Th and 40 K was calculated from <strong>the</strong> Currie 33<br />
formula to be 1.1, 1.0 and 8.2 Bq/kg respectively.<br />
Based on <strong>the</strong> measured values <strong>of</strong> 226 Ra, 232 Th and 40 K,<br />
<strong>the</strong> radium equivalent activity for all <strong>soil</strong> samples under<br />
study was calculated us<strong>in</strong>g <strong>the</strong> relation 16,34,35<br />
Raeq = ARa + 1.43ATh + 0.077AK, (2)<br />
where ARa, ATh and AK are <strong>the</strong> activity concentrations <strong>of</strong><br />
226 Ra, 232 Th and 40 K <strong>in</strong> Bq/kg respectively.<br />
Local stones and <strong>soil</strong> are used for <strong>the</strong> construction <strong>of</strong><br />
houses <strong>in</strong> <strong>the</strong> hilly areas. It is expected that <strong>the</strong> radiation<br />
dose would be delivered externally, if a build<strong>in</strong>g is constructed<br />
us<strong>in</strong>g local rocks/<strong>soil</strong>. The external hazard <strong>in</strong>dex<br />
(Hex) and <strong>in</strong>ternal hazard <strong>in</strong>dex (H<strong>in</strong>) were calculated by<br />
<strong>the</strong> follow<strong>in</strong>g equation 18,36,37 :<br />
Hex = ARa/370 + ATh/259 + AK/4810, (3)<br />
H<strong>in</strong> = ARa/185 + ATh/259 + AK/4810. (4)<br />
The outdoor air-absorbed dose rates due to terrestrial<br />
gamma rays at 1 m above <strong>the</strong> ground were calculated<br />
from 226 Ra, 232 Th and 40 K concentrations <strong>in</strong> <strong>the</strong> <strong>soil</strong><br />
assum<strong>in</strong>g that <strong>the</strong> contribution <strong>of</strong> o<strong>the</strong>r radionuclides to<br />
<strong>the</strong> environmental background was negligible 18,38,39 . The<br />
absorbed dose rates were calculated by <strong>the</strong> conversion<br />
factor 40 :<br />
D = 0.461ARa + 0.623ATh + 0.0414AK. (5)<br />
For <strong>the</strong> above calculation <strong>the</strong> decay products <strong>of</strong> 226 Ra and<br />
232 Th are considered <strong>in</strong> equilibrium. F<strong>in</strong>ally <strong>in</strong> order to<br />
calculate <strong>the</strong> annual effective dose rate due to <strong>the</strong> presence<br />
<strong>of</strong> 226 Ra, 232 Th and 40 K <strong>in</strong> <strong>soil</strong> samples, one has to<br />
take <strong>in</strong>to account <strong>the</strong> conversion coefficient from absorbed<br />
dose <strong>in</strong> air to effective dose and <strong>the</strong> <strong>in</strong>door occupancy<br />
factor 1 .<br />
Ambient dose equivalent rate (mSv y –1 ) = Dose rate <strong>in</strong><br />
(nGy h –1 ) (24 h) × 365.25d × 0.8 (<strong>in</strong>door occupancy factor)<br />
× 0.7 Sv Gy –1 (conversion coefficient) × 10 –6 .<br />
Based on <strong>the</strong> <strong>analysis</strong> <strong>in</strong> <strong>the</strong> UNSCEAR report 41 , a coefficient<br />
<strong>of</strong> 0.7 Sv Gy –1 was used to convert <strong>the</strong> absorbed<br />
dose <strong>in</strong> air to effective dose equivalent and <strong>the</strong> <strong>in</strong>door<br />
occupancy factor was assumed to be 0.8, imply<strong>in</strong>g that<br />
RESEARCH COMMUNICATIONS<br />
20% <strong>of</strong> time is spent outdoors on an average around <strong>the</strong><br />
world.<br />
The distribution <strong>of</strong> radionuclides and <strong>the</strong>ir isotopic<br />
fraction are summarized <strong>in</strong> Table 1. The sample locations<br />
are shown <strong>in</strong> Figure 1. The results <strong>of</strong> 37 <strong>soil</strong> samples collected<br />
from different lithotectonic units <strong>in</strong> <strong>the</strong> eastern part<br />
<strong>of</strong> <strong>Kumaun</strong> Himalaya are discussed here. The data were<br />
collected from five different formations <strong>of</strong> <strong>the</strong> study area.<br />
In general, <strong>soil</strong> thickness <strong>in</strong> <strong>the</strong> study area is small (0.5 m<br />
to a maximum <strong>of</strong> 2 m) because <strong>of</strong> <strong>the</strong> rugged topography<br />
and fast erosion along <strong>the</strong> slopes 15 . Therefore different<br />
horizon studies (with vary<strong>in</strong>g depths) for <strong>the</strong> radionuclides<br />
are not possible <strong>in</strong> <strong>the</strong> study area. The radionuclide<br />
concentration <strong>in</strong> <strong>the</strong> <strong>soil</strong> samples directly reflects<br />
<strong>the</strong> concentration <strong>of</strong> radionuclides <strong>in</strong> <strong>the</strong> underly<strong>in</strong>g rock<br />
at equilibrium.<br />
The discussion here has been divided <strong>in</strong>to four parts,<br />
i.e. radionuclide distribution, radium equivalent activity,<br />
hazard <strong>in</strong>dex and air-absorbed dose rate. These results<br />
show that <strong>the</strong> radionuclides are extensively affected by<br />
<strong>soil</strong>-formation processes. The activity <strong>of</strong> 40 K (124.6–<br />
1758 Bq/kg),<br />
238 U (32.6–1305.5 Bq/kg),<br />
235 U (1.2–<br />
18.2 Bq/kg), 226 Ra (2.4–186.9 Bq/kg), 232 Th (16.3–136.3<br />
Bq/kg), 230 Th (0.2–11.5 Bq/kg), 210 Pb (0.1–260.6 Bq/kg)<br />
and 137 Cs (0.4–8.2 Bq/kg) was measured (Table 2), but<br />
more emphasis will be given to discussion <strong>of</strong> <strong>the</strong> results<br />
<strong>of</strong> 226 Ra, 232 Th and 40 K. For this <strong>the</strong> data have been<br />
divided accord<strong>in</strong>g to five different rock formations for<br />
easy <strong>in</strong>terpretation <strong>of</strong> external hazard <strong>in</strong>dex and dose calculation<br />
<strong>in</strong> a small region. The mean values <strong>of</strong> 226 Ra,<br />
232 Th and 40 K <strong>in</strong> <strong>soil</strong> samples with 95% confidence level<br />
for different formations are given <strong>in</strong> Table 3. The highest<br />
levels <strong>of</strong> <strong>the</strong>se radionuclides were recorded <strong>in</strong> <strong>the</strong> Saryu<br />
Formation. The variations <strong>of</strong> radioactivity levels at different<br />
measurement locations are due to <strong>the</strong> variation <strong>of</strong><br />
concentration <strong>of</strong> <strong>the</strong>se radioactive elements <strong>in</strong> <strong>the</strong> geological<br />
formations, and micro-cracks and defects <strong>in</strong> <strong>the</strong><br />
rocks. Micro-cracks and defects provide a tunnel for <strong>the</strong><br />
upward movement <strong>of</strong> radionuclides and enhance <strong>the</strong><br />
radioactivity level. 137 Cs was recorded <strong>the</strong> highest <strong>in</strong><br />
Deoban Formation <strong>of</strong> <strong>the</strong> study area. The radioactive related<br />
m<strong>in</strong>erals such as zircon, iron oxides and fluorite<br />
play an important role <strong>in</strong> controll<strong>in</strong>g <strong>the</strong> distribution <strong>of</strong><br />
uranium and thorium. Zircon usually conta<strong>in</strong>s uranium<br />
and thorium concentration rang<strong>in</strong>g from 0.01% to 0.19%<br />
and 1% to 2% respectively 42 .<br />
The activity <strong>of</strong> 226 Ra <strong>in</strong> sedimentary rocks <strong>of</strong> Ber<strong>in</strong>ag<br />
Formation, predom<strong>in</strong>antly dom<strong>in</strong>ated by quartzite rocks,<br />
varied from 2.4 to 28.2 Bq/kg with a mean value <strong>of</strong> 15.3<br />
Bq/kg. The activity <strong>of</strong> 40 K was 155.4–429.1 Bq/kg, with a<br />
mean value <strong>of</strong> 292.3 Bq/kg. The radium equivalent activity<br />
<strong>in</strong> this formation varied from 110 to 165.2 Bq/kg,<br />
with a mean value <strong>of</strong> 137.6 Bq/kg. Only <strong>the</strong> mean value<br />
<strong>of</strong> thorium recorded was higher than that given <strong>in</strong> <strong>the</strong><br />
UNSCEAR report 1 for India. Comparatively low mean<br />
CURRENT SCIENCE, VOL. 100, NO. 6, 25 MARCH 2011 909
RESEARCH COMMUNICATIONS<br />
910<br />
Table 1. Analytical results <strong>of</strong> <strong>the</strong> activity concentration (Bq/kg ± 1 SD) <strong>of</strong> <strong>the</strong> major radionuclides <strong>in</strong> different geological formations<br />
Sample no. Formation<br />
40 K<br />
238 U<br />
235 U<br />
EK-02 Saryu 1652 ± 37.9 129.4 ± 5.4 8.3 ± 1.8 55.6 ± 2.3 96.0 ± 3.1 1.7 ± 4.2 0.1 ± 0 BDL<br />
EK-03 Saryu 1758 ± 39.7 268.5 ± 53.7 7.4 121.1 ± 4.0 131 ± 3.4 BDL 164.8 ± 73.2 BDL<br />
EK-04 Saryu 1710 ± 38.8 203.4 ± 43.5 5.5 ± 3.0 90.4 ± 1.6 102.4 ± 1.4 4.1 ± 2.5 130.3 ± 71.2 BDL<br />
EK-06 Sayru 985.6 ± 23.8 143.2 ± 29.8 NA 62.2 ± 3.8 79.8 ± 2.5 BDL 33.9 ± 11.5 0.7 ± 0.4<br />
EK-07 Sayru 124.6 ± 7.9 483.9 ± 16.1 7.2 ± 2.0 26.9 ± 1.3 55.5 ± 1.1 0.6 ± 0.1 52.8 ± 14.3 5.5 ± 0.5<br />
EK-09 Sayru 1212 ± 35.8 261.8 ± 53.6 7.7 ± 3.2 79.6 ± 4.5 135.9 ± 12.5 6.8 ± 5.8 BDL 1.5 ± 0.4<br />
EK-10 Sayru 910.4 ± 22.6 234.9 ± 8.1 8.6 147.4 ± 20.7 114.7 ± 4.4 3.0 ± 5.0 28.6 ± 11.5 0.7 ± 0.4<br />
EK-11 Sayru 743.9 ± 15.6 940.6 ± 27.7 12.1 ± 3.2 35.7 ± 1.3 62.2 ± 3.3 BDL 1.3 ± 0.2 BDL<br />
EK-12 Sayru 1470 ± 23.4 591.2 ± 26.0 13.1 ± 0.9 100.9 ± 1.8 115.2 ± 1.4 2.5 ± 0.2 1.3 ± 0.2 1.1 ± 0.6<br />
EK-13 Deoban 180.7 ± 8.7 37.7 ± 4.5 15.8 ± 1.8 76.8 ± 1.7 16.3 ± 1.9 BDL BDL 4.4 ± 0.5<br />
EK-14 Deoban 305.5 ± 10.1 39.9 ± 3.9 2.7 ± 0.6 17.5 ± 1.3 28.2 ± 2.3 BDL BDL 2.1 ± 0.4<br />
EK-15 Deoban 524.0 ± 13.7 301.3 ± 85 6.1 ± 2.6 35.2 ± 1.3 46.3 ± 1.1 BDL 11.3 ± 1.4 5.1 ± 0.4<br />
EK-16 Deoban 596.3 ± 16.2 78.5 ± 5.1 BDL 33.3 ± 2.0 38.6 ± 3.1 BDL BDL 0.8 ± 0.4<br />
EK-17 Saryu 713.4 ± 18.1 84.6 ± 4.9 BDL 35.0 ± 1.3 50.1 ± 3.1 5.2 ± 0.7 BDL 0.6 ± 0.3<br />
EK-18 Saryu 726.2 ± 19.0 34.4 ± 7.2 1.2 ± 0.5 15.8 ± 1.7 29.8 ± 6.9 BDL BDL 1.1 ± 0.3<br />
EK-19 Saryu 1330 ± 31.5 93.1 ± 20.2 BDL 36.0 ± 1.4 40.8 ± 2.2 BDL BDL BDL<br />
EK-20 Saryu 866.1 ± 16.8 1305.5 ± 29.7 14.3 ± 0.8 111.0 ± 1.5 98.0 ± 1.4 1.0 ± 0.0 1.5 ± 0.1 3.5 ± 0.5<br />
EK-21 Deoban 590.1 ± 13.3 345.2 ± 14.1 4.8 ± 0.7 29.5 ± 1.1 45.8 ± 4.3 BDL 41.0 ± 14.4 3.4 ± 0.2<br />
EK-22 Ber<strong>in</strong>ag 155.4 ± 8.1 428.1 ± 87.2 2.6 ± 0.6 2.4 ± 1.0 66.9 ± 1.1 BDL 1.4 ± 1.0 1.6 ± 0.4<br />
EK-23 Ber<strong>in</strong>ag 429.1 ± 9.8 321.7 ± 65.7 4.3 ± 0.4 28.2 ± 0.7 72.7 ± 2.4 BDL 59.0 ± 11.4 0.5 ± 0.3<br />
EK-25 Saryu 1537.0 ± 34.9 182.7 ± 38.0 11.7 ± 1.2 60.1 ± 1.6 124.1 ± 5.3 BDL BDL BDL<br />
EK-26 Saryu 802.7 ± 16.2 383.2 ± 29.7 5.6 ± 2.5 42.3 ± 1.3 65.1 ± 2.7 0.2 ± 0.0 60.5 ± 20.5 BDL<br />
EK-27 Saryu 1412.1 ± 22.5 218.5 ± 74.5 12.1 ± 2.8 102.7 ± 3.0 110.2 ± 0.8 BDL 100 ± 23.6 BDL<br />
EK-28 Saryu 809.2 ± 16.5 374.4 ± 22.1 7.8 ± 2.5 53.8 ± 1.6 73.7 ± 2.9 BDL 125.4 ± 21.3 4.8 ± 0.4<br />
EK-29 Saryu 730.1 ± 19.1 32.6 ± 6.3 BDL 55.3 ± 4.2 60.8 ± 1.1 BDL 208.7 ± 58.2 1.6 ± 0.4<br />
EK-31 Saryu 552.3 ± 13.6 228.6 ± 12.7 10.3 ± 2.5 36.0 ± 2.7 54.4 ± 3.7 BDL 71.8 ± 18.6 0.4 ± 2.6<br />
EK-34 Saryu 315.9 ± 9.6 588.0 ± 13.7 6.5 ± 0.6 29.8 ± 0.7 32.3 ± 0.9 BDL 88.9 ± 14.8 4.4 ± 0.5<br />
EK-35 Saryu 935.7 ± 23.4 65.6 ± 9.2 BDL 75.3 ± 3.7 71.0 ± 1.2 BDL 64.8 ± 11.7 8.2 ± 0.5<br />
EK-39 Mandali 671.2 ± 1.7 52.8 ± 9.5 3.6 ± 0.3 86.8 ± 3.3 86.8 ± 3.1 BDL 84.1 ± 29.4 3.5 ± 0.6<br />
EK-40 Mandali 637.9 ± 14.8 300.4 ± 107.8 6.2 ± 0.8 13.5 ± 3.9 66.5 ± 2.7 BDL 93.8 ± 16.3 5.7 ± 0.7<br />
EK-41 Munsairi 709.3 ± 16.1 807.1 ± 237.7 13.2 ± 0.8 103.6 ± 1.4 77.8 ± 1.3 3.1 ± 0.3 96.2 ± 21.2 BDL<br />
EK-42 Munsairi 953.7 ± 17.9 1070.5 ± 26.9 8.0 ± 0.8 64.7 ± 3.0 92.8 ± 4.8 BDL 151.4 ± 21.2 1.8 ± 0.5<br />
EK-43 Munsairi 916.4 ± 19.5 305.6 ± 68.8 8.9 ± 1.0 60.8 ± 1.8 72.3 ± 5.8 BDL 235.7 ± 23.3 6.4 ± 0.8<br />
EK-44 Saryu 1144.5 ± 22.9 383 ± 14.3 11.0 ± 2.0 122.6 ± 2.6 136.3 ± 4.2 5.8 ± 1.2 136.2 ± 6.1 1.2 ± 0.2<br />
EK-45 Saryu 1282.8 ± 22.0 801.8 ± 186.6 8.9 ± 2.9 78.7 ± 3.2 132.5 ± 5.5 2.8 ± 0.3 66.4 ± 25.8 BDL<br />
EK-46 Saryu 1423.5 ± 15.2 347.8 ± 27.8 15.7 ± 3.1 186.9 ± 4.7 130.4 ± 3.3 BDL 128.8 ± 16.7 2.6 ± 0.4<br />
EK-47 Saryu 1004.8 ± 17.5 181.0 ± 55.2 18.2 ± 3.9 154.0 ± 1.4 124.2 ± 2.9 11.5 ± 1.1 260.6 ± 28.8 BDL<br />
*BDL, Below detection limit.<br />
Table 2. Statistical summary <strong>of</strong> radionuclides <strong>in</strong> <strong>soil</strong> samples collected from <strong>the</strong> eastern part <strong>of</strong> <strong>Kumaun</strong> Himalaya<br />
40 K<br />
238 U<br />
235 U<br />
226 Ra<br />
232 Th<br />
230 Th<br />
210 Pb<br />
226 Ra<br />
232 Th<br />
230 Th<br />
210 Pb<br />
137 Cs<br />
Air Kerma Ambient dose<br />
rate equivalent rate<br />
137 Cs Raeq (nGyh -1 ) Hex H<strong>in</strong> (mSv y -1 )<br />
Mean 887.1 341.9 8.7 66.7 79.4 3.7 86.2 2.8 248.5 118.7 0.7 0.9 0.6<br />
Median 809.2 268.5 8.0 60.1 72.7 3.0 71.8 2.0 234.8 112.7 0.6 0.8 0.6<br />
S.D. 443.0 304.7 4.4 43.1 34.7 3.2 70.7 2.2 113.2 53.6 0.3 0.4 0.3<br />
Standard error 72.8 50.1 0.8 7.1 5.7 3.0 13.1 0.4 18.6 8.8 0.1 0.1 0.0<br />
M<strong>in</strong>imum 124.6 32.6 1.2 2.4 16.3 0.2 0.1 0.4 81.3 39.1 0.2 0.3 0.2<br />
Maximum 1758.0 1305.5 18.2 186.9 136.3 11.5 260.6 8.2 483.0 226.8 1.3 1.8 1.1<br />
No. <strong>of</strong> samples 37 37 29 37 37 13 29 26 37 37 37 37 37<br />
value <strong>of</strong> radium <strong>in</strong> this formation is due to <strong>the</strong> absence <strong>of</strong><br />
uranium-rich m<strong>in</strong>erals like apatite, zircon, etc.<br />
In <strong>the</strong> Deoban Formation radium activity was recorded<br />
to be 17.5–76.8 Bq/kg, with a mean value <strong>of</strong> 44.7 Bq/kg.<br />
40 K was recorded as 180.7 to 935.7 Bq/kg, with a mean<br />
value <strong>of</strong> 476.4 Bq/kg and 232 Th activity <strong>in</strong> this formation<br />
varied from 16.3 to 71.0 Bq/kg, with a mean value <strong>of</strong><br />
38.8 Bq/kg. The radium equivalent activity <strong>in</strong> this formation<br />
was 81.3 to 248.9 Bq/kg, with a mean value<br />
136.8 Bq/kg. The radium content <strong>in</strong> <strong>the</strong> <strong>soil</strong> samples <strong>of</strong><br />
CURRENT SCIENCE, VOL. 100, NO. 6, 25 MARCH 2011
RESEARCH COMMUNICATIONS<br />
Table 3. Statistical summary <strong>of</strong> <strong>the</strong> activity concentration <strong>of</strong> 226 Ra, 40 K and 232 Th (Bq/kg) with total radium equivalent activity (Bq/kg), (external<br />
and <strong>in</strong>ternal) hazard, total absorbed dose and effective dose rate <strong>in</strong> different geological formations <strong>in</strong> <strong>the</strong> eastern part <strong>of</strong> <strong>Kumaun</strong> Himalaya<br />
Formation<br />
40 K<br />
226 Ra<br />
Air kerma rate<br />
Ambient dose<br />
equivalent rate<br />
232 Th Raeq (nGy h –1 ) Hex H<strong>in</strong> (mSv y –1 )<br />
Saryu Formation<br />
Mean 1082.7 78.7 92.3 294.1 140.7 0.8 1.0 0.7<br />
Standard error 86.9 9.5 7.2 23.3 10.9 0.1 0.1 0.1<br />
Median 1004.8 62.2 98.0 320.1 157.2 0.9 1.1 0.8<br />
M<strong>in</strong>imum 124.6 15.8 29.8 114.3 53.7 0.3 0.4 0.3<br />
Maximum 1758.0 186.9 136.3 483.0 226.8 1.3 1.8 1.1<br />
Confidence level (95.0%) 180.3 19.7 14.9 48.2 22.7 0.1 0.2 0.1<br />
Mandhali Formation<br />
Mean 654.6 50.2 76.7 210.2 100.1 0.6 0.7 0.5<br />
Standard error 16.7 36.7 10.2 52.4 23.2 0.1 0.2 0.1<br />
Median 654.6 50.2 76.7 210.2 100.1 0.6 0.7 0.5<br />
M<strong>in</strong>imum 637.9 13.5 66.5 157.7 76.9 0.4 0.5 0.4<br />
Maximum 671.2 86.8 86.8 262.6 123.2 0.7 0.9 0.6<br />
Confidence level (95.0%) 211.6 465.7 129.0 666.4 294.6 1.8 3.1 1.4<br />
Munsiari Formation<br />
Mean 859.8 76.4 81.0 258.4 122.8 0.7 0.9 0.6<br />
Standard error 76.0 13.7 6.1 11.8 5.1 0.0 0.1 0.0<br />
Median 916.4 64.7 77.8 269.5 126.0 0.7 0.9 0.6<br />
M<strong>in</strong>imum 709.3 60.8 72.3 234.8 112.7 0.6 0.8 0.6<br />
Maximum 953.7 103.6 92.8 270.8 129.6 0.7 1.0 0.6<br />
Confidence level (95.0%) 327.1 58.8 26.4 50.8 22.1 0.1 0.3 0.1<br />
Ber<strong>in</strong>ag Formation<br />
Mean 292.3 15.3 69.8 137.6 65.3 0.4 0.4 0.3<br />
Standard error 136.9 12.9 2.9 27.6 13.2 0.1 0.1 0.1<br />
Median 292.3 15.3 69.8 137.6 65.3 0.4 0.4 0.3<br />
M<strong>in</strong>imum 155.4 2.4 66.9 110.0 52.1 0.3 0.3 0.3<br />
Maximum 429.1 28.2 72.7 165.2 78.5 0.4 0.5 0.4<br />
Confidence level (95.0%) 1738.8 163.9 36.8 350.5 167.9 0.9 1.4 0.8<br />
Deoban Formation<br />
Mean 476.4 44.7 38.8 136.8 65.0 0.4 0.5 0.3<br />
Standard Error 111.1 10.2 7.6 24.2 11.7 0.1 0.1 0.1<br />
Median 420.0 34.3 35.5 124.2 58.2 0.3 0.5 0.3<br />
M<strong>in</strong>imum 180.7 17.5 16.3 81.3 39.1 0.2 0.3 0.2<br />
Maximum 935.7 76.8 71.0 248.9 118.9 0.7 0.9 0.6<br />
Confidence level (95.0%) 285.5 26.3 19.7 62.1 29.9 0.2 0.2 0.1<br />
this formation was higher than that <strong>in</strong> <strong>the</strong> Ber<strong>in</strong>ag Formation.<br />
However, <strong>the</strong> mean thorium value was less than that<br />
<strong>in</strong> <strong>the</strong> Ber<strong>in</strong>ag Formation. The dolomitic limestone was<br />
slightly phosphatic <strong>in</strong> this region 43 . Precipitation <strong>of</strong> uranium<br />
takes place with phosphate; thus uranium and<br />
radium concentrations are always higher compared to<br />
o<strong>the</strong>r sedimentary rocks 2,44 .<br />
The Mandhali Formation <strong>of</strong> <strong>the</strong> same geological subgroup<br />
had radium activity rang<strong>in</strong>g from 13.5 to 86.8 Bq/kg,<br />
with a mean value <strong>of</strong> 50.2 Bq/kg. 40 K was 637.9–671.2<br />
Bq/kg, with a mean value <strong>of</strong> 654.6 Bq/kg. 232 Th activity<br />
was 66.5–86.8 Bq/kg, with a mean value <strong>of</strong> 76.7 Bq/kg.<br />
The radium equivalent activity <strong>in</strong> this formation varied<br />
from 157.7 to 262.6 Bq/kg, with a mean value <strong>of</strong> 210.2<br />
Bq/kg. The rocks <strong>of</strong> <strong>the</strong> Mandhali Formation have f<strong>in</strong>e<br />
gra<strong>in</strong> size, which <strong>of</strong>fers high resistivity, i.e. it creates a<br />
compact structure <strong>of</strong> <strong>the</strong> upper layer <strong>of</strong> <strong>the</strong> <strong>soil</strong> and lack<br />
<strong>of</strong> channels accumulates <strong>the</strong> radionuclides <strong>in</strong>side. The<br />
low movement and accumulation <strong>of</strong> radionuclides <strong>in</strong> this<br />
Formation, gives a high mean value <strong>of</strong> 226 Ra, 232 Th and<br />
40 K.<br />
The Saryu Formation <strong>of</strong> Almora Group has high radionuclide<br />
content. 226 Ra activity <strong>in</strong> this formation varied<br />
from 15.8 to 186.9 Bq/kg, with a mean value <strong>of</strong><br />
78.7 Bq/kg, 40 K activity was 124.6–1758.0 Bq/kg, with a<br />
mean value <strong>of</strong> 1082.7 Bq/kg and 232 Th activity was 29.8–<br />
136.3 Bq/kg, with a mean value <strong>of</strong> 92.3 Bq/kg. The<br />
radium equivalent activity <strong>in</strong> this formation was 114.3–<br />
483.0 Bq/kg, with a mean value <strong>of</strong> 294.1 Bq/kg. The<br />
presence <strong>of</strong> high uranium <strong>in</strong> m<strong>in</strong>eralized granite and<br />
CURRENT SCIENCE, VOL. 100, NO. 6, 25 MARCH 2011 911
RESEARCH COMMUNICATIONS<br />
pegmatite are attributed to <strong>the</strong> ability <strong>of</strong> iron oxide to<br />
adsorb uranium from circulat<strong>in</strong>g solution or to <strong>the</strong> prevalence<br />
<strong>of</strong> oxidation conditions that cause <strong>the</strong> precipitation<br />
<strong>of</strong> U + ion 18 . The high uranium content <strong>in</strong> fluorite may be<br />
attributed to fluor<strong>in</strong>e ions, which forms a complex with<br />
uranium. These values are smaller than <strong>the</strong> radionuclide<br />
concentration <strong>in</strong> Wadi karim area <strong>of</strong> <strong>the</strong> eastern desert <strong>in</strong><br />
Egypt and rocks comprise <strong>of</strong> post-tectonic granite and<br />
bosttonite dykes 18 . The high radioactivity level <strong>in</strong> granite<br />
rocks, associated with pegmatites, is attributed to <strong>the</strong><br />
presence <strong>of</strong> <strong>the</strong> radioactive m<strong>in</strong>erals like thorianite,<br />
uranophane and allanite 45,46 . The meso-to-epi grade para<br />
and orthogneisses, schist, calc silicate, marble, granites<br />
and <strong>the</strong>ir mylonitic equivalent form<strong>in</strong>g <strong>the</strong> Munsiari Formation,<br />
constitute <strong>the</strong> root-zone rocks <strong>of</strong> <strong>the</strong> far-travelled<br />
detached thrust sheets (nappe and klippe) <strong>in</strong> <strong>the</strong> Lesser<br />
Himalaya.<br />
The 226 Ra activity concentration <strong>in</strong> Munsiari Formation<br />
varied from 60.8 to 103.6 Bq/kg, with a mean value <strong>of</strong><br />
76.4 Bq/kg, 40 K was from 709.3 to 953.7 Bq/kg, with a<br />
mean value <strong>of</strong> 859.8 Bq/kg and 232 Th activity was 72.3 to<br />
92.8 Bq/kg, with a mean value <strong>of</strong> 81.0 Bq/kg. The radium<br />
equivalent activity <strong>in</strong> this formation was 234.8 to<br />
270.8 Bq/kg, with a mean value <strong>of</strong> 258.4 Bq/kg. This is<br />
less than 370 Bq/kg, which is acceptable for safe use <strong>of</strong><br />
<strong>the</strong> rocks and <strong>soil</strong> for construction purpose 12 .<br />
The distribution <strong>of</strong> o<strong>the</strong>r radionuclides like 137 Cs and<br />
210 Pb is not directly related with <strong>the</strong> measurement <strong>of</strong> <strong>the</strong><br />
air kerma dose rate and ambient dose equivalent, but<br />
137 Cs is considered to be <strong>the</strong> most important isotope from<br />
<strong>the</strong> po<strong>in</strong>t <strong>of</strong> view <strong>of</strong> <strong>the</strong> external gamma dose. The concentration<br />
<strong>of</strong> 210 Pb was found to be consistently higher<br />
than that <strong>of</strong> 137 Cs at all sampl<strong>in</strong>g sites (locations). 137 Cs<br />
content varied between 0.4 and 8.2 Bq/kg, with a mean<br />
value <strong>of</strong> 2.8 Bq/kg <strong>in</strong> <strong>the</strong> study area. The highest and<br />
lowest 137 Cs content was attributed to <strong>the</strong> same formation,<br />
which shows that <strong>the</strong> different geological formations<br />
are not responsible for 137 Cs variation. 210 Pb activity <strong>in</strong><br />
<strong>the</strong> <strong>soil</strong> also affects 210 Po <strong>in</strong> <strong>the</strong> dwell<strong>in</strong>gs, which is used<br />
for <strong>the</strong> retrospective assessment <strong>of</strong> radon <strong>in</strong>doors. The results<br />
<strong>of</strong> 210 Pb may be used as a reference for any retrospective<br />
study <strong>in</strong> <strong>the</strong> near future <strong>in</strong> <strong>the</strong> area. The 210 Pb<br />
activity varied between 0.1 and 260.3 Bq/kg, with a mean<br />
value <strong>of</strong> 86.2 Bq/kg. The lowest and highest values were<br />
recorded <strong>in</strong> <strong>the</strong> Saryu Formation <strong>of</strong> <strong>the</strong> study area, but at<br />
different locations.<br />
Some <strong>in</strong>terest<strong>in</strong>g trends <strong>in</strong> <strong>the</strong> 226 Ra/ 238 U concentration<br />
were recorded with respect to different geological formations.<br />
The ratio decreased slightly as we moved from<br />
Ber<strong>in</strong>ag to Deoban and Saryu formations. The same decl<strong>in</strong><strong>in</strong>g<br />
trend was also observed for <strong>the</strong> 235 U/ 238 U ratio,<br />
whereas <strong>the</strong> 238 U/ 232 Th ratio did not show any def<strong>in</strong>ite<br />
pattern. The results from ratio <strong>analysis</strong> will be helpful to<br />
expla<strong>in</strong> equilibrium conditions at different locations.<br />
Extreme disequilibrium among 238 U : 230 Th : 226 Ra (#EK20;<br />
Table 1) <strong>in</strong> Champawat region is due to <strong>the</strong> granitic rocks<br />
912<br />
<strong>of</strong> <strong>the</strong> concordant Champawat body, which are magmatic<br />
<strong>in</strong> orig<strong>in</strong> as <strong>in</strong>dicated by complexly tw<strong>in</strong>ed and zoned<br />
plagioclases 47 . The rocks <strong>of</strong> this region are comagmatic<br />
(<strong>the</strong> <strong>in</strong>dividual types reflect<strong>in</strong>g varied physical conditions<br />
<strong>of</strong> emplacement), and are bound to systematic progressive<br />
changes <strong>in</strong> <strong>the</strong> proportion <strong>of</strong> N2O, K2O, CaO, Fe2O7,<br />
FeO (ref. 21). These complex chemical reactions may<br />
have resulted <strong>in</strong> <strong>the</strong> disequilibrium <strong>of</strong> <strong>the</strong> radionuclides.<br />
The average values distributed over <strong>the</strong> study area were<br />
computed for correlation coefficient between radionuclides<br />
(Table 4). Strong correlation was observed between<br />
40 K and 226 Ra (0.6), 40 K and 232 Th (0.7), 235 U and<br />
226 Ra (0.8) as well as 226 Ra and 232 Th (0.7). A weak negative<br />
correlation was observed between 40 K and 230 Th<br />
(–0.2), 238 U and 230 Th (–0.3), 226 Ra and 230 Th (–0.4) as<br />
well as 232 Th and 230 Th (–0.5). The negative correlation<br />
shows that <strong>the</strong> radionuclide concentrations are associated<br />
with different chemical and geological properties <strong>of</strong> <strong>the</strong><br />
elements. The different contents <strong>of</strong> clay and sand <strong>in</strong> <strong>soil</strong><br />
samples also contribute to <strong>the</strong> correlation coefficient,<br />
with micro-cracks, fractures and mobility characteristic<br />
<strong>of</strong> <strong>the</strong> radionuclides <strong>in</strong> geological medium. Uranium<br />
chemistry changes with reduc<strong>in</strong>g and oxidiz<strong>in</strong>g environment,<br />
but radium chemistry is relatively simple as it<br />
behaves like <strong>the</strong> o<strong>the</strong>r alkal<strong>in</strong>e earth metals 48 .<br />
The air-absorbed dose rate at a height <strong>of</strong> 1 m above <strong>the</strong><br />
ground level and o<strong>the</strong>r radiological effects were calculated<br />
when <strong>the</strong> <strong>soil</strong> samples were used as construction<br />
material on a local scale. These results are also important<br />
for <strong>the</strong> purpose <strong>of</strong> environmental protection studies, s<strong>in</strong>ce<br />
<strong>the</strong> local <strong>soil</strong> <strong>in</strong> <strong>the</strong> hilly areas is used for different purposes<br />
<strong>in</strong> <strong>the</strong> mud houses, ma<strong>in</strong>ly for floor<strong>in</strong>g and labell<strong>in</strong>g<br />
<strong>the</strong> walls. The build<strong>in</strong>g materials act as a source <strong>of</strong><br />
radiation and also shield aga<strong>in</strong>st outdoor radiation 40 .<br />
Massive houses were made us<strong>in</strong>g stone, <strong>soil</strong> and wood <strong>in</strong><br />
<strong>the</strong> hilly areas. The fraction <strong>of</strong> radiation emitted by <strong>the</strong><br />
<strong>soil</strong> will contribute to <strong>the</strong> total radiation level <strong>in</strong>doors,<br />
and <strong>the</strong> radiation emitted by sources outdoor is efficiently<br />
absorbed by <strong>the</strong> wall. Consequently, <strong>the</strong> dose rate <strong>in</strong>doors<br />
will be more accord<strong>in</strong>g to <strong>the</strong> radionuclide content <strong>in</strong> <strong>the</strong><br />
<strong>soil</strong> used for <strong>the</strong> construction. The fluxes <strong>of</strong> <strong>the</strong> ioniz<strong>in</strong>g<br />
radiation <strong>in</strong> <strong>the</strong> <strong>in</strong>door air will <strong>in</strong>crease as a consequence<br />
<strong>of</strong> <strong>the</strong> <strong>soil</strong> hav<strong>in</strong>g more radionuclides. The average calculated<br />
absorbed dose rate varied from 39.1 to 226.8 nGy h –1 ,<br />
with a mean value <strong>of</strong> 118.7 nGy h –1 . The average absorbed<br />
dose rate <strong>in</strong> air was reported as 56 nGyh –1 by<br />
UNSCEAR 1 for India. The recorded value <strong>in</strong> study area is<br />
nearly twice <strong>the</strong> Indian average and thus a detail study <strong>in</strong><br />
necessary and important for health hazard effects to <strong>the</strong><br />
people liv<strong>in</strong>g <strong>the</strong>re. The ultimate use <strong>of</strong> <strong>the</strong> activity<br />
measured <strong>in</strong> <strong>the</strong> <strong>soil</strong> samples is to measure <strong>the</strong> radiation<br />
dose delivered externally <strong>in</strong> <strong>the</strong> form <strong>of</strong> gamma dose. The<br />
external hazard <strong>in</strong>dexes (Hex) were calculated from 0.2 to<br />
1.3, with a mean value <strong>of</strong> <strong>the</strong> 0.7; <strong>the</strong> calculated average<br />
values are less than <strong>the</strong> acceptable value (1.5). These<br />
radionuclides are a source <strong>of</strong> radon ( 222 Rn) and its<br />
CURRENT SCIENCE, VOL. 100, NO. 6, 25 MARCH 2011
40 K<br />
Table 4. Correlation coefficient between different radionuclides<br />
238 U<br />
235 U<br />
226 Ra<br />
RESEARCH COMMUNICATIONS<br />
CURRENT SCIENCE, VOL. 100, NO. 6, 25 MARCH 2011 913<br />
232 Th<br />
230 Th<br />
40 K 1<br />
238 U 0.0 1<br />
235 U 0.3 0.3 1<br />
226 Ra 0.6* 0.1 0.8* 1<br />
232 Th 0.7* 0.2 0.4 0.7* 1<br />
230 Th –0.2 –0.3 0.5* –0.4 –0.5 1<br />
210 Pb 0.2 –0.3 0.3 0.3 0.3 0.9* 1<br />
137 Cs –0.2 0.1 0.1 –0.1 –0.2 –0.4 0.2 1<br />
*Shows significant correlation coefficient (P = 0.95).<br />
radioactive progeny. The <strong>in</strong>ternal exposure by radon and<br />
its progeny is controlled by <strong>the</strong> <strong>in</strong>ternal hazard <strong>in</strong>dex H<strong>in</strong>.<br />
H<strong>in</strong> less than 1 is suggested for materials used for house<br />
construction. H<strong>in</strong> <strong>of</strong> 1.8 was calculated for <strong>the</strong> <strong>soil</strong> collected<br />
from igneous rocks <strong>of</strong> <strong>the</strong> Saryu Formation. The<br />
observed higher value <strong>of</strong> <strong>the</strong> <strong>in</strong>ternal hazard <strong>in</strong>dex <strong>in</strong> <strong>the</strong><br />
Saryu Formation was due to <strong>the</strong> presence <strong>of</strong> radioactive<br />
m<strong>in</strong>erals <strong>in</strong> <strong>the</strong> rocks <strong>of</strong> this formation. The annual effective<br />
dose rate <strong>of</strong> <strong>the</strong> study area varied from 0.2 to<br />
1.1 mSv y –1 , with a mean value <strong>of</strong> 0.6 mSv y –1 . Accord<strong>in</strong>g<br />
to <strong>the</strong> recent regulation issued by <strong>the</strong> European Union<br />
<strong>in</strong> 1999 (ref. 49), build<strong>in</strong>g materials should be exempted<br />
from all construction purposes if <strong>the</strong> excessive gamma<br />
radiation due to <strong>the</strong>m causes an <strong>in</strong>crease <strong>in</strong> <strong>the</strong> annual<br />
effective dose received by an <strong>in</strong>dividual by a maximum<br />
value <strong>of</strong> 0.3 mSv.<br />
High occurrences <strong>of</strong> radionuclides are associated with<br />
mylonitized granite gneiss, augen gneiss, garnetiferous<br />
mica schist and micaceous wea<strong>the</strong>red quartzite, and tectonically<br />
emplaced bodies <strong>of</strong> granite and granodiorite <strong>of</strong><br />
Saryu and Munsiari formations. Presence <strong>of</strong> uranium<br />
m<strong>in</strong>eralization <strong>in</strong> <strong>the</strong> shear zone associated with different<br />
thrusts and faults may be responsible for high radioactivity<br />
<strong>in</strong> <strong>the</strong> study area. The diverse lithology and associated<br />
complex tectonic features also contribute to<br />
radioactivity <strong>in</strong> <strong>the</strong> environment. The observed results<br />
show some strong disequilibrium conditions <strong>in</strong> <strong>the</strong> study<br />
area with respect to <strong>the</strong> oxidiz<strong>in</strong>g and reduc<strong>in</strong>g environment.<br />
Based on this study on radium equivalent activity,<br />
absorbed dose rate, external and <strong>in</strong>ternal hazard <strong>in</strong>dices<br />
and annual effective dose rate, it is recommended that radiometric<br />
survey is necessary before choos<strong>in</strong>g raw materials<br />
for construction purposes and location <strong>of</strong> houses <strong>in</strong><br />
<strong>the</strong> Himalayan region. Use <strong>of</strong> <strong>soil</strong> and rocks from <strong>the</strong>se<br />
locations needs careful regulation to reduce <strong>the</strong> radiation<br />
levels <strong>in</strong>to <strong>the</strong> surround<strong>in</strong>gs. These results will also provide<br />
<strong>the</strong> basel<strong>in</strong>e data for <strong>the</strong> future with respect to geophysical<br />
and geomorphologic changes <strong>in</strong> <strong>the</strong> study area.<br />
1. UNSCEAR, Sources and effects <strong>of</strong> ioniz<strong>in</strong>g radiation (without<br />
scientific annexes), United Nations Scientific Committee on <strong>the</strong><br />
Effect <strong>of</strong> Atomic Radiation, 2000, p. 6.<br />
210 Pb<br />
137 Cs<br />
2. ICRP, Annals <strong>of</strong> ICRP 23, Protection Aga<strong>in</strong>st 222 Rn at Home and<br />
at Work, Pergamon Press, Oxford, International Commission for<br />
Radiation Protection, Publication No. 60, 1993.<br />
3. Ramola, R. C., Choubey, V. M., Prasad, Y., Prasad, G. and Bartarya,<br />
S. K., Variation <strong>in</strong> radon concentration and terrestrial<br />
gamma radiation dose rate <strong>in</strong> relation to <strong>the</strong> lithology <strong>in</strong> sou<strong>the</strong>rn<br />
part <strong>of</strong> <strong>Kumaun</strong> Himalaya, India. Radiat. Meas., 2006, 41, 714–<br />
720.<br />
4. Mason, B. and Moore, C. B., Pr<strong>in</strong>ciple <strong>of</strong> Geochemistry, John<br />
Wiley, New York, 1982, 4th edn, p. 344.<br />
5. Rogers, J. J. W. and Adams, J. A. S., Uranium. In Handbook <strong>of</strong><br />
Geochemistry, (ed. Wedepohl, K. H.), Spr<strong>in</strong>ger-Verlag, Heidelberg,<br />
1969, p. 92.<br />
6. Edsfeldt, C., The radium distribution <strong>in</strong> some Swedish <strong>soil</strong>s and its<br />
effects on radon emanation. Ph D <strong>the</strong>sis submitted to Division <strong>of</strong><br />
Eng<strong>in</strong>eer<strong>in</strong>g Geology, Royal Institute <strong>of</strong> Technology Stockholm,<br />
2001, pp. 1–52.<br />
7. Guthrie, V. A. and Kleeman, J. D., Chang<strong>in</strong>g uranium distributions<br />
dur<strong>in</strong>g wea<strong>the</strong>r<strong>in</strong>g <strong>of</strong> granite. Chem. Geol., 1986, 54, 113–<br />
126.<br />
8. Waite, T. D. and Payne, T. E., Uranium transport <strong>in</strong> <strong>the</strong> subsurface<br />
environment, Koongarra, a case study. In Metals <strong>in</strong> Groundwater<br />
(eds Allen Herbert, E. et al.), Chelsea, 1993, pp. 349–410.<br />
9. Langmuir, D. and Herman, J. S., The mobility <strong>of</strong> thorium <strong>in</strong> natural<br />
waters at low temperatures. Geochim. Cosmoschim. Acta,<br />
1980, 44, 1753–1766.<br />
10. Gundersen, L. C. S., Schumann, R. R., Otton, J. K., Dubiel, R. F.,<br />
Owen, D. E. and Dick<strong>in</strong>son, K. A., Geology <strong>of</strong> radon <strong>in</strong> United<br />
States. In Geologic Controls on Radon Special Paper 271 (eds<br />
Gates, A., Alexander, E. and Gunderson, L. C. S.), Geological<br />
Society <strong>of</strong> America, 1982, pp. 1–16.<br />
11. Mol<strong>in</strong>ari, J. and Snodgrass, W. J., The chemistry and radiochemistry<br />
<strong>of</strong> radium and o<strong>the</strong>r elements <strong>of</strong> <strong>the</strong> uranium and thorium<br />
natural decay series. In The Environmental Behaviour <strong>of</strong><br />
Radium, IAEA Technical Reports Series No. 310, International<br />
Atomic Energy Agency, Vienna, 1990, vol. 1, pp. 11–56.<br />
12. OECD, Exposure to radiation from <strong>the</strong> natural radioactivity <strong>in</strong><br />
build<strong>in</strong>g materials. Nuclear Energy Agency, Organization for<br />
Economic Cooperation Development, Paris, France, 1979.<br />
13. Radhakrishna, A. P., Somashekarappa, H. M., Narayana, Y. and<br />
Siddappa, K., A new natural background radiation area on <strong>the</strong><br />
southwest coast <strong>of</strong> India. Health Phys., 1993, 65, 390–395.<br />
14. Qu<strong>in</strong>dos, L. S., Fernandez, P. I., Soto, J., Rodenas, C. and Gomez,<br />
J., Natural radioactivity <strong>in</strong> Spanish <strong>soil</strong>s. Health Phys., 1994, 66,<br />
194–200.<br />
15. Choubey, V. M., Bisht, K. S., Sa<strong>in</strong>i, N. K. and Ramola, R. C., Relation<br />
between <strong>soil</strong> gas radon variation and different lithotectonic<br />
units <strong>of</strong> Garhwal Himalaya, India. Appl. Radiat. Isot., 1999, 51,<br />
587–592.<br />
16. S<strong>in</strong>gh, S., Rani, A. and Mahajan, R. K., 226 Ra, 232 Th and 40 K <strong>analysis</strong><br />
<strong>in</strong> <strong>soil</strong> samples from some areas <strong>of</strong> Punjab and Himachal
RESEARCH COMMUNICATIONS<br />
Pradesh, India us<strong>in</strong>g gamma ray spectrometry. Radiat. Meas.,<br />
2005, 39, 431–439.<br />
17. Mireles, F., Davila, J. I., Quir<strong>in</strong>o, L. L., Lugo, J. F., P<strong>in</strong>edo, J. L.<br />
and Rios, C., Natural <strong>soil</strong> gamma radioactivity levels and resultant<br />
population dose <strong>in</strong> <strong>the</strong> cities <strong>of</strong> Zacatecas and Guadalupe, Zacatecas,<br />
Mexico. Health Phys., 2003, 84, 368–372.<br />
18. El-Arabi, A. M., 226 Ra, 232 Th and 40 K concentrations <strong>in</strong> igneous<br />
rocks from eastern desert, Egypt and its radiological implication.<br />
Radiat. Meas., 2007, 42, 94–100.<br />
19. Choubey, V. M., Radon measurements <strong>in</strong> <strong>soil</strong> and water and its relation<br />
with geology, Garhwal Himalaya. In Proceed<strong>in</strong>g Volume <strong>of</strong><br />
7th Tohwa International symposium ‘Radon and Thoron <strong>in</strong> <strong>the</strong><br />
Human Environment (eds Katase, A. and Shimo, M.), Fukuoka,<br />
Japan October 1997, World Scientific, 1998, pp. 193–198.<br />
20. Ra<strong>in</strong>a, B. N. and Dungrakoti, B. D., Geology <strong>of</strong> <strong>the</strong> area between<br />
Na<strong>in</strong>ital and Champawat, <strong>Kumaun</strong> Himalaya, Uttar Pradesh.<br />
Himalayan Geol., 1975, 5, 1–27.<br />
21. Valdiya, K. S., Geology <strong>of</strong> <strong>Kumaun</strong> Lesser Himalaya, WIHG<br />
Publication, Dehra Dun, 1980, p. 291.<br />
22. Valdiya, K. S., Neotectonic activity <strong>in</strong> <strong>the</strong> Himalayan belt. In Proceed<strong>in</strong>gs<br />
International Symposium on Neotectonics <strong>in</strong> South Asia.<br />
Survey <strong>of</strong> India, Dehra Dun, 1986, pp. 248–267.<br />
23. Bartarya, S. K. and Valdiya, K. S., Landslides and erosion <strong>in</strong> <strong>the</strong><br />
catchment <strong>of</strong> <strong>the</strong> Gaula River, <strong>Kumaun</strong> Lesser Himalaya, India.<br />
Mt. Res. Dev., 1989, 9(4), 405–419.<br />
24. Papachristodoulou, C. A., Assimakopoulos, P. A., Patronis, N. E.<br />
and Ioannides, K. G., Use <strong>of</strong> HPGe gamma ray spectrometry to<br />
assess <strong>the</strong> isotopic composition <strong>of</strong> uranium <strong>in</strong> <strong>soil</strong>s. J. Environ.<br />
Radioact., 2003, 64, 195–203.<br />
25. Karangelos, D. J., Anagnostakis, M. J., H<strong>in</strong>is, E. P., Simopoulous,<br />
S. E. and Zunic, Z. S., Determ<strong>in</strong>ation <strong>of</strong> depleted uranium <strong>in</strong> environmetal<br />
samples by gamma-spectroscopic techniques. J. Environ.<br />
Radioact., 2004, 76, 295–310.<br />
26. Tzortzis, M. and Tsertos, H., Determ<strong>in</strong>ation <strong>of</strong> thorium, uranium<br />
and potassium elemental concentrations <strong>in</strong> surface <strong>soil</strong>s <strong>in</strong> Cyprus.<br />
J. Environ. Radioact., 2004, 77, 325–338.<br />
27. Shanbhag, A. A., Sartandel, S. J., Ramachandran, T. V. and<br />
Puranik, V. D, Natural radioactivity concentrations <strong>in</strong> beach sands<br />
<strong>of</strong> Ratnagiri coast, Maharastra. J. Assoc. Environ. Geochem.,<br />
2005, 8, 304–308.<br />
28. Strachnov, V.,Valkovic, V., Zeisler, R. and Dekner, R., Report on<br />
<strong>the</strong> <strong>in</strong>tercomparison run IAEA-314: 226 Ra, Th and U <strong>in</strong> stream<br />
sediment. AQCS/IAEA, Vienna, Austria, 1991.<br />
29. Hamby, D. M. And Tynybekov, A. K., Uranium, thorium and<br />
potassium <strong>in</strong> <strong>soil</strong>s along <strong>the</strong> shore <strong>of</strong> lake Issyk-Kyol <strong>in</strong> <strong>the</strong> Kyrghyz<br />
Republic. Environ. Monit. Assess., 2002, 73, 101–108.<br />
30. Degerlier, M., Karahan, G. and Ozger, G., Radioactivity concentrations<br />
and dose assessment for <strong>soil</strong> samples around Adana, Turkey.<br />
J. Environ. Radioact., 2008, 99, 1018–1025.<br />
31. Petropoulos, N. P., Anagnostakis, M. J. and Simopoulos, S. E.,<br />
Photon attenuation, natural radioactivity content and radon exhalation<br />
rate <strong>of</strong> build<strong>in</strong>g materials. J. Environ. Radioact., 2001, 61,<br />
257–269.<br />
32. Strachnov, V., Valkovic, V., Zeisler, R. and Dekner, R., Report on<br />
<strong>the</strong> <strong>in</strong>tercomparison run IAEA-312: 226 Ra, Th and U <strong>in</strong> <strong>soil</strong>.<br />
AQCS/IAEA, Vienna, Austria, 1991.<br />
33. Currie, L.A., Limits for qualitative detection and quantitative<br />
determ<strong>in</strong>ation. Ann. Chem., 1968, 40, 586–593.<br />
34. Yu, K. N., Guan, Z. J., Stoks, M. J. and Young, E. C., The<br />
assessment <strong>of</strong> natural radiation dose committed to <strong>the</strong> Hong Kong<br />
people. J. Environ. Radioact., 1992, 17, 31.<br />
35. Tufail, M., Ahmad, N., Mirza, S. M., Mirza, N. M. and Khan, H.<br />
A., Natural radioactivity from <strong>the</strong> build<strong>in</strong>g materials used <strong>in</strong><br />
Islamabad and Rawalp<strong>in</strong>di, Pakistan. Sci. Total Environ., 1992,<br />
121, 283–291.<br />
36. Qu<strong>in</strong>dos, L. S., Fernandez, P. L. and Soto, J., Build<strong>in</strong>g materials<br />
as source <strong>of</strong> exposure <strong>in</strong> houses. In Indoor Air 87 (eds Seifert, B.<br />
914<br />
and Esdorn, H., Institute <strong>of</strong> Water, Soil and Air Hygiene, Berl<strong>in</strong>,<br />
1987, vol. 2, p. 365.<br />
37. Cottens, E., Actions aga<strong>in</strong>st radon at <strong>the</strong> <strong>in</strong>ternational level. In<br />
Proceed<strong>in</strong>gs, Symposium on SRBII, Journee Radon, Royal Society<br />
<strong>of</strong> Eng<strong>in</strong>eers and Indistrials <strong>of</strong> Belgium, Brussels, 17 January<br />
1990.<br />
38. Jacob, P., Paretzke, H. G., Rosenbaum, H. and Zankl, M., Effective<br />
dose equivalents for photon exposure from plane sources on<br />
<strong>the</strong> ground. Radiat. Prot. Dosim., 1986, 14, 299–310.<br />
39. Leung, K. C., Lau, S. Y. and Poon, C. B., Gamma radiation dose<br />
from radionuclides <strong>in</strong> Hong Kong <strong>soil</strong>. J. Environ. Radioact.,<br />
1990, 11, 279–290.<br />
40. UNSCEAR, Exposure from natural sources <strong>of</strong> radiation. United<br />
Nations, United Nations Scientific Committee on <strong>the</strong> Effects <strong>of</strong><br />
Atomic Radiation, New York, 1993.<br />
41. UNSCEAR, Sources and biological effects. United Nations Scientific<br />
Committee on <strong>the</strong> Effects <strong>of</strong> Atomic Radiation, Report to <strong>the</strong><br />
General Assembly with Annexes, United Nations Sales Publication<br />
E.82.IX.8, New York, 1982.<br />
42. Cuney, M., LeFort, P. and Wangeg, Z., Geology <strong>of</strong> Granites and<br />
<strong>the</strong>ir Metallogenetic Relations, <strong>Science</strong> Press, Moscow, 1987,<br />
pp. 852–873.<br />
43. Valdiya, K. S., A new phosphatic horizon <strong>in</strong> <strong>the</strong> late Precambrian<br />
Calc Zone <strong>of</strong> Pithoragarh, <strong>Kumaun</strong> Himalaya. Curr. Sci., 1969,<br />
38, 415–416.<br />
44. Akerblom G. and Wilson C., Radon gas – a radiation hazard from<br />
radioactive bedrock and build<strong>in</strong>g materials. Bull. Int. Assoc. Eng.<br />
Geol., 1982, 23, 51–61.<br />
45. Omran, A., Petrochemical studies and potentiality <strong>of</strong> uranium–<br />
thorium occurrences <strong>in</strong> Gabal Um Taghir El-Tahtani area with<br />
emphasis on <strong>the</strong> granitic rocks, central Eastern Desert, Egypt.<br />
Ph D <strong>the</strong>sis Geological, A<strong>in</strong> Shams University, 2005.<br />
46. Anjos, R. et al., Natural radionuclide distribution <strong>in</strong> Brazalian<br />
commericial granites. Radiat. Meas., 2005, 39, 245–253.<br />
47. Valdiya, K. S., A study <strong>of</strong> Champawat Granodiorite and associated<br />
metamorphics <strong>of</strong> <strong>the</strong> Lohaghat subdivision, District Almora,<br />
with special reference to petrography and petrogenesis. Indian<br />
M<strong>in</strong>eral., 1962, 3, 6–37.<br />
48. Edsfeldt, C. and Fernlund, J., Difference <strong>in</strong> radium and uranium<br />
distribution <strong>in</strong> quaternary deposits, Proc. <strong>of</strong> <strong>the</strong> Int. Radon Symposium,<br />
Wiscons<strong>in</strong>, USA, 22–25 October 2000, pp. 2.0–2.10.<br />
49. EC, European Commission report on radiological protection pr<strong>in</strong>ciples<br />
concern<strong>in</strong>g <strong>the</strong> natural radioactivity <strong>of</strong> build<strong>in</strong>g materials.<br />
Radiation Protection Publication No. 112, 1999.<br />
ACKNOWLEDGEMENTS. We thank <strong>the</strong> Board <strong>of</strong> Research <strong>in</strong><br />
Nuclear <strong>Science</strong>s, Department <strong>of</strong> Atomic Energy, Government <strong>of</strong> India<br />
for provid<strong>in</strong>g f<strong>in</strong>ancial support <strong>in</strong> <strong>the</strong> form <strong>of</strong> a project. We also thank<br />
<strong>the</strong> Director, Wadia Institute <strong>of</strong> Himalayan Geology, Dehradun, for<br />
provid<strong>in</strong>g facilities to carry out this work. V.M.C. thanks FNR, Luxembourg<br />
for provid<strong>in</strong>g f<strong>in</strong>ancial support to visit Luxembourg University<br />
under a jo<strong>in</strong>t collaborative research programme. The contribution<br />
<strong>of</strong> scientific data by late Dr Yogesh Prasad will be remembered.<br />
Received 8 December 2009; revised accepted 22 November 2010<br />
CURRENT SCIENCE, VOL. 100, NO. 6, 25 MARCH 2011