Environmental Problems, Their Causes, and Sustainability 1
Environmental Problems, Their Causes, and Sustainability 1
Environmental Problems, Their Causes, and Sustainability 1

You also want an ePaper? Increase the reach of your titles
YUMPU automatically turns print PDFs into web optimized ePapers that Google loves.
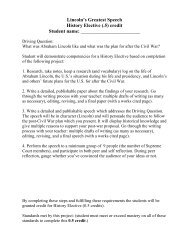
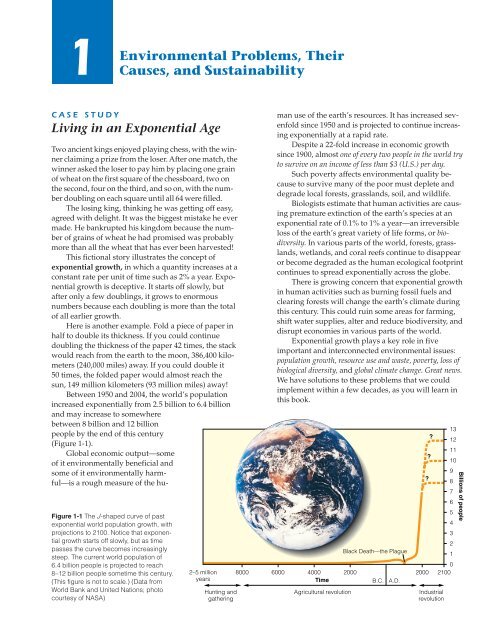
1<strong>Environmental</strong> <strong>Problems</strong>, <strong>Their</strong><strong>Causes</strong>, <strong>and</strong> <strong>Sustainability</strong>CASE STUDYLiving in an Exponential AgeTwo ancient kings enjoyed playing chess, with the winnerclaiming a prize from the loser. After one match, thewinner asked the loser to pay him by placing one grainof wheat on the first square of the chessboard, two onthe second, four on the third, <strong>and</strong> so on, with the numberdoubling on each square until all 64 were filled.The losing king, thinking he was getting off easy,agreed with delight. It was the biggest mistake he evermade. He bankrupted his kingdom because the numberof grains of wheat he had promised was probablymore than all the wheat that has ever been harvested!This fictional story illustrates the concept ofexponential growth, in which a quantity increases at aconstant rate per unit of time such as 2% a year. Exponentialgrowth is deceptive. It starts off slowly, butafter only a few doublings, it grows to enormousnumbers because each doubling is more than the totalof all earlier growth.Here is another example. Fold a piece of paper inhalf to double its thickness. If you could continuedoubling the thickness of the paper 42 times, the stackwould reach from the earth to the moon, 386,400 kilometers(240,000 miles) away. If you could double it50 times, the folded paper would almost reach thesun, 149 million kilometers (93 million miles) away!Between 1950 <strong>and</strong> 2004, the world’s populationincreased exponentially from 2.5 billion to 6.4 billion<strong>and</strong> may increase to somewherebetween 8 billion <strong>and</strong> 12 billionpeople by the end of this century(Figure 1-1).Global economic output—someof it environmentally beneficial <strong>and</strong>some of it environmentally harmful—isa rough measure of the hu-Figure 1-1 The J-shaped curve of pastexponential world population growth, withprojections to 2100. Notice that exponentialgrowth starts off slowly, but as timepasses the curve becomes increasinglysteep. The current world population of6.4 billion people is projected to reach8–12 billion people sometime this century.(This figure is not to scale.) (Data fromWorld Bank <strong>and</strong> United Nations; photocourtesy of NASA)2–5 millionyearsHunting <strong>and</strong>gatheringman use of the earth’s resources. It has increased sevenfoldsince 1950 <strong>and</strong> is projected to continue increasingexponentially at a rapid rate.Despite a 22-fold increase in economic growthsince 1900, almost one of every two people in the world tryto survive on an income of less than $3 (U.S.) per day.Such poverty affects environmental quality becauseto survive many of the poor must deplete <strong>and</strong>degrade local forests, grassl<strong>and</strong>s, soil, <strong>and</strong> wildlife.Biologists estimate that human activities are causingpremature extinction of the earth’s species at anexponential rate of 0.1% to 1% a year—an irreversibleloss of the earth’s great variety of life forms, or biodiversity.In various parts of the world, forests, grassl<strong>and</strong>s,wetl<strong>and</strong>s, <strong>and</strong> coral reefs continue to disappearor become degraded as the human ecological footprintcontinues to spread exponentially across the globe.There is growing concern that exponential growthin human activities such as burning fossil fuels <strong>and</strong>clearing forests will change the earth’s climate duringthis century. This could ruin some areas for farming,shift water supplies, alter <strong>and</strong> reduce biodiversity, <strong>and</strong>disrupt economies in various parts of the world.Exponential growth plays a key role in fiveimportant <strong>and</strong> interconnected environmental issues:population growth, resource use <strong>and</strong> waste, poverty, loss ofbiological diversity, <strong>and</strong> global climate change. Great news.We have solutions to these problems that we couldimplement within a few decades, as you will learn inthis book.8000 6000 4000 2000TimeAgricultural revolutionBlack Death—the PlagueB.C.A.D.???1312111098765432102000 2100IndustrialrevolutionBillions of people
Alone in space, alone in its life-supporting systems, poweredby inconceivable energies, mediating them to us through themost delicate adjustments, wayward, unlikely, unpredictable,but nourishing, enlivening, <strong>and</strong> enriching in the largestdegree—is this not a precious home for all of us? Is it notworth our love?BARBARA WARD AND RENÉ DUBOSThis chapter presents an overview of environmentalproblems, their causes, controversy over their seriousness,<strong>and</strong> ways we can live more sustainably. It discussesthese questions:■■■■■■What keeps us alive? What is an environmentallysustainable society?How fast is the human population increasing?What are economic growth, economic development,<strong>and</strong> globalization?What are the earth’s main types of resources? Howcan they be depleted or degraded?What are the principal types of pollution? Whatcan we do about pollution?What are the basic causes of today’s environmentalproblems? How are these causes connected?Is our current course sustainable? What is environmentallysustainable development?1-1 LIVING MORE SUSTAINABLYWhat Is the Difference between Environment,Ecology, <strong>and</strong> <strong>Environmental</strong> Science? DefiningSome Basic Terms<strong>Environmental</strong> science is a study of how the earthworks, how we interact with the earth, <strong>and</strong> how todeal with environmental problems.Environment is everything that affects a living organism(any unique form of life). Ecology is a biologicalscience that studies the relationships between livingorganisms <strong>and</strong> their environment.This textbook is an introduction to environmentalscience, an interdisciplinary study that uses informationfrom the physical sciences <strong>and</strong> social sciencesto learn how the earth works, how we interact with theearth, <strong>and</strong> how to deal with environmental problems.<strong>Environmental</strong> science involves integrating ideas fromthe natural world (biosphere) <strong>and</strong> our cultural world(culturesphere).<strong>Environmental</strong>ism is a social movement dedicatedto protecting the earth’s life support systems forus <strong>and</strong> other species. Members of the environmentalcommunity include ecologists, environmental scientists,conservation biologists, conservationists, preservationists,restorationists, <strong>and</strong> environmentalists.What Keeps Us Alive? The Sun <strong>and</strong> the Earth’sNatural CapitalAll life <strong>and</strong> economies depend on energy fromthe sun (solar capital) <strong>and</strong> the earth’s resources <strong>and</strong>ecological services (natural capital).Our existence, lifestyles, <strong>and</strong> economies depend completelyon the sun <strong>and</strong> the earth, a blue <strong>and</strong> whiteisl<strong>and</strong> in the black void of space (Figure 1-1). To economists,capital is wealth used to sustain a business <strong>and</strong>to generate more wealth. For example, suppose you invest$100,000 of capital <strong>and</strong> get a 10% return on yourmoney. In a year you get $10,000 in income from interest<strong>and</strong> increase your wealth to $110,000.By analogy, we can think of energy from the sun assolar capital. Solar energy includes direct sunlight<strong>and</strong> indirect forms of renewable solar energy such aswind power, hydropower (energy from flowing water),<strong>and</strong> biomass (direct solar energy converted to chemicalenergy <strong>and</strong> stored in biological sources of energy suchas wood).Similarly, we can think of the planet’s air, water,soil, wildlife, forest, rangel<strong>and</strong>, fishery, mineral, <strong>and</strong>energy resources <strong>and</strong> the processes of natural purification,recycling, <strong>and</strong> pest control as natural resourcesor natural capital (Figure 1-2). See the Guest Essay byPaul Hawken on the website for this chapter.Natural capital consists of resources (orange in Figure1-2) <strong>and</strong> ecological services (green in Figure 1-2) thatsupport <strong>and</strong> sustain the earth’s life <strong>and</strong> economies.This priceless natural capital that nature provides atno cost to us plus the natural biological income it suppliescan sustain the planet <strong>and</strong> our economies indefinitelyas long as we do not deplete them. Examples ofbiological income are renewable supplies of wood, fish,grassl<strong>and</strong> for grazing, <strong>and</strong> underground water fordrinking <strong>and</strong> irrigation.What Is an <strong>Environmental</strong>ly SustainableSociety? One That Preserves Natural Capital<strong>and</strong> Lives Off Its IncomeAn environmentally sustainable society meetsthe basic resource needs of its people indefinitelywithout degrading or depleting the natural capitalthat supplies these resources.An environmentally sustainable society meets thecurrent needs of its people for food, clean water, cleanair, shelter, <strong>and</strong> other basic resources without compromisingthe ability of future generations to meettheir needs. Living sustainably means living off naturalincome replenished by soils, plants, air, <strong>and</strong> water<strong>and</strong> not depleting or degrading the earth’s naturalcapital that supplies this biological income.Imagine you win $1 million in a lottery. Invest thiscapital at 10% interest per year, <strong>and</strong> you will have a6 CHAPTER 1 <strong>Environmental</strong> <strong>Problems</strong>, <strong>Their</strong> <strong>Causes</strong>, <strong>and</strong> <strong>Sustainability</strong>
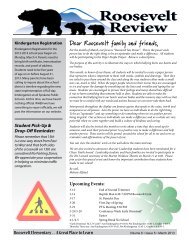
AirSOLAR ENERGYRESOURCESWaterEnergySoilMineralsFigure 1-2 The earth’s natural capital.Energy from the sun (solar capital)<strong>and</strong> the earth’s natural capital provideresources (orange) <strong>and</strong> ecological services(green) that support <strong>and</strong> sustainthe earth’s life <strong>and</strong> economies. Wedgesfrom this diagram will be used near thetitles of various chapters to indicate thecomponents of natural capital that arethe primary focus of such chapters.This diagram also appears on the backcover of this book.PopulationControlNutrientRecyclingNATURAL CAPITALClimateControlPollutionControlSERVICESWasteTreatmentsustainable annual income of $100,000 without depletingyour capital. If you spend $200,000 a year, your$1 million will be gone early in the 7th year <strong>and</strong> even ifyou spend only $110,000 a year, you will be bankruptearly in the 18th year.The lesson here is an old one: Protect your capital<strong>and</strong> live off the income it provides. Deplete, waste, orsqu<strong>and</strong>er your capital, <strong>and</strong> you move from a sustainableto an unsustainable lifestyle.The same lesson applies to the earth’s natural capital.According to many environmentalists <strong>and</strong> leadingscientists, we are living unsustainably by wasting, depleting,<strong>and</strong> degrading the earth’s natural capital at anaccelerating rate.Some people disagree. They contend that environmentalistshave exaggerated the seriousness of population,resource, <strong>and</strong> environmental problems. They alsobelieve we can overcome these problems by human ingenuity,economic growth, <strong>and</strong> technological advances.1-2 POPULATION GROWTH,ECONOMIC GROWTH, ECONOMICDEVELOPMENT, AND GLOBALIZATIONHow Rapidly Is the Human PopulationGrowing? Pretty FastThe rate at which the world’s population is growinghas slowed but is still growing pretty rapidly.Currently the world’s population is growing exponentiallyat a rate of about 1.25% a year. This does not seemBiodiversityPest &DiseaseControllike a very fast rate. But it addedabout 80 million people (6.4 billion 0.0125 80 million) to theworld’s population in 2004, anaverage increase of 219,000 people a day, or 9,100 anhour. At this rate it takes only about 3 days to add the651,000 Americans killed in battle in all U.S. wars <strong>and</strong>only 1.6 years to add the 129 million people killed inall wars fought in the past 200 years!How much is 80 million? Suppose you spend1 second saying hello to each of the 80 million new peopleadded this year for 24 hours a day—no sleeping,eating or anything else allowed. How long would thish<strong>and</strong>shaking marathon take? Answer: 2.5 years. Bythen there would be about 192 million more people toshake h<strong>and</strong>s with. Exponential growth is astonishing!What Is the Difference between EconomicGrowth <strong>and</strong> Economic Development? MoreStuff <strong>and</strong> Better Living St<strong>and</strong>ardsEconomic growth provides people with moregoods <strong>and</strong> services <strong>and</strong> economic developmentuses economic growth to improve livingst<strong>and</strong>ards.Economic growth is an increase in the capacity of acountry to provide people with goods <strong>and</strong> services. Accomplishingthis increase requires population growth(more producers <strong>and</strong> consumers), more production<strong>and</strong> consumption per person, or both.Economic growth is usually measured by the percentagechange in a country’s gross domestic product(GDP): the annual market value of all goods <strong>and</strong> servicesproduced by all firms <strong>and</strong> organizations, foreign<strong>and</strong> domestic, operating within a country. Changes ina country’s st<strong>and</strong>ard of living is measured by percapita GDP: the GDP divided by the total populationat midyear.Economic development is the improvement of livingst<strong>and</strong>ards by economic growth. The United Nationshttp://biology.brookscole.com/miller147
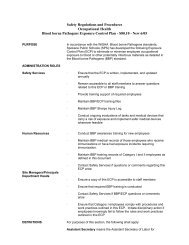
Percent ofWorld'sPopulationPopulationgrowthWealth <strong>and</strong>income190.11.6158185Population (billions)121110987654321World totalDevelopingcountriesDevelopedcountries1950 2000 2050 2100YearResourceusePollution<strong>and</strong> waste1225Developed countries(UN) classifies the world’s countries as economicallydeveloped or developing based primarily on their degreeof industrialization <strong>and</strong> their per capita GDP.The developed countries (with 1.2 billion people)include the United States, Canada, Japan, Australia,New Zeal<strong>and</strong>, <strong>and</strong> the countries of Europe. Most arehighly industrialized <strong>and</strong> have high average per capitaGDP. All other nations (with 5.2 billion people) areclassified as developing countries, most of them inAfrica, Asia, <strong>and</strong> Latin America. Some are middleincome,moderately developed countries <strong>and</strong> others arelow-income countries.Figure 1-3 compares some key characteristics of developed<strong>and</strong> developing countries. About 97% of theprojected increase in the world’s population is expectedto take place in developing countries (Figure 1-4).Figure 1-5 summarizes some of the benefits (goodnews) <strong>and</strong> harm (bad news) caused mostly by economicdevelopment. It shows effects of the wide <strong>and</strong> increasinggap between the world’s haves <strong>and</strong> have-nots.What Is Globalization? Being ConnectedWe live in a world that is increasingly interconnectedthrough economic, cultural, <strong>and</strong> environmentalinterdependence.You have probably heard about globalization: theprocess of social, economic, <strong>and</strong> environmental global7588Developing countriesFigure 1-3 Comparison of developed <strong>and</strong> developing countries.(Data from United Nations <strong>and</strong> the World Bank)Figure 1-4 Past <strong>and</strong> projected population size for developedcountries, developing countries, <strong>and</strong> the world, 1950–2100.Developing countries are expected to account for 97% of the2.5 billion people projected to be added to the world’s populationbetween 2004 <strong>and</strong> 2050. (Data from United Nations)Good NewsGlobal lifeexpectancydoubled since1950Infant mortalitycut in half since1955Food productionahead ofpopulation growthsince 1978Air <strong>and</strong> waterpollution down inmost developedcountries since1970Number of peopleliving in povertydropped 6%since 1990Trade-OffsEconomic DevelopmentBad NewsLife expectancy11 years less indevelopingcountries than indevelopedcountriesInfant mortalityrate in developingcountries over 8times higher thanin developedcountriesHarmfulenvironmentaleffects ofagriculture maylimit future foodproductionAir <strong>and</strong> waterpollution levels inmost developingcountries too highHalf of world'speople trying tolive on less than$3 (U.S.) per dayFigure 1-5 Trade-offs: good <strong>and</strong> bad news about economicdevelopment. Pick the single pieces of good news <strong>and</strong> badnews that you believe are the most important. (Data from UnitedNations <strong>and</strong> World Health Organization)8 CHAPTER 1 <strong>Environmental</strong> <strong>Problems</strong>, <strong>Their</strong> <strong>Causes</strong>, <strong>and</strong> <strong>Sustainability</strong>
changes that lead to an increasingly interconnectedworld. It involves increasing exchanges of people,products, services, capital, <strong>and</strong> ideas across internationalborders.Factors accelerating globalization include information<strong>and</strong> communication technologies, human mobility,<strong>and</strong> international trade <strong>and</strong> investment. Moderncommunication via cell phones <strong>and</strong> the Internet alsoallows powerless people throughout the world toshare ideas <strong>and</strong> to b<strong>and</strong> together to bring about changefrom the bottom up.This decentralized network, where everyone hasaccess to everyone else, represents a democratization oflearning <strong>and</strong> communication that is unprecedented inhuman history. A sustainable community or countryrecognizes that it is part of a larger global economic<strong>and</strong> ecological system <strong>and</strong> that it cannot be sustainableunless these larger systems are also sustainable.DirectsolarenergyPerpetualWinds,tides,flowingwaterResourcesRenewableFossilfuels(oil,naturalgas,coal)NonrenewableMetallicminerals(iron,copper,aluminum)Nonmetallicminerals(clay,s<strong>and</strong>,phosphates)1-3 RESOURCESWhat Is a Resource? Things We Need or WantWe obtain resources from the environment to meetour needs <strong>and</strong> wants.From a human st<strong>and</strong>point, a resource is anything obtainedfrom the environment to meet our needs <strong>and</strong>wants. Examples include food, water, shelter, manufacturedgoods, transportation, communication, <strong>and</strong>recreation. On our short human time scale, we classifythe material resources we get from the environmentas perpetual, renewable, or nonrenewable, as shown inFigure 1-6.Some resources, such as solar energy, fresh air,wind, fresh surface water, fertile soil, <strong>and</strong> wild edibleplants, are directly available for use. Other resources,such as petroleum (oil), iron, groundwater (waterfound underground), <strong>and</strong> modern crops, are not directlyavailable. They become useful to us only withsome effort <strong>and</strong> technological ingenuity. For example,petroleum was a mysterious fluid until we learnedhow to find <strong>and</strong> extract it <strong>and</strong> refine it into gasoline,heating oil, <strong>and</strong> other products that we could sell at affordableprices.What Are Perpetual <strong>and</strong> RenewableResources? Resources That Can LastResources renewed by natural processes are sustainableif we do not use them faster than they arereplenished.Solar energy is called a perpetual resource because ona human time scale it is renewed continuously. It is expectedto last at least 6 billion years as the sun completesits life cycle as a star.On a human time scale, a renewable resource canbe replenished fairly rapidly (from hours to severalFreshairFreshwaterFertilesoilPlants <strong>and</strong>animals(biodiversity)Figure 1-6 Natural capital: major types of material resources. Thisscheme is not fixed; renewable resources can become nonrenewableif used for a prolonged period at a faster rate than natural processesrenew them.decades) through natural processes. But this worksonly as long as the resource is not used up faster thanit is replaced. Examples of renewable resources areforests, grassl<strong>and</strong>s, wild animals, fresh water, fresh air,<strong>and</strong> fertile soil.Renewable resources can be depleted or degraded.The highest rate at which a renewable resource can beused indefinitely without reducing its available supplyis called its sustainable yield.When we exceed a renewable resource’s naturalreplacement rate, the available supply begins to shrink,aprocess known as environmental degradation. Examplesinclude urbanization of productive l<strong>and</strong>, excessivetopsoil erosion, pollution, deforestation (temporaryor permanent removal of large expanses of forestfor agriculture or other uses), groundwater depletion,overgrazing of grassl<strong>and</strong>s by livestock, <strong>and</strong> reductionin the earth’s forms of wildlife (biodiversity) by eliminationof habitats <strong>and</strong> species.Case Study: The Tragedy of the Commons—Degrading Free Renewable ResourcesRenewable resources that are freely available to everyonecan be degraded.http://biology.brookscole.com/miller149
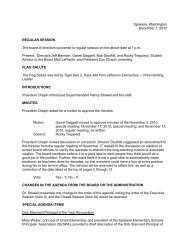
One cause of environmental degradation of renewableresources is the overuse of common-property or freeaccessresources. No individual owns these resources,<strong>and</strong> they are available to users at little or no charge.Examples include clean air, the open ocean <strong>and</strong> itsfish, migratory birds, wildlife species, publicly ownedl<strong>and</strong>s (such as national forests <strong>and</strong> national parks),gases of the lower atmosphere, <strong>and</strong> space.In 1968, biologist Garrett Hardin (1915–2003) calledthe degradation of renewable free-access resources thetragedy of the commons. It happens because each userreasons, “If I do not use this resource, someone else will.The little bit I use or pollute is not enough to matter, <strong>and</strong>such resources are renewable.”With only a few users, this logic works. But the cumulativeeffect of many people trying to exploit a freeaccessresource eventually exhausts or ruins it. Thenno one can benefit from it, <strong>and</strong> that is the tragedy.One solution is to use free-access resources atrates well below their estimated sustainable yields byreducing population, regulating access to the resources,or both. Some communities have establishedrules <strong>and</strong> traditions to regulate <strong>and</strong> share their accessto common-property resources such as ocean fisheries,grazing l<strong>and</strong>s, <strong>and</strong> forests. Governments havealso enacted laws <strong>and</strong> international treaties to regulateaccess to commonly owned resources such as forests,national parks, rangel<strong>and</strong>s, <strong>and</strong> fisheries in coastalwaters.Another solution is to convert free-access resourcesto private ownership. The reasoning is that if youown something, you are more likely to protect yourinvestment.This sounds good, but private ownership is not alwaysthe answer. One problem is private owners donot always protect natural resources they own whenthis conflicts with protecting their financial capital orincreasing their profits. For example, some private forestowners can make more money by clear-cutting thetimber, selling the degraded l<strong>and</strong>, <strong>and</strong> investing theirprofits in other timberl<strong>and</strong>s or businesses.A second problem is that this approach is notpractical for global common resources—such as the atmosphere,the open ocean, most wildlife species, <strong>and</strong>migratory birds—that cannot be divided up <strong>and</strong> convertedto private property.What Is Our Ecological Footprint? Our Growing<strong>Environmental</strong> ImpactSupplying each person with renewable resources <strong>and</strong>absorbing the wastes from such resource use creates alarge ecological footprint or environmental impact.The per capita ecological footprint is the amount ofbiologically productive l<strong>and</strong> <strong>and</strong> water needed to supplyeach person or population with the renewable resourcesthey use <strong>and</strong> to absorb or dispose of the wastesfrom such resource use. It measures the average environmentalimpact of individuals in different countries<strong>and</strong> areas. In other words, it is a measure of how muchof the earth’s natural capital <strong>and</strong> biological incomeeach of us uses.Bad news. Humanity’s ecological footprint per personexceeds the earth’s biological capacity to replenishrenewable resources <strong>and</strong> absorb waste by about 15%(Figure 1-7, right). If these estimates are correct, it willCountryUnited StatesThe Netherl<strong>and</strong>sIndiaCountryPer Capita Ecological Footprint(Hectares per person)0.83.8Total Ecological Footprint(Hectares)9.6Number of Earths1.41.21.0.8.6.4Humanity's Ecological FootprintEarth's Ecological CapacityUnited StatesThe Netherl<strong>and</strong>sIndia62 million hectares880 millionhectares3 billionhectares.201961 1965 1970 1975 1980 1985 1990 1995 2000 2005YearFigure 1-7 Natural capital use <strong>and</strong> degradation: total <strong>and</strong> per capita ecological footprints of the UnitedStates, the Netherl<strong>and</strong>s, <strong>and</strong> India (left). The ecological footprint is a measure of the biologically productiveareas of the earth required to produce the renewable resources required per person <strong>and</strong> absorb or breakdown the wastes produced by such resource use. Currently, humanity’s average ecological footprint per personis 15% higher than the earth’s biological capacity per person (right). (Data from William Rees <strong>and</strong> MathisWackernagel, Redefining Progress, 2004)10 CHAPTER 1 <strong>Environmental</strong> <strong>Problems</strong>, <strong>Their</strong> <strong>Causes</strong>, <strong>and</strong> <strong>Sustainability</strong>
take the resources of 1.15 planet earths to indefinitely supportour current use of renewable resources!The ecological footprint of each person in developedcountries is large compared to that in developingcountries (Figure 1-7, left). The per capita ecologicalfootprint of the United States is nearly double the country’sbiological capacity per person—explaining whythe country spreads its ecological footprint by importinglarge quantities of renewable resources from othercountries. You can estimate your ecological footprintby going to the website www.redefiningprogress.org/.Also, see the Guest Essay by Michael Cain on the websitefor this chapter.This eventually unsustainable situation is expectedto get worse as affluence increases in both developed<strong>and</strong> developing countries. According toWilliam Rees <strong>and</strong> Mathis Wachernagel, developers ofthe ecological footprint concept, it would take the l<strong>and</strong>area of about four more planet earths for the rest of theworld to reach U.S. levels of consumption with existingtechnology. Clearly, such consumption patternscannot be sustained.A new country with a large <strong>and</strong> growing ecologicalfootprint is emerging. China has the world’s largestpopulation <strong>and</strong> hopes to increase its total <strong>and</strong> per capitaeconomic growth, which will increase the ecologicalfootprints of its people. See the Guest Essay on thistopic by Norman Myers on the website for this chapter.What Are Nonrenewable Resources?Resources We Can DepleteNonrenewable resources can be economicallydepleted to the point where it costs too much toobtain what is left.Nonrenewable resources exist in a fixed quantity orstock in the earth’s crust. On a time scale of millions tobillions of years, geological processes can renew suchresources. But on the much shorter human time scaleof hundreds to thous<strong>and</strong>s of years, these resources canbe depleted much faster than they are formed.These exhaustible resources include energy resources(such as coal, oil, <strong>and</strong> natural gas that cannot berecycled), metallic mineral resources (such as iron, copper,<strong>and</strong> aluminum that can be recycled), <strong>and</strong> nonmetallicmineral resources (such as salt, clay, s<strong>and</strong>, <strong>and</strong> phosphatesthat usually are difficult or too costly to recycle).Figure 1-8 shows the production <strong>and</strong> depletioncycle of a nonrenewable energy or mineral resource.We never completely exhaust such a resource, but it becomeseconomically depleted when the costs of extracting<strong>and</strong> using what is left exceed its economic value. Atthat point, we have six choices: try to find more, recycleor reuse existing supplies (except for nonrenewable energyresources, which cannot be recycled or reused),waste less, use less, try to develop a substitute, or waitmillions of years for more to be produced.Resource productionArea under curveequals the totalamount of theresourceSome nonrenewable mineral resources, such ascopper <strong>and</strong> aluminum, can be recycled or reused to extendsupplies. Recycling involves collecting wastematerials, processing them into new materials, <strong>and</strong>selling these new products. For example, discardedaluminum cans can be crushed <strong>and</strong> melted to makenew aluminum cans or other aluminum items thatconsumers can buy. Recycling means nothing if we donot close the loop by buying products that are madefrom or contain recycled materials. Reuse is using a resourceagain in the same form. For example, glass bottlescan be collected, washed, <strong>and</strong> refilled many times.Recycling nonrenewable metallic resources takesmuch less energy, water, <strong>and</strong> other resources <strong>and</strong> producesmuch less pollution <strong>and</strong> environmental degradationthan exploiting virgin metallic resources.Reusing such resources takes even less energy <strong>and</strong>other resources <strong>and</strong> produces less pollution <strong>and</strong> environmentaldegradation than recycling.1-4 POLLUTIONTimeEconomic depletion(80% used up)Figure 1-8 Full production <strong>and</strong> exhaustion cycle of a nonrenewableresource such as copper, iron, oil, or coal. Usually, a nonrenewableresource is considered economically depleted when80% of its total supply has been extracted <strong>and</strong> used. Normally,it costs too much to extract <strong>and</strong> process the remaining 20%.Where Do Pollutants Come From, <strong>and</strong> WhatAre <strong>Their</strong> Harmful Effects? Threats to Health<strong>and</strong> SurvivalPollutants are chemicals found at high enough levelsin the environment to cause harm to people or otherorganisms.Pollution is the presence of substances at high enoughlevels in air, water, soil, or food to threaten the health,survival, or activities of humans or other organisms.Pollutants can enter the environment naturally (for example,from volcanic eruptions) or through human oranthropogenic activities (for example, from burningcoal). Most pollution from human activities occurs inor near urban <strong>and</strong> industrial areas, where pollutionsources such as cars <strong>and</strong> factories are concentrated.Industrialized agriculture is also a major source ofhttp://biology.brookscole.com/miller1411
pollution. Most pollutants are unintended by productsof useful activities such as burning coal to generateelectricity, driving cars, <strong>and</strong> growing crops.Some pollutants contaminate the areas where theyare produced <strong>and</strong> some are carried by wind or flowingwater to other areas. Pollution does not respect theneat territorial political lines we draw on maps.The pollutants we produce come from two typesof sources. Point sources of pollutants are single, identifiablesources. Examples are the smokestack of a coalburningpower plant, the drainpipe of a factory, <strong>and</strong>the exhaust pipe of an automobile. Nonpoint sourcesof pollutants are dispersed <strong>and</strong> often difficult to identify.Examples are pesticides sprayed into the air orblown by the wind into the atmosphere <strong>and</strong> runoff offertilizers <strong>and</strong> pesticides from farml<strong>and</strong>s, golf courses,<strong>and</strong> suburban lawns <strong>and</strong> gardens into streams <strong>and</strong>lakes. It is much easier <strong>and</strong> cheaper to identify <strong>and</strong>control pollution from point sources than from widelydispersed nonpoint sources.Pollutants can have three types of unwanted effects.First, they can disrupt or degrade life-supportsystems for humans <strong>and</strong> other species. Second, they c<strong>and</strong>amage wildlife, human health, <strong>and</strong> property. Third,they can be nuisances such as noise <strong>and</strong> unpleasantsmells, tastes, <strong>and</strong> sights.Solutions: What Can We Do about Pollution?Prevention PaysWe can try to clean up pollutants in theenvironment or prevent them from enteringthe environment.We use two basic approaches to deal with pollution.One is pollution prevention, or input pollution control,which reduces or eliminatesthe production of pollutants. Theother is pollution cleanup, oroutput pollution control, whichinvolves cleaning up or dilutingpollutants after they have beenproduced.<strong>Environmental</strong>ists have identifiedthree problems with relyingprimarily on pollution cleanup.First, it is only a temporary b<strong>and</strong>ageas long as population <strong>and</strong>consumption levels grow withoutcorresponding improvements inpollution control technology. Forexample, adding catalytic convertersto car exhaust systems hasreduced some forms of air pollution.But increases in the numberof cars <strong>and</strong> in the distance eachtravels have reduced the effectivenessof this approach.Air Pollution• Global climatechange• Stratospheric ozonedepletion• Urban air pollution• Acid deposition• Outdoor pollutants• Indoor pollutants• NoiseWater Pollution• Sediment• Nutrient overload• Toxic chemicals• Infectious agents• Oxygen depletion• Pesticides• Oil spills• Excess heatSecond, cleanup often removes a pollutant fromone part of the environment only to cause pollution inanother. For example, we can collect garbage, but thegarbage is then burned (perhaps causing air pollution<strong>and</strong> leaving toxic ash that must be put somewhere),dumped into streams, lakes, <strong>and</strong> oceans (perhaps causingwater pollution), or buried (perhaps causing soil<strong>and</strong> groundwater pollution).Third, once pollutants have entered <strong>and</strong> becomedispersed into the environment at harmful levels, itusually costs too much to reduce them to acceptablelevels.Both pollution prevention (front-of-the-pipe) <strong>and</strong>pollution cleanup (end-of-the-pipe) solutions areneeded. But environmentalists <strong>and</strong> some economistsurge us to put more emphasis on prevention because itworks better <strong>and</strong> is cheaper than cleanup. As BenjaminFranklin observed long ago, “An ounce of preventionis worth a pound of cure.”1-5 ENVIRONMENTAL ANDRESOURCE PROBLEMS: CAUSESAND CONNECTIONSWhat Are Key <strong>Environmental</strong> <strong>Problems</strong><strong>and</strong> <strong>Their</strong> Basic <strong>Causes</strong>? The Big FiveThe major causes of environmental problemsare population growth, wasteful resource use,poverty, poor environmental accounting,<strong>and</strong> ecological ignorance.We face a number of interconnected environmental<strong>and</strong> resource problems, as listed in Figure 1-9. The firststep in dealing with these problems is to identify theirBiodiversity Depletion• Habitat destruction• Habitat degradation• ExtinctionMajor<strong>Environmental</strong><strong>Problems</strong>Waste Production• Solid waste• Hazardous wasteFigure 1-9 Natural capitaldegradation: major environmental<strong>and</strong> resource problems.Food Supply <strong>Problems</strong>• Overgrazing• Farml<strong>and</strong> loss<strong>and</strong> degradation• Wetl<strong>and</strong>s loss<strong>and</strong> degradation• Overfishing• Coastal pollution• Soil erosion• Soil salinization• Soil waterlogging• Water shortages• Groundwater depletion• Loss of biodiversity• Poor nutrition12 CHAPTER 1 <strong>Environmental</strong> <strong>Problems</strong>, <strong>Their</strong> <strong>Causes</strong>, <strong>and</strong> <strong>Sustainability</strong>
<strong>Causes</strong> of <strong>Environmental</strong> <strong>Problems</strong>• Rapid population growth• Unsustainable resource use• Poverty• Not including the environmental costsof economic goods <strong>and</strong> services intheir market prices• Trying to manage <strong>and</strong> simplify naturewith too little knowledge about howit worksFigure 1-10 <strong>Environmental</strong>ists have identified five basiccauses of the environmental problems we face.they die, typically in their 50s in the poorest countries.The poor do not have retirement plans, social security,or government-sponsored health plans.Many of the world’s desperately poor die prematurelyfrom four preventable health problems. One ismalnutrition from a lack of protein <strong>and</strong> other nutrientsneeded for good health (Figure 1-12). The second is increasedsusceptibility to normally nonfatal infectiousdiseases, such as diarrhea <strong>and</strong> measles, because of theirweakened condition from malnutrition. A third factoris lack of access to clean drinking water. A fourth factoris severe respiratory disease <strong>and</strong> premature death fromunderlying causes, listed in Figure 1-10 <strong>and</strong> sometimesknown as the big five.Four of these causes are rapid population growth(p. 7), poverty (discussed below), <strong>and</strong> excessive <strong>and</strong>wasteful use of resources (discussed on p. 14) A fourthis failure to include the harmful environmental costsof items in their market prices, discussed in Chapter26. This in turn is a policy <strong>and</strong> political failure to addressthis issue. The fifth, inadequate underst<strong>and</strong>ingof how the earth works, is discussed throughout thisbook.Lack ofaccess toAdequatesanitationEnough fuel forheating <strong>and</strong>cookingElectricityClean drinkingwaterAdequatehealth careNumber of people(% of world's population)2.4 billion (38%)2 billion (32%)1.6 billion (25%)1.1 billion (17%)1.1 billion (17%)What Is the Relationship between Poverty <strong>and</strong><strong>Environmental</strong> <strong>Problems</strong>? Being Poor Is Badfor People <strong>and</strong> the EarthPoverty is a major threat to human health <strong>and</strong> theenvironment.Many of the world’s poor do not have access to the basicnecessities for a healthy, productive, <strong>and</strong> decentlife, as listed in Figure 1-11. <strong>Their</strong> daily lives are focusedon getting enough food, water, <strong>and</strong> fuel (forcooking <strong>and</strong> heat) to survive. Desperate for l<strong>and</strong> togrow enough food, many of the world’s poor peopledeplete <strong>and</strong> degrade forests, soil, grassl<strong>and</strong>s, <strong>and</strong>wildlife for short-term survival. They do not have theluxury of worrying about long-term environmentalquality or sustainability.Another problem for the poor is living in areas withhigh levels of air <strong>and</strong> water pollution <strong>and</strong> with a greatrisk of natural disasters such as floods, earthquakes,hurricanes, <strong>and</strong> volcanic eruptions. And they usuallymust take jobs—if they can find them—with unhealthy<strong>and</strong> unsafe working conditions at very low pay.Poverty also affects population growth. Poor peopleoften have many children as a form of economic security.<strong>Their</strong> children help them grow food, gather fuel(mostly wood <strong>and</strong> dung), haul drinking water, tendlivestock, work, <strong>and</strong> beg in the streets. The childrenalso help their parents survive in their old age beforeJohn Bryson/Photo Researchers, Inc.Enough foodfor good health1.1 billion (17%)Figure 1-11 Natural capital degradation: some harmful effectsof poverty. Which two of these effects do you believe is themost harmful? (Data from United Nations, World Bank, <strong>and</strong>World Health Organization)Figure 1-12 One in every three children under age 5, suchas this Brazilian child, suffers from malnutrition. According tothe World Health Organization, each day at least 13,700 childrenunder age 5 die prematurely from malnutrition <strong>and</strong> infectiousdiseases from drinking contaminated water <strong>and</strong> othercauses.http://biology.brookscole.com/miller1413
inhaling indoor air pollutants produced by burningwood or coal for heat <strong>and</strong> cooking in open fires or inpoorly vented stoves. According to the World HealthOrganization, these four factors cause premature deathfor at least 7 million of the poor a year.This premature death of about 19,200 human beingsper day is equivalent to 48 fully loaded 400-passenger jumbojet planes crashing every day with no survivors! Twothirdsof those dying are children under age 5.What Is the Relationship between ResourceConsumption <strong>and</strong> <strong>Environmental</strong> <strong>Problems</strong>?AffluenzaMany consumers in developed countries have becomeaddicted to buying more <strong>and</strong> more stuff in theirsearch for fulfillment <strong>and</strong> happiness.Affluenza (“af-loo-EN-zuh”) is a term used to describethe unsustainable addiction to overconsumption<strong>and</strong> materialism exhibited in the lifestyles ofaffluent consumers in the United States <strong>and</strong> other developedcountries. It is based on the assumption thatbuying more <strong>and</strong> more things can, should, <strong>and</strong> doesbuy happiness.Most people infected with this contagious shoptill-you-dropvirus have some telltale symptoms. Theyfeel overworked, have high levels of debt <strong>and</strong> bankruptcy,suffer from increasing stress <strong>and</strong> anxiety, havedeclining health, <strong>and</strong> feel unfulfilled in their quest toaccumulate more <strong>and</strong> more stuff. As humorist WillRogers said, “Too many people spend money theyhaven’t earned to buy things they don’t want, to impresspeople they don’t like.” For some, shopping untilyou drop means shopping until you go bankrupt.Between 1998 <strong>and</strong> 2001, more Americans declaredbankruptcy than graduated from college.Globalization <strong>and</strong> global advertising are nowspreading the virus throughout much of the world. Affluenzahas an enormous environmental impact. Ittakes about 27 tractor-trailer loads of resources peryear to support one American. This amounts to 7.9 billiontruckloads of resources a year to support the U.S.population. Stretched end-to-end, these trucks wouldmore than reach the sun!What can we do about affluenza? The first step foraddicts is to admit they have a problem. Then they beginsteps to kick their addiction by going on a stuff diet.For example, before buying anything a person with theaffluenza addiction should ask: Do I really need this ormerely want it? Can I buy it secondh<strong>and</strong> (reuse)? Can Iborrow it from a friend or relative? Another withdrawalstrategy: Do not hang out with other addicts.Shopaholics should avoid malls as much as they can.After a lifetime of studying the growth <strong>and</strong> declineof the world’s human civilizations, historian ArnoldToynbee summarized the true measure of a civilization’sgrowth in what he called the law of progressive simplification:“True growth occurs as civilizations transferan increasing proportion of energy <strong>and</strong> attention fromthe material side of life to the nonmaterial side <strong>and</strong>thereby develop their culture, capacity for compassion,sense of community, <strong>and</strong> strength of democracy.”How Can Affluence Help Increase <strong>Environmental</strong>Quality? Another Side of the StoryAffluent countries have more money for improvingenvironmental quality.Some analysts point out that affluence need not lead toenvironmental degradation. Instead, it can lead peopleto become more concerned about environmental quality,<strong>and</strong> it provides money for developing technologiesto reduce pollution, environmental degradation, <strong>and</strong>resource waste. This explains why most of the importantenvironmental progress made since 1970 hastaken place in developed countries.In the United States, the air is cleaner, drinkingwater is purer, most rivers <strong>and</strong> lakes are cleaner, <strong>and</strong>the food supply is more abundant <strong>and</strong> safer than in1970. Also, the country’s total forested area is largerthan it was in 1900 <strong>and</strong> most energy <strong>and</strong> material resourcesare used more efficiently. Similar advanceshave been made in most other affluent countries. Affluencefinanced these improvements in environmentalquality.How Are <strong>Environmental</strong> <strong>Problems</strong> <strong>and</strong> <strong>Their</strong><strong>Causes</strong> Connected? Exploring Connections<strong>Environmental</strong> quality is affected by interactionsbetween population size, resource consumption, <strong>and</strong>technology.Once we have identified environmental problems <strong>and</strong>their root causes, the next step is to underst<strong>and</strong> howthey are connected to one another. The three-factormodel in Figure 1-13 is a starting point.According to this simple model, the environmentalimpact (I) ofapopulation on a given area dependson three factors: the number of people (P), the averageresource use per person (affluence, A), <strong>and</strong> thebeneficial <strong>and</strong> harmful environmental effects of thetechnologies (T) used to provide <strong>and</strong> consume eachunit of resource <strong>and</strong> to control or prevent the resultingpollution <strong>and</strong> environmental degradation.In developing countries, population size <strong>and</strong> theresulting degradation of renewable resources as thepoor struggle to stay alive tend to be the key factors intotal environmental impact (Figure 1-13, top). In suchcountries per capita resource use is low.In developed countries, high rates of per capita resourceuse <strong>and</strong> the resulting high levels of pollution<strong>and</strong> environmental degradation per person usually arethe key factors determining overall environmental impact(Figure 1-13, bottom) <strong>and</strong> a country’s ecological14 CHAPTER 1 <strong>Environmental</strong> <strong>Problems</strong>, <strong>Their</strong> <strong>Causes</strong>, <strong>and</strong> <strong>Sustainability</strong>
Developing Countriesxx=Population (P)xConsumptionper person(affluence, A)xTechnological impact perunit of consumption (T)=<strong>Environmental</strong>impact of population (I)xx=Developed CountriesFigure 1-13 Connections: simplified model of how three factors—number of people, affluence, <strong>and</strong> technology—affectthe environmental impact of the population in developing countries (top) <strong>and</strong> developed countries(bottom).footprint per person (Figure 1-7). For example, the averageU.S. citizen consumes about 35 times as much asthe average citizen of India <strong>and</strong> 100 times as much asthe average person in the world’s poorest countries.Thus poor parents in a developing country would need 70 to200 children to have the same lifetime resource consumptionas 2 children in a typical U.S. family.Some forms of technology, such as polluting factories<strong>and</strong> motor vehicles <strong>and</strong> energy-wasting devices,increase environmental impact by raising the T factorin the equation. But other technologies, suchas pollution control <strong>and</strong> prevention,solar cells, <strong>and</strong> energy-saving devices,lower environmental impactby decreasing the T factor.In other words, someforms of technology are en-Earth's Life-Support SystemAir(atmosphere)Water(hydrosphere)vironmentally harmful <strong>and</strong> some are environmentallybeneficial.The three-factor model in Figure 1-13 can help usunderst<strong>and</strong> how key environmental problems <strong>and</strong>some of their causes are connected. It can also guide usin seeking solutions. However, these problems involvea number of poorly understood interactions betweenmany more factors than those in this simplified model,as outlined in Figure 1-14. Look at the interactionsshown in this figure.Human CulturespherePopulationTechnologyFigure 1-14 Connections: majorcomponents <strong>and</strong> interactions within<strong>and</strong> between the earth’s life-supportsystem <strong>and</strong> the human socioculturalsystem (culturesphere). The goal ofenvironmental science is to learn asmuch as possible about these complexinteractions.Soil <strong>and</strong> rocks(lithosphere)Life(biosphere)EconomicsPoliticshttp://biology.brookscole.com/miller1415
1-6 IS OUR PRESENT COURSESUSTAINABLE?Are Things Getting Better or Worse?The Answer Is BothThere is good <strong>and</strong> bad environmental news.Experts disagree about how serious our environmentalproblems are <strong>and</strong> what we should do about them.Some analysts believe human ingenuity, technologicaladvances, <strong>and</strong> economic growth <strong>and</strong> development willallow us to clean up pollution to acceptable levels, findsubstitutes for resources that become scarce, <strong>and</strong> keepexp<strong>and</strong>ing the earth’s ability to support more humans,as we have done in the past. They accuse many scientists<strong>and</strong> environmentalists of exaggerating the seriousnessof the problems we face <strong>and</strong> failing to appreciatethe progress we have made in improving quality oflife <strong>and</strong> protecting the environment.<strong>Environmental</strong>ists <strong>and</strong> many leading scientists disagreewith this view. They cite evidence that we aredegrading <strong>and</strong> disrupting many of the world’s lifesupportsystems for us <strong>and</strong> other species at an acceleratingrate. They are greatly encouraged by the progresswe have made in increasing average life expectancy, reducinginfant mortality, increasing food supplies, <strong>and</strong>reducing many forms of pollution—especially in developedcountries. But they point out that we need to usethe earth in a way that is more sustainable for present<strong>and</strong> future human generations <strong>and</strong> other species thatsupport us <strong>and</strong> other forms of life.The most useful answer to the question of whetherthings are getting better or worse is both. Some thingsare getting better, some worse.Our challenge is not to get trapped into confusion<strong>and</strong> inaction by listening primarily to either of twogroups of people. One group consists of technologicaloptimists. They tend to overstate the situation by tellingus to be happy <strong>and</strong> not worry, because technologicalinnovations <strong>and</strong> conventional economic growth <strong>and</strong>development will lead to a wonderworld for everyone.Leave the driving to us because we know best.The second group consists of environmental pessimistswho overstate the problems to the point whereour environmental situation seems hopeless. Accordingto the noted conservationist Aldo Leopold, “I haveno hope for a conservation based on fear.”xHOW WOULD YOU VOTE? * Is the society you live in on anunsustainable path? Cast your vote online at http://biology.brookscole.com/miller14.*To cast your vote, go to the website for the book listed above<strong>and</strong> then go to the appropriate chapter (in this case Chapter 1). Inmost cases you will be able to compare how you voted with othersusing this book throughout the United States <strong>and</strong> the world.How Should We Live? A Clash of<strong>Environmental</strong> WorldviewsThe way we view the seriousness of environmentalproblems <strong>and</strong> how to solve them depends on ourenvironmental worldview.The differing views about how serious our environmentalproblems are <strong>and</strong> what we should do aboutthem arise mostly out of differing environmentalworldviews. Your environmental worldview is howyou think the world works, what you think your rolein the world should be, <strong>and</strong> what you believe is right<strong>and</strong> wrong environmental behavior (environmentalethics).People who have widely differing environmentalworldviews can take the same data, be logically consistent,<strong>and</strong> arrive at quite different conclusions becausethey start with different assumptions <strong>and</strong> values.Some people in today’s industrial consumer societieshave a planetary management worldview. Hereare the basic environmental beliefs of this worldview:■ As the planet’s most important species, we are incharge of nature.■ We will not run out of resources because of ourability to develop <strong>and</strong> find new ones.■ The potential for global economic growth is essentiallyunlimited.■ Our success depends on how well we manage theearth’s life-support systems, mostly for our ownbenefit.A second environmental worldview, known as thestewardship worldview, consists of the following majorbeliefs:■ We are the planet’s most important species but wehave an ethical responsibility to care for the rest ofnature.■ We will probably not run out of resources but theyshould not be wasted.■ We should encourage environmentally beneficialforms of economic growth <strong>and</strong> discourage environmentallyharmful forms of economic growth.■ Our success depends on how well we can managethe earth’s life-support systems for our benefit <strong>and</strong> forthe rest of nature.Another environmental worldview, known as theenvironmental wisdom worldview, is based on thefollowing major beliefs, which are the opposite of thosemaking up the planetary management worldview:■ Nature exists for all species, not just for us <strong>and</strong> weare not in charge of the earth.■ The earth’s resources are limited, should not bewasted, <strong>and</strong> are not all for us.16 CHAPTER 1 <strong>Environmental</strong> <strong>Problems</strong>, <strong>Their</strong> <strong>Causes</strong>, <strong>and</strong> <strong>Sustainability</strong>
■ We should encourage earth-sustaining forms of economicgrowth <strong>and</strong> discourage earth-degrading forms.■ Our success depends on learning how the earthsustains itself <strong>and</strong> integrating such lessons from nature(environmental wisdom) into the ways we think<strong>and</strong> act.What Are the Greatest <strong>Environmental</strong><strong>Problems</strong> We Face Now <strong>and</strong> in the Future?The Big PicturePoverty <strong>and</strong> malnutrition, smoking, infectiousdiseases, water shortages, biodiversity loss, <strong>and</strong>climate changes are the most serious environmentalproblems we face.Figure 1-15 ranks major environmental problems on atime scale in terms of the estimated number of peopleprematurely killed annually today <strong>and</strong> over the nexthundred years.From this diagram you can see that we should focusour money, minds, <strong>and</strong> hearts on reducing the environmentalrisks from poverty, malnutrition, unsafedrinking water, smoking, air pollution, infectious diseases(AIDS, TB, malaria, <strong>and</strong> hepatitis B), water shortages, climatechanges, <strong>and</strong> loss <strong>and</strong> degradation of biodiversity. Thepoor in developing countries bear the brunt of most ofthese serious problems.Annual number of premature deaths (millions)109876543210Poverty, malnutrition,water-borne diseaseSmokingTBAIDSAIDS <strong>and</strong> Air pollutionSmokingMalaria <strong>and</strong> Hepatitis B2000WatershortagesBiodiversity lossClimate changes2010 2020 2030 2040 2050 2060 2070 2080 2090 2100YearFigure 1-15 Priorities: ranking of major environmental risks in terms of the estimatednumber of people prematurely killed annually now (yellow) <strong>and</strong> over the next hundredyears (red). Some scientists consider biodiversity loss <strong>and</strong> climate change the twomost serious ecological risks to humans <strong>and</strong> other species. Estimates of deaths frombiodiversity loss <strong>and</strong> climate change 50 or more years into the future are difficult tomake <strong>and</strong> could be higher or lower than those shown here. (Data from UN Food <strong>and</strong>Agriculture Organization, World Health Organization, United Nations EnvironmentProgram, U.S. Centers for Disease Control <strong>and</strong> Prevention, <strong>and</strong> the World Bank)xHOW WOULD YOU VOTE? What do you think is our mostserious environmental problem? Cast your vote online athttp://biology.brookscole.com/miller14.What Is <strong>Environmental</strong>ly SustainableEconomic Development? Rewarding<strong>Environmental</strong>ly Beneficial Activities<strong>Environmental</strong>ly sustainable economic developmentrewards environmentally beneficial<strong>and</strong> sustainable activities <strong>and</strong> discouragesenviron-mentally harmful <strong>and</strong> unsustainableactivities.During this century, many analysts call for us to putmuch greater emphasis on environmentally sustainableeconomic development. Figure 1-16 (p. 18) listssome of the shifts involved in implementing such an environmental,or sustainability, revolution during this centurybased on this concept. Study this figure carefully.This type of development uses economic rewards(government subsidies <strong>and</strong> tax breaks) to encourage environmentallybeneficial <strong>and</strong> more sustainable formsof economic growth <strong>and</strong> economic penalties (governmenttaxes <strong>and</strong> regulations) to discourage environmentallyharmful <strong>and</strong> unsustainable forms of economicgrowth.Throughout this book I try to giveyou a balanced view of good <strong>and</strong> badenvironmental news. Try not to be overwhelmedor immobilized by the bad environmentalnews, because there is alsosome great environmental news. We havemade immense progress in improving thehuman condition <strong>and</strong> dealing with manyenvironmental problems. We are learninga great deal about how nature works <strong>and</strong>sustains itself. And we have numerousscientific, technological, <strong>and</strong> economicsolutions available to deal with the environmentalproblems we face.The challenge is to make creative useof our economic <strong>and</strong> political systems toimplement such solutions. One key is torecognize that most economic <strong>and</strong> politicalchange comes about as a result of individualactions <strong>and</strong> individuals actingtogether to bring about change by grassrootsaction from the bottom up. Goodnews. Social scientists suggest it takes onlyabout 5–10% of the population of a countryor of the world to bring about majorsocial change. Anthropologist MargaretMead summarized our potential forchange: “Never doubt that a small grouphttp://biology.brookscole.com/miller1417
CurrentEmphasisPollution cleanupWaste disposal (buryor burn)Protecting species<strong>Environmental</strong>degradationIncreased resourceusePopulation growthDepleting <strong>and</strong>degrading naturalcapitalof thoughtful, committed citizens can change theworld. Indeed, it is the only thing that ever has.”We live in exciting times during what might becalled a hinge of cultural history. Indeed, if I had to pick atime to live, it would be the next 50 years as we face thechallenge of developing more environmentally sustainablesocieties.What’s the use of a house if you don’t have a decent planet toput it on?HENRY DAVID THOREAUCRITICAL THINKING<strong>Sustainability</strong>EmphasisPollution prevention(cleaner production)Waste prevention <strong>and</strong>reductionProtecting wherespecies live (habitatprotection)<strong>Environmental</strong>restorationLess wasteful (moreefficient) resource usePopulationstabilization bydecreasing birth ratesProtecting naturalcapital <strong>and</strong> living offthe biological interestit providesFigure 1-16 Solutions: some shifts involved in the environmentalor sustainability revolution.1. Do you favor instituting policies designed to reducepopulation growth <strong>and</strong> stabilize (a) the size of theworld’s population as soon as possible <strong>and</strong> (b) the sizeof the U.S. population (or the population of the countrywhere you live) as soon as possible? Explain. If youagree that population stabilization is desirable, whatthree major policies would you implement to accomplishthis goal?2. List (a) three forms of economic growth you believeare environmentally unsustainable <strong>and</strong> (b) three formsyou believe are environmentally sustainable.3. Give three examples of how you cause environmentaldegradation as a result of the tragedy of the commons.4. When you read that about 19,200 human beings dieprematurely each day (13 per minute) from preventablemalnutrition <strong>and</strong> infectious disease, do you (a) doubtwhether it is true, (b) not want to think about it, (c) feelhopeless, (d) feel sad, (e) feel guilty, or (f) want to dosomething about this problem?5. How do you feel when you read that (1) the averageAmerican consumes about 35 times more resources thanthe average Indian citizen, (2) human activities lead tothe premature extinction of at least 10 species per day,<strong>and</strong> (3) human activities are projected to make the earth’sclimate warmer: (a) skeptical about their accuracy, (b) indifferent,(c) sad, (d) helpless, (e) guilty, (f) concerned, or(g) outraged? Which of these feelings help perpetuatesuch problems, <strong>and</strong> which can help alleviate them?6. See if you are infected by the affluenza bug by indicatingwhether you agree or disagree with the followingstatements.a. I am willing to work at a job I despise so I can buylots of stuff.b. When I am feeling down, I like to go shopping tomake myself feel better.c. I would rather be shopping right now.d. I owe more than $1,000 on my credit cards.e. I usually make only the minimum payment on mymonthly credit card bills.f. I am running out of room to store my stuff.If you agree with three of these statements, you are infectedwith affluenza. If you agree with more than three,you have a serious case of affluenza. Compare your answerswith those of your classmates <strong>and</strong> discuss the effectsof the results on the environment <strong>and</strong> your feelingsof happiness.7. Explain why you agree or disagree with each of thefollowing statements: (a) humans are superior to otherforms of life, (b) humans are in charge of the earth, (c) alleconomic growth is good, (d) the value of other speciesdepends only on whether they are useful to us, (e) becauseall species eventually become extinct we shouldnot worry about whether our activities cause the prematureextinction of a species, (f) all species have an inherentright to exist, (g) nature has an almost unlimitedstorehouse of resources for human use, (h) technologycan solve our environmental problems, (i) I do not believeI have any obligation to future generations, <strong>and</strong>(j) I do not believe I have any obligation to other species.8. What are the basic beliefs of your environmentalworldview? Are the beliefs of your environmentalworldview consistent with your answers to question 7?Are your environmental actions consistent with your environmentalworldview?PROJECTS1. What are the major resource <strong>and</strong> environmental problemswhere you live? Which of these problems affect youdirectly? Have these problems gotten better or worseduring the last 10 years?18 CHAPTER 1 <strong>Environmental</strong> <strong>Problems</strong>, <strong>Their</strong> <strong>Causes</strong>, <strong>and</strong> <strong>Sustainability</strong>
2. Write two-page scenarios describing what your life<strong>and</strong> that of any children you may have might be like50 years from now if (a) we continue on our present path;(b) we shift to more sustainable societies throughoutmost of the world.3. Make a list of the resources you truly need. Then makeanother list of the resources you use each day only becauseyou want them. Finally, make a third list of resourcesyou want <strong>and</strong> hope to use in the future. Compareyour lists with those compiled by other members of yourclass, <strong>and</strong> relate the overall result to the tragedy of thecommons (p. 9).4. Use the library or the Internet to find out bibliographicinformation about Barbara Ward, René Dubos, <strong>and</strong> HenryDavid Thoreau, whose quotes appear at the beginning <strong>and</strong>end of this chapter.5. Make a concept map of this chapter’s major ideas usingthe section heads, subheads, <strong>and</strong> key terms (in boldfacetype). Look on the website for this book for informationabout making concept maps.LEARNING ONLINEThe website for this book contains study aids <strong>and</strong> manyideas for further reading <strong>and</strong> research. They include achapter summary, review questions for the entire chapter,flash cards for key terms <strong>and</strong> concepts, a multiple-choicepractice quiz, interesting Internet sites, references, <strong>and</strong>a guide for accessing thous<strong>and</strong>s of InfoTrac ® CollegeEdition articles. Log on tohttp://biology.brookscole.com/miller14Then click on the Chapter-by-Chapter area, choose Chapter1, <strong>and</strong> select a learning resource.http://biology.brookscole.com/miller1419
2<strong>Environmental</strong>History:Learning from the PastBiodiversityCASE STUDYNear Extinctionof the American BisonIn 1500, before Europeans settled North America,30–60 million North American bison—commonlyknown as the buffalo—grazed the plains, prairies, <strong>and</strong>woodl<strong>and</strong>s over much of the continent.These animals were once so numerous that in1832 a traveler wrote, “As far as my eye could reachthe country seemed absolutely blackened by innumerableherds.” A single herd on the move might thunderpast for hours.For centuries, several Native American tribes dependedheavily on bison. Typically they killed onlyenough animals to meet their needs for food, clothing,<strong>and</strong> shelter. They also burned dried feces of these animals,known as “buffalo chips,” to cook food <strong>and</strong> provideheat.By 1906, the once vast range of the bison hadshrunk to a tiny area, <strong>and</strong> the species had beendriven nearly to extinction (Figure 2-1). How didthis happen? It began when settlers moving westafter the Civil War upset the sustainable balance betweenNative Americans <strong>and</strong> bison. Several Plainstribes traded bison skins to settlers for steel knives<strong>and</strong> firearms, which allowed them to kill morebison.But it was the new settlers who caused the mostrelentless slaughter. As railroads spread westward inthe late 1860s, railroad companies hired professionalbison hunters—including Buffalo Bill Cody—to supplyconstruction crews with meat. Passengers alsogunned down bison from train windows for sport,leaving the carcasses to rot.Commercial hunters shot millions of bison fortheir hides <strong>and</strong> tongues (considered a delicacy),leaving most of the meat to rot. “Bone pickers”collected the bleached bones that whitened theprairies <strong>and</strong> shipped them east to be ground up asfertilizer.Farmers shot bison because they damaged crops,fences, telegraph poles, <strong>and</strong> sod houses. Rancherskilled them because they competed with cattle <strong>and</strong>sheep for pasture. The U.S. Army killed at least12 million bison as part of its campaign to subdue15001850187018801906Figure 2-1 The historical range of the bison shrank severelybetween 1500 <strong>and</strong> 1906, mostly because of unregulated <strong>and</strong>deliberate overhunting.the Plains tribes by killing off their primary sourceof food.Between 1870 <strong>and</strong> 1875, at least 2.5 million bisonwere slaughtered each year. Only 85 bison were leftby 1892. They were given refuge in YellowstoneNational Park <strong>and</strong> protected by an 1893 law that forbidsthe killing of wild animals in national parks.In 1905, 16 people formed the American BisonSociety to protect <strong>and</strong> rebuild the captive population.Soon thereafter, the federal government establishedthe National Bison Range near Missoula, Montana.Today an estimated 350,000 bison are alive, about97% of them on privately owned ranches.Some wildlife conservationists have suggestedrestoring large herds of bison on public l<strong>and</strong>s in theNorth American plains. This idea has been stronglyopposed by ranchers with permits to graze cattle <strong>and</strong>sheep on federally managed l<strong>and</strong>s.The history of humanity’s relationships to the environmentprovides many important lessons that canhelp us deal with today’s environmental problems<strong>and</strong> avoid repeating past mistakes.
A continent ages quickly once we come.ERNEST HEMINGWAYThis chapter addresses the following questions:■■■What major beneficial <strong>and</strong> harmful effects havehunter–gatherer societies, agricultural societies,<strong>and</strong> industrialized societies had on the environment?What might be the environmental impactof the current information <strong>and</strong> globalizationrevolution?What are the major phases in the history ofl<strong>and</strong> <strong>and</strong> wildlife conservation, public health,<strong>and</strong> environmental protection in the UnitedStates?What is Aldo Leopold’s l<strong>and</strong> ethic?2-1 CULTURAL CHANGESAND THE ENVIRONMENTWhat Major Human Cultural Changes HaveTaken Place? Agriculture, Industrialization,<strong>and</strong> GlobalizationSince our hunter–gatherer days we have undergonethree major cultural changes that have increased ourimpact on the environment.Evidence from fossils, DNA analysis, <strong>and</strong> studies ofancient cultures suggests that the earliest form of thehuman (Homo sapiens) species was Homo sapiens idaltu,which existed about 160,000 years ago. The latest versionof our species, Homo sapiens sapiens, has beenaround for only about 60,000 years. Thus the variousversions of Homo sapiens have walked the earth for lessthan an eye blink of the estimated 3.7-billion-year existenceof life on this marvelous planet. We are theplanet’s new infants.Until about 12,000 years ago, we were mostlyhunter–gatherers who typically moved as needed tofind enough food for survival. Since then, three majorcultural changes have occurred: the agricultural revolution(which began 10,000–12,000 years ago), the industrial–medicalrevolution (which began about 275 yearsago), <strong>and</strong> the information <strong>and</strong> globalization revolution(which began about 50 years ago).These changes have greatly increased our impacton the environment in three ways. They have given usmuch more energy <strong>and</strong> new technologies with whichto alter <strong>and</strong> control more of the planet to meet ourbasic needs <strong>and</strong> increasing wants. They have also allowedexpansion of the human population, mostly becauseof increased food supplies <strong>and</strong> longer life spans.In addition, they have greatly increased our resourceuse, pollution, <strong>and</strong> environmental degradation.How Did Ancient Hunting-<strong>and</strong>-GatheringSocieties Affect the Environment? LivingLightly on the EarthHunter–gatherers had a fairly small impact on theirenvironment.During most of their 60,000-year existence, Homo sapienssapiens have been hunter–gatherers. They survivedby collecting edible wild plant parts, hunting, fishing,<strong>and</strong> scavenging meat from animals killed by otherpredators. Our hunter–gatherer ancestors typicallylived in small b<strong>and</strong>s of fewer than 50 people whoworked together to get enough food to survive. Manygroups were nomadic, picking up their few possessions<strong>and</strong> moving seasonally from place to place to findenough food.The earliest hunter–gatherers (<strong>and</strong> those still livingthis way today) survived through expert knowledge<strong>and</strong> underst<strong>and</strong>ing of their natural surroundings.Because of high infant mortality <strong>and</strong> an estimated averagelife span of 30–40 years, hunter–gatherer populationsgrew very slowly.Advanced hunter–gatherers had greater environmentalimpacts than those of early hunter–gatherers.They used more advanced tools <strong>and</strong> fire to convertforests into grassl<strong>and</strong>s. There is also some evidencethat they probably contributed to the extinction ofsome large animals. They also altered the distributionof plants (<strong>and</strong> animals feeding on such plants) as theycarried seeds <strong>and</strong> plants to new areas.Early <strong>and</strong> advanced hunter–gatherers exploitedtheir environment to survive. But their environmentalimpact usually was limited <strong>and</strong> local because of theirsmall population, low resource use per person, migrationthat allowed natural processes to repair most ofthe damage they caused, <strong>and</strong> lack of technology thatcould have exp<strong>and</strong>ed their impact.What Was the Agricultural Revolution?More Food, More People, Longer Lives,<strong>and</strong> an Increasing Ecological FootprintAgriculture provided more food for more peoplewho lived longer <strong>and</strong> in better health but alsogreatly increased environmental degradation.Some 10,000–12,000 years ago, a cultural shift knownas the agricultural revolution began in several regionsof the world. It involved a gradual move from usuallynomadic hunting-<strong>and</strong>-gathering groups to settled agriculturalcommunities in which people domesticatedwild animals <strong>and</strong> cultivated wild plants.Plant cultivation probably developed in manyareas, some including tropical forests of SoutheastAsia, northeast Africa, <strong>and</strong> Mexico. People discoveredhow to grow various wild food plants from roots or tubers(fleshy underground stems). To prepare the l<strong>and</strong>http://biology.brookscole.com/miller1421
1Clearing<strong>and</strong> burningvegetationAllowing plotto revegetate10 to 30 years42 3PlantingHarvesting for2 to 5 yearsFigure 2-2 The first crop-growing technique may have been a combination of slash-<strong>and</strong>-burn <strong>and</strong> shifting cultivationin tropical forests. This method is sustainable only if small plots of the forest are cleared, cultivated forno more than 5 years, <strong>and</strong> then allowed to regenerate for 10–30 years to renew soil fertility. Indigenous cultureshave developed many variations of this technique <strong>and</strong> have found ways to use some former plots nondestructivelywhile they are being regenerated.for planting, they cleared small patches of tropicalforests by cutting down trees <strong>and</strong> other vegetation <strong>and</strong>then burning the underbrush (Figure 2-2). The ashesfertilized the often nutrient-poor tropical forest soils inthis slash-<strong>and</strong>-burn cultivation.Early growers also used various forms of shiftingcultivation (Figure 2-2), primarily in tropical regions.After a plot had been used for several years, the soilbecame depleted of nutrients or reinvaded by the forest.Then the growers cleared a new plot. They learnedthat each ab<strong>and</strong>oned patch normally had to be left fallow(unplanted) for 10–30 years before the soil becamefertile enough to grow crops again. While patches wereregenerating, growers used them for tree crops, medicines,fuelwood, <strong>and</strong> other purposes. In this manner,most early growers practiced sustainable cultivation.These early farmers had fairly little impact on theenvironment. <strong>Their</strong> dependence mostly on humanmuscle power <strong>and</strong> crude stone or stick tools meantthey could cultivate only small plots <strong>and</strong> their populationsize <strong>and</strong> density were low. In addition, normallyenough l<strong>and</strong> was available so they could move toother areas <strong>and</strong> leave ab<strong>and</strong>oned plots unplanted forthe several decades needed to restore soil fertility.As more advanced forms of agriculture grew <strong>and</strong>spread they led to various beneficial <strong>and</strong> harmfuleffects (Figure 2-3).What Is the Industrial–Medical Revolution?More People, Longer Lives, MoreProduction, <strong>and</strong> an Even Larger EcologicalFootprintBecause of the industrial–medical revolutionmore people live longer <strong>and</strong> healthier lives at ahigher st<strong>and</strong>ard of living, but pollution, resourcewaste, <strong>and</strong> environmental degradation haveincreased.The next cultural shift, the industrial–medical revolution,began in Engl<strong>and</strong> in the mid-1700s <strong>and</strong> spreadto the United States in the 1800s. It involved a shiftfrom dependence on renewable wood (with supplies22 CHAPTER 2 <strong>Environmental</strong> History: Learning from the Past
Good NewsMore foodSupported alarger populationLonger lifeexpectancyHigher st<strong>and</strong>ardof living for manypeopleFormation ofvillages, towns,<strong>and</strong> citiesTowns <strong>and</strong> citiesserved as centersfor trade,government,<strong>and</strong> religionT rade-OffsAgricultural RevolutionBad NewsDestruction ofwildlife habitatsfrom clearingforests <strong>and</strong>grassl<strong>and</strong>sKilling of wildanimals feedingon grass or cropsFertile l<strong>and</strong> turnedinto desert bylivestockovergrazingSoil eroded intostreams <strong>and</strong> lakesTowns <strong>and</strong> citiesconcentratedwastes <strong>and</strong>pollution <strong>and</strong>increased spreadof diseasesIncrease in armedconflict <strong>and</strong>slavery overownership of l<strong>and</strong><strong>and</strong> waterresourcesFigure 2-3 Trade-offs: good <strong>and</strong> bad news about the shiftfrom hunting <strong>and</strong> gathering to agriculture. Pick the singlepieces of good news <strong>and</strong> bad news that you think are the mostimportant.dwindling in some areas because of unsustainablecutting) <strong>and</strong> flowing water to dependence on machinesrunning on nonrenewable fossil fuels (first coal<strong>and</strong> later oil <strong>and</strong> natural gas). This led to a switchfrom small-scale, localized production of h<strong>and</strong>madegoods to large-scale production of machine-madegoods in centralized factories in rapidly growing industrialcities.Factory towns grew into cities as rural peoplecame to the factories for work. There they worked longhours under noisy, dirty, <strong>and</strong> hazardous conditions.Other workers toiled in dangerous coal mines.In early industrial cities, coal smoke belchingfrom chimneys was so heavy that many people diedof lung ailments. Ash <strong>and</strong> soot covered everything,<strong>and</strong> some days the smoke was thick enough to blotout the sun.Fossil fuel–powered farm machinery, commercialfertilizers, <strong>and</strong> new plant-breeding techniques increasedcrop yields per acre. This helped protect biodiversityby reducing the need to exp<strong>and</strong> the area ofcropl<strong>and</strong>. Because fewer farmers were needed, morepeople migrated to cities. With a larger <strong>and</strong> more reliablefood supply <strong>and</strong> longer life spans, the humanpopulation began the sharp increase that continuestoday.Figure 2-4 lists some of the beneficial (good news)<strong>and</strong> harmful (bad news) effects of the advanced industrial–medicalrevolution.How Might the Information <strong>and</strong> GlobalizationRevolution Affect the Environment?Information Blessing or InformationOverload?Global access to information can help us underst<strong>and</strong><strong>and</strong> respond to environmental problemsbut can lead to confusion from informationoverload.Good NewsMass productionof useful <strong>and</strong>affordableproductsHigher st<strong>and</strong>ardof living for manyGreatly increasedagriculturalproductionLower infantmortalityLonger lifeexpectancyIncreasedurbanizationLower rate ofpopulation growthT rade-OffsIndustrial–Medical RevolutionBad NewsIncreased airpollutionIncreased waterpollutionIncreased wasteproductionSoil depletion <strong>and</strong>degradationGroundwaterdepletionHabitatdestruction <strong>and</strong>degradationBiodiversitydepletionFigure 2-4 Trade-offs: good <strong>and</strong> bad news about the effectsof the advanced industrial revolution. Pick the single pieces ofgood news <strong>and</strong> bad news that you think are the most important.http://biology.brookscole.com/miller1423
T rade-OffsInformation–Globalization RevolutionGood NewsComputergeneratedmodels<strong>and</strong> maps of theearth’senvironmentalsystemsRemote-sensingsatellite surveysof the world’senvironmentalsystemsAbility to respondto environmentalproblems moreeffectively <strong>and</strong>rapidlyBad NewsInformationoverload cancause confusion<strong>and</strong> sense ofhopelessnessGlobalizedeconomy canincreaseenvironmentaldegradation byhomogenizing theearth’s surfaceGlobalizedeconomy c<strong>and</strong>ecrease culturaldiversityFigure 2-5 Trade-offs: good <strong>and</strong> bad news about the effectsof this latest cultural revolution. Pick the single pieces of goodnews <strong>and</strong> bad news that you think are the most important.Since 1950, <strong>and</strong> especially since 1970, we have begunmaking a new cultural shift called the information<strong>and</strong> globalization revolution. It is based on using newtechnologies for gaining rapid access to much moreinformation on a global scale. These technologies includethe telephone, radio, television, computers, theInternet, automated databases, <strong>and</strong> remote-sensingsatellites. Figure 2-5 lists some of the possible beneficial<strong>and</strong> harmful effects of the information <strong>and</strong> globalizationrevolution.2-2 ENVIRONMENTAL HISTORYOF THE UNITED STATES: THE TRIBALAND FRONTIER ERASWhat Happened during the Tribal Era?Sustainable LivingNative Americans living in North America for at least10,000 years had a fairly low environmental impact.The environmental history of the United States can bedivided into four eras: tribal, frontier, conservation, <strong>and</strong>environmental.During the tribal era, North America was occupiedby 5–10 million tribal people for at least 10,000 years be-fore European settlers began arriving in the early 1600s.These indigenous people were called Indians by theEuropeans <strong>and</strong> now are often called Native Americans.They practiced hunting <strong>and</strong> gathering, burned <strong>and</strong>cleared fields, <strong>and</strong> planted crops. Because of their smallpopulations <strong>and</strong> simple technology, they had a fairlylow environmental impact.With some exceptions, most Native American cultureshad a deep respect for the l<strong>and</strong> <strong>and</strong> its animals<strong>and</strong> did not believe in l<strong>and</strong> ownership, as indicated bythe following quotation:My people, the Blackfeet Indians, have always had asense of reverence for nature that made us want tomove through the world carefully, leaving as littlemark behind as possible. (Jamake Highwater, Blackfoot)What Happened During the Frontier Era(1607–1890)? Taking Over a ContinentEuropean settlers saw the continent as a vastfrontier to conquer <strong>and</strong> settle.The frontier era began in the early 1600s when Europeancolonists began settling North America. The earlycolonists developed a frontier environmental worldview.They viewed most of the continent as having vast<strong>and</strong> seemingly inexhaustible resources <strong>and</strong> as a hostile<strong>and</strong> dangerous wilderness to be conquered <strong>and</strong> managedfor human use.The government set up by European settlers conqueredNative American tribes, took over the l<strong>and</strong>,<strong>and</strong> urged people to spread across the continent. Thetransfer of vast areas of public l<strong>and</strong> to private interestsaccelerated the settling of the continent.This frontier environmental view prevailed formore than 280 years, until the government declaredthe frontier officially closed in 1890. However, thisworldview that there is always another frontier to conquerremains as an important part of American culturetoday.2-3 ENVIRONMENTAL HISTORYOF THE UNITED STATES: THEEARLY CONSERVATION ERA(1832–1960)What Happened between (1832–70)?Ignored WarningsA few people warned Americans that theywere degrading their resource base, but fewlistened.Between 1832 <strong>and</strong> 1870, some people became alarmedat the scope of resource depletion <strong>and</strong> degradation inthe United States. They urged that part of the unspoiledwilderness on public l<strong>and</strong>s—owned jointly by24 CHAPTER 2 <strong>Environmental</strong> History: Learning from the Past
Figure 2-8 Theodore (“Teddy”)Roosevelt (1858– 1919) wasa writer, explorer, naturalist,avid birdwatcher, <strong>and</strong>26th president of theUnited States. He wasthe first national politicalfigure to bring theissues of conservationto the attention ofthe American public.According to manyhistorians, he hascontributed more thanany other president tonatural resource conservationin the UnitedStates.In 1907, Congress became upset because Roosevelthad added vast tracts to the forest reserves <strong>and</strong>banned further executive withdrawals of publicforests. On the day before the bill became law, Rooseveltdefiantly reserved another 6.5 million hectares(16 million acres). Most environmental historians viewRoosevelt (a Republican) as the country’s best environmentalpresident.In 1916, Congress passed the National Park ServiceAct. It declared that parks are to be maintained in amanner that leaves them unimpaired for future generations.The Act also established the National ParkService (within the Department of the Interior) to managethe system.After World War I, the country entered a new eraof economic growth <strong>and</strong> expansion. During theHarding, Coolidge, <strong>and</strong> Hoover administrations, thefederal government promoted increased resource removalfrom public l<strong>and</strong>s at low prices to stimulate economicgrowth.President Hoover (a Republican) went even further<strong>and</strong> proposed that the federal government returnall remaining federal l<strong>and</strong>s to the states or sell them toprivate interests for economic development. But theGreat Depression (1929–41) made owning such l<strong>and</strong>sunattractive to state governments <strong>and</strong> private investors.The depression was bad news for the country.But some say that without it we might have little if anypublic l<strong>and</strong>s left today.What Happened between 1930 <strong>and</strong> 1960?Depression <strong>and</strong> WarDuring the economic depression of the 1930s thegovernment bought l<strong>and</strong> <strong>and</strong> hired many workers torestore the country’s degraded environment <strong>and</strong> builddams to supply electricity <strong>and</strong> water.A second wave of national resource conservation <strong>and</strong>improvements in public health began in the early1930s as President Franklin D. Roosevelt (1882–1945)strove to bring the country out of the Great Depression.Figure 2 on p. A4 in Appendix 2 summarizes majorevents during this period. Roosevelt persuaded Congressto enact federal government programs to providejobs <strong>and</strong> restore the country’s degraded environment.The following are examples of these programs.The government purchased large tracts of l<strong>and</strong>from cash-poor l<strong>and</strong>owners, <strong>and</strong> the Civilian ConservationCorps (CCC) was established in 1933. It put 2 millionunemployed people to work planting trees <strong>and</strong>developing <strong>and</strong> maintaining parks <strong>and</strong> recreation areas.The CCC also restored silted waterways <strong>and</strong> builtlevees <strong>and</strong> dams for flood control.The government built <strong>and</strong> operated many largedams in the Tennessee Valley <strong>and</strong> in the arid westernstates, including Hoover Dam on the Colorado River.The goals were to provide jobs, flood control, cheap irrigationwater, <strong>and</strong> cheap electricity for industry.Many environmental historians praise Roosevelt(a Democrat) for his efforts to get the country out of amajor economic depression <strong>and</strong> restore past environmentaldegradation.Federal resource conservation <strong>and</strong> public healthpolicy during the 1940s <strong>and</strong> 1950s changed little,mostly because of preoccupation with World War II(1941–45) <strong>and</strong> economic recovery after the war.2-4 ENVIRONMENTAL HISTORYOF THE UNITED STATES: THEENVIRONMENTAL ERA (1960–2004)What Happened during the 1960s? An <strong>Environmental</strong>AwakeningThe modern environmental movement began <strong>and</strong>more citizens urged government to improve environmentalquality.A number of milestones in American environmentalhistory occurred during the 1960s, as summarized inFigure 3 on p. A5 in Appendix 2. In 1962, biologistRachel Carson (1907–64) published Silent Spring, whichdocumented the pollution of air, water, <strong>and</strong> wildlifefrom pesticides such as DDT (Individuals Matter,right). This influential book helped broaden the conceptof resource conservation to include preservationof wildlife <strong>and</strong> the quality of the air, water, <strong>and</strong> soil.Many historians mark Carson’s wake-up call asthe beginning of the modern environmental move-26 CHAPTER 2 <strong>Environmental</strong> History: Learning from the Past
Rachel CarsonINDIVIDUALSMATTERRachel Carson(Figure 2-A) beganher professionalcareer as a biologistfor the Bureauof U.S. Fisheries(later the U.S. Fish <strong>and</strong> WildlifeService). In that capacity, she carriedout research on oceanography <strong>and</strong>marine biology <strong>and</strong> wrote articlesabout the oceans <strong>and</strong> topics relatedto the environment.In 1951, she wrote The Sea AroundUs, which described in easily underst<strong>and</strong>ableterms the natural historyof oceans <strong>and</strong> how humanswere harming them. This book soldmore than 2 million copies, wastranslated into 32 languages, <strong>and</strong>won a National Book Award.During the late 1940s <strong>and</strong>throughout the 1950s, DDT <strong>and</strong> relatedcompounds were increasinglyused to kill insects that ate foodcrops, attacked trees, bothered people,<strong>and</strong> transmitted diseases suchas malaria.In 1958, DDT was sprayed tocontrol mosquitoes near the home<strong>and</strong> private bird sanctuary of one ofRachel Carson’s friends. After thespraying, her friend witnessed theagonizing deaths of several birds.She begged Carson to find someoneto investigate the effects of pesticideson birds <strong>and</strong> other wildlife.Carson decided to look into theissue herself <strong>and</strong> found that independentresearch on the environmentaleffects of pesticides wasalmost nonexistent. As a welltrainedscientist, she surveyed thescientific literature, became convincedthat pesticides could harmwildlife <strong>and</strong> humans, <strong>and</strong> methodicallydeveloped information aboutthe harmful effects of widespreaduse of pesticides.In 1962, she published her findingsin Silent Spring, an allusion tothe silencing of “robins, catbirds,doves, jays, wrens, <strong>and</strong> scores ofother bird voices” because of theirexposure to pesticides.Many scientists, politicians,<strong>and</strong> policy makersread Silent Spring,<strong>and</strong> the public embracedit. But manufacturersofchemicals viewedthe book as a seriousthreat to theirbooming pesticidesales <strong>and</strong> mountedacampaign to discredither. A parade ofcritical reviewers <strong>and</strong>industry scientists claimed her bookwas full of inaccuracies, made selective<strong>and</strong> biased use of research findings,<strong>and</strong> failed to give a balancedaccount of the benefits of pesticides.Some critics even claimed that,as a woman, she was incapable ofunderst<strong>and</strong>ing such a highly scientific<strong>and</strong> technical subject. Otherscharged that she was a hystericalwoman <strong>and</strong> a radical nature lovertrying to scare the public in order tosell books.During these intense attacks,Carson was suffering from terminalcancer. Yet she strongly defendedher research <strong>and</strong> countered her critics.She died in 1964—18 monthsafter the publication of SilentSpring—without knowing thatmany historians considerher work an importantcontribution to themodern environmentalmovement thenemerging in theUnited States.Figure 2-A Rachel Carson(1907–1964)ment in the United States. It flourished when agrowing number of citizens organized to dem<strong>and</strong> thatpolitical leaders enact laws <strong>and</strong> develop policies tocurtail pollution, clean up polluted environments,<strong>and</strong> protect unspoiled areas from environmentaldegradation.In 1964 Congress passed the Wilderness Act, inspiredby the vision of John Muir more than 80 yearsearlier. It authorized the government to protect undevelopedtracts of public l<strong>and</strong> as part of the NationalWilderness System, unless Congress later decides theyare needed for the national good. L<strong>and</strong> in this systemis to be used only for nondestructive forms of recreationsuch as hiking <strong>and</strong> camping.Between 1965 <strong>and</strong> 1970, the emerging science ofecology received widespread media attention. At thesame time, the popular writings of biologists such asPaul Ehrlich, Barry Commoner, <strong>and</strong> Garrett Hardin awakenedpeople to the interlocking relationships amongpopulation growth, resource use, <strong>and</strong> pollution.During that period, a number of events increasedpublic awareness of pollution. The public also becameaware that pollution <strong>and</strong> loss of habitat were endangeringwell-known wildlife species such as the NorthAmerican bald eagle, grizzly bear, whooping crane,<strong>and</strong> peregrine falcon.During the 1969 U.S. Apollo mission to the moon,astronauts photographed the earth from space. This allowedpeople to see the earth as a tiny blue <strong>and</strong> whiteplanet in the black void of space <strong>and</strong> led to the developmentof the spaceship-earth environmental worldview.It reminded us that we live on a marvelous planetaryspaceship (Terra I) that we should not harm because itis the only home we have.http://biology.brookscole.com/miller1427
What Happened during the 1970s? The<strong>Environmental</strong> DecadeIncreased awareness <strong>and</strong> public concern led Congressto pass a number of laws to improve environmentalquality <strong>and</strong> conserve more of the nation’s naturalresources.During the 1970s, media attention, public concernabout environmental problems, scientific research, <strong>and</strong>action to address these concerns grew rapidly. Figure 4on p. A6 of Appendix 2 summarizes major environmentalevents during this period, which is sometimescalled the first decade of the environmentThe first annual Earth Day was held on April 20,1970. During this event, proposed by Senator GaylordNelson (born 1916), some 20 million people in morethan 2,000 communities took to the streets to heightenawareness <strong>and</strong> to dem<strong>and</strong> improvements in environmentalquality.Republican President Richard Nixon (1913–94) respondedto the rapidly growing environmental movement.He established the <strong>Environmental</strong> ProtectionAgency (EPA) in 1970 <strong>and</strong> supported passage of theEndangered Species Act of 1973. This greatly strengthenedthe role of the federal government in protectingendangered species <strong>and</strong> their habitats.In 1978, the Federal L<strong>and</strong> Policy <strong>and</strong> Management Actgave the Bureau of L<strong>and</strong> Management (BLM) its first realauthority to manage the public l<strong>and</strong> under its control,85% of which is in 12 western states. This law angereda number of western interests whose use of these publicl<strong>and</strong>s was restricted for the first time.In response, a coalition of ranchers, miners, loggers,developers, farmers, some elected officials, <strong>and</strong>others launched a political campaign known as thesagebrush rebellion. It had two major goals. One was tosharply reduce government regulation of the use ofpublic l<strong>and</strong>s. The other was to remove most publicl<strong>and</strong>s in the western United States from federal ownership<strong>and</strong> management <strong>and</strong> turn them over to the states.Then the plan was to persuade state legislatures to sellor lease the resource-rich l<strong>and</strong>s at low prices to ranching,mining, timber, l<strong>and</strong> development, <strong>and</strong> other privateinterests. This represented a return to PresidentHoover’s plan to turn all public l<strong>and</strong> over to privateownership that was thwarted by the Great Depression.Jimmy Carter (a Democrat, born 1924), president between1977 <strong>and</strong> 1981, was very responsive to environmentalconcerns. He persuaded Congress to create theDepartment of Energy to develop a long-range energystrategy to reduce the country’s heavy dependence onimported oil. He appointed respected environmentaliststo key positions in environmental <strong>and</strong> resourceagencies <strong>and</strong> consulted with environmental leaders onenvironmental <strong>and</strong> resource policy matters.In 1980, Carter helped create a Superfund as part ofthe Comprehensive Environment Response, Compensation,<strong>and</strong> Liability Act to clean up ab<strong>and</strong>oned hazardouswaste sites, including the Love Canal near NiagaraFalls, New York. Carter also used the Antiquities Actof 1906 to triple the amount of l<strong>and</strong> in the NationalWilderness System <strong>and</strong> double the area in theNational Park System (primarily by adding vast tractsin Alaska).What Happened during the 1980s? <strong>Environmental</strong>BacklashAn anti-environmental movement formed toweaken or do away with many of the environmentallaws passed in the 1960s <strong>and</strong> 1970s <strong>and</strong> to destroythe political effectiveness of the environmentalmovement.Figure 5 on p. A6 in Appendix 2 summarizes some keyenvironmental events during the 1980s that shapedU.S. environmental policy. During this decade, farmers<strong>and</strong> ranchers <strong>and</strong> leaders of the oil, automobile,mining, <strong>and</strong> timber industries strongly opposed manyof the environmental laws <strong>and</strong> regulations developedin the 1960s <strong>and</strong> 1970s. They organized <strong>and</strong>funded a strong anti-environmental movement that persiststoday.In 1981, Ronald Reagan (a Republican, born 1911),a self-declared sagebrush rebel <strong>and</strong> advocate of lessfederal control, became president. During his 8 yearsin office he angered environmentalists by appointingto key federal positions people who opposed most existingenvironmental <strong>and</strong> public l<strong>and</strong> use laws <strong>and</strong>policies.Reagan greatly increased private energy <strong>and</strong> mineraldevelopment <strong>and</strong> timber cutting on public l<strong>and</strong>s.He also drastically cut federal funding for research onenergy conservation <strong>and</strong> renewable energy resources<strong>and</strong> eliminated tax incentives for residential solar energy<strong>and</strong> energy conservation enacted during theCarter administration. In addition, he lowered automobilegas mileage st<strong>and</strong>ards <strong>and</strong> relaxed federal air<strong>and</strong> water quality pollution st<strong>and</strong>ards.Although Reagan was immensely popular, manypeople strongly opposed his environmental <strong>and</strong> resourcepolicies. This resulted in strong opposition inCongress, public outrage, <strong>and</strong> legal challenges by environmental<strong>and</strong> conservation organizations, whosememberships soared during this period.In 1988, an industry-backed anti-environmentalcoalition called the wise-use movement was formed. Itsmajor goals were to weaken or repeal most of thecountry’s environmental laws <strong>and</strong> regulations <strong>and</strong>destroy the effectiveness of the environmental movementin the United States. Politically powerful coal,28 CHAPTER 2 <strong>Environmental</strong> History: Learning from the Past
have the United States become the world leader inmaking this the environmental century.2-5 CASE STUDY: ALDO LEOPOLDAND HIS LAND ETHICWho Was Aldo Leopold? Teacher,Conservationist, <strong>and</strong> Proponent of L<strong>and</strong>EthicsAldo Leopold played a major role in educatingus about the need for conservation <strong>and</strong> providingethical guidelines for our actions in nature.Aldo Leopold (Figure 2-9) is best known as a strong proponentof l<strong>and</strong> ethics, a philosophy in which humans aspart of nature have an ethical responsibility to preservewild nature.After earning a master’s degree in forestry fromYale University, he joined the U.S. Forest Service. Hebecame alarmed by overgrazing <strong>and</strong> l<strong>and</strong> deteriorationon public l<strong>and</strong>s where he worked, <strong>and</strong> was convincedthe United States was losing too much of itsmostly untouched wilderness.In 1933, Leopold became a professor at the Universityof Wisconsin <strong>and</strong> founded the profession of gamemanagement. In 1935, he was one of the founders ofthe Wilderness Society.He was a keen student of nature as he took longwalks in the countryside. As years passed, he developeda deep underst<strong>and</strong>ing <strong>and</strong> appreciation forwildlife <strong>and</strong> urged us to include nature in our ethicalconcerns. Through his writings <strong>and</strong> teachings he becameone of the founders of the conservation <strong>and</strong> environmentalmovements of the 20th century. In doing this,he laid important groundwork for the field of environmentalethics.Leopold died in 1948 while fighting a brush fire ata neighbor’s farm in central Wisconsin. His weekendsof planting, hiking, <strong>and</strong> observing nature at his farm inFigure 2-9 Aldo Leopold(1887–1948) was aforester, writer, <strong>and</strong>conservationist. Hisbook A S<strong>and</strong> CountyAlmanac (publishedafter his death) isconsidered an environmentalclassicthat inspired the modernenvironmentalmovement. His l<strong>and</strong>ethic exp<strong>and</strong>ed the roleof humans as protectors ofnature.Wisconsin provided material for his most famousbook, A S<strong>and</strong> County Almanac, published after hisdeath in 1949. Since then more than 2 million copies ofthis important book have been sold.What Is Leopold’s Concept of L<strong>and</strong> Ethics?Work with NatureWe need to become plain citizens of the earth insteadof its conquerors.The following quotations from his writings reflectLeopold’s l<strong>and</strong> ethic, <strong>and</strong> they form the basis for manyof the beliefs of the modern environmental wisdom worldview(p. 17).All ethics so far evolved rest upon a singlepremise: that the individual is a member of a communityof interdependent parts.That l<strong>and</strong> is a community is the basic concept ofecology, but that l<strong>and</strong> is to be loved <strong>and</strong> respected is anextension of ethics.The l<strong>and</strong> ethic changes the role of Homo sapiensfrom conqueror of the l<strong>and</strong>-community to plain member<strong>and</strong> citizen of it.We abuse l<strong>and</strong> because we regard it as a commoditybelonging to us. When we see l<strong>and</strong> as a communityto which we belong, we may begin to use it with love<strong>and</strong> respect.Anything is right when it tends to preserve the integrity,stability, <strong>and</strong> beauty of the biotic community.It is wrong when it tends otherwise.Thank God, they cannot cut down the clouds!HENRY DAVID THOREAUCRITICAL THINKING1. What three major things would you do to reduce theharmful environmental impacts of advanced industrialsocieties?2. What one person do you believe has made the greatest<strong>and</strong> longest lasting contribution to the conservation <strong>and</strong>environmental movements in the United States (or in thecountry where you live)? Explain.3. Public forests, grassl<strong>and</strong>s, wildlife reserves, parks, <strong>and</strong>wilderness areas are owned by all citizens <strong>and</strong> managedfor them by federal <strong>and</strong> state governments in the UnitedStates. In terms of the management policies for most ofthese l<strong>and</strong>s, would you classify yourself as (a) a preservationist,(b) a conservationist, or (c) an advocate of transferringmost public l<strong>and</strong>s to private enterprise? Explain.4. Do you favor or oppose efforts to greatly weaken orrepeal most environmental laws in the United States (orin the country where you live)? Explain.5. Some analysts believe the world’s remaininghunter–gatherer societies should be given title to the l<strong>and</strong>30 CHAPTER 2 <strong>Environmental</strong> History: Learning from the Past
on which they <strong>and</strong> their ancestors have lived for centuries<strong>and</strong> should be left alone by modern civilization.They contend that we have created protected reserves forendangered wild species, so why not create reserves forthese endangered human cultures? What do you think?Explain.PROJECTS1. What major changes (such as a change from agriculturalto industrial, from rural to urban, or changesin population size, pollution, <strong>and</strong> environmentaldegradation) have taken place in your locale during thepast 50 years? On balance, have these changes improvedor decreased (a) the quality of your life <strong>and</strong> (b) the qualityof life for members of your community as a whole?2. Use the library or Internet to summarize the major accomplishmentsof the anti-environmental movement inthe United States between 1980 <strong>and</strong> 2005.3. Use the library or Internet to find bibliographic informationabout Ernest Hemingway <strong>and</strong> Henry David Thoreau,whose quotes appear at the beginning <strong>and</strong> end of thischapter.4. Make a concept map of this chapter’s major ideasusing the section heads, subheads, <strong>and</strong> key terms (inboldface type). Look on the website for this book for informationabout making concept maps.LEARNING ONLINEThe website for this book contains study aids <strong>and</strong> manyideas for further reading <strong>and</strong> research. They include achapter summary, review questions for the entire chapter,flash cards for key terms <strong>and</strong> concepts, a multiple-choicepractice quiz, interesting Internet sites, references, <strong>and</strong> aguide for accessing thous<strong>and</strong>s of InfoTrac ® CollegeEdition articles. Log on tohttp://biology.brookscole.com/miller14Then click on the Chapter-by-Chapter area, choose Chapter2, <strong>and</strong> select a learning resource.http://biology.brookscole.com/miller1431
3Science,Systems,Matter, <strong>and</strong> EnergyAirWaterSoilEnergyMineralsCASE STUDYAn <strong>Environmental</strong> Lessonfrom Easter Isl<strong>and</strong>Easter Isl<strong>and</strong> (Rapa Nui) is a small, isolated isl<strong>and</strong> inthe great expanse of the South Pacific. Polynesiansused double-hulled sea-going canoes to colonize thisisl<strong>and</strong> about 2,500 years ago. They brought along theirpigs, chickens, dogs, stowaway rats, taro roots, yams,bananas, <strong>and</strong> sugarcane.Evidence from pollen grains found in the soil <strong>and</strong>lake sediments <strong>and</strong> in artifacts shows that the isl<strong>and</strong>was abundantly forested with a variety of trees—includingbasswoods (called hauhau) <strong>and</strong> giant palms.The Polynesians developed a civilization based on theisl<strong>and</strong>’s trees. The towering palm trees were used forshelter, tools, <strong>and</strong> fishing boats. Hauhau trees werefelled <strong>and</strong> burned to cook <strong>and</strong> keep warm in the isl<strong>and</strong>’scool winters, <strong>and</strong> rope was made from thetree’s fibers. L<strong>and</strong> was also cleared of trees to planttaro, sugarcane, bananas, <strong>and</strong> yams.Using these abundant tree resources, thePolynesians developed an impressive civilization.They also developed a technology capable of making<strong>and</strong> moving large stone structures, including theirfamous statues (Figure 3-1). The people flourished,with the population peaking at somewhere between7,000 <strong>and</strong> 20,000 by 1400. However, they used up theisl<strong>and</strong>’s precious trees faster than they were regenerated—anexample of the tragedy of the commons.By 1600, only a few small trees were left.Without large trees, the isl<strong>and</strong>ers could notbuild their traditional big canoes for huntingporpoises <strong>and</strong> catching fish in deeper offshorewaters, <strong>and</strong> no one could escape the isl<strong>and</strong> by boat.Without the once-great forests to absorb <strong>and</strong> slowlyrelease water, springs <strong>and</strong> streams dried up, exposedsoils eroded, crop yields plummeted, <strong>and</strong> faminestruck. There was no firewood for cooking or keepingwarm. The hungry isl<strong>and</strong>ers ate all of the isl<strong>and</strong>’sbirds. Then they began raising <strong>and</strong> eating rats, descendantsof hitchhikers on the first canoes.Both the population <strong>and</strong> the civilization collapsedas gangs fought one another for dwindling food supplies.Bone evidence indicates that the isl<strong>and</strong>ers beganhunting <strong>and</strong> eating one another.Dutch explorers reached the isl<strong>and</strong> on Easter Day,1722, perhaps 1,000 years after the first Polynesians hadl<strong>and</strong>ed. They found about 2,000 hungry Polynesians,living in caves on a shrubby grassl<strong>and</strong>.Like Easter Isl<strong>and</strong> at its peak, the earth is an isolatedisl<strong>and</strong> in the vastness of space with no othersuitable planet to migrate to. As on Easter Isl<strong>and</strong>, ourpopulation <strong>and</strong> resource consumption are growing<strong>and</strong> our resources are finite.Will the humans on Earth Isl<strong>and</strong> re-create thetragedy of Easter Isl<strong>and</strong> on a gr<strong>and</strong>er scale, or will welearn how to live more sustainably on this planet thatis our only home? Scientific knowledge is a key tolearning how to live more sustainably. Thus we needto know what science is, underst<strong>and</strong> the behavior ofcomplex systems studied by scientists, <strong>and</strong> have abasic knowledge of the nature of the matter <strong>and</strong> energythat make up the earth’s living <strong>and</strong> nonlivingresources, as discussed in this chapter.Figure 3-1 These massive stone figures on Easter Isl<strong>and</strong>are the remains of the technology created by an ancientcivilization of Polynesians. <strong>Their</strong> civilization collapsed becausethe people used up the trees (especially largepalm trees) that were the basis of their livelihood. Morethan 200 of these stone statues once stood on hugestone platforms lining the coast. At least 700 additionalstatues were found turned over, ab<strong>and</strong>oned in rock quarriesor on ancient roads between the quarries <strong>and</strong> thecoast. No one knows how the early isl<strong>and</strong>ers (with nowheels, no draft animals, <strong>and</strong> no sources of energy otherthan their own muscles) transported these gigantic structuresfor miles before erecting them. We presume theyaccomplished it by felling large trees <strong>and</strong> using them toroll <strong>and</strong> erect the statues.
Science is an adventure of the human spirit. It is essentiallyan artistic enterprise, stimulated largely by curiosity, servedlargely by disciplined imagination, <strong>and</strong> based largely on faithin the reasonableness, order, <strong>and</strong> beauty of the universe.WARREN WEAVERThis chapter addresses the following questions:Ask a questionDo experiments<strong>and</strong> collect dataInterpret data■What is science, <strong>and</strong> what do scientists do?■■What are major components <strong>and</strong> behaviors of complexsystems?What are the basic forms of matter? What makesmatter useful to us as a resource?Formulate hypothesisto explain dataWell-tested <strong>and</strong>accepted patternsin data becomescientific laws■What are the major forms of energy? What makesenergy useful to us as a resource?Do more experimentsto test hypothesis■■What scientific law governs changes of matter fromone physical or chemical form to another?What three main types of nuclear changes can matterundergo?Revise hypothesisif necessary■■What are two scientific laws governing changes ofenergy from one form to another?How are the scientific laws governing changes ofmatter <strong>and</strong> energy from one form to anotherrelated to resource use <strong>and</strong> environmentaldegradation?Well-tested <strong>and</strong>acceptedhypothesesbecomescientific theoriesFigure 3-2 What scientists do.3-1 THE NATURE OF SCIENCEWhat Is Science <strong>and</strong> What Do Scientists Do?Searching for Order in NatureScientists collect data, form hypotheses, <strong>and</strong> developtheories, models, <strong>and</strong> laws about how nature works.Science is an attempt to discover order in the naturalworld <strong>and</strong> use that knowledge to describe what islikely to happen in nature. Its goal is to increase our underst<strong>and</strong>ingof the natural world. Science is based onthe fundamental assumption that events in the naturalworld follow orderly patterns that can be understoodthrough careful observation <strong>and</strong> experimentation.Figure 3-2 summarizes the scientific process. Tracethe pathways in this figure.The first thing scientists do is ask a question oridentify a problem to be investigated. Then they collectscientific data, or facts, related to the problem or question,by making observations <strong>and</strong> measurements. Theyoften conduct experiments to study some phenomenonunder known conditions. The resulting scientificdata or facts must be confirmed by repeated observations<strong>and</strong> measurements, ideally by several differentinvestigators.The primary goal of science is not the data or factsthemselves. Instead science seeks new ideas, principles,or models that connect <strong>and</strong> explain certain scientificdata <strong>and</strong> descriptions of what is likely to happenin nature. Scientists working on a particular problemtry to come up with a variety of possible explanations,or scientific hypotheses, of what they (or other scientists)observe in nature. A scientific hypothesis is anunconfirmed explanation of an observed phenomenonthat can be tested by further research.One method scientists use to test a hypothesis isto develop a model, an approximate or simplified representationor simulation of a system being studied. Itmay be an actual working model, a mental model, apictorial model, a computer model, or a mathematicalmodel.Three important features of the scientific processare skepticism, reproducibility, <strong>and</strong> peer review of resultsby other scientists. Scientists tend to be highly skepticalof any new data or hypotheses until they can beconfirmed or verified.Peers, or scientists working in the same field,check for reproducibility by repeating <strong>and</strong> checkingout one another’s work to see if the data can be reproduced<strong>and</strong> whether proposed hypotheses are reasonable<strong>and</strong> useful.Peer review happens when scientists openly publishdetails of the methods they used, the results ofhttp://biology.brookscole.com/miller1433
their experiments, <strong>and</strong> the reasoning behind theirhypotheses. This process of publishing one’s work forother scientists to examine <strong>and</strong> criticize helps keep scientistshonest <strong>and</strong> reduces bias.If repeated observations <strong>and</strong> measurements ortests using models support a particular hypothesis ora group of related hypotheses, the hypothesis becomesa scientific theory. In other words, a scientifictheory is a verified, credible, <strong>and</strong> widely acceptedscientific hypothesis or a related group of scientifichypotheses.To scientists, scientific theories are not to be takenlightly. They are not guesses, speculations, or suggestions.Instead, they are useful explanations of processesor natural phenomena that have a high degreeof certainty because they are supported by extensiveevidence.New evidence or a better explanation may modify,or in rare cases overturn, a particular scientific theory.But unless or until this happens, a scientific theory isthe best <strong>and</strong> most reliable knowledge we have abouthow nature works.Nonscientists often use the word theory incorrectlywhen they mean to refer to a scientific hypothesis, a tentativeexplanation or educated guess that needs furtherevaluation. The statement, “Oh, that’s just a theory,”made in everyday conversation, implies a lack ofknowledge <strong>and</strong> careful testing—the opposite of the scientificmeaning of the word.Another important result of science is a scientific,or natural, law: a description of what we find happeningin nature over <strong>and</strong> over in the same way. For example,after making thous<strong>and</strong>s of observations <strong>and</strong>measurements over many decades, scientists formulatedthe second law of thermodynamics. Simply stated,this law says that heat always flows spontaneouslyfrom hot to cold—something you learned the first timeyou touched a hot object. A scientific law is no betterthan the accuracy of the observations or measurementsupon which it is based. But if the data are accurate,a scientific law cannot be broken.How Do Scientists Learn about Nature?Follow Many PathsThere are many scientific methods.We often hear about the scientific method. In reality,many scientific methods exist: they are ways in whichscientists gather data <strong>and</strong> formulate <strong>and</strong> test scientifichypotheses, models, theories, <strong>and</strong> laws.Here is an example of applying the scientificprocess to an everyday situation:Observation: You switch on your trusty flashlight<strong>and</strong> nothing happens.Question: Why did the light not come on?Hypothesis: Maybe the batteries are bad.Test the hypothesis: Put in new batteries <strong>and</strong> switchon the flashlight .Result: Flashlight still does not work.New hypothesis: Maybe the bulb is burned out.Experiment: Replace bulb with a new bulb.Result: Flashlight works when switched on.Conclusion: Second hypothesis is verified.Situations in nature are usually much more complicatedthan this. Many variables or factors influencemost processes or parts of nature that scientists seek tounderst<strong>and</strong>. Ideally, scientists conduct a controlled experimentto isolate <strong>and</strong> study the effect of a single variable.To do such single-variable analysis, scientists set uptwo groups. One is an experimental group in which thechosen variable is changed in a known way. The otheris a control group in which the chosen variable is notchanged. If the experiment is designed properly, anydifference between the two groups should result fromthe variable that was changed in the experimentalgroup (see Connections, right).A basic problem is that many of the problemsenvironmental scientists investigate involve a hugenumber of interacting variables. This limitation issometimes overcome by using multivariable analysis—running mathematical models on high-speed computersto analyze the interactions of many variableswithout having to carry out traditional controlledexperiments.What Types of Reasoning Do Scientists Use?Bottom-Up <strong>and</strong> Top-Down ReasoningScientists use inductive reasoning to convert observations<strong>and</strong> measurements to a general conclusion<strong>and</strong> deductive reasoning to convert a generalizationto a specific conclusion.Scientists arrive at certain conclusions with varyingdegrees of certainty by using inductive <strong>and</strong> deductivereasoning. Inductive reasoning involves using specificobservations <strong>and</strong> measurements to arrive at ageneral conclusion or hypothesis. It is a form of “bottom-up”reasoning that involves going from the specificto the general. For example, suppose we observe that avariety of different objects fall to the ground when wedrop them from various heights. We might then use inductivereasoning to conclude that all objects fall to theearth’s surface when dropped. Depending on the numberof observations made, there may be a high degree ofcertainty in this conclusion. However, what we are reallysaying is that “All objects that we or other observershave dropped from various heights fall to theearth’s surface.” Although it is extremely unlikely, weCONNECT34 CHAPTER 3 Science, Systems, Matter, <strong>and</strong> Energy
CTIONSWhat Is Harmingthe Robins?Suppose a scientist observes anabnormality in the growth ofrobin embryos in a certain area.CONNECTIONS She knows the area has beensprayed with a pesticide <strong>and</strong> suspectsthe chemical may be causing the abnormalitiesshe has observed.To test this hypothesis, the scientist carries out acontrolled experiment. She maintains two groups ofrobin embryos of the same age in the laboratory.Each group is exposed to exactly the same conditionsof light, temperature, food supply, <strong>and</strong> so on,except the embryos in the experimental group areexposed to a known amount of the pesticide inquestion.The embryos in both groups are then examinedover an identical period of time for the abnormality.If she finds a significantly larger number of theabnormalities in the experimental group than inthe control group, the results support the idea thatthe pesticide is the culprit.To be sure no errors occur during the procedure,the original researcher should repeat the experimentseveral times. Ideally one or more otherscientists should repeat the experimentindependently.Critical ThinkingCan you find flaws in this experiment that mightlead you to question the scientist’s conclusions?(Hint: What other factors in nature—not the laboratory—<strong>and</strong>in the embryos themselves could possiblyexplain the results?)cannot be absolutely sure someone will drop an objectthat does not fall to the earth’s surface.Deductive reasoning involves using logic to arriveat a specific conclusion based on a generalization orpremise. It is a form of “top-down” reasoning that goesfrom the general to the specific. For example,Generalization or premise: All birds have feathers.Example: Eagles are birds.Deductive conclusion: All eagles have feathers.The conclusion of this syllogism (a series of logicallyconnected statements) is valid as long as the premise iscorrect <strong>and</strong> we do not use faulty logic to arrive at theconclusion.Deductive <strong>and</strong> inductive reasoning <strong>and</strong> criticalthinking skills (p. 3) are important scientific tools. Butscientists also try to come up with new or creative ideasto explain some of the things they observe in nature.Often such ideas defy conventional logic <strong>and</strong> currentscientific knowledge. According to physicist AlbertEinstein, “There is no completely logical way to a newscientific idea.” Intuition, imagination, <strong>and</strong> creativityare as important in science as they are in poetry, art,music, <strong>and</strong> other great adventures of the human spirit,as reflected in scientist Warren Weaver’s quotationfound at the opening of this chapter.One of the exciting things about science is that it isnever complete. Each discovery unearths new unansweredquestions in an ongoing quest for knowledgeabout how the natural world works. This is one reasonwhy people choose this profession.How Valid Are the Results of Science?Very Reliable But Not PerfectScientists try to establish that a particular model,theory, or law has a very high probability of beingtrue.Scientists can do two major things. First, they c<strong>and</strong>isprove things. Second, they can establish that a particularmodel, theory, or law has a very high probabilityor degree of certainty of being true. However, likescholars in any field, scientists cannot prove that theirtheories, models, <strong>and</strong> laws are absolutely true.Although it may be extremely low, some degree ofuncertainty is always involved in any scientific theory,model, or law. Most scientists rarely say somethinglike, “Cigarettes cause lung cancer.” Rather, the statementmight be phrased, “There is overwhelmingevidence from thous<strong>and</strong>s of studies that indicate a significantrelationship between cigarette smoking <strong>and</strong>lung cancer.”Most scientists also rarely use the word proof.When scientists hear someone say we should not takea scientific finding seriously because it has not beenabsolutely proven they know that this person eitherknows little about the nature of science or is using adebating or advertising trick to cast doubt on a widelyaccepted scientific finding. Scientists tend to use wordslike projections <strong>and</strong> scenarios to describe what is likely tohappen in nature instead of making predictions or forecastsabout what will happen.What Is the Difference between FrontierScience <strong>and</strong> Sound Science? Preliminary<strong>and</strong> Well-Tested ResultsScientific results fall into those that have not beenconfirmed (frontier science) <strong>and</strong> those that have beenwell tested <strong>and</strong> widely accepted (sound science).News reports about science often focus on two things:new so-called scientific breakthroughs, <strong>and</strong> disputesbetween scientists over the validity of preliminary <strong>and</strong>http://biology.brookscole.com/miller1435
untested data, hypotheses, <strong>and</strong> models. These preliminaryresults, called frontier science, are often controversialbecause they have not been widely tested <strong>and</strong>accepted. At the frontier stage, it is normal <strong>and</strong>healthy for reputable scientists to disagree about themeaning <strong>and</strong> accuracy of data <strong>and</strong> the validity of varioushypotheses.By contrast, sound science, or consensus science,consists of data, theories, <strong>and</strong> laws that are widely acceptedby scientists who are considered experts in thefield involved. The results of sound science are basedon a self-correcting process of open peer review. Oneway to find out what scientists generally agree on is toseek out reports by scientific bodies such as the U.S.National Academy of Sciences <strong>and</strong> the British RoyalSociety, which attempt to summarize consensusamong experts in key areas of science.What Is Junk Science <strong>and</strong> How Can We DetectIt? Look Out for BaloneyJunk science is untested ideas presented as soundscience.Junk science consists of scientific results or hypothesespresented as sound science but not having undergonethe rigors of the peer review process. Note that frontierscience is not necessarily junk science. Instead, it representstentative results or hypotheses that are in theprocess of being validated or rejected by peer review.There are two problems in uncovering junk science.One is that some scientists, politicians, <strong>and</strong> otheranalysts label as junk science any science that does notsupport or further their particular agenda. The other isthat reporters <strong>and</strong> journalists sometimes mislead us inpresenting sound or consensus science along with aquote from a scientist in the field who disagrees withthe consensus view or from one who is not an expert inthe field being discussed. Such attempts to give a falsesense of balance or fairness can mislead the public intodistrusting well-established sound science.Here are some critical thinking questions you canuse to uncover junk science.■ How reliable are the sourcesmaking a particular claim? Do theyhave a hidden agenda? Are they expertsin this field? What is theirsource of funding?■ Do the conclusions follow logicallyfrom the observations?■ Has the claim been verified byimpartial peer review?■ How does the claim comparewith the consensus view of expertsin this field?Inputs(from environment)InformationEnergyMatter3-2 MODELS AND BEHAVIOROF SYSTEMSWhy Are Models of Complex Systems Useful?Using Inputs, Throughputs, <strong>and</strong> Outputsto Make ProjectionsScientists project the behavior of a complexsystem by developing a model of its inputs,throughputs (flows), <strong>and</strong> outputs of matter,energy, <strong>and</strong> information.A system is a set of components that function <strong>and</strong> interactin some regular <strong>and</strong> theoretically underst<strong>and</strong>ablemanner. Most systems have the following key components:inputs from the environment, flows or throughputswithin the system at certain rates, <strong>and</strong> outputs tothe environment (Figure 3-3).Scientists use models or approximate representationsor simulations to find out how systems work <strong>and</strong>to evaluate ideas or hypotheses. Some of the mostpowerful <strong>and</strong> useful technologies invented by humansare mathematical models, which are used tosupplement our mental models. Mathematical modelsconsist of one or more equations used to describe thebehavior of a system <strong>and</strong> to describe how the systemis likely to behave.Making a mathematical model usually requiresgoing many times through three steps. First, make aguess <strong>and</strong> write down some equations. Second, computethe likely behavior of the system implied by theequations. Third, compare the system’s projected behaviorwith observations <strong>and</strong> behavior projected bymental models, existing experimental data, <strong>and</strong> scientifichypotheses, laws, <strong>and</strong> theories.Mathematical models are important because theycan give us improved perceptions <strong>and</strong> projections, especiallyin situations where our mental models areweak <strong>and</strong> unreliable. They are particularly usefulwhen there are many interacting variables, when thetime frame is long, <strong>and</strong> when controlled experimentsare impossible, too slow, or too expensive to conduct.Throughputs(rates of flow)Human Body(inputs may bestored for differentlengths of time)Figure 3-3 Major components of a system such as your body.Outputs(to environment)HeatIdeas<strong>and</strong>actionsWaste<strong>and</strong>pollution36 CHAPTER 3 Science, Systems, Matter, <strong>and</strong> Energy
After building <strong>and</strong> testing a mathematical model,scientists use it to project what is likely to happen undera variety of conditions. In effect, they use mathematicalmodels to answer if–then questions: “If we do such <strong>and</strong>such, then what is likely to happen now <strong>and</strong> in the future?”This process can give us a variety of projectionsor scenarios of possible futures or outcomes based ondifferent assumptions.Despite its usefulness, a mathematical model isnothing more than a set of hypotheses or assumptionsabout how we think a certain system works. Mathematicalmodels (like all other models) are no better thanthe assumptions on which they are built <strong>and</strong> the datafed into them.How Do Feedback Loops Affect Systems?Changing DirectionOutputs of matter, energy, or information fed backinto a system can cause the system to do more ofwhat it was doing (positive feedback) or less(negative feedback).When someone asks you for feedback, they are askingfor information that they can feed back into their mentalprocesses to help them make a decision or carry outsome action. All systems undergo change as a result offeedback loops. A feedback loop occurs when an outputof matter, energy, or information is fed back intothe system as an input <strong>and</strong> leads to changes in thatsystem.A positive feedback loop causes a system tochange further in the same direction. One example involvesdepositing money in a bank at compoundinterest <strong>and</strong> leaving it there. The interest increases thebalance, which through a positive feedback loop leadsto more interest <strong>and</strong> an even higher balance.A negative, or corrective, feedback loop causes asystem to change in the opposite direction. An exampleis recycling aluminum cans. This involves meltingaluminum <strong>and</strong> feeding it back into an economic systemto make new aluminum products. This negativefeedback loop of matter reduces the need to find, extract,<strong>and</strong> process virgin aluminum ore. It also reducesthe flow of waste matter (discarded aluminum cans)into the environment.The temperature-regulating system of your body isan example of a system governed by feedback. Normallya negative feedback loop prevents your bodytemperature from going too high. If you get hot, yourbrain receives this information <strong>and</strong> causes your body tosweat. The evaporation of sweat on your skin removesheat <strong>and</strong> cools your body. However, if your body temperatureexceeds 42°C (108°F), your temperature controlsystem breaks down as your body produces moreheat than your sweat-dampened skin can get rid of.Then a positive feedback loop caused by overloadingthe system overwhelms the negative feedback loop.These conditions produce a net gain in body heat,which produces even more body heat, <strong>and</strong> so on, untilyou die from heatstroke.The tragedy on Easter Isl<strong>and</strong> discussed at the beginningof the chapter also involved the coupling ofpositive <strong>and</strong> negative feedback loops. As the abundanceof trees turned to a shortage of trees, a positivefeedback loop (more births than deaths) becameweaker as death rates rose. Eventually a negative feedbackloop (more deaths than births) dominated <strong>and</strong>caused a dieback of the isl<strong>and</strong>’s human population.How Do Time Delays Affect ComplexSystems? Waiting for Something toKick InSometimes corrective feedback takes so long to workthat a system can cross a threshold <strong>and</strong> change itsnormal behavior.Complex systems often show time delays between theinput of a stimulus <strong>and</strong> the response to it. A long timedelay can mean that corrective action comes too late.For example, a smoker exposed to cancer-causingchemicals in cigarette smoke may not get lung cancerfor 20 years or more.Time delays allow a problem to build up slowlyuntil it reaches a threshold level <strong>and</strong> causes a fundamentalshift in the behavior of a system. Prolonged delaysdampen the negative feedback mechanisms that mightslow, prevent, or halt environmental problems. Examplesare population growth, leaks from toxic wastedumps, <strong>and</strong> degradation of forests from prolonged exposureto air pollutants.What Is Synergy, <strong>and</strong> How Can It AffectComplex Systems? One Plus One Can BeGreater Than TwoSometimes processes <strong>and</strong> feedbacks in a system caninteract to amplify the results.In arithmetic, 1 plus 1 always equals 2. However, insome of the complex systems found in nature, 1 plus 1may add up to more than 2 because of synergistic interactions.A synergistic interaction, or synergy, occurswhen two or more processes interact so that thecombined effect is greater than the sum of their separateeffects.Synergy can result when two people work togetherto accomplish a task. For example, suppose you<strong>and</strong> I need to move a 140-kilogram (300-pound) treethat has fallen across the road. By ourselves, each of uscan lift only, say, 45 kilograms (100 pounds). But if wework together <strong>and</strong> use our muscles properly, we canhttp://biology.brookscole.com/miller1437
move the tree out of the way. That is using synergy tosolve a problem. Research in the social sciences suggeststhat most political changes or changes in culturalbeliefs are brought about by only about 5% (<strong>and</strong> rarelymore than 10%) of a population working together(synergizing) <strong>and</strong> exp<strong>and</strong>ing their efforts to influenceother people.How Can We Anticipate <strong>Environmental</strong>Surprises? We Can Never Do Just One ThingBecause any action in a complex system has multiple<strong>and</strong> often unpredictable results, we should try toanticipate <strong>and</strong> plan for unintended results <strong>and</strong>surprises.One basic principle of environmental science is we cannever do just one thing. Any action in a complex systemhas multiple, unintended, <strong>and</strong> often unpredictable effects.Indeed, most of the harmful environmentalproblems we face today are unintended results of activitiesdesigned to increase the quality of human life(Figure 3-4).One factor that can lead to an environmentalsurprise is a discontinuity or abrupt change in a previouslystable system when some environmental thresholdis crossed. For example, you may be able to lean backin a chair <strong>and</strong> balance yourself on two of its legs for along time with only minor adjustments. But if youpass a certain threshold of movement, your balancedsystem suffers a discontinuity, or sudden shift, <strong>and</strong>you may find yourself on the floor. A similar changecan happen when many trees in a forest start dying afterbeing weakened <strong>and</strong> depleted of soil nutrients afterdecades of exposure to a cocktail of air pollutants.3-3 MATTERWhat Types of Matter Do We Findin Nature? Getting to the Bottomof ThingsMatter exists in chemical forms as elements<strong>and</strong> compounds.HumanActivitiesResultsUnintendedResultsPopulation growthL<strong>and</strong> clearingAgriculturePesticidesMore foodBetter nutritionPest controlNutrient-rich soilsToo many people insome areasDeforestationSoil erosion <strong>and</strong>degradationFertilizersMore seafoodDesertificationIrrigationMore waterWater deficitsFishingFlood controlAir pollutionFigure 3-4 Natural capital degradation:human activities designed toimprove the quality of life have had anumber of unintended harmful environmentaleffects.Dams <strong>and</strong> watertransfersCitiesIndustrializationMineral extractionFuel consumptionAntibioticsShelterCultureEducationMobilityConsumer goodsBetter healthDecline of infectiousdiseasesLonger lifeWater pollutionSolid wasteToxic wasteLoss of biodiversityFisheries depletionClimate changeOzone depletionGenetic resistance topesticidesGenetic resistance toantibiotics38 CHAPTER 3 Science, Systems, Matter, <strong>and</strong> Energy
I am going to give you a brief introduction to somechemistry—a discussion of matter <strong>and</strong> energy. Some ofyou are saying “I hate chemistry. Why do I need toknow this stuff?” The answer is that you <strong>and</strong> everyother material thing on this planet are made up ofchemicals <strong>and</strong> energy. To underst<strong>and</strong> life <strong>and</strong> environmentalproblems, you need to know a wee bit of chemistry.I will try to make this journey as interesting <strong>and</strong>painless as possible. For those of you who have hadsome basic chemistry, this material will be a breeze.Matter is anything that has mass (the amount ofmaterial in an object) <strong>and</strong> takes up space. Matter isfound in two chemical forms. One is elements: thedistinctive building blocks of matter that make upevery material substance. The other consists of compounds:two or more different elements held togetherin fixed proportions by attractive forces called chemicalbonds.To simplify things, chemists represent each elementby a one- or two-letter symbol. Examples used inthis book are hydrogen (H), carbon (C), oxygen (O), nitrogen(N), phosphorus (P), sulfur (S), chlorine (Cl),fluorine (F), bromine (Br), sodium (Na), calcium (Ca),lead (Pb), mercury (Hg), arsenic (As), <strong>and</strong> uranium(U). Chemists have developed a way to classify elementsin terms of their chemical behavior by arrangingthem in a periodic table of elements, as discussed inAppendix 3. Good news. The elements in the list aboveare the only ones you need to know to underst<strong>and</strong> thematerial in this book.From a chemical st<strong>and</strong>point, how much are youworth? Not much. If we add up the market price perkilogram for each element in someone weighing 70kilograms (154 pounds), the total value comes to about$120. Not very uplifting, is it?But of course you are worth much more becauseyour body is not just a bunch of chemicals enclosed ina bag of skin. Instead you are an incredibly complexsystem of air, water, soil nutrients, energy-storingchemicals, <strong>and</strong> food chemicals interacting in millionsof ways to keep you alive <strong>and</strong> healthy. Feel better now?What Are Nature’s Building Blocks?Matter’s BricksAtoms, ions, <strong>and</strong> molecules are the building blocksof matter.If you had a supermicroscope capable of looking at individualelements <strong>and</strong> compounds, you could see theyare made up of three types of building blocks. The firstis an atom: the smallest unit of matter that exhibits thecharacteristics of an element. The second is an ion: anelectrically charged atom or combination of atoms. Athird building block is a molecule: a combination oftwo or more atoms of the same or different elementsheld together by chemical bonds.Some elements are found in nature as molecules.Examples are nitrogen <strong>and</strong> oxygen, which togethermake up about 99% of the volume of air you just inhaled.Two atoms of nitrogen (N) combine to form agaseous molecule, with the shorth<strong>and</strong> formula N 2(read as “N-two”). The subscript after the element’ssymbol indicates the number of atoms of that elementin a molecule. Similarly, most of the oxygen gas in theatmosphere exists as O 2 (read as “O-two”) molecules.A small amount of oxygen, found mostly in the secondlayer of the atmosphere (stratosphere), exists as O 3(read as “O-three”) molecules, a gaseous form of oxygencalled ozone.What Are Atoms Made Of? LookingInsideEach atom has a tiny nucleus containing protons, <strong>and</strong>in most cases neutrons, <strong>and</strong> one or more electronswhizzing around somewhere outside the nucleus.If you increased the magnification of your supermicroscope,you would find that each different type of atomcontains a certain number of subatomic particles. Thereare three types of these atomic building blocks: positivelycharged protons (p), uncharged neutrons (n),<strong>and</strong> negatively charged electrons (e). Actually, thereare other particles, but they need not concern us at thisintroductory level.Each atom consists of an extremely small center, ornucleus. It contains one or more protons, <strong>and</strong> in mostcases neutrons, <strong>and</strong> one or more electrons in rapid motionsomewhere outside the nucleus. Atoms are incrediblysmall. More than 3 million hydrogen atomscould sit side by side on the period at the end of thissentence. Now that is tiny.Each atom has a certain number of positivelycharged protons inside its nucleus <strong>and</strong> an equal numberof negatively charged electrons outside its nucleus.Because these electrical charges cancel one another, theatom as a whole has no net electrical charge.Each element has its own specific atomic number,equal to the number of protons in the nucleus of eachof its atoms. The simplest element, hydrogen (H), hasonly 1 proton in its nucleus, so its atomic number is 1.Carbon (C), with 6 protons, has an atomic number of 6.Uranium (U), a much larger atom, has 92 protons <strong>and</strong>an atomic number of 92.Because atoms are electrically neutral, the atomicnumber of an atom tells us the number of positivelycharged protons in its nucleus <strong>and</strong> the equal numberof negatively charged electrons outside its nucleus. Forexample, an atom of uranium with an atomic numberof 92 has 92 protons in its nucleus <strong>and</strong> 92 electrons outside,<strong>and</strong> thus no net electrical charge.Because electrons have so little mass comparedwith the mass of a proton or a neutron, most of anhttp://biology.brookscole.com/miller1439
Figure 3-5 Isotopes of hydrogen <strong>and</strong>uranium. All isotopes of hydrogen have an atomicnumber of 1 because each has one proton in itsnucleus; similarly, all uranium isotopes have anatomic number of 92. However, each isotope ofthese elements has a different mass number becauseits nucleus contains a different number ofneutrons. Figures in parentheses indicate the percentageabundance by weight of each isotope ina natural sample of the element.Hydrogen (H)0n1p1eMass number = 0 + 1 = 1Hydrogen-1(99.98%)1n1p1eMass number = 1 + 1 = 2Hydrogen-2or deuterium (D)(0.015%)2n1p1eMass number = 2 + 1 = 3Hydrogen-3or tritium (T)(trace)Uranium (U)143 n92p92 e146n92p92 eMass number = 143 + 92 = 235Uranium-235(0.7%)Mass number = 146 + 92 = 238Uranium-238(99.3%)atom’s mass is concentrated in its nucleus. The mass ofan atom is described in terms of its mass number: thetotal number of neutrons <strong>and</strong> protons in its nucleus.For example, a hydrogen atom with 1 proton <strong>and</strong> noneutrons in its nucleus has a mass number of 1, <strong>and</strong>an atom of uranium with 92 protons <strong>and</strong> 143 neutronsin its nucleus has a mass number of 235 (92 143 235).All atoms of an element have the same number ofprotons in their nuclei. But they may have differentnumbers of uncharged neutrons in their nuclei, <strong>and</strong>thus may have different mass numbers. Various formsof an element having the same atomic number but adifferent mass number are called isotopes of that element.Scientists identify isotopes by attaching theirmass numbers to the name or symbol of the element.For example, hydrogen has three isotopes: hydrogen-1(H-1), hydrogen-2 (H-2, common name deuterium), <strong>and</strong>hydrogen-3 (H-3, common name tritium). A naturalsample of an element contains a mixture of its isotopesin a fixed proportion, or percentage abundance byweight (Figure 3-5).What Are Ions? GettingCharged UpAtoms of some elements can lose or gain oneor more electrons to form ions with positiveor negative electrical charges.Ions form when an atom of an element loses or gainsone or more electrons. Thus an ion is an atom orgroups of atoms with one or more net positive () ornegative () electrical charges, one for each electronlost or gained. Atoms are neutral but ions are allcharged up.Some elements, known as metals, tend to lose oneor more of their electrons <strong>and</strong> form positively chargedions. Like a quarterback passing a football, they areelectron givers. For example, an atom of the metallicelement sodium (Na, atomic number 11) with 11 positivelycharged protons <strong>and</strong> 11 negatively charged electronscan lose one of its electrons. It then becomes asodium ion with a positive charge of 1 (Na ) because itnow has 11 positive charges (protons) but only 10 negativecharges (electrons).Other atoms, known as nonmetals, tend to gain oneor more electrons <strong>and</strong> form negatively charged ions.Like a tight end waiting for a pass from a quarterback,they are electron receivers. For example, an atom of thenonmetallic element chlorine (Cl, with an atomic numberof 17) can gain an electron <strong>and</strong> become a chlorineion. The ion has a negative charge of 1 (Cl ) because ithas 17 positively charged protons <strong>and</strong> 18 negativelycharged electrons.The number of positive or negative charges on anion is shown as a superscript after the symbol for anatom or a group of atoms. Examples of ions encounteredin this book are positive ions such as hydrogenions (H ), calcium ions (Ca 2 ), <strong>and</strong> ammonium ions(NH 4 ), <strong>and</strong> negative ions such as nitrate ions (NO 3 ),sulfate ions (SO 42), <strong>and</strong> phosphate ions (PO 43).The amount of a substance in a unit volume of air,water, or other medium is called its concentration. It islike the number of people in a classroom or a swimmingpool.The concentration of hydrogen ions (H ) in a watersolution is a measure of its acidity or alkalinity, representedby a value called pH. On a pH scale of 0 to 14,acids have a pH less than 7, bases have a pH greaterthan 7, <strong>and</strong> a neutral solution has a pH of 7 (Figure 3-6).40 CHAPTER 3 Science, Systems, Matter, <strong>and</strong> Energy
Figure 3-6 The pH scale, used to measure acidity <strong>and</strong>alkalinity of water solutions. A pH value is a measure of the concentrationof hydrogen ions (H ) in a water solution. Valuesshown are approximate. A solution with a pH less than 7 isacidic, a neutral solution has a pH of 7, <strong>and</strong> one with a pHgreater than 7 is basic. Each whole-number drop in pH representsa 10-fold increase in acidity. (From Cecie Starr, Biology:Concepts <strong>and</strong> Applications, 4th ed., Brooks/Cole [Wadsworth]© 2000)What Holds the Atoms <strong>and</strong> Ions inCompounds Together? Giving, Receiving,<strong>and</strong> Sharing ElectronsSome compounds are made up of oppositely chargedions <strong>and</strong> others are made up of molecules.Most matter exists as compounds, substances containingatoms or ions of more than one element that areheld together by chemical bonds. Chemists use ashorth<strong>and</strong> chemical formula to show the number ofatoms or ions of each type in a compound. The formulacontains the symbols for each of the elementspresent <strong>and</strong> uses subscripts to represent the number ofatoms or ions of each element in the compound’s basicstructural unit.Some compounds are made up of oppositelycharged ions <strong>and</strong> are called ionic compounds. Thosemade up of molecules of uncharged atoms are calledcovalent or molecular compounds.Sodium chloride (table salt) is an ionic compoundrepresented by the chemical formula NaCl. It consistsof a three-dimensional array of oppositely chargedions (Na <strong>and</strong> Cl ). The forces of attraction betweenthese oppositely charged ions are called ionic bonds, asdiscussed in more detail in Appendix 3. They areformed when a metal atom (a giver) gives one or moreelectrons to a nonmetal atom (a receiver). Then the resultingpositively <strong>and</strong> negatively charged ions attractone another. The result of this electron dating game,involving giving, receiving, <strong>and</strong> attraction betweenopposites, is an ionic compound.Water, a covalent or molecular compound, consists ofmolecules made up of uncharged atoms of hydrogen(H) <strong>and</strong> oxygen (O). Each water molecule consists oftwo hydrogen atoms chemically bonded to an oxygenatom, yielding H 2 O (read as “H-two-O”) molecules.The bonds between the atoms in such molecules arecalled covalent bonds, as discussed in Appendix 3. Covalentcompounds form when atoms of various elementsshare one or more electrons. It is electron datingby sharing.What Are Organic Compounds?Think CarbonOrganic compounds contain carbon atoms combinedwith one another <strong>and</strong> with various other atoms suchas hydrogen, nitrogen, or chlorine.http://biology.brookscole.com/miller1441
Table sugar, vitamins, plastics, aspirin, penicillin, <strong>and</strong>most of the chemicals in your body are organic compounds.If you could view these compounds with yoursupermicroscope, you would see that all (except one)have at least two carbon atoms (some have thous<strong>and</strong>s)combined with each other <strong>and</strong> with atoms of one ormore other elements such as hydrogen, oxygen, nitrogen,sulfur, phosphorus, chlorine, <strong>and</strong> fluorine. Oneexception, methane (CH 4 ), has only one carbon atom.Almost all organic compounds are molecularcompounds held together by covalent bonds. Organiccompounds can be either natural (such as carbohydrates,proteins, <strong>and</strong> fats in natural foods) or synthetic(such as plastics <strong>and</strong> many drugs made by humans).The millions of known organic (carbon-based)compounds include the following:■ Hydrocarbons: compounds of carbon <strong>and</strong> hydrogenatoms. An example is methane (CH 4 ), the maincomponent of natural gas, <strong>and</strong> the simplest organiccompound.■ Chlorinated hydrocarbons: compounds of carbon, hydrogen,<strong>and</strong> chlorine atoms. An example is the insecticideDDT (C 14 H 9 Cl 5 ).■ Simple carbohydrates (simple sugars): certain types ofcompounds of carbon, hydrogen, <strong>and</strong> oxygen atoms.An example is glucose (C 6 H 12 O 6 ), which most plants<strong>and</strong> animals break down in their cells to obtain energy.What Are Genes, Chromosomes, <strong>and</strong> DNAMolecules? Linking Up MoleculesSimple organic molecules can link together to formmore complex organic compounds.Larger <strong>and</strong> more complex organic compounds, calledpolymers, consist of a number of basic structural ormolecular units (monomers) linked by chemical bonds,somewhat like cars linked in a freight train. The threemajor types of organic polymers are complex carbohydratesconsisting of two or more monomers of simplesugars (such as glucose) linked together, proteinsformed by linking together monomers of amino acids,<strong>and</strong> nucleic acids (such as DNA <strong>and</strong> RNA) made bylinked sequences of monomers called nucleotides, asdiscussed in Appendix 3.Genes consist of specific sequences of nucleotidesin a DNA molecule. Each gene carries codes (each consistingof three nucleotides) needed to make variousproteins. These coded units of genetic informationabout specific traits are passed on from parents to offspringduring reproduction.Chromosomes are combinations of genes thatmake up a single DNA molecule, together with a numberof proteins. Each chromosome typically containsthous<strong>and</strong>s of genes. Genetic information coded inyour chromosomal DNA is what makes you differentfrom an oak leaf, an alligator, or a flea <strong>and</strong> from yourparents. The relationships of genetic material to cellsare depicted in Figure 3-7, which you may find usefulin getting genetic terms straight.The total weight of the DNA needed to reproducethe world’s 6.4 billion people is only about 50 milligrams—theweight of a small match. If the DNAcoiled in your body were unwound, it would stretchabout 960 million kilometers (600 million miles)—more than six times the distance between the sun <strong>and</strong>the earth.A CTGC A T GA human body contains trillionsof cells, each with an identicalset of genes.There is a nucleus inside eachhuman cell (except red blood cells).Each cell nucleus has an identicalset of chromosomes, which arefound in pairs.A specific pair of chromosomescontains one chromosome fromeach parent.Each chromosome contains a longDNA molecule in the form of a coileddouble helix.Genes are segments of DNA onchromosomes that contain instructionsto make proteins—the building blocksof life.The genes in each cell are codedby sequences of nucleotides intheir DNA molecules.Figure 3-7 Relationships among cells, nuclei, chromosomes,DNA, genes, <strong>and</strong> nucleotides.42 CHAPTER 3 Science, Systems, Matter, <strong>and</strong> Energy
The different molecules of DNA that make up themillions of species found on the earth are like a vast<strong>and</strong> diverse genetic library. Each species is a uniquebook in that library.The genome of a species is made up of the entire sequenceof DNA “letters” or base pairs that combine to“spell out” the chromosomes in typical members ofeach species. In 2002, scientists were able to map outthe genome for the human species.What Are Inorganic Compounds? The Restof the World’s CompoundsCompounds without carbon–carbon <strong>and</strong>carbon–hydrogen bonds are called inorganiccompounds.Inorganic compounds do not have carbon–carbon orcarbon–hydrogen bonds. Some of the inorganic compoundsdiscussed in this book are sodium chloride(NaCl), water (H 2 O), nitrous oxide (N 2 O), nitric oxide(NO), carbon monoxide (CO), carbon dioxide (CO 2 ),nitrogen dioxide (NO 2 ), sulfur dioxide (SO 2 ), ammonia(NH 3 ), hydrogen sulfide (H 2 S), sulfuric acid (H 2 SO 4 ),<strong>and</strong> nitric acid (HNO 3 ). Good news. These are the onlyinorganic compounds you need to know to underst<strong>and</strong>the material in this book.Now you know about the fairly small cast ofchemicals (atoms, ions, molecules, <strong>and</strong> compounds)you will encounter in this book.But scientists have learned how to make artificialplasmas in fluorescent lights, arc lamps, neon signs,gas discharge lasers, <strong>and</strong> in TV <strong>and</strong> computer screens.They do this by running a high-voltage electric currentthrough a gas. Scientists hope to be able to develop affordableplasma torches <strong>and</strong> use them to destroy toxicwastes, sterilize <strong>and</strong> clean water, remove soot from exhaustgases, <strong>and</strong> produce clean-burning hydrogen gasfrom diesel fuel, gasoline, or methane for use in fuelcells. Great stuff if we can do it.What Is Matter Quality? Matter UsefulnessMatter can be classified as having high or low qualitydepending on how useful it is to us as a resource.Matter quality is a measure of how useful a form ofmatter is to us as a resource, based on its availability <strong>and</strong>concentration, as shown in Figure 3-8. High-qualityHigh QualitySolidLow QualityGasWhat Are Four States of Matter? Let’s GetPhysicalMatter exists in solid, liquid, <strong>and</strong> gaseousphysical states <strong>and</strong> a fourth state known asplasma.The atoms, ions, <strong>and</strong> molecules that make up matterare found in three physical states: solid, liquid, <strong>and</strong> gas.For example, water exists as ice, liquid water, or watervapor depending on its temperature <strong>and</strong> the surroundingair pressure. The three physical states of anysample of matter differ in the spacing <strong>and</strong> orderlinessof its atoms, ions, or molecules. A solid has the mostcompact <strong>and</strong> orderly arrangement <strong>and</strong> a gas the leastcompact <strong>and</strong> orderly arrangement. Liquids are somewherein between.A fourth state of matter is called plasma. It is ahigh-energy mixture of roughly equal numbers of positivelycharged ions <strong>and</strong> negatively charged electrons.A plasma forms when enough energy is applied tostrip electrons away from the nuclei of atoms—somewhatlike a blast of wind blowing the leaves off a tree.Plasma is the most abundant form of matter in theuniverse. The sun <strong>and</strong> all stars consist mostly ofplasma. There is little natural plasma on the earth,with most of it found in lightning bolts <strong>and</strong> flames.SaltCoalGASOLINEGasolineAluminum canSolution of salt in waterCoal-fired powerplant emissionsAutomobile emissionsAluminum oreFigure 3-8 Examples of differences in matter quality. Highqualitymatter (left-h<strong>and</strong> column) is fairly easy to extract <strong>and</strong>concentrated; low-quality matter (right-h<strong>and</strong> column) is moredifficult to extract <strong>and</strong> more dispersed than high-quality matter.http://biology.brookscole.com/miller1443
matter is concentrated, usually is found near the earth’ssurface, <strong>and</strong> has great potential for use as a matter resource.Low-quality matter is dilute, often is deep undergroundor dispersed in the ocean or the atmosphere,<strong>and</strong> usually has little potential for use as a materialresource.An aluminum can is a more concentrated, higherqualityform of aluminum than aluminum ore containingthe same amount of aluminum. That is why ittakes less energy, water, <strong>and</strong> money to recycle analuminum can than to make a new can from aluminumore.Material efficiency, or resource productivity, isthe total amount of material needed to produce eachunit of goods or services. Great news. Business expertPaul Hawken <strong>and</strong> physicist Amory Lovins contendthat resource productivity in developed countriescould be improved by 75–90% within two decades usingexisting technologies.3-4 ENERGYWhat Is Energy? Doing Work <strong>and</strong>Transferring HeatEnergy is the work needed to move matter <strong>and</strong> theheat that flows from hot to cooler samples of matter.Energy is the capacity to do work <strong>and</strong> transfer heat.Work is performed when an object such as a grain ofs<strong>and</strong>, this book, or a giant boulder is moved over somedistance. Work, or matter movement, also is needed toboil water or burn natural gas to heat a house or cookfood. Energy is also the heat that flows automaticallyfrom a hot object to a cold object when they come incontact.There are two major types of energy. One is kineticenergy, possessed by matter because of the matter’smass <strong>and</strong> its speed or velocity. Examples of thisenergy in motion are wind (a moving mass of air),flowing streams, heat flowing from a body at a hightemperature to one at a lower temperature, <strong>and</strong> electricity(flowing electrons).The second type is potential energy, which isstored <strong>and</strong> potentially available for use. Examples ofthis stored energy are a rock held in your h<strong>and</strong>, anunlit match, still water behind a dam, the chemical energystored in gasoline molecules, <strong>and</strong> the nuclear energystored in the nuclei of atoms.Potential energy can be changed to kinetic energy.Drop a rock or this book on your foot <strong>and</strong> the book’spotential energy when you held it changes into kineticenergy. When you burn gasoline in a car engine, thepotential energy stored in the chemical bonds of itsmolecules changes into heat, light, <strong>and</strong> mechanical (kinetic)energy that propel the car.What Is Electromagnetic Radiation?Think WavesSome energy travels in waves at the speed of light.Another type of energy is electromagnetic radiation.It is energy traveling in the form of a wave as a result ofchanging electric <strong>and</strong> magnetic fields.There are many different forms of electromagneticradiation, each with a different wavelength (distancebetween successive peaks or troughs in the wave) <strong>and</strong>energy content, as shown in Figure 3-9. Such radiationtravels through space at the speed of light, which isabout 300,000 kilometers (186,000 miles) per second.That is fast.SunHigh energy, shortwavelengthLow energy, longwavelengthIonizing radiationNonionizing radiationCosmicraysGammaraysX raysFarultravioletwavesNearultravioletwavesVisiblewavesNearinfraredwavesFarinfraredwavesMicrowavesTVwavesRadiowavesWavelengthin meters(not to scale)10 –1410 –12 10 –8 10 –7 10 –6 10 –5 10 –3 10 –2 10 –1 1Figure 3-9 The electromagnetic spectrum: the range of electromagnetic waves, which differ in wavelength(distance between successive peaks or troughs) <strong>and</strong> energy content.44 CHAPTER 3 Science, Systems, Matter, <strong>and</strong> Energy
Energy emitted from sun (kcal/cm 2 /min)151050Ultraviolet0.25VisibleInfrared1 2 2.5 3Wavelength (micrometers)Figure 3-10 Solar capital: the spectrum of electromagneticradiation released by the sun consists mostly ofvisible light.Cosmic rays, gamma rays, X rays, <strong>and</strong> ultravioletradiation (Figure 3-9, left side) are called ionizingradiation because they have enough energy to knockelectrons from atoms <strong>and</strong> change them to positivelycharged ions. The resulting highly reactive electrons<strong>and</strong> ions can disrupt living cells, interfere with bodyprocesses, <strong>and</strong> cause many types of sickness, includingvarious cancers. The other forms of electromagnetic radiation(Figure 3-9, right side) do not contain enoughenergy to form ions <strong>and</strong> are called nonionizing radiation.No scientific consensus exists on whether nonionizingforms of electromagnetic radiation given offwhen an electric current passes through a wire or amotor is harmful to humans.The visible light that you can detect with youreyes is a form of nonionizing radiation that occupiesonly a small portion of the full range, or spectrum, ofdifferent types of electromagnetic radiation. We are energychallenged because our senses can detect only atiny amount of the different types of electromagneticradiation that are all around us. Figure 3-10 shows thatvisible light makes up most of the spectrum of electromagneticradiation emitted by the sun.What Is Heat <strong>and</strong> How Is It Transferred?Three Ways to TangoHeat is the total kinetic energy of all the partsof a sample of matter <strong>and</strong> is transferred from oneplace to another by convection, conduction, <strong>and</strong>radiation.Heat is the total kinetic energy of all the movingatoms, ions, or molecules within a given substance, excludingthe overall motion of the whole object. For example,a glass of water consists of zillions of watermolecules in constant motion. The heat stored in thissample of water is the total kinetic energy of all ofthese moving molecules. The term heat is also used todescribe the energy that can be transferred betweenobjects at different temperatures.Temperature is the average speed of motion of theatoms, ions, or molecules in a sample of matter at agiven moment. For example, the molecules in a sampleof water in a glass have a certain average speed of motion.This is what we call its temperature.Heat can be transferred from one place to anotherby three different methods. Study Figure 3-11 for anexplanation of these methods.Convection Conduction RadiationHeating water in the bottom of a pancauses some of the water to vaporizeinto bubbles. Because they arelighter than the surrounding water,they rise. Water then sinks from thetop to replace the rising bubbles.Thisup <strong>and</strong> down movement (convection)eventually heats all of the water.Heat from a stove burner causesatoms or molecules in the pan’sbottom to vibrate faster. The vibratingatoms or molecules then collide withnearby atoms or molecules, causingthem to vibrate faster. Eventually,molecules or atoms in the pan’sh<strong>and</strong>le are vibrating so fast itbecomes too hot to touch.As the water boils, heat from the hotstove burner <strong>and</strong> pan radiate into thesurrounding air, even though airconducts very little heat.Figure 3-11 Three ways in which heat can be transferred from one place to another.http://biology.brookscole.com/miller1445
ElectricityVery high temperatureheat (greater than 2,500°C)Nuclear fission (uranium)Nuclear fusion (deuterium)Concentrated sunlightHigh-velocity windVery highVery high-temperature heat(greater than 2,500°C)for industrial processes<strong>and</strong> producing electricity torun electrical devices(lights, motors)High-temperature heat(1,000–2,500°C)Hydrogen gasNatural gasGasolineCoalFoodHighMechanical motion (to movevehicles <strong>and</strong> other things)High-temperature heat(1,000–2,500°C) forindustrial processes <strong>and</strong>producing electricityNormal sunlightModerate-velocity windHigh-velocity water flowConcentratedgeothermal energyModerate-temperature heat(100–1,000°C)Wood <strong>and</strong> crop wastesModerateModerate-temperature heat(100–1,000°C) for industrialprocesses, cooking,producing steam,electricity, <strong>and</strong> hot waterDispersed geothermal energyLow-temperature heat(100°C or lower)LowLow-temperature heat(100°C or less) forspace heatingSource of EnergyRelative Energy Quality(usefulness)Energy TasksFigure 3-12 Categories of energy quality. High-quality energy is concentrated <strong>and</strong> has great abilityto perform useful work. Low-quality energy is dispersed <strong>and</strong> has little ability to do useful work. Toavoid unnecessary energy waste, it is best to match the quality of an energy source with the qualityof energy needed to perform a task.What Is Energy Quality? Energy UsefulnessEnergy can be classified as having high or low qualitydepending on how useful it is to us as a resource.Energy quality is a measure of an energy source’s abilityto do useful work, as seen in Figure 3-12. Highqualityenergy is concentrated <strong>and</strong> can perform muchuseful work. Examples are electricity, the chemical energystored in coal <strong>and</strong> gasoline, concentrated sunlight,<strong>and</strong> nuclei of uranium-235 used as fuel in nuclearpower plants.By contrast, low-quality energy is dispersed <strong>and</strong>has little ability to do useful work. An example oflow-quality energy is heat dispersed in the movingmolecules of a large amount of matter (such as theatmosphere or a large body of water) so that its temperatureis low.For example, the total amount of heat stored in theAtlantic Ocean is greater than the amount of highqualitychemical energy stored in all the oil deposits ofSaudi Arabia. Yet the ocean’s heat is so widely dispersed,it cannot be used to move things or to heatthings to high temperatures.It makes sense to match the quality of an energysource with the quality of energy needed to perform aparticular task (Figure 3-12) because doing so savesenergy <strong>and</strong> usually money.3-5 THE LAW OF CONSERVATION OFMATTER: A RULE WE CANNOT BREAKWhat Is the Difference between a Physical<strong>and</strong> a Chemical Change? Changes in Form<strong>and</strong> in Chemical MakeupMatter can change from one physical form toanother or change its chemical composition.When a sample of matter undergoes a physicalchange, its chemical composition is not changed. Apiece of aluminum foil cut into small pieces is still46 CHAPTER 3 Science, Systems, Matter, <strong>and</strong> Energy
aluminum foil. When solid water (ice) is melted orliquid water is boiled, none of the H 2 O molecules involvedare altered; instead, the molecules are organizedin different spatial (physical) patterns.In a chemical change, or chemical reaction, thereis a change in the chemical composition of the elementsor compounds. Chemists use shorth<strong>and</strong> chemicalequations to represent what happens in a chemicalreaction. For example, when coal burns completely,the solid carbon (C) it contains combines with oxygengas (O 2 ) from the atmosphere to form the gaseouscompound carbon dioxide (CO 2 ):CReactant(s)+OOblack solid colorless gas colorless gasOProduct(s)carbon + oxygen carbon dioxide +C + O 2 CO 2 +COenergyenergy+ energyEnergy is given off in this reaction, making coal auseful fuel. The reaction also shows how the completeburning of coal (or any of the carbon-containing compoundsin wood, natural gas, oil, <strong>and</strong> gasoline) givesoff carbon dioxide gas. This is a key gas that helpswarm the lower atmosphere (troposphere).The Law of Conservation of Matter: WhyThere Is No “Away”When a physical or chemical change occurs, no atomsare created or destroyed.We may change various elements <strong>and</strong> compoundsfrom one physical or chemical form to another, but inno physical <strong>and</strong> chemical change can we create or destroyany of the atoms involved. All we can do isrearrange them into different spatial patterns (physicalchanges) or different combinations (chemical changes).This statement, based on many thous<strong>and</strong>s of measurements,is known as the law of conservation of matter.The law of conservation of matter means there isno “away” as in “to throw away.” Everything we thinkwe have thrown away is still here somewhere on the planetwith us in one form or another. Dust <strong>and</strong> soot from thesmokestacks of industrial plants, substances removedfrom polluted water at sewage treatment plants, <strong>and</strong>banned chemicals like DDT all have to go somewhere<strong>and</strong> can come back around to haunt us. For example,selling DDT abroad means it can return to the UnitedStates as residues in imported coffee, fruit, <strong>and</strong> otherfoods, or as fallout from air masses moved long distancesby winds.How Do Chemists Keep Track of Atoms?Atomic BookkeepingChemical equations are used as an accountingsystem to verify that no atoms are created ordestroyed in a chemical reaction.In keeping with the law of conservation of matter,each side of a chemical equation must have the samenumber of atoms of each element involved. Mindingthis law leads to what chemists call a balanced chemicalequation.The equation for the burning of carbon (C O 2 CO 2 )isbalanced because one atom of carbon<strong>and</strong> two atoms of oxygen are on both sides of the equation.That is an easy one.Now we try a slightly harder one. When electricityis passed through water (H 2 O), the water molecule canbe broken down into hydrogen (H 2 ) <strong>and</strong> oxygen (O 2 ).This chemical reaction can be represented by the followingshorth<strong>and</strong> chemical equation:H 2 O H 2 O 22 H atoms 2 H atoms 2 O atoms1 O atomThis equation is unbalanced because one atom of oxygenis on the left but two atoms are on the right.We cannot change the subscripts of any of the formulasto balance this equation because that wouldmake the substances different from those actuallyinvolved. That is a no-no according to the law of conservationof matter. Instead, we could use differentnumbers of the molecules involved to balance the equation.For example, we could use two water molecules:2 H 2 O H 2 O 24 H atoms 2 H atoms 2 O atoms2 O atomsThis equation is still unbalanced because althoughthe numbers of oxygen atoms on both sides are nowequal, the numbers of hydrogen atoms are not.We can correct this by having the reaction producetwo hydrogen molecules:2 H 2 O 2 H 2 O 24 H atoms 4 H atoms 2 O atoms2 O atomsNow the equation is balanced, <strong>and</strong> the law of conservationof matter has been observed. We see that forevery two molecules of water through which we passelectricity, two hydrogen molecules <strong>and</strong> one oxygenmolecule are produced. By the way, this equation maychange your life. It represents how we could use heator electricity to decompose water <strong>and</strong> produce hydrogengas that someday may replace oil as a fuel tohttp://biology.brookscole.com/miller1447
Fraction of original amount ofplutonium-239 left11/21/41/801sthalf-life2ndhalf-life3rdhalf-life24,000 48,000 72,000Time (years)sapiens) has existed. Chapter 17 has more on the problemof what to do with the nuclear wastes we havecreated.Exposure to ionizing radiation from alpha particles,beta particles, <strong>and</strong> gamma rays can damage cellsin two ways. One is genetic damage from mutations orchanges in DNA molecules that alter genes <strong>and</strong> chromosomes.If the mutation is harmful, it can lead togenetic defects in the next generation of offspring orseveral generations later.The other is somatic damage to tissues, whichcauses harm during the victim’s lifetime. Examplesinclude burns, miscarriages, eye cataracts, <strong>and</strong> certaincancers.According to the U.S. National Academy ofSciences, exposure over an average lifetime to averagelevels of ionizing radiation from natural <strong>and</strong> humansources causes about 1% of all fatal cancers <strong>and</strong> 5–6%of all normally encountered genetic defects in the U.S.population.Figure 3-13 Half-life. The radioactive decay of plutonium-239,which is produced in nuclear reactors <strong>and</strong> used asthe explosive in some nuclear weapons, has a half-life of24,000 years. The amount of radioactivity emitted by a radioactiveisotope decreases by one-half for each half-life thatpasses. Thus, after three half-lives, amounting to 72,000years, one-eighth of a sample of plutonium-239 would still beradioactive.nuclear weapons, can cause lung cancer when its particlesare inhaled in minute amounts. Its half-life is24,000 years. Thus it must be stored safely for 240,000years (10 24,000 years)—about four times longerthan the latest version of our species (Homo sapiensTable 3-1 Half-Lives of Selected RadioisotopesRadiationIsotope Half-Life EmittedPotassium-42 12.4 hours Alpha, betaIodine-131 8 days Beta, gammaCobalt-60 5.27 years Beta, gammaHydrogen-3 12.5 years Beta(tritium)Strontium-90 28 years BetaCarbon-14 5,370 years BetaPlutonium-239 24,000 years Alpha, gammaUranium-235 710 million years Alpha, gammaUranium-238 4.5 billion years Alpha, gammaWhat Is Nuclear Fission? Splitting HeavyNucleiNeutrons can split apart the nuclei of certain isotopeswith large mass numbers <strong>and</strong> release a large amountof energy.Nuclear fission is a nuclear change in which nuclei ofcertain isotopes with large mass numbers (such asuranium-235) are split apart into lighter nuclei whenstruck by neutrons; each fission releases two or threemore neutrons <strong>and</strong> energy (Figure 3-14, p. 50). Each ofthese neutrons, in turn, can cause an additional fission.For these multiple fissions to take place, enough fissionablenuclei must be present to provide the criticalmass needed for efficient capture of these neutrons.Multiple fissions within a critical mass forma chain reaction, which releases an enormous amountof energy (Figure 3-15, p. 50). This is somewhat like aroom in which the floor is covered with springloadedmousetraps, each topped by a Ping-Pong ball.Open the door, throw in a single Ping-Pong ball, <strong>and</strong>watch the action in this simulated chain reaction ofsnapping mousetraps <strong>and</strong> balls flying around inevery direction.In an atomic bomb, an enormous amount of energyis released in a fraction of a second in an uncontrollednuclear fission chain reaction. This reaction isinitiated by an explosive charge, which pushes twomasses of fissionable fuel together. This causes the fuelto reach the critical mass needed for a chain reaction<strong>and</strong> to give off a tremendous amount of energy in a giganticexplosion.In the reactor of a nuclear power plant, the rate atwhich the nuclear fission chain reaction takes place ishttp://biology.brookscole.com/miller1449
nn23592 UUranium-235nucleus9236Kr14156 BanUnstablenucleusnn23592 U23592 U9236Fission fragmentKr14156 BannnnFission fragment14156 Ba92369236Kr14156 BanKrnnEnergyFigure 3-14 Fission of a uranium-235 nucleus by a neutron (n).23592 Unnnn23592 U23592 U23592 Untogether at extremely high temperatures until theyfuse to form a heavier nucleus. Lots of energy is releasedwhen this happens. Temperatures of at least100 million °C are needed to force the positivelycharged nuclei (which strongly repel one another)to fuse.Nuclear fusion is much more difficult to initiatethan nuclear fission, but once started it releases farmore energy per unit of fuel than does fission. Youwould not be alive without nuclear fusion. Fusion ofhydrogen nuclei to form helium nuclei is the source ofenergy in the sun <strong>and</strong> other stars.After World War II, the principle of uncontrollednuclear fusion was used to develop extremely powerfulhydrogen, or thermonuclear, weapons. These weaponsuse the D–T fusion reaction, in which a hydrogen-2, ordeuterium (D), nucleus <strong>and</strong> a hydrogen-3 (tritium, T)nucleus are fused to form a larger, helium-4 nucleus, aneutron, <strong>and</strong> energy, as shown in Figure 3-16.Scientists have also tried to develop controlled nuclearfusion, in which the D–T reaction is used to pro-FuelD–T Fusion+Hydrogen-2 ordeuterium nucleusReaction Conditions++ProductsNeutronEnergyFigure 3-15 A nuclear chain reaction initiated by one neutrontriggering fission in a single uranium-235 nucleus. This figureillustrates only a few of the trillions of fissions caused when asingle uranium-235 nucleus is split within a critical mass ofuranium-235 nuclei. The elements krypton (Kr) <strong>and</strong> barium(Ba), shown here as fission fragments, are only two of manypossibilities.controlled so that under normal operation only one ofevery two or three neutrons released is used to splitanother nucleus. In conventional nuclear fission reactors,the splitting of uranium-235 nuclei releases heat,which produces high-pressure steam to spin turbines<strong>and</strong> thus generate electricity.+Hydrogen-3 ortritium nucleusD–D Fusion+Hydrogen-2 ordeuterium nucleus+100 million °C+++ +Helium-4nucleus++Helium-3nucleusEnergyWhat Is Nuclear Fusion? Forcing LightNuclei to CombineExtremely high temperatures can force thenuclei of isotopes of some lightweight atoms tofuse together <strong>and</strong> release large amounts ofenergy.Nuclear fusion is a nuclear change in which two isotopesof light elements, such as hydrogen, are forcedHydrogen-2 ordeuterium nucleus+Proton1 billion °CNeutronNeutronFigure 3-16 The deuterium–tritium (D–T) <strong>and</strong> deuterium–deuterium (D–D) nuclear fusion reactions, which take place atextremely high temperatures.50 CHAPTER 3 Science, Systems, Matter, <strong>and</strong> Energy
duce heat that can be converted into electricity. Aftermore than 50 years of research, this process is still inthe laboratory stage. Even if it becomes technologically<strong>and</strong> economically feasible, many energy expertsdo not expect it to be a practical source of energy until2030, if then.3-7 ENERGY LAWS: TWO RULESWE CANNOT BREAKWhat Is the First Law of Thermodynamics?You Cannot Get Something for NothingIn a physical or chemical change, we canchange energy from one form to another but wecan never create or destroy any of the energyinvolved.Scientists have observed energy being changed fromone form to another in millions of physical <strong>and</strong> chemicalchanges. But they have never been able to detectthe creation or destruction of any energy (except in nuclearchanges). The results of their experiments havebeen summarized in the law of conservation of energy,also known as the first law of thermodynamics:In all physical <strong>and</strong> chemical changes, energy is neither creatednor destroyed, but it may be converted from one form toanother.This scientific law tells us that when one form ofenergy is converted to another form in any physical orchemical change, energy input always equals energyoutput. No matter how hard we try or how clever weare, we cannot get more energy out of a system thanwe put in; in other words, we cannot get something fornothing in terms of energy quantity. This is one of MotherNature’s basic rules that we have to live with.What Is the Second Law of Thermodynamics?You Cannot Even Break EvenWhenever energy is changed from one form toanother we always end up with less usable energythan we started with.Because the first law of thermodynamics states thatenergy can be neither created nor destroyed, we maybe tempted to think we will always have enough energy.Yet if we fill a car’s tank with gasoline <strong>and</strong> drivearound or use a flashlight battery until it is dead,something has been lost. If it is not energy, what is it?The answer is energy quality (Figure 3-12), the amountof energy available that can perform useful work.Countless experiments have shown that when energyis changed from one form to another, a decreasein energy quality always occurs. The results of theseexperiments have been summarized in what is calledthe second law of thermodynamics: When energy ischanged from one form to another, some of the useful energyis always degraded to lower quality, more dispersed, lessuseful energy. This degraded energy usually takes theform of heat given off at a low temperature to the surroundings(environment). There it is dispersed by ther<strong>and</strong>om motion of air or water molecules <strong>and</strong> becomeseven less useful as a resource.In other words, we cannot even break even in terms ofenergy quality because energy always goes from a more usefulto a less useful form when energy is changed from oneform to another. No one has ever found a violation ofthis fundamental scientific law. It is another one ofMother Nature’s basic rules that we have to live with.Consider three examples of the second law ofthermodynamics in action. First, when a car is driven,only about 20–25% of the high-quality chemical energyavailable in its gasoline fuel is converted into mechanicalenergy (to propel the vehicle) <strong>and</strong> electricalenergy (to run its electrical systems). The remaining75–80% is degraded to low-quality heat that is releasedinto the environment <strong>and</strong> eventually lost into space.Thus, most of the money you spend for gasoline is notused to get you anywhere.Second, when electrical energy flows through filamentwires in an inc<strong>and</strong>escent lightbulb, it is changedinto about 5% useful light <strong>and</strong> 95% low-quality heatthat flows into the environment. In other words, thisso-called light bulb is really a heat bulb. Good news.Scientists have developed compact fluorescent bulbsthat are four times more efficient, <strong>and</strong> even more efficientbulbs are on the way. Do you use compact fluorescentbulbs?Third, in living systems, solar energy is convertedinto chemical energy (food molecules) <strong>and</strong> then intomechanical energy (moving, thinking, <strong>and</strong> living).During each of these conversions, high-quality energyis degraded <strong>and</strong> flows into the environment as lowqualityheat (Figure 3-17, p. 52). Trace the flows <strong>and</strong>energy conversions in this diagram.The second law of thermodynamics also meansthat we can never recycle or reuse high-quality energy toperform useful work. Once the concentrated energy in aserving of food, a liter of gasoline, a lump of coal, or achunk of uranium is released, it is degraded to lowqualityheat that is dispersed into the environment.Energy efficiency, or energy productivity, is ameasure of how much useful work is accomplished bya particular input of energy into a system. Good news.There is plenty of room for improving energy efficiency.Scientists estimate that only about 16% of theenergy used in the United States ends up performinguseful work. The remaining 84% is either unavoidablywasted because of the second law of thermodynamics(41%) or unnecessarily wasted (43%).Here is a lesson from thermodynamics. The cheapest<strong>and</strong> quickest way for us to get more energy is tohttp://biology.brookscole.com/miller1451
SolarenergyChemicalenergy(photosynthesis)Chemicalenergy(food)Mechanicalenergy(moving,thinking,living)WasteheatWasteheatWasteheatWasteheatFigure 3-17 The second law of thermodynamics in action in living systems. Each time energy ischanged from one form to another, some of the initial input of high-quality energy is degraded, usually to lowqualityheat that is dispersed into the environment.stop unnecessarily wasting almost half of the energywe use. We can do this by not driving gas-guzzlingmotor vehicles <strong>and</strong> by not living in poorly insulated<strong>and</strong> leaky houses. What are you doing to reduce yourunnecessary waste of energy?3-8 MATTER AND ENERGY LAWSAND ENVIRONMENTAL PROBLEMSWhat Is a High-Throughput Economy?An Accelerating TreadmillMost of today’s economies increase economicgrowth by converting the world’s resources togoods <strong>and</strong> services in ways that add large amountsof waste, pollution, <strong>and</strong> low-quality heat to theenvironment.As a result of the law of conservation of matter <strong>and</strong> thesecond law of thermodynamics, individual resourceuse automatically adds some waste heat <strong>and</strong> wastematter to the environment. Most of today’s advancedindustrialized countries have high-throughput (highwaste)economies that attempt to sustain ever-increasingeconomic growth by increasing the one-way flowof matter <strong>and</strong> energy resources through their economicsystems (Figure 3-18). These resources flowthrough their economies into planetary sinks (air, water,soil, organisms), where pollutants <strong>and</strong> wastes endup <strong>and</strong> can accumulate to harmful levels.What happens if more <strong>and</strong> more people continueto use <strong>and</strong> waste more <strong>and</strong> more energy <strong>and</strong> matter resourcesat an increasing rate? In other words, whathappens if most of the world’s people get infectedwith the affluenza virus?The law of conservation of matter <strong>and</strong> the twolaws of thermodynamics discussed in this chapter tellus that eventually this consumption will exceed the capacityof the environment to dilute <strong>and</strong> degrade wastematter <strong>and</strong> absorb waste heat. However, they do nottell us how close we are to reaching such limits.What Is a Matter-Recycling-<strong>and</strong>-ReuseEconomy? Go in Circles Instead of StraightLinesRecycling <strong>and</strong> reusing more of the earth’s matterresources slows down depletion of nonrenewablematter resources <strong>and</strong> reduces our environmentalimpact.There is a way to slow down the resource use <strong>and</strong>reduce our environmental impact in a high-throughputeconomy. We can convert such a linear high-throughputeconomy into a circular matter-recycling-<strong>and</strong>-reuseeconomy that recycles <strong>and</strong> reuses our matter outputsback instead of dumping them into the environment.Changing to a matter-recycling-<strong>and</strong>-reuse economyis an important way to buy some time. But thisdoes not allow more <strong>and</strong> more people to use more <strong>and</strong>more resources indefinitely, even if all of them were52 CHAPTER 3 Science, Systems, Matter, <strong>and</strong> Energy
Inputs(from environment)High-quality energyMatterSystemThroughputsUnsustainablehigh-wasteeconomyOutputs(into environment)Low-quality energy (heat)Waste <strong>and</strong> pollutionFigure 3-18 The high-throughputeconomies of most developedcountries are based on continually increasingthe rates of energy <strong>and</strong> matterflow. This produces valuable goods <strong>and</strong>services but also converts high-qualitymatter <strong>and</strong> energy resources intowaste, pollution, <strong>and</strong> low-quality heat.somehow perfectly recycled <strong>and</strong> reused. The reason isthat the two laws of thermodynamics tell us that recycling<strong>and</strong> reusing matter resources always requires usinghigh-quality energy (which cannot be recycled)<strong>and</strong> adds waste heat to the environment.What Is a Low-Throughput Economy?Learning from NatureWe can live more sustainably by reducing thethroughput of matter <strong>and</strong> energy in our economies,not wasting matter <strong>and</strong> energy resources, recycling<strong>and</strong> reusing most of the matter resources we use, <strong>and</strong>stabilizing the size of our population.Is there a better way out of the environmental situationthat we have gotten ourselves into? You bet. The threescientific laws governing matter <strong>and</strong> energy changessuggest that the best long-term solution to our environmental<strong>and</strong> resource problems is to shift from aneconomy based on increasing matter <strong>and</strong> energy flow(throughput) to a more sustainable low-throughput(low-waste) economy, as summarized in Figure 3-19.This means building on the concept of recycling <strong>and</strong>reusing as much matter as possible by also reducingthe throughput of matter <strong>and</strong> energy through an economy.This can be done by wasting less matter <strong>and</strong> energy,living more simply to decrease resource use perperson, <strong>and</strong> slowing population growth to reduce theEnergyEnergyconservationSustainablelow-wasteeconomyLow-qualityenergy(heat)MatterWaste <strong>and</strong>pollutionpreventionPollutioncontrolWaste<strong>and</strong>pollutionMatterFeedbackRecycle<strong>and</strong>reuseEnergy FeedbackFigure 3-19 Solutions: lessons from nature. A low-throughput economy, based on energy flow <strong>and</strong>matter recycling, works with nature to reduce the throughput of matter <strong>and</strong> energy resources (items shown ingreen). This is done by (1) reusing <strong>and</strong> recycling most nonrenewable matter resources, (2) using renewableresources no faster than they are replenished, (3) using matter <strong>and</strong> energy resources efficiently, (4) reducingunnecessary consumption, (5) emphasizing pollution prevention <strong>and</strong> waste reduction, <strong>and</strong> (6) controllingpopulation growth.http://biology.brookscole.com/miller1453
number of resource users. In other words, we learn tolive more sustainably by heeding the lessons from naturerevealed by the law of conservation of mass <strong>and</strong>the two laws of thermodynamics.The next five chapters apply the three basic scientificlaws of matter <strong>and</strong> thermodynamics to living systems<strong>and</strong> look at some biological principles that can alsoteach us how to live more sustainably by working withnature.The second law of thermodynamics holds, I think, thesupreme position among laws of nature. . . . If your theory isfound to be against the second law of thermodynamics, I cangive you no hope.ARTHUR S. EDDINGTONCRITICAL THINKING1. Respond to the following statements:a. Scientists have not absolutely proven that anyonehas ever died from smoking cigarettes.b. The greenhouse theory—that certain gases (such aswater vapor <strong>and</strong> carbon dioxide) warm the atmosphere—isnot a reliable idea because it is only ascientific theory.2. See whether you can find an advertisement or an articledescribing some aspect of science in which (a) theconcept of scientific proof is misused, (b) the term theoryis used when it should have been hypothesis, <strong>and</strong> (c) aconsensus scientific finding is dismissed or downplayedbecause it is “only a theory” or is not viewed as soundscience.3. How does a scientific law (such as the law of conservationof matter) differ from a societal law (such as maximumspeed limits for vehicles)? Can each be broken?Explain.4. Atree grows <strong>and</strong> increases its mass. Explain why thisis not a violation of the law of conservation of matter5. If there is no “away,” why is the world not filled withwaste matter?6. Methane (CH 4 ) gas is the major component ofnatural gas. Write <strong>and</strong> balance the chemical equationfor the burning of methane when it combines with oxygengas in the atmosphere to form carbon dioxide <strong>and</strong>water.7. Suppose you have 100 grams of radioactive plutonium-239with a half-life of 24,000 years. How manygrams of plutonium-239 will remain after (a) 12,000years, (b) 24,000 years, <strong>and</strong> (c) 96,000 years?8. Someone wants you to invest money in an automobileengine that will produce more energy than the energy inthe fuel (such as gasoline or electricity) you use to run themotor. What is your response? Explain.9. Use the second law of thermodynamics to explainwhy a barrel of oil can be used only once as a fuel.PROJECTS1. Use the library or Internet to find an example of junkscience <strong>and</strong> explain why it is junk science. Compare yourfindings with those of your classmates.2. (a) List two examples of negative feedback loops notdiscussed in this chapter, one that is beneficial <strong>and</strong> onethat is detrimental. Compare your examples with thoseof your classmates. (b) Give two examples of positivefeedback loops not discussed in this chapter. Include onethat is beneficial <strong>and</strong> one that is detrimental. Compareyour examples with those of your classmates.3. If you have the use of a sensitive balance, try todemonstrate the law of conservation of mass in a physicalchange. Weigh a container with a lid (a glass jar willdo), add an ice cube <strong>and</strong> weigh it again, <strong>and</strong> then allowthe ice to melt <strong>and</strong> weigh it again. Explain how your resultsobey the law of conservation of matter.4. Use the library or Internet to find examples of variousperpetual motion machines <strong>and</strong> inventions that allegedlyviolate the two laws of thermodynamics by producingmore high-quality energy than the high-quality energyneeded to make them run. What has happened to theseschemes <strong>and</strong> machines—many of them developed byscam artists to attract money from investors?5. Use the library or the Internet to find bibliographic informationabout Warren Weaver <strong>and</strong> Arthur S. Eddington,whose quotes appear at the beginning <strong>and</strong> end of thischapter.6. Make a concept map of this chapter’s major ideas usingthe section heads, subheads, <strong>and</strong> key terms (in boldface).Look on the website for this book for informationabout making concept maps.LEARNING ONLINEThe website for this book contains study aids <strong>and</strong> manyideas for further reading <strong>and</strong> research. They include achapter summary, review questions for the entire chapter,flash cards for key terms <strong>and</strong> concepts, a multiple-choicepractice quiz, interesting Internet sites, references, <strong>and</strong> aguide for accessing thous<strong>and</strong>s of InfoTrac ® CollegeEdition articles. Log on tohttp://biology.brookscole.com/miller14Then click on the Chapter-by-Chapter area, choose Chapter3, <strong>and</strong> select a learning resource.ConnectionsWhat Is Harming the Robins?54 CHAPTER 3 Science, Systems, Matter, <strong>and</strong> Energy
4Ecosystems:What Are They <strong>and</strong>How Do They Work?NutrientRecyclingWaterSoilEnergyBiodiversityCASE STUDYHave You Thanked theInsects Today?Insects have a bad reputation. We classify many aspests because they compete with us for food, spreadhuman diseases such as malaria, <strong>and</strong> invade ourlawns, gardens, <strong>and</strong> houses. Some people have“bugitis,” fear all insects, <strong>and</strong> think the only goodbug is a dead bug. This view fails to recognize thevital roles insects play in helping sustain life onearth.A large proportion of the earth’s plantspecies (including many trees) depends oninsects to pollinate their flowers (Figure 4-1,right). Without pollinating insects,we would have few fruits<strong>and</strong> vegetables to enjoy.Insects that eat other insectshelp control the populations of at leasthalf the species of insects we call pests.An example is the praying mantis(Figure 4-1, left). This free pestcontrolservice is an importantpart of the natural capital thathelps sustain us.Insects have been around for atleast 400 million years <strong>and</strong> are phenomenallysuccessful forms of life. Anestimated 10 quintillion (ten followed by18 zeros) insects live with us on the earth—about 1.6 million insects for each one of us.Some insects can reproduce at an astoundingrate. For example, a single female housefly<strong>and</strong> her offspring can theoretically produce about5.6 trillion houseflies in only one year.Insects can rapidly evolve new genetic traits,such as resistance to pesticides. They also have anexceptional ability to evolve into new specieswhen faced with new environmental conditions,<strong>and</strong> they are quite resistant to extinction.For example, we can apply chemical pesticidesto protect crops from pests. This can helpgrow more food. But there is a downside to pesticides.They can harm beneficial insects that helpprotect crops from other insects. Widespread use ofchemical pesticides can also accelerate the naturalability of rapidly reproducing insect pests to developgenetic resistance (immunity) to such chemicals. Thusin the long run, chemical pesticides can backfire <strong>and</strong>become less effective in reducing crop losses frominsect pests—a glaring example of unintendedconsequences.The environmental lesson is that although insectscan thrive without newcomers such as us, we <strong>and</strong>most other l<strong>and</strong> organisms would perish quicklywithout them. Learning about the roles insects playin nature requires us to underst<strong>and</strong> how insects <strong>and</strong>other organisms living in a biological community suchas a forest or pond interact with one another <strong>and</strong>with the nonliving environment. Ecology is the sciencethat studies such relationships <strong>and</strong> interactions in nature,as discussed in this <strong>and</strong> the following sixchapters.Figure 4-1 Insects play important roles in helping sustain life on earth. Thebright green caterpillar moth feeding on pollen in a crocus (right) <strong>and</strong> otherinsects pollinate flowering plants that serve as food for many plant eaters.The praying mantis eating a monarch butterfly (left) <strong>and</strong> many other insectspecies help control the populations of at least half of the insect species weclassify as pests.
The earth’s thin film of living matter is sustained by gr<strong>and</strong>scalecycles of energy <strong>and</strong> chemical elements.G. EVELYN HUTCHINSONThis chapter addresses the following questions:■■■■■■■■What is ecology?What basic processes keep us <strong>and</strong> other organismsalive?What are the major components of an ecosystem?What happens to energy in an ecosystem?What are soils, <strong>and</strong> how are they formed?What happens to matter in an ecosystem?How do scientists study ecosystems?What are two principles of sustainability derivedfrom learning how nature works?Organisms can be classified into species, groupsof organisms that resemble one another in appearance,behavior, chemistry, <strong>and</strong> genetic makeup. Scientistsuse a special system to name each species. (See Appendix4 to find out how biologists came up with the nameHomo sapiens sapiens for our current species.)Organisms that reproduce sexually by combiningcells from both parents are classified as members of thesame species if, under natural conditions, they canpotentially breed with one another <strong>and</strong> produce live,fertile offspring.How many species are on the earth? We do notknow. Estimates range from 3.6 million to 100 million,many of them in tropical forests. Most are insects <strong>and</strong>microorganisms too small to be seen with the nakedeye. A best guess is that we share the planet with10–14 million other species.So far biologists have identified, named, <strong>and</strong> brieflydescribed about 1.4 million species, most of them insects(Figure 4-4, p. 58).4-1 THE NATURE OF ECOLOGYWhat Is Ecology? Underst<strong>and</strong>ingConnectionsEcology is a study of connections in nature.Ecology (from the Greek words oikos, “house” or “placeto live,” <strong>and</strong> logos, “study of”) is the study of how organismsinteract with one another <strong>and</strong> with their nonlivingenvironment. In effect, it is a study of connectionsin nature—the house for the earth’s life. Ecologists focuson trying to underst<strong>and</strong> the interactions among organisms,populations, communities, ecosystems, <strong>and</strong>the biosphere (Figure 4-2).An organism is any form of life. The cell is the basicunit of life in organisms. Organisms may consist ofa single cell (bacteria, for instance) or many cells.Look in the mirror. What you see is about 10 trillioncells divided into about 200 different types.On the basis of their cell structure, organisms canbe classified as either eukaryotic or prokaryotic. Each cellof a eukaryotic organism is surrounded by a membrane<strong>and</strong> has a distinct nucleus (a membraneboundedstructure containing genetic material in theform of DNA), <strong>and</strong> several other internal parts calledorganelles (Figure 4-3a, p. 58). All organisms exceptbacteria <strong>and</strong> some algae are eukaryotic.Amembrane surrounds the cell of a prokaryotic organism,but the cell contains no distinct nucleus or otherinternal parts enclosed by membranes (Figure 4-3b). Allbacteria are single-celled prokaryotic organisms. Mostfamiliar organisms are eukaryotic, but they could notexist without hordes of prokaryotic organisms calledmicrobes that can only be seen only with the aid of amicroscope (see Case Study at right).Case Study: What Species Rule the World?Small Matters!Multitudes of tiny microbes such as bacteria,protozoa, fungi, <strong>and</strong> yeast help keep us alive.They are everywhere <strong>and</strong> there are trillions of them.Billions are found inside your body, on your body, in ah<strong>and</strong>ful of soil, <strong>and</strong> in a cup of river water.These mostly invisible rulers of the earth are microbes,a catchall term for many thous<strong>and</strong>s of species ofbacteria, protozoa, fungi, <strong>and</strong> yeasts—most too smallto be seen with the naked eye.Microbes do not get the respect they deserve.Most of us think of them as threats to our health in theform of infectious bacteria or “germs,” fungi thatcause athlete’s foot <strong>and</strong> other skin diseases, <strong>and</strong>protozoa that cause diseases such as malaria. But theseharmful microbes are in the minority.You are alive because of multitudes of microbestoiling away, mostly out of sight. You can thank microbesfor providing you with food by convertingnitrogen gas in the atmosphere into forms that plantscan take up from the soil as nutrients that keep youalive <strong>and</strong> well. Microbes also help produce foods suchas bread, cheese, yogurt, vinegar, tofu, soy sauce, beer,<strong>and</strong> wine. You should also thank bacteria <strong>and</strong> fungi inthe soil that decompose organic wastes into nutrientsthat can be taken up by plants that we <strong>and</strong> most otheranimals eat. Without these wee creatures we would beup to our eyeballs in waste matter.Microbes, especially bacteria, help purify the wateryou drink by breaking down wastes. Bacteria inyour intestinal tract break down the food you eat. Somemicrobes in your nose prevent harmful bacteria fromreaching your lungs. Others are the source of disease-56 CHAPTER 4 Ecosystems: What Are They <strong>and</strong> How Do They Work?
Universe?GalaxiesSupermacroorcosmic world(the very large)Solar systemsPlanetsBiosphereNASAEarthBiosphereEcosystemsEcosystemsCommunitiesRealmofecologyLifePopulationsMacro world(the ordinary)OrganismsCommunitiesOrgan systemsOrgansTissuesCellsPopulationsBorderlineProtoplasmMicro world(the very small)MoleculesNonlifeAtomsOrganismsSubatomic particlesFigure 4-2 Natural capital: levels of organization of matter in nature. Note the five levels that ecologyfocuses on.fighting antibiotics, including penicillin, erythromycin,<strong>and</strong> streptomycin. Genetic engineers are developingmicrobes that can extract metals from ores, break downvarious pollutants, <strong>and</strong> help clean up toxic waste sites.Some microbes help control plant diseases <strong>and</strong>populations of insect species that attack our foodcrops. Relying more on these microbes for pest controlcan reduce the use of potentially harmful chemicalpesticides.What Is a Population? Lifein a GroupMembers of a species interact in groups calledpopulations that live together in a particular place orhabitat.A population is a group of interacting individualsof the same species occupying a specific area (Figure4-5, p. 59). Examples are all sunfish in a pond,http://biology.brookscole.com/miller1457
(a) Eukaryotic CellNucleus(informationstorage)Energyconversion(b) Prokaryotic CellDNA(information storage, no nucleus)ProteinconstructionPackagingCell membrane(transport of rawmaterials <strong>and</strong>finished products)Protein construction<strong>and</strong> energy conversionoccur without specializedinternal structuresCell membrane(transport ofraw materials<strong>and</strong> finishedproducts)Figure 4-3 (a) Generalized structure of a eukaryotic cell. The parts <strong>and</strong> internal structure of cells in varioustypes of organisms such as plants <strong>and</strong> animals differ somewhat from this generalized model. (b) Generalizedstructure of a prokaryotic cell. Note that prokaryotic cells lack a distinct nucleus.)Known species1,412,000Other animals281,000Insects751,000Fungi69,000Prokaryotes4,800Protists57,700Plants248,400Figure 4-4 Natural capital:breakdown of the earth’s1.4 million known species.Biologists estimate that weshare the planet with 3.6 millionto 100 million species, with abest estimate of 10–14 millionspecies.white oak trees in a forest, <strong>and</strong> people in a country. Inmost natural populations, individuals vary slightly intheir genetic makeup, which is why they do not alllook or act alike. This is called a population’s geneticdiversity (Figure 4-6).The place or environment where a population (oran individual organism) normally lives is its habitat. Itmay be as large as an ocean or as small as the intestineof a termite.The area over which we can find a species is calledits distribution or range. Many species, such as sometropical plants, have a small range <strong>and</strong> may be foundon a single hillside. Other species such the grizzly bearhave large ranges.58 CHAPTER 4 Ecosystems: What Are They <strong>and</strong> How Do They Work?
Figure 4-5 A population ofmonarch butterflies. The geographicdistribution of thisbutterfly coincides with that ofthe milkweed plant, onwhich monarch larvae<strong>and</strong> caterpillars feed.Scientists studying ecosystems seek answers toseveral questions. First, how many members of eachspecies are present? Second, how do these organismscapture energy <strong>and</strong> matter (nutrients) from their environment?Third, how do they transfer energy <strong>and</strong>matter among themselves <strong>and</strong> to other ecosystems?Fourth, how do they release energy into the environment<strong>and</strong> return nutrients to the environment forrecycling?4-2 THE EARTH’S LIFE-SUPPORTSYSTEMSFigure 4-6 The geneticdiversity among individualsof onespecies ofCaribbean snail isreflected in thevariations in shellcolor <strong>and</strong> b<strong>and</strong>ingpatterns.What Are Communities <strong>and</strong> Ecosystems?Interactions in NatureA community consists of populations of differentspecies living <strong>and</strong> interacting in an area, <strong>and</strong> anecosystem is a community interacting with itsphysical environment of matter <strong>and</strong> energy.A community, or biological community, consists of allthe populations of the different species living <strong>and</strong> interactingin an area. It is a complex <strong>and</strong> interacting networkof plants, animals, <strong>and</strong> microorganisms.An ecosystem is a community of different speciesinteracting with one another <strong>and</strong> with their physicalenvironment of matter <strong>and</strong> energy. Ecosystems canrange in size from a puddle of water to a stream, apatch of woods, an entire forest, or a desert. Ecosystemscan be natural or artificial (human created). Examplesof artificial ecosystems are crop fields, farmponds, <strong>and</strong> reservoirs. All of the earth’s ecosystems togethermake up what we call the biosphere.What Are the Major Parts of the Earth’sLife-Support Systems? The Spheres of LifeThe earth is made up of interconnected sphericallayers that contain air, water, soil, minerals,<strong>and</strong> life.We can think of the earth as being made up of severalspherical layers, as diagrammed in Figure 4-7 (p. 60).Study this figure carefully. The atmosphere is a thin envelopeor membrane of air around the planet. Its innerlayer, the troposphere, extends only about 17 kilometers(11 miles) above sea level. It contains most of theplanet’s air, mostly nitrogen (78%) <strong>and</strong> oxygen(21%). The next layer, stretching 17–48 kilometers(11–30 miles) above the earth’s surface, isthe stratosphere. Its lower portion containsenough ozone (O 3 )tofilter out most of thesun’s harmful ultraviolet radiation. This allowslife to exist on l<strong>and</strong> <strong>and</strong> in the surface layersof bodies of water.The hydrosphere consists of the earth’s water.It is found as liquid water (both surface <strong>and</strong> underground),ice (polar ice, icebergs, <strong>and</strong> ice in frozen soillayers called permafrost), <strong>and</strong> water vapor in the atmosphere.The lithosphere is the earth’s crust <strong>and</strong> uppermantle; the crust contains nonrenewable fossil fuels(created from ancient fossils that were buried <strong>and</strong> subjectedto intense pressure <strong>and</strong> heat) <strong>and</strong> minerals, <strong>and</strong>renewable soil chemicals (nutrients) needed for plantlife.The biosphere is the portion of the earth in whichliving (biotic) organisms exist <strong>and</strong> interact with oneanother <strong>and</strong> with their nonliving (abiotic) environment.The biosphere includes most of the hydrosphere<strong>and</strong> parts of the lower atmosphere <strong>and</strong> upper lithosphere.It reaches from the deepest ocean floor, 20 kilometers(12 miles) below sea level, to the tops of thehighest mountains.All parts of the biosphere are interconnected. If theearth were an apple, the biosphere would be nothicker than the apple’s skin. The goal of ecology is to underst<strong>and</strong>the interactions in this thin, life-supporting globalmembrane of air, water, soil, <strong>and</strong> organisms.http://biology.brookscole.com/miller1459
AtmosphereVegetationBiosphere<strong>and</strong> animalsSoilRockCrustFigure 4-7 Naturalcapital: general structureof the earth. Theearth’s surface consistsof a crust of rock floatingon a mantle of solid<strong>and</strong> partly melted rock,which surrounds an intenselyhot core.OceaniccrustCoreMantleHydrosphere(water)Lithosphere(crust, top of upper mantle)ContinentalcrustLithosphereUpper mantleAsthenosphereLower mantleAtmosphere(air)Crust (soil<strong>and</strong> rock)Biosphere(living <strong>and</strong> deadorganisms)How Does the Sun Help Sustain Lifeon Earth? A Distant Nuclear FusionReactorEnergy released by the gigantic nuclear fusionreactor we call the sun provides the light <strong>and</strong>heat needed to sustain the earth’s life.Energy from the sun supports most life on theearth by lighting <strong>and</strong> warming the planet. It supportsphotosynthesis, the process in which greenplants <strong>and</strong> some bacteria make compounds suchas carbohydrates that keep them alive <strong>and</strong> feedmost other organisms. And it powers the cyclingof matter <strong>and</strong> drives the climate <strong>and</strong> weathersystems that distribute heat <strong>and</strong> fresh water overthe earth’s surface.About one-billionth of the sun’s output ofenergy reaches the earth—a tiny sphere in thevastness of space—in the form of electromagneticwaves (Figure 3-10, p. 45). The amount ofenergy reaching the earth from the sun equalsthe amount of heat energy the earth reflects orradiates back into space. Otherwise, the earthwould heat up to temperatures too hot for life aswe know it.Much of the sun’s incoming energy is reflectedaway or absorbed by chemicals, dust,<strong>and</strong> clouds in the atmosphere as shown in Fig-What Sustains Life on Earth? Sun, Cycles,<strong>and</strong> GravitySolar energy, the cycling of matter, <strong>and</strong> gravity sustainthe earth’s life.Life on the earth depends on three interconnected factors,shown in Figure 4-8.■ The one-way flow of high-quality energy from the sun,through materials <strong>and</strong> living things in their feedinginteractions, into the environment as low-qualityenergy (mostly heat dispersed into air or water moleculesat a low temperature), <strong>and</strong> eventually back intospace as heat. No round-trips are allowed because energycannot be recycled.■ The cycling of matter (the atoms, ions, or moleculesneeded for survival by living organisms) throughparts of the biosphere. Because the earth is closed tosignificant inputs of matter from space, the earth’s essentiallyfixed supply of nutrients must be recycledagain <strong>and</strong> again for life to continue. Nutrient trips inecosystems are round-trips.■ Gravity, which allows the planet to hold onto itsatmosphere <strong>and</strong> causes the downward movement ofchemicals in the matter cycles.CarboncyclePhosphoruscycleBiosphereNitrogencycleHeat in the environmentWatercycleOxygencycleHeat Heat HeatFigure 4-8 Natural capital: life on the earth depends on the onewayflow of energy (dashed lines) from the sun through the biosphere,the cycling of crucial elements (solid lines around circles),<strong>and</strong> gravity, which keeps atmospheric gases from escaping intospace <strong>and</strong> draws chemicals downward in the matter cycles. Thissimplified model depicts only a few of the many cycling elements.60 CHAPTER 4 Ecosystems: What Are They <strong>and</strong> How Do They Work?
Figure 4-9 Solar capital: flow of energy to <strong>and</strong>from the earth.SolarradiationEnergy in = Energy outReflected byatmosphere (34%)UV radiationAbsorbedby ozoneAbsorbedby theearthVisiblelightRadiated byatmosphereas heat (66%)Lower Stratosphere(ozone layer)GreenhouseTroposphere effectHeatEarthure 4-9. About 80% of the energy that gets throughwarms the troposphere <strong>and</strong> evaporates <strong>and</strong> cycles waterthrough the biosphere. About 1% of this incomingenergy generates winds, <strong>and</strong> green plants, algae, <strong>and</strong>bacteria use less than 0.1% to fuel photosynthesis.Most of the solar radiation making it though the atmospherehits the surface of the earth <strong>and</strong> is degradedinto longer-wavelength infrared radiation. This infraredradiation interacts with so-called greenhouse gases(such as water vapor, carbon dioxide, methane, nitrousoxide, <strong>and</strong> ozone) in the troposphere. The radiationcauses these gaseous molecules to vibrate <strong>and</strong> releaseinfrared radiation with even longer wavelengths intothe troposphere. As this radiation interacts with moleculesin the air, it increases their kinetic energy, helpingwarm the troposphere <strong>and</strong> the earth’s surface. Withoutthis natural greenhouse effect, the earth would be toocold for life as we know it to exist <strong>and</strong> you would not bearound to read this book.Heat radiatedby the earthViewed from outer space, the earth resemblesan enormous jigsaw puzzle consistingof large masses of l<strong>and</strong> <strong>and</strong> vastexpanses of ocean.Biologists have classified the terrestrial(l<strong>and</strong>) portion of the biosphere intobiomes (“BY-ohms”). They are large regionssuch as forests, deserts, <strong>and</strong> grassl<strong>and</strong>scharacterized by a distinct climate<strong>and</strong> specific species (especially vegetation)adapted to it (Figure 4-10, p. 62).Scientists divide the watery parts ofthe biosphere into aquatic life zones, eachcontaining numerous ecosystems. Examples includefreshwater life zones (such as lakes <strong>and</strong> streams) <strong>and</strong>ocean or marine life zones (such as coral reefs, coastal estuaries,<strong>and</strong> the deep ocean).What Are the Major Componentsof Ecosystems? Matter, Energy, LifeEcosystems consist of nonliving (abiotic) <strong>and</strong> living(biotic) components.Two types of components make up the biosphere <strong>and</strong>its ecosystems. One type, called abiotic, consists ofnonliving components such as water, air, nutrients,<strong>and</strong> solar energy. The other type, called biotic, consistsof biological components—plants, animals, <strong>and</strong>microbes.Figures 4-11 (p. 63) <strong>and</strong> 4-12 (p. 63) are greatlysimplified diagrams of some of the biotic <strong>and</strong> abioticcomponents in a freshwater aquatic ecosystem <strong>and</strong> aterrestrial ecosystem.4-3 ECOSYSTEM COMPONENTSWhat Are Biomes <strong>and</strong> Aquatic Life Zones? Lifeon L<strong>and</strong> <strong>and</strong> at SeaLife exists on l<strong>and</strong> systems called biomes <strong>and</strong> infreshwater <strong>and</strong> ocean aquatic life zones.How Tolerant Are Organisms to<strong>Environmental</strong> Conditions? ToleranceLimitsPopulations of different species can thrive onlyunder certain physical <strong>and</strong> chemical conditions.Populations of different species thrive under differentphysical conditions. Some need bright sunlight, <strong>and</strong>http://biology.brookscole.com/miller1461
Coastal chaparral<strong>and</strong> scrubConiferousforestDesertConiferousforestPrairiegrassl<strong>and</strong>DeciduousforestCoastalmountainrangesSierraNevadaMountainsGreatAmericanDesertRockyMountainsGreatPlainsMississippiRiver ValleyAppalachianMountains15,000 ft.10,000 ft.5,000 ft.Average annual precipitation100–125 cm (40–50 in.)75–100 cm (30–40 in.)50–75 cm (20–30 in.)25–50 cm (10–20 in.)below 25 cm (0–10 in.)Figure 4-10 Natural capital: major biomes found along the 39th parallel across the United States. Thedifferences reflect changes in climate, mainly differences in average annual precipitation <strong>and</strong> temperature (notshown).others thrive better in shade. Some need a hot environment<strong>and</strong> others a cool or cold one. Some do best underwet conditions <strong>and</strong> others under dry conditions.Each population in an ecosystem has a range oftolerance to variations in its physical <strong>and</strong> chemicalenvironment (Figure 4-13, p. 64). Individuals within apopulation may also have slightly different toleranceranges for temperature or other factors because ofsmall differences in genetic makeup, health, <strong>and</strong> age.For example, a trout population may do best within anarrow b<strong>and</strong> of temperatures (optimum level or range),but a few individuals can survive above <strong>and</strong> belowthat b<strong>and</strong> (Figure 4-13). However, if the water becomestoo hot or too cold, none of the trout can survive.These observations are summarized in the law oftolerance: The existence, abundance, <strong>and</strong> distribution of aspecies in an ecosystem are determined by whether the levelsof one or more physical or chemical factors fall within therange tolerated by that species. A species may have a widerange of tolerance to some factors <strong>and</strong> a narrow rangeof tolerance to others. Most organisms are least tolerantduring juvenile or reproductive stages of their lifecycles. Highly tolerant species can live in a variety ofhabitats with widely different conditions. Figure 4-14(p. 64) shows how environmental physical conditionscan limit the distribution of a particular species.What Factors Limit Population Growth?There Are Always Limits in NatureAvailability of matter <strong>and</strong> energy resourcescan limit the number of organisms in apopulation.Avariety of factors can affect the number of organismsin a population. However, sometimes one factor, knownas a limiting factor, is more important in regulatingpopulation growth than other factors. This ecologicalprinciple, related to the law of tolerance, is called thelimiting factor principle: Too much or too little of any abioticfactor can limit or prevent growth of a population, even ifall other factors are at or near the optimum range of tolerance.On l<strong>and</strong>, precipitation often is the limiting factor.Lack of water in a desert limits plant growth. Soil nutrientsalso can act as a limiting factor on l<strong>and</strong>. Supposea farmer plants corn in phosphorus-poor soil.Even if water, nitrogen, potassium, <strong>and</strong> other nutrientsare at optimum levels, the corn will stop growingwhen it uses up the available phosphorus.62 CHAPTER 4 Ecosystems: What Are They <strong>and</strong> How Do They Work?
SunProducers (rooted plants)Producers (phytoplankton)Primary consumers (zooplankton)Secondary consumer (fish)DissolvedchemicalsTertiary consumer(turtle)SedimentDecomposers (bacteria <strong>and</strong> fungi)Figure 4-11 Major components of a freshwater ecosystem.Oxygen (O 2 )SunProducerCarbon dioxide (CO 2 )Primary consumer(rabbit)Secondary consumer(fox)PrecipitationFalling leaves<strong>and</strong> twigsProducersSoil decomposersWaterSoluble mineral nutrientsFigure 4-12 Major components of an ecosystem in a field.http://biology.brookscole.com/miller1463
NoorganismsLower limitof toleranceFeworganismsAbundance of organismsFeworganismsUpper limitof toleranceNoorganismsPopulation sizeZone ofintoleranceZone ofphysiological stressOptimum rangeZone ofphysiological stressZone ofintoleranceLowTemperatureHighFigure 4-13 Range of tolerance for a population of organisms, such as fish, to an abiotic environmentalfactor—in this case, temperature.Sugar Mapleoxygen gas dissolved in a given volume of water at aparticular temperature <strong>and</strong> pressure. Another limitingfactor in aquatic ecosystems is salinity—the amountsof various inorganic minerals or salts dissolved in agiven volume of water.Figure 4-14 The physical conditions of the environment can limitthe distribution of a species. The green area shows the currentrange of sugar maple trees in eastern North America. (Data fromU.S. Department of Agriculture).Too much of an abiotic factor can also be limiting.For example, too much water or too much fertilizercan kill plants, a common mistake of many beginninggardeners.Important limiting factors for aquatic ecosystemsinclude temperature, sunlight, nutrient availability,<strong>and</strong> dissolved oxygen (DO) content—the amount ofWhat Are the Major Biological Componentsof Ecosystems? Producers <strong>and</strong>ConsumersSome organisms in ecosystems produce food <strong>and</strong>others consume food.The earth’s organisms either produce or consumefood. Producers, sometimes called autotrophs (selffeeders),make their own food from compounds obtainedfrom their environment.On l<strong>and</strong>, most producers are green plants. Infreshwater <strong>and</strong> marine ecosystems, algae <strong>and</strong> plantsare the major producers near shorelines. In open water,the dominant producers are phytoplankton—mostly microscopicorganisms that float or drift in the water.Most producers capture sunlight to make carbohydrates(such as glucose, C 6 H 12 O 6 )byphotosynthesis.Although hundreds of chemical changes take placeduring photosynthesis, the overall chemical reactioncan be summarized as follows:carbon dioxide water solar energy glucose oxygen6 CO 2 6 H 2 O solar energy C 6 H 12 O 6 6 O 264 CHAPTER 4 Ecosystems: What Are They <strong>and</strong> How Do They Work?
Figure 4-15 Feeding relationships between producers,consumers, <strong>and</strong> decomposers.Soil <strong>and</strong> WaterNutrientsBreak downorganic matterfor recyclingDecomposers(bacteria, fungi)Producers(plants <strong>and</strong>phytoplankton)ConsumersFeeding onLiving OrganismsPrimaryConsumersFeeding onProducers(rabbits, zooplankton)Secondary<strong>and</strong> HigherConsumers Feeding onOther Consumers(foxes, turtles, hawks)ConsumersFeeding onDead Organismsor the Organic Wastes ofLiving OrganismsScavengers(vultures, hyenas)A few producers, mostly specialized bacteria,can convert simple compounds fromtheir environment into more complex nutrientcompounds without sunlight. Thisprocess is called chemosynthesis.All other organisms in an ecosystemare consumers, or heterotrophs(“other feeders”) thatget the energy <strong>and</strong> nutrientsthey need by feeding on otherorganisms or their remains.Decomposers (mostly certaintypes of bacteria <strong>and</strong> fungi)are specialized consumersthat recycle organic matter inecosystems. They do this bybreaking down (biodegrading)dead organic material orDetritus Feedersdetritus (“di-TRI-tus”, meaning“debris”) to get nutrients.(crabs, termites)This releases the resultingsimpler inorganic compoundsinto the soil <strong>and</strong> water, where producerscan take them up as nutrients.Life works in circles.Figure 4-15 shows the feeding relationshipsamong producers, consumers feeding onlive or dead organisms or their wastes, <strong>and</strong> decomposers.Trace the flows of matter <strong>and</strong> energy in this diagram.Some consumers, called omnivores, play dualroles by feeding on both plants <strong>and</strong> animals. Examplesare pigs, rats, foxes, bears, cockroaches, <strong>and</strong> humans.When you had lunch today were you an herbivore, acarnivore, or an omnivore?Detritivores consist of detritus feeders <strong>and</strong> decomposersthat feed on detritus. Hordes of these wasteeaters <strong>and</strong> degraders can transform a fallen tree trunkinto a powder <strong>and</strong> finally into simple inorganic moleculesthat plants can absorb as nutrients (Figure 4-16,p. 66). In natural ecosystems, there is little or no waste.One organism’s wastes serve as resources for others,as the nutrients that make life possible are recycledagain <strong>and</strong> again. In nature waste becomes food.Producers, consumers, <strong>and</strong> decomposers use thechemical energy stored in glucose <strong>and</strong> other organiccompounds to fuel their life processes. In most cellshttp://biology.brookscole.com/miller1465
Detritus feedersDecomposersLong-hornedbeetle holesBark beetleengravingCarpenterantgalleriesTermite <strong>and</strong>carpenterantworkDry rot fungusWoodreducedto powderMushroomTime progressionPowder broken down by decomposersinto plant nutrients in soilFigure 4-16 Natural capital: Some detritivores, called detritus feeders, directly consume tiny fragments of thislog. Other detritivores, called decomposers (mostly fungi <strong>and</strong> bacteria), digest complex organic chemicals infragments of the log into simpler inorganic nutrients that can be used again by producers.this energy is released by aerobic respiration, whichuses oxygen to convert organic nutrients back into carbondioxide <strong>and</strong> water. The net effect of the hundredsof steps in this complex process is represented by thefollowing chemical reaction:glucose oxygencarbon dioxide water energyC 6 H 12 O 6 6 O 2 6 CO 2 6 H 2 O energyAlthough the detailed steps differ, the net chemicalchange for aerobic respiration is the opposite of thatfor photosynthesis (p. 64).Some decomposers get the energy they need bybreaking down glucose (or other organic compounds)in the absence of oxygen. This form of cellular respirationis called anaerobic respiration, or fermentation.Instead of carbon dioxide <strong>and</strong> water, the end productsof this process are compounds such as methane gas(CH 4 , the main component of natural gas), ethyl alcohol(C 2 H 6 O), acetic acid (C 2 H 4 O 2 , the key componentof vinegar), <strong>and</strong> hydrogen sulfide (H 2 S, when sulfurcompounds are broken down). This is a plan B way toget a meal.The survival of any individual organism dependson the flow of matter <strong>and</strong> energy through its body. However,an ecosystem as a whole survives primarilythrough a combination of matter recycling (rather thanone-way flow) <strong>and</strong> one-way energy flow (Figure 4-17).Figure 4-17 sums up most of what is going on in ourplanetary home.Decomposers complete the cycle of matter bybreaking down detritus into inorganic nutrients thatcan be reused by producers. These waste eaters <strong>and</strong>nutrient recyclers provide us with this crucial ecologicalservice <strong>and</strong> never send us a bill. Without decomposers,the entire world would be knee-deep in plantlitter, dead animal bodies, animal wastes, <strong>and</strong> garbage,<strong>and</strong> most life as we know it would no longer exist.Have you thanked a decomposer today?What Is Biodiversity? Variety Is the Spiceof LifeA vital renewable resource is the biodiversityfound in the earth’s variety of genes, species,ecosystems, <strong>and</strong> ecosystem processes.66 CHAPTER 4 Ecosystems: What Are They <strong>and</strong> How Do They Work?
HeatDecomposers(bacteria, fungi)Abiotic chemicals(carbon dioxide,oxygen, nitrogen,minerals)HeatHeatProducers(plants)Solarenergythe fertility of soils, dispose of wastes, <strong>and</strong> control populationsof pests that attack crops <strong>and</strong> forests.Biodiversity is a renewable resource as long welive off the biological income it provides instead of thenatural capital that supplies this income.Some scientists say that the loss <strong>and</strong> degradationof biodiversity is the most important environmentalproblem we face. This is why underst<strong>and</strong>ing, protecting,<strong>and</strong> sustaining biodiversity is a major theme ofecology <strong>and</strong> of this book.4-4 ENERGY FLOW IN ECOSYSTEMSHeatConsumers(herbivores,carnivores)HeatFigure 4-17 Natural capital: the main structural componentsof an ecosystem (energy, chemicals, <strong>and</strong> organisms).Matter recycling <strong>and</strong> the flow of energy from the sun, throughorganisms, <strong>and</strong> then into the environment as low-quality heat,link these components.Biological diversity, or biodiversity, is one of theearth’s most important renewable resources. Kinds ofbiodiversity include the following:■ Genetic diversity: the variety of genetic materialwithin a species or a population■ Species diversity: the number of species present indifferent habitats■ Ecological diversity: the variety of terrestrial<strong>and</strong> aquatic ecosystems found in an area or on theearth■ Functional diversity: the biological <strong>and</strong> chemicalprocesses such as energy flow <strong>and</strong> matter cyclingneeded for the survival of species, communities, <strong>and</strong>ecosystems (Figure 4-17)Some people also include human cultural diversityas part of the earth’s biodiversity. Each human culturehas developed various ways to deal with changing environmentalconditions.The earth’s biodiversity is the biological wealth orcapital that helps keep us alive <strong>and</strong> supports oureconomies. Biologist Edward O. Wilson describes theearth’s biodiversity as a “natural or biological Internet”that all living things are part of.The earth’s biodiversity supplies us with food,wood, fibers, energy, raw materials, industrial chemicals,<strong>and</strong> medicines—all of which pour hundreds of billionsof dollars into the world economy each year. It alsohelps preserve the quality of the air <strong>and</strong> water, maintainWhat Are Food Chains <strong>and</strong> FoodWebs? Maps of Ecological InterdependenceFood chains <strong>and</strong> webs show how eaters, the eaten,<strong>and</strong> the decomposed are connected to one anotherin an ecosystem.All organisms, whether dead or alive, are potentialsources of food for other organisms. A caterpillar eats aleaf, a robin eats the caterpillar, <strong>and</strong> a hawk eats therobin. Decomposers consume the leaf, caterpillar, robin,<strong>and</strong> hawk after they die. As a result, there is little matterwaste in natural ecosystems.The sequence of organisms, each of which is asource of food for the next, is called a food chain. It determineshow energy <strong>and</strong> nutrients move from one organismto another through an ecosystem (Figure 4-18,p. 68).Ecologists assign each organism in an ecosystemto a feeding level, also called a trophic level, dependingon whether it is a producer or a consumer <strong>and</strong> onwhat it eats or decomposes. Producers belong to thefirst trophic level, primary consumers to the secondtrophic level, secondary consumers to the third, <strong>and</strong> soon. Detritivores <strong>and</strong> decomposers process detritusfrom all trophic levels.Real ecosystems are more complex than this. Mostconsumers feed on more than one type of organism,<strong>and</strong> most organisms are eaten or decomposed by morethan one type of consumer. Because most species participatein several different food chains, the organisms inmost ecosystems form a complex network of interconnectedfood chains called a food web. Trace the flows ofmatter <strong>and</strong> energy within the simplified food web inFigure 4-19 (p. 69). Trophic levels can be assigned infood webs just as in food chains. Afood web shows howeaters, the eaten, <strong>and</strong> the decomposed are connected toone another. It is a map of life’s interdependence.How Can We Represent the Energy Flowin an Ecosystem? Think PyramidThere is a decrease in the amount of energy availableto each succeeding organism in a food chain or web.http://biology.brookscole.com/miller1467
First TrophicLevelSecond TrophicLevelThird TrophicLevelFourth TrophicLevelProducers(plants)Primaryconsumers(herbivores)Secondaryconsumers(carnivores)Tertiaryconsumers(top carnivores)Heat Heat HeatSolarenergyHeatHeatHeatHeatDetritivores(decomposers <strong>and</strong> detritus feeders)HeatFigure 4-18 Model of a food chain. The arrows show how chemical energy in food flows through varioustrophic levels in energy transfers; most of the energy is degraded to heat, in accordance with the second law ofthermodynamics. Food chains rarely have more than four trophic levels. Can you figure out why?Each trophic level in a food chain or web contains acertain amount of biomass, the dry weight of all organicmatter contained in its organisms. In a foodchain or web, chemical energy stored in biomass istransferred from one trophic level to another.Energy transfer through food chains <strong>and</strong> foodwebs is not very efficient. The reason is that with eachtransfer some usable energy is degraded <strong>and</strong> lost tothe environment as low-quality heat, in accordancewith the second law of thermodynamics. Thus only asmall portion of what is eaten <strong>and</strong> digested is actuallyconverted into an organism’s bodily material or biomass,<strong>and</strong> the amount of usable energy available toeach successive trophic level declines.The percentage of usable energy transferredas biomass from one trophic level to the next is calledecological efficiency. It ranges from 2% to 40%(that is, a loss of 60–98%) depending on the typesof species <strong>and</strong> the ecosystem involved, but 10% istypical.Assuming 10% ecological efficiency (90% loss) ateach trophic transfer, if green plants in an area manageto capture 10,000 units of energy from the sun, thenonly about 1,000 units of energy will be available tosupport herbivores <strong>and</strong> only about 100 units to supportcarnivores.The more trophic levels in a food chain or web, thegreater the cumulative loss of usable energy as energyflows through the various trophic levels. The pyramidof energy flow in Figure 4-20 (p. 70) illustrates thisenergy loss for a simple food chain, assuming a 90%energy loss with each transfer. How does this diagramhelp explain why there are not very many tigers in theworld? Figure 4-21 (p. 70) shows the pyramid of energyflow during 1 year for an aquatic ecosystem inSilver Springs, Florida.Energy flow pyramids explain why the earth cansupport more people if they eat at lower trophic levelsby consuming grains, vegetables, <strong>and</strong> fruits directlyrather than passing such crops through another trophiclevel <strong>and</strong> eating grain eaters such as cattle.The large loss in energy between successivetrophic levels also explains why food chains <strong>and</strong> websrarely have more than four or five trophic levels. Inmost cases, too little energy is left after four or fivetransfers to support organisms feeding at these hightrophic levels. This explains why there are so few topcarnivores such as eagles, hawks, tigers, <strong>and</strong> whitesharks. It also explains why such species usually arethe first to suffer when the ecosystems supportingthem are disrupted, <strong>and</strong> why these species are so vulnerableto extinction. Do you think we are on this list?68 CHAPTER 4 Ecosystems: What Are They <strong>and</strong> How Do They Work?
HumansBlue whaleSperm whaleCrabeater sealElephantsealKiller whaleLeopardsealEmperorpenguinAdelie ´penguinsPetrelSquidFishCarnivorous planktonKrillHerbivorouszooplanktonPhytoplanktonFigure 4-19 Greatly simplified food web in the Antarctic. Many more participants in theweb, including an array of decomposer organisms, are not depicted here. This is part of life’sinternet.http://biology.brookscole.com/miller1469
Figure 4-20 Generalized pyramid of energy flow showing thedecrease in usable energy available at each succeeding trophic levelin a food chain or web. In nature, ecological efficiency varies from 2%to 40%, with 10% efficiency being common. This model assumes a10% ecological efficiency (90% loss of usable energy to the environment,in the form of low-quality heat) with each transfer from onetrophic level to another.10Tertiaryconsumers(human)Secondaryconsumers(perch)HeatDecomposersHeatHeat100Heat1,000Primaryconsumers(zooplankton)Heat10,000Usable energyavailable ateach tropic level(in kilocalories)Producers(phytoplankton)Figure 4-21 Annual energy flow (in kilocalories persquare meter per year) for an aquatic ecosystem inSilver Springs, Florida. (From Cecie Starr, Biology:Concepts <strong>and</strong> Applications, 4th ed., Brooks/Cole[Wadsworth] © 2000)Top carnivoresCarnivoresHerbivoresProducers213833,36820,810Decomposers/detritivores5,0604-5 PRIMARY PRODUCTIVITYOF ECOSYSTEMSHow Fast Can Producers Produce Biomass?A Very Important RateDifferent ecosystems use solar energy to produce<strong>and</strong> use biomass at different rates.The rate at which an ecosystem’s producers convertsolar energy into chemical energy as biomass is theecosystem’s gross primary productivity (GPP). Figure4-22 shows how this productivity varies across theearth.To stay alive, grow, <strong>and</strong> reproduce, an ecosystem’sproducers must use some of the biomass they producefor their own respiration. Net primary productivity(NPP) is the rate at which producers use photosynthesisto store energy minus the rate at which they use someof this stored energy through aerobic respiration asshown in Figure 4-23. In other words, NPP GPP R,where R is energy used in respiration. NPP is a measureof how fast producers can provide the food needed byconsumers in an ecosystem.Various ecosystems <strong>and</strong> life zones differ in theirNPP, as graphed in Figure 4-24 (p. 72). Looking at thisgraph, what are the three most productive <strong>and</strong> thethree least productive systems? Generally, would youexpect NPP to be higher at the equator than at theearth’s poles? Why? Despite its low net primary productivity,there is so much open ocean that it producesmore of the earth’s NPP per year than any of the otherecosystems <strong>and</strong> life zones shown in Figure 4-24.In agricultural systems, the goal is to increase theNPP <strong>and</strong> biomass of selected crop plants by addingwater (irrigation) <strong>and</strong> nutrients (mostly nitrates <strong>and</strong>phosphates in fertilizers). Despite such inputs, theNPP of agricultural l<strong>and</strong> is not very high comparedwith that of other terrestrial ecosystems (Figure 4-24).How Does the World’s Net Rate of BiomassProduction Limit the Populations of ConsumerSpecies? Nature’s LimitsThe number of consumer organisms the earthcan support is determined by how fast producerscan supply them with energy found inbiomass.As we have seen, producers are the source of all foodin an ecosystem. Only the biomass represented byNPP is available as food for consumers <strong>and</strong> they useonly a portion of this. Thus the planet’s NPP ultimatelylimits the number of consumers (including humans) thatcan survive on the earth. This is an important lessonfrom nature.70 CHAPTER 4 Ecosystems: What Are They <strong>and</strong> How Do They Work?
Figure 4-22 Satellite data on the earth’s gross primary productivity in terms of ocean <strong>and</strong> l<strong>and</strong> concentrationsof chlorophyll in producer organisms during the winter of 2004. On l<strong>and</strong> rain forests <strong>and</strong> other highly productiveareas are dark green <strong>and</strong> the least productive (mostly deserts) are brown or white in polar areas. At sea,the concentration of chlorophyll found in phytoplankton, a primary indicator of ocean productivity, ranges fromred (highest) to orange, yellow, green, light blue, <strong>and</strong> dark blue (lowest). Where are the areas of highest <strong>and</strong>lowest productivity on l<strong>and</strong> <strong>and</strong> at sea? (Image data from SeaWiFs Project/NASA <strong>and</strong> by kind permission ofORBIMAGE. All rights reserved.)It is tempting to conclude from Figure 4-24 that agood way to feed the world’s hungry millions wouldbe to harvest plants in highly productive estuaries,swamps, <strong>and</strong> marshes. But people cannot eat mostplants in these areas. In addition, these plants providevital food sources (<strong>and</strong> spawning areas) for fish,shrimp, <strong>and</strong> other aquatic species that provide us <strong>and</strong>other consumers with protein.We might also conclude from Figure 4-24 that wecould grow more food for human consumption byclearing highly productive tropical rain forests <strong>and</strong>planting food crops. According to most ecologists, thisis also a bad idea. Here is why. In tropical rain forestsmost nutrients are stored in the vegetation rather thanin the soil, where they need to be to grow crops. Whenthe trees are removed, frequent rains <strong>and</strong> growing cropsrapidly deplete the nutrient-poor soils. Thus crops canbe grown for only a short time without massive <strong>and</strong> expensiveapplications of commercial fertilizers.Are the oceans a way out? Because the earth’s vastopen oceans provide the largest percentage of theearth’s net primary productivity, why not harvest itsprimary producers (floating <strong>and</strong> drifting phytoplankton)to help feed the rapidly growing human population?The problem is that harvesting the widelySunPhotosynthesisGross primaryproductionRespirationGrowth <strong>and</strong> reproductionEnergy lost <strong>and</strong>unavailable toconsumersNet primaryproduction(energyavailable toconsumers)Figure 4-23 Distinction between gross primary productivity <strong>and</strong>net primary productivity. A plant uses some of its gross primaryproductivity to survive through respiration. The remaining energyis available to consumers.http://biology.brookscole.com/miller1471
Terrestrial EcosystemsSwamps <strong>and</strong> marshesTropical rain forestTemperate forestNorthern coniferous forest (taiga)SavannaAgricultural l<strong>and</strong>Woodl<strong>and</strong> <strong>and</strong> shrubl<strong>and</strong>Temperate grassl<strong>and</strong>Tundra (arctic <strong>and</strong> alpine)Desert scrubExtreme desertAquatic EcosystemsEstuariesLakes <strong>and</strong> streamsContinental shelfOpen ocean800 1,600 2,400 3,200 4,000 4,800 5,600 6,400 7,200 8,000 8,800 9,6002Average net primary productivity (kcal/m /yr)Figure 4-24 Natural capital: estimated annual average net primary productivity (NPP) per unit of area inmajor life zones <strong>and</strong> ecosystems, expressed as kilocalories of energy produced per square meter per year(kcal/m 2 /yr). (Data from Communities <strong>and</strong> Ecosystems, 2nd ed., by R. H. Whittaker, 1975. New York:Macmillan)dispersed, tiny floating producers in the open oceanwould take much more fossil fuel <strong>and</strong> other types ofenergy than the food energy we would get. In addition,this would disrupt the food webs of the openocean that provide us <strong>and</strong> other consumer organismswith important sources of energy <strong>and</strong> protein fromfish <strong>and</strong> shellfish.How Much of the World’s Net Rate ofBiomass Production Do We Use? Let ThemEat CrumbsHumans are using, wasting, or destroying a significantamount of the world’s biomass faster than producerscan make it.Peter Vitousek, Stuart Roystaczer, <strong>and</strong> other ecologistsestimate that humans now use, waste, or destroy about27% of the earth’s total potential NPP <strong>and</strong> 10–55% ofthe NPP of the planet’s terrestrial ecosystems.These scientists contend that this is the main reasonwe are crowding out or eliminating the habitats<strong>and</strong> food supplies of a growing number of otherspecies. What might happen to us <strong>and</strong> to other consumerspecies if the human population doubles overthe next 40–50 years <strong>and</strong> per capita consumption of resourcessuch as food, timber, <strong>and</strong> grassl<strong>and</strong> risessharply? This is an important question!4-6 SOILSWhat Is Soil <strong>and</strong> Why Is It Important?The Base of Life on L<strong>and</strong>Soil is a slowly renewed resource that providesmost of the nutrients needed for plant growth <strong>and</strong>also helps purify water.Soil is a thin covering over most l<strong>and</strong> that is a complexmixture of eroded rock, mineral nutrients, decayingorganic matter, water, air, <strong>and</strong> billions of living organisms,most of them microscopic decomposers. Studythe diagram in Figure 4-25 showing the profile of differentaged soils. Soil is a renewable resource but it isrenewed very slowly. Depending mostly on climate,the formation of just 1 centimeter (0.4 inch) of soil cantake from 15 years to hundreds of years.Soil is the base of life on l<strong>and</strong> because it providesmost of the nutrients needed for plant growth. Indeed,you are mostly soil nutrients imported into your bodyby the food you eat. Soil is also the earth’s primary filterthat cleanses water as it passes through. It is also a72 CHAPTER 4 Ecosystems: What Are They <strong>and</strong> How Do They Work?
Oak treeWoodsorrelFernLords <strong>and</strong>ladiesEarthwormMillipedeHoneyfungusDog violetMoleGrasses <strong>and</strong>small shrubsOrganic debrisbuilds upMoss <strong>and</strong>lichenRockfragmentsO horizonLeaf litterA horizonTopsoilB horizonSubsoilBedrockImmature soilC horizonParentmaterialRegolithYoung soilPseudoscorpionMiteNematodeRoot systemMature soilRed earthmiteActinomycetesSpringtailFungusBacteriaFigure 4-25 Natural capital: soil formation <strong>and</strong> generalized soil profile. Horizons, or layers, vary innumber, composition, <strong>and</strong> thickness, depending on the type of soil. Soil is the base of life that provides thefood you need to stay alive <strong>and</strong> healthy. (From Derek Elsom, Earth, 1992. Copyright © 1992 by MarshallEditions Developments Limited, New York: Macmillan. Used by permission.)major component of the earth’s water recycling <strong>and</strong>water storage processes. You can thank soil every timeyou drink a glass of water.What Major Layers Are Found in MatureSoils? Layers CountMost soils developed over a long time consistof several layers containing different materials.Mature soils, or soils that have developed over a longtime, are arranged in a series of horizontal layerscalled soil horizons, each with a distinct texture <strong>and</strong>composition that varies with different types of soils.Across-sectional view of the horizons in a soil iscalled a soil profile. Most mature soils have at leastthree of the possible horizons (Figure 4-25). Thinkof them as floors in the building of life underneathyour feet.The top layer is the surface litter layer, or O horizon.It consists mostly of freshly fallen undecomposed orpartially decomposed leaves, twigs, crop wastes, animalwastes, fungi, <strong>and</strong> other organic materials. Normally,it is brown or black.The topsoil layer, or A horizon, is a porous mixtureof partially decomposed organic matter, called humus,<strong>and</strong> some inorganic mineral particles. It is usuallydarker <strong>and</strong> looser than deeper layers. A fertile soil thatproduces high crop yields has a thick topsoil layerwith lots of humus. This helps topsoil hold water <strong>and</strong>nutrients taken up by plant roots.The roots of most plants <strong>and</strong> most of a soil’s organicmatter are concentrated in a soil’s two upperlayers. As long as vegetation anchors these layers,soil stores water <strong>and</strong> releases it in a nourishingtrickle.The two top layers of most well-developed soilsteem with bacteria, fungi, earthworms, <strong>and</strong> small insectsthat interact in complex food webs such as theone shown in Figure 4-26 (p. 74). Bacteria <strong>and</strong> otherdecomposer microorganisms found by the billions inhttp://biology.brookscole.com/miller1473
every h<strong>and</strong>ful of topsoil break down some of itscomplex organic compounds into simpler inorganiccompounds soluble in water. Soil moisture carryingthese dissolved nutrients is drawn up by the roots ofplants <strong>and</strong> transported through stems <strong>and</strong> into leavesas part of the earth’s chemical cycling processes.The color of its topsoil tells us a lot about how usefula soil is for growing crops. Dark-brown or blacktopsoil is nitrogen-rich <strong>and</strong> high in organic matter.Gray, bright yellow, or red topsoils are low in organicmatter <strong>and</strong> need nitrogen enrichment to support mostcrops. Pick up a h<strong>and</strong>ful of soil <strong>and</strong> look at its color.What did you learn?The B horizon (subsoil) <strong>and</strong> the C horizon (parent material)contain most of a soil’s inorganic matter, mostlybroken-down rock consisting of varying mixtures ofs<strong>and</strong>, silt, clay, <strong>and</strong> gravel. The C horizon lies on a baseof unweathered parent rock called bedrock.The spaces, or pores, between the solid organic<strong>and</strong> inorganic particles in the upper <strong>and</strong> lower soil layerscontain varying amounts of air (mostly nitrogen<strong>and</strong> oxygen gas) <strong>and</strong> water. Plant roots need the oxygenfor cellular respiration.Some of the precipitation that reaches the soilpercolates through the soil layers <strong>and</strong> occupies manyof the soil’s open spaces or pores. This downwardmovement of water through soil is called infiltration.As the water seeps down, it dissolves various minerals<strong>and</strong> organic matter in upper layers <strong>and</strong> carries them tolower layers in a process called leaching.Most of the world’s crops are grown on soils exposedwhen grassl<strong>and</strong>s <strong>and</strong> deciduous (leaf-shedding)forests are cleared. Worldwide there are many thous<strong>and</strong>sof different soil types—at least 15,000 in theUnited States. Five important soil types, each with adistinct profile, are shown in Figure 4-27.Rove beetlePseudoscorpionFlatwormsAntCentipedeMiteGroundbeetleAdultflyFlylarvaeRoundwormsProtozoaBeetleMitesSpringtailMillipedeRoundwormsSowbugSlugBacteriaFungiSnailActinomycetesMiteEarthwormsOrganic debrisFigure 4-26 Natural capital: greatly simplified food web of living organisms found in soil.74 CHAPTER 4 Ecosystems: What Are They <strong>and</strong> How Do They Work?
Figure 4-27 Natural capital:soil profiles of the principal soiltypes typically found in five differentbiomes.Mosaicof closelypackedpebbles,bouldersWeak humus–mineral mixtureDry, brown toreddish-brownwith variableaccumulationsof clay, calciumcarbonate, <strong>and</strong>soluble saltsAlkaline,dark,<strong>and</strong> richin humusClay,calciumcompoundsDesert Soil(hot, dry climate)Grassl<strong>and</strong> Soil(semiarid climate)AcidiclightcoloredhumusIron <strong>and</strong>aluminumcompoundsmixed withclayForest litterleaf moldHumus–mineralmixtureLight, grayishbrown,silt loamDark brownfirm clayAcid litter<strong>and</strong> humusLight-colored<strong>and</strong> acidicHumus <strong>and</strong>iron <strong>and</strong>aluminumcompoundsTropical Rain Forest Soil(humid, tropical climate)Deciduous Forest Soil(humid, mild climate)Coniferous Forest Soil(humid, cold climate)How Do Soils Differ in Texture <strong>and</strong> Porosity?Composition <strong>and</strong> Spaces Are ImportantSoils vary in the size of the particles they contain <strong>and</strong>the amount of space between these particles.Soils vary in their content of clay (very fine particles),silt (fine particles), s<strong>and</strong> (medium-size particles), <strong>and</strong>gravel (coarse to very coarse particles). The relativeamounts of the different sizes <strong>and</strong> types of these mineralparticles determine soil texture.To get an idea of a soil’s texture, take a smallamount of topsoil, moisten it, <strong>and</strong> rub it between yourfingers <strong>and</strong> thumb. A gritty feel means it contains a lotof s<strong>and</strong>. A sticky feel means a high clay content, <strong>and</strong>you should be able to roll it into a clump. Silt-ladensoil feels smooth, like flour. A loam topsoil is besthttp://biology.brookscole.com/miller1475
suited for plant growth. It has a texture between theseextremes—a crumbly, spongy feeling—with many ofits particles clumped loosely together.Soil texture helps determine soil porosity, a measureof the volume of pores or spaces per volume ofsoil <strong>and</strong> of the average distances between those spaces.Fine particles are needed for water retention <strong>and</strong>coarse ones for air spaces. A porous soil has manypores <strong>and</strong> can hold more water <strong>and</strong> air than a lessporous soil. The average size of the spaces or pores in asoil determines soil permeability: the rate at whichwater <strong>and</strong> air move from upper to lower soil layers.4-7 MATTER CYCLING IN ECOSYSTEMSWhat Are Biogeochemical Cycles? Going inCirclesGlobal cycles recycle nutrients through the earth’s air,l<strong>and</strong>, water, <strong>and</strong> living organisms <strong>and</strong>, in the process,connect past, present, <strong>and</strong> future forms of life.All organisms are interconnected by vast global recyclingsystems made up of nutrient cycles, or biogeochemicalcycles (literally, life–earth–chemical cycles).In these cycles, nutrient atoms, ions, <strong>and</strong> moleculesthat organisms need to live, grow, <strong>and</strong> reproduce arecontinuously cycled between air, water, soil, rock, <strong>and</strong>living organisms. These cycles, driven directly or indirectlyby incoming solar energy <strong>and</strong> gravity, includethe carbon, oxygen, nitrogen, phosphorus, <strong>and</strong> hydrologic(water) cycles (Figure 4-8).The earth’s chemical cycles connect past, present,<strong>and</strong> future forms of life. Some of the carbon atoms inyour skin may once have been part of a leaf, a dinosaur’sskin, or a layer of limestone rock. Your gr<strong>and</strong>mother,Plato, or a hunter–gatherer who lived 25,000years ago may have inhaled some of the oxygen moleculesyou just inhaled.How Is Water Cycled in the Biosphere?The Water CycleA vast global cycle collects, purifies, distributes, <strong>and</strong>recycles the earth’s fixed supply of water.The hydrologic cycle, or water cycle, recycles theearth’s fixed supply of water, as shown in Figure 4-28.Trace the flows <strong>and</strong> paths in this diagram. Solar energyevaporates water found on the earth’s surface into theatmosphere. Some of this water returns to the earth asrain or snow, passes through living organisms, flowsinto bodies of water, <strong>and</strong> eventually is evaporatedagain to continue the cycle. The water cycle differsfrom most other nutrient cycles in that most of the waterremains chemically unchanged <strong>and</strong> is transformedfrom one physical state to another.Rain cloudsCondensationPrecipitationPrecipitationto l<strong>and</strong>RunoffTranspirationTranspirationfrom plantsSurface runoff(rapid)Evaporationfrom l<strong>and</strong>EvaporationEvaporationfrom oceanPrecipitationPrecipitationto oceanInfiltration <strong>and</strong>PercolationSurfacerunoff(rapid)Groundwater movement (slow)Ocean storageFigure 4-28 Natural capital: simplified model of the global hydrologic cycle that helps keep you alive.76 CHAPTER 4 Ecosystems: What Are They <strong>and</strong> How Do They Work?
The main processes in this water recycling <strong>and</strong> purifyingcycle are evaporation (conversion of water intowater vapor), transpiration (evaporation from plantleaves after water is extracted from soil by roots <strong>and</strong>transported throughout the plant), condensation (conversionof water vapor into droplets of liquid water),precipitation (rain, sleet, hail, <strong>and</strong> snow), infiltration(movement of water into soil), percolation (downwardflow of water through soil <strong>and</strong> permeable rock formationsto groundwater storage areas called aquifers),<strong>and</strong> runoff (surface movement down slopes to the seato resume the cycle).The water cycle is powered by energy from thesun, which evaporates water into the atmosphere,<strong>and</strong> by gravity, which draws the water back to theearth’s surface as precipitation. About 84% of watervapor in the atmosphere comes from the oceans, <strong>and</strong>the rest comes from l<strong>and</strong>. This should not surpriseyou since almost three-fourths of the earth is coveredwith water.Winds <strong>and</strong> air masses transport water vapor overvarious parts of the earth’s surface, often over longdistances. Falling temperatures cause the water vaporto condense into tiny droplets that form clouds in thesky or fog near the surface. For precipitation to occur,air must contain condensation nuclei: tiny particles onwhich droplets of water vapor can collect. Sources ofsuch particles include volcanic ash, soil dust, smoke,sea salts, <strong>and</strong> particulate matter emitted by factories,coal-burning power plants, <strong>and</strong> motor vehicles.Currently about one-tenth of the fresh water returningto the earth’s surface as precipitation becomeslocked up in slowly flowing ice <strong>and</strong> snow called glaciers.But most precipitation falling on terrestrial ecosystemsbecomes surface runoff. This water flows intostreams <strong>and</strong> lakes, which eventually carry water backto the oceans, where it can evaporate <strong>and</strong> cycle again.Besides replenishing streams, lakes, <strong>and</strong> wetl<strong>and</strong>s,surface runoff also causes soil erosion, whichmoves soil <strong>and</strong> weathered rock fragments from oneplace to another. Water is thus the primary sculptor ofthe earth’s l<strong>and</strong>scape. Because water dissolves manynutrient compounds, it is also a major medium fortransporting nutrients within <strong>and</strong> between ecosystems<strong>and</strong> for removing <strong>and</strong> diluting wastes.Throughout the hydrologic cycle, many naturalprocesses purify water. Evaporation <strong>and</strong> subsequentprecipitation act as a natural distillation process thatremoves impurities dissolved in water. Water flowingabove ground through streams <strong>and</strong> lakes <strong>and</strong> belowground in aquifers is naturally filtered <strong>and</strong> purified bychemical <strong>and</strong> biological processes, mostly by the actionsof decomposer bacteria. Thus the hydrologic cyclecan also be viewed as a cycle of natural renewal of waterquality.How Are Human Activities Affectingthe Water Cycle? Messing with NatureWe alter the water cycle by withdrawing largeamounts of fresh water, clearing vegetation,eroding soils, polluting surface <strong>and</strong> undergroundwater, <strong>and</strong> contributing to climate change.During the past 100 years, we have been interveningin the earth’s current water cycle in four major ways.First, we withdraw large quantities of fresh waterfrom streams, lakes, <strong>and</strong> underground sources. Insome heavily populated or heavily irrigated areas,withdrawals have led to groundwater depletion or intrusionof ocean salt water into underground watersupplies.Second, we clear vegetation from l<strong>and</strong> for agriculture,mining, road <strong>and</strong> building construction, <strong>and</strong>other activities <strong>and</strong> sometimes cover the l<strong>and</strong> withbuildings, concrete, or asphalt. This increases runoff,reduces infiltration that recharges groundwater supplies,increases the risk of flooding, <strong>and</strong> accelerates soilerosion <strong>and</strong> l<strong>and</strong>slides. We also increase flooding bydestroying wetl<strong>and</strong>s, which act like sponges to absorb<strong>and</strong> hold overflows of water.Third, we modify water quality by adding nutrients(such as phosphates <strong>and</strong> nitrates found in fertilizers)<strong>and</strong> other pollutants. Fourth, according to a 2003study by Ruth Curry <strong>and</strong> her colleagues, the earth’swater cycle is speeding up as a result of a warmer climatecaused partially by human inputs of carbon dioxide<strong>and</strong> other greenhouse gases into the atmosphere.This could change global precipitation patterns thataffect the severity <strong>and</strong> frequency of droughts, floods,<strong>and</strong> storms. It can also intensify global warming byspeeding up the input of water vapor—a powerfulgreenhouse gas—into the troposphere.How Is Carbon Cycled in the Biosphere?Carbon Dioxide in ActionCarbon, the basic building block of organic compounds,recycles through the earth’s air, water, soil,<strong>and</strong> living organisms.Carbon is the basic building block of the carbohydrates,fats, proteins, DNA, <strong>and</strong> other organic compoundsnecessary for life. It is circulated through thebiosphere by the carbon cycle, as shown in Figure 4-29(p. 78). Trace the flows <strong>and</strong> paths in this diagram.This cycle is based on carbon dioxide gas, whichmakes up about 0.038% of the volume of the troposphere<strong>and</strong> is also dissolved in water. The aerobicrespiration of organisms, volcanic eruptions, the weatheringof carbonate rocks, <strong>and</strong> the burning of carboncontainingcompounds found in wood, grasses, <strong>and</strong>fossil fuels add carbon dioxide to the troposphere.http://biology.brookscole.com/miller1477
Figure 4-29 Naturalcapital: simplifiedmodel of the globalcarbon cycle that helpskeep you alive. The leftportion shows themovement of carbonthrough marine systems,<strong>and</strong> the right portionshows its movementthrough terrestrialecosystems. Carbonreservoirs are shown asboxes; processes thatchange one form ofcarbon to another areshown in unboxed print.(From Cecie Starr,Biology: Concepts<strong>and</strong> Applications,4th ed., Brooks/Cole[Wadsworth] © 2000)Diffusion betweenatmosphere <strong>and</strong> oceanCarbon dioxidedissolved inocean waterMarine food websProducers, consumers,decomposers, detritivoresCombustion of fossil fuelsMarine sediments, includingformations with fossil fuelsAerobic respiration in the cells of oxygen-using producers,consumers, <strong>and</strong> decomposers breaks down glucose<strong>and</strong> other complex organic compounds <strong>and</strong> convertsthe carbon back to CO 2 , which is released into the troposphere<strong>and</strong> in water for reuse by producers.Carbon dioxide is removed from the troposphereby terrestrial <strong>and</strong> aquatic producers, which use photosynthesisto convert it into complex carbohydrates suchas glucose (C 6 H 12 O 6 ).This linkage between photosynthesis in producers<strong>and</strong> aerobic respiration in producers, consumers, <strong>and</strong>decomposers circulates carbon in the biosphere <strong>and</strong> isa major part of the global carbon cycle. Oxygen <strong>and</strong>hydrogen, the other elements in carbohydrates, cyclealmost in step with carbon.Carbon dioxide is a key component of nature’sthermostat. If the carbon cycle removes too much CO 2from the atmosphere, the atmosphere will cool; if thecycle generates too much, the atmosphere will getwarmer. Thus even slight changes in the carbon cyclecan affect climate <strong>and</strong> ultimately the types of life thatcan exist on various parts of the planet.Some carbon atoms take a long time to recycle.Over millions of years, buried deposits of dead plantmatter <strong>and</strong> bacteria have been compressed betweenlayers of sediment, where they form carbon-containingfossil fuels such as coal <strong>and</strong> oil (Figure 4-29). This carbonis not released to the atmosphere as CO 2 for recyclinguntil these fuels are extracted <strong>and</strong> burned, oruntil long-term geological processes expose these depositsto air. In only a few hundred years, we have extracted<strong>and</strong> burned huge quantities of fossil fuels thattook millions of years to form. This is why fossil fuelsare nonrenewable resources on a human time scale.Oceans play important roles in the carbon cycle.Some of the atmosphere’s carbon dioxide dissolves inocean water, <strong>and</strong> the ocean’s photosynthesizing producersremove some. On the other h<strong>and</strong>, as ocean waterwarms, some of its dissolved CO 2 returns to theatmosphere, just as carbon dioxide fizzes out of a carbonatedbeverage when it warms. The balance betweenthese two processes plays a role in the earth’saverage temperature.Some ocean organisms build their shells <strong>and</strong> skeletonsby using dissolved CO 2 molecules in seawater toform carbonate compounds such as calcium carbonate(CaCO 3 ). When these organisms die, tiny particles oftheir shells <strong>and</strong> bone drift slowly to the ocean depths.There they are buried for eons (as long as 400 millionyears) in deep bottom sediments (Figure 4-29, left),where under immense pressure they are convertedinto limestone rock. Geological processes may eventu-78 CHAPTER 4 Ecosystems: What Are They <strong>and</strong> How Do They Work?
Atmosphere(most carbon is in carbon dioxide)volcanic actionCombustionof fossilfuelsTerrestrialrocksL<strong>and</strong> food websProducers, consumers,decomposers, detritivoresSoil water(dissolved carbon)Peat,fossil fuelsally expose the limestone to the atmosphere <strong>and</strong> acidicprecipitation <strong>and</strong> make its carbon available to livingorganisms once again.How Are Human Activities Affectingthe Carbon Cycle? Messing with Nature’sThermostatCarbon dioxide produced by burning fossilfuels <strong>and</strong> clearing photosynthesizing vegetationfaster than it is replaced can increase theaverage temperature of the troposphere.Since 1800 <strong>and</strong> especially since 1950, we have been interveningin the earth’s carbon cycle in two ways thatadd carbon dioxide to the atmosphere. First, in someareas we clear trees <strong>and</strong> other plants that absorb CO 2through photosynthesis faster than they can growback. Second, we add large amounts of CO 2 by burningfossil fuels (Figure 4-30) <strong>and</strong> wood.Computer models of the earth’s climate systemssuggest that increased concentrations of atmosphericCO 2 <strong>and</strong> other gases we are adding to the atmospherecould enhance the planet’s natural greenhouse effect thathelps warm the lower atmosphere (troposphere) <strong>and</strong>the earth’s surface (Figure 4-9). The resulting globalwarming could disrupt global food production <strong>and</strong>CO 2 emissions from fossil fuels(billion metric tons of caron equivalent)141312111098765432HighprojectionLowprojection101850 1900 1950 2000 2030YearFigure 4-30 Natural capital degradation: human interferencein the global carbon cycle from carbon dioxide emissions whenfossil fuels are burned, 1850 to 2001 <strong>and</strong> projections to 2030(dashed lines). (Data from UN Environment Programme, BritishPetroleum, International Energy Agency, <strong>and</strong> U.S. Departmentof Energy)http://biology.brookscole.com/miller1479
wildlife habitats, alter temperature <strong>and</strong> precipitationpatterns, <strong>and</strong> raise the average sea level in variousparts of the world—more about this in Chapter 21.How Is Nitrogen Cycledin the Biosphere? Bacteria in ActionDifferent types of bacteria help recycle nitrogenthrough the earth’s air, water, soil, <strong>and</strong> livingorganisms.Nitrogen is the atmosphere’s most abundant element,with chemically unreactive nitrogen gas (N 2 ) makingup about 78% of the volume of the troposphere. Nitrogenis a crucial component of proteins, many vitamins,<strong>and</strong> the nucleic acids DNA <strong>and</strong> RNA. However, N 2cannot be absorbed <strong>and</strong> used (metabolized) directly asa nutrient by multicellular plants or animals.Fortunately, two natural processes convert N 2 gasin the atmosphere into compounds that can enter foodwebs as part of the nitrogen cycle, depicted in Figure4-31. Trace the flows <strong>and</strong> paths in this diagram.One of these processes is atmospheric electrical dischargein the form of lightning. This causes nitrogen(N 2 ) <strong>and</strong> oxygen (O 2 ) in the atmosphere to react <strong>and</strong>produce nitrogen oxide (NO). Try to write <strong>and</strong> balancethe chemical equation for this reaction.The other process is carried out by certain types ofbacteria in aquatic systems, in the soil, <strong>and</strong> in the rootsof some plants that can convert or “fix” N 2 into compoundsuseful as nutrients for plants <strong>and</strong> animals.The nitrogen cycle consists of several major steps(Figure 4-31). In nitrogen fixation, specialized bacteriain the soil convert (“fix”) gaseous nitrogen (N 2 ) to ammonia(NH 3 ) that can be used by plants. See if you canwrite a balanced chemical equation for the reaction ofN 2 with H 2 to form NH 3 .Ammonia not taken up by plants may undergonitrification. In this process, specialized aerobic bacteriaconvert most of the ammonia in soil to nitriteions (NO 2 ), which are toxic to plants, <strong>and</strong> nitrate ionsNitrogenFixationby industryfor agricultureGaseous Nitrogen (N 2 )in AtmosphereFood Webson L<strong>and</strong>Fertilizersuptake byautotrophsexcretion, death,decompositionuptake byautotrophsNitrogen Fixationbacteria convert N 2 toammonia (NH 3 ); thisdissolves to formammonium (NH 4+ )Nitrogenous Wastes,Remains in SoilNO 3–in SoilDenitrificationby bacteriaNH 3 , NH 4+in SoilAmmonificationbacteria, fungi convert theresidues to NH 3 ; thisdissolves to form NH 4+2. Nitrificationbacteria convert NO 2–to nitrate (NO 3– )loss byleaching1. Nitrificationbacteria convert NH 4+to nitrite (NO 2– )NO 2–in Soilloss byleachingFigure 4-31 Natural capital: simplified model of the nitrogen cycle in a terrestrial ecosystem. Nitrogen reservoirsare shown as boxes; processes changing one form of nitrogen to another are shown in unboxed print.This cycle helps keep you alive. (From Cecie Starr <strong>and</strong> Ralph Taggart, Biology: The Unity <strong>and</strong> Diversity of Life,9th ed., Wadsworth © 2001)80 CHAPTER 4 Ecosystems: What Are They <strong>and</strong> How Do They Work?
(NO 3 ), which are easily taken up by plants as anutrient.Nitrogen fixation <strong>and</strong> nitrification add inorganicammonia, ammonium ions (NH 4 ), <strong>and</strong> nitrate ions tosoil water. Then plant roots can absorb these dissolvedsubstances in a step called assimilation. Plants use theseions to make nitrogen-containing organic moleculessuch as DNA, amino acids, <strong>and</strong> proteins. Animals inturn get their nitrogen by eating plants or plant-eatinganimals.Plants <strong>and</strong> animals return nitrogen-rich organiccompounds to the environment as wastes, cast-off particles,<strong>and</strong> dead bodies. In the ammonification step, vastarmies of specialized decomposer bacteria convert thisdetritus into simpler nitrogen-containing inorganiccompounds such as ammonia <strong>and</strong> water-soluble saltscontaining ammonium ions.Nitrogen leaves the soil in the denitrification step inwhich other specialized anaerobic bacteria in waterloggedsoil <strong>and</strong> in the bottom sediments of lakes,oceans, swamps, <strong>and</strong> bogs convert NH 3 <strong>and</strong> NH 4back into nitrite <strong>and</strong> nitrate ions <strong>and</strong> then into nitrogengas (N 2 ) <strong>and</strong> nitrous oxide gas (N 2 O). These gases arereleased to the atmosphere to begin the cycle again.Global nitrogen (N) fixation(trillion grams)200150100500Nitrogen fixation by natural processesNitrogen fixation by humanprocesses1920 1940 1960 1980 2000YearFigure 4-32 Natural capital degradation: human interferencein the global nitrogen cycle. Human activities such as productionof fertilizers now fix more nitrogen than all naturalsources combined. (Data from UN Environment Programme,UN Food <strong>and</strong> Agriculture Organization, <strong>and</strong> U.S. Department ofAgriculture)How Are Human Activities Affecting theNitrogen Cycle? Altering NatureExcessive inputs of various nitrogen-containingcompounds into the environment from humanactivities is becoming a major regional <strong>and</strong> globalenvironmental problem.In the past 100 years, human activities have had severaleffects on the earth’s current nitrogen cycle.First, we add large amounts of nitric oxide (NO) tothe atmosphere when we burn any fuel. In the atmosphere,this gas can be converted to nitrogen dioxidegas (NO 2 ) <strong>and</strong> nitric acid (HNO 3 ), which can return tothe earth’s surface as damaging acid deposition, commonlycalled acid rain—more on this in Chapter 20.Second, we add nitrous oxide (N 2 O) to the atmospherethrough the action of anaerobic bacteria onlivestock wastes <strong>and</strong> commercial inorganic fertilizersapplied to the soil. This gas can warm the troposphere<strong>and</strong> deplete ozone in the stratosphere.Third, we release large quantities of nitrogenstored in soils <strong>and</strong> plants as gaseous compounds intothe troposphere through destruction of forests, grassl<strong>and</strong>s,<strong>and</strong> wetl<strong>and</strong>s. Fourth, we upset aquatic ecosystemsby adding excess nitrates in agricultural runoff<strong>and</strong> discharges from municipal sewage systems—more on this in Chapter 22.Fifth, we remove nitrogen from topsoil when weharvest nitrogen-rich crops, irrigate crops, <strong>and</strong> burn orclear grassl<strong>and</strong>s <strong>and</strong> forests before planting crops.Sixth, inputs of nitrogen into the air, soil, <strong>and</strong> watermostly from our activities is beginning to affectthe biodiversity of terrestrial <strong>and</strong> aquatic systems byshifting their species composition towards speciesthat can thrive on increased supplies of nitrogennutrients.Since 1950, human activities have more than doubledthe annual release of nitrogen from the terrestrialportion of the earth into the rest of the environment(Figure 4-32). These excessive inputs of nitrogen intothe air <strong>and</strong> water is a serious local, regional, <strong>and</strong> globalenvironmental problem that so far has attracted fairlylittle attention compared to global environmentalproblems such as global warming <strong>and</strong> depletion ofozone in the stratosphere. Princeton University physicistRobert Socolow calls for the nations of the world towork out some type of international nitrogen managementagreement to help prevent this problem fromreaching crisis levels.How Is Phosphorus Cycled in theBiosphere? Slow Cycling without Usingthe AtmospherePhosphorus cycles fairly slowly through the earth’swater, soil, <strong>and</strong> living organisms.Phosphorus circulates through water, the earth’s crust,<strong>and</strong> living organisms in the phosphorus cycle, depictedhttp://biology.brookscole.com/miller1481
miningFertilizerexcretionuptake byautotrophsGuanoweatheringuptake byautotrophsagricultureMarineFoodWebsDissolvedin OceanWaterleaching, runoffDissolvedin Soil Water,Lakes, RiversL<strong>and</strong>FoodWebsdeath,decompositiondeath,decompositionsedimentationsettling outweatheringMarine Sedimentsuplifting overgeologic timeRocksFigure 4-33 Natural capital: simplified model of the phosphorus cycle. Phosphorus reservoirs are shown asboxes; processes that change one form of phosphorus to another are shown in unboxed print. This cyclehelps keep you alive. (From Cecie Starr <strong>and</strong> Ralph Taggart, The Unity <strong>and</strong> Diversity of Life, 9th ed.,Wadsworth © 2001)in Figure 4-33. Trace the flows <strong>and</strong> paths in this diagram.With the exception of small particles of phosphatein dust, very little phosphorus circulates in theatmosphere because soil conditions do not allow bacteriato convert chemical forms of phosphorus to gaseousforms of phosphorus. The phosphorus cycle is slow,<strong>and</strong> on a short human time scale much phosphorusflows one way from the l<strong>and</strong> to the oceans.Phosphorus is typically found as phosphate saltscontaining phosphate ions (PO 43)interrestrial rockformations <strong>and</strong> ocean bottom sediments. The weathering<strong>and</strong> erosion of phosphorus-containing rocks releasesphosphorus into soil water, lakes, <strong>and</strong> rivers asphosphate ions, which are taken up by plant roots.Animals get most of the phosphorus they need fromthe food they eat. Decomposers break down organicphosphorus compounds in dead organisms into thesoil where it can be reused by plants.Phosphate can be lost from the cycle for long periodswhen it washes from the l<strong>and</strong> into streams <strong>and</strong>rivers <strong>and</strong> is carried to the ocean. There it can bedeposited as sediment on the sea floor <strong>and</strong> remainfor millions of years. Someday geological uplift processesmay expose these seafloor deposits from whichphosphate can be eroded to start the cyclical processagain.Because most soils contain little phosphate, it is oftenthe limiting factor for plant growth on l<strong>and</strong> unlessphosphorus (as phosphate salts mined from the earth)is applied to the soil as a fertilizer. Phosphorus alsolimits the growth of producer populations in manyfreshwater streams <strong>and</strong> lakes because phosphate saltsare only slightly soluble in water.How Are Human Activities Affectingthe Phosphorus Cycle? More Messingwith NatureWe remove large amounts of phosphate fromthe earth to make fertilizer, reduce phosphorusin tropical soils by clearing forests, <strong>and</strong> addexcess phosphates to aquatic systems.We intervene in the earth’s phosphorus cycle in threeways. First, we mine large quantities of phosphate rockto make commercial inorganic fertilizers. Second, wereduce the available phosphate in tropical soils whenwe cut down areas of tropical forests. Third, we disruptaquatic systems with phosphates from runoff of ani-82 CHAPTER 4 Ecosystems: What Are They <strong>and</strong> How Do They Work?
mal wastes <strong>and</strong> fertilizers <strong>and</strong> discharges from sewagetreatment systems—more on this in Chapter 22.Scientists estimate that since 1900 human activitieshave increased the natural rate of phosphorus releaseinto the environment about 3.7-fold.How Is Sulfur Cycled in the Biosphere?The Sulfur CycleSulfur cycles through the earth’s air, water, soil,<strong>and</strong> living organisms.Sulfur circulates through the biosphere in the sulfurcycle, shown in Figure 4-34. Trace the flows <strong>and</strong> pathsin this diagram. Much of the earth’s sulfur is storedunderground in rocks <strong>and</strong> minerals, including sulfate2(SO 4 ) salts buried deep under ocean sediments.Sulfur also enters the atmosphere from severalnatural sources. Hydrogen sulfide (H 2 S)—a colorless,highly poisonous gas with a rotten-egg smell—is releasedfrom active volcanoes <strong>and</strong> from organic matterin swamps, bogs, <strong>and</strong> tidal flats broken down byanaerobic decomposers.Sulfur dioxide (SO 2 ), a colorless, suffocating gas,2also comes from volcanoes. Particles of sulfate (SO 4 )salts, such as ammonium sulfate, enter the atmospherefrom sea spray, dust storms, <strong>and</strong> forest fires. Plantroots absorb sulfate ions <strong>and</strong> incorporate the sulfur asan essential component of many proteins.Certain marine algae produce large amounts ofvolatile dimethyl sulfide, or DMS (CH 3 SCH 3 ). Tinydroplets of DMS serve as nuclei for the condensationof water into droplets found in clouds. Thus changesin DMS emissions can affect cloud cover <strong>and</strong> climate.In the atmosphere DMS is converted to sulfur dioxide.In the atmosphere, sulfur dioxide (SO 2 ) fromnatural sources <strong>and</strong> human activities is convertedto sulfur trioxide gas (SO 3 ) <strong>and</strong> to tiny droplets ofsulfuric acid (H 2 SO 4 ). Sulfur dioxide also reacts withother atmospheric chemicals such as ammonia toproduce tiny particles of sulfate salts. These droplets<strong>and</strong> particles fall to the earth as components of acid deposition,which along with other air pollutants canharm trees <strong>and</strong> aquatic life—more on this in Chapter20.In the oxygen-deficient environments of floodedsoils, freshwater wetl<strong>and</strong>s, <strong>and</strong> tidal flats, specializedbacteria convert sulfate ions to sulfide ions (S 2 ). Thesulfide ions can then react with metal ions to form insolublemetallic sulfides, which are deposited as rock,<strong>and</strong> the cycle continues.WaterSulfur trioxide Sulfuric acid Acidic fog <strong>and</strong> precipitationSulfur dioxideOxygenHydrogen sulfideAmmoniaAmmonium sulfatePlantsDimethyl sulfideVolcanoIndustriesAnimalsOceanSulfate saltsMetallicsulfidedepositsDecaying matterSulfurHydrogen sulfideFigure 4-34 Natural capital: simplified model of the sulfur cycle.http://biology.brookscole.com/miller1483
How Are Human Activities Affecting theSulfur Cycle? Overloading NatureWe add sulfur dioxide to the atmosphere by burningcoal <strong>and</strong> oil, refining oil, <strong>and</strong> producing some metalsfrom ores.We add sulfur dioxide to the atmosphere in threeways. First, we burn sulfur-containing coal <strong>and</strong> oil toproduce electric power. Second, we refine sulfurcontainingpetroleum to make gasoline, heating oil,<strong>and</strong> other useful products. Third, we convert sulfurcontainingmetallic mineral ores into free metals suchas copper, lead, <strong>and</strong> zinc.Private owner 1Critical nesting sitelocationsUSDA Forest ServiceUSDAForest ServicePrivate owner 2Topography4-8 HOW DO ECOLOGISTS LEARNABOUT ECOSYSTEMS?What Is Field Research? Muddy BootsEcologyEcologists go into ecosystems <strong>and</strong> hang out in treetopsto learn what organisms live there <strong>and</strong> how theyinteract.Field research involves going into nature <strong>and</strong> observing<strong>and</strong> measuring the structure of ecosystems <strong>and</strong> whathappens in them. Most of what we know about thestructure <strong>and</strong> functioning of ecosystems described inthis chapter has come from such research.Ecologists trek through forests, deserts, <strong>and</strong> grassl<strong>and</strong>s<strong>and</strong> wade or boat through wetl<strong>and</strong>s, lakes, <strong>and</strong>streams collecting <strong>and</strong> observing species. Sometimesthey carry out controlled experiments by isolating <strong>and</strong>changing a variable in part of an area <strong>and</strong> comparingthe results with nearby unchanged areas.Tropical ecologists erect tall construction cranesinto the canopies of tropical forests to identify <strong>and</strong> observethe rich diversity of species living or feeding inthese treetop habitats.Increasingly, ecologists are using new technologiesto collect field data. These include remote sensingfrom aircraft <strong>and</strong> satellites <strong>and</strong> geographic informationsystems (GISs), in which information gathered frombroad geographic regions is stored in spatial databases(Figure 4-35). Then computers <strong>and</strong> GIS software cananalyze <strong>and</strong> manipulate the data <strong>and</strong> combine themwith ground <strong>and</strong> other data. These efforts can producecomputerized maps of forest cover, water resources,air pollution emissions, coastal changes, relationshipsbetween cancers <strong>and</strong> sources of pollution, <strong>and</strong> changesin global sea temperatures.Most satellite sensors use either reflected light orreflected infrared radiation to gather data. However,some new satellites have radar sensors that measurethe reflection of microwave energy from the earth.Wetl<strong>and</strong>LakeForestGrassl<strong>and</strong>Habitat typeReal worldFigure 4-35 Geographic information systems (GISs) providethe computer technology for organizing, storing, <strong>and</strong> analyzingcomplex data collected over broad geographic areas. GISsenable scientists to overlay many layers of data (such as soils,topography, distribution of endangered populations, <strong>and</strong> l<strong>and</strong>protection status).These microwaves can “see” in the dark <strong>and</strong> penetratesmoke, clouds, haze, <strong>and</strong> water. This method is alsobeing used to map the topography of the ocean floor<strong>and</strong> provide information about ocean currents <strong>and</strong>upward flows of nutrients from the ocean bottom (upwellings)that sustain fisheries.How Are Ecosystems Studied in theLaboratory? Life under GlassEcologists use aquarium tanks, greenhouses, <strong>and</strong>controlled indoor <strong>and</strong> outdoor chambers to studyecosystems.During the past 50 years, ecologists have increasinglysupplemented field research by using laboratory researchto set up, observe, <strong>and</strong> make measurements ofmodel ecosystems <strong>and</strong> populations under laboratoryconditions. Such simplified systems have been set upin containers such as culture tubes, bottles, aquariumtanks, <strong>and</strong> greenhouses <strong>and</strong> in indoor <strong>and</strong> outdoor84 CHAPTER 4 Ecosystems: What Are They <strong>and</strong> How Do They Work?
chambers where temperature, light, CO 2 , humidity,<strong>and</strong> other variables can be controlled carefully.Such systems make it easier for scientists to carryout controlled experiments. In addition, such laboratoryexperiments often are quicker <strong>and</strong> cheaper thansimilar experiments in the field.But there is a catch. We must consider whetherwhat scientists observe <strong>and</strong> measure in a simplified,controlled system under laboratory conditions takesplace in the same way in the more complex <strong>and</strong> dynamicconditions found in nature. Thus the results oflaboratory research must be coupled with <strong>and</strong> supportedby field research.SystemsMeasurementDataAnalysisDefine objectivesIdentify <strong>and</strong> inventory variablesObtain baseline data on variablesMake statistical analysis ofrelationships among variablesDetermine significant interactionsWhat Is Systems Analysis? SimulatingEcosystemsEcologists develop mathematical <strong>and</strong> other modelsto simulate the behavior of ecosystems.Since the late 1960s, ecologists have made increasinguse of systems analysis to develop mathematical <strong>and</strong>other models that simulate ecosystems. Computersimulation of such models can help us underst<strong>and</strong>large <strong>and</strong> very complex systems (such as rivers,oceans, forests, grassl<strong>and</strong>s, cities, <strong>and</strong> climate) thatcannot be adequately studied <strong>and</strong> modeled in field<strong>and</strong> laboratory research. Figure 4-36 outlines the majorstages of systems analysis.Researchers can change values of the variables intheir computer models to project possible changes inenvironmental conditions, help anticipate environmentalsurprises, <strong>and</strong> analyze the effectiveness of variousalternative solutions to environmental problems.However, simulations <strong>and</strong> projections made usingecosystem models are no better than the data <strong>and</strong> assumptionsused to develop the models. Thus carefulfield <strong>and</strong> laboratory ecological research must be usedto provide the baseline data <strong>and</strong> determine the causalrelationships between key variables needed to develop<strong>and</strong> test ecosystem models.Why Do We Need Baseline Ecological Data?Underst<strong>and</strong>ing What We HaveWe need baseline data on the world’s ecosystems sowe can see how they are changing <strong>and</strong> develop effectivestrategies for preventing or slowing their degradation.According to a 2002 ecological study published by theHeinz Foundation, scientists have less than half of thebasic ecological data they need to evaluate the statusof ecosystems in the United States. Even fewer data areavailable for most other parts of the world.Before we can underst<strong>and</strong> what is happening toan ecosystem, community, or population <strong>and</strong> how bestSystemModelingSystemSimulationSystemOptimizationConstruct mathematical modeldescribing interactions amongvariablesRun the model on a computer,with values entered for differentvariablesEvaluate best ways to achieveobjectivesFigure 4-36 Major stages of systems analysis. (Modified datafrom Charles Southwick)to prevent harmful environmental changes, we need toknow its current condition. In other words, we needbaseline data about its components, physical <strong>and</strong> chemicalconditions, <strong>and</strong> how well it is functioning.By analogy your doctor would like to have baselinedata on your blood pressure, weight, <strong>and</strong> howwell your organs <strong>and</strong> other systems are functioning asrevealed by blood <strong>and</strong> other basic tests. Then whensomething happens to your health the doctor can runnew tests <strong>and</strong> compare the results with the baselinedata to determine what has changed <strong>and</strong> use this tocome up with a treatment.Ecologists call for a massive program to developbaseline data for the world’s ecosystems. If we do notknow how many elephants are in Africa, we cannotdetermine whether their populations are declining orincreasing.If we could see the bounty <strong>and</strong> beauty of naturethe way it was 100 or 200 years ago, we would be outragedat what we have lost. But it is easy for us not tomiss what we never saw or experienced.http://biology.brookscole.com/miller1485
For example, people visit degraded coastal environmentssuch as a coral reef <strong>and</strong> call it beautiful becausethey are unaware how it used to look. Veter<strong>and</strong>ivers say, “You should have seen it in the old days.”In this chapter we have seen that almost all naturalecosystems <strong>and</strong> the biosphere itself achieve long-termsustainability in two ways. First, they use renewable solarenergy as their energy source. Second, they recycle thechemical nutrients their organisms need for survival,growth, <strong>and</strong> reproduction.These two sustainability principles arise from thestructure <strong>and</strong> function of natural ecosystems (Figures4-8 <strong>and</strong> 4-17), the law of conservation of matter(p. 47), <strong>and</strong> the two laws of thermodynamics (p. 51).Thus the results of basic research in both the physical<strong>and</strong> biological sciences provide us with the sameguidelines or lessons from nature on how we can livemore sustainably on the earth, as summarized in Figure3-19 (p. 53).All things come from earth, <strong>and</strong> to earth they all return.MENANDER (342–290 B.C.)CRITICAL THINKING1. (a) A bumper sticker asks, “Have you thanked a greenplant today?” Give two reasons for appreciating a greenplant. (b) Trace the sources of the materials that make upthe bumper sticker, <strong>and</strong> decide whether the sticker itselfis a sound application of the slogan.2. Explain why microbes are the real rulers of the earth.3. Explain how decomposers help keep you alive.4. (a) How would you set up a self-sustaining aquariumfor tropical fish? (b) Suppose you have a balanced aquariumsealed with a clear glass top. Can life continue in theaquarium indefinitely as long as the sun shines regularlyon it? (c) A friend cleans out your aquarium <strong>and</strong> removesall the soil <strong>and</strong> plants, leaving only the fish <strong>and</strong> water.What will happen? Explain.5. Make a list of the food you have eaten today <strong>and</strong> traceeach type of food back to a particular producer.6. Use the second law of thermodynamics (p. 51) to explainwhy there is such a sharp decrease in usable energyas energy flows through a food chain or web. Does anenergy loss at each step violate the first law of thermodynamics(p. 51)? Explain.7. Use the second law of thermodynamics (p. 51) to explainwhy many poor people in developing countries liveon a mostly vegetarian diet.8. Why do farmers not need to apply carbon to growtheir crops but often need to add fertilizer containing nitrogen<strong>and</strong> phosphorus?9. Carbon dioxide (CO 2 ) in the atmosphere fluctuatessignificantly on a daily <strong>and</strong> seasonal basis. Why are CO 2levels higher during the day than at night?10. What would happen to an ecosystem if (a) all its decomposers<strong>and</strong> detritus feeders were eliminated or (b) allits producers were eliminated? Are we necessary for thefunctioning of any natural ecosystem? Explain.PROJECTS1. Visit several types of nearby aquatic life zones <strong>and</strong>terrestrial ecosystems. For each site, try to determinethe major producers, consumers, detritivores, <strong>and</strong>decomposers.2. Write a brief scenario describing the sequence of consequencesto us <strong>and</strong> to other forms of life if each of thefollowing nutrient cycles stopped functioning: (a) carbon,(b) nitrogen, (c) phosphorus, <strong>and</strong> (d) water.3. Use the library or the Internet to find out bibliographicinformation about G. Evelyn Hutchinson <strong>and</strong> Men<strong>and</strong>er,whose quotes are found at the beginning <strong>and</strong> end of thischapter.4. Make a concept map of this chapter’s major ideas usingthe section heads, subheads, <strong>and</strong> key terms (in boldface).Look on the website for this book for informationabout making concept maps.LEARNING ONLINEThe website for this book contains study aids <strong>and</strong> manyideas for further reading <strong>and</strong> research. They include achapter summary, review questions for the entire chapter,flash cards for key terms <strong>and</strong> concepts, a multiple-choicepractice quiz, interesting Internet sites, references, <strong>and</strong> aguide for accessing thous<strong>and</strong>s of InfoTrac ® CollegeEdition articles. Log on tohttp://biology.brookscole.com/miller14Then click on the Chapter-by-Chapter area, choose Chapter4, <strong>and</strong> select a learning resource.86 CHAPTER 4 Ecosystems: What Are They <strong>and</strong> How Do They Work?
5Evolution <strong>and</strong> BiodiversityBiodiversityCASE STUDYEarth: The Just-Right,Resilient PlanetLife on the earth (Figure 5-1) as we know it needs acertain temperature range: Venus is much too hot <strong>and</strong>Mars is much too cold, but the earth is just right. Otherwise,you would not be reading these words.Life as we know it depends on the liquid water thatdominates the earth’s surface. Temperature is crucialbecause most life on the earth needs average temperaturesbetween the freezing <strong>and</strong> boiling points of water.The earth’s orbit is the right distance from the sunto provide these conditions. If the earth were muchcloser, it would be too hot—like Venus—for watervapor to condense to form rain. If it were much fartheraway, its surface would be so cold—like Mars—that its water would exist only as ice. The earth alsospins; if it did not, the side facing the sun would betoo hot <strong>and</strong> the other side too cold for water-based lifeto exist.The earth is also the right size: it has enoughgravitational mass to keep its iron <strong>and</strong> nickelcore molten <strong>and</strong> to keep the light gaseous moleculesin its atmosphere (such as N 2 , O 2 , CO 2 , <strong>and</strong>H 2 O) from flying off into space.On a time scale of millions of years, theearth is enormously resilient <strong>and</strong> adaptive. Duringthe 3.7 billion years since life arose, the averagesurface temperature of the earth has remainedwithin the narrow range of 10–20°C(50–68°F), even with a 30–40% increase in thesun’s energy output. What a great temperaturecontrol system.For several hundred million years oxygenhas made up about 21% of the volume of earth’satmosphere. This is fortunate for us <strong>and</strong> mostother forms of life. If the atmosphere’s oxygencontent dropped to about 15%, this would belethal for most forms of life. If it increased toabout 25%, oxygen in the atmosphere wouldprobably ignite into a giant fireball. And thanks to thedevelopment of photosynthesizing bacteria more than2 billion years ago, an ozone sunscreen protects us<strong>and</strong> many other forms of life from an overdose of ultravioletradiation. In short, this remarkable planet welive on is just right for life as we know it.We can summarize the 3.7-billion-year biologicalhistory of the earth in one sentence: Organisms convertsolar energy to food, chemicals cycle, <strong>and</strong> a variety ofspecies with different biological roles (niches) has evolved inresponse to changing environmental conditions. Perhapsthe two most astounding features of the planet are itsincredibly rich diversity of life <strong>and</strong> its inherent abilityto sustain life.Here is the essence of this chapter. Each specieshere today represents a long chain of evolution <strong>and</strong>plays a unique ecological role (called its niche) in theearth’s communities <strong>and</strong> ecosystems. These species,communities, <strong>and</strong> ecosystems also are essential for futureevolution as populations of species continue toadapt to changes in environmental conditions.Figure 5-1 Natural capital: the earth, a blue <strong>and</strong> whiteplanet in the black void of space. Currently, it has theright physical <strong>and</strong> chemical conditions to allow the developmentof life as we know it.NASA
There is gr<strong>and</strong>eur to this view of life . . . that, whilst thisplanet has gone cycling on . . . endless forms most beautiful<strong>and</strong> most wonderful have been, <strong>and</strong> are being, evolved.CHARLES DARWINThis chapter addresses the following questions:■■■■■How do scientists account for the emergence of lifeon the earth?What is evolution, <strong>and</strong> how has it led to the currentdiversity of organisms on the earth?What is an ecological niche, <strong>and</strong> how does it help apopulation adapt to changing environmental conditions?How do extinction of species <strong>and</strong> formation of newspecies affect biodiversity?What is the future of evolution <strong>and</strong> what should beour role in this future?5-1 ORIGINS OF LIFEHow Did Life Emerge on the Primitive Earth?Chemistry First, Then BiologyEvidence indicates that the earth’s life is the resultof about 1 billion years of chemical evolution to formthe first cells, followed by about 3.7 billion years ofbiological evolution to form the species we find onthe earth today.How did life on the earth evolve to its present incrediblediversity of species? We do not know the full answersto these questions. But considerable evidencesuggests that life on the earth developed in two phasesover the past 4.6–4.7 billion years (Figure 5-2).The first phase was chemical evolution of the organicmolecules, biopolymers, <strong>and</strong> systems of chemicalreactions needed to form the first cells. This tookabout 1 billion years.This was followed by biological evolution fromsingle-celled prokaryotic bacteria (Figure 4-3b, p. 58),to single-celled eukaryotic creatures (Figure 4-3a,Chemical Evolution(1 billion years)p. 58), <strong>and</strong> then to multicellular organisms. This secondphase has been going on for about 3.7 billion years(Figure 5-3).How Do We Know What Organisms Livedin the Past? Scientific Detective WorkMost of our knowledge about past life comes fromfossils, chemical analysis, cores drilled out of buriedice, <strong>and</strong> DNA analysis.Most of what we know of the earth’s life history comesfrom fossils: mineralized or petrified replicas of skeletons,bones, teeth, shells, leaves, <strong>and</strong> seeds, or impressionsof such items. Fossils give us physical evidenceof organisms that lived long ago <strong>and</strong> reveal what theirinternal structures looked like.Despite its importance, the fossil record is uneven<strong>and</strong> incomplete. Some forms of life left no fossils, somefossils have decomposed, <strong>and</strong> others are yet to befound. The fossils we have found so far are believed torepresent only about 1% of all the species that haveever lived.Evidence about the earth’s early history alsocomes from chemical analysis <strong>and</strong> measurements ofthe half-lives of radioactive elements in primitive rocks<strong>and</strong> fossils. Information also comes from analysis ofmaterial in cores drilled out of buried ice <strong>and</strong> fromcomparisons of DNA of past <strong>and</strong> current organisms.5-2 EVOLUTION AND ADAPTATIONWhat Is Evolution? Changing GenesEvolution is the change in a population’s geneticmakeup over time.According to scientific evidence, the major drivingforce of adaptation to changes in environmental conditionsis biological evolution, or evolution. It is thechange in a population’s genetic makeup through successivegenerations. Note that populations, not individuals,evolve by becoming genetically different.Biological Evolution(3.7 billion years)Formationof theearth’searlycrust <strong>and</strong>atmosphereSmallorganicmoleculesform inthe seasLargeorganicmolecules(biopolymers)form inthe seasFirstprotocellsform inthe seasSingle-cellprokaryotesform inthe seasSingle-celleukaryotesform inthe seasVariety ofmulticellularorganismsform, firstin the seas<strong>and</strong> lateron l<strong>and</strong>Figure 5-2 Summary of the hypothesized chemical <strong>and</strong> biological evolution of the earth. This drawing is notto scale. Note that the time span for biological evolution is almost four times longer than that for chemicalevolution.88 CHAPTER 5 Evolution <strong>and</strong> Biodiversity
Modern humans(Homo sapiens sapiens)appear about2 secondsbefore midnight530 million years 370 millionyearsFirst fossilrecord ofanimals225 million yearsInsects <strong>and</strong>amphibiansinvadethe l<strong>and</strong>6965 millionAge ofreptilesPMyearsAge ofmammalsmidnight12Recorded humanhistory begins1/4 secondbefore midnightOrigin of life(3.6–3.8 billionyears ago)AM36570 million years39Plants begininvadingl<strong>and</strong>Evolution <strong>and</strong>expansion of life12noon780 million years1 billion yearsFigure 5-3 Natural capital: greatly simplified overview of the biological evolution of life on the earth,which was preceded by about 1 billion years of chemical evolution. Evidence indicates that microorganisms(mostly bacteria <strong>and</strong>, later, protists) that lived in water dominated the early span of biological evolution on theearth, between about 3.7 billion <strong>and</strong> 1 billion years ago. Plants <strong>and</strong> animals evolved first in the seas. Fossil <strong>and</strong>recent DNA evidence suggests that plants began moving onto l<strong>and</strong> about 780 million years ago, <strong>and</strong> animalsbegan invading the l<strong>and</strong> about 370 million years ago. Humans arrived on the scene a very short time ago. Wehave been around for less than an eye blink of the earth’s roughly 3.7-billion-year history of biological evolution.Although we are newcomers we have taken over much of the planet <strong>and</strong> now have the power to cause the prematureextinction of many of the other species that travel with us as passengers on the earth as it hurtlesthrough space.http://biology.brookscole.com/miller1489
According to the theory of evolution, all speciesdescended from earlier, ancestral species. In otherwords, life comes from life. This widely accepted scientifictheory explains how life has changed over thepast 3.7 billion years <strong>and</strong> why life is so diverse today.Religious <strong>and</strong> other groups offer other explanations,but this is the accepted scientific explanation.Biologists use the term microevolution to describethe small genetic changes that occur in a population.They use the term macroevolution to describe longterm,large-scale evolutionary changes through whichnew species form from ancestral species <strong>and</strong> otherspecies are lost through extinction. Macroevolutionalso involves changes that occur at higher levels thanspecies, such as the evolution of new genera, families,or classes of species (see Appendix 4).How Does Microevolution Work?Changes in the Gene PoolA population’s gene pool changes over time whenbeneficial changes or mutations in its DNA moleculesare passed on to offspring.The first step in evolution is the development of geneticvariability in a population. Every population of a specieshas a gene pool: its collection of genes or genetic resourcespotentially available to members’ offspring inthe next generation. Microevolution is a change in a population’sgene pool over time.Members of a population generally have the samenumber <strong>and</strong> kinds of genes. But a particular gene mayhave two or more different molecular forms, calledalleles. Sexual reproduction leads to a r<strong>and</strong>om shufflingor recombination of alleles. As a result, each individualin a population (except identical twins) has adifferent combination of alleles.Genetic variability in a population originatesthrough mutations: r<strong>and</strong>om changes in the structure ornumber of DNA molecules in a cell that can be inheritedby offspring. Mutations can occur in two ways. One isby exposure of DNA to external agents such as radioactivity,X rays, <strong>and</strong> natural <strong>and</strong> human-made chemicals(called mutagens). The other is the result of r<strong>and</strong>om mistakesthat sometimes occur in coded genetic instructionswhen DNA molecules are copied each time a cell divides<strong>and</strong> whenever an organism reproduces.Mutations can occur in any cells, but only those inreproductive cells are passed on to offspring. Somemutations are harmless but most are lethal. Every so often,a mutation is beneficial. The result is new genetictraits that give the bearer <strong>and</strong> its offspring betterchances for survival <strong>and</strong> reproduction under existingenvironmental conditions or when conditions change.Mutations are r<strong>and</strong>om <strong>and</strong> unpredictable, are theonly source of totally new genetic raw material (alleles),<strong>and</strong> are rare. Life is a genetic shuffle. Once createdby mutation, new alleles can be shuffled togetheror recombined r<strong>and</strong>omly to create new combinations ofgenes in populations of sexually reproducing species.In addition to mutations, another source of evolutionarychange is the trading of genes between bacteria.What Role Does Natural Selection Playin Microevolution? Backing ReproductiveWinnersSome members of a population may have genetictraits that enhance their ability to survive <strong>and</strong>produce offspring with these traits.Natural selection occurs when some individuals of apopulation have genetically based traits that increasetheir chances of survival <strong>and</strong> their ability to produce offspringwith the same traits. Three conditions are necessaryfor evolution of a population by natural selection.There must be genetic variability for a trait in a population.The trait must be heritable, meaning it can bepassed from one generation to another. And the traitmust somehow lead to differential reproduction. Thismeans it must enable individuals with the trait to leavemore offspring than other members of the population.An adaptation, or adaptive trait, is any heritabletrait that enables organisms to better survive <strong>and</strong> reproduceunder prevailing environmental conditions.Natural selection causes any allele or set of alleles thatresult in an adaptive trait to become more common insucceeding generations <strong>and</strong> alleles without the trait tobecome less common.When faced with a critical change in environmentalconditions, a population of a species has three possibilities:adapt to the new conditions through naturalselection, migrate (if possible) to an area with more favorableconditions, or become extinct.The process of microevolution can be summarizedsimply: Genes mutate, individuals are selected, <strong>and</strong> populationsevolve.What Is Coevolution? An Arms Racebetween Interacting SpeciesInteracting species can engage in a back-<strong>and</strong>-forthgenetic contest in which each gains a temporarygenetic advantage over the other.Some biologists have proposed that interactions betweenspecies can also result in microevolution in each of theirpopulations. According to this hypothesis, when populationsof two different species interact over a longtime, changes in the gene pool of one species can leadto changes in the gene pool of the other. This process iscalled coevolution. In this give-<strong>and</strong>-take evolutionarygame, each species is in a genetic race to produce thelargest number of surviving offspring.One example is the interactions between bats <strong>and</strong>moths. Bats like to eat moths, <strong>and</strong> they hunt at night<strong>and</strong> use echolocation to navigate <strong>and</strong> locate their prey.90 CHAPTER 5 Evolution <strong>and</strong> Biodiversity
They do this by emitting extremely high-frequency<strong>and</strong> high-intensity pulses of sound. Then they analyzethe returning echoes to create a sonic “image” of theirprey. (We have copied this natural technology by usingsonar to detect submarines, whale, <strong>and</strong> schools of fish.)As a countermeasure, some moth species haveevolved ears that are especially sensitive to the soundfrequencies bats use to find them. When the mothshear the bat frequencies they try to escape by falling tothe ground or flying evasively.Some bat species then evolved ways to counterthis defense by switching the frequency of their soundpulses. Some moths then evolved their own highfrequencyclicks to jam the bats’ echolocation system(we have also learned to jam radar). Some bat speciesthen adapted by turning off their echolocation system<strong>and</strong> using the moth’s clicks to locate their prey. Eachspecies continues refining its adaptations in this ongoingcoevolutionary contest. Coevolution is like anarms race between interacting populations of differentspecies. Sometimes the predators are ahead <strong>and</strong> atother times the prey get the upper h<strong>and</strong>.5-3 ECOLOGICAL NICHESAND ADAPTATIONWhat Is an Ecological Niche? How SpeciesCoexistEach species in an ecosystem has a specific role orway of life.If asked what role a certain species such as an alligatorplays in an ecosystem, an ecologist woulddescribe its ecological niche, or simply niche (pronounced“nitch”). It is a species’ way of life or functionalrole in a community or ecosystem <strong>and</strong> involveseverything that affects its survival <strong>and</strong> reproduction.A species’ ecological niche includes the adaptationsor adaptive traits its members have acquired throughevolution. It also includes that species’ range of tolerancefor various physical <strong>and</strong> chemical conditions,such as temperature (Figure 4-13, p. 64) <strong>and</strong> wateravailability. In addition, it includes the types <strong>and</strong>amounts of resources the species uses (such as food ornutrients <strong>and</strong> space), how it interacts with other living<strong>and</strong> nonliving components of the ecosystems in whichit is found, <strong>and</strong> the role it plays in the energy flow <strong>and</strong>matter cycling in an ecosystem. Finding out aboutthese things for just one species takes a lot of research.The ecological niche of a species is different fromits habitat, the physical location where it lives. Ecologistsoften say that a niche is like a species’ occupation,whereas habitat is like its address.A species’ fundamental niche is the full potentialrange of physical, chemical, <strong>and</strong> biological conditions<strong>and</strong> resources it could theoretically use if there wereno direct competition from other species. But in a particularecosystem, different species often compete withone another for one or more of the same resources. Inother words, the niches of competing species overlap.To survive <strong>and</strong> avoid competition for the sameresources, a species usually occupies only part of itsfundamental niche in a particular community or ecosystem—whatecologists call its realized niche. Byanalogy, you may be capable of being president of a particularcompany (your fundamental professional niche),but competition from others may mean you becomeonly a vice president (your realized professional niche).What are Generalist <strong>and</strong> Specialist Species?Broad <strong>and</strong> Narrow NichesSome species have broad ecological roles <strong>and</strong> othershave narrower or more specialized roles.Scientists use the niches of species to broadly classifythem as generalists or specialists. Generalist specieshave broad niches (Figure 5-4, right curve). They canlive in many different places, eat a variety of foods,<strong>and</strong> tolerate a wide range of environmental conditions.Flies, cockroaches (Spotlight, p. 92), mice, rats, whitetaileddeer, raccoons, coyotes, copperheads, channelcatfish, <strong>and</strong> humans are generalist species.Specialist species have narrow niches (Figure 5-4,left curve). They may be able to live in only one type ofhabitat, use only one or a few types of food, or tolerateonly a narrow range of climatic <strong>and</strong> other environmentalconditions. This makes them more prone to extinctionwhen environmental conditions change.For example, tiger salam<strong>and</strong>ers are specialists becausethey can breed only in fishless ponds wheretheir larvae will not be eaten. Threatened red-cockadedwoodpeckers carve nest holes almost exclusively inNumber of individualsSpecialist specieswith a narrow nicheNicheseparationResource useNichebreadthRegion ofniche overlapGeneralist specieswith a broad nicheFigure 5-4 Overlap of the niches of two different species: aspecialist <strong>and</strong> a generalist. In the overlap area the two speciescompete for one or more of the same resources. As a result,each species can occupy only a part of its fundamental niche;the part it occupies is its realized niche. Generalist specieshave a broad niche (right), <strong>and</strong> specialist species have a narrowniche (left).http://biology.brookscole.com/miller1491
Black skimmerseizes small fishat water surfaceScaup <strong>and</strong> otherdiving ducks feed onmollusks, crustaceans,<strong>and</strong> aquatic vegetationBrown pelican dives for fish,which it locates from the airAvocet sweeps bill throughmud <strong>and</strong> surface water insearch of small crustaceans,insects, <strong>and</strong> seedsFlamingofeeds onminuteorganismsin mudLouisiana heron wades intowater to seize small fishOystercatcher feeds onclams, mussels, <strong>and</strong>other shellfish into whichit pries its narrow beakFigure 5-5 Specialized feeding niches of various bird species in a coastal wetl<strong>and</strong>. Such resource partitioningreduces competition <strong>and</strong> allows sharing of limited resources.longleaf pines that are at least 75 years old. China’shighly endangered giant p<strong>and</strong>as feed almost exclusivelyon various types of bamboo. Figure 5-5 showsshorebirds that feed in specialized niches on crustaceans,insects, <strong>and</strong> other organisms on s<strong>and</strong>ybeaches <strong>and</strong> their adjoining coastal wetl<strong>and</strong>s.Is it better to be a generalist than a specialist? Itdepends. When environmental conditions are fairlyconstant, as in a tropical rain forest, specialists have anadvantage because they have fewer competitors. Butunder rapidly changing environmental conditions, thegeneralist usually is better off than the specialist.Natural selection can lead to an increase in specializedspecies when the niches of species compete intenselyfor scarce resources. Over time one speciesmay evolve into a variety of species with differentadaptations that reduce competition <strong>and</strong> allow themto share limited resources.This evolutionary divergence of a single species intoa variety of similar species with specialized niches canCockroaches: Nature’s Ultimate SurvivorsCockroaches, thebugs many peoplelove to hate, havebeen around forSPOTLIGHT about 350 millionyears <strong>and</strong> are oneof the great success stories of evolution.They are so successful becausethey are generalists.The earth’s 4,000 cockroach speciescan eat almost anything includingalgae, dead insects, fingernailclippings, salts in tennis shoes, electricalcords, glue, paper, <strong>and</strong> soap.They can also live <strong>and</strong> breed almostanywhere except in polar regions.Some cockroach species can gofor months without food, survivefor a month on a drop of water froma dishrag, <strong>and</strong> withst<strong>and</strong> massivedoses of radiation. One species cansurvive being frozen for 48 hours.They can usually evade theirpredators <strong>and</strong> a human foot inhot pursuit because most specieshave antennae that can detectminute movements of air, vibrationsensors in their knee joints, <strong>and</strong>rapid response times (faster thanyou can blink). Some even havewings.They also have high reproductiverates. In only a year, a single femaleAsian cockroach (especiallyprevalent in Florida) <strong>and</strong> its youngcan add about 10 million new cockroachesto the world. <strong>Their</strong> high reproductiverate also helps themquickly develop genetic resistanceto almost any poison we throw atthem.Most cockroaches also samplefood before it enters their mouth<strong>and</strong> learn to shun foul-tasting poi-sons. They also clean up afterthemselves by eating their dead<strong>and</strong>, if food is scarce enough, theirliving.The 25 different species of cockroachthat live in homes can carryviruses <strong>and</strong> bacteria that cause diseasessuch as hepatitis, polio, typhoidfever, plague, <strong>and</strong> salmonella.They can also cause somepeople to have allergic reactionsranging from watery eyes to severewheezing. About 60% of Americanssuffering from asthma are allergic todead or live cockroaches.Critical ThinkingIf you could, would you exterminateall cockroach species? Whatmight be some ecological consequencesof doing this?92 CHAPTER 5 Evolution <strong>and</strong> Biodiversity
Dowitcher probes deeplyinto mud in search ofsnails, marine worms,<strong>and</strong> small crustaceansHerring gull is atireless scavengerRuddy turnstone searchesunder shells <strong>and</strong> pebblesfor small invertebratesin a population, most of the population would have todie or become sterile so that individuals with the traitcould predominate <strong>and</strong> pass the trait on. Thus mostplayers get kicked out of the genetic dice game beforethey have a chance to win. This means that most membersof the human population would have to die prematurelyfor hundreds of thous<strong>and</strong>s of generations fora new genetic trait to predominate. This is hardly adesirable solution to the environmental problems weface.Knot (a s<strong>and</strong>piper)picks up worms <strong>and</strong>small crustaceans leftby receding tidePiping plover feedson insects <strong>and</strong> tinycrustaceans ons<strong>and</strong>y beaches(Birds shown here are not drawn to scale)be illustrated by various species of honeycreepers onthe isl<strong>and</strong> of Hawaii. Starting with a single ancestor, avariety of honeycreeper species evolved with differenttypes of beaks specialized to feed on different types offood sources such as specific insects, nectar from differenttypes of flowers, <strong>and</strong> certain types of seeds <strong>and</strong>fruit (Figure 5-6).What Limits Adaptation? Life Is a GeneticDice GameA population’s ability to adapt to new environmentalconditions is limited by its gene pool <strong>and</strong> how fast itcan reproduce.Will adaptations to new environmental conditions inthe not-to-distant future allow our skin to become moreresistant to the harmful effects of ultraviolet radiation,our lungs to cope with air pollutants, <strong>and</strong> our liver tobetter detoxify pollutants?The answer is no because of two limits to adaptationsin nature. First, a change in environmental conditionscan lead to adaptation only for genetic traitsalready present in the gene pool of a population. Youmust have dice to play the genetic dice game.Second, even if a beneficial heritable trait is presentin a population, the population’s ability to adapt maybe limited by its reproductive capacity. Populations ofgenetically diverse species that reproduce quickly—such as weeds, mosquitoes, rats, bacteria, or cockroaches—oftenadapt to a change in environmentalconditions in a short time. In contrast, species that cannotproduce large numbers of offspring rapidly, suchas elephants, tigers, sharks, <strong>and</strong> humans, take a longtime (typically thous<strong>and</strong>s or even millions of years) toadapt through natural selection. You have to be able tothrow the genetic dice fast.Here is some bad news for most members of a population.Even when a favorable genetic trait is presentWhat Are Two Commonly MisunderstoodAspects of Evolution? Strong Does Not Cut It<strong>and</strong> There Is No Gr<strong>and</strong> DesignEvolution is about leaving the most descendants,<strong>and</strong> there is no master plan leading to geneticperfection.There are two common misconceptions about evolution.One is that “survival of the fittest” means “survivalof the strongest.” To biologists, fitness is a measureof reproductive success, not strength. Thus the fittestindividuals are those that leave the most descendants.The other misconception is that evolution involvessome gr<strong>and</strong> plan of nature in which species becomemore perfectly adapted. From a scientific st<strong>and</strong>point,no plan or goal of genetic perfection has beenidentified in the evolutionary process.Fruit <strong>and</strong> seed eatersGreater Koa-finchKona GrosbeakAkiapolaauMaui ParrotbillUnkown finch ancestorInsect <strong>and</strong> nectar eatersKuai AkialaoaAmakihiCrested HoneycreeperApapaneFigure 5-6 Evolutionary divergence of honeycreepers into a varietyof specialized ecological niches. Each of these relatedspecies has a beak specialized to take advantage of certaintypes of food resources.http://biology.brookscole.com/miller1493
5-4 SPECIATION, EXTINCTION,AND BIODIVERSITYHow Do New Species Evolve? Moving Out<strong>and</strong> Moving OnA new species arises when members of a populationare isolated from other members so long that changesin their genetic makeup prevent them from producingfertile offspring if they get together again.Under certain circumstances, natural selection canlead to an entirely new species. In this process, calledspeciation, two species arise from one. For sexually reproducingspecies, a new species is formed whensome members of a population can no longer breedwith other members to produce fertile offspring.The most common mechanism of speciation (especiallyamong animals) is called allopatric speciation. Ittakes place in two phases: geographic isolation <strong>and</strong> reproductiveisolation. Geographic isolation occurswhen different groups of the same population becomephysically isolated from one another for long periods.For example, part of a population may migrate insearch of food <strong>and</strong> then begin living in another areawith different environmental conditions (Figure 5-7).Populations also may become separated by a physicalbarrier (such as a mountain range, stream, lake, orroad), by a change such as a volcanic eruption orearthquake, or when a few individuals are carried toa new area by wind or water. Other causes are theadvance of glaciers during ice ages, changes in sealevel that can create isl<strong>and</strong>s, shifts in ocean currents,a warmer or cooler climate that shifts vegetationnorthward or southward or up or down slopes, <strong>and</strong> adrier climate that divides a large lake into severalsmall lakes.The second phase of allopatric speciation is reproductiveisolation. It occurs when mutation <strong>and</strong>natural selection operate independently in the genepools of two geographically isolated populations. Ifthis divergence process continues long enough, membersof isolated populations of a sexually reproducingspecies may become so different in genetic makeupthat when they get together again, they cannot producelive, fertile offspring. Then one species hasbecome two, <strong>and</strong> speciation has occurred through divergentevolution.For some rapidly reproducing organisms, thistype of speciation may occur within hundreds of years.For most species it takes from tens of thous<strong>and</strong>s to millionsof years, which makes it difficult to observe <strong>and</strong>document the appearance of a new species.A less common form of speciation is called sympatricspeciation. It is the creation of a new species whengroups in a population living close together are unableto interbreed because of a mutation or subtle behavioralchanges. Some insects are c<strong>and</strong>idates for this typeof speciation perhaps when two populations experiencedifferent types of mutations by feeding on differenttypes of plants.What Is Extinction? Going, Going, GoneA species becomes extinct when its populationscannot adapt to changing environmentalconditions.After speciation, the second process affecting the number<strong>and</strong> types of species on the earth is extinction, inwhich an entire species ceases to exist. Fossil recordsindicate that species tend to exist for 1-10 million yearsbefore becoming extinct, although catastrophic eventsaccelerate the extinction process.For most of the earth’s geological history, specieshave faced incredible challenges to their existence.Continents have broken apart <strong>and</strong> moved over millionsof years (Figure 5-8). The earth’s l<strong>and</strong> area has re-Early foxpopulationSpreadsnorthward<strong>and</strong>southward<strong>and</strong>separatesNorthernpopulationDifferent environmentalconditions lead to differentselective pressures <strong>and</strong> evolutioninto two different species.SouthernpopulationGray FoxArctic FoxAdapted to coldthrough heavierfur, short ears,short legs, shortnose. White furmatches snowfor camouflage.Adapted to heatthrough lightweightfur <strong>and</strong> long ears,legs, <strong>and</strong> nose, whichgive off more heat.Figure 5-7 How geographic isolation can lead to reproductive isolation, divergence, <strong>and</strong> speciation.94 CHAPTER 5 Evolution <strong>and</strong> Biodiversity
LAURASIA120° 80° 40° 80° 120°APA N G A E120° 80° 80° 120°G O N D W A N A L A N D225 million years ago135 million years agoNORTH AMERICAEURASIASOUTHAMERICAAFRICA120° 80° 120°MADA-GASCARA N TA R C T I C A65 million years agoINDIAAUSTRALIA120° 0° 40° 120°PresentFigure 5-8 Continental drift, the extremely slow movement of continents over millions of years onseveral gigantic plates. This process plays a role in the extinction of species <strong>and</strong> the rise of newspecies. Populations are geographically <strong>and</strong> eventually reproductively isolated as l<strong>and</strong> masses floatapart <strong>and</strong> new coastal regions are created. Rock <strong>and</strong> fossil evidence indicates that about 200–250million years ago all of the earth’s present-day continents were locked together in a supercontinentcalled Pangaea (top left). About 180 million years ago, Pangaea began splitting apart as the earth’shuge plates separated <strong>and</strong> eventually resulted in today’s locations of the continents (bottom right).peatedly shrunk as continents have been flooded, <strong>and</strong>exp<strong>and</strong>ed when the world’s oceans have shrunk. Atother times much of the planet’s l<strong>and</strong> has been coveredwith ice.The earth’s life has also had to cope with volcaniceruptions, meteorites <strong>and</strong> asteroids crashing onto theplanet, <strong>and</strong> releases of large amounts of methanetrapped beneath the ocean floor. Some of these eventscreated dust clouds that shut down or sharply reducedphotosynthesis long enough to eliminate huge numbersof producers <strong>and</strong>, soon thereafter, the consumersthat fed on them.Populations of existing species in some placeshave been also been reduced or eliminated by newlyarrived migrant species or species that are accidentallyor deliberately introduced into new areas. More recentlyour species arrived <strong>and</strong> began taking over ordegrading more <strong>and</strong> more of the earth’s resources <strong>and</strong>habitats. Today’s biodiversity represents the speciesthat have survived <strong>and</strong> thrived despite environmentalupheavals.What Is the Difference between BackgroundExtinction, Mass Extinction, <strong>and</strong> MassDepletion? Wiping Out Large GroupsAll species eventually become extinct, but sometimesdrastic changes in environmental conditions eliminatelarge groups of species.Extinction is the ultimate fate of all species, just asdeath is for all individual organisms. Biologists estimatethat 99.9% of all the species that ever existed arenow extinct.As local environmental conditions change, a certainnumber of species disappear at a low rate, calledbackground extinction. Based on the fossil record <strong>and</strong>analysis of ice cores, biologists estimate that the averageannual background extinction rate is one to fivespecies for each million species on the earth.In contrast, mass extinction is a significant rise inextinction rates above the background level. It is a catastrophic,widespread (often global) event in whichlarge groups of existing species (perhaps 25–70%) arewiped out.http://biology.brookscole.com/miller1495
Scientists have also identified periods of mass depletionin which extinction rates are higher than normalbut not high enough to classify as a mass extinction.Recent fossil <strong>and</strong> geological evidence casts doubt on thehypothesis that there have been five mass extinctionsover the past 500 million years as is reported in manybiology <strong>and</strong> environmental science textbooks. The newevidence suggests that there have been two mass extinctions<strong>and</strong> three mass depletions during this period.What Is Adaptive Radiation? Take Advantageof OpportunitiesExtinction of large groups of species opens upopportunities for new species to evolve <strong>and</strong> fillnew or vacant niches.A mass extinction or mass depletion crisis for somespecies is an opportunity for other species. The existenceof millions of species today means that speciation,on average, has kept ahead of extinction, especiallyduring the last 250 million years (Figure 5-9). Study thisfigure carefully.Evidence shows that the earth’s mass extinctions<strong>and</strong> depletions have been followed by periods of recoverycalled adaptive radiations in which numerousnew species evolved to fill new or vacated ecologicalroles or niches in changed environments. Fossil recordssuggest that it takes 1–10 million years for adaptive radiationsto rebuild biological diversity after a mass extinctionor depletion.How Are Human Activities Affecting theEarth’s Biodiversity? The Earth Giveth<strong>and</strong> We TakethThe scientific consensus is that human activities aredecreasing the earth’s biodiversity.Speciation minus extinction equals biodiversity, theplanet’s genetic raw material for future evolution inresponse to changing environmental conditions. Extinctionis a natural process. But much evidence indicatesthat humans have recently become a majorforce in the premature extinction of species. Accordingto biologists Stuart Primm <strong>and</strong> Edward O.Wilson, three independent measures estimate thatduring the 20th century, extinction rates increased by100–1,000 times the natural background extinctionrate of about one to five species per million speciesper year. In other words, the annual estimated human-causedextinction rate is 100 to 1,000 species permillion species.Wilson <strong>and</strong> Primm warn that projected increasesin the human population <strong>and</strong> resource consumptionmay cause the premature extinction of at least onefifthof the earth’s current species by 2030 <strong>and</strong> half bythe end of the century. This could constitute a newmass depletion <strong>and</strong> possibly a new mass extinction. Accordingto Wilson, if we make an “all-out effort to savethe biologically richest parts of the world, the amountof loss can be cut at least by half.”On our short time scale, such major losses cannotbe recouped by formation of new species; it took millionsof years after each of the earth’s past mass extinctions<strong>and</strong> depletions for life to recover to the previouslevel of biodiversity. If the recovery period lasts at least5 million years, this would be 20 times longer than wehave been around as a species.We are also destroying or degrading ecosystemssuch as tropical forests, coral reefs, <strong>and</strong> wetl<strong>and</strong>s thatare centers for future speciation (See the Guest Essayon this topic by Norman Myers on the website for thischapter). Genetic engineering cannot stop this loss ofbiodiversity because genetic engineers rely on naturalbiodiversity for their genetic raw material.Number of families16001200800400Pre-cambrianCambrianOrdovicianSilurianDevonianCarboniferousPermianTriassicJurassicCretaceousTertiaryQuaternaryTerrestrialorganismsMarineorganisms03500 545 500 440 410 355 290 250 205 14565 1.8Millions of years ago0Figure 5-9 Natural capital: changes in the earth’s biodiversity over geological time. The biological diversity oflife on l<strong>and</strong> <strong>and</strong> in the oceans has increased dramatically over the last 3.5 billion years, especially during thepast 250 million years. Note that during the last 1.8 million years this increase has leveled off. During the nexthundred years or so, will the human species be a major factor in decreasing the earth’s biodiversity?96 CHAPTER 5 Evolution <strong>and</strong> Biodiversity
5-5 WHAT IS THE FUTUREOF EVOLUTION?What Is Artificial Selection? Gettingthe Type of Fruit or Dog You WantHumans pick members of a population with genetictraits they like <strong>and</strong> breed them to produce offspringwith such traits.We have used artificial selection to change geneticcharacteristics of populations. In this process, we selectone or more desirable genetic traits in the populationof a plant or animal, such as a type of wheat, fruit,or dog. Then we use selective breeding to end up withpopulations of the species containing large numbers ofindividuals with the desired traits.For example, two crop plants such as a variety ofa pear <strong>and</strong> of an apple can be crossbred with the goalof producing a pear with a more reddish color (Figure5-10). This is repeated for a number of generationsuntil the desired trait in the pear predominates.Artificial selection results in many domesticatedbreeds or hybrids of the same species, all originally developedfrom one wild species. For example, despitetheir widely different genetic traits, the hundreds ofdifferent breeds of dogs are members of the samespecies because they can interbreed <strong>and</strong> produce fertileoffspring.Artificial selection has yielded food crops withhigher yields, cows that give more milk, trees thatgrow faster, <strong>and</strong> a variety of types of dogs <strong>and</strong> cats.But traditional crossbreeding is a slow process.And it can combine traits only from species that areclose to one another genetically.OffspringNewoffspringPearBest resultCropCrossbreedingCrossbreedingDesired trait(color)AppleWhat Is Genetic Engineering? TransferringGenes between SpeciesGenetic engineers create genetically modifiedorganisms by transplanting genes from one speciesto the DNA of another species.Recently scientists have learned how to use genetic engineeringto speed up our ability to manipulate genes.Genetic engineering, or gene splicing, is a set of techniquesfor isolating, modifying, multiplying, <strong>and</strong> recombininggenes from different organisms. It enablesscientists to transfer genes between different speciesthat would never interbreed in nature. For example,genes from a fish species can be put into a tomato orstrawberry.The resulting organisms are called geneticallymodified organisms (GMOs) or transgenic organisms.Figure 5-11 (p. 98) outlines the steps involved indeveloping a genetically modified or transgenic plant.Study this figure carefully.Gene splicing takes about half as much time todevelop a new crop or animal variety <strong>and</strong> costs lessDesiredresultFigure 5-10 Traditional crossbreeding of species that are fairlyclose to one another genetically.than traditional crossbreeding. While traditional crossbreedinginvolves mixing the genes of similar types oforganisms through breeding, genetic engineeringallows us to transfer traits between different types oforganisms.Scientists have used gene splicing to developmodified crop plants, genetically engineered drugs,<strong>and</strong> pest-resistant plants. They have also created geneticallyengineered bacteria to help clean up spills ofoil <strong>and</strong> other toxic pollutants.Genetic engineers have also learned how to producea clone or genetically identical version of an individualin a population. Scientists have made clones ofdomestic animals such as sheep <strong>and</strong> cows <strong>and</strong> mayhttp://biology.brookscole.com/miller1497
Identify <strong>and</strong> extractgene with desired traitPhase 1Make Modified GenecellgeneTransfer plasmidcopies to a carrieragrobacteriumPhase 2Make Transgenic CellIdentify <strong>and</strong> removeportion of DNAwith desired traitRemove plasmidfrom DNA of E. coliDNAplasmidE. coliAgrobacteriuminserts foreignDNA into plantcell to yieldtransgenic cellA. tumefaciens(agrobacterium)Plant cellNucleusHost DNAInsert extracted DNA(step 2) into plasmid(step 3)DNAGeneticallymodifiedplasmidplasmidTransfer plasmidto surfacemicroscopic metalparticleForeign DNAInsert modifiedplasmid into E. coliGrow in tissueculture tomake copiesUse gene gunto inject DNAinto plant cellsomeday be able to clone humans—a possibility thatexcites some people <strong>and</strong> horrifies others.Bioengineers have developed chickens that laylow-cholesterol eggs, tomatoes with genes that canhelp prevent some types of cancer, <strong>and</strong> bananas <strong>and</strong>potatoes that contain oral vaccines to treat various viraldiseases in developing countries where needles<strong>and</strong> refrigeration are not available.Researchers envision using genetically engineeredanimals to act as biofactories for producing drugs,vaccines, antibodies, hormones, industrial chemicalssuch as plastics <strong>and</strong> detergents, <strong>and</strong> human body organs.This new field is called biopharming. For example,cows may be able to produce insulin for treatingdiabetes, perhaps more cheaply than making the insulinin laboratories. Have you considered this field asa career choice?Phase 3Grow Genetically Engineered PlantTransgenic cellfrom Phase 2Cell division oftransgenic cellsCulture cellsto form plantletsTransfer to soilWhat Are Some Concerns about the GeneticRevolution? Genetic Wonderl<strong>and</strong> orGenetic Wastel<strong>and</strong>?Genetic engineering has great promise butit is an unpredictable process <strong>and</strong> raises a numberof privacy, ethical, legal, <strong>and</strong> environmentalissues.Transgenic plantswith new traitsFigure 5-11 Genetic engineering. Steps in geneticallymodifying a plant.98 CHAPTER 5 Evolution <strong>and</strong> Biodiversity
The hype about genetic engineering can lead us to believethat its results are controllable <strong>and</strong> predictable. Inreality, most current forms of genetic engineering aremessy <strong>and</strong> unpredictable. Genetic engineers can inserta gene into the nucleus of a cell but with current technologythey do know whether the cell will incorporatethe new gene into its DNA. They also do not knowwhere the new gene will be located in the DNA molecule’sstructure <strong>and</strong> what effects this will have on theorganism.Thus, genetic engineering is a trial <strong>and</strong> error processwith many failures <strong>and</strong> unexpected results. Indeed,the average success rate of current genetic engineeringexperiments is only about 1%.Some people have genes that make them morelikely to develop certain genetic diseases or disorders.We now have the power to detect these genetic deficiencies,even before birth. This raises some importantissues. If gene therapy is developed for correctingthese deficiencies, who will get it? Will it be mostly forthe rich? Will this mean more abortions of geneticallydefective fetuses? Will health insurers refuse to insurepeople with certain genetic defects that could lead tohealth problems? Will employers refuse to hire them?xHOW WOULD YOU VOTE? Should genetic screeningbe required as part of an application for a job, healthinsurance, or life insurance? Cast your vote online athttp://biology.brookscole.com/miller14.Some people dream of a day when our geneticprowess could eliminate death <strong>and</strong> aging altogether.As one’s cells, organs, or other parts wear out or aredamaged, they would be replaced with new ones.These replacement parts might be grown in genetic engineeringlaboratories or biopharms. Or people mightchoose to have a clone available for spare parts. Severalcountries have banned human cloning, but the researchis taking place anyway <strong>and</strong> human clones mayappear in the not too distant future.This raises a number of questions: Is it moral to dothis? Who decides? Who regulates it? Will geneticallydesigned humans <strong>and</strong> clones have the same legalrights as other people?xHOW WOULD YOU VOTE? Should we legalize the productionof human clones if a reasonably safe technology fordoing so becomes available? Cast your vote online athttp://biology.brookscole.com/miller14.What might be the environmental impacts of suchgenetic developments on resource use, pollution, <strong>and</strong>environmental degradation? If everyone could livewith good health as long as they wanted for a price,sellers of body makeovers would encourage customersto line up. Each of these wealthy, long-lived peoplecould have an enormous ecological footprint for perhapscenturies.What Are Our Options? Time to MakeDecisionsThere are arguments over how much we shouldregulate genetic engineering research <strong>and</strong>development.In the 1990s, a backlash developed against the increasinguse of genetically modified food plants <strong>and</strong> animals.Some protesters are strongly against this newtechnology for a variety of reasons. Others advocateslowing down <strong>and</strong> taking a closer look at the short<strong>and</strong>long-term advantages <strong>and</strong> disadvantages of this<strong>and</strong> other rapidly emerging genetic technologies.Or at the very least, they say, we should requirethat all genetically modified crops <strong>and</strong> animal products<strong>and</strong> foods containing such components be clearlylabeled as such. This would give consumers a more informedchoice, as do the food labels that now requirelisting ingredients <strong>and</strong> nutritional information. Makersof genetically modified products strongly opposesuch labeling (as food manufacturers opposed theother types of food labeling now in use) because theyfear it would hurt sales.Supporters of genetic engineering wonder whythere is so much concern. After all, we have been geneticallymodifying plants <strong>and</strong> animals for centuries.Now we have a faster, better, <strong>and</strong> perhaps cheaperway to do it, so why not use it?But proponents of more careful control of geneticengineering point out that most new technologies havehad unintended harmful consequences (Figure 3-4,p. 38). The ecological lesson is that whenever we intervenein nature we must pause <strong>and</strong> ask, “What happensnext?” This is why many analysts are cautious aboutrushing into genetic engineering <strong>and</strong> other forms ofbiotechnology without more careful evaluation of possibleunintended consequences.xHOW WOULD YOU VOTE? Should there be stricter governmentcontrol over the development <strong>and</strong> use of genetic engineeringtechnology? Cast your vote online at http://biology.brookscole.com/miller14.How Did We Become Such a PowerfulSpecies So Quickly? Brain <strong>and</strong> ThumbPowerWe have thrived as a species mostly because of ourcomplex brains <strong>and</strong> strong opposable thumbs.Like other species, we have survived <strong>and</strong> thrived so farbecause we have certain adaptive traits. What are they?First, look at the traits we do not have. We lack exceptionalstrength, speed, <strong>and</strong> agility. We do not haveweapons such as claws or fangs, <strong>and</strong> we lack a protectiveshell or body armor.Our senses are unremarkable. We see only visiblelight—a tiny fraction of the spectrum of electromagneticradiation that bathes the earth. We cannot seehttp://biology.brookscole.com/miller1499
infrared radiation, as a rattlesnake can, or the ultravioletlight that guides some insects to their favoriteflowers.We cannot see as well or as far as an eagle or seewell in the night like some owls <strong>and</strong> other nocturnalcreatures. We cannot hear the high-pitched soundsthat help bats maneuver in the dark. Our ears cannotpick up low-pitched sounds that are the songs ofwhales as they glide through the world’s oceans. Wecannot smell as keenly as a dog or a wolf. By suchmeasures, our physical <strong>and</strong> sensory powers are pitiful.Yetwehave survived <strong>and</strong> flourished within lessthan a twitch of the earth’s 3.7-billion year evolutionaryhistory. Analysts attribute our success to two evolutionaryadaptations: a complex brain <strong>and</strong> strong opposablethumbs that allow us to grip <strong>and</strong> use tools better thanthe few other animals that have thumbs. This has enabledus to develop technologies that extend our limitedsenses, weapons, <strong>and</strong> protective devices.As a newly evolved infant species, we havequickly developed many powerful technologies totake over much of the earth’s life-support systems tomeet our basic needs <strong>and</strong> rapidly growing wants. Wenamed ourselves Homo sapiens sapiens—the doublywise species. If we keep degrading the life-supportsystem for us <strong>and</strong> other species, some say we shouldbe called Homo ignoramus—the unwise species. Duringthis century we will probably learn which of thesenames is appropriate.The good news is that we can change our ways. Wecan learn more about how to work with nature by underst<strong>and</strong>ing<strong>and</strong> copying the ways it has sustained itselffor several billion years despite major changes inenvironmental conditions.In the earth’s ballet of life that has been playing onthe global stage for about 3.7 billion years, life <strong>and</strong>death are interconnected. Some species appear <strong>and</strong>some disappear, but the show goes on. We only recentlybecame members of this evolutionary ballet.Will we temporarily interrupt the show, take out someof the dancers, <strong>and</strong> get kicked off the stage? Or will welearn the rules of the ballet <strong>and</strong> have a long run? Welive in interesting <strong>and</strong> challenging times.All we have yet discovered is but a trifle in comparison withwhat lies hid in the great treasury of nature.ANTONI VAN LEEUWENHOEKCRITICAL THINKING1. (a) How would you respond to someone who tellsyou that he or she does not believe in biological evolutionbecause it is “just a theory”? (b) How would yourespond to a statement that we should not worry aboutair pollution because through natural selection thehuman species will develop lungs that can detoxifypollutants?2. How would you respond to someone who says thatbecause extinction is a natural process we should notworry about the loss of biodiversity?3. Describe the major differences between the ecologicalniches of humans <strong>and</strong> cockroaches. Are these two speciesin competition? If so, how do they manage to coexist?4. Explain why you are for or against each of the following:(a) requiring labels indicating the use of geneticallyengineered components in any food item, (b) using geneticengineering to develop “superior” human beings,<strong>and</strong> (c) using genetic engineering to eliminate aging <strong>and</strong>death.5. Suppose we could spray something in the air thatwould permanently give every person on earth unconditionallove for all other people <strong>and</strong> unconditional love fornature. Explain why you would favor or oppose doingthis. What professions, businesses, <strong>and</strong> educational subjectswould this eliminate? How would this affect the entertainment,sports, <strong>and</strong> advertising businesses? Howwould it affect politics <strong>and</strong> environmental professions?6. Congratulations! You are in charge of the future evolutionon the earth. What are the three most importantthings you would do?PROJECTS1. An important adaptation of humans is a strong opposablethumb, which allows us to grip <strong>and</strong> manipulatethings with our h<strong>and</strong>s. As a demonstration of the importanceof this trait, fold each of your thumbs into the palmof its h<strong>and</strong> <strong>and</strong> then tape them securely in that position foran entire day. After the demonstration, make a list of thethings you could not do without the use of your thumbs.2. Use the library or the Internet to find out what controlsnow exist on genetically engineered organisms inthe United States, or the country where you live, <strong>and</strong>how well such controls are enforced.3. Use the library or the Internet to find out bibliographicinformation about Charles Darwin <strong>and</strong> Antoni vanLeeuwenhoek, whose quotes appear at the beginning <strong>and</strong>end of this chapter.4. Make a concept map of this chapter’s major ideas, usingthe section heads, subheads, <strong>and</strong> key terms (in boldface).Look on the website for this book for informationabout making concept maps.LEARNING ONLINEThe website for this book contains study aids <strong>and</strong> manyideas for further reading <strong>and</strong> research. They include achapter summary, review questions for the entire chapter,flash cards for key terms <strong>and</strong> concepts, a multiple-choicepractice quiz, interesting Internet sites, references, <strong>and</strong> aguide for accessing thous<strong>and</strong>s of InfoTrac ® College Editionarticles. Log on tohttp://biology.brookscole.com/miller14Then click on the Chapter-by-Chapter area, choose Chapter5, <strong>and</strong> select a learning resource.100 CHAPTER 5 Evolution <strong>and</strong> Biodiversity
6Climate <strong>and</strong> Terrestrial BiodiversityClimateControlBiodiversityCASE STUDYBlowing in the Wind:A Story of ConnectionsWind, a vital part of the planet’s circulatory system,connects most life on the earth. Without wind, thetropics would be unbearably hot <strong>and</strong> most of the restof the planet would freeze.Winds also transport nutrients from one placeto another. Dust rich in phosphates <strong>and</strong> iron blowsacross the Atlantic from the Sahara Desert in Africa(Figure 6-1). This helps build up agricultural soils inthe Bahamas <strong>and</strong> supplies nutrients for plants in theupper canopy of rain forests in Brazil. Iron-rich dustblowing from China’s Gobi Desert falls into the PacificOcean between Hawaii <strong>and</strong> Alaska. This input of ironstimulates the growth of phytoplankton, the minuteproducers that support ocean food webs. This is thegood news.The bad news is that wind also transports harmfulviruses, bacteria, fungi, <strong>and</strong> particles of long-livedpesticides <strong>and</strong> toxic metals. Particles of reddish-brownsoil <strong>and</strong> pesticides banned in the United States areblown from Africa’s deserts <strong>and</strong> eroding farml<strong>and</strong>sinto the sky over Florida. This makes it difficult for thestate to meet federal air pollution st<strong>and</strong>ards duringsummer months.More bad news. Some types of fungi in this dustmay play a role in degrading or killing coral reefs inthe Florida Keys <strong>and</strong> the Caribbean. Scientists are currentlystudying possible links betweencontaminated African dust <strong>and</strong> a sharprise in rates of asthma in the Caribbeansince 1973.Particles of iron-rich dust from Africathat enhance the productivity of algaehave also been linked to outbreaks oftoxic algal blooms—referred to as redtides—in Florida’s coastal waters. Peoplewho eat shellfish contaminated by a toxinproduced in red tides can become paralyzedor even die. Europe <strong>and</strong> the MiddleEast also receive contaminated Afric<strong>and</strong>ust.Figure 6-1 Some of the dust shown here blowingfrom Africa’s Sahara Desert can end up assoil nutrients in Amazonian rain forests <strong>and</strong> particlesof toxic air pollutants in Florida <strong>and</strong> theCaribbean.Image data from NASA/Goddard Space Flight Center, the SeaWiFSProject <strong>and</strong> ORBIMAGE, Scientific Visualization Studio by kindpermission of ORBIMAGE. All rights reserved.Pollution <strong>and</strong> dust from rapidly industrializingChina <strong>and</strong> central Asia blow across the Pacific Ocean<strong>and</strong> degrade air quality over the western UnitedStates. In 2001, climate scientists reported that a hugedust storm of soil particles blown from northernChina had blanketed areas from Canada to Arizonawith a layer of dust. Studies show that Asian pollutioncontributes as much as 10% to West Coastsmog, a threat expected to increase as Chinaindustrializes.There is also mixed news. Particles from volcaniceruptions ride the winds, circle the globe, <strong>and</strong> changethe earth’s temperature for a while. Emissions fromthe 1991 eruption of Mount Pinatubo in the Philippinescooled the earth slightly for 3 years, temporarilymasking signs of global warming. And volcanic ash,like the blowing desert dust, adds valuable trace mineralsto the soil where it settles.The lesson, once again, is that there is no away becauseeverything is connected. Wind acts as part of theplanet’s circulatory system for heat, moisture, plantnutrients, <strong>and</strong> long-lived pollutants we put into theair. Movement of soil particles from one place to anotherby wind <strong>and</strong> water is a natural phenomenon.But when we disturb the soil <strong>and</strong> leave it unprotected,we hasten <strong>and</strong> intensify this process.Wind is also an important factor in climatethrough its influence on global air circulation patterns.Climate, in turn, is crucial for determining what kindsof plant <strong>and</strong> animal life are found in the major biomesof the biosphere, as discussed in this chapter.
To do science is to search for repeated patterns, not simply toaccumulate facts, <strong>and</strong> to do the science of geographical ecologyis to search for patterns of plant <strong>and</strong> animal life that can beput on a map.ROBERT H. MACARTHURThis chapter addresses the following broad questionsabout geographic patterns of ecology:■■■■■■■What key factors determine the earth’s weather?What key factors determine the earth’s climate?How does climate determine where the earth’smajor biomes are found?What are the major types of desert biomes, <strong>and</strong>how do human activities affect them?What are the major types of grassl<strong>and</strong> biomes, <strong>and</strong>how do human activities affect them?What are the major types of forest biomes, <strong>and</strong> howdo human activities affect them?Why are mountain <strong>and</strong> arctic biomes important,<strong>and</strong> how do human activities affect them?Warm air massCold air massWarm front surfaceColdAnvil topfront surfaceCoolair massWarm air mass6-1 WEATHER: A BRIEFINTRODUCTIONWhat Is Weather? When Air Masses MeetWeather is the result of the atmospheric conditionsin a particular area over short time periods <strong>and</strong> isproduced mostly by interacting air masses.Weather is an area’s short-term atmospheric conditions—typicallyover hours or days. Examples ofatmospheric conditions are temperature, pressure,moisture content, precipitation, sunshine, cloud cover,<strong>and</strong> wind direction <strong>and</strong> speed.Meteorologists use equipment on weather balloons,aircraft, ships, <strong>and</strong> satellites, as well as radar<strong>and</strong> stationary sensors, to obtain data on weather variables.They feed the data into computer models todraw weather maps. Other computer models projectthe weather for the next several days by calculating theprobabilities that air masses, winds, <strong>and</strong> other factorswill move <strong>and</strong> change in certain ways.Much of the weather you experience is the resultof interactions between the leading edges or fronts ofmoving masses of warm <strong>and</strong> cold air. Weather changesas one air mass replaces or meets another. The mostdramatic changes in weather occur along a front, theboundary between two air masses with different temperatures<strong>and</strong> densities.A warm front is the boundary between an advancingwarm air mass <strong>and</strong> the cooler one it is replacing(Figure 6-2, top). Because warm air is less dense (weighsless per unit of volume) than cool air, an advancingwarm front rises up over a mass of cool air. As the warmfront rises, its moisture begins condensing into dropletsFigure 6-2 A warm front (top) occurs when an advancing mass ofwarm air meets <strong>and</strong> rises up over a retreating mass of denser cool air.A cold front (bottom) is the boundary formed when a mass of cold airwedges beneath a retreating mass of less dense warm air.to form layers of clouds at different altitudes. Graduallythe clouds thicken, descend to a lower altitude, <strong>and</strong> oftenrelease their moisture as rainfall. A moist warmfront can bring days of cloudy skies <strong>and</strong> drizzle.A cold front (Figure 6-2, bottom) is the leadingedge of an advancing mass of cold air. Because cold airis denser than warm air, an advancing cold front staysclose to the ground <strong>and</strong> wedges underneath less densewarmer air. An approaching cold front producesrapidly moving, towering clouds called thunderheads.As a cold front passes through, we often experiencehigh surface winds <strong>and</strong> thunderstorms. After thefront passes through, we usually have cooler temperatures<strong>and</strong> a clear sky.Further up near the top of the troposphere we findhurricane-force winds circling the earth, These powerfulwinds, called jet streams, follow rising <strong>and</strong> fallingpaths that have a strong influence on weather patterns.What Are Highs <strong>and</strong> Lows? Pressure ChangesWeather is affected by up <strong>and</strong> down movements ofmasses of air with high <strong>and</strong> low atmospheric pressure.Weather is also affected by changes in atmosphericpressure. Air pressure results from zillions of tiny mol-102 CHAPTER 6 Climate <strong>and</strong> Terrestrial Biodiversity
ecules of gases (mostly nitrogen <strong>and</strong> oxygen) in the atmospherezipping around at incredible speeds <strong>and</strong>hitting <strong>and</strong> bouncing off anything they encounter.Atmospheric pressure is greater near the earth’ssurface because the molecules in the atmosphereare squeezed together under the weight of the airabove. An air mass with high pressure, called a high,contains cool, dense air that descends toward theearth’s surface <strong>and</strong> becomes warmer. Fair weather followsas long as the high-pressure air mass remainsover an area.In contrast, a low-pressure air mass, called a low,produces cloudy <strong>and</strong> sometimes stormy weather. Becauseof its low pressure <strong>and</strong> low density, the center ofa low rises, <strong>and</strong> its warm air exp<strong>and</strong>s <strong>and</strong> cools. Whenthe temperature drops below a certain level where condensationtakes place, called the dew point, moisture inthe air condenses <strong>and</strong> forms clouds. If the droplets inthe clouds coalesce into large <strong>and</strong> heavy drops, precipitationoccurs. Recall that the condensation of watervapor into water drops usually requires that the aircontain suspended tiny particles of material such asdust, smoke, sea salts, or volcanic ash. These so-calledcondensation nuclei provide surfaces on which thedroplets of water can form <strong>and</strong> coalesce. Now youknow how rain forms.What Are Tornadoes <strong>and</strong> Tropical Cyclones?Weather GodzillasTornadoes <strong>and</strong> tropical storms are weather extremesthat can cause lots of damage but can sometimeshave beneficial ecological effects.Sometimes we experience weather extremes. Two examplesare violent storms called tornadoes (which formover l<strong>and</strong>) <strong>and</strong> tropical cyclones (which form over warmocean waters <strong>and</strong> sometimes pass over coastal l<strong>and</strong>).Tornadoes or twisters are swirling funnel shapedclouds that form over l<strong>and</strong>. They can destroy houses<strong>and</strong> cause other serious damage in areas when theytouch down on the earth’s surface. The United States isthe world’s most tornado-prone country, followed byAustralia.Tornadoes in the plains of the Midwest usually occurwhen a large, dry cold air front moving southwardfrom Canada runs into a large mass of humid air movingnorthward from the Gulf of Mexico. Most tornadoesoccur in the spring when fronts of cold air fromthe north penetrate deeply into the midwestern plans.As the large warm-air mass moves rapidly overthe more dense mass of cold air it rises rapidly <strong>and</strong>forms strong vertical convection currents that suck airupward, as shown in Figure 6-3. Trace the flows in thisDescendingcool airSeverethunderstormRisingwarm airSevere thunderstormscan trigger a numberof smaller tornadoesTornado forms whencool downdraft <strong>and</strong>warm updraft of airmeet <strong>and</strong> interactWarm moist air drawn inRisingupdraftof airFigure 6-3 Formationof a tornado ortwister. Althoughtwisters can formany time of the year,the most active tornadoseason in theUnited States isusually Marchthrough August.Meteorologists cannottell us with greataccuracy when <strong>and</strong>where most tornadoeswill form.http://biology.brookscole.com/miller14103
figure. Scientists hypothesize that the rising vortex ofair starts spinning because the air near the ground inthe funnel is moving slower than the air above. Thisrolls or spins the air ahead of the advancing front in avertically rising air mass or vortex.Large <strong>and</strong> dangerous storms called tropical cyclonesare spawned by the formation of low-pressurecells of air over warm tropical seas. Figure 6-4 showsthe formation <strong>and</strong> structure of a tropical cyclone. Tracethe flows in this figure. Hurricanes are tropical cyclonesthat form in the Atlantic Ocean; those forming in thePacific Ocean usually are called typhoons. Tropical cyclonestake a long time to form <strong>and</strong> gain strength. As aresult, meteorologists can track their paths <strong>and</strong> windspeeds <strong>and</strong> warn people in areas likely to be hit bythese violent storms.Hurricanes <strong>and</strong> typhoons can kill <strong>and</strong> injure people<strong>and</strong> damage property <strong>and</strong> agricultural production.But sometimes the long-term ecological <strong>and</strong> economicbenefits of a tropical cyclone can exceed its short-termharmful effects.For example, in parts of Texas along the Gulf ofMexico, coastal bays <strong>and</strong> marshes normally are closedoff from freshwater <strong>and</strong> saltwater inflows. In August1999, Hurricane Brett struck this coastal area. Accordingto marine biologists, it flushed out excess nutrientsfrom l<strong>and</strong> runoff <strong>and</strong> dead sea grasses <strong>and</strong> rotting vegetationfrom the coastal bays <strong>and</strong> marshes. It alsocarved 12 channels through the barrier isl<strong>and</strong>s alongthe coast, allowing huge quantities of fresh seawater toflood the bays <strong>and</strong> marshes. This flushing out of thebays <strong>and</strong> marshes reduced brown tides consisting ofexplosive growths of algae feeding on excess nutrients.It also increased growth of sea grasses, which serve asnurseries for shrimp, crabs, <strong>and</strong> fish <strong>and</strong> food for millionsof ducks wintering in Texas bays. Production ofcommercially important species of shellfish <strong>and</strong> fishalso increased.4Rising winds exitfrom the storm athigh altitudes.The calm centraleye usually is about24 kilometers(15 miles) wide.Gales circle the eye at speedsof up to 320 kilometers(200 miles) per hour321Moist surface windsspiral in toward thecenter of the storm.Figure 6-4 Formation of a tropical cyclone. Those forming in the Atlantic Ocean usually are called hurricanes;those forming in the Pacific Ocean usually are called typhoons.104 CHAPTER 6 Climate <strong>and</strong> Terrestrial Biodiversity
6-2 CLIMATE: A BRIEFINTRODUCTIONWhat Is Climate? Long-Term Weather<strong>and</strong> Global Air CirculationClimate is the average temperature <strong>and</strong> averageprecipitation of an area over long periods of time,which in turn are affected by global air circulation.Climate is a region’s long-term atmospheric conditions—typicallyover decades. Average temperature <strong>and</strong>average precipitation are the two main factors determininga region’s climate <strong>and</strong> its effects on people, asshown in Figure 6-5.Figure 6-6 (p. 106) is a generalized map of theearth’s major climate zones. In what type of climatezone do you live?The temperature <strong>and</strong> precipitation patterns thatlead to different climates are caused primarily by theClimateisthe average weather patterns for an area overa long period of time (30–1,000,000 years).Average PrecipitationIt is determined by<strong>and</strong>which are influenced byAverage Temperatureamount of incoming solar energy per unit area of l<strong>and</strong>,air circulation over the earth’s surface, <strong>and</strong> water circulation.Solar energy heats the atmosphere, evaporateswater, helps create seasons, <strong>and</strong> causes air to circulate.Four major factors determine global air circulationpatterns. One is the uneven heating of the earth’s surface.Air is heated much more at the equator, where thesun’s rays strike directly throughout the year, than atthe poles, where sunlight strikes at an angle <strong>and</strong> thusis spread out over a much greater area. You can observethis effect by shining a flashlight in a darkenedroom on the middle of a spherical object such as abasketball. These differences in the amount of incomingsolar energy help explain why tropical regionsnear the equator are hot, polar regions are cold, <strong>and</strong>temperate regions in between generally have intermediateaverage temperatures.Asecond factor is seasonal changes in temperature <strong>and</strong>precipitation. The earth’s axis—an imaginary line connectingthe north <strong>and</strong> south poles—is tilted. Asaresult, various regions are tipped toward oraway from the sun as the earth makes its yearlongrevolution around the sun (Figure 6-7,p. 106). This creates opposite seasons in thenorthern <strong>and</strong> southern hemispheres.A third factor is rotation of the earth on itsaxis. As the earth rotates, its surface turns fasterbeneath air masses at the equator <strong>and</strong> slowerbeneath those at the poles. This deflects airmasses moving north <strong>and</strong> south to the west oreast over different parts of the earth’s surface(Figure 6-8, p. 107). The direction of air movementin these different areas sets upbelts of prevailing winds—major surfacewinds that blow almost continually<strong>and</strong> distribute air <strong>and</strong> moisture over theearth’s surface.Fourth, properties of air, water, <strong>and</strong>l<strong>and</strong> affect global air circulation. Heatfrom the sun evaporates ocean water<strong>and</strong> transfers heat from the oceans tothe atmosphere, especially nearthe hot equator.latitudealtitudeocean currents<strong>and</strong> affectswhere people livehow people livewhat theygrow <strong>and</strong> eatFigure 6-5 Climate <strong>and</strong> its effects. (Datafrom National Oceanic <strong>and</strong> AtmosphericAdministration)http://biology.brookscole.com/miller14105
ArcticCircleTropic ofCancerNorth PacificAlaskacurrentdriftc urrentCaliforniaGulfstreamLabrador currentCanaries currentNorth Atlantic driftNorthKuroshio currentequatorialOyashiocurrentcurrentEquatorial countercurrentCaribbeancurrentGuinea currentMonsoon driftTropic ofCapricornWest wind driftSouth equatorial currentcurrentPeruBrazilcurrentSouthequatorialcurrentcurrentBenguelaWest wind driftSouth equatorial currentcurrentWest AustralianWest wind driftralianEast AustcurrentAntarcticCirclePolar (ice)Warm temperateHighl<strong>and</strong>Warm ocean currentSubarctic (snow)DryMajor upwelling zonesCold ocean currentCool temperateTropicalRiverFigure 6-6 Natural capital: generalized map of the earth’s current climate zones, showing the major contributingocean currents <strong>and</strong> drifts.This evaporation of water creates cyclical convectioncells that circulate air, heat, <strong>and</strong> moisture both vertically<strong>and</strong> from place to place in the troposphere, asshown in Figure 6-9. Trace the flows in this diagram. Tounderst<strong>and</strong> this cycle, remember two things. First, hotair tends to rise, cool, <strong>and</strong> release moisture as precipitation.Second, cool air tends to sink, get warmer, <strong>and</strong> loseits moisture by evaporation (not precipitation).The earth’s air <strong>and</strong> water circulation patterns <strong>and</strong>its mixture of continents <strong>and</strong> oceans lead to an irregulardistribution of climates <strong>and</strong> patterns of vegetation,as shown in Figure 6-10.Figure 6-7 Seasons in the northern <strong>and</strong> southern hemispheresare caused by the tilt of the earth’s axis. As the planet makes itsannual revolution around the sun on an axis tilted about 23.5°,various regions are tipped toward or away from the sun. The resultingvariations in the amount of solar energy reaching theearth create the seasons.Spring(sun aims directlyat equator)Summer(northern hemispheretilts toward sun)SolarradiationWinter(northern hemispheretilts away from sun) 23.5 °Fall(sun aims directly at equator)106 CHAPTER 6 Climate <strong>and</strong> Terrestrial Biodiversity
WesterliesNortheast tradesCold deserts 60°NForests30°NHot desertsForests0°EquatorCold,dry airfallsPolar capCell 3 NorthArctic tundraEvergreen60° coniferous forestTemperate deciduousforest <strong>and</strong> grassl<strong>and</strong>Desert30°Moist air rises — rainCell 2 NorthCool, dryair fallsCell 1 NorthSoutheast tradesWesterliesForestsCold desertsHot deserts60°S30°SFigure 6-8 The earth’s rotation deflects the movement of the airover different parts of the earth <strong>and</strong> creates global patterns ofprevailing winds.0°30°60°Polar capTropical deciduous forestEquatorDesertTemperate deciduousforest <strong>and</strong> grassl<strong>and</strong>Tropicalrain forestTropical deciduous forestCool, dryair fallsCell 2 SouthMoistair rises,cools, <strong>and</strong>releasesmoistureas rainCell 1 SouthCold,dry airfallsCell 3 SouthMoist air rises — rainLOWPRESSURECool, dryairFalls, is compressed, warmsHeat releasedradiates to spaceHIGHPRESSURECondensation<strong>and</strong>precipitationRises, exp<strong>and</strong>s, coolsFigure 6-10 Natural capital: global air circulation <strong>and</strong> biomes.Heat <strong>and</strong> moisture are distributed over the earth’s surface byvertical currents that form six large convection cells (Hadleycells) at different latitudes. The direction of airflow <strong>and</strong> the ascent<strong>and</strong> descent of air masses in these convection cells determinethe earth’s general climatic zones. The resulting unevendistribution of heat <strong>and</strong> moisture over the planet’s surface leadsto the forests, grassl<strong>and</strong>s, <strong>and</strong> deserts that make up the earth’sbiomes.Warm,dry airHIGHPRESSUREFlows toward low pressure,picks up moisture <strong>and</strong> heatMoist surface warmed by sunHot, wetairLOWPRESSUREFigure 6-9 Transfer of energy by convection in the atmosphere.Convection occurs when matter warms, becomes less dense,<strong>and</strong> rises within its surroundings. This efficient means of heattransfer occurs in the planet’s interior, oceans, <strong>and</strong> atmosphere(as shown here). Distribution of heat <strong>and</strong> water occurs in the atmospherebecause vertical convection currents stir up air in thetroposphere <strong>and</strong> transport heat <strong>and</strong> water from one area to anotherin circular convection cells called Hadley cells.How Do Ocean Currents <strong>and</strong> WindsAffect Regional Climates? Moving Heat <strong>and</strong>Air AroundOcean currents <strong>and</strong> winds influence climate byredistributing heat received from the sun from oneplace to another.The oceans absorb heat from the air circulation patternsjust described, with the bulk of this heat absorbednear the warm tropical areas. This heat plusdifferences in water density create warm <strong>and</strong> coldocean currents (Figure 6-6). These currents, driven bywinds <strong>and</strong> the earth’s rotation, redistribute heat receivedfrom the sun from one place to another <strong>and</strong>thus influence climate <strong>and</strong> vegetation, especially nearcoastal areas. They also help mix ocean waters <strong>and</strong> distributenutrients <strong>and</strong> dissolved oxygen needed byaquatic organisms.http://biology.brookscole.com/miller14107
Winds can also affect regionalclimates <strong>and</strong> distributionof some forms of aquaticlife. For example, wind blowingalong steep western coastsof some continents pushessurface water away from thel<strong>and</strong>. This outgoing surfacewater is replaced by an upwellingof cold, nutrient-richbottom water, as shown in Figure6-11.Upwellings, whether farfrom shore or near shore,bring plant nutrients from thedeeper parts of the ocean tothe surface. In turn, these nutrientssupport large populationsof phytoplankton, zooplankton,fish, <strong>and</strong> fish-eatingseabirds.UpwellingMovement ofsurface waterFishZooplanktonPhytoplanktonNutrientsWindDiving birdsFigure 6-11 A shore upwelling (shown here) occurs when deep, cool, nutrient-rich waters aredrawn up to replace surface water moved away from a steep coast by wind flowing along the coasttoward the equator. Such areas support large populations of phytoplankton, zooplankton, fish, <strong>and</strong>fish-eating birds. Equatorial upwellings occur in the open sea near the equator (Figure 6-6) whennorthward <strong>and</strong> southward currents interact to push deep waters <strong>and</strong> their nutrients to the surface,thus greatly increasing primary productivity in such areas.What Are El Niño <strong>and</strong> La Niña?Changing Winds, Altered Upwellings, <strong>and</strong>Freaky WeatherEl Niño occurs when a change in the direction of tropicalwinds warms coastal surface water, suppressesupwellings, <strong>and</strong> alters much of the earth’s weather. LaNiña is the reverse of this effect.Every few years in the Pacific Ocean, normal shoreupwellings (Figure 6-12, left) are affected bychanges in climate patterns called the El Niño–Southern Oscillation, or ENSO (Figure 6-12, right).Trace the flows <strong>and</strong> components of the diagram inFigure 6-12.Surface windsblow westwardDrought inAustralia <strong>and</strong>Southeast AsiaWinds weaken,causing updrafts<strong>and</strong> stormsEQUATOREQUATORAUSTRALIAWarm waterWarm waterspushed westwardThermoclineSOUTHAMERICACold waterAUSTRALIAWarm waterWarm waterflow stoppedor reversedThermoclineSOUTHAMERICAWarm water deepens offSouth AmericaCold waterNormal ConditionsEl Niño ConditionsFigure 6-12 Normal trade winds blowing westward cause shore upwellings of cold, nutrient-rich bottomwater in the tropical Pacific Ocean near the coast of Peru (left). A zone of gradual temperature changecalled the thermocline separates the warm <strong>and</strong> cold water. Every few years a climate shift known as theEl Niño–Southern Oscillation (ENSO) disrupts this pattern. Westward-blowing trade winds weaken or reversedirection, which depresses the coastal upwellings <strong>and</strong> warms the surface waters off South America (right).When an ENSO lasts 12 months or longer, it severely disrupts populations of plankton, fish, <strong>and</strong> seabirds inupwelling areas <strong>and</strong> can trigger extreme weather changes over much of the globe (see Figure 6-13).108 CHAPTER 6 Climate <strong>and</strong> Terrestrial Biodiversity
DroughtUnusually high rainfallUnusually warm periodsEl NiñoFigure 6-13 Typical global climatic effects of anEl Niño–Southern Oscillation. During the 1996–98 ENSO,huge waves battered the California coast, <strong>and</strong> torrential rainscaused widespread flooding <strong>and</strong> mudslides. In Peru, floods<strong>and</strong> mudslides killed hundreds of people, left about 250,000people homeless, <strong>and</strong> ruined harvests. Drought in Brazil, Indonesia,<strong>and</strong> Australia led to massive wildfires in tinder-dryforests. India <strong>and</strong> parts of Africa also experienced severedrought. A catastrophic ice storm hit Canada <strong>and</strong> the northeasternUnited States, but the southeastern United States had fewerhurricanes. (Data from United Nations Food <strong>and</strong> AgricultureOrganization)In an ENSO, often called El Niño, prevailing tropicaltrade winds blowing westward weaken or reversedirection. This warms up surface water along theSouth <strong>and</strong> North American coasts, which suppressesthe normal upwellings of cold, nutrient-rich water.The decrease in nutrients reduces primary productivity<strong>and</strong> causes a sharp decline in the populations ofsome fish species.A strong ENSO can trigger extreme weatherchanges over at least two-thirds of the globe (Figure6-13)—especially in l<strong>and</strong>s along the Pacific <strong>and</strong>Indian Oceans—<strong>and</strong> distorts the fast-moving jetstream that flows high above North America.La Niña, the reverse of El Niño, cools some coastalsurface waters, <strong>and</strong> brings back upwellings. TypicallyLa Niña means more Atlantic Ocean hurricanes, colderwinters in Canada <strong>and</strong> the northeastern United States,<strong>and</strong> warmer <strong>and</strong> drier winters in the southeastern <strong>and</strong>southwestern United States. It also usually leads towetter winters in the Pacific Northwest, torrential rainsin Southeast Asia, lower wheat yields in Argentina,<strong>and</strong> more wildfires in Florida.How Do Gases in the AtmosphereAffect Climate? The Natural GreenhouseEffectWater vapor, carbon dioxide, <strong>and</strong> other gasesinfluence climate by warming the lower troposphere<strong>and</strong> the earth’s surface.Small amounts of certain gases play a key role in determiningthe earth’s average temperatures <strong>and</strong> thusits climates. These gases include water vapor (H 2 O),carbon dioxide (CO 2 ), methane (CH 4 ), <strong>and</strong> nitrous oxide(N 2 O).Together these gases, known as greenhouse gases,allow mostly visible light <strong>and</strong> some infrared radiation<strong>and</strong> ultraviolet (UV) radiation from the sun to passthrough the troposphere. The earth’s surface absorbsmuch of this solar energy. This transforms it to longerwavelengthinfrared radiation, which rises into thetroposphere.Some of this infrared radiation escapes into space<strong>and</strong> some is absorbed by molecules of greenhousegases <strong>and</strong> emitted into the troposphere in all directionsas even longer wavelength infrared radiation.Some of this released energy is radiated into space<strong>and</strong> some warms the troposphere <strong>and</strong> the earth’s surface.This natural warming effect of the troposphereis called the greenhouse effect, diagrammed in Figure6-14 (p. 110).The basic principle behind the natural greenhouseeffect is well established. Indeed, without itscurrent concentrations of greenhouse gases (especiallywater vapor, which is found in the largest concentration),the earth would be a cold <strong>and</strong> mostly lifelessplanet.Human activities such as burning fossil fuels,clearing forests, <strong>and</strong> growing crops release carbondioxide, methane, <strong>and</strong> nitrous oxide into the troposphere.There is concern that these large inputs ofgreenhouse gases can enhance the earth’s naturalgreenhouse effect <strong>and</strong> lead to global warming—more onthis in Chapter 21. This could alter precipitation patterns,shift areas where we can grow crops, raise averagesea levels, <strong>and</strong> shift areas where some types ofplants <strong>and</strong> animals can live.How Does Topography of the Earth’s SurfaceAffect Local Climate? Creating Deserts <strong>and</strong>Warming CitiesMountains <strong>and</strong> cities affect local <strong>and</strong> regionalclimates.Various topographic features of the earth’s surface cancreate local <strong>and</strong> regional climatic conditions that differfrom the general climate of a region. For example,mountains interrupt the flow of prevailing surfacewinds <strong>and</strong> the movement of storms. When moist airblowing inl<strong>and</strong> from an ocean reaches a mountainrange, it cools as it is forced to rise <strong>and</strong> exp<strong>and</strong>. Thiscauses the air to lose most of its moisture as rain <strong>and</strong>snow on the windward (wind-facing) slopes.As the drier air mass flows down the leeward(away from the wind) slopes, it draws moisture out ofthe plants <strong>and</strong> soil over which it passes. The lower precipitation<strong>and</strong> the resulting semiarid or arid conditionshttp://biology.brookscole.com/miller14109
FPO(a) Rays of sunlight penetratethe lower atmosphere <strong>and</strong>warm the earth's surface.(b) The earth's surface absorbs much of the incoming (c) As concentrations of greenhousesolar radiation <strong>and</strong> degrades it to longer-wavelength gases rise, their molecules absorb <strong>and</strong>infrared (IR) radiation, which rises into the loweremit more infrared radiation, which addsatmosphere. Some of this IR radiation escapes into space more heat to the lower atmosphere.as heat <strong>and</strong> some is absorbed by molecules ofgreenhouse gases <strong>and</strong> emitted as even longerwavelength IR radiation, which warms thelower atmosphere.Figure 6-14 Natural capital: the natural greenhouse effect. Without the atmospheric warming provided bythis natural effect, the earth would be a cold <strong>and</strong> mostly lifeless planet. According to the widely accepted greenhousetheory, when concentrations of greenhouse gases in the atmosphere rise, the average temperature of thetroposphere rises. (Modified by permission from Cecie Starr, Biology: Concepts <strong>and</strong> Applications, 4th ed.,Brooks/Cole [Wadsworth] 2000)on the leeward side of high mountains are called therain shadow effect, (Figure 6-15). This is one waysome deserts form.Cities also create distinct microclimates. Bricks,concrete, asphalt, <strong>and</strong> other building materials absorb<strong>and</strong> hold heat, <strong>and</strong> buildings block wind flow. Motorvehicles <strong>and</strong> the climate control systems of buildingsrelease large quantities of heat <strong>and</strong> pollutants. As a result,cities tend to have more haze <strong>and</strong> smog, highertemperatures, <strong>and</strong> lower wind speeds than the surroundingcountryside.Now that you have the basics of climate we canexamine how it applies to ecology.6-3 BIOMES: CLIMATE AND LIFEON LANDWhy Do Different Organisms Livein Different Places? Think ClimateDifferent climates lead to different communitiesof organisms, especially vegetation.Why is one area of the earth’s l<strong>and</strong> surface a desert, anothera grassl<strong>and</strong>, <strong>and</strong> another a forest? Why do differenttypes of deserts, grassl<strong>and</strong>s, <strong>and</strong> forests exist? Thegeneral answer to these questions is differences inclimate (Figure 6-6), caused mostly by differences inPrevailing windspick up moisturefrom an ocean.On the windwardside of a mountain range,air rises, cools, <strong>and</strong>releases moisture.On the leeward side ofthe mountain range, airdescends, warms, <strong>and</strong> releaseslittle moisture.Dry habitatsMoist habitatsFigure 6-15 The rain shadow effect is a reduction of rainfall on the side of high mountains facing away fromprevailing surface winds. It occurs when warm, moist air in prevailing onshore winds loses most of its moistureas rain <strong>and</strong> snow on the windward (wind-facing) slopes of a mountain range. This leads to semiarid <strong>and</strong> aridconditions on the leeward side of the mountain range <strong>and</strong> the l<strong>and</strong> beyond. The Mojave Desert (east of theSierra Nevada in California) <strong>and</strong> Asia’s Gobi Desert are produced by this effect.110 CHAPTER 6 Climate <strong>and</strong> Terrestrial Biodiversity
average temperature <strong>and</strong> precipitation due to globalair <strong>and</strong> water circulation (Figure 6-10).Figure 6-16 shows how scientists have divided theworld into 12 major biomes. They are terrestrial regionswith characteristic types of natural ecologicalcommunities adapted to the climate of each region.Study Figure 6-16 carefully <strong>and</strong> identify the type ofbiome you live in.By comparing Figure 6-16 with Figure 6-6, you cansee how the world’s major biomes vary with climate.Make this comparison for the area where you live. Figure4-10 (p. 62) shows major biomes in the UnitedStates as one moves through different climates alongthe 39th parallel.Average annual precipitation <strong>and</strong> temperature (aswell as soil type, Figure 4-27, p. 75) are the most importantfactors in producing tropical, temperate, or polardeserts, grassl<strong>and</strong>s, <strong>and</strong> forests (Figure 6-17, p. 112).On maps such as the one in Figure 6-16, biomesare presented as having boundaries <strong>and</strong> being coveredwith the same general type of vegetation. In reality,biomes are not uniform. They consist of a mosaic ofpatches, with somewhat different biological communitiesbut with similarities unique to the biome. Thesepatches occur mostly because the resources plants <strong>and</strong>animals need are not uniformly distributed. Go to anatural area in or near where you live <strong>and</strong> see if youcan find patches with different vegetation.Tropic ofCancerEquatorTropic ofCapricornArctic tundra (polar grassl<strong>and</strong>s)Boreal forest (taiga), evergreen coniferousforest (e.g., montane coniferous forest)Temperate deciduous forestTemperate grassl<strong>and</strong>Dry woodl<strong>and</strong>s <strong>and</strong>shrubl<strong>and</strong>s (chaparral)DesertTropical rain forest,tropical evergreen forestTropical deciduous forestTropical scrub forestTropical savanna,thorn forestSemidesert,arid grassl<strong>and</strong>Mountains(complex zonation)IceFigure 6-16 Natural capital: the earth’s major biomes—the main types of natural vegetation in different undisturbedl<strong>and</strong> areas—result primarily from differences in climate. Each biome contains many ecosystems whosecommunities have adapted to differences in climate, soil, <strong>and</strong> other environmental factors. In reality, peoplehave removed or altered much of this natural vegetation in some areas for farming, livestock grazing, lumber<strong>and</strong> fuelwood, mining, <strong>and</strong> construction.http://biology.brookscole.com/miller14111
ColdPolarTundraSubpolarDecreasing temperatureConiferous forestTemperateDesertDeciduousforestChaparralGrassl<strong>and</strong>TropicalHotDesertWetRain forestTropicalseasonalforestScrubl<strong>and</strong>SavannaDryDecreasing precipitationFigure 6-17 Natural capital: average precipitation <strong>and</strong> average temperature, acting together as limiting factorsover a period of 30 or more years, determine the type of desert, grassl<strong>and</strong>, or forest biome in a particulararea. Although the actual situation is much more complex, this simplified diagram explains how climate determinesthe types <strong>and</strong> amounts of natural vegetation found in an area left undisturbed by human activities. (Usedby permission of Macmillan Publishing Company. From Derek Elsom, The Earth, 1992. Copyright © 1992 byMarshall Editions Developments Limited. New York: Macmillan. Used by permission.)AltitudeMountainice <strong>and</strong> snowTundra (herbs,lichens, mosses)ConiferousForestDeciduousForestLatitudeTropicalForestTropicalForestDeciduousForestConiferousForestTundra (herbs,lichens, mosses)Polar ice<strong>and</strong> snowFigure 6-18 Generalized effects of altitude (left) <strong>and</strong> latitude (right) on climate <strong>and</strong> biomes. Parallel changesin vegetation type occur when we travel from the equator to the poles or from lowl<strong>and</strong>s to mountaintops. Thisgeneralized diagram shows only on of many possible sequences.112 CHAPTER 6 Climate <strong>and</strong> Terrestrial Biodiversity
Figure 6-18 (facing page) shows how climate <strong>and</strong>vegetation vary with latitude (distance from the equator)<strong>and</strong> altitude (elevation above sea level). If youclimb a tall mountain from its base to its summit, youcan observe changes in plant life similar to those youwould encounter in traveling from the equator to theearth’s poles.6-4 DESERT BIOMESWhat Are the Major Types of Deserts? Hot,Medium, <strong>and</strong> ColdDeserts have little precipitation <strong>and</strong> little vegetation<strong>and</strong> are found in tropical, temperate, <strong>and</strong> polar regions.A desert is an area where evaporation exceeds precipitation.Annual precipitation is low <strong>and</strong> often scatteredunevenly throughout the year. Deserts have sparse,widely spaced, mostly low vegetation.Deserts cover about 30% of the earth’s l<strong>and</strong> surface<strong>and</strong> are found mostly in tropical <strong>and</strong> subtropicalregions (Figure 6-16). The largest deserts are found inthe interiors of continents, far from moist sea air <strong>and</strong>moisture-bearing winds. Other, more local desertsform on the downwind sides of mountain ranges becauseof the rain shadow effect (Figure 6-15).During the day the baking sun warms the groundin the desert. At night, however, most of the heatstored in the ground radiates quickly into the atmosphere.This occurs because desert soils have little vegetation<strong>and</strong> moisture to help store the heat <strong>and</strong> theskies are usually clear. This explains why in a desertyou may roast during the day but shiver at night.A combination of low rainfall <strong>and</strong> different averagetemperatures creates tropical, temperate, <strong>and</strong> colddeserts (Figures 6-17 <strong>and</strong> 6-19). Take a close look at thegraphs in Figure 6-19.Tropical deserts (Figure 6-19, left) are hot <strong>and</strong> drymost of the year. They have few plants <strong>and</strong> a hard,windblown surface strewn with rocks <strong>and</strong> some s<strong>and</strong>.They are the deserts we often see in movies.In temperate deserts, daytime temperatures are highin summer <strong>and</strong> low in winter <strong>and</strong> there is more precipitationthan in tropical deserts (Figure 6-19, center).The sparse vegetation consists mostly of widely dispersed,drought-resistant shrubs <strong>and</strong> cacti or othersucculents adapted to the lack of water <strong>and</strong> temperaturevariations, as shown in Figure 6-20 (p. 114). Tracehow nutrients <strong>and</strong> energy flow through the ecosystemin this diagram. In cold deserts, winters are cold, summersare warm or hot, <strong>and</strong> precipitation is low (Figure6-19, right).In the semiarid zones between deserts <strong>and</strong> grassl<strong>and</strong>s,we find semidesert. This biome is dominated bythorn trees <strong>and</strong> shrubs adapted to long dry spells followedby brief, sometimes heavy rains.How Do Desert Plants <strong>and</strong> AnimalsSurvive? Stay Cool <strong>and</strong> Get Water Any WayYou CanDesert plants <strong>and</strong> animals have a number of strategiesfor staying cool <strong>and</strong> getting enough water to survivein hot <strong>and</strong> dry climates.Adaptations for survival in the desert have two themes.One is beat the heat <strong>and</strong> the other is every drop of watercounts. Desert plants exposed to the sunlight must conserveenough water for survival <strong>and</strong> lose enough heatso they do not overheat <strong>and</strong> die.Desert plants have evolved a number of strategiesfor doing this. During long hot <strong>and</strong> dry spells plantsMean monthly temperature°C °F in. mm100 153537530 9014 35025 8013 32520 7012 30015 6011 27510 5010 2505 409 2250 308 200–5 32°F Freezing point207 175–10–15106 150–20 05 125–25 –104 100–30 –203 75–35–40–45–30–40–5021050250JanFebMarAprMayJunJulAugSepOctNovDecMonthsTropical desert(Saudi Arabia)Mean monthly precipitationMean monthly temperature°C °F1003530 9025 8020 7015 6010 505 400 30–5 20–10–1510–20 0–25 –10–30 –20–35 –30–40 –40–45 –5032°F Freezing pointJanFebMarAprMayJunJulAugSepOctNovDecMonthsTemperate desert(Reno, Nevada)in.1514131211109876543210mm3753503253002752502252001751501251007550250Mean monthly precipitationMean monthly temperature°C °F10035309025 8020 7015 6010 505 400 30–5 20–10–1510–20 0–25 –10–30 –20–35 –30–40 –40–45 –5032°F Freezing pointJanFebMarAprMayJunJulAugSepOctNovDecMonthsPolar desert(northwest China)in.1514131211109876543210mm3753503253002752502252001751501251007550250Mean monthly precipitationFigure 6-19 Climate graphs showing typical variations in annual temperature (the graphed line) <strong>and</strong> precipitation(the shaded area on the graph) in tropical, temperate, <strong>and</strong> polar (cold) deserts.http://biology.brookscole.com/miller14113
Figure 6-20 Natural capital:some components <strong>and</strong> interactionsin a temperate desertecosystem. When these organismsdie, decomposers breakdown their organic matter intominerals that plants use. Coloredarrows indicate transfers ofmatter <strong>and</strong> energy betweenproducers, primary consumers(herbivores), secondary, orhigher-level, consumers (carnivores),<strong>and</strong> decomposers. Organismsare not drawn to scale.Red-tailed hawkYuccaJackrabbitCollaredlizardGambel'squailAgavePricklypearcactussuch as mesquite <strong>and</strong> creosotedrop their leaves to survive ina dormant state. Succulent(fleshy) plants, such as thesaguaro (“sah-WAH-ro”) cactus,have three adaptations.They have no leaves, whichcan lose water by evapotranspiration.They store water<strong>and</strong> synthesize food in theirexp<strong>and</strong>able, fleshy tissue.And they reduce water lossby opening their pores (stomata)to take up carbon dioxide(CO 2 ) only at night. Whatagreat evolutionary solutionto a difficult problem.Some desert plants usedeep roots to tap into groundwater.Others such as pricklyRoadrunnerDiamondback rattlesnakeProducerto primaryconsumerpear (Figure 6-20) <strong>and</strong> saguaro cacti use widely spread,shallow roots to collect water after brief showers <strong>and</strong>store it in their spongy tissue.Evergreen plants conserve water by having waxcoatedleaves that minimize evapotranspiration. Others,such as annual wildflowers <strong>and</strong> grasses, storemuch of their biomass in seeds that remain inactive,sometimes for years, until they receive enough waterto germinate. Shortly after a rain these seeds germinate,grow, carpet some deserts with a dazzling arrayof colorful flowers, produce new seed, <strong>and</strong> die, all inonly a few weeks.Most desert animals are small. Some beat the heatby hiding in cool burrows or rocky crevices by day <strong>and</strong>coming out at night or in the early morning. Others becomedormant during periods of extreme heat ordrought.Kangaroo ratPrimaryto secondaryconsumerDarklingbeetleSecondary tohigher-levelconsumerFungiBacteriaAll producers <strong>and</strong>consumers todecomposersSome desert animals have physical adaptationsfor conserving water. Insects <strong>and</strong> reptiles have thickouter coverings to minimize water loss through evaporation,<strong>and</strong> their wastes are dry feces <strong>and</strong> a dried concentrateof urine. Many spiders <strong>and</strong> insects get theirwater from dew or from the food they eat. Arabianoryxes survive by licking the dew that accumulates atnight on rocks <strong>and</strong> on one another’s hair.Figure 6-21 shows major human impacts ondeserts. What are the direct or indirect effects of yourlifestyle on desert biomes?Deserts take a long time to recover from disturbancesbecause of their slow plant growth, low speciesdiversity, slow nutrient cycling (because of little bacterialactivity in their soils), <strong>and</strong> lack of water. Desertvegetation destroyed by livestock overgrazing <strong>and</strong> offroadvehicles may take decades to grow back.114 CHAPTER 6 Climate <strong>and</strong> Terrestrial Biodiversity
Natural Capital DegradationLarge desert citiesSoil destruction by off-roadvehicles <strong>and</strong> urb<strong>and</strong>evelopmentDesertsSoil salinization from irrigationDepletion of undergroundwater suppliesL<strong>and</strong> disturbance <strong>and</strong> pollutionfrom mineral extractionStorage of toxic <strong>and</strong>radioactive wastesLarge arrays of solar cells <strong>and</strong>solar collectors used toproduce electricityFigure 6-21 Natural capital degradation: major human impactson the world’s deserts.6-5 GRASSLAND, TUNDRA, ANDCHAPARRAL BIOMESWhat Are the Major Types of Grassl<strong>and</strong>s?Hot, Mild, <strong>and</strong> ColdGrassl<strong>and</strong>s have enough precipitation to supportgrasses but not enough to support large st<strong>and</strong>s oftrees <strong>and</strong> are found in tropical, temperate, <strong>and</strong> polarregions.Grassl<strong>and</strong>s, or prairies, are regions with enough averageannual precipitation to support grasses (<strong>and</strong> insome areas, a few trees). Most grassl<strong>and</strong>s are found inthe interiors of continents (Figure 6-16).Grassl<strong>and</strong>s persist because of a combination ofseasonal drought, grazing by large herbivores, <strong>and</strong> occasionalfires—all of which keep large numbers ofshrubs <strong>and</strong> trees from growing. The three main typesof grassl<strong>and</strong>s—tropical, temperate, <strong>and</strong> polar (tundra)—resultfrom combinations of low average precipitation<strong>and</strong> various average temperatures (Figures 6-17<strong>and</strong> 6-22). Take a close look at the graphs in Figure 6-22.What Are Tropical Grassl<strong>and</strong>s <strong>and</strong> Savannas?Hot with On-<strong>and</strong>-Off RainSavannas are hot places that have rain, exceptduring dry seasons, <strong>and</strong> enormous herds of hoofedanimals occupying different ecologicalniches.One type of tropical grassl<strong>and</strong>, called a savanna,usually has warm temperatures year-round, two prolongeddry seasons, <strong>and</strong> abundant rain the rest of theyear (Figure 6-22, left). African tropical savannas containenormous herds of grazing (grass- <strong>and</strong> herbeating)<strong>and</strong> browsing (twig- <strong>and</strong> leaf-nibbling) hoofedanimals that feed on a wide variety of savanna plants,as shown in Figure 6-23 (p. 116). In this diagram, notethe number of different niches that allow these animalsto coexist.As part of their niches, these <strong>and</strong> other large herbivoreshave evolved specialized eating habits that minimizecompetition between species for vegetation. Forexample, giraffes eat leaves <strong>and</strong> shoots from the tops oftrees, elephants eat leaves <strong>and</strong> branches further down,Thompson’s gazelles <strong>and</strong> wildebeests prefer shortgrass, <strong>and</strong> zebras graze on longer grass <strong>and</strong> stems.Mean monthly temperature°C °F in. mm100 153537530 9014 35025 8013 32520 7012 30015 6011 27510 5010 2505 409 2250 308 200–5 32°F Freezing point207 175–10–15106 150–20 05 125–25 –104 100–30 –203 75–35–40–45–30–40–5021050250JanFebMarAprMayJunJulAugSepOctNovDecMonthsTropical grassl<strong>and</strong> (savanna)(Harare, Zimbabwe)Mean monthly precipitationMean monthly temperature°C °F1003530 9025 8020 7015 6010 505 400 30–5 20–10–1510–20 0–25 –10–30 –20–35 –30–40 –40–45 –5032°F Freezing pointJanFebMarAprMayJunJulAugSepOctNovDecMonthsTemperate grassl<strong>and</strong>(Lawrence, Kansas)in.1514131211109876543210mm3753503253002752502252001751501251007550250Mean monthly precipitationMean monthly temperature°C °F10035309025 8020 7015 6010 505 400 30–5 20–10–1510–20 0–25 –10–30 –20–35 –30–40 –40–45 –5032°FFreezing pointJanFebMarAprMayJunJulAugSepOctNovDecMonthsin.1514131211109876543210Polar grassl<strong>and</strong> (arctic tundra)(Fort Yukon, Alaska)mm3753503253002752502252001751501251007550250Mean monthly precipitationFigure 6-22 Climate graphs showing typical variations in annual temperature (the graphed line) <strong>and</strong> precipitation(the shaded area on the graph) in tropical, temperate, <strong>and</strong> polar (arctic tundra) grassl<strong>and</strong>s.http://biology.brookscole.com/miller14115
Beisa oryxCape buffaloWildebeestTopiWarthogDry Grassl<strong>and</strong>Thompson'sgazelleWaterbuckMoist Grassl<strong>and</strong>Grant's zebraGiraffeAfrican elephantGerenukBlack rhinoDik-dikDry Thorn ScrubEast Africanel<strong>and</strong>Blue duiker Greater kudu BushbuckRiverine ForestFigure 6-23 Natural capital: some of the grazing animals found in different parts of the African savanna.These species share vegetation resources by occupying different feeding niches.Many large savanna animal species are killed fortheir economically valuable coats <strong>and</strong> parts (tigers),tusks (rhinoceroses), <strong>and</strong> ivory tusks (elephants).Humans have attempted to raise cattle in somesavanna areas. Often these herds have helped convertsavannas to deserts. One reason is that cattle require alot more water than native herbivores (Figure 6-23)that are better adapted to the savanna climate. To getenough water the cattle must move back <strong>and</strong> forth betweenwater holes. This frequent movement reduces116 CHAPTER 6 Climate <strong>and</strong> Terrestrial Biodiversity
their meat yield, tramples vegetation, <strong>and</strong> compactslarge areas of soil.Another problem is that cattle have moist droppings.As the droppings dry, they heat up in the sun,kill the grass underneath, <strong>and</strong> form patches of a nearlyimpenetrable soil covering (sometimes called fecal pavement).In contrast, native herbivores, such as antelope,produce dry fecal pellets that are readily decomposedwith the nutrients returned to the soil. This illustrates abasic ecological rule: Do not try to raise a plant or animalin an environment to which it is not adapted.What Are Temperate Grassl<strong>and</strong>s? GoodWeather <strong>and</strong> Soils for Crops <strong>and</strong> LivestockTemperate grassl<strong>and</strong>s with cold winters <strong>and</strong> hot<strong>and</strong> dry summers have deep <strong>and</strong> fertile soils thatmake them widely used for growing crops <strong>and</strong>grazing cattle.Golden eaglePronghorn antelopeTemperate grassl<strong>and</strong>s cover vast expanses of plains <strong>and</strong>gently rolling hills in the interiors of North <strong>and</strong> SouthAmerica, Europe, <strong>and</strong> Asia (Figure 6-16). In these grassl<strong>and</strong>s,winters are bitterly cold, summers are hot <strong>and</strong>dry, <strong>and</strong> annual precipitation is fairly sparse <strong>and</strong> fallsunevenly through the year (Figure 6-22, center).Because the aboveground parts of most of thegrasses die <strong>and</strong> decompose each year, organic matteraccumulates to produce a deep, fertile soil (Figure 4-27,top right, p. 75). This soil is held in place by a thick networkof intertwined roots of drought-tolerant grassesunless the topsoil is plowed up <strong>and</strong> allowed to blowaway by prolonged exposure to high winds found inthese biomes. The natural grasses are also adapted tofires ignited by lightning or set deliberately. The firesburn the plant above the ground but do not harm theroots, from which new life can spring.Types of temperate grassl<strong>and</strong>s in North Americaare the tall-grass prairies (Figure 6-24) <strong>and</strong> short-grassprairies of the midwestern <strong>and</strong>western United States <strong>and</strong> Canada.Trace the nutrient <strong>and</strong> energyflows <strong>and</strong> transfers in Figure 6-24.Here winds blow almost continuously,<strong>and</strong> evaporation is rapid, oftenleading to fires in the summer<strong>and</strong> fall.CoyoteGrasshoppersparrowGrasshopperBlue stemgrassPrairiedogProducerto primaryconsumerPrimaryto secondaryconsumerFungiBacteriaSecondary tohigher-levelconsumerPrairieconeflowerAll producers <strong>and</strong>consumers todecomposersFigure 6-24 Natural capital: somecomponents <strong>and</strong> interactions in a temperatetall-grass prairie ecosystem inNorth America. When these organismsdie, decomposers break down theirorganic matter into minerals that plantsuse. Colored arrows indicate transfers ofmatter <strong>and</strong> energy between producers,primary consumers (herbivores), secondary,or higher-level, consumers (carnivores),<strong>and</strong> decomposers. Organismsare not drawn to scale.http://biology.brookscole.com/miller14117
Figure 6-25 Natural capitaldegradation: replacement of atemperate grassl<strong>and</strong> with amonoculture crop in California.When the tangled root network ofnatural grasses is removed, the fertiletopsoil is subject to severe winderosion unless it is covered withsome type of vegetation.National Archives/EPA DocumericaMany of the world’s natural temperate grassl<strong>and</strong>shave disappeared because they are great placesto grow crops (Figure 6-25) <strong>and</strong> graze cattle. They areoften flat, easy to plow, <strong>and</strong> have fertile, deep soils.However, plowing breaks up the soil <strong>and</strong> leaves itvulnerable to erosion by wind <strong>and</strong> water, <strong>and</strong> overgrazingcan transform grassl<strong>and</strong>s to semidesert ordesert.With the elimination of the bison (p. 20) <strong>and</strong> withplows that could break the dense turf, North America’slong-grass prairies have become breadbaskets thatproduce huge quantities of grain. Only tiny protectedremnants of the original prairies remain.On the western short-grass prairie, cattle <strong>and</strong>sheep have replaced antelope <strong>and</strong> bison. Much of thesagebrush desert of the American West is the result ofovergrazing of short-grass prairie.What Are Polar Grassl<strong>and</strong>s? BitterlyCold PlainsPolar grassl<strong>and</strong>s are covered with ice <strong>and</strong> snowexcept during a brief summer.Polar grassl<strong>and</strong>s, or arctic tundra, occur just south of thearctic polar ice cap (Figure 6-16). During most of theyear these treeless plains are bitterly cold (Figure 6-22,right), swept by frigid winds, <strong>and</strong> covered with ice<strong>and</strong> snow. Winters are long <strong>and</strong> dark, <strong>and</strong> the scantprecipitation falls mostly as snow, making this a“freezing desert.”This biome is carpeted with a thick, spongy mat oflow-growing plants, primarily grasses, mosses, <strong>and</strong>dwarf woody shrubs, as shown in Figure 6-26. Tracethe energy flows <strong>and</strong> nutrient transfers in this diagram.Trees or tall plants cannot survive in the cold<strong>and</strong> windy tundra because they would lose too muchof their heat. Most of the annual growth of the tundra’splants occurs during the 6- to 8-week summer, whensunlight shines almost around the clock.One effect of the extreme cold is permafrost, aperennially frozen layer of the soil that forms not farbelow the surface when the water there freezes. Duringthe brief summer the permafrost layer keepsmelted snow <strong>and</strong> ice from soaking into the ground.Then the waterlogged tundra forms a large number ofshallow lakes, marshes, bogs, ponds, <strong>and</strong> other seasonalwetl<strong>and</strong>s. Hordes of mosquitoes, blackflies, <strong>and</strong>other insects thrive in these shallow surface pools.They feed large colonies of migratory birds (especiallywaterfowl) that return from the south to nest <strong>and</strong>breed in the bogs <strong>and</strong> ponds.The arctic tundra’s permanent animal residentsare mostly small herbivores such as lemmings, hares,voles, <strong>and</strong> ground squirrels that burrow undergroundto escape the cold. Predators such as the lynx, weasel,snowy owl, <strong>and</strong> arctic fox eat them. Animals in thisbiome survive the intense winter cold through adaptationssuch as thick coats of fur (arctic wolf, arctic fox,<strong>and</strong> musk oxen), feathers (snowy owl), <strong>and</strong> living underground(arctic lemming).Because of the cold, decomposition is slow. Withlow decomposer populations, the soil is poor in organicmatter <strong>and</strong> in nitrates, phosphates, <strong>and</strong> otherminerals. Human activities—mostly oil drilling sites,pipelines, mines, <strong>and</strong> military bases—leave scars thatpersist for centuries.Another type of tundra, called alpine tundra, occursabove the limit of tree growth but below the per-118 CHAPTER 6 Climate <strong>and</strong> Terrestrial Biodiversity
CaribouLong-tailed jaegerGrizzly bearFigure 6-26 Natural capital: somecomponents <strong>and</strong> interactions in anarctic tundra (polar grassl<strong>and</strong>)ecosystem. When these organismsdie, decomposers break down theirorganic matter into minerals thatplants use. Colored arrows indicatetransfers of matter <strong>and</strong> energy betweenproducers, primary consumers(herbivores), secondary, orhigher-level, consumers (carnivores),<strong>and</strong> decomposers. Organismsare not drawn to scale.MosquitoSnowy owlHorned larkArcticfoxWillow ptarmiganDwarfwillowLemmingMountaincranberryMoss campionProducerto primaryconsumerPrimaryto secondaryconsumerSecondary tohigher-levelconsumerAll producers <strong>and</strong>consumers todecomposersmanent snow line on high mountains (Figure 6-18,left). The vegetation is similar to that found in arctictundra, but it gets more sunlight than arctic vegetation<strong>and</strong> has no permafrost layer.Figure 6-27 (p. 120) lists major human impacts ongrassl<strong>and</strong>s. What are the direct <strong>and</strong> indirect effects ofyour lifestyle on grassl<strong>and</strong> biomes?What Is Chaparral? Great Place to Livebut Beware of Fires <strong>and</strong> MudslidesThis temperate shrubl<strong>and</strong> has a wonderful climatebut is subject to fires in the fall followed by flooding<strong>and</strong> mudslides.In many coastal regions that border on deserts, such assouthern California <strong>and</strong> the Mediterranean, we find abiome known as temperate shrubl<strong>and</strong> or chaparral.Closeness to the sea provides a slightly longer winterrainy season than nearby temperate deserts have, <strong>and</strong>fogs during the spring <strong>and</strong> fall reduce evaporation.Chaparral consists mostly of dense growths oflow-growing evergreen shrubs <strong>and</strong> occasional smalltrees with leathery leaves that reduce evaporation.During the long, hot <strong>and</strong> dry summers, chaparral vegetationbecomes very dry <strong>and</strong> highly flammable. In thefall, fires started by lightning or human activitiesspread with incredible swiftness.Research reveals that chaparral is adapted to <strong>and</strong>maintained by periodic fires. Many of the shrubs storefood reserves in their fire-resistant roots <strong>and</strong> haveseeds that sprout only after a hot fire. With the firstrain, annual grasses <strong>and</strong> wildflowers spring up <strong>and</strong>http://biology.brookscole.com/miller14119
Natural Capital DegradationGrassl<strong>and</strong>storrents of water pour off the unprotected burned hillsidesto flood lowl<strong>and</strong> areas. Bottom line. Chaparral hasagreat climate but is a risky place to live.Conversion of savanna <strong>and</strong>temperate grassl<strong>and</strong> to cropl<strong>and</strong>Release of CO 2 to atmospherefrom burning <strong>and</strong> conversion ofgrassl<strong>and</strong> to cropl<strong>and</strong>Overgrazing of tropical <strong>and</strong>temperate grassl<strong>and</strong>s bylivestockDamage to fragile arctic tundraby oil production, air <strong>and</strong> waterpollution, <strong>and</strong> off-road vehiclesFigure 6-27 Natural capital degradation: major human impactson the world’s grassl<strong>and</strong>s.use nutrients released by the fire. New shrubs growquickly <strong>and</strong> crowd out the grasses.People like living in this biome because of its favorableclimate. But those living in chaparral assumethe high risk of losing their homes <strong>and</strong> possibly theirlives to frequent fires <strong>and</strong> mudslides.Some people in southern California learned thislesson in the fall of 2003 when fires raging throughchaparral areas destroyed several thous<strong>and</strong> homes <strong>and</strong>killed 20 people. After fires often comes the hazard offlooding <strong>and</strong> mudslides; when heavy rains come, great6-6 FOREST BIOMESWhat Are the Major Types of Forests? Hot,Mild, <strong>and</strong> ColdForests have enough precipitation to supportst<strong>and</strong>s of trees <strong>and</strong> are found in tropical, temperate,<strong>and</strong> polar regions.Undisturbed areas with moderate to high average annualprecipitation tend to be covered with forest,which contains various species of trees <strong>and</strong> smallerforms of vegetation. The three main types of forest—tropical, temperate, <strong>and</strong> boreal (polar)—result fromcombinations of this precipitation level <strong>and</strong> variousaverage temperatures (Figures 6-16 <strong>and</strong> 6-28). Take aclose look at the graphs in Figure 6-28.What Are Tropical Rain Forests? Centersof BiodiversityThese forests have heavy rainfall on most days <strong>and</strong>have a diversity of life forms occupying a varietyof specialized niches in distinct layers.Tropical rain forests are found near the equator, wherehot, moisture-laden air rises <strong>and</strong> dumps its moisture(Figure 6-10). Trace the nutrient flows <strong>and</strong> energytransfers in Figure 6-29. These forests have a warm annualmean temperature (which varies little either dailyor seasonally), high humidity, <strong>and</strong> heavy rainfall almostdaily (Figure 6-28, left).Mean monthly temperature°C °F in. mm100 1535375309014 35025 8013 32520 7012 30015 6011 27510 5010 2505 409 2250 308 200–5 32°F Freezing point207 175–10–15106 150–20 05 125–25 –104 100–30–35–40–45–20–30–40–5032107550250JanFebMarAprMayJunJulAugSepOctNovDecMonthsTropical rain forest(Manaus, Brazil)Mean monthly precipitationMean monthly temperature°C °F in. mm100 1535375309014 35025 8013 32520 7012 30015 6011 27510 5010 2505 409 2250 308 200–5 32°F Freezing point207 175–10–15106 150–20 05 125–25 –104 100–30–35–40–45–20–30–40–5032107550250JanFebMarAprMayJunJulAugSepOctNovDecMonthsTemperate deciduous forest(Nashville, Tennessee)Figure 6-28 Climate graphs showing typical variations in annual temperature (the graphed line) <strong>and</strong> precipitation(the shaded area on the graph) in tropical, temperate, <strong>and</strong> polar forests.Mean monthly precipitationMean monthly temperature°C °F in. mm100 153537530 9014 35025 8013 32520 7012 30015 6011 27510 5010 2505 409 2250 308 200–532°F207 175–10Freezing point–15106 150–20 05 125–25 –104 100–30 –203 75–35–40–45–30–40–5021050250JanFebMarAprMayJunJulAugSepOctNovDecMonthsPolar evergreen coniferous forest(boreal forest, taiga)(Moscow, Russia)Mean monthly precipitation120 CHAPTER 6 Climate <strong>and</strong> Terrestrial Biodiversity
Blue <strong>and</strong>gold macawHarpyeagleSquirrelmonkeysOcelotFigure 6-29 Natural capital: somecomponents <strong>and</strong> interactions in atropical rain forest ecosystem. Whenthese organisms die, decomposersbreak down their organic matter intominerals that plants use. Colored arrowsindicate transfers of matter <strong>and</strong>energy between producers, primaryconsumers (herbivores), secondary,or higher-level, consumers (carnivores),<strong>and</strong> decomposers. Organismsare not drawn to scale.Climbingmonstera palmSlaty-tailedtrogonKatydidGreen tree snakeTree frogAntsBacteriaBromeliadFungiProducerto primaryconsumerPrimaryto secondaryconsumerSecondary tohigher-levelconsumerAll producers <strong>and</strong>consumers todecomposersTropical rain forests are dominated by broadleafevergreen plants, which keep most of their broadleaves year-round. Typically, this biome’s huge treeshave shallow roots <strong>and</strong> wide bases that support theirmassive weight. The tops of the trees form a densecanopy which blocks most light from reaching the forestfloor. Many of the plants that live at the groundlevel have enormous leaves to capture what little sunlightfilters through to the dimly lit forest floor.Individual trees may be draped with vines thatreach to their tops to gain access to sunlight. <strong>Their</strong>trunks <strong>and</strong> branches may contain large numbers of epiphytes(or air plants), such as some types orchids <strong>and</strong>other plants. These plants grow without soil, get waterfrom the humid air <strong>and</strong> rain, <strong>and</strong> receive nutrientsfalling from the trees’ upper leaves <strong>and</strong> limbs.Tropical rain forests are teeming with life <strong>and</strong>have incredible biological diversity. These diverse lifeforms occupy a variety of specialized niches in distinctlayers, based in the plants’ case mostly on their needfor sunlight, as shown in Figure 6-30 (p. 122). Much ofthe animal life, particularly insects, bats, <strong>and</strong> birds,lives in the sunny canopy layer, with its abundant shelter<strong>and</strong> supplies of leaves, flowers, <strong>and</strong> fruits. To studylife in the canopy, ecologists climb trees, use tall constructioncranes, <strong>and</strong> build platforms <strong>and</strong> boardwalksin the upper canopy.Stratification of specialized plant <strong>and</strong> animal nichesin the layers of a tropical rain forest enables coexistenceof a great variety of species. Although these forestscover only about 2% of the earth’s l<strong>and</strong> surface, they arehabitats for at least half of the earth’s terrestrial species.http://biology.brookscole.com/miller14121
4540HarpyeagleEmergentlayer35Tocotoucan30CanopyHeight (meters)252015WoolyopossumUnderstory105BraziliantapirShrublayer0Black-crownedantpittaGroundlayerFigure 6-30 Natural capital: stratification of specialized plant <strong>and</strong> animal niches in various layers of a tropicalrain forest. The presence of these specialized niches enables species to avoid or minimize competition for resources<strong>and</strong> results in the coexistence of a great variety of species.Dropped leaves, fallen trees, <strong>and</strong> dead animals decomposequickly because of the warm, moist conditions<strong>and</strong> hordes of bacteria, fungi, insects, <strong>and</strong> otherdetritivores. This rapid recycling of scarce soil nutrientsis why little litter is found on the ground. Instead of beingstored in the soil, most nutrients released by decompositionare taken up quickly <strong>and</strong> stored by trees,vines, <strong>and</strong> other plants. This explains why tropical rainforest soils have so few plant nutrients (Figure 4-27,bottom left, p. 75). Because of their poor soils, these arenot good places to clear <strong>and</strong> grow crops or graze cattle.What Are Temperate Deciduous Forests?Seasonal Changes <strong>and</strong> Beautiful ColorsMost of the trees in these forests survive winter bydropping their leaves, which decay <strong>and</strong> producea nutrient-rich soil.Temperate deciduous forests grow in areas with moderateaverage temperatures that change significantly withthe season. Trace the nutrient transfers <strong>and</strong> energyflows in Figure 6-31 (p. 123). These areas have long,warm summers, cold but not too severe winters, <strong>and</strong>abundant precipitation, often spread fairly evenlythroughout the year (Figure 6-28, center).This biome is dominated by a few species ofbroadleaf deciduous trees such as oak, hickory, maple,poplar, <strong>and</strong> beech. They survive cold winters by droppingtheir leaves in the fall <strong>and</strong> becoming dormant.Each spring they grow new leaves that change in thefall into an array of reds <strong>and</strong> golds before dropping.Temperate deciduous forests have fewer treespecies than tropical rain forests. But the penetrationof more sunlight supports a richer diversity of plantlife at ground level. Because of the fairly low rate ofdecomposition, these forests accumulate a thick layer122 CHAPTER 6 Climate <strong>and</strong> Terrestrial Biodiversity
Broad-wingedhawkGraysquirrelHairywoodpeckerFigure 6-31 Natural capital:some components <strong>and</strong> interactionsin a temperate deciduousforest ecosystem. When theseorganisms die, decomposersbreak down their organic matterinto minerals that plants use.Colored arrows indicate transfersof matter <strong>and</strong> energy betweenproducers, primary consumers(herbivores), secondary,or higher-level, consumers (carnivores),<strong>and</strong> decomposers. Organismsare not drawn to scale.White oakWhite-taileddeerMetallicwood-boringbeetle <strong>and</strong>larvaeWhite-footedmouseShagbark hickoryMountainwinterberryFungiLong-tailedweaselMay beetleRacerBacteriaWood frogProducerto primaryconsumerPrimaryto secondaryconsumerSecondary tohigher-levelconsumerAll producers <strong>and</strong>consumers todecomposersof slowly decaying leaf litter that is a storehouse of nutrients(Figure 4-27, bottom middle, p. 75).The temperate deciduous forests of the easternUnited States were once home for such large predatorsas bears, wolves, foxes, wildcats, <strong>and</strong> mountain lions(pumas). Today most of the predators have been killedor displaced, <strong>and</strong> the dominant mammal species oftenis the white-tailed deer, along with smaller mammalssuch as squirrels, rabbits, opossums, raccoons, <strong>and</strong>mice. Some of these diverse forests have been cleared<strong>and</strong> replaced with tree plantations consisting of onlyone tree species (see photo on p. vi).Warblers, robins, <strong>and</strong> other bird species migrate tothese forests during the summer to feed <strong>and</strong> breed.Many of these species are declining in numbers becauseof loss or fragmentation of their summer <strong>and</strong>winter habitats.What Are Evergreen Coniferous Forests?Green <strong>and</strong> ColdThese forests in cold climates consist mostly ofcone-bearing evergreen trees that keep their needlesyear-round to help the trees survive long <strong>and</strong> coldwinters.Evergreen coniferous forests, also called boreal forests <strong>and</strong>taigas (“TIE-guhs”), are found just south of the arctictundra in northern regions across North America,Asia, <strong>and</strong> Europe (Figure 6-16). In this subarcticclimate, winters are long, dry, <strong>and</strong> extremely cold,http://biology.brookscole.com/miller14123
with sunlight available only 6–8 hours a day in thenorthernmost taiga. Summers are short, with mild towarm temperatures (Figure 6-28, right), <strong>and</strong> the suntypically shines 19 hours a day.Most boreal forests are dominated by a few speciesof coniferous (cone-bearing) evergreen trees such asspruce, fir, cedar, hemlock, <strong>and</strong> pine that keep some oftheir narrow-pointed leaves (needles) all year long.This adaptation also allows the trees to take advantageof the brief summers without having to take time togrow new needles. Plant diversity is low because fewspecies can survive the winters when soil moisture isfrozen.Beneath the st<strong>and</strong>s of trees is a deep layer of partiallydecomposed conifer needles <strong>and</strong> leaf litter. Decompositionis slow because of the low temperatures,waxy coating of conifer needles, <strong>and</strong> high soil acidity.As the conifer needles decompose, they make the thin,nutrient-poor soil acidic <strong>and</strong> prevent most other plants(except certain shrubs) from growing on the forestfloor (Figure 4-27, bottom right, p. 75).These biomes contain a variety of wildlife, as depictedin Figure 6-32. Trace the flow of energy <strong>and</strong> nutrientsin this diagram. During the brief summer thesoil becomes waterlogged, forming acidic bogs, ormuskegs, in low-lying areas of these forests. WarblersBlue jayGreathornedowlBalsam firMartenMooseWhitespruceWolfBebbwillowPine sawyerbeetle<strong>and</strong> larvaeFigure 6-32 Natural capital:some components <strong>and</strong> interactionsin an evergreen coniferous(boreal or taiga) forest ecosystem.When these organisms die,decomposers break down theirorganic matter into minerals thatplants use. Colored arrows indicatetransfers of matter <strong>and</strong> energybetween producers, primaryconsumers (herbivores),secondary, or higher-level, consumers(carnivores), <strong>and</strong> decomposers.Organisms are notdrawn to scale.StarflowerProducerto primaryconsumerSnowshoeharePrimaryto secondaryconsumerBacteriaFungiSecondary tohigher-levelconsumerBunchberryAll producers <strong>and</strong>consumers todecomposers124 CHAPTER 6 Climate <strong>and</strong> Terrestrial Biodiversity
<strong>and</strong> other insect-eating birds feed on hordes of flies,mosquitoes, <strong>and</strong> caterpillars.What Are Temperate Rain Forests? DrippingGreen Giants <strong>and</strong> MossesCoastal areas support huge cone-bearing evergreentrees such as redwoods <strong>and</strong> Douglas fir in a cool <strong>and</strong>moist environment.Coastal coniferous forests or temperate rain forests arefound in scattered coastal temperate areas with amplerainfall or moisture from dense ocean fogs. Densest<strong>and</strong>s of large conifers such as Sitka spruce, Douglasfir, <strong>and</strong> redwoods dominate undisturbed areas of thesebiomes along the coast of North America, from Canadato northern California.Most of the trees are evergreen because the abundanceof water means that they have no need to shedtheir leaves. Tree trunks <strong>and</strong> the ground are frequentlycovered with mosses <strong>and</strong> ferns in this cool <strong>and</strong> moistenvironment. As in tropical rain forests, little lightreaches the forest floor.The ocean moderates the temperature so wintersare mild <strong>and</strong> summers are cool. The trees in thesemoist forests depend on frequent rains <strong>and</strong> moisturefrom summer fog that rolls in off the Pacific.Figure 6-33 lists major human impacts on theworld’s forests. What direct <strong>and</strong> indirect impacts doesyour lifestyle have on forest biomes?Natural Capital DegradationForestsClearing <strong>and</strong> degradation of tropicalforests for agriculture, livestockgrazing, <strong>and</strong> timber harvestingClearing of temperate deciduousforests in Europe, Asia, <strong>and</strong> NorthAmerica for timber, agriculture, <strong>and</strong>urban developmentClearing of evergreen coniferousforests in North America, Finl<strong>and</strong>,Sweden, Canada, Siberia, <strong>and</strong> RussiaConversion of diverse forests to lessbiodiverse tree plantationsDamage to soils from off-road vehiclesFigure 6-33 Natural capital degradation: major humanimpacts on the world’s forests.6-7 MOUNTAIN BIOMESWhy Are Mountains Ecologically Important?High-Altitude Biodiversity SanctuariesMountains are high-elevation forested isl<strong>and</strong>s of biodiversity<strong>and</strong> often have snow-covered peaks that reflectsolar radiation <strong>and</strong> gradually release water tolower-elevation streams <strong>and</strong> ecosystems.Some of the world’s most spectacular <strong>and</strong> importantenvironments are mountains, which make up almost afourth of the world’s l<strong>and</strong> surface. Mountains areplaces where dramatic changes in altitude, climate,soil, <strong>and</strong> vegetation take place over a very short distance(Figure 6-18, left).Because of the steep slopes, mountain soils are especiallyprone to erosion when the vegetation holdingthem in place is removed by natural disturbances(such as l<strong>and</strong>slides <strong>and</strong> avalanches) or human activities(such as timber cutting <strong>and</strong> agriculture). Manyfreest<strong>and</strong>ing mountains are isl<strong>and</strong>s of biodiversity surroundedby a sea of lower-elevation l<strong>and</strong>scapes transformedby human activities.Mountains play important ecological roles. Theycontain the majority of the world’s forests, which arehabitats for much of the world’s terrestrial biodiversity.They often are habitats for endemic species foundnowhere else on earth, <strong>and</strong> they serve as sanctuariesfor animal species driven from lowl<strong>and</strong> areas.They also help regulate the earth’s climate whentheir snow- <strong>and</strong> ice-covered tops reflect solar radiationback into space. Mountains affect sea levels as a resultof decreases or increases in glacial ice—most of whichis locked up in Antarctica (the most mountainous of allcontinents). Finally, mountains play a critical role inthe hydrologic cycle by gradually releasing meltingice, snow, <strong>and</strong> water stored in the soils <strong>and</strong> vegetationof mountainsides to small streams.Despite their ecological, economic, <strong>and</strong> culturalimportance, the fate of mountain ecosystems has notbeen a high priority of governments or many environmentalorganizations. Mountain ecosystems arecoming under increasing pressure from several humanactivities (Figure 6-34, p. 126). What direct or indirectimpacts does your lifestyle have on mountainbiomes?In this chapter we examined the connectionsamong weather, climate, <strong>and</strong> the distribution of theearth’s terrestrial biomes. Three general ecologicallessons emerge from this study. First, different climatesoccur as a result of currents of air <strong>and</strong> water flowingover an unevenly heated planet spinning on a tiltedaxis. Second, different climates result in different communitiesof organisms, or biomes. Third, everything isconnected.http://biology.brookscole.com/miller14125
Natural Capital DegradationWhen we try to pick out anything by itself, we find it hitchedto everything else in the universe.JOHN MUIRMountainsL<strong>and</strong>less poor migrating uphill tosurviveTimber extractionMineral resource extractionHydroelectric dams <strong>and</strong>reservoirsIncreasing tourism (such ashiking <strong>and</strong> skiing)Air pollution from industrial <strong>and</strong>urban centersIncreased ultraviolet radiationfrom ozone depletionSoil damage from off-roadvehiclesFigure 6-34 Natural capital degradation: major human impactson the world’s mountains.CRITICAL THINKING1. List a limiting factor for each of the following ecosystems:(a) a desert, (b) arctic tundra, (c) alpine tundra,(d) the floor of a tropical rain forest, <strong>and</strong> (e) a temperatedeciduous forest.2. Why do deserts <strong>and</strong> arctic tundra support a muchsmaller biomass of animals than do tropical forests?3. Some biologists have suggested restoring large herdsof bison on public l<strong>and</strong>s in the North American plains asa way of restoring remaining tracts of tall-grass prairie.Ranchers with permits to graze cattle <strong>and</strong> sheep onfederally managed l<strong>and</strong>s have strongly opposed thisidea. Do you agree or disagree with the idea of restoringlarge numbers of bison to the plains of North America?Explain.4. Why do most animals in a tropical rain forest live inits trees?5. What biomes are best suited for (a) raising crops <strong>and</strong>(b) grazing livestock?6. Congratulations! You are in charge of the world. Whatare the three most important features of your plan to helpsustain the earth’s terrestrial biodiversity?PROJECTS1. How has the climate changed in the area where youlive during the past 50 years? Investigate the beneficial<strong>and</strong> harmful effects of these changes. How have thesechanges benefited or harmed you personally?2. What type of biome do you live in? What have beenthe major effects of human activities over the past50 years on the characteristic vegetation <strong>and</strong> animal lifenormally found in the biome you live in? How is yourlifestyle affecting this biome?3. Use the library or the Internet to find bibliographic informationabout Robert H. MacArthur <strong>and</strong> John Muir,whose quotes appear at the beginning <strong>and</strong> end of thischapter.4. Make a concept map of this chapter’s major ideas, usingthe section heads, subheads, <strong>and</strong> key terms (in boldface).Look on the website for this book for informationabout making concept maps.LEARNING ONLINEThe website for this book contains study aids <strong>and</strong> manyideas for further reading <strong>and</strong> research. They include achapter summary, review questions for the entire chapter,flash cards for key terms <strong>and</strong> concepts, a multiple-choicepractice quiz, interesting Internet sites, references, <strong>and</strong> aguide for accessing thous<strong>and</strong>s of InfoTrac ® College Editionarticles. Log on tohttp://biology.brookscole.com/miller14Then click on the Chapter-by-Chapter area, choose Chapter6, <strong>and</strong> select a learning resource.126 CHAPTER 6 Climate <strong>and</strong> Terrestrial Biodiversity
7Aquatic BiodiversityBiodiversityWaterWasteTreatmentCASE STUDYWhy Should We Careabout Coral Reefs?In the shallow coastal zones of warm tropical <strong>and</strong> subtropicaloceans we often find coral reefs (Figure 7-1,left). These stunningly beautiful natural wonders areamong the world’s oldest, most diverse, <strong>and</strong> mostproductive ecosystems.Coral reefs are formed by massive coloniesof tiny animals called polyps. They slowly build reefsby secreting a protective crust of limestone (calciumcarbonate) around their soft bodies.When the polyps die, their empty crusts remainas a platform for more reef growth. The result is anelaborate network of crevices, ledges, <strong>and</strong> holes thatserve as calcium carbonate “condominiums” for avariety of marine animals.Coral reefs involve a mutually beneficial relationshipbetween the polyps <strong>and</strong> tiny single-celled algaecalled zooxanthellae (“zoh-ZAN-thel-ee”) that live inthe tissues of the polyps. The algae provide thepolyps with color, food, <strong>and</strong> oxygen through photosynthesis<strong>and</strong> help produce calcium carbonate, whichforms the coral skeleton. The polyps in turn providethe algae with a well-protected home <strong>and</strong> some oftheir nutrients. This is a win-win deal for bothspecies.Coral reefs provide a number of important ecological<strong>and</strong> economic services. When coral polypsform their limestone shells they remove carbon dioxidefrom the atmosphere as part of the carbon cycle.Coral reefs act as natural barriers that help protectabout 15% of the world’s coastlines from erosion bybattering waves <strong>and</strong> storms. They also support at leastone-fourth of all identified marine species <strong>and</strong> abouttwo-thirds of marine fish species <strong>and</strong> produce about atenth of the global fish catch.The reefs provide jobs <strong>and</strong> building materials(which can help destroy the reefs) for some of theworld’s poorest countries <strong>and</strong> support fishing<strong>and</strong> tourism industries worth billions of dollarseach year.Finally, these biological treasures give us an underwaterworld to study <strong>and</strong> enjoy. Coral reefs providethese free ecological <strong>and</strong> economic services whileoccupying less than 0.1% of the world’s ocean area—amounting to an area about half the size of France.They are true wonders of biodiversity!Bad news. More than one-fourth of the world’scoral reefs have been lost to coastal development, pollution,overfishing, warmer ocean temperatures, <strong>and</strong>other stresses. And these threats are increasing.One problem is coral bleaching (Figure 7-1, right). Itoccurs when a coral becomes stressed <strong>and</strong> expels mostof its colorful algae, leaving an underlying ghostlywhite skeleton of calcium carbonate. Two causes areincreased water temperature <strong>and</strong> runoff of silt thatcovers the coral <strong>and</strong> prevents photosynthesis. Unableto grow or repair themselves, the corals eventually dieunless the stress is removed <strong>and</strong> algae recolonize them.Aquatic scientists view coral reefs as “aquatic biodiversitysavings banks” <strong>and</strong> sensitive biological indicatorsof environmental conditions in their aquaticenvironment. The decline <strong>and</strong> degradation of these colorfuloceanic sentinels should serve as a warning aboutthe health of their habitats <strong>and</strong> the oceans that provideus with crucial ecological <strong>and</strong> economic services.Figure 7-1 A healthy coral reef covered by colorful algae (left)<strong>and</strong> a bleached coral reef that has lost most of its algae (right)because of changes in the environment (such as cloudy water ortoo warm temperatures). With the algae gone, the white limestoneof the coral skeleton becomes visible. If the environmental stressis not removed <strong>and</strong> no other alga species fill the ab<strong>and</strong>onedniche, the corals die. These diverse <strong>and</strong> productive ecosystemsare being damaged <strong>and</strong> destroyed at an alarming rate.
If there is magic on this planet, it is contained in water.LOREN EISLEYThis chapter addresses the following questions:■■■■What are the basic types of aquatic life zones, <strong>and</strong>what factors influence the kinds of life they contain?What are the major types of saltwater life zones,<strong>and</strong> how do human activities affect them?What are the major types of freshwater life zones,<strong>and</strong> how do human activities affect them?How can we help sustain aquatic life zones?7-1 AQUATIC ENVIRONMENTSWhat Are the Two Major Types of AquaticLife Zones? Salty <strong>and</strong> FreshSaltwater <strong>and</strong> freshwater aquatic life zones coveralmost three-fourths of the earth’s surface.The aquatic equivalents of biomes are called aquatic lifezones. The major types of organisms found in aquaticenvironments are determined by the water’s salinity—the amounts of various salts such as sodium chloride(NaCl) dissolved in a given volume of water. As a result,aquatic life zones are divided into two majortypes: saltwater or marine (such as estuaries, coastlines,coral reefs, coastal marshes, mangrove swamps, <strong>and</strong>oceans) <strong>and</strong> freshwater (such as lakes, ponds, streams,rivers, <strong>and</strong> inl<strong>and</strong> wetl<strong>and</strong>s). Figure 7-2 shows the distributionof the world’s major oceans, lakes, rivers,coral reefs, <strong>and</strong> mangroves.The world’s saltwater <strong>and</strong> freshwater aquatic systemscover about 71% of the earth’s surface. We canthink of the world’s rivers, streams, lakes, <strong>and</strong> oceansas a giant circulatory system transporting water fromone place to another as part of the earth’s water cycle(Figure 4-28, p. 76). These aquatic systems also play vitalroles in the earth’s biological productivity, climate,biogeochemical cycles, <strong>and</strong> biodiversity.What Kinds of Organisms Live in AquaticLife Zones? Floaters, Swimmers, Crawlers,<strong>and</strong> DecomposersAquatic systems contain floating, drifting, swimming,bottom-dwelling, <strong>and</strong> decomposer organisms.LakesRiversCoral reefsMangrovesFigure 7-2 Natural capital: distribution of the world’s major saltwater oceans, coral reefs, mangroves, <strong>and</strong>freshwater lakes <strong>and</strong> rivers.128 CHAPTER 7 Aquatic Biodiversity
Saltwater <strong>and</strong> freshwater life zones contain four majortypes of organisms. One group consists of weaklyswimming, free-floating plankton carried by currents.There are three major types of plankton. One is phytoplankton(“FIE-toe-plank-ton,” Greek for “driftingplants”), or plant plankton. They <strong>and</strong> many types of algaeare the producers that support most aquatic foodchains <strong>and</strong> food webs. Another type is zooplankton(“ZOE-oh-plank-ton”, Greek for “drifting animals”),or animal plankton. They consist of primary consumers(herbivores) that feed on phytoplankton <strong>and</strong> secondaryconsumers that feed on other zooplankton.They range from single-celled protozoa to large invertebratessuch as jellyfish.Improved technologies for filtering <strong>and</strong> analyzingwater have revealed huge populations of much smallerplankton called ultraplankton—photosynthetic bacteriano more than 2 micrometers (40 millionths of aninch) wide. Scientists estimate that these extremelysmall plankton may be responsible for 70% of the primaryproductivity near the ocean surface.A second group of organisms consists of nekton,strongly swimming consumers such as fish, turtles,<strong>and</strong> whales. A third group, called benthos, dwells onthe bottom. Examples are barnacles <strong>and</strong> oysters thatanchor themselves to one spot, worms that burrowinto the s<strong>and</strong> or mud, <strong>and</strong> lobsters <strong>and</strong> crabs that walkabout on the bottom. A fourth group consists of decomposers(mostly bacteria) that break down the organiccompounds in the dead bodies <strong>and</strong> wastes ofaquatic organisms into simple nutrient compounds foruse by producers.How Do Aquatic Systems Differ fromTerrestrial Systems? Living withoutBoundaries <strong>and</strong> Large TemperatureFluctuationsLiving in water has its benefits <strong>and</strong> drawbacks.Living in an aquatic environment has advantages <strong>and</strong>disadvantages (Figure 7-3). Several differences betweenaquatic <strong>and</strong> terrestrial systems also hinder theability of researchers to underst<strong>and</strong> aquatic systems.One is that aquatic systems have less pronounced <strong>and</strong>fixed physical boundaries than terrestrial ecosystems.This makes it difficult to count <strong>and</strong> manage populationsof aquatic organisms.Also, food chains <strong>and</strong> webs in aquatic systems areusually more complex <strong>and</strong> longer than those in terrestrialbiomes. One reason is that the fluid medium ofwater systems <strong>and</strong> the variety of bottom habitats openup ways of getting food that are not available on l<strong>and</strong>.Another difference is that aquatic systems (especiallymarine systems) are more difficult to monitor <strong>and</strong>study than terrestrial systems because of their size <strong>and</strong>because they are largely hidden from view.AdvantagesPhysical supportfrom waterbouyancyFairly constanttemperatureNourishmentfrom dissolvednutrientsWater availabilityEasydispersementof organisms,larvae, <strong>and</strong> eggsLess exposure toharmful UVradiationDilution <strong>and</strong>dispersion ofpollutantsTrade-OffsLiving in WaterDisadvantagesCannot tolerate awide temperaturerangeExposure todissolvedpollutantsFluctuatingpopulation size formany speciesDispersionseparates manyaquatic offspringfrom parentsFigure 7-3 Trade-offs: advantages <strong>and</strong> disadvantages of livingin water.What Factors Limit Life at Different Depths inAquatic Life Zones? Living in Layered ZonesLife in aquatic systems is found in surface, middle,<strong>and</strong> bottom layers.Most aquatic life zones can be divided into three layers:surface, middle, <strong>and</strong> bottom. A number of environmentalfactors determine the types <strong>and</strong> numbers oforganisms found in these layers. Examples are temperature,access to sunlight for photosynthesis, dissolved oxygencontent, <strong>and</strong> availability of nutrients such as carbon(as dissolved CO 2 gas), nitrogen (as NO 3 ), <strong>and</strong> phosphorus(mostly as PO 4 ) for producers.3In deep aquatic systems, photosynthesis is confinedmostly to the upper layer, or euphotic zone,through which sunlight can penetrate. The depth ofthe euphotic zone in oceans <strong>and</strong> deep lakes can be reducedby excessive algal growth (algal blooms) cloudingthe water.Dissolved O 2 levels are higher near the surface becauseoxygen-producing photosynthesis takes placehttp://biology.brookscole.com/miller14129
there. Photosynthesis cannot take place below the sunlitlayer. Thus at lower depths O 2 levels fall because of aerobicrespiration by aquatic animals <strong>and</strong> decomposers.They also fall because less oxygen gas dissolves in thedeeper <strong>and</strong> colder water than in warmer surface water.In contrast, levels of dissolved CO 2 are low insurface layers because producers use CO 2 duringphotosynthesis <strong>and</strong> are high in deeper, dark layerswhere aquatic animals <strong>and</strong> decomposers produce CO 2through aerobic respiration.In shallow waters in streams, ponds, <strong>and</strong> oceans,ample supplies of nutrients for primary producers areusually available. By contrast, in the open ocean, nitrates,phosphates, iron, <strong>and</strong> other nutrients often are inshort supply <strong>and</strong> limit net primary productivity (NPP)(Figure 4-24, p. 72). However, NPP is much higher inparts of the open ocean where upwellings bring suchnutrients from the ocean bottom to the surface for useby producers.Most creatures living on the bottom of the deepocean <strong>and</strong> deep lakes depend on animal <strong>and</strong> plantplankton that die <strong>and</strong> fall into deep waters. Becausethis food is limited, deep-dwelling fish species tend toreproduce slowly. This makes them especially vulnerableto depletion from overfishing.Ocean hemisphereL<strong>and</strong>–ocean hemisphereFigure 7-4 Natural capital: the ocean planet. The saltyoceans cover about 71% of the earth’s surface. About 97% ofthe earth’s water is in the interconnected oceans, which cover90% of the planet’s mostly ocean hemisphere (left) <strong>and</strong> 50% ofits l<strong>and</strong>–ocean hemisphere (right). Freshwater systems coverless than 1% of the earth’s surface.Oceans have two major life zones: the coastal zone <strong>and</strong>the open sea (Figure 7-6). The coastal zone is thewarm, nutrient-rich, shallow water that extends fromthe high-tide mark on l<strong>and</strong> to the gently sloping, shal-Natural CapitalMarine Ecosystems7-2 SALTWATER LIFE ZONESEcologicalServicesEconomicServicesWhy Should We Care about the Oceans?Givers of LifeAlthough oceans occupy most of the earth’s surface<strong>and</strong> provide many ecological <strong>and</strong> economic services,we know less about them than we do about the moon.A more accurate name for Earth would be Ocean becausesaltwater oceans cover about 71% of the planet’ssurface (Figure 7-4). They contain about 250,000known species of marine plants <strong>and</strong> animals <strong>and</strong> providemany important ecological <strong>and</strong> economic services,shown in Figure 7-5. Take a good look at thisfigure that describes part of your life-support system.As l<strong>and</strong>lubbers we have a distorted <strong>and</strong> limitedview of our watery home. We know more about thesurface of the moon than about the oceans that covermost of the earth. According to aquatic scientists, thescientific investigation of poorly understood marine<strong>and</strong> freshwater aquatic systems is a research frontierwhose study could result in immense ecological <strong>and</strong>economic benefits.What Is the Coastal Zone? Abundant Lifenear the ShoreThe coastal zone makes up less than 10% of the world’socean area but contains 90% of all marine species.ClimatemoderationCO 2 absorptionNutrient cyclingWaste treatment<strong>and</strong> dilutionReduced stormimpact(mangrove,barrier isl<strong>and</strong>s,coastalwetl<strong>and</strong>s)Habitats <strong>and</strong>nursery areas formarine <strong>and</strong>terrestrialspeciesGeneticresources <strong>and</strong>biodiversityScientificinformationFoodAnimal <strong>and</strong> petfeed (fish meal)PharmaceuticalsHarbors <strong>and</strong>transportationroutesCoastal habitatsfor humansRecreationEmploymentOffshore oil <strong>and</strong>natural gasMineralsBuilding materialsFigure 7-5 Natural capital: major ecological <strong>and</strong> economicservices provided by marine systems.130 CHAPTER 7 Aquatic Biodiversity
High tideLow tideCoastal ZoneOpen SeaSea levelSunDepth inmeters0EstuarineZoneEuphotic Zone50100PhotosynthesisContinentalshelf200Bathyal Zone5001,000Twilight1,500AbyssalZone2,0003,0004,000Darkness5,00010,000Figure 7-6 Natural capital: major life zones in an ocean (not drawn to scale). Actual depths of zones may vary.low edge of the continental shelf (the submerged partof the continents). This zone has numerous interactionswith the l<strong>and</strong> <strong>and</strong> thus human activities easilyaffect it.Although it makes up less than a tenth of theworld’s ocean area, the coastal zone contains 90% of allmarine species <strong>and</strong> is the site of most large commercialmarine fisheries. Most ecosystems found in the coastalzone have a high net primary productivity per unit ofarea. This occurs because of the zone’s ample suppliesof sunlight <strong>and</strong> plant nutrients flowing from l<strong>and</strong> <strong>and</strong>distributed by wind <strong>and</strong> ocean currents.What Are Estuaries, Coastal Wetl<strong>and</strong>s,<strong>and</strong> Mangrove Swamps? Stressed Centersof Biological ProductivitySeveral highly productive coastal ecosystems areunder increasing stress from human activities.One highly productive area in the coastal zone is anestuary, a partially enclosed area of coastal waterwhere seawater mixes with freshwater <strong>and</strong> nutrientsfrom rivers, streams, <strong>and</strong> runoff from l<strong>and</strong> (Figure 7-7,p. 132).Estuaries <strong>and</strong> their associated coastal wetl<strong>and</strong>s(l<strong>and</strong> areas covered with water all or part of the year) includeriver mouths, inlets, bays, sounds, mangrove forestswamps in sheltered regions along tropical coasts,<strong>and</strong> salt marshes (Figure 7-8, p. 132) in temperate zones.Temperature <strong>and</strong> salinity levels vary widely in estuaries<strong>and</strong> coastal wetl<strong>and</strong>s because of the dailyrhythms of the tides <strong>and</strong> seasonal variations in theflow of freshwater into the estuary. They are also affectedby unpredictable flows of freshwater fromcoastal l<strong>and</strong> <strong>and</strong> rivers after heavy rains <strong>and</strong> of saltwater from the ocean as a result of storms, hurricanes,<strong>and</strong> typhoons. You have to be tough to survive in thisharsh <strong>and</strong> variable environment.http://biology.brookscole.com/miller14131
Figure 7-7 View of an estuary taken fromspace. The photo shows the sediment plumeat the mouth of Madagascar’s Betsiboka Riveras it flows through the estuary <strong>and</strong> into theMozambique Channel. Because of its topography,heavy rainfall, <strong>and</strong> the clearing of forestsfor agriculture, Madagascar is the world’s mosteroded country.NASAHerring gullsPeregrine falconSnowyegretCordgrassShort-billeddowitcherPhytoplanktonMarshperiwinkleSmeltFigure 7-8 Natural capital: somecomponents <strong>and</strong> interactions in a saltmarsh ecosystem in a temperate areasuch as the United States. When theseorganisms die, decomposers breakdown their organic matter into mineralsused by plants. Colored arrows indicatetransfers of matter <strong>and</strong> energy betweenconsumers (herbivores), secondary (orhigher-level) consumers (carnivores),<strong>and</strong> decomposers. Organisms are notdrawn to scale.Soft-shelledclamProducer toprimaryconsumerPrimary tosecondaryconsumerZooplankton <strong>and</strong>small crustaceansBacteriaSecondary tohigher-levelconsumerClamwormAll consumers<strong>and</strong> producersto decomposers132 CHAPTER 7 Aquatic Biodiversity
The dominant organisms in mangrove forestswamps are trees that can grow in salt water. Thesetrees have extensive roots that extend above the water,where they can obtain oxygen <strong>and</strong> provide support forthe plant. These nutrient-rich forests are found in shelteredregions along tropical coasts (Figure 7-2).Because ocean waves do not reach these saltwaterecosystems, they collect mud <strong>and</strong> anaerobic sediment.The constant water movement in estuaries <strong>and</strong>their associated coastal wetl<strong>and</strong>s stirs up the nutrientrichsilt, making it available to producers. Thesesystems filter toxic pollutants, excess plant nutrients,sediments, <strong>and</strong> other pollutants. They reduce stormdamage by absorbing waves <strong>and</strong> storing excess waterproduced by storms. And they provide food, habitats,<strong>and</strong> nursery sites for a variety of aquatic species.Bad news. We are degrading or destroying some ofthe ecological services that these important ecosystemsprovide at no cost. Researchers estimate thatmore than a third of the world’s mangrove forestshave been destroyed—mostly for developing aquacultureshrimp farms, growing crops, <strong>and</strong> coastal developmentprojects.What Niches Do Rocky <strong>and</strong> S<strong>and</strong>y ShoresProvide? Hold On, Dig In, or Hang Outin a ShellOrganisms in coastal areas experiencing daily low <strong>and</strong>high tides have evolved a number of ways to surviveunder harsh <strong>and</strong> changing conditions.The area of shoreline between low <strong>and</strong> high tides iscalled the intertidal zone. This is not an easy place tolive. Its organisms must be able to avoid being sweptaway or crushed by waves, <strong>and</strong> avoid or cope with beingimmersed during high tides <strong>and</strong> left high <strong>and</strong> dry(<strong>and</strong> much hotter) at low tides. They must also survivechanging levels of salinity when heavy rains dilute saltwater. To deal with such stresses, most intertidal organismshold on to something, dig in, or hide in protectiveshells.Some coasts have steep rocky shores pounded bywaves. The numerous pools <strong>and</strong> other niches in the intertidalzone of rocky shores contain a great variety ofspecies with different niches as shown in the top partof Figure 7-9 (p. 134).Other coasts have gently sloping barrier beaches, ors<strong>and</strong>y shores, with niches for different marine organismsas shown in the bottom portion of Figure 7-9.Most of them are hidden from view <strong>and</strong> survive byburrowing, digging, <strong>and</strong> tunneling in the s<strong>and</strong>. Theses<strong>and</strong>y beaches <strong>and</strong> their adjoining coastal wetl<strong>and</strong>sare also home to a variety of shorebirds that feed inspecialized niches on crustaceans, insects, <strong>and</strong> otherorganisms (Figure 5-5, p. 92).What Are Barrier Isl<strong>and</strong>s? Natural Protectorsof the ShoreNarrow isl<strong>and</strong>s off some shores help protect coastalzones from storm waves, but developing these isl<strong>and</strong>sreduces this natural protection <strong>and</strong> makes them riskyplaces to live.Barrier isl<strong>and</strong>s are low, narrow, s<strong>and</strong>y isl<strong>and</strong>s that formoffshore from a coastline. Most run parallel to the shore.They are found along some coasts such as most of NorthAmerica’s Atlantic <strong>and</strong> Gulf coasts. These isl<strong>and</strong>s helpprotect the mainl<strong>and</strong>, estuaries, <strong>and</strong> coastal wetl<strong>and</strong>sfrom the onslaught of approaching storm waves.These beautiful but very limited pieces of real estateare prime targets for real estate development. Almostone-fourth of the area of barrier isl<strong>and</strong>s in theUnited States has been developed.Living on these isl<strong>and</strong>s can be risky. Sooner orlater, many of the structures humans build on lowlyingbarrier isl<strong>and</strong>s (Figure 7-10, p. 135), such asAtlantic City, New Jersey, <strong>and</strong> Miami Beach, Florida,are damaged or destroyed by flooding, severe beacherosion, or major storms (including hurricanes).<strong>Their</strong> low-lying beaches are constantly shifting,with gentle waves building them up <strong>and</strong> storms flattening<strong>and</strong> eroding them. Currents running parallel tothe beaches constantly take s<strong>and</strong> from one area <strong>and</strong>deposit it in another. Some beach communities spendlots of money to replace the eroded s<strong>and</strong>. But sooner orlater nature moves it somewhere else.Figure 7-11 (p. 135) shows that undisturbedbeaches on typical barrier isl<strong>and</strong>s have one or morerows of natural s<strong>and</strong> dunes with the s<strong>and</strong> held in placeby the roots of grasses. These dunes serve as the firstline of defense against the ravages of the sea at no cost.If we left it that way <strong>and</strong> built behind the second set ofdunes, these beaches would be safer places for people<strong>and</strong> many of the populations of natural organisms thatlive there. Mainl<strong>and</strong> coastal cities, beaches, <strong>and</strong> undisturbedsalt marshes <strong>and</strong> estuaries behind these protectiveisl<strong>and</strong>s would also be safer from damage.But this real estate is so scarce <strong>and</strong> valuable thatdevelopers want to cover it with buildings <strong>and</strong> roads.In doing this, they are rarely required to take into accountthe storm protection <strong>and</strong> other free ecologicalservices the protective dunes provide. Thus the firstthing most coastal developers do is to remove the protectivedunes or build behind the first set of dunes.This means that large storms can flood <strong>and</strong> even sweepaway seaside buildings <strong>and</strong> severely erode the s<strong>and</strong>ybeaches. Then we call these human-influenced eventsnatural disasters.Governments often provide owners with fairlycheap property insurance, funds for replenishingeroded s<strong>and</strong>, <strong>and</strong> grants <strong>and</strong> low-cost loans to rebuildafter damaging storms. This makes it less financiallyhttp://biology.brookscole.com/miller14133
Rocky Shore BeachSea starHermit crabShore crabHigh tidePeriwinkleSea urchinAnemoneMusselLow tideSculpinBarnaclesKelpSea lettuceNudibranchMonterey flatwormBeach fleaBarrier BeachPeanut wormTigerbeetleBlue crabDwarfoliveClamHigh tideSilversidesLow tideS<strong>and</strong>piperMoleshrimpGhostshrimpWhite s<strong>and</strong> macoma S<strong>and</strong> dollar Moon snailFigure 7-9 Living between the tides. Some organisms with specialized niches found in variouszones on rocky shore beaches (top) <strong>and</strong> barrier or s<strong>and</strong>y beaches (bottom). Organisms are notdrawn to scale.134 CHAPTER 7 Aquatic Biodiversity
G. H. Dermetrohas/T. C. CarmeraFigure 7-10 A developed barrier isl<strong>and</strong>: Ocean City, Maryl<strong>and</strong>,host to 8 million visitors a year. Rising sea levels from globalwarming may put this <strong>and</strong> many other barrier isl<strong>and</strong>s under waterby the end of this century.risky to live in such places <strong>and</strong> hastens the destructionof their protective dune <strong>and</strong> vegetation systems.Some argue that people who choose to live inthese <strong>and</strong> other risky places should accept the full costof such risks. They should not expect taxpayers to supplementtheir high property insurance costs or helpthem rebuild houses lost in hurricanes or other naturaldisasters that are expected risks in such areas.What Are Coral Reefs? Aquatic Oasesof BiodiversityCoral reefs are biologically diverse <strong>and</strong> productiveecosystems that are increasingly stressed by humanactivities.Coral reefs (Figure 7-1 <strong>and</strong> photo on p. viii) form inclear, warm coastal waters of the tropics <strong>and</strong> subtropics(Figure 7-2). Coral reefs are ecologically complex interms of the many interactions among the diverseorganisms that live there as shown in Figure 7-12(p. 136).These reefs are vulnerable to damage because theygrow slowly <strong>and</strong> are disrupted easily. They also thriveonly in clear, warm, <strong>and</strong> fairly shallow water of constanthigh salinity. Corals can live only in water with atemperature of 18–30°C (64–86°F). Coral bleaching(Figure 7-1, right) can be triggered by an increase ofjust 1°C (1.8°F) above this maximum temperature.The biodiversity of coral reefs can be reduced bynatural disturbances such as severe storms, freshwaterfloods, <strong>and</strong> invasions of predatory fish. Butthroughout their long geologic history, coral reefshave been able to adapt to such natural environmentalchanges.Today the biggest threats to the survival <strong>and</strong> biodiversityof many of the world’s coral reefs comefrom sediment runoff <strong>and</strong> other human activities (Figure7-13, p. 137). Scientists are concerned that thesethreats are occurring so rapidly (over decades) <strong>and</strong>over such a wide area that many of the world’s coralreef systems may not have enough time to adapt.Good news. There is growing evidence that coralreefs can recover when given a chance. When localitiesOcean Beach Primary Dune Trough Secondary Dune Back Dune Bay orLagoonIntensive recreation,no buildingNo direct passageor buildingLimited No direct passagerecreation or building<strong>and</strong> walkwaysMost suitablefor developmentIntensiverecreationGrasses or shrubsTaller shrubsTaller shrubs <strong>and</strong> treesBay shoreNo fillingFigure 7-11 Natural capital: primary <strong>and</strong> secondary dunes on gently sloping s<strong>and</strong>y beaches help protectl<strong>and</strong> from erosion by the sea. The roots of various grasses that colonize the dunes help hold the s<strong>and</strong> in place.Ideally, construction is allowed only behind the second strip of dunes, <strong>and</strong> walkways to the beach are built overthe dunes to keep them intact. This helps preserve barrier beaches <strong>and</strong> protect buildings from damage bywind, high tides, beach erosion, <strong>and</strong> flooding from storm surges. Such protection is rare because the shorttermeconomic value of oceanfront l<strong>and</strong> is considered much higher than its long-term ecological value.http://biology.brookscole.com/miller14135
Figure 7-12 Natural capital:some components <strong>and</strong> interactionsin a coral reef ecosystem.When these organisms die,decomposers break down theirorganic matter into mineralsused by plants. Colored arrowsindicate transfers of matter <strong>and</strong>energy between producers,primary consumers (herbivores),secondary (or higher-level) consumers(carnivores), <strong>and</strong> decomposers.Organisms are notdrawn to scale.Gray reef sharkGreen seaturtleBluetangsSea nettleFairy bassletParrot fishSergeant majorHard coralsAlgaeBrittle starB<strong>and</strong>ed coralshrimpPhytoplanktonSymbioticalgaeConeyZooplanktonBlackcap bassletSpongesMorayeelBacteriaProducer toprimaryconsumerPrimary tosecondaryconsumerSecondary tohigher-levelconsumerAll consumers<strong>and</strong> producersto decomposersor nations have imposed restrictions on reef fishing orreduced inputs of nutrients <strong>and</strong> other pollutants, reefshave rebounded.Some 300 coral reefs in 65 countries are protectedas reserves or parks, <strong>and</strong> another 600 have been recommendedfor protection. But protecting reefs is difficult<strong>and</strong> expensive, <strong>and</strong> only half of the countries withcoral reefs have set aside reserves that receive someprotection from human activities.What Biological Zones Are Found in theOpen Sea? Where Is the Light?The open ocean consists of a brightly lit surface layer,a dimly lit middle layer, <strong>and</strong> a dark bottom zone.The sharp increase in water depth at the edge of thecontinental shelf separates the coastal zone from thevast volume of the ocean called the open sea. Primarilyon the basis of the penetration of sunlight, it isdivided into the three vertical zones shown in Figure7-6.The euphotic zone is the lighted upper zone wherefloating drifting phytoplankton carry out photosynthesis.Nutrient levels are low (except around upwellings),<strong>and</strong> levels of dissolved oxygen are high. Large, fastswimmingpredatory fish such as swordfish, sharks,<strong>and</strong> bluefin tuna populate this zone.The bathyal zone is the dimly lit middle zone thatdoes not contain photosynthesizing producers becauseof a lack of sunlight. Various types of zooplankton <strong>and</strong>136 CHAPTER 7 Aquatic Biodiversity
smaller fish, many of which migrate to the surface atnight to feed, populate this zone.The lowest zone, called the abyssal zone, is dark<strong>and</strong> very cold <strong>and</strong> has little dissolved oxygen. However,there are enough nutrients on the ocean floor tosupport about 98% of the species living in the ocean.Most organisms of the deep waters <strong>and</strong> oceanfloor get their food from showers of dead <strong>and</strong> decayingorganisms (detritus) drifting down from upper lightedlevels of the ocean. Some of these organisms, includingmany types of worms, are deposit feeders, which takemud into their guts <strong>and</strong> extract nutrients from it.Others such as oysters, clams, <strong>and</strong> sponges are filterfeeders, which pass water through or over their bodies<strong>and</strong> extract nutrients from it. On parts of the dark,deep ocean floor near hydrothermal vents, scientistshave found communities of organisms where specializedbacteria use chemosynthesis to produce their ownfood <strong>and</strong> food for other organisms feeding on them.Average primary productivity <strong>and</strong> NPP per unit ofarea are quite low in the open sea except at an occasionalequatorial upwelling, where currents bring upnutrients from the ocean bottom. However, because theopen sea covers so much of the earth’s surface, it makesthe largest contribution to the earth’s overall NPP.Currently, about 40% of the world’s population<strong>and</strong> more than half of the U.S. population live alongNatural Capital DegradationMarine EcosystemsHalf of coastal wetl<strong>and</strong>s lost toagriculture <strong>and</strong> urb<strong>and</strong>evelopmentOver one-third of mangroveforests lost since 1980 toagriculture, development, <strong>and</strong>aquaculture shrimp farmsAbout 10% of world’s beacheseroding because of coastaldevelopment <strong>and</strong> rising sea levelOcean bottom habitats degradedby dredging <strong>and</strong> trawler fishingboatsOver 25% of coral reefs severelydamaged <strong>and</strong> 11% have beendestroyedFigure 7-14 Natural capital degradation: major humanimpacts on the world’s marine systems.Natural Capital DegradationOcean warmingSoil erosionCoral ReefsAlgae growth from fertilizer runoffMangrove destructionCoral reef bleachingRising sea levelsIncreased UV exposure from ozonedepletionUsing cyanide <strong>and</strong> dynamite toharvest coral reef fishCoral removal for building material,aquariums, <strong>and</strong> jeweleryDamage from anchors, ships, <strong>and</strong>tourist diversFigure 7-13 Natural capital degradation: major threats tocoral reefs.coasts or within 100 kilometers (62 miles) of a coast.Some 13 of the world’s 19 megacities with populationsof 10 million or more people are in coastal zones. By2030, at least 6.3 billion people—equal to the world’sentire population in 2003—are expected to live in ornear coastal zones. Figure 7-14 lists major human impactson marine systems. Explain how your lifestylecan contribute directly or indirectly to these impacts.7-3 FRESHWATER LIFE ZONESWhat Are Freshwater Life Zones? Lakes,Wetl<strong>and</strong>s, RiversFreshwater ecosystems provide important ecological<strong>and</strong> economic services even though they cover lessthan 1% of the earth’s surface.Freshwater life zones occur where water with a dissolvedsalt concentration of less than 1% by volume accumulateson or flows through the surfaces of terrestrialbiomes. Examples are st<strong>and</strong>ing (lentic) bodies offreshwater such as lakes, ponds, <strong>and</strong> inl<strong>and</strong> wetl<strong>and</strong>s<strong>and</strong> flowing (lotic) systems such as streams <strong>and</strong> rivers.Although freshwater systems cover less than 1% of theearth’s surface, they provide a number of importantecological <strong>and</strong> economic services (Figure 7-15, p. 138).http://biology.brookscole.com/miller14137
EcologicalServicesClimatemoderationNutrient cyclingWaste treatment<strong>and</strong> dilutionFlood controlGroundwaterrechargeHabitats foraquatic <strong>and</strong>terrestrialspeciesGeneticresources <strong>and</strong>biodiversityScientificinformationNatural CapitalFreshwater SystemsEconomicServicesFoodDrinking waterIrrigation waterHydroelectricityTransportationcorridorsRecreationEmploymentFigure 7-15 Natural capital: major ecological <strong>and</strong> economicservices provided by freshwater systems.Lakes normally consist of four distinct zones thatare defined by their depth <strong>and</strong> distance from shore asshown in Figure 7-16. The top layer is the littoral zone(“LIT-tore-el”). It consists of the shallow sunlit watersnear the shore to the depth at which rooted plants stopgrowing, <strong>and</strong> it has a high biological diversity. It hasadequate nutrients from bottom sediments. Bulrushes<strong>and</strong> cattails are plentiful near the shore <strong>and</strong> water lilies<strong>and</strong> entirely submerged plants flourish at the deepestdepths of the littoral zone.Next is the limnetic zone (“lim-NET-ic”): the open,sunlit water surface layer away from the shore that extendsto the depth penetrated by sunlight. As the mainphotosynthetic body of the lake, its producers supplythe food <strong>and</strong> oxygen that support most of the lake’sconsumers.Next is the profundal zone (“pro-FUN-dahl”): thedeep, open water where it is too dark for photosynthesis.Without sunlight <strong>and</strong> plants, oxygen levels are low.Fish adapted to its cooler <strong>and</strong> darker water are foundin this zone.Finally, at the bottom of the lake we find the benthiczone (“BEN-thic”). Mostly decomposers <strong>and</strong> detritusfeeders <strong>and</strong> fish that swim from one zone to theother inhabit it. It is nourished mainly by detritus thatfalls from the littoral <strong>and</strong> limnetic zones <strong>and</strong> by sedimentwashing into the lake.During the summer <strong>and</strong> winter, the water in deeptemperate zone lakes becomes stratified into differenttemperature layers, which do not mix. Twice a year, inthe fall <strong>and</strong> spring, the waters at all layers of theselakes mix in overturns that equalize the temperature atall depths. These overturns bring oxygen from the surfacewater to the lake bottom <strong>and</strong> nutrients from thelake bottom to the surface waters.The volume of fresh water that we use provides uswith free services worth about $3 trillion a year—equalto about 7% the value of all goods <strong>and</strong> services providedannually by the entire global economy.What Life Zones Are Found in FreshwaterLakes? Life in LayersLakes consist of sunlit surface layers near <strong>and</strong> awayfrom the shore, <strong>and</strong> at deeper levels a dark layer <strong>and</strong> abottom zone.Lakes are large natural bodies of st<strong>and</strong>ing fresh waterformed when precipitation, runoff, or groundwaterseepage fill depressions in the earth’s surface. <strong>Causes</strong>of such depressions include glaciation (the Great Lakesof North America), crustal displacement (Lake Nyasa inEast Africa) <strong>and</strong> volcanic activity (Crater Lake inOregon; see photo on title page). Lakes are suppliedwith water from rainfall, melting snow, <strong>and</strong> streamsthat drain the surrounding watershed.How Do Plant Nutrients Affect Lakes?Too Much of a Good Thing Is Not GoodAlake’s supply of plant nutrients from its environmentaffect its physical <strong>and</strong> chemical conditions <strong>and</strong>the types <strong>and</strong> numbers of organisms it can support.Ecologists classify lakes according to their nutrientcontent <strong>and</strong> primary productivity. A newly formedlake generally has a small supply of plant nutrients<strong>and</strong> is called an oligotrophic (poorly nourished) lake(Figure 7-17, left, p. 140). This type of lake is oftendeep, with steep banks. Glacier melt <strong>and</strong> mountainstreams carrying little sediment supply water to suchlakes. Because there is little sediment or microscopiclife to cloud the water, such a lake usually has crystalclearblue or green water <strong>and</strong> has small populations ofphytoplankton <strong>and</strong> fish (such as smallmouth bass <strong>and</strong>trout). Because of their low levels of nutrients, theselakes have a low net primary productivity.Over time, sediment, organic material, <strong>and</strong> inorganicnutrients wash into an oligotrophic lake, <strong>and</strong>138 CHAPTER 7 Aquatic Biodiversity
SunlightGreenfrogPaintedturtleBlue-wingedtealPondsnailMuskratLittoral zoneLimnetic zoneDivingbeetleProfundal zonePlanktonBenthic zoneYellowperchBloodwormsNorthernpikeFigure 7-16 The distinct zones of life in a fairly deep temperate zone lake.SunlightSunlightLittleshorevegetationLimneticzoneProfundalzoneOligotrophic lakeLow concentration ofnutrients <strong>and</strong> planktonSparse fishpopulationNarrowlittoralzoneSteeplyslopingshorelinesS<strong>and</strong>, gravel,rock bottomMuchshorevegetationLimneticzoneProfundalzoneEutrophic lakeHigh concentration ofnutrients <strong>and</strong> planktonDense fishpopulationSilt, s<strong>and</strong>,clay bottomWidelittoralzoneGentlyslopingshorelinesFigure 7-17 An oligotrophic, or nutrient-poor, lake (left) <strong>and</strong> a eutrophic, or nutrient-rich, lake (right).Mesotrophic lakes fall between these two extremes of nutrient enrichment. Nutrient inputs from human activitiescan accelerate eutrophication <strong>and</strong> lead to algae blooms <strong>and</strong> fish die-offs. This can reduce the fish populationsshown for a europhic lake.plants grow <strong>and</strong> decompose to form bottom sediments.A lake with a large or excessive supply of nutrients(mostly nitrates <strong>and</strong> phosphates) needed byproducers is called a eutrophic (well-nourished) lake(Figure 7-17, right). Such lakes typically are shallow<strong>and</strong> have murky brown or green water with poor visibility.Because of their high levels of nutrients, theselakes have a high net primary productivity.http://biology.brookscole.com/miller14139
In warm months the bottom layer of a eutrophiclake often is depleted of dissolved oxygen. Human inputsof nutrients from the atmosphere <strong>and</strong> fromnearby urban <strong>and</strong> agricultural areas can accelerate theeutrophication of lakes, a process called cultural eutrophication.Many lakes fall somewhere between thetwo extremes of nutrient enrichment <strong>and</strong> are calledmesotrophic lakes.What Are the Major Characteristics ofFreshwater Streams <strong>and</strong> Rivers? A DownhillRideWater flowing from mountains to the sea createsdifferent aquatic conditions <strong>and</strong> habitats.Precipitation that does not sink into the ground orevaporate is surface water. It becomes runoff when itflows into streams. The l<strong>and</strong> area that delivers runoff,sediment, <strong>and</strong> dissolved substances to a stream iscalled a watershed, or drainage basin. Small streamsjoin to form rivers, <strong>and</strong> rivers flow downhill to theocean as shown in Figure 7-18.In many areas, streams begin in mountainous orhilly areas that collect <strong>and</strong> release water falling to theearth’s surface as rain or snow that melts during warmseasons. The downward flow of surface water <strong>and</strong>groundwater from mountain highl<strong>and</strong>s to the seatakes place in three different aquatic life zones withdifferent environmental conditions: the source zone, thetransition zone, <strong>and</strong> the floodplain zone (Figure 7-18).Rivers in different areas can differ somewhat from thisgeneralized model.In the first, narrow source zone (Figure 7-18, top),headwaters, or mountain highl<strong>and</strong> streams of cold,clear water, rush over waterfalls <strong>and</strong> rapids. As thisturbulent water flows <strong>and</strong> tumbles downward, it dissolveslarge amounts of oxygen from the air. Since thewater moves rapidly, floating plankton are less important.Instead, most plants such as algae <strong>and</strong> mosses areattached to rocks.Since the water is shallow, light can usually penetrateto the bottom. But most of these streams are notvery productive because of a lack of nutrients. Mostnutrients come from organic matter (mostly leaves,branches, <strong>and</strong> the bodies of living <strong>and</strong> dead insects)that falls into the stream from nearby l<strong>and</strong>.This zone is populated by cold-water fish (such astrout in some areas), which need lots of dissolved oxygen.Many fish <strong>and</strong> other animals in fast-flowing headwaterstreams have compact <strong>and</strong> flattened bodies thatallow them to live under stones.In the transition zone (Figure 7-18, middle), theheadwater streams merge to form wider, deeperstreams that flow down gentler slopes with fewerRain <strong>and</strong> snowLakeGlacierRapidsWaterfallTributaryFlood plainOxbow lakeSalt marshSource ZoneDeltaDepositedsedimentOceanTransition ZoneSedimentWaterFloodplain ZoneFigure 7-18 Natural capital: three zones in the downhill flow of water: source zone containing mountain(headwater) streams, transition zone containing wider, lower-elevation streams, <strong>and</strong> floodplain zone containingrivers, which empty into the ocean.140 CHAPTER 7 Aquatic Biodiversity
obstacles. The warmer water <strong>and</strong> other conditions inthis zone support more producers (phytoplankton)<strong>and</strong> a variety of cool-water <strong>and</strong> warm-water fishspecies (such as black bass) with slightly lower oxygenrequirements.In the floodplain zone (see Figure 7-18, bottom),streams join into wider <strong>and</strong> deeper rivers that me<strong>and</strong>eracross broad, flat valleys. Water in this zone usuallyhas higher temperatures <strong>and</strong> less dissolvedoxygen than water in the first two zones. These slowmovingrivers sometimes support fairly large populationsof producers such as algae <strong>and</strong> cyanobacteria<strong>and</strong> rooted aquatic plants along the shores. Because ofincreased erosion <strong>and</strong> runoff over a larger area, waterin this zone often is muddy <strong>and</strong> contains high concentrationsof suspended particulate matter (silt). Themain channels of these slow-moving, wide, <strong>and</strong>murky rivers support distinctive varieties of fish (carp<strong>and</strong> catfish), whereas their backwaters support speciessimilar to those present in lakes. They are nice placesto fish. At its mouth, a river may divide into manychannels as it flows through coastal wetl<strong>and</strong>s <strong>and</strong> estuaries,where the river water mixes with ocean water(Figure 7-7).As streams flow downhill, they become powerfulshapers of l<strong>and</strong>. Over millions of years the friction ofmoving water levels mountains <strong>and</strong> cuts deep canyons,<strong>and</strong> the rock <strong>and</strong> soil the water removes are depositedas sediment in low-lying areas.Streams are fairly open ecosystems that receivemany of their nutrients from bordering l<strong>and</strong> ecosystems.We have established farml<strong>and</strong>s <strong>and</strong> constructeddams, power plants that need cooling water, sewagetreatment plants, cities, recreation areas, <strong>and</strong> shippingterminals in the watersheds along the shores of rivers<strong>and</strong> streams, especially in their transition <strong>and</strong> floodplainzones. This greatly increases the flow of plant nutrients,sediment, <strong>and</strong> pollutants into these ecosystems.To protect a stream or river system from excessive inputsof nutrients <strong>and</strong> pollutants, we must protect thel<strong>and</strong> around it.What Are Freshwater Inl<strong>and</strong> Wetl<strong>and</strong>s?Natural SpongesInl<strong>and</strong> wetl<strong>and</strong>s absorb <strong>and</strong> store excess waterfrom storms <strong>and</strong> provide a variety of wildlifehabitats.Inl<strong>and</strong> wetl<strong>and</strong>s are l<strong>and</strong>s covered with fresh waterall or part of the time (excluding lakes, reservoirs, <strong>and</strong>streams) <strong>and</strong> located away from coastal areas. Wetl<strong>and</strong>sinclude marshes (dominated by grasses <strong>and</strong>reeds with a few trees), swamps (dominated by trees<strong>and</strong> shrubs), <strong>and</strong> prairie potholes (depressions carvedout by glaciers). Other examples are floodplains (whichreceive excess water during heavy rains <strong>and</strong> floods)<strong>and</strong> the wet arctic tundra in summer. Some wetl<strong>and</strong>sare huge <strong>and</strong> some are small.Some wetl<strong>and</strong>s are covered with water yearround.Others, called seasonal wetl<strong>and</strong>s, usually are underwateror soggy for only a short time each year.They include prairie potholes, floodplain wetl<strong>and</strong>s,<strong>and</strong> bottoml<strong>and</strong> hardwood swamps. Some stay dryfor years before being covered with water again. Insuch cases, scientists must use the composition of thesoil or the presence of certain plants (such as cattails,bulrushes, or red maples) to determine that a particulararea is really a wetl<strong>and</strong>. Inl<strong>and</strong> wetl<strong>and</strong>s provide anumber of important <strong>and</strong> free ecological <strong>and</strong> economicservices such as filtering toxic wastes <strong>and</strong> pollutants,absorbing <strong>and</strong> storing excess water fromstorms, <strong>and</strong> providing habitats for a variety ofspecies.What Are the Impacts of Human Activitieson Freshwater Systems? Using <strong>and</strong> AbusingRivers <strong>and</strong> Wetl<strong>and</strong>sWe have built dams, levees, <strong>and</strong> dikes that reducethe flow of water <strong>and</strong> alter wildlife habitats in rivers;established nearby cities <strong>and</strong> farml<strong>and</strong>s that pollutestreams <strong>and</strong> rivers; <strong>and</strong> filled in inl<strong>and</strong> wetl<strong>and</strong>s togrow food <strong>and</strong> build cities.Human activities have four major impacts on freshwatersystems. First, dams, diversions, or canals fragmentalmost 60% of the world’s 237 large rivers. This alters<strong>and</strong> destroys wildlife habitats along rivers <strong>and</strong> incoastal deltas <strong>and</strong> estuaries by reducing water flow.Second, flood control levees <strong>and</strong> dikes built alongrivers alter <strong>and</strong> destroy aquatic habitats. Third, cities<strong>and</strong> farml<strong>and</strong>s add pollutants <strong>and</strong> excess plant nutrientsto nearby streams <strong>and</strong> rivers.Fourth, many inl<strong>and</strong> wetl<strong>and</strong>s have been drainedor filled to grow crops or have been covered with concrete,asphalt, <strong>and</strong> buildings. In the United States,more than half of the inl<strong>and</strong> wetl<strong>and</strong>s estimated tohave existed in the lower 48 states during the 1600s nolonger exist. The total area of these wetl<strong>and</strong> losses isgreater than the size of California (which has lost 90%of its wetl<strong>and</strong>s), Oregon, <strong>and</strong> Nevada combined. Suchloss of important natural capital has been an importantfactor in increased flood <strong>and</strong> drought damage in theUnited States. Many other countries have sufferedsimilar losses. For example, 80% of all wetl<strong>and</strong>s inGermany <strong>and</strong> France have been destroyed.In this chapter we have seen that human activitiesare severely stressing <strong>and</strong> overloading many of theworld’s aquatic systems. Good news. Research showswhen such activities are reduced most of these systemscan recover fairly quickly as long as aquatic life zonesare not overfished or overloaded with pollutants <strong>and</strong>excessive nutrients.http://biology.brookscole.com/miller14141
According to scientists, we urgently need more researchon how the world’s aquatic systems work. Withsuch information we will have a clearer picture of theimpacts of our activities on the earth’s aquatic biodiversity<strong>and</strong> how we can reduce these impacts.All at last returns to the sea—to Oceanus, the ocean river,like the ever-flowing stream of time, the beginning <strong>and</strong>the end.RACHEL CARSONCRITICAL THINKING1. List a limiting factor for each of the following: (a) thesurface layer of a tropical lake, (b) the surface layer of theopen sea, (c) an alpine stream, (d) a large, muddy river,(e) the bottom of a deep lake.2. Why do terrestrial organisms evolve tolerances tobroader temperature ranges than aquatic organisms do?3. Why do aquatic plants such as phytoplankton tend tobe very small, whereas most terrestrial plants such astrees tend to be larger <strong>and</strong> have more specialized structuressuch as stems <strong>and</strong> leaves for growth? Why aresome aquatic animals, especially marine mammals suchas whales, extremely large compared with terrestrialanimals?4. How would you respond to someone who proposesthat we use the deep portions of the world’s oceans todeposit our radioactive <strong>and</strong> other hazardous wastes becausethe deep oceans are vast <strong>and</strong> are located far awayfrom human habitats? Give reasons for your response.5. Someone tries to sell you several brightly coloredpieces of dry coral. Explain in biological terms why thistransaction is probably fraudulent.6. Developers want to drain a large area of inl<strong>and</strong> wetl<strong>and</strong>sin your community <strong>and</strong> build a large housing development.List (a) the main arguments the developerswould use to support this project <strong>and</strong> (b) the main argumentsecologists would use in opposing this project. Ifyou were an elected city official, would you vote for oragainst this project? Can you come up with a compromiseplan?7. You are a defense attorney arguing in court for sparingan undeveloped old-growth tropical rain forest <strong>and</strong> acoral reef from severe degradation or destruction by development.Write your closing statement for the defenseof each of these ecosystems. If the judge decides you cansave only one of the ecosystems, which one would youchoose, <strong>and</strong> why?8. Congratulations! You are in charge of the world. Whatare the three most important features of your plan to helpsustain the earth’s aquatic biodiversity?PROJECTS1. Search for information about mangrove trees, usingthe Internet <strong>and</strong> library. Are the different species of mangrovetrees closely related? What characteristics do theyhave in common? What characteristics do they have thatmake them a good place for fish to breed?2. If possible, visit a nearby lake or reservoir. Would youclassify it as oligotrophic, mesotrophic, or eutrophic?What are the primary factors contributing to its nutrientenrichment? Which of these factors are related to humanactivities?3. Examine a topographic map for the area around astream or lake near where you live to define the watershedfor the stream. What human activities occur in thewatershed? What influence, if any, do you expect theseactivities to have on the ecology of the stream or lake?4. Use the library or the Internet to find bibliographic informationabout Loren Eisley <strong>and</strong> Rachel Carson, whosequotes appear at the beginning <strong>and</strong> end of this chapter.5. Make a concept map of this chapter’s major ideas, usingthe section heads, subheads. <strong>and</strong> key terms (in boldface).Look on the website for this book for informationabout making concept maps.LEARNING ONLINEThe website for this book contains study aids <strong>and</strong> manyideas for further reading <strong>and</strong> research. They include achapter summary, review questions for the entire chapter,flash cards for key terms <strong>and</strong> concepts, a multiple-choicepractice quiz, interesting Internet sites, references, <strong>and</strong> aguide for accessing thous<strong>and</strong>s of InfoTrac ® College Editionarticles. Log on tohttp://biology.brookscole.com/miller14Then click on the Chapter-by-Chapter area, choose Chapter7, <strong>and</strong> select a learning resource.142 CHAPTER 7 Aquatic Biodiversity
8Community EcologyPopulationControlBiodiversityCASE STUDYFlying Foxes: Keystone Speciesin Tropical ForestsThe durian (Figure 8-1, top) is a prized fruit growingin Southeast Asian tropical forests. The odor of thisfootball-sized fruit is so strong, it is illegal to havethem on trains <strong>and</strong> in many hotel rooms in SoutheastAsia. But its custardlike flesh has been described as“exquisite,” “sensual,” “intoxicating,” <strong>and</strong> “theworld’s finest fruit.”Durian fruits come from a wild tree that grows inthe tropical rain forest. Various species of nectar-,pollen-, <strong>and</strong> fruit-eating bats calledflying foxes (Figure 8-1, bottom right)pollinate the flowers that hang highin durian trees (Figure 8-1, left).This pollination by flying foxes is anexample of mutualism: an interactionbetween two species in whichboth species benefit.Many species of flying foxes are listed as endangered,<strong>and</strong> most populations are much smaller thanhistoric numbers. One reason is deforestation. Anotheris hunting these bat species for their meat, which is soldin China <strong>and</strong> other parts of Asia. The bats also are killedto keep them from eating commercially grown fruits.Flying foxes are easy to hunt because they tend to congregatein large numbers when they feed or sleep.Some ecologists classify flying foxes as keystonespecies because of the important roles they play insustaining tropical forest communities. In addition topollinating many plant species, the plant seeds theydisperse in their droppings help maintain forest biodiversity<strong>and</strong> regenerate deforested areas.Thus many other species depend on flyingfox species. This explains why ecologists are concernedthat the decline of flying fox populationscould lead to a cascade of linked extinctions.The story of flying foxes <strong>and</strong> durians illustratesthe unique role (niche) of interactingspecies in a community. When populations ofdifferent species in a community interact withone another, they influence one another’s abilityto survive <strong>and</strong> reproduce. In this chapter we willlook at these <strong>and</strong> other interactions <strong>and</strong> processesthat occur in biological communities.Figure 8-1 Flying foxes (bottomright) are bats that play key ecologicalroles in tropical rain forests inSoutheast Asia by pollinating (left)<strong>and</strong> spreading the seeds of duriantrees. Durians (top) are a highlyprized tropical fruit.
Animal <strong>and</strong> vegetable life is too complicated a problem forhuman intelligence to solve, <strong>and</strong> we can never know howwide a circle of disturbance we produce in the harmonies ofnature when we throw the smallest pebble into the ocean oforganic life.GEORGE PERKINS MARSHThis chapter addresses the following questions:■■■■■10050What determines the number of species in acommunity?What different roles do species play in acommunity?How do species interact with one another in acommunity?How do communities change as environmentalconditions change?Does high biodiversity increase the stability of acommunity?8-1 COMMUNITY STRUCTUREAND SPECIES DIVERSITYWhat Is Community Structure? Appearance,Diversity, <strong>and</strong> NichesBiological communities differ in their physical appearance,the types <strong>and</strong> numbers of species they contain,<strong>and</strong> the ecological roles their species play.3020Ecologists use three characteristics to describe a biologicalcommunity. One is physical appearance: therelative sizes, stratification, <strong>and</strong> distribution of itspopulations <strong>and</strong> species, as shown in Figure 8-2 forvarious terrestrial communities. There are also differencesin the physical structures <strong>and</strong> zones of communitiesin aquatic life zones such as oceans, rocky shores<strong>and</strong> s<strong>and</strong>y beaches, lakes, river systems, <strong>and</strong> inl<strong>and</strong>wetl<strong>and</strong>s.The physical structure within a particular type ofcommunity or ecosystem can also vary. Most largeterrestrial communities <strong>and</strong> ecosystems consist of amosaic of vegetation patches of differing size. Life ispatchy.Community structure also varies around its edgeswhere one type of community makes a transition to adifferent type of community. For example, the edgearea between a forest <strong>and</strong> an open field may be sunnier,warmer, <strong>and</strong> drier than the forest interior <strong>and</strong>have a different combination of species than the forest<strong>and</strong> field interiors.However, increased edge area from habitat fragmentationmakes many species more vulnerable tostresses such as predators <strong>and</strong> fire. It also creates barriersthat can prevent some species from colonizing newareas <strong>and</strong> finding food <strong>and</strong> mates.A second characteristic of a community is itsspecies diversity: acombination of its number of differentspecies (species richness) <strong>and</strong> the abundance of individualswithin each of its species (species evenness). Forexample, suppose we have two communities each witha total of 20 different species <strong>and</strong> 200 individuals <strong>and</strong>thus the same species diversity. But these communitiescould differ in their species richness <strong>and</strong> species evenness.For example, suppose community A has 10 individualsin each of its 20 species. And community B has10 species with 2 individuals each <strong>and</strong> 10 other species,each with 18 individuals. Which community has thehighest species evenness?A third characteristic is a community’s niche structure:the number of ecological niches, how they resembleor differ from each other, <strong>and</strong> how species interact10ftmTropicalrain forestConiferousforestDeciduousforestThornforestThornscrubTall-grassprairieShort-grassprairieDesertscrubFigure 8-2 Natural capital: generalized types, relative sizes, <strong>and</strong> stratification of plant species in various terrestrialcommunities.144 CHAPTER 8 Community Ecology
Species Diversity200100Species Diversity1,000100Figure 8-3 Changes inspecies diversity at different latitudes(distances from the equator) in terrestrialcommunities for (a) ants <strong>and</strong>(b) breeding birds of North <strong>and</strong>Central America. As a general rule,species diversity steadily declines aswe go away from the equator towardeither pole. (Modified by permissionfrom Cecie Starr, Biology: Concepts<strong>and</strong> Applications, 4th ed., 2000,Brooks/Cole [Wadsworth])0 10(a) Ants90°N 6030 0 30°S 60 80°NLatitude(b) Breeding birds60 40Latitude20 0with one another. Studies indicate that the most speciesrichenvironments are tropical rain forests, coral reefs,the deep sea, <strong>and</strong> large tropical lakes. Communitiessuch as a tropical rain forest or a coral reef with a largenumber of different species (high species richness) generallyhave only a few members of each species (lowspecies evenness).Several factors affect the species diversity in communities.One is latitude (distance from the equator) interrestrial communities (Figure 8-3). For most plants<strong>and</strong> animals, species diversity is highest in the tropics<strong>and</strong> declines from the equator to the poles. Another factoris pollution in aquatic systems (Figure 8-4). Other factorsare habitat diversity, NPP, habitat disturbance, <strong>and</strong>time.Number of diatom speciesUnpollutedstreamPollutedstreamFigure 8-4 Changes in the species diversity <strong>and</strong> species abundanceof diatom species in an unpolluted stream <strong>and</strong> a pollutedstream. Both species diversity <strong>and</strong> species abundance decreasewith pollution.What Determines the Number of Specieson Isl<strong>and</strong>s? Entrances <strong>and</strong> ExitsThe number of species on an isl<strong>and</strong> is determined byhow fast new species arrive <strong>and</strong> old species becomeextinct, the isl<strong>and</strong>’s size, <strong>and</strong> how far it is from themainl<strong>and</strong>.In the 1960s, Robert MacArthur <strong>and</strong> Edward O. Wilsonbegan studying communities on isl<strong>and</strong>s to discoverwhy large isl<strong>and</strong>s tend to have more species of a certaincategory such as insects, birds, or ferns than dosmall isl<strong>and</strong>s. To explain these differences in speciesrichness with isl<strong>and</strong> size, MacArthur <strong>and</strong> Wilson proposedwhat is called the species equilibrium model,or the theory of isl<strong>and</strong> biogeography. According tothis widely accepted model, a balance between twofactors determines the number of different speciesfound on an isl<strong>and</strong>: the rate at which new species immigrateto the isl<strong>and</strong> <strong>and</strong> the rate at which existingspecies become extinct on the isl<strong>and</strong>.The model projects that at some point the rates ofimmigration <strong>and</strong> extinction should reach an equilibriumpoint (Figure 8-5a, p. 146) that determines the isl<strong>and</strong>’saverage number of different species. This is afairly complex idea, so study Figure 8-5 carefully. TheCD that comes with this book has a great animation ofthis model. Check it out.According to the model, two features of an isl<strong>and</strong>affect its immigration <strong>and</strong> extinction rates <strong>and</strong> thus itsspecies diversity. One is the isl<strong>and</strong>’s size, with a smallisl<strong>and</strong> tending to have fewer different species than alarge one (Figure 8-5b). One reason is that a small isl<strong>and</strong>generally has a lower immigration rate because itis a smaller target for potential colonizers. In addition,a small isl<strong>and</strong> should have a higher extinction rate becauseit usually has fewer resources <strong>and</strong> less diversehabitats for its species.http://biology.brookscole.com/miller14145
HighHighHighRate of immigrationor extinctionImmigrationExtinctionRate of immigrationor extinctionImmigration(large isl<strong>and</strong>)Immigration(small isl<strong>and</strong>)Extinction(small isl<strong>and</strong>)Extinction(large isl<strong>and</strong>)Rate of immigrationor extinctionImmigration(near isl<strong>and</strong>)Immigration(far isl<strong>and</strong>)ExtinctionLowEquilibrium numberLowSmall isl<strong>and</strong>Large isl<strong>and</strong>LowFar isl<strong>and</strong>Near isl<strong>and</strong>Number of species on isl<strong>and</strong>(a) Immigration <strong>and</strong> extinction ratesNumber of species on isl<strong>and</strong>(b) Effect of isl<strong>and</strong> sizeNumber of species on isl<strong>and</strong>(c) Effect of distance from mainl<strong>and</strong>Figure 8-5 The species equilibrium model or theory of isl<strong>and</strong> biogeography, developed byRobert MacArthur <strong>and</strong> Edward O. Wilson. (a) The equilibrium number of species (blue triangle) onan isl<strong>and</strong> is determined by a balance between the immigration rate of new species <strong>and</strong> the extinctionrate of species already on the isl<strong>and</strong>. (b) With time, large isl<strong>and</strong>s have a larger equilibriumnumber of species than smaller isl<strong>and</strong>s because of higher immigration rates <strong>and</strong> lower extinctionrates on large isl<strong>and</strong>s. (c) Assuming equal extinction rates, an isl<strong>and</strong> near a mainl<strong>and</strong> will have alarger equilibrium number of species than a more distant isl<strong>and</strong> because the immigration rate isgreater for a near isl<strong>and</strong> than for a more distant one.A second factor is an isl<strong>and</strong>’s distance from thenearest mainl<strong>and</strong> (Figure 8-5c). According to the model,if we have two isl<strong>and</strong>s about equal in size <strong>and</strong> otherfactors, the isl<strong>and</strong> closer to a mainl<strong>and</strong> source of immigrantspecies should have the higher immigrationrate <strong>and</strong> thus a higher species richness—assumingthat extinction rates on both isl<strong>and</strong>s are about thesame.In recent years, scientists have used the model tohelp protect wildlife in habitat isl<strong>and</strong>s such as nationalparks surrounded by a sea of developed <strong>and</strong> fragmentedl<strong>and</strong>.8-2 TYPES OF SPECIESWhat Roles Do Various Species Play inCommunities? A Biological Play with ManyPartsCommunities can contain native, nonnative, indicator,keystone, <strong>and</strong> foundation species that play differentecological roles.Ecologists often use labels—such as native, nonnative,indicator, keystone, or foundation—to describe the majorecological roles or niches various species play in communities.Any given species may play more than oneof these five roles in a particular community.Native species are those that normally live <strong>and</strong>thrive in a particular community. Others that evolvedsomewhere else <strong>and</strong> then migrate into or are deliberatelyor accidentally introduced into a community arecalled nonnative species, invasive species, or alienspecies.Throughout the earth’s long history of life speciesin one part of the world have migrated from one communityto another. But moving into a new communityis not easy. Most organisms arriving in a newcommunity do not survive because they are not ableto find a suitable niche under their new environmentalconditions.Many people tend to think of nonnative or invasivespecies as villains. But most introduced <strong>and</strong> domesticatedspecies of crops <strong>and</strong> animals such as chickens,cattle, <strong>and</strong> fish from around the world <strong>and</strong> many wildgame species are beneficial to us. Indeed, most of thefood crops <strong>and</strong> domesticated animals we depend onare not native to the communities where we raise them.But sometimes a nonnative species can thrive <strong>and</strong>crowd out native species—an example of unintended<strong>and</strong> unexpected consequences. In 1957, for example,Brazil imported wild African bees to help increasehoney production. Instead, the bees displaced domestichoneybees <strong>and</strong> reduced the honey supply.Since then, these nonnative bee species, popularlyknown as “killer bees,” have moved northward intoCentral America <strong>and</strong> parts of the southwestern UnitedStates, such as Texas, Arizona, New Mexico, <strong>and</strong>California. They are still heading north but should bestopped eventually by cold winters in the centralUnited States unless they can adapt genetically to coldweather.146 CHAPTER 8 Community Ecology
They are not the killer bees portrayed in some horrormovies, but they are aggressive <strong>and</strong> unpredictable.They have killed thous<strong>and</strong>s of domesticated animals<strong>and</strong> an estimated 1,000 people in the western hemisphere.Most of the people killed by these honeybeesdied because they were allergic to their stings or theyfell down or became trapped <strong>and</strong> could not flee.What Are Indicator Species? Smoke AlarmsSome species can alert us to harmful changes that aretaking place in biological communities.Species that serve as early warnings of damage or dangerto a community are called indicator species. Forexample, the presence or absence of trout species inwater at temperatures within their range of tolerance(Figure 4-13, p. 64) is an indicator of water quality becausetrout need clean water with high levels of dissolvedoxygen.Birds are excellent biological indicators becausethey are found almost everywhere <strong>and</strong> are affectedquickly by environmental change such as loss or fragmentationof their habitats <strong>and</strong> introduction of chemicalpesticides. Many bird species are declining. Butterfliesare also good indicator species <strong>and</strong> in some areasare declining faster than bird species.Using a living organism to monitor environmentalquality is not new. Coal mining is a dangerous occupation,partly because of the underground presence ofpoisonous <strong>and</strong> explosive gases, many of which haveno detectable odor. In the 1800s <strong>and</strong> early 1900s, coalminers took caged canaries into mines to act as earlywarningsentinels. These birds sing loudly <strong>and</strong> often. Ifthey quit singing for a long period <strong>and</strong> they appearedto be distressed, miners took this as an indicator for thepresence of poisonous or explosive gases <strong>and</strong> got outof the mine.The latest idea is to use indicator species to combatterrorism. Some scientists are trying to geneticallyengineer species of weedy plants to change their colorrapidly when exposed to a harmful biological or chemicalagent. If successful, genes from these plants couldbe inserted into evergreen trees, backyard shrubs,cheap houseplants, or even pond algae to turn theminto early-warning systems for attacks using biologicalor chemical weapons.Case Study: Why Are Amphibians Vanishing?Warnings from FrogsThe disappearance of many of the world’s amphibianspecies may indicate a decline in environmentalquality in many parts of the world.Amphibians (frogs, toads, <strong>and</strong> salam<strong>and</strong>ers) live partof their lives in water <strong>and</strong> part on l<strong>and</strong> <strong>and</strong> are classifiedas indicator species. Frogs, for example, are goodindicator species because they are especially vulnerableto environmental disruption at various points intheir life cycle, shown in Figure 8-6. As tadpoles theylive in water <strong>and</strong> eat plants, <strong>and</strong> as adults they liveAdult frog(3 years)Young frogSpermEggsSexualreproductionFertilized eggdevelopmentOrgan formationEgg hatchesTadpoledevelopsinto frogTadpoleFigure 8-6 Typical lifecycle of a frog. Populationsof various frogspecies can declinebecause of the effects ofvarious harmful factorsat different points intheir life cycle. Suchfactors include habitatloss, drought, pollution,increased ultravioletradiation, parasitism,disease, overhunting forfood (frog legs), <strong>and</strong>nonnative predators <strong>and</strong>competitors.http://biology.brookscole.com/miller14147
mostly on l<strong>and</strong> <strong>and</strong> eat insects that can expose them topesticides. <strong>Their</strong> eggs have no protective shells to blockultraviolet (UV) radiation or pollution. As adults, theytake in water <strong>and</strong> air through their thin, permeableskins that can readily absorb pollutants from water, air,or soil.Since 1980, populations of hundreds of the world’sestimated 5,280 amphibian species have been vanishingor declining in almost every part of the world, evenin protected wildlife reserves <strong>and</strong> parks.No single cause has been identified to explain theamphibian declines. However, scientists have identifieda number of factors that can affect frogs <strong>and</strong> otheramphibians at various points in their life cycle.One factor is habitat loss <strong>and</strong> fragmentation, especiallybecause of the draining <strong>and</strong> filling of inl<strong>and</strong>wetl<strong>and</strong>s, deforestation, <strong>and</strong> development. Another isprolonged drought, which dries up breeding pools sothat few tadpoles survive. Dehydration from lack ofwater can also weaken amphibians <strong>and</strong> make themmore susceptible to fatal viruses, bacteria, fungi, <strong>and</strong>parasites.Pollution can also play a role. Frog eggs, tadpoles,<strong>and</strong> adults are very sensitive to many pollutants, especiallypesticides. Exposure to such pollutants mayalso make them more vulnerable to bacterial, viral,<strong>and</strong> fungal diseases, <strong>and</strong> cause an array of sexualabnormalities.Increases in UV radiation caused by reductions instratospheric ozone—caused when certain chemicalswe make drift up into the stratosphere—can harmyoung embryos of amphibians found in shallowponds. Increased incidence of parasitism by a flatworm(trematode) may account for deformities found insome frog species but not the worldwide decline ofamphibians.Overhunting can be a factor, especially in Asia <strong>and</strong>France, where frog legs are a delicacy. Populations ofsome amphibians can also be reduced by immigrationor introduction of nonnative predators <strong>and</strong> competitors(such as fish) <strong>and</strong> disease organisms. A combination ofsuch factors probably is responsible for the decline ordisappearance of most amphibian species.So why should we care if various amphibianspecies become extinct? Scientists give three reasons.First, it suggests that environmental quality is deterioratingin parts of the world because amphibians aresensitive biological indicators of changes in environmentalconditions such as habitat loss <strong>and</strong> degradation,pollution, UV exposure, <strong>and</strong> climate change.Second, adult amphibians play important ecologicalroles in biological communities. For example, amphibianseat more insects (including mosquitoes) th<strong>and</strong>o birds. In some habitats, extinction of certain amphibianspecies could lead to extinction of otherspecies, such as reptiles, birds, aquatic insects, fish,mammals, <strong>and</strong> other amphibians that feed on them ortheir larvae.Third, from a human perspective, amphibians representa genetic storehouse of pharmaceutical productswaiting to be discovered. Compounds in hundreds ofsecretions from amphibian skin have been isolated <strong>and</strong>some are used as painkillers <strong>and</strong> antibiotics <strong>and</strong> intreating burns <strong>and</strong> heart disease.The plight of some amphibian indicator species isa warning signal. They do not need us, but we <strong>and</strong>other species need them.What Are Keystone Species? Major PlayersWho Help Keep Ecosystems Running SmoothlyKeystone species help determine the types <strong>and</strong>numbers of various other species in a community.A keystone is the wedge-shaped stone placed at thetop of a stone archway. Remove this stone <strong>and</strong> the archcollapses. In some communities, certain species calledkeystone species apparently play a similar role. Theyhave a much larger effect on the types <strong>and</strong> abundancesof many other species in a community than their numberswould suggest.According to this hypothesis, keystone speciesplay critical ecological roles. One is pollination of floweringplant species by bees, hummingbirds, bats, <strong>and</strong>other species. In addition, top predator keystone speciesfeed on <strong>and</strong> help regulate the populations of otherspecies. Examples are the wolf, leopard, lion, alligator(Connections, at right), <strong>and</strong> great white shark.Have you thanked a dung beetle today? Maybe youshould, because these keystone species rapidly remove,bury, <strong>and</strong> recycle animal wastes or dung. Withoutthem we would be up to our eyeballs in such waste,<strong>and</strong> many plants would be starved for nutrients. Thesebeetles also churn <strong>and</strong> aerate the soil, making it moresuitable for plant life.Ecologist Robert Paine conducted a controlled experimentalong the rocky Pacific coast of the state ofWashington that demonstrated the role of the sea starPiaster orchaceus as a keystone species in an intertidalzone community (Figure 7-9, top, p. 134). He removedsea stars from one community but not froman adjacent community, which served as a controlgroup. In both communities he monitored the populationsof 18 other species. In the community fromwhich he removed the sea stars, all of the 18 speciesdisappeared except mussels. In the community wherethe sea stars remained, they ate the mussels <strong>and</strong> keptthem from multiplying <strong>and</strong> crowding out otherspecies.The loss of a keystone species can lead to populationcrashes <strong>and</strong> extinctions of other species in a com-148 CHAPTER 8 Community Ecology
Why Should We Care about Alligators?The American alligator,NorthAmerica’s largestreptile, has no naturalpredatorsCONNECTIONSexcept humans.This species, which has beenaround for about 200 million years,has been able to adapt to numerouschanges in the earth’s environmentalconditions.This changed when hunters begankilling large numbers of theseanimals for their exotic meat <strong>and</strong>their supple belly skin, used tomake shoes, belts, <strong>and</strong> pocketbooks.Other people considered alligatorsto be useless <strong>and</strong> dangerous<strong>and</strong> hunted them for sport or out ofhatred. Between l950 <strong>and</strong> 1960,hunters wiped out 90% of the alligatorsin Louisiana. By the 1960s,the alligator population in theFlorida Everglades also was nearextinction.People who say “So what?” areoverlooking the alligator’s importantecological role or niche in subtropicalwetl<strong>and</strong> ecosystems. Alligatorsdig deep depressions, orgator holes. These holes hold freshwater during dry spells, serve asrefuges for aquatic life, <strong>and</strong> supplyfresh water <strong>and</strong> food for manyanimals.In addition, large alligator nestingmounds provide nesting <strong>and</strong>feeding sites for herons <strong>and</strong> egrets.Alligators also eat large numbers ofgar (a predatory fish) <strong>and</strong> thus helpmaintain populations of game fishsuch as bass <strong>and</strong> bream.As alligators move from gatorholes to nesting mounds, they helpkeep areas of open water free of invadingvegetation. Without thesefree ecosystem services, freshwaterponds <strong>and</strong> shrubs <strong>and</strong> trees wouldfill in the coastal wetl<strong>and</strong>s in the alligator’shabitat, <strong>and</strong> dozens ofspecies would disappear.Some ecologists classify theNorth American alligator as a keystonespecies because of these importantecological roles in helpingmaintain the structure <strong>and</strong> functionof its natural ecosystems. Some sayit can also be classified as a foundationspecies.In 1967, the U.S. governmentplaced the American alligator onthe endangered species list. Protectedfrom hunters, the alligatorpopulation made a strong comebackin many areas by 1975—toostrong, according to those who findalligators in their backyards <strong>and</strong>swimming pools, <strong>and</strong> to duckhunters, whose retriever dogssometimes are eaten by alligators.In 1977, the U.S. Fish <strong>and</strong>Wildlife Service reclassified theAmerican alligator from an endangeredspecies to a threatened speciesin Florida, Louisiana, <strong>and</strong> Texas,where 90% of the animals live. In1987, this reclassification was extendedto seven other states.Alligators now number perhaps3 million, most in Florida <strong>and</strong>Louisiana. It is generally illegal tokill members of a threatenedspecies, but limited kills by licensedhunters are allowed in some areasof Texas, Florida, Louisiana, SouthCarolina, <strong>and</strong> Georgia to control thepopulation.To biologists, the comeback ofthe American alligator from nearpremature extinction by overhuntingis an important success story inwildlife conservation.The increased dem<strong>and</strong> for alligatormeat <strong>and</strong> hides has created abooming business in alligatorfarms, especially in Florida. Suchfarms reduce the rewards for illegalhunting of wild alligators.Critical ThinkingSome homeowners in Florida believethey should have the right tokill any alligator found on theirproperty. Others argue this shouldnot be allowed because alligatorsare a threatened species, <strong>and</strong> housingdevelopments have invaded thehabitats of alligators, not the otherway around. What is your opinionon this issue? Explain.munity that depend on it for certain services. Accordingto biologist Edward O. Wilson, “The loss of a keystonespecies is like a drill accidentally striking a powerline. It causes lights to go out all over.”What Are Foundation Species? PlayersWho Create New Habitats <strong>and</strong> NichesFoundation species can create <strong>and</strong> enhance habitatsthat can benefit other species in a community.Some ecologists think the keystone species should beexp<strong>and</strong>ed to include the roles of foundation species,which play a major role in shaping communities bycreating <strong>and</strong> enhancing habitat that benefits otherspecies. For example, elephants push over, break, oruproot trees, creating forest openings in the savannagrassl<strong>and</strong>s <strong>and</strong> woodl<strong>and</strong>s of Africa. This promotesthe growth of grasses <strong>and</strong> other forage plants that benefitsmaller grazing species such as antelope. It also acceleratesnutrient cycling rates. Some bat <strong>and</strong> birdfoundation species can regenerate deforested areas<strong>and</strong> spread fruit plants by depositing plant seeds intheir droppings.Proponents of the foundation species hypothesissay that Paine’s study of the role of the sea star Piasterorchaceus as a keystone species in an intertidal zonecommunity did not take into account the role of musselsas foundation species.http://biology.brookscole.com/miller14149
According to this hypothesis, mussel beds arehomes to hundreds of invertebrate species that dopoorly in the presence of mussel competitors such assea stars. When scientists measured the overall diversityof the species in a tide pool rather than just the 18species observed by Paine they found that the overalldiversity of species was greater when the keystone seastar species was absent. Its absence allowed the numberof mussel species <strong>and</strong> the species they interact withto exp<strong>and</strong>. From this point of view, the mussels shouldbe viewed as a foundation species that exp<strong>and</strong>ed speciesrichness.8-3 SPECIES INTERACTIONS:COMPETITION AND PREDATIONHow Do Species Interact? Ways to Getan EdgeCompetition, predation, parasitism, mutualism,<strong>and</strong> commensalism are ways in which speciescan interact <strong>and</strong> increase their ability tosurvive.When different species in a community have activitiesor resource needs in common, they may interact withone another. Members of these species may be harmed,helped, or unaffected by the interaction. Ecologistsidentify five basic types of interactions between species:interspecific competition, predation, parasitism, mutualism,<strong>and</strong> commensalism.The most common interaction between species iscompetition for shared or scarce resources such as space<strong>and</strong> food. Ecologists call such competition betweenspecies interspecific competition.When this occurs, parts of the fundamental nichesof the competing species overlap (Figure 5-7, p. 94).With significant overlap, one of the competing speciesmust migrate, if possible, to another area, shift its feedinghabits or behavior through natural selection <strong>and</strong>evolution, suffer a sharp population decline, or becomeextinct in that area.Humans are in competition with many otherspecies for space, food, <strong>and</strong> other resources. As weconvert more <strong>and</strong> more of the earth’s l<strong>and</strong> <strong>and</strong> aquaticresources <strong>and</strong> net primary productivity to our uses wedeprive many other species of resources they need tosurvive.Over a time scale long enough for evolution to occur,some species competing for the same resources evolveadaptations that reduce or avoid competition. Oneway this happens is through resource partitioning. Itoccurs when species competing for similar scarce resourcesevolve more specialized traits that allow themto use shared resources at different times, in differentways, or in different places.Through evolution, the fairly broad niches of twocompeting species (Figure 8-7, top) can become morespecialized (Figure 8-7, bottom) so that the species canshare limited resources. When lions <strong>and</strong> leopards livein the same area, lions take mostly larger animals asprey, <strong>and</strong> leopards take smaller ones. Hawks <strong>and</strong> owlsfeed on similar prey, but hawks hunt during the day<strong>and</strong> owls hunt at night.Ecologist Robert H. MacArthur studied the feedinghabits of five species of North American warblers(small insect-eating birds) that hunt for insects <strong>and</strong>nest in the same type of spruce tree. He found that thebird species minimized the overlap of their niches <strong>and</strong>reduced competition among the species through resourcepartitioning. They did this by concentratingmuch of their hunting for insects in different parts ofthe spruce trees (Figure 8-8), employing differentNumber of individualsNumber of individualsSpecies 1Regionofniche overlapResource useSpecies 2Species 1 Species 2How Have Some Species Reducedor Avoided Competition? Sharethe Wealth by Becoming MoreSpecializedSome species evolve adaptations that allow them toreduce or avoid competition for resources with otherspecies.Resource useFigure 8-7 Natural capital: resource partitioning <strong>and</strong> nichespecialization as a result of competition between two species.The top diagram shows the overlapping niches of two competingspecies. The bottom diagram shows that through evolutionthe niches of the two species become separated <strong>and</strong> more specialized(narrower) so that they avoid competing for the sameresources.150 CHAPTER 8 Community Ecology
hunting tactics, <strong>and</strong> nesting at slightly different times.Other examples are shown in Figure 5-5 (p. 92).How Do Predator <strong>and</strong> Prey Species Interact?Eating <strong>and</strong> Being EatenPredator species feed on all or parts of other speciescalled prey.In predation, members of one species (the predator)feed directly on all or part of a living organism of anotherspecies (the prey). In this interaction, the predatorsbenefit <strong>and</strong> the prey are harmed. The two kinds oforganisms are said to have a predator–prey relationship.Such relationships are depicted in Figures 4-11 (p. 63),4-12 (p. 63), 4-18 (p. 68), <strong>and</strong> 4-19 (p. 69).Most of the world’s predation is not the kind wesee in many nature documentaries such as lions killingzebras or bears plucking salmon from streams. Instead,most predation occurs unseen at the microscopic levelin soils <strong>and</strong> in the sediments of aquatic systems.At the individual level, members of the preyspecies are clearly harmed. But at the population level,predation plays a role in evolution by natural selection.Predation can benefit the prey species becausepredators often kill the sick, weak, aged, <strong>and</strong> least fitmembers of a population (Case Study, below). Thisgives remaining prey better access to food supplies<strong>and</strong> prevents excessive population growth. Predationalso helps successful genetic traits to become moredominant in the prey population through natural selection.This can enhance the reproductive success <strong>and</strong>long-term survival of the prey species.Some people tend to view predators with contempt.When a hawk tries to capture <strong>and</strong> feed on a rabbit,some root for the rabbit. Yet the hawk like all predatorsis merely trying to get enough food to feed itself<strong>and</strong> its young; in the process, it is playing an importantecological role in controlling rabbit populations.Case Study: Why Are Sharks ImportantSpecies? Culling the Oceans <strong>and</strong> Helping ImproveHuman HealthSome shark species eat <strong>and</strong> remove sick <strong>and</strong> injuredocean animals <strong>and</strong> some can help us learn how tofight cancer <strong>and</strong> immune system disorders.The world’s 370 shark species vary widely in size. Thesmallest is the dwarf dog shark, about the size of alarge goldfish. The largest is the whale shark, theworld’s largest fish. It can grow to 15 meters (50 feet)long <strong>and</strong> weigh as much as two full-grown Africanelephants!Various shark species, feeding at the top of foodwebs, cull injured <strong>and</strong> sick animals from the ocean <strong>and</strong>thus play an important ecological role. Without suchshark species, the oceans would be overcrowded withdead <strong>and</strong> dying fish.Figure 8-8 Sharing the wealth: resource partitioning of fivespecies of common insect-eating warblers in the spruce forestsof Maine. Each species minimizes competition with the othersfor food by spending at least half its feeding time in a distinctportion (shaded areas) of the spruce trees, <strong>and</strong> consumingsomewhat different insect species. (After R. H. MacArthur,“Population Ecology of Some Warblers in Northeastern ConiferousForests,” Ecology 36 (1958): 533–36)http://biology.brookscole.com/miller14151
Many people—influenced by movies (such asJaws), popular novels, <strong>and</strong> widespread media coverageof a fairly small number of shark attacks per year—think of sharks as people-eating monsters. However,the three largest species—the whale shark, baskingshark, <strong>and</strong> megamouth shark—are gentle giants. Theyswim through the water with their mouths open, filteringout <strong>and</strong> swallowing huge quantities of plankton.Every year, members of a few species of shark—mostly great white, bull, tiger, gray reef, lemon, hammerhead,shortfin mako, <strong>and</strong> blue—typically injure60–100 people worldwide (60 in 2002). Between 1990<strong>and</strong> 2003, sharks killed 8 people off U.S. coasts <strong>and</strong>88 people worldwide—an average of 7 people peryear. Most attacks are by great white sharks, whichfeed on sea lions <strong>and</strong> other marine mammals <strong>and</strong>sometimes mistake divers <strong>and</strong> surfers for their usualprey. Whose fault is this?Media coverage of such attacks greatly distorts thedanger from sharks. You are 30 times more likely to bekilled by lightning than by a shark, <strong>and</strong> your chance ofbeing killed by lightning is extremely small.For every shark that kills or injures a person, wekill at least 1 million sharks, a total of about 100 millionsharks each year. Sharks are caught mostly for theirfins <strong>and</strong> then thrown back into the water to die.Shark fins are widely used in Asia as a soup ingredient<strong>and</strong> as a pharmaceutical cure-all. They are worthas much as $563 per kilogram ($256 per pound). Inhigh-end Hong Kong restaurants, a single bowl ofshark fin soup can cost as much as $100!According to a 2001 study by Wild Aid, shark finssold in restaurants throughout Asia <strong>and</strong> in Chinesecommunities in cities such as New York, San Francisco,<strong>and</strong> London contain dangerously high levels of toxicmercury. Consumption of high levels of mercury is especiallythreatening for pregnant women, fetuses, <strong>and</strong>infants feeding on breast milk.Sharks are also killed for their livers, meat (especiallymako <strong>and</strong> thresher), hides (a source of exotic,high-quality leather), <strong>and</strong> jaws (especially greatwhites, whose jaws can sell for up to $10,000). They arealso killed because we fear them. Some sharks (especiallyblue, mako, <strong>and</strong> oceanic whitetip) die when theyare trapped in nets or lines deployed to catch swordfish,tuna, shrimp, <strong>and</strong> other commercially importantspecies.In addition to their important ecological roles,sharks can save human lives. They are helping us learnhow to fight cancer, which sharks almost never get.Scientists are also studying their highly effective immunesystem because it allows wounds to heal withoutbecoming infected.Sharks have three natural traits that make themprone to population declines from overfishing. Theytake a long time to reach sexual maturity (10–24years), have only a few offspring (between 2 <strong>and</strong> 10)once every year or two, <strong>and</strong> have long gestation(pregnancy) periods (up to 24 months for somespecies).Sharks are among the most vulnerable <strong>and</strong> leastprotected animals on the earth. Eight of the world’sshark species are in danger of extinction. In 2003,experts at the National Aquarium in Baltimore,Maryl<strong>and</strong>, estimated that populations of a number ofcommercially valuable shark species have decreasedby 90% since 1992.In response to a public outcry over depletion ofsome shark species, the United States <strong>and</strong> several othercountries have banned practices such as shark finningin their territorial waters. But such bans are difficult toenforce.Some critics do not underst<strong>and</strong> the concern becausethey see sharks as fish we should be able to catch<strong>and</strong> do what we want with. They also do not believethat sharks suffer from any harm we inflict on them sothere is no need to treat them humanely. And they resentthe United States <strong>and</strong> other countries forcing theirethical concerns about killing or harming sharks onnations <strong>and</strong> individuals that do not share these views.They also worry that such ethical concerns aboutspecies such as sharks <strong>and</strong> whales could spread toother aquatic <strong>and</strong> terrestrial species.With more than 400 million years of evolution behindthem, sharks have had a long time to get thingsright. Preserving their evolutionary genetic developmentbegins with the knowledge that sharks do notneed us, but we <strong>and</strong> other species need them.xHOW WOULD YOU VOTE? Do we have an ethical obligationto protect shark species from premature extinction <strong>and</strong> treatthem humanely? Cast your vote online at http://biology.brookscole.com/miller14.How Do Predators Increase <strong>Their</strong> Chancesof Getting a Meal? Pursue, Ambush, <strong>and</strong>ImmobilizeSome predators are fast enough to catch their prey,some hide <strong>and</strong> lie in wait, <strong>and</strong> some inject chemicalsto paralyze their prey.Predators have a variety of methods that help themcapture prey. Herbivores can simply walk, swim, or flyup to the plants they feed on.Carnivores feeding on mobile prey have two mainoptions: pursuit <strong>and</strong> ambush. Some, such as the cheetah,catch prey by running fast; others, such as theAmerican bald eagle, fly <strong>and</strong> have keen eyesight; stillothers, such as wolves <strong>and</strong> African lions, cooperate incapturing their prey by hunting in packs.152 CHAPTER 8 Community Ecology
Other predators use camouflage—a changein shape or color—to hide in plain sight <strong>and</strong>ambush their prey. For example, praying mantisessit in flowers of a similar color <strong>and</strong> ambushvisiting insects. White ermines (a type ofweasel) <strong>and</strong> snowy owls hunt in snow-coveredareas. The alligator snapping turtle, camouflagedin its stream-bottom habitat, dangles itsworm-shaped tongue to entice fish into its powerfuljaws. People camouflage themselves tohunt wild game <strong>and</strong> use camouflaged traps toambush wild game.Some predators use chemical warfareto attack their prey. For example, spiders<strong>and</strong> poisonous snakes use venom to paralyzetheir prey <strong>and</strong> to deter their predators.(a) Span worm(b) W<strong>and</strong>ering leaf insectHow Do Prey Defend ThemselvesAgainst or Avoid Predators? Escape,Repel, Deceive, <strong>and</strong> PoisonSome prey escape their predators or haveprotective shells or thorns, some camouflagethemselves, <strong>and</strong> some use chemicals to repel orpoison predatorsPrey species have evolved many ways to avoidpredators, including the ability to run, swim, orfly fast, <strong>and</strong> a highly developed sense of sight orsmell that alerts them to the presence of predators.Other avoidance adaptations are protectiveshells (as on armadillos, which roll themselvesup into an armor-plated ball, <strong>and</strong> turtles), thickbark (giant sequoia), spines (porcupines), <strong>and</strong>thorns (cacti <strong>and</strong> rosebushes). Many lizardshave brightly colored tails that break off whenthey are attacked, often giving them enoughtime to escape.Other prey species use the camouflage ofcertain shapes or colors or the ability to changecolor (chameleons <strong>and</strong> cuttlefish). Some insectspecies have evolved shapes that look like twigs(Figure 8-9a), bark, thorns, or even bird droppingson leaves. A leaf insect may be almost invisibleagainst its background (Figure 8-9b), <strong>and</strong>an arctic hare in its white winter fur blends intothe snow. A spotted cheetah blends into thegrass as it watches for grazing animals to chasedown <strong>and</strong> kill.Chemical warfare is another common strategy.Some prey species discourage predatorswith chemicals that are poisonous (ole<strong>and</strong>er plants), irritating(stinging nettles <strong>and</strong> bombardier beetles, Figure8-9c), foul smelling (skunks, skunk cabbages, <strong>and</strong>stinkbugs), or bad tasting (buttercups <strong>and</strong> monarchbutterflies, Figure 8-9d). When attacked, some species(c) Bombardier beetle(e) Poison dart frog(g) Hind wings of Io mothresemble eyes of a muchlarger animal.(d) Foul-tasting monarch butterfly(f) Viceroy butterfly mimicsmonarch butterfly(h) When touched,snake caterpillar changesshape to look like head of snake.Figure 8-9 Some ways in which prey species avoid their predators by (a, b)camouflage, (c–e) chemical warfare, (d, e) warning coloration, (f) mimicry,(g) deceptive looks, <strong>and</strong> (h) deceptive behavior.of squid <strong>and</strong> octopus emit clouds of black ink to confusethe predator <strong>and</strong> allow them to escape.Scientists have identified more than 10,000 defensivechemicals made by plants. Some are herbivorepoisons such as cocaine, caffeine, cyanide, opium,http://biology.brookscole.com/miller14153
strychnine, peyote, nicotine, <strong>and</strong> rotenone, some ofwhich we use as an insecticide. Others are herbivorerepellents such as pepper, mustard, nutmeg, oregano,cinnamon, <strong>and</strong> mint, all of which we use to flavor orspice up our food. Major pharmaceutical companiesview the plant world as a vast drugstore to study as asource for new medicines to treat a variety of hum<strong>and</strong>iseases <strong>and</strong> as a source of natural pesticides. Scientistsgoing into nature to find promising natural chemicalsare called bioprospectors. You might consider a careerdoing this fascinating work.Many bad-tasting, bad-smelling, toxic, or stingingprey species have evolved warning coloration, brightlycolored advertising that enables experienced predatorsto recognize <strong>and</strong> avoid them. They flash a warning,“Eating me is risky.” Examples are brilliantly coloredpoisonous frogs (Figure 8-9e), red-, yellow-, <strong>and</strong>black-striped coral snakes, <strong>and</strong> foul-tasting monarchbutterflies (Figure 8-9d) <strong>and</strong> grasshoppers.Based on coloration, biologist Edward O. Wilsongives us two rules for evaluating possible danger froman unknown animal species we encounter in nature.First, if it is small <strong>and</strong> strikingly beautiful, it is probablypoisonous. Second, if it is strikingly beautiful <strong>and</strong>easy to catch, it is probably deadly.Other butterfly species, such as the nonpoisonousviceroy (Figure 8-9f), gain some protection by looking<strong>and</strong> acting like the monarch, a protective deviceknown as mimicry. The harmless mountain king snakeavoids predation by looking like the deadly <strong>and</strong> brilliantlycolored coral snake.Some prey species use behavioral strategies to avoidpredation. Some attempt to scare off predators by puffingup (blowfish), spreading their wings (peacocks), ormimicking a predator (Figure 8-9h). Some moths havewings that look like the eyes of much larger animals(Figure 8-9g). Other prey species gain some protectionby living in large groups (schools of fish, herds of antelope,flocks of birds).Disease-carrying bacteria <strong>and</strong> fungi also attackspecies. Animals such as ants that live in complexsocial societies containing millions to trillions of individualssurvive onslaughts by harmful infectiousbacteria <strong>and</strong> fungi by evolving gl<strong>and</strong>s that secrete antibiotics<strong>and</strong> antifungals. Indeed, because of these secretions,the outer surface of an ant is almost free ofbacteria <strong>and</strong> fungi <strong>and</strong> is much cleaner than most humanskin. The ecological lessons from ants are simple<strong>and</strong> powerful. In a world ruled by bacteria, never betagainst the bacteria <strong>and</strong> always rely on a variety ofweapons!Some biologists have begun exploring the use ofantibiotics produced by ants to treat human infectiousdiseases. So far two antibiotic patents have been filedbased on studying ants, <strong>and</strong> there are more to come.You might consider a career in this research frontier.8-4 SPECIES INTERACTIONS:PARASITISM, MUTUALISM,AND COMMENSALISMWhat Are Parasites, <strong>and</strong> Why Are TheyImportant? Living On or In Another SpeciesAlthough parasites can harm their host organismsthey can promote community biodiversity.Parasitism occurs when one species (the parasite) feedson part of another organism (the host), usually by livingon or in the host. In this relationship, the parasitebenefits <strong>and</strong> the host is harmed.Parasitism can be viewed as a special form of predation.But unlike a conventional predator, a parasiteusually is much smaller than its host (prey) <strong>and</strong> rarelykills its host. Also most parasites remain closely associatedwith, draw nourishment from, <strong>and</strong> may graduallyweaken their hosts over time.Tapeworms, disease-causing microorganisms, <strong>and</strong>other parasites live inside their hosts. Other parasitesattach themselves to the outside of their hosts. Examplesare ticks, fleas, mosquitoes, mistletoe plants, <strong>and</strong>fungi that cause diseases such as athlete’s foot. Someparasites move from one host to another, as fleas <strong>and</strong>ticks do; others, such as tapeworms, spend their adultlives with a single host.Some parasites have little contact with their host.For example, in North America cowbirds parasitize ortake over the nests of other birds by laying their eggs inthem <strong>and</strong> then letting the host birds raise their young.From the host’s point of view, parasites are harmful,but parasites play important ecological roles. Collectively,the matrix of parasitic relationships in a communityacts somewhat like glue that helps hold thevarious species in a community together. Parasitesalso promote biodiversity by helping keep some speciesfrom becoming so plentiful that they eliminateother species.How Do Species Interact So That Both SpeciesBenefit? Win-Win RelationshipsPollination, fungi that help plant roots take up nutrients,<strong>and</strong> bacteria in your gut that help digest yourfood are examples of species interactions that benefitboth species.In mutualism, two species interact in a way that benefitsboth. The pollination mutualism between floweringplants <strong>and</strong> animals such as insects, birds, <strong>and</strong> bats isone of the most common forms of mutualism.Some species benefit from nutritional mutualism.Lichens, hardy species that can grow on trees or barrenrocks, consist of colorful photosynthetic algae <strong>and</strong>chlorophyll-lacking fungi living together. The fungiprovide a home for the algae, <strong>and</strong> their bodies collect154 CHAPTER 8 Community Ecology
<strong>and</strong> hold moisture <strong>and</strong> mineral nutrients used by bothspecies. The algae, through photosynthesis, providesugars as food for themselves <strong>and</strong> the fungi.A mutualistic relationship that combines nutrition<strong>and</strong> protection is birds that ride on the backs of largeanimals like African buffalo, elephants, <strong>and</strong> rhinoceroses(Figure 8-10a). The birds remove <strong>and</strong> eat parasitesfrom the animal’s body <strong>and</strong> often make noises warningthe animal when predators approach.Another example is clownfish species, which livewithin sea anemones, whose tentacles sting <strong>and</strong> paralyzemost fish that touch them (Figure 8-10b). Theclownfish, which are not harmed by the tentacles, gainprotection from predators <strong>and</strong> feed on the detritus leftfrom the meals of the anemones. The sea anemonesbenefit because the clownfish protect them from someof their predators.Another example of nutritional mutualism is thehighly specialized fungi that combine with plant rootsto form mycorrhizae (from the Greek words for fungus<strong>and</strong> roots). The fungi get nutrition from the plant’sroots. In turn the fungi benefit the plant by using theirmyriad networks of hairlike extensions to improve theplant’s ability to extract nutrients <strong>and</strong> water from thesoil (Figure 8-10c).In gut inhabitant mutualism, vast armies of organismssuch as bacteria live in an animal’s digestive tract.The bacteria receive a sheltered habitat <strong>and</strong> food fromtheir host. In turn, they help break down (digest) theirhost’s food. Examples are the bacteria inside a termite’sgut that digest wood or cellulose <strong>and</strong> providethe termite with food. Similarly, bacteria in your guthelp digest the food you eat. Thank these little crittersfor helping keep you alive.(a) Oxpeckers <strong>and</strong> black rhinoceros(b) Clownfish <strong>and</strong> sea anemone(c) Mycorrhizae fungi on juniper seedlingsin normal soil(d) Lack of mycorrhizae fungi on juniperseedlings in sterilized soilFigure 8-10 Examples of mutualism. (a) Oxpeckers (or tickbirds) feed on <strong>and</strong> remove parasitic ticksthat infest large thick-skinned animals such as a black rhinoceros. (b) A clownfish gains protection <strong>and</strong>food by living among deadly stinging sea anemones <strong>and</strong> helps protect the anemones from some oftheir predators. (c) Beneficial effects of mycorrhizal fungi attached to roots of juniper seedlings on plantgrowth compared to (d) growth of such seedlings in sterilized soil without mycorrhizal fungi.http://biology.brookscole.com/miller14155
It is tempting to think of mutualism as an exampleof cooperation between species, but actually it involveseach species benefiting by exploiting the other.How Do Species Interact So That One Benefitsbut the Other Is Not Harmed? Do No HarmSome species interact in a way that helps one speciesbut has little if any effect on the other.Commensalism is a species interaction that benefitsone species but has little, if any, effect on the otherspecies. One example is a redwood sorrel, a small herb.It benefits from growing in the shade of tall redwoodtrees, with no known negative effects on the redwoodtrees.Another example is plants called epiphytes (such assome types of orchids <strong>and</strong> bromeliads) that attachthemselves to the trunks or branches of large trees intropical <strong>and</strong> subtropical forests. These so-called airplants benefit by having a solid base on which to grow.They also live in an elevated spot that gives them betteraccess to sunlight, water from the humid air <strong>and</strong>rain, <strong>and</strong> nutrients falling from the tree’s upper leaves<strong>and</strong> limbs. This apparently does not harm the tree.8-5 ECOLOGICAL SUCCESSION:COMMUNITIES IN TRANSITIONHow Do Ecosystems Respond to Change?Shifting Community CompositionOver time new environmental conditions can causechanges in community structure that lead to onegroup of species being replaced by other groups.All communities change their structure <strong>and</strong> compositionover time in response to changing environmentalconditions. The gradual change in species compositionof a given area is called ecological succession. Duringsuccession some species colonize an area <strong>and</strong> theirpopulations become more numerous, whereas populationsof other species decline <strong>and</strong> may even disappear.Ecologists recognize two types of ecological succession,depending on the conditions present at the beginningof the process. One is primary succession,which involves the gradual establishment of bioticcommunities on nearly lifeless ground. With the other,more common type, called secondary succession, bioticcommunities are established in an area wheresome type of biotic community is already present.What Is Primary Succession? Establishing Lifeon Lifeless GroundOver long periods, a series of communities with differentspecies can develop in lifeless areas where thereis no soil or bottom sediment.Primary succession begins with an essentially lifelessarea where there is no soil in a terrestrial ecosystem(Figure 8-11) or no bottom sediment in an aquaticecosystem. Examples include bare rock exposed by aretreating glacier or severe soil erosion, newly cooledlava, an ab<strong>and</strong>oned highway or parking lot, or a newlycreated shallow pond.Primary succession usually takes an extremelylong time. One reason is that before a community canbecome established on l<strong>and</strong>, there must be soil. Dependingmostly on the climate, it takes natural processesseveral hundred to several thous<strong>and</strong> years toproduce fertile soil.Soil formation begins when hardy pioneer speciesattach themselves to inhospitable patches of bare rock.Examples are wind-dispersed lichens <strong>and</strong> mosses,which can withst<strong>and</strong> the lack of moisture <strong>and</strong> soil nutrients<strong>and</strong> hot <strong>and</strong> cold temperature extremes foundin such habitats.These tough species start the soil formationprocess on patches of bare rock by trapping windblownsoil particles <strong>and</strong> tiny pieces of detritus, producingtiny bits of organic matter, <strong>and</strong> secreting mildacids that slowly fragment <strong>and</strong> break down the rock.This chemical breakdown (weathering) is hastened byphysical weathering such as the fragmentation of rockthat occurs when water freezes in cracks <strong>and</strong> exp<strong>and</strong>s.This is a slow process. It may take a lichen 100 years togrow as large as a dinner plate.As patches of soil build up <strong>and</strong> spread, a newplant community replaces the community of lichens<strong>and</strong> mosses. Most of these plants are tiny annuals thatlive for only a year. However, they produce flowers<strong>and</strong> seeds that fall to the ground <strong>and</strong> can germinate forthe following growing season. These taller plants eliminatethe lichens by depriving them of sunlight.Acommunity of small perennial grasses (plants thatlive for more than 2 years without having to reseed)<strong>and</strong> herbs or ferns normally replaces the annual plantcommunity. The seeds of these plants germinate afterarriving on the wind <strong>and</strong> in the rain, in the droppingsof birds, or on the coats of mammals.These early successional plant species growclose to the ground, can establish large populationsquickly under harsh conditions, <strong>and</strong> have short lives.Some of their roots penetrate the rock <strong>and</strong> help breakit up into more soil particles. The decay of theirwastes <strong>and</strong> dead bodies also adds more nutrients tothe soil.After hundreds to a thous<strong>and</strong> or more years, thesoil may be deep <strong>and</strong> fertile enough to store enoughmoisture <strong>and</strong> nutrients to support the growth of lesshardy midsuccessional plant species of herbs, grasses,<strong>and</strong> low shrubs. Trees that need lots of sunlight <strong>and</strong> areadapted to the area’s climate <strong>and</strong> soil usually replacethese species.156 CHAPTER 8 Community Ecology
Figure 8-11 Natural capital: starting from ground zero.Primary ecological succession over several hundred years ofplant communities on bare rock exposed by a retreating glacieron Isle Royal, Michigan, an isl<strong>and</strong> in Lake Superior.ExposedrocksLichens<strong>and</strong> mossesSmall herbs<strong>and</strong> shrubsHeath matJack pine,black spruce,<strong>and</strong> aspenBalsam fir,paper birch, <strong>and</strong>white spruceforest communityTimeAs these tree species grow <strong>and</strong> create shade, theyare replaced by late successional plant species(mostly trees) that can tolerate shade. Unless fire,flooding, severe erosion, tree cutting, climate change,or other natural or human processes disturb the area,what was once bare rock becomes a complex forestcommunity.Primary succession can also take place in newlycreated small ponds as a result of an influx of sediments<strong>and</strong> nutrients in runoff from the surroundingl<strong>and</strong>. This sediment can support seeds or spores ofplants reaching the pond by winds, birds, or other animals.Over time this process can transform the pondfirst into a marsh <strong>and</strong> eventually to dry l<strong>and</strong>.What Is Secondary Succession? Life Buildingon LifeA series of communities with different species c<strong>and</strong>evelop in places containing some soil or bottomsediment.Secondary succession begins in an area where the naturalcommunity of organisms has been disturbed, removed,or destroyed but some soil or bottom sedimentremains. Compared to primary succession this is life inthe fast lane. C<strong>and</strong>idates for secondary succession includeab<strong>and</strong>oned farml<strong>and</strong>s, burned or cut forests, heavilypolluted streams, <strong>and</strong> l<strong>and</strong> that has been dammed orflooded. Because some soil or sediment is present, newvegetation can usually begin to germinate within a fewweeks. Seeds can be present in soils, or they can be carriedfrom nearby plants by wind or by birds <strong>and</strong> otheranimals.European settlers cleared the mature native oak<strong>and</strong> hickory forests <strong>and</strong> planted the l<strong>and</strong> with crops inthe central or Piedmont region of North Carolina. Laterthey ab<strong>and</strong>oned some of this farml<strong>and</strong> because of erosion<strong>and</strong> loss of soil nutrients. Figure 8-12 (p. 158) showsone way that such ab<strong>and</strong>oned farml<strong>and</strong> has undergonesecondary succession over 150–200 years.Descriptions of ecological succession usually focuson changes in vegetation. But these changes inturn affect food <strong>and</strong> shelter for various types of animals.Thus as succession proceeds, the numbers <strong>and</strong>types of animals <strong>and</strong> decomposers also change.As we have seen, primary <strong>and</strong> secondary successioninvolve changes in community structure. Thus thevarious stages of succession have different patterns ofspecies diversity, trophic structure, niches, nutrient cycling,<strong>and</strong> energy flow <strong>and</strong> efficiency (Table 8-1, p. 158).http://biology.brookscole.com/miller14157
How Do Species Replace One Another inEcological Succession? Creating Beneficial<strong>and</strong> Hostile ConditionsSome species create conditions that favor the speciesthat replace them; some create conditions that hindertheir replacements; <strong>and</strong> some get along with the nextgroup of species.Ecologists have identified three factors that affect how<strong>and</strong> at what rate succession occurs. One is facilitation,in which one set of species makes an area suitable forspecies with different niche requirements. For example,as lichens <strong>and</strong> mosses gradually build up soil on arock in primary succession, herbs <strong>and</strong> grasses can colonizethe site. Similarly, plants such as legumes add nitrogento the soil, making it more suitable for otherplants found at later stages of succession.A second factor is inhibition, in which early specieshinder the establishment <strong>and</strong> growth of other species.Inhibition often occurs when plants release toxicchemicals that reduce competition from other plants.Succession then can proceed only when a fire, bulldozer,or other human or natural disturbance removesmost of the inhibiting species.A third factor is tolerance, in which late successionalplants are largely unaffected by plants at earlierstages of succession. Tolerance may explain why latesuccessional plants can thrive in mature communitieswithout eliminating some early successional <strong>and</strong> midsuccessionalplants.How Do Disturbances Affect Succession<strong>and</strong> Species Diversity? Setting Back theCommunity ClockChanges in environmental conditions that disrupta community can set back succession.A disturbance is a change in environmental conditionsthat disrupts a community or ecosystem. Examples arefire, drought, flooding, mining, clear-cutting a forest,plowing a grassl<strong>and</strong>, applying pesticides, climatechange, <strong>and</strong> invasion by nonnative species. <strong>Environmental</strong>disturbances can range from catastrophic tomild <strong>and</strong> can be caused by natural changes or humanactivities. At any time during primary or secondarysuccession, such disturbances can convert a particularstage of succession to an earlier stage.Many people think of all environmental disturbancesas harmful. Large catastrophic disturbancescan devastate communities <strong>and</strong> ecosystems. But manyecologists contend that in the long run some types ofdisturbances, even catastrophic ones such as fires <strong>and</strong>hurricanes, can be beneficial for the species diversityof some communities. Such disturbances create newconditions that can discourage or eliminate somespecies but encourage others by releasing nutrients<strong>and</strong> creating unfilled niches.For example, when a large tree falls in a tropicalforest, this local disturbance increases sunlight <strong>and</strong> nutrientsfor growth of plants in the understory. When alog hits a rock in an intertidal zone, it dislodges or killsmany of the organisms that are growing on the rock<strong>and</strong> provides space for colonization by new intertidalorganisms.According to the intermediate disturbance hypothesis,communities that experience fairly frequent butmoderate disturbances have the greatest species diversity.Researchers hypothesize that in such communities,moderate disturbances are large enough to createopenings for colonizing species in disturbed areas butmild <strong>and</strong> infrequent enough to allow the survival ofsome mature species in undisturbed areas. Some fieldexperiments support this hypothesis, but the scientificjury is still out on whether it applies to all types ofcommunities.Does Succession Proceed along an ExpectedPath, <strong>and</strong> Is Nature in Balance? Things AreAlways ChangingScientists cannot project the course of a given successionor view it as preordained progress toward astable climax community that is in balance with itsenvironment.We may be tempted to conclude that ecological successionis an orderly sequence in which each stage leadsautomatically to the next, more stable stage. Accordingto this classic view, succession proceeds along an expectedpath until a certain stable type of climax communityoccupies an area. Such a community is dominatedby a few long-lived plant species <strong>and</strong> is in balancewith its environment. This equilibrium model of successionis what ecologists meant years ago when theytalked about the balance of nature.Over the last several decades, many ecologistshave changed their views about balance <strong>and</strong> equilibriumin nature. When these ecologists look at a communityor ecosystem, such as a young forest, they seecontinuous change <strong>and</strong> instability instead of equilibrium<strong>and</strong> stability.Under the old balance-of-nature view, a large terrestrialcommunity undergoing succession eventuallybecame covered with an expected type of climax vegetation.But a close look at almost any community revealsthat it consists of an ever-changing mosaic ofvegetation patches at various stages of succession.These patches result from a variety of mostly unexpectedsmall <strong>and</strong> medium-sized disturbances.Such research indicates that we cannot project thecourse of a given succession or view it as preordained progresstoward an ideally adapted climax community. Rather, successionreflects the ongoing struggle by differentspecies for enough light, nutrients, food, <strong>and</strong> space.This allows each to survive <strong>and</strong> gain reproductivehttp://biology.brookscole.com/miller14159
advantages over other species by occupying as much ofits fundamental niche as possible.This change in the way we view what is happeningin nature explains why a growing number of ecologistsprefer terms such as biotic change instead ofsuccession—which implies an ordered <strong>and</strong> expected sequenceof changes. Many ecologists have also replacedthe term climax community with terms such as maturecommunity or a mosaic of vegetation patches at variousstages of succession.8-6 ECOLOGICAL STABILITY,COMPLEXITY, AND SUSTAINABILITYWhat Is Stability? Long-Term <strong>Sustainability</strong>through Continuous ChangeLiving systems maintain some degree of stability orsustainability through constant change in response tochanging environmental conditions.All systems from a cell to the biosphere are constantlychanging in response to changing environmental conditions.Continents move, the climate changes, <strong>and</strong>disturbances <strong>and</strong> succession change the compositionof communities. Even without human actions, ecologicalcommunities have always faced change.So how do living organisms, communities, ecosystems,<strong>and</strong> the biosphere face changes <strong>and</strong> survive? Allliving systems, from single-celled organisms to thebiosphere, contain complex networks of negative <strong>and</strong>positive feedback loops that interact to provide somedegree of stability or sustainability over each system’sexpected life span.This stability is maintained only by constantchange in response to changing environmental conditions.For example, in a mature tropical rain forest,some trees die <strong>and</strong> others take their places. However,unless the forest is cut, burned, or otherwise destroyed,you would still recognize it as a tropical rainforest 50 or 100 years from now.It is useful to distinguish among three aspects ofstability or sustainability in living systems. One is inertia,or persistence: the ability of a living system toresist being disturbed or altered. A second is constancy:the ability of a living system such as a populationto keep its numbers within the limits imposed byavailable resources. A third factor is resilience: theability of a living system to repair damage after an externaldisturbance that is not too drastic.Does Ecological Complexity IncreaseEcological Stability? Mixed ResultsHaving many different species can provide someecological stability or sustainability for communities,but we do not know whether this applies to allcommunities nor the minimum number of speciesneeded for such stability.In ecological terms, complexity refers to the number ofspecies in a community (species richness) at eachtrophic level <strong>and</strong> the number of trophic levels ina community. It is one measure of a community’sbiodiversity.In the 1960s, most ecologists believed the greaterthe species diversity <strong>and</strong> the accompanying web offeeding <strong>and</strong> biotic interactions in an ecosystem, thegreater its stability. According to this hypothesis, acomplex <strong>and</strong> biodiverse community with a diversityof species <strong>and</strong> feeding paths has more ways to respondto most environmental stresses because it does nothave “all its eggs in one basket.” This is a useful hypothesis,but recent research has found exceptions tothis intuitively appealing idea.Because no community can function withoutsome producers <strong>and</strong> decomposers, there is a minimumthreshold of species diversity below which communities<strong>and</strong> ecosystems cannot function. Beyondthis, it is difficult to know whether simple communitiesare less stable than complex <strong>and</strong> biodiverse onesor to identify the threshold of species diversity neededto maintain community stability. Recent research byecologist David Tilman <strong>and</strong> others suggests that communitieswith more species tend to have a higher netprimary productivity <strong>and</strong> can be more resilient thansimpler ones.Many studies support the idea that some level ofbiodiversity provides insurance against catastrophe.But how much biodiversity is needed in various communitiesremains uncertain. For example, some recentresearch suggests that the average annual netprimary productivity of an ecosystem reaches a peakwith 10–40 producer species. Many ecosystems containmore producer species than this, but it is difficultto distinguish among those that are essential <strong>and</strong>those that are not. We need much more of this type ofresearch.Part of the problem is that ecologists disagree onhow to define stability. Does an ecosystem need bothhigh inertia <strong>and</strong> high resilience to be considered stable?Evidence suggests that some ecosystems have oneof these properties but not the other. For example,tropical rain forests have high species diversity <strong>and</strong>high inertia; that is, they are resistant to significant alterationor destruction.However, once a large tract of tropical forest is severelydegraded, the community’s resilience sometimesis so low that the forest may not be restored. Nutrients(which are stored primarily in the vegetation,not in the soil), <strong>and</strong> other factors needed for recoverymay no longer be present. Such a large-scale loss offorest cover may also change the local or regional climateso that forests can no longer be supported.160 CHAPTER 8 Community Ecology
By contrast, grassl<strong>and</strong>s are much less diverse thanmost forests <strong>and</strong> have low inertia because they burneasily. However, because most of their plant matter isstored in underground roots, these ecosystems havehigh resilience <strong>and</strong> recover quickly. Grassl<strong>and</strong> can bedestroyed only if its roots are plowed up <strong>and</strong> somethingelse is planted in its place, or if it is severelyovergrazed by livestock or other herbivores. Bad news.We have been doing both of these things in somegrassl<strong>and</strong> areas for many decades.Another difficulty is that populations, communities,<strong>and</strong> ecosystems are rarely, if ever, at equilibrium.Instead, nature is in a continuing state of disturbance,fluctuation, <strong>and</strong> change.Why Should We Bother to ProtectNatural Systems? The PrecautionaryPrincipleSometimes we should take precautionary measures toprevent serious harm even if some of the cause-<strong>and</strong>effectrelationships have not been established.Some developers argue that if biodiversity does notnecessarily lead to increased ecological stability, thereis no point in trying to preserve <strong>and</strong> manage oldgrowthforests <strong>and</strong> other ecosystems. They concludethat we should cut down diverse old-growth forests,use the timber resources, <strong>and</strong> replace the forests withtree plantations of single tree species. Furthermore,they say, we should convert most of the world’s grassl<strong>and</strong>sto crop fields, drain <strong>and</strong> develop inl<strong>and</strong> wetl<strong>and</strong>s,dump our toxic <strong>and</strong> radioactive wastes into thedeep ocean, <strong>and</strong> not worry about the premature extinctionof species.Ecologists point out that just because a system isnot in equilibrium or balance does not mean that itcannot suffer from environmental degradation. Theypoint to overwhelming evidence that human disturbancesare disrupting some of the ecosystem servicesthat support <strong>and</strong> sustain all life <strong>and</strong> all economies.They contend that our ignorance about the effects ofour actions means we need to use great caution inmaking potentially harmful changes to communities<strong>and</strong> ecosystems on the fairly short-term time framethat concerns us.As an analogy, we know that eating too much ofcertain types of foods <strong>and</strong> not getting enough exercisecan greatly increase our chances of a heart attack, diabetes,<strong>and</strong> other disorders. But the exact connectionsbetween these health problems, chemicals in variousfoods, exercise, <strong>and</strong> genetics are still under study <strong>and</strong>often debated. We could use this uncertainty <strong>and</strong> unpredictabilityas an excuse to continue overeating <strong>and</strong>not exercising. But the wise course is to eat better <strong>and</strong>exercise more to help prevent potentially serious healthproblems.This approach is based on the precautionary principle:When there is evidence that a human activitycan harm our health or bring about changes in environmentalconditions that can affect our economies orquality of life, we should take measures to preventharm even if some of the cause-<strong>and</strong>-effect relationshipshave not been fully established scientifically. It isbased on the commonsense idea behind many adagessuch as “Better safe than sorry,” “Look before youleap,” “First, do no harm,” <strong>and</strong> “Slow down for speedbumps.”The precautionary principle makes sense, but itcan be taken too far. If we do not take some risks, wewould never learn much or discover what works <strong>and</strong>what does not.The message is that we should take some risks butalways think carefully about the possible short- <strong>and</strong>long-term expected <strong>and</strong> unintended effects (Figure 3-4,p. 38). Using the precautionary principle comes inwhen the potential risks seem too great or we have littleinformation about the possible risks. Then it is timeto step back, think about what we are doing, <strong>and</strong> domore research.In this chapter we have seen how interactionsamong organisms in a community determine theirabundances <strong>and</strong> distributions. Such interactions alsoserve as agents of natural selection on one anotherthrough coevolution. They also have significant effectson the structure <strong>and</strong> function of the ecosystems inwhich these organisms live. Everything is connected.No part of the world is what it was before there were humans.LAWRENCE B. SLOBODKINCRITICAL THINKING1. How would you respond to someone who claims it isnot important to protect areas of temperate <strong>and</strong> polarbiomes because most of the world’s biodiversity is in thetropics?2. Why is the species diversity of a large isl<strong>and</strong> usuallyhigher than that on a smaller isl<strong>and</strong>?3. Why are predators generally less abundant than theirprey?4. What would you do if large numbers of cockroachesinvaded your home? See whether you can come up withan ecological rather than a chemical (pesticide) approachto this problem.5. How would you determine whether a particularspecies found in a given area is a keystone species?6. Describe how evolution can affect predator–preyrelationships.7. How would you reply to someone who argues that(a) we should not worry about our effects on natural systemsbecause succession will heal the wounds of humanhttp://biology.brookscole.com/miller14161
activities <strong>and</strong> restore the balance of nature, (b) effortsto preserve natural systems are not worthwhile becausenature is largely unpredictable, <strong>and</strong> (c) because there isno balance in nature we should cut down diverse oldgrowthforests <strong>and</strong> replace them with tree plantations?8. Suppose a hurricane blows down most of the treesin a forest. Timber company officials offer to salvage thefallen trees <strong>and</strong> plant a tree plantation to reduce thechances of fire <strong>and</strong> to improve the area’s appearance,with an agreement that they can harvest the trees whenthey reach maturity <strong>and</strong> plant another tree plantation.Others argue that the damaged forest should be leftalone because hurricanes <strong>and</strong> other natural events arepart of nature, <strong>and</strong> the dead trees will serve as a sourceof nutrients for natural recovery through ecologicalsuccession. What do you think should be done, <strong>and</strong>why?9. Congratulations! You are in charge of the world. Whatare the three most important features of your plan to helpsustain the earth’s biological communities?PROJECTS1. Make field studies, consult research papers, <strong>and</strong> interviewpeople to identify <strong>and</strong> evaluate (a) the effects of thedeliberate introduction of a beneficial nonnative speciesinto the area where you live <strong>and</strong> (b) the effects of the deliberateor accidental introduction of a harmful nonnativespecies into the area where you live.2. Use the library or Internet to find <strong>and</strong> describe twospecies not discussed in this textbook that are engaged in(a) a commensalistic interaction, (b) a mutualistic interaction,<strong>and</strong> (c) a parasite–host relationship.3. Visit a nearby natural area <strong>and</strong> identify examples of(a) mutualism <strong>and</strong> (b) resource partitioning.4. Use the library or Internet to identify the parasiteslikely to be found in your body.5. Visit a nearby l<strong>and</strong> area such as a partially cleared orburned forest or grassl<strong>and</strong> or an ab<strong>and</strong>oned crop field<strong>and</strong> record signs of secondary ecological succession.Study the area carefully to see whether you can findpatches that are at different stages of succession becauseof various disturbances.6. Use the library or the Internet to find bibliographicinformation about George Perkins Marsh <strong>and</strong> Lawrence B.Slobodkin, whose quotes appear at the beginning <strong>and</strong> endof this chapter.7. Make a concept map of this chapter’s major ideas, usingthe section heads, subheads, <strong>and</strong> key terms (in boldface).Look on the website for this book for informationabout making concept maps.LEARNING ONLINEThe website for this book contains study aids <strong>and</strong> manyideas for further reading <strong>and</strong> research. They include achapter summary, review questions for the entire chapter,flash cards for key terms <strong>and</strong> concepts, a multiple-choicepractice quiz, interesting Internet sites, references, <strong>and</strong> aguide for accessing thous<strong>and</strong>s of InfoTrac ® College Editionarticles. Log on tohttp://biology.brookscole.com/miller14Then click on the Chapter-by-Chapter area, choose Chapter8, <strong>and</strong> select a learning resource.162 CHAPTER 8 Community Ecology
9Population EcologyPopulationControlCASE STUDYSea Otters: Are They Backfrom the Brink of Extinction?Southern sea otters (Figure 9-1a) live in kelp forests(Figure 9-1c) in shallow waters along much of thePacific coast of North America. Most remaining membersof this species are found between California’scoastal cities of Santa Cruz <strong>and</strong> Los Angeles.These tool-using marine mammals use stones topry shellfish off rocks underwater <strong>and</strong> to break openthe shells while swimming on their backs <strong>and</strong> usingtheir bellies as a table. Each day a sea otter consumesabout a fourth of its weight in sea urchins (Figure 9-1b),clams, mussels, crabs, abalone, <strong>and</strong> about 40 otherspecies of bottom-dwelling organisms.Before European settlers arrived, about 1 millionsouthern sea otters lived along the Pacific coastline ofNorth America. By the early 1900s, the species was almostextinct because of overhunting for their thick<strong>and</strong> luxurious fur <strong>and</strong> because they competed withfishers for valuable abalone fish.Good news. Between 1938 <strong>and</strong> 2003 the populationof southern sea otters off California’s coast increasedfrom about 300 to 2,800. This partial recovery washelped when in 1977 the U.S. Fish <strong>and</strong> Wildlife Servicedeclared the species endangered.Why should we care about this species? One reasonis that people love to look at these charismatic,cute, <strong>and</strong> cuddly animals as they play in the water.Anoher reason is biologists classify them as keystonespecies that help keep sea urchins <strong>and</strong> other kelpeatingspecies from depleting kelp forests in offshorecoastal waters. The third reason is ethical. Some peoplebelieve it is wrong to cause their premature extinction.Why should we worry about preventing the lossof kelp forests? One reason is that they provide food,shelter, <strong>and</strong> protection for a variety of aquatic species.They also help reduce shore erosion <strong>and</strong> lessen theimpact of storm waves on coastlines.Wherever southern sea otters have returned orhave been reintroduced, formerly deforested kelpareas recover within a few years <strong>and</strong> fish populationsincrease. This pleases biologists. But it upsets manycommercial <strong>and</strong> recreational fishers, who argue thatsea otters consume too many shellfish <strong>and</strong> dwindlingstocks of abalone.In 2003, the U.S. Fish <strong>and</strong> Wildlife Service publishedits recovery plan for the southern sea otter. Itrecommends reducing oil spills, ocean pollutants, <strong>and</strong>entanglements with fishing gear <strong>and</strong> boat motors. Italso calls for more research to determine why ottershave not recovered more fully after being named athreatened species in 1977. The plan says that the seaotter population would have to reach about 8,400 animalsbefore it can be removed from the endangeredspecies list.Studying the population dynamics of southernsea otter populations <strong>and</strong> their interactions with otherspecies has helped us to better underst<strong>and</strong> the ecologicalimportance of this keystone species. Populationdynamics <strong>and</strong> some basic ecological lessons are the subjectsof this chapter.(a) Southern sea otter(b) Sea urchin(c) Kelp bedFigure 9-1 Three of the species found in a kelp forest ecosystem. People visiting kelp forests marvel at theirbeauty <strong>and</strong> biodiversity. But old-timers say “You should have seen them before we started simplifying <strong>and</strong>degrading them.”
In looking at nature ... never forget that every single organicbeing around us may be said to be striving to increase itsnumbers.CHARLES DARWIN, 1859This chapter addresses the following questions:■■■■■How do populations change in size, density,makeup, <strong>and</strong> distribution in response to environmentalstress?How do species differ in their reproductivepatterns?What role does genetics play in the size <strong>and</strong> survivalof a population?What are the major impacts of human activitieson populations, communities, <strong>and</strong> ecosystems?What lessons can we learn from ecology aboutliving more sustainably?9-1 POPULATION DYNAMICSAND CARRYING CAPACITYWhat Are the Major Characteristics of aPopulation? Changing <strong>and</strong> ClumpingPopulations change in size, density, <strong>and</strong> age distribution,<strong>and</strong> most members of populations livetogether in clumps or groups.Population dynamics is a study of how populationschange in size (total number of individuals), density(number of individuals in a certain space), <strong>and</strong> age distribution(the proportion of individuals of each age in apopulation) in response to changes in environmentalconditions.Populations can also change in how they are distributedin their habitat. Three general patterns of populationdistribution or dispersion in a habitat are clumping,uniform dispersion, <strong>and</strong> r<strong>and</strong>om dispersion (Figure 9-2).The populations of most species live in clumps orgroups (Figure 9-2a). Examples are patches of vegetation,cottonwood trees clustered along streams, wolfpacks, flocks of geese, <strong>and</strong> schools of fish. Viewedfrom above, most of the world’s l<strong>and</strong>scapes are patchywith clumps of various plant <strong>and</strong> animal speciesfound here <strong>and</strong> there. The same thing is found whenwe view the underwater world <strong>and</strong> the soil beneathour feet.Why clumping? Four reasons. First, the resourcesa species needs vary greatly in availability from placeto place. Second, living in herds, flocks, <strong>and</strong> schools canprovide better protection from predators. Third, livingin packs gives some predator species such as wolves abetter chance of getting a meal. Fourth, some animalspecies form temporary groups for mating <strong>and</strong> caringfor their young.Some species maintain a fairly constant distancebetween individuals. By having this patter creosotebushes in a desert (Figure 9-2b) have better access toscarce water resources. Organisms with a r<strong>and</strong>om distribution(Figure 9-2c) are fairly rare. The world ismostly clumpy.What Factors Govern Changes in PopulationSize? Entrances <strong>and</strong> Exits on the Global StagePopulations increase through births <strong>and</strong> immigration<strong>and</strong> decrease through deaths <strong>and</strong> emigration.Four variables—births, deaths, immigration, <strong>and</strong> emigration—governchanges in population size. A populationincreases by birth <strong>and</strong> immigration <strong>and</strong> decreases bydeath <strong>and</strong> emigration:Populationchange (Births Immigration) (Deaths Emigration)These variables depend on changes in resource availability<strong>and</strong> other environmental changes (Figure 9-3).A population’s age structure can have a strong effecton how rapidly its size increases or decreases. Agestructures are usually described in terms of organismsthat are not mature enough to reproduce (the prereproductivestage), those that are capable of reproduction(the reproductive stage), <strong>and</strong> those that are too old to reproduce(the postreproductive stage).Figure 9-2 Generalized dispersionpatterns for individualsin a population throughouttheir habitat. The mostcommon pattern is clumpsof members of a populationthroughout their habitat,mostly because resourcesare usually found inpatches.(a) Clumped (elephants)(b) Uniform (creosote bush) (c)R<strong>and</strong>om (d<strong>and</strong>elions)164 CHAPTER 9 Population Ecology
The size of a population that includes a large proportionof young organisms in their reproductivestage or that will soon enter this stage is likely to increase.In contrast, the size of a population dominatedby individuals past their reproductive stage is likely todecrease. The size of a population with a fairly evendistribution between these three stages will likely remainstable because the reproduction by younger individualswill be roughly balanced by the deaths ofolder individuals.What Limits Population Growth? Resources<strong>and</strong> CompetitorsNo population can grow indefinitely becauseresources such as light, water, <strong>and</strong> nutrients arelimited <strong>and</strong> because of the presence of competitorsor predators.Populations vary in their capacity for growth, alsoknown as the biotic potential of a population. The intrinsicrate of increase (r) is the rate at which a popula-0Growth factors(biotic potential)AbioticFavorable lightFavorable temperatureFavorable chemical environment(optimal level of critical nutrients)POPULATIONSIZEDecrease factors(environmental resistance)AbioticToo much or too little lightTemperature too high or too lowUnfavorable chemical environment(too much or too little of critical nutrients)tion would grow if it had unlimited resources. Mostpopulations grow at a rate slower than this maximum.Individuals in populations with a high rate ofgrowth typically reproduce early in life, have short generationtimes (the time between successive generations),can reproduce many times (have a long reproductivelife), <strong>and</strong> have many offspring each time they reproduce.Some species have an astounding biotic potential.Without any controls on population growth, the descendantsof a single female housefly could totalabout 5.6 trillion houseflies within about 13 months. Ifthis exponential growth kept up, within a few yearsthere would be enough houseflies to cover the earth’sentire surface!Fortunately, this is not realistic because no populationcan grow indefinitely. In the real world, a rapidlygrowing population reaches some size limit imposedby a shortage of one or more limiting factors, such aslight, water, space, or nutrients, or by too many competitorsor predators. In nature there are always limits topopulation growth. This important lesson from nature isthe main message of this chapter.<strong>Environmental</strong> resistance consists of all factorsthat act to limit the growth of a population. The sizeof the population of a particular species in a givenplace <strong>and</strong> time is determined by the interplay betweenits biotic potential <strong>and</strong> environmental resistance(Figure 9-3).Together biotic potential <strong>and</strong> environmentalresistance determine the carryingcapacity (K). This is the maximum numberof individuals of a given species thatcan be sustained indefinitely in a givenspace (area or volume). Thegrowth rate of a populationdecreases as its size nears thecarrying capacity of its environmentbecause resourcessuch as food <strong>and</strong> water beginto dwindle.BioticHigh reproductive rateGeneralized nicheAdequate food supplySuitable habitatAbility to compete for resourcesAbility to hide from or defendagainst predatorsAbility to resist diseases <strong>and</strong> parasitesAbility to migrate <strong>and</strong> live in otherhabitatsAbility to adapt to environmental changeBioticLow reproductive rateSpecialized nicheInadequate food supplyUnsuitable or destroyed habitatToo many competitorsInsufficient ability to hide from or defendagainst predatorsInability to resist diseases <strong>and</strong> parasitesInability to migrate <strong>and</strong> live in otherhabitatsInability to adapt to environmental changeFigure 9-3 Ecological trade-offs:factors that tend to increase or decreasethe size of a population.Whether the size of a populationgrows, remains stable, or decreasesdepends on interactions between itsgrowth factors (biotic potential) <strong>and</strong>its decrease factors (environmentalresistance).http://biology.brookscole.com/miller14165
What Is the Difference betweenExponential <strong>and</strong> Logistic PopulationGrowth? J-Curves <strong>and</strong> S-CurvesWith ample resources a population can grow rapidly,but as resources become limited its growth rate slows<strong>and</strong> levels off.A population with few if any resource limitationsgrows exponentially. In exponential growth, a populationgrows at a fixed rate such as 1% or 2%. It starts slowly<strong>and</strong> grows faster as the population increases becausethe base size of the population is growing. Plotting thenumber of individuals against time yields a J-shapedgrowth curve (Figure 9-4, lower part of curve). Whetheran exponential growth curve looks steep or “fast” dependson the time period of observation.Logistic growth involves rapid exponential populationgrowth followed by a steady decrease in populationgrowth with time until the population sizelevels off. This occurs as the population encountersenvironmental resistance <strong>and</strong> its rate of growth decreasesas it approaches the carrying capacity of itsenvironment (Figure 9-4, top half of curve). After levelingoff, such a population typically fluctuatesslightly above <strong>and</strong> below the carrying capacity.A plot of the number of individuals against timeyields a sigmoid, or S-shaped, logistic growth curve(the whole curve in Figure 9-4). Figure 9-5 shows sucha case involving sheep on the isl<strong>and</strong> of Tasmania,south of Australia, in the early 19th century.Population size (N)Carrying capacity (K)BioticpotentialExponentialgrowthTime (t)<strong>Environmental</strong>resistanceFigure 9-4 No population can grow forever. Exponentialgrowth (lower part of the curve) occurs when resources are notlimiting <strong>and</strong> a population can grow at near its intrinsic rate ofincrease (r) or biotic potential. Such exponential growth is convertedto logistic growth, in which the growth rate decreases asthe population gets larger <strong>and</strong> faces environmental resistance.With time, the population size stabilizes at or near the carryingcapacity (K) of its environment <strong>and</strong> results in the sigmoid(S-shaped) population growth curve shown in this figure. Dependingon resource availability, the size of a population oftenfluctuates around its carrying capacity.Number of sheep (millions)2.01.51.0.5Overshoot1800 1825 1850 1875 1900 1925YearCarrying capacityFigure 9-5 Logistic growth of a sheep population on the isl<strong>and</strong>of Tasmania between 1800 <strong>and</strong> 1925. After sheep were introducedin 1800, their population grew exponentially because ofample food. By 1855, they overshot the l<strong>and</strong>’s carrying capacity.<strong>Their</strong> numbers then stabilized <strong>and</strong> fluctuated around a carryingcapacity of about 1.6 million sheep.What Happens If the Population Size Exceedsthe Carrying Capacity? DiebacksWhen a population exceeds its resource supplies,many of its members die unless they can switch tonew resources or move to an area with more resources.The populations of some species do not make asmooth transition from exponential growth to logisticgrowth. Instead they use up their resource supplies<strong>and</strong> temporarily overshoot, or exceed, the carrying capacityof their environment. This occurs because of areproductive time lag: the period needed for the birthrate to fall <strong>and</strong> the death rate to rise in response to resourceoverconsumption. Sometimes it takes a whilefor the message to get out.In such cases the population suffers a dieback, orcrash, unless the excess individuals can switch to newresources or move to an area with more resources.Such a crash occurred when reindeer were introducedonto a small isl<strong>and</strong> off the southwest coast of Alaska(Figure 9-6).Sometimes when a population exceeds the carryingcapacity of an area, it can cause damage that reducesthe area’s carrying capacity. For example, overgrazingby cattle on dry western l<strong>and</strong>s in the United States hasreduced grass cover in some areas. This has allowedsagebrush—which cattle cannot eat—to move in,thrive, <strong>and</strong> replace grasses. This reduces the l<strong>and</strong>’s carryingcapacity for cattle.Humans are not exempt from population overshoot<strong>and</strong> dieback, as shown by the tragedy on EasterIsl<strong>and</strong> (p. 32). Irel<strong>and</strong> also experienced a populationcrash after a fungus destroyed the potato crop in 1845.166 CHAPTER 9 Population Ecology
Number of reindeer2,0001,5001,0005000CarryingcapacityPopulationovershootscarryingcapacityPopulationcrashes1910 1920 1930 1940 1950YearFigure 9-6 Exponential growth, overshoot, <strong>and</strong> populationcrash of reindeer introduced to a small isl<strong>and</strong> off the southwestcoast of Alaska. When 26 reindeer (24 of them female) were introducedin 1910, lichens, mosses, <strong>and</strong> other food sourceswere plentiful. By 1935, the herd’s population had soared to2,000, overshooting the isl<strong>and</strong>’s carrying capacity. This led to apopulation crash, with the herd plummeting to only 8 reindeerby 1950.About 1 million people died, <strong>and</strong> 3 million others migratedto other countries.Technological, social, <strong>and</strong> other cultural changeshave extended the earth’s carrying capacity for humans.We have increased food production <strong>and</strong> usedlarge amounts of energy <strong>and</strong> matter resources to makenormally uninhabitable areas habitable. A criticalquestion is how long we will be able to keep doing thison a planet with a finite size <strong>and</strong> finite resources, <strong>and</strong>with a human population whose size <strong>and</strong> per capitaresource use is growing exponentially.xHOW WOULD YOU VOTE? Can we continue exp<strong>and</strong>ing theearth’s carrying capacity for humans? Cast your vote online athttp://biology.brookscole.com/miller14.How Does Population Density AffectPopulation Growth? Some Effects ofClumpingA population’s density may or may not affect howrapidly it can grow.Population density is the number of individuals in apopulation found in a particular space. Density-independentpopulation controls affect a population’s sizeregardless of its density. Such controls include floods,hurricanes, unseasonable weather, fire, habitat destruction(such as clearing a forest of its trees or fillingin a wetl<strong>and</strong>), pesticide spraying, <strong>and</strong> pollution.For example, a severe freeze in late spring can killmany individuals in a plant population, regardless ofdensity.Some factors that limit population growth have agreater effect as a population’s density increases. Examplesof such density-dependent population controls includecompetition for resources, predation, parasitism,<strong>and</strong> infectious disease.Infectious disease is a classic type of densitydependentpopulation control. An example is thebubonic plague, which swept through densely populatedEuropean cities during the 14th century. The bacteriumcausing this disease normally lives in rodents. Itwas transferred to humans by fleas that fed on infectedrodents <strong>and</strong> then bit humans. The disease spread likewildfire through crowded cities, where sanitary conditionswere poor <strong>and</strong> rats were abundant. At least25 million people in European cities died from thedisease.What Kinds of Population Change CurvesDo We Find in Nature? Variety Is the Spiceof LifePopulation sizes may stay about the same, suddenlyincrease <strong>and</strong> then decrease, vary in regular cycles, orchange erratically.In nature we find four general types of populationfluctuations: stable, irruptive, cyclic, <strong>and</strong> irregular (Figure9-7, p. 168). A species whose population size fluctuatesslightly above <strong>and</strong> below its carrying capacity issaid to have a fairly stable population size (Figures 9-5<strong>and</strong> 9-7a). Such stability is characteristic of manyspecies found in undisturbed tropical rain forests,where average temperature <strong>and</strong> rainfall vary littlefrom year to year.Some species, such as the raccoon <strong>and</strong> feral housemouse, normally have a fairly stable population. However,their population growth may occasionally explode,or irrupt, to a high peak <strong>and</strong> then crash to amore stable lower level or in some cases to a very lowlevel (Figures 9-6 <strong>and</strong> 9-7b). Many short-lived, rapidlyreproducing species such as algae <strong>and</strong> many insectshave irruptive population cycles that are linked to seasonalchanges in weather or nutrient availability. Forexample, in temperate climates, insect populationsgrow rapidly during the spring <strong>and</strong> summer <strong>and</strong> thencrash during the hard frosts of winter.The third type consists of cyclic fluctuations of populationsize over a regular time period (Figure 9-7c). Examplesare lemmings, whose populations rise <strong>and</strong> fallevery 3–4 years, <strong>and</strong> lynx <strong>and</strong> snowshoe hare, whosepopulations generally rise <strong>and</strong> fall in a 10-year cycle.Finally, some populations appear to have irregularbehavior in their changes in population size, withno recurring pattern (Figure 9-7d). Some scientistsattribute this behavior to chaos in such systems.Other scientists contend that it may be orderly behaviorwhose details <strong>and</strong> interactions are still poorlyunderstood.http://biology.brookscole.com/miller14167
Number of individuals(a) Stable(b) Irruptive(c) CyclicTime(d) IrregularFigure 9-7 General types of simplified population changecurves found in nature. (a) The population size of a species witha fairly stable population fluctuates slightly above <strong>and</strong> below itscarrying capacity. (b) The populations of some species mayoccasionally explode, or irrupt, to a high peak <strong>and</strong> then crash toa more stable lower level. (c) Other species undergo sharp increasesin their numbers, followed by crashes over fairly regulartime intervals. Predators sometimes are blamed, but the actualcauses of such boom-<strong>and</strong>-bust cycles are poorly understood.(d) The population sizes of some species change irregularly formostly unknown reasons.Do Predators Control Population Size? TheLynx–Hare CycleThe population sizes of some predators <strong>and</strong> theirprey change in cycles that appear to be caused byinteraction between the two species, but other factorsmay be involved.Some species that interact as predator <strong>and</strong> prey undergocyclic changes in their numbers: sharp increasesare followed by crashes (Figure 9-8).For decades, predation has been the explanationfor the 10-year population cycles of the snowshoe hare<strong>and</strong> its predator, the Canadian lynx. According to thistop-down control hypothesis, lynx preying on hares periodicallyreduce the hare population. The shortage ofhares then reduces the lynx population, which allowsthe hare population to build up again. At some pointthe lynx population increases to take advantage of theincreased supply of hares, starting the cycle again.Controlled laboratory experiments involving branconidwasp predators <strong>and</strong> bean weevil prey produce asimilar pattern of out-of-phase fluctuations in thepredator <strong>and</strong> prey populations.Some research has cast doubt on this appealing hypothesis.Researchers have found that some snowshoehare populations have similar 10-year boom-<strong>and</strong>-bustcycles on isl<strong>and</strong>s where lynx are absent. These scientistshypothesize that the periodic crashes in the harepopulation can also be influenced by their food supply.Large numbers of hares can die following a periodwhen they consume food plants faster than the plantscan be replenished, especially during winter.Once the hare population crashes, the plants recover<strong>and</strong> the hare population begins rising again in ahare–plant cycle. If this bottom-up control hypothesis iscorrect, the lynx do not control hare populations. Instead,the changing hare population size may causefluctuations in the lynx population.The two hypotheses are not mutually exclusive.One problem is that the simple model of the predator–preyrelationship assumes that the lynx are the onlypredators of hares <strong>and</strong> that the lynx prey only on hares.Neither is true in many of the real-life communitieswhere these species are found. According to extensiveresearch by Charles J. Krebs, the 10-year population cycleof snowshoe hares in boreal forests is caused by aninteraction between predation (by lynx, coyotes, <strong>and</strong>other predators) <strong>and</strong> food supplies (especially in winter),<strong>and</strong> predation is the dominant process.9-2 REPRODUCTIVE PATTERNSAND SURVIVALHow Do Species Reproduce? Sexual PartnersAre Not Always NeededSome species reproduce without having sex <strong>and</strong>others reproduce by having sex.Figure 9-8 Population cycles for the snowshoehare <strong>and</strong> Canadian lynx. At one time scientistsbelieved these curves provided circumstantialevidence that these predator <strong>and</strong> prey populationsregulated one another. More recent researchsuggests that the periodic swings in thehare population are caused by a combination ofpredation by lynx <strong>and</strong> other predators (top-downpopulation control) <strong>and</strong> changes in the availabilityof the food supply for hares. The rise <strong>and</strong> fallof the hare population apparently helps determinethe lynx population (bottom-up populationcontrol). (Data from D. A. MacLulich)Population size (thous<strong>and</strong>s)16014012010080604020HareLynx01845 1855 1865 1875 1885 1895 1905 1915 1925 1935Year168 CHAPTER 9 Population Ecology
Reproductive individuals in populations of specieshave an inherent evolutionary drive to ensure that asmany members of the next generation as possible willcarry their genes. This increases the chance that theirpopulation will undergo evolution through naturalselection.Two types of reproduction can pass genes on tooffspring. One is asexual reproduction, in which alloffspring are exact genetic copies (clones) of a singleparent. This is common in species such as bacteria thathave only one cell. Each cell can divide to produce twoidentical cells that are genetic clones, or replicas of theoriginal.The second type is sexual reproduction, in whichorganisms produce offspring by combining sex cells orgametes (such as sperm <strong>and</strong> ovum) from both parents.This produces offspring with combinations of genetictraits from each parent.Sexual reproduction has three disadvantages.First, males do not give birth. This means that femaleshave to produce twice as many offspring to maintainthe same number of young in the next generation as anasexually reproducing organism.Second, there is an increased chance of genetic errors<strong>and</strong> defects during the splitting <strong>and</strong> recombinationof chromosomes. Third, courtship <strong>and</strong> mating ritualsconsume time <strong>and</strong> energy, can transmit disease, <strong>and</strong>can inflict injury on males of some species as they competefor sexual partners.So if sexual reproduction has some serious disadvantages,why do 97% of the earth’s species use it? Accordingto biologists, this happens because of two importantadvantages of sexual reproduction. One is thatit provides a greater genetic diversity in offspring. Apopulation with many different genetic possibilitieshas a greater chance of reproducing when environmentalconditions change than does a brood of geneticallyidentical clones. In addition, males of somespecies can gather food for the female <strong>and</strong> the young<strong>and</strong> protect <strong>and</strong> help train the young.Species with a capacity for a high rate of populationincrease (r)are called r-selected species (Figure 9-9<strong>and</strong> Figure 9-10, left). Such species reproduce early <strong>and</strong>put most of their energy into reproduction. Examplesare algae, bacteria, rodents, annual plants (such as d<strong>and</strong>elions),<strong>and</strong> most insects.These species have many, usually small offspring<strong>and</strong> give them little or no parental care or protection.They overcome the massive loss of offspring by producingso many that a few will survive to reproducemany more offspring to begin the cycle again.Such species tend to be opportunists. They reproduce<strong>and</strong> disperse rapidly when conditions are favorableor when a disturbance opens up a new habitat orniche for invasion, as in the early stages of ecologicalsuccession.<strong>Environmental</strong> changes caused by disturbancescan allow opportunist species to gain a foothold. However,once established, their populations may crashbecause of unfavorable changes in environmental conditionsor invasion by more competitive species. Thishelps explain why most r-selected or opportunist speciesgo through irregular <strong>and</strong> unstable boom-<strong>and</strong>-bustcycles in their population size.At the other extreme are competitor or K-selectedspecies (Figure 9-9 <strong>and</strong> Figure 9-10, right). These speciestend to reproduce late in life <strong>and</strong> have a smallnumber of offspring with fairly long life spans.Typically the offspring of such species developinside their mothers (where they are safe), are bornfairly large, mature slowly, <strong>and</strong> are cared for <strong>and</strong> protectedby one or both parents until they reach reproductiveage. This reproductive pattern results in afew big <strong>and</strong> strong individuals that can compete forresources <strong>and</strong> reproduce a few young to begin the cycleagain.Carrying capacityKWhat Types of Reproductive PatternsDo Species Have? Opportunists <strong>and</strong>CompetitorsSome species have a large number of small offspring<strong>and</strong> give them little parental care while other specieshave a few larger offspring <strong>and</strong> take care of them untilthey can reproduce.In 1967, Robert H. MacArthur <strong>and</strong> Edward O. Wilsonsuggested that species could be classified into twofundamental reproductive patterns, r-selected <strong>and</strong> K-selected species. This classification depends on their positionon the sigmoid (S-shaped) population growthcurve (Figure 9-9) <strong>and</strong> the characteristics of their reproductivepatterns (Figure 9-10, p. 170).Number of individualsr species;experiencer selectionTimeK species;experienceK selectionFigure 9-9 Positions of r-selected <strong>and</strong> K-selected species onthe sigmoid (S-shaped) population growth curve.http://biology.brookscole.com/miller14169
-Selected SpeciesK-Selected SpeciesCockroachD<strong>and</strong>elionElephantSaguaroMany small offspringFewer, larger offspringLittle or no parental care <strong>and</strong> protection of offspringEarly reproductive ageMost offspring die before reaching reproductive ageSmall adultsAdapted to unstable climate <strong>and</strong> environmental conditionsHigh population growth rate (r)Population size fluctuates wildly above <strong>and</strong> below carryingcapacity (K)Generalist nicheLow ability to competeEarly successional speciesHigh parental care <strong>and</strong> protection of offspringLater reproductive ageMost offspring survive to reproductive ageLarger adultsAdapted to stable climate <strong>and</strong> environmental conditionsLower population growth rate (r)Population size fairly stable <strong>and</strong> usually close to carryingcapacity (K)Specialist nicheHigh ability to competeLate successional speciesFigure 9-10 Generalized characteristics of r-selected or opportunist species <strong>and</strong> K-selected or competitorspecies. Many species have characteristics between these two extremes.They are called K-selected species because theytend to do well in competitive conditions when theirpopulation size is near the carrying capacity (K) oftheir environment. <strong>Their</strong> populations typically followa logistic growth curve.Most large mammals (such as elephants, whales,<strong>and</strong> humans), birds of prey, <strong>and</strong> large <strong>and</strong> long-livedplants (such as the saguaro cactus, oak trees, <strong>and</strong> mosttropical rain forest trees) are K-selected species. ManyK-selected species—especially those with long generationtimes <strong>and</strong> low reproductive rates like elephants,rhinoceroses, <strong>and</strong> sharks—are prone to extinction.Most organisms have reproductive patterns betweenthe extremes of r-selected species <strong>and</strong> K-selected species, or they change from one extreme tothe other under certain environmental conditions. Inagriculture we raise both r-selected species (crops) <strong>and</strong>K-selected species (livestock).The reproductive pattern of a species may give it atemporary advantage. But the availability of suitablehabitat for individuals of a population in a particular area iswhat determines its ultimate population size. Regardlessof how fast a species can reproduce, there can be nomore d<strong>and</strong>elions than there is d<strong>and</strong>elion habitat <strong>and</strong>no more zebras than there is zebra habitat in a particulararea.What Are Survivorship Curves?At What Age Is Death Most Likely?The populations of different speciesvary in how long individual memberstypically live.Individuals of species with different reproductivestrategies tend to have different life expectancies. Oneway to represent the age structure of a population iswith a survivorship curve, which shows the percentagesof the members of a population surviving at differentages. There are three generalized types ofsurvivorship curves: late loss, early loss, <strong>and</strong> constant loss(Figure 9-11). Which type of curve applies to the humanspecies?A life table shows the numbers of individuals ateach age on a survivorship curve. It shows the projectedlife expectancy <strong>and</strong> probability of death for individualsat each age.Insurance companies use life tables of humanpopulations to determine policy costs for customers.Life tables show that women in the United Statessurvive an average of 6 years longer than men. Thisexplains why a 65-year-old American man normallypays more for life insurance than a 65-year-oldAmerican woman.170 CHAPTER 9 Population Ecology
Percentage surviving (log scale)10010100.01Constant lossLate lossEarly lossAgeFigure 9-11 Three general survivorship curves for populationsof different species, obtained by showing the percentages ofthe members of a population surviving at different ages. A lateloss population (such as elephants, rhinoceroses, <strong>and</strong> humans)typically has high survivorship to a certain age, then high mortality.A constant loss population (such as many songbirds)shows a fairly constant death rate at all ages. For an early losspopulation (such as annual plants <strong>and</strong> many bony fish species),survivorship is low early in life. These generalized survivorshipcurves only approximate the behavior of species.9-3 EFFECTS OF GENETIC VARIATIONSON POPULATION SIZEWhat Role Does Genetics Play in the Sizeof Populations? The Vulnerability of SmallIsolated PopulationsVariations in genetic diversity can affect the survivalof small, isolated populations.In most large populations genetic diversity is fairly constant.The loss or addition of individuals has little effecton the total gene pool.However, genetic factors can affect the survival<strong>and</strong> genetic diversity of small, isolated populations.Several factors can play a role in the loss of genetic diversity<strong>and</strong> the survival of such populations. One is thefounder effect when a few individuals in a populationcolonize a new habitat that is geographically isolatedfrom other members of the population (Figure 5-7,p. 94). In such cases, limited genetic diversity or variabilitymay threaten the survival of the colonizing population.Another problem is a demograpic bottleneck. Itoccurs when only a few individuals in a populationsurvive a catastrophe such as a fire or hurricane. Lackof genetic diversity may limit the ability of these individualsto rebuild the population. A third factor isgenetic drift. It involves r<strong>and</strong>om changes in the genefrequencies in a population that can lead to unequal reproductivesuccess. For example, some individualsmay breed more than others <strong>and</strong> their genes mayeventually dominate the gene pool of the population.This change in gene frequency could help or hinderthe survival of the population. The founder effect isone cause of genetic drift. A fourth factor is inbreeding.It occurs when individuals in a small population matewith one another. This can increase the frequency ofdefective genes within a population <strong>and</strong> affect its longtermsurvival.What are Metapopulations? Exchanging GenesNow <strong>and</strong> ThenVariations in genetic diversity can affect the survivalof small, isolated populations.Some mobile populations that are geographically separatedfrom one another can exchange genes whensome of their membeers get together occasionally <strong>and</strong>mate. Such collections of interacting local populationsof a species are called metapopulations.Some local populations where birth rates arehigher than death rates produce excess individualsthat can migrate to other local populations. Other localpopulations where death rates are greater than birthrates can accept individuals from other populations.Conservation biologists can map out the locations ofmetapopulations <strong>and</strong> use this information to providecorridors <strong>and</strong> migration routes to enhance the overallpopulation size, genetic diversity, <strong>and</strong> survial of relatedlocal populations.9-4 HUMAN IMPACTS ON NATURALSYSTEMS: LEARNING FROM NATUREHow Have Humans Modified NaturalEcosystems? Our Big FootprintsWe have used technology to alter much of the restof nature in ways that threaten the survival of manyother species <strong>and</strong> could reduce the quality of life forour own species.In this <strong>and</strong> the six preceding chapters we have lookedat key concepts of science <strong>and</strong> ecology. It is time to reviewwhat lessons we can learn from this study of hownature operates <strong>and</strong> sustains itself. But first let us lookat our environmental impact on the earth.To survive <strong>and</strong> provide resources for growingnumbers of people, we have modified, cultivated,built on, or degraded a large <strong>and</strong> increasing area of theearth’s natural systems. Excluding Antarctica, our activitieshave directly affected to some degree about83% of the earth’s l<strong>and</strong> surface (Figure 9-12, p. 172).Figure 9-13 (p. 172) compares some of the characteristicsof natural <strong>and</strong> human-dominated systems.http://biology.brookscole.com/miller14171
Figure 9-12 Natural capital degradation: the human footprint on the earth’s l<strong>and</strong> surface—in effect the sumof all ecological footprints (Figure 1-7, p. 10) of the human population. Colors represent the percentage of eacharea influenced by human activities. Excluding Antarctica <strong>and</strong> Greenl<strong>and</strong>, human activities have directly affectedto some degree about 83% of the earth’s l<strong>and</strong> surface <strong>and</strong> 98% of the area where it is possible to growrice, wheat, or maize. (Data from Wildlife Conservation Society <strong>and</strong> the Center for International Earth ScienceInformation Network at Columbia University [CIESIN]. Reprinted by permission.)PropertyComplexityEnergy sourceWaste productionNutrientsNet primaryproductivityNaturalSystemsBiologically diverseRenewable solarenergyLittle, if anyRecycledShared among manyspeciesHuman-DominatedSystemsBiologicallysimplifiedMostlynonrenewable fossilfuel energyHighOften lost or wastedUsed, destroyed, ordegraded to supporthuman activitiesFigure 9-13 Some typical characteristics of natural <strong>and</strong> human-dominated systems.We have used technology to alter muchof the rest of nature to meet our growingneeds <strong>and</strong> wants in nine major ways. One isreducing biodiversity by destroying, fragmenting,<strong>and</strong> degrading wildlife habitats. This happenswhen we clear forests, dig up grassl<strong>and</strong>s, <strong>and</strong>fill in wetl<strong>and</strong>s to grow food or to constructbuildings, highways, <strong>and</strong> parking lots.A second is reducing biodiversity by simplifying<strong>and</strong> homogenizing natural ecosystems.Communities <strong>and</strong> ecosystems dominated byhumans tend to have fewer species <strong>and</strong> fewercommunity interactions than do undisturbedecosystems. When we plow grassl<strong>and</strong>s <strong>and</strong>clear forests, we often replace thous<strong>and</strong>s ofinterrelated plant <strong>and</strong> animal species withone crop or one kind of tree—called a monoculture.Then we spend a lot of time, energy,<strong>and</strong> money trying to protect such monoculturesagainst threats such as invasions by opportunistspecies of plants (weeds) <strong>and</strong> pests—mostly insects, to which a monoculture cropis like an all-you-can-eat restaurant. Anotherthreat is invasions by pathogens—fungi,viruses, or bacteria—that harm the plants<strong>and</strong> animals we want to raise.172 CHAPTER 9 Population Ecology
A third type of alteration is using, wasting, or destroyingan increasing percentage of the earth’s net primaryproductivity that supports all consumer species (includinghumans). This factor is the main reason we are crowdingout or eliminating the habitats <strong>and</strong> food suppliesof a growing number of other species.A fourth type of intervention has unintentionallystrengthened some populations of pest species <strong>and</strong> diseasecausingbacteria. This has occurred through overuseof pesticides <strong>and</strong> antibiotics that has speeded up naturalselection <strong>and</strong> caused genetic resistance to thesechemicals.A fifth effect has been to eliminate some predators.Some ranchers want to eliminate wolves, coyotes, eagles,<strong>and</strong> other predators that occasionally kill sheep.They also want to eradicate bison or prairie dogs thatcompete with their sheep or cattle for grass. A few biggamehunters push for elimination of predators thatprey on game species.Sixth, we have deliberately or accidentally introducednew or nonnative species into ecosystems. Most of thesespecies, such as food crops <strong>and</strong> domesticated livestock,are beneficial to us but a few are harmful to us<strong>and</strong> other species.Seventh, we have overharvested some renewable resources.Ranchers <strong>and</strong> nomadic herders sometimes allowlivestock to overgraze grassl<strong>and</strong>s until erosionconverts these ecosystems to less productive semidesertsor deserts. Farmers sometimes deplete soil nutrientsby excessive crop growing. Some fish speciesare overharvested. Illegal hunting or poaching endangerswildlife species with economically valuable partssuch as elephant tusks, rhinoceros horns, <strong>and</strong> tigerskins. In some areas, fresh water is being pumped outof underground aquifers faster than it is replenished.Eighth, some human activities interfere with the normalchemical cycling <strong>and</strong> energy flows in ecosystems. Soilnutrients can erode from monoculture crop fields, treeplantations, construction sites, <strong>and</strong> other simplifiedecosystems <strong>and</strong> overload <strong>and</strong> disrupt other ecosystemssuch as lakes <strong>and</strong> coastal ecosystems. Chemicals suchas chlorofluorocarbons (CFCs) released into the atmospherecan increase the amount of harmful ultravioletenergy reaching the earth by reducing ozone levels inthe stratosphere. Emissions of carbon dioxide <strong>and</strong>other greenhouse gases—from burning fossil fuels <strong>and</strong>from clearing <strong>and</strong> burning forests <strong>and</strong> grassl<strong>and</strong>s—cantrigger global climate change by altering energy flowthrough the troposphere.Ninth, while most natural systems are powered bysunlight, human-dominated ecosystems have become increasinglydependent on nonrenewable energy from fossilfuels. Fossil fuel systems typically produce pollution,add more of the greenhouse gas carbon dioxide to theatmosphere, <strong>and</strong> waste much more energy than theyneed to.To survive we must exploit <strong>and</strong> modify parts ofnature. However, we are beginning to underst<strong>and</strong>that any human intrusion into nature has multiple effects,most of them unintended <strong>and</strong> unpredictable(Figure 3-4, p. 38 <strong>and</strong> Connections, below).We face two major challenges. First, we need tomaintain a balance between simplified, human-alteredecosystems <strong>and</strong> the more complex natural ecosystemsEcological SurprisesMalaria once infected9 out of10 people in NorthBorneo, nowCONNECTIONS known as Sabah.In 1955, theWorld Health Organization (WHO)began spraying the isl<strong>and</strong> withdieldrin (a DDT relative) to killmalaria-carrying mosquitoes. Theprogram was so successful thatthe dreaded disease was nearlyeliminated.But unexpected things beganto happen. The dieldrin also killedother insects, including flies <strong>and</strong>cockroaches living in houses. Theisl<strong>and</strong>ers applauded. But thensmall insect-eating lizards thatalso lived in the houses died aftergorging themselves on dieldrincontaminatedinsects.Next, cats began dying afterfeeding on the lizards. Then, in theabsence of cats, rats flourished <strong>and</strong>overran the villages. When the peoplebecame threatened by sylvaticplague carried by rat fleas, theWHO parachuted healthy cats ontothe isl<strong>and</strong> to help control the rats.Operation Cat Drop worked.But then the villagers’ roofs beganto fall in. The dieldrin hadkilled wasps <strong>and</strong> other insects thatfed on a type of caterpillar thateither avoided or was not affectedby the insecticide. With most ofits predators eliminated, the caterpillarpopulation exploded, munchingits way through its favoritefood: the leaves used in thatchedroofs.Ultimately, this episode endedhappily: both malaria <strong>and</strong> the unexpectedeffects of the sprayingprogram were brought under control.Nevertheless, this chain of unintended<strong>and</strong> unforeseen eventsemphasizes the unpredictability ofinterfering with an ecosystem. It remindsus that when we intervene innature, we need to ask, “Now whatwill happen?”Critical ThinkingDo you believe the beneficial effectsof spraying pesticides on Sabah outweighedthe resulting unexpected<strong>and</strong> harmful effects? Explain.http://biology.brookscole.com/miller14173
on which we <strong>and</strong> other species depend. Second, weneed to slow down the rates at which we are alteringnature for our purposes. If we simplify, homogenize,<strong>and</strong> degrade too much of the planet to meet our needs<strong>and</strong> wants, what is at risk is not the resilient earth butthe quality of life for members of our species <strong>and</strong> otherspecies we drive to premature extinction.What Can We Learn from Ecology aboutLiving More Sustainably? Copy NatureWe can develop more sustainable economies <strong>and</strong>societies by mimicking the four major ways thatnature has adapted <strong>and</strong> sustained itself for severalbillion years.So how can we live more sustainably? Ecologists say:Find out how nature has survived <strong>and</strong> adapted forseveral billion years <strong>and</strong> copy this strategy. Figure 9-14(also found on the bottom half of the back cover) summarizesthe four major ways in which life on earth hassurvived <strong>and</strong> adapted for several billion years. Figure9-15 (left) gives an exp<strong>and</strong>ed description of theseprinciples <strong>and</strong> Figure 9-15 (right) summarizes how wecan live more sustainably by mimicking these fundamentalbut amazingly simple lessons from nature indesigning our societies, products, <strong>and</strong> economies. Figures9-14 <strong>and</strong> 9-15 summarize the major message of thisbook. Study them carefully.Biologists have used these lessons from their ecologicalstudy of nature to formulate four guidelines fordeveloping more sustainable societies <strong>and</strong> lifestyles:SolarEnergyNutrientRecyclingPRINCIPLESOFSUSTAINABILITYPopulationControlBiodiversityFigure 9-14 Sustaining natural capital: four interconnectedprinciples of sustainability derived from learning how naturesustains itself. This diagram also appears on the bottom half ofthe back cover of this book.SolutionsPrinciples of <strong>Sustainability</strong>How Nature WorksRuns onrenewablesolar energy.Recyclesnutrients <strong>and</strong>wastes. Thereis little wastein nature.Usesbiodiversity tomaintain itself<strong>and</strong> adapt tonew environmentalconditions.Controls aspecies'population size<strong>and</strong> resourceuse byinteractionswith itsenvironment<strong>and</strong> otherspecies.Lessons for UsRely mostly onrenewable solarenergy.Prevent <strong>and</strong> reducepollution <strong>and</strong>recycle <strong>and</strong> reuseresources.Preserve biodiversityby protectingecosystem services<strong>and</strong> preventingpremature extinctionof species.Reduce births <strong>and</strong>wasteful resourceuse to preventenvironmentaloverload <strong>and</strong>depletion <strong>and</strong>degradation ofresources.Figure 9-15 Solutions: the four principles of sustainability(left) derived from observing nature have implications for thelong-term sustainability of human societies (right). These fouroperating principles of nature are connected to one another.Failure of any single principle can lead to temporary or longtermunsustainability <strong>and</strong> disruption of ecosystems <strong>and</strong> humaneconomies <strong>and</strong> societies.■ Our lives, lifestyles, <strong>and</strong> economies are totally dependenton the sun <strong>and</strong> the earth. We need the earth, butthe earth does not need us. As a species, we areexpendable.■ Everything is connected to <strong>and</strong> interdependent witheverything else. The primary goal of ecology is to discoverwhat connections in nature are the strongest,most important, <strong>and</strong> most vulnerable to disruption forus <strong>and</strong> other species.■ We can never do merely one thing. Any humanintrusion into nature has unexpected <strong>and</strong> mostlyunintended side effects (Figure 3-4, p. 38). Whenwe alter nature we need to ask, “Now what willhappen?”■ We cannot indefinitely sustain a civilization that depletes<strong>and</strong> degrades the earth’s natural capital, but we cansustain one that lives off the biological income provided bythat capital.174 CHAPTER 9 Population Ecology
In the next chapter we will apply the principles ofpopulation dynamics <strong>and</strong> sustainability discussed inthis chapter to the growth of the human population. Inthe three chapters after that we apply them to underst<strong>and</strong>ingthe earth’s terrestrial <strong>and</strong> aquatic biodiversity<strong>and</strong> how to help sustain them.We cannot comm<strong>and</strong> nature except by obeying her.SIR FRANCIS BACONCRITICAL THINKING1. (a) Why do biotic factors that regulate populationgrowth tend to depend on population density <strong>and</strong>(b) Why do abiotic factors that regulate population tendto be independent of population density?2. Why are pest species likely to be extreme r-selectedspecies? Why are many endangered species likely to beextreme K-selected species?3. Why is an animal that devotes most of its energy to reproductionlikely to be small <strong>and</strong> weak?4. Given current environmental conditions, if you hada choice, would you rather be an r-strategist or a K-strategist? Explain your answer.5. List the type of survivorship curve you would expectgiven descriptions of the following organisms:a. This organism is an annual plant. It lives only 1year. During that time, it sprouts, reaches maturity,produces many wind-dispersed seeds, <strong>and</strong> dies.b. This organism is a mammal. It reaches maturity after10 years. It bears one young every 2 years. Theparents <strong>and</strong> the rest of the herd protect the young.6. Explain why a simplified ecosystem such as a cornfieldusually is much more vulnerable to harm from insects<strong>and</strong> plant diseases than a more complex, natural ecosystemsuch as a grassl<strong>and</strong>. Does this mean that we shouldnever convert a grassl<strong>and</strong> to a cornfield? Explain. Whatrestrictions, if any, would you put on such conversions?7. How has the human population generally been able toavoid environmental resistance factors that affect otherpopulations? Is this likely to continue? Explain.8. Explain why you agree or disagree with the four principlesof sustainability listed in Figure 9-15 (left) <strong>and</strong>their lessons for human societies listed in Figure 9-15(right). Identify aspects of your lifestyle that follow orviolate each of these four sustainability principles. Wouldyou be willing to change the aspects of your lifestyle thatviolate these sustainability principles? Explain.PROJECTS1. Use the principles of sustainability derived from thescientific study of how nature sustains itself (Figures 9-14<strong>and</strong> 9-15) to evaluate the sustainability of the followingparts of human systems: (a) transportation, (b) cities,(c) agriculture, (d) manufacturing, (e) waste disposal,<strong>and</strong> (f) your own lifestyle. Compare your analysis withthose made by your classmates.2. Use the library or the Internet to choose one wildplant species <strong>and</strong> one animal species <strong>and</strong> analyze thefactors that are likely to limit the population of eachspecies.3. Use the library or the Internet to find bibliographic informationabout Charles Darwin <strong>and</strong> Sir Francis Bacon,whose quotes appear at the beginning <strong>and</strong> end of thischapter.4. Make a concept map of this chapter’s major ideas, usingthe section heads, subheads, <strong>and</strong> key terms (in boldface).Look on the website for this book for informationabout making concept maps.LEARNING ONLINEThe website for this book contains study aids <strong>and</strong> manyideas for further reading <strong>and</strong> research. They include achapter summary, review questions for the entire chapter,flash cards for key terms <strong>and</strong> concepts, a multiple-choicepractice quiz, interesting Internet sites, references, <strong>and</strong> aguide for accessing thous<strong>and</strong>s of InfoTrac ® College Editionarticles. Log on tohttp://biology.brookscole.com/miller14Then click on the Chapter-by-Chapter area, choose Chapter9, <strong>and</strong> select a learning resource.http://biology.brookscole.com/miller14175
10 TheApplying Population Ecology:Human PopulationPopulationControlCASE STUDYSlowing Population Growthin Thail<strong>and</strong>: A Success StoryCan a country sharply reduce its population growth inonly 15 years? Thail<strong>and</strong> did.In 1971, Thail<strong>and</strong> adopted a policy to reduce itspopulation growth. When the program began, thecountry’s population was growing at a very rapid rateof 3.2% per year, <strong>and</strong> the average Thai family had6.4 children.Fifteen years later in 1986, the country’s populationgrowth rate had been cut in half to 1.6%. By 2004,the rate had fallen to 0.8%, <strong>and</strong> the average number ofchildren per family was 1.7.There are a number of reasons for this impressiveachievement. They include the creativity of thegovernment-supported family planning program, ahigh literacy rate among women (90%), an increasedeconomic role for women <strong>and</strong> advances in women’srights, <strong>and</strong> better health care for mothers <strong>and</strong> children.Other factors are the openness of the Thai people tonew ideas <strong>and</strong> support of family planning by the country’sreligious leaders (95% of Thais are Buddhist). Akey factor was the willingness of the government toencourage <strong>and</strong> financially support family planning<strong>and</strong> to work with the private, nonprofit Population<strong>and</strong> Community Development Association (PCDA).Mechai Viravidaiya (Figure 10-1) led the way inreducing the country’s population growth rate. Thispublic relations genius <strong>and</strong> former government economistlaunched the PCDA in 1974 to help make familyplanning a national goal. PCDAworkers h<strong>and</strong>ed out condomsat festivals, movietheaters, <strong>and</strong> even traffic jams, <strong>and</strong> they developedads <strong>and</strong> witty songs about contraceptive use. Between1971 <strong>and</strong> 2004, the percentage of married women usingmodern birth control rose from 15% to 70%—higher than the 58% usage in developed countries <strong>and</strong>the 51% usage in developing countries.Viravidaiya helped establish a German-financedrevolving loan plan to enable people participating infamily planning programs to install toilets <strong>and</strong> drinkingwater systems. Low-rate loans were offered tofarmers practicing family planning. The governmentalso offers loans to individuals from a fund that increasesas their village’s level of contraceptive userises. Education <strong>and</strong> economic rewards work.All is not completely rosy. Although Thail<strong>and</strong> hasdone well in slowing population growth <strong>and</strong> raisingper capita income, it has been less successful in reducingpollution <strong>and</strong> improving public health. Its capital,Bangkok, is plagued with notoriously high levels oftraffic congestion <strong>and</strong> air pollution (Figure 10-2).Figure 10-1 Individualsmatter: MechaiViravidaiya, a charismaticleader, played a majorrole in Thail<strong>and</strong>’s successfulefforts to reduceits population growth. In1974, he established theprivate, nonprofit Population<strong>and</strong> Community DevelopmentAssociation (PCDA)to help implement family planningas a national goal.Figure 10-2 This policeman <strong>and</strong> schoolchildren in Bangkok,Thail<strong>and</strong>, are wearing masks to reduce their intake of air pollutedmainly by automobiles. Bangkok is one of the world’s mostcar-clogged cities, with car commutes averaging 3 hours perday. Roughly one of every nine of its residents has a respiratoryailment.
The problems to be faced are vast <strong>and</strong> complex, but comedown to this: 6.4 billion people are breeding exponentially.The process of fulfilling their wants <strong>and</strong> needs is strippingearth of its biotic capacity to produce life; a climactic burst ofconsumption by a single species is overwhelming the skies,earth, waters, <strong>and</strong> fauna.PAUL HAWKENThis chapter addresses the following questions:■■■■■How is population size affected by birth, death,fertility, <strong>and</strong> migration rates?How is population size affected by age structure?How can we influence population size?What success have India <strong>and</strong> China had in slowingpopulation growth?How can global population growth be reduced?10-1 FACTORS AFFECTING HUMANPOPULATION SIZEWhat Is Demography <strong>and</strong> Why Is itImportant? How Population Change AffectsLife, Death, <strong>and</strong> EconomiesChanges in the size, composition, <strong>and</strong> distribution ofhuman populations have important health, social, <strong>and</strong>economic effects.How long are you likely to live <strong>and</strong> what will probablykill you? How many people are there in the country orarea where you live <strong>and</strong> how many people are likely tolive there in the future? How many children are youlikely to have? How likely are you to get married or divorced?What kind of job will you probably have <strong>and</strong>how many times are you likely to change jobs? Whatare your chances of promotion? When are you likely toretire? About how many times will you move?Demography is devoted to finding answers tothese <strong>and</strong> other population-related questions. Demographyis the study of the size, composition, <strong>and</strong> distributionof human populations <strong>and</strong> the causes <strong>and</strong>consequences of changes in these characteristics. Specialistsin this field are called demographers.How Is Population Size Affectedby Birth Rates <strong>and</strong> Death Rates? Entrances<strong>and</strong> ExitsPopulation increases because of births <strong>and</strong>immigration, <strong>and</strong> decreases through deaths <strong>and</strong>emigration.Human populations grow or decline through the interplayof three factors: births, deaths, <strong>and</strong> migration. Populationchange is calculated by subtracting the numberof people leaving a population (through death <strong>and</strong>Average crude birth rateWorldAll developed11countries 10All developingcountries 8Developingcountries(w/o China)AfricaLatinAmerica 6AsiaOceania9914United14States 8North14America 8Europe101277Average crude death rateFigure 10-3 Average crude birth <strong>and</strong> death rates for variousgroupings of countries in 2004. (Data from Population ReferenceBureau)emigration) from the number entering it (throughbirth <strong>and</strong> immigration) during a specified period oftime (usually a year):Population change (Births Immigration) (Deaths Emigration)When births plus immigration exceed deaths plusemigration, population increases; when the reverse istrue, population declines.Instead of using the total numbers of births <strong>and</strong>deaths per year, demographers use the birth rate, orcrude birth rate (the number of live births per 1,000people in a population in a given year), <strong>and</strong> the deathrate, or crude death rate (the number of deaths per1,000 people in a population in a given year). Figure10-3 shows the crude birth <strong>and</strong> death rates for variousgroupings of countries in 2004.How Fast Is the World’s PopulationGrowing? Good <strong>and</strong> Bad NewsThe rate at which the world’s population increaseshas slowed, but the population is still growing fairlyrapidly.Birth rates <strong>and</strong> death rates are coming down worldwide,but death rates have fallen more sharply than18212022242738http://biology.brookscole.com/miller14177
irth rates. As a result, more births are occurring th<strong>and</strong>eaths; every time your heart beats, 2.5 more babies areadded to the world’s population. At this rate, we sharethe earth <strong>and</strong> its resources with about 219,000 morepeople each day—97% of them in developing countries.The rate of the world’s annual population changeis usually expressed as a percentage:1.1 billion1.4 billionAnnual rate ofBirth rate Death rateBrazil 179 millionnatural population 100change (%)1,000 persons211 millionBirth rate Death ratePakistan 159 million 10 229 millionRussia 144 millionExponential population growth has not disappearedbut is occurring at a slower rate. The rate of theworld’s annual population growth (natural increase)dropped by almost half between 1963 <strong>and</strong> 2004, from2.2% to 1.25%. This is good news but during the sameperiod the population base doubled, from 3.2 billion to6.4 billion. This drop in the rate of population increaseis somewhat like learning that a truck heading straightBangladeshJapanNigeria137 million141 million205 million128 million121 million137 million206 millionat you has slowed from 100 kilometers per hour (kph)2004 2025to 55 kph while its weight has doubled.Figure 10-4 The world’s 10 most populous countries in 2004,An exponential growth rate of 1.25% may seemwith projections of their population size in 2025. In 2004, moresmall. But in 2004 it added about 80 million people topeople lived in China than in all of Europe, Russia, North America,the world’s population, compared to 69 million addedin 1963, when the world’s population growth reachedJapan, <strong>and</strong> Australia combined. (Data from World Bank <strong>and</strong>Population Reference Bureau)its peak. An increase of 80 million people per year isroughly equal to adding another New York City everyHow Long Does It Take to Double the Numbermonth, a Germany every year, <strong>and</strong> a United Statesof People on the Planet? The Rule of 70every 3.7 years.Also, there is a big difference between exponentialDoubling time is how long it takes for a populationpopulation growth rates in developed <strong>and</strong> developinggrowing at a specified rate to double its size.countries. In 2004, the population of developed countrieswas growing at a rate of 0.1%. That of the developingcountries was 1.5%—almost 15 times faster.As a result of these trends, the population of thedeveloped countries, currently at 1.2 billion, is expectedto change little in the next 50 years. In contrast,the population of the developing countries is projectedto rise steadily from 5.2 billion in 2004 to 8 billion in2050. The six nations expected to experience mostof this growth are, in order: India, China, Pakistan,Nigeria, Bangladesh, <strong>and</strong> Indonesia.What five countries have the largest numbers ofpeople? Number 1 is China with 1.3 billion people—One measure of population growth is doubling time:the time (usually in years) it takes for a populationgrowing at a specified rate to double its size. A quickway to calculate doubling time is to use the rule of 70:70/percentage growth rate doubling time in years(a formula derived from the basic mathematics of exponentialgrowth). For example, in 2004 the world’spopulation grew by 1.2%. If that rate continues, theearth’s population will double in about 56 years(70/1.25 56 years).The population of the African country of Nigeriais increasing by 2.8% a year. How long will it take forits population to double?about one of every five people in the world. Number 2is India with 1.1 billion people—about one of every sixHow Have Global Fertility Rates Changed?people. Together China <strong>and</strong> India—with roughly theHaving Fewer Babies per Womansame geographic areas—have 37% of the world’s population.Number 3 is the United States, with 294 millionpeople or 4.6% of the world’s population.has dropped sharply since 1950, but the number is notThe average number of children that a woman bearsCan you guess the next two most populous countries?What three countries are expected to have thenear future.low enough to stabilize the world’s population in themost people in 2025? Look at Figure 10-4 to see if youranswers are correct.Fertility is the number of births that occur to an individualwoman or in a population. Two types of fertilityChinaIndiaUSAIndonesia294 million349 million219 million308 million1.3 billion1.4 billion178 CHAPTER 10 Applying Population Ecology: The Human Population
ates affect a country’s population size <strong>and</strong> growthrate. The first type, replacement-level fertility, is thenumber of children a couple must bear to replace themselves.It is slightly higher than two children per couple(2.1 in developed countries <strong>and</strong> as high as 2.5 in somedeveloping countries), mostly because some femalechildren die before reaching their reproductive years.Does reaching replacement-level fertility mean animmediate halt in population growth? No, because somany future parents are alive. If each of today’s coupleshad an average of 2.1 children <strong>and</strong> their childrenalso had 2.1 children, the world’s population wouldstill grow for 50 years or more (assuming death ratesdo not rise).The second type of fertility rate is the total fertilityrate (TFR): the average number of children awoman typically has during her reproductive years.Good news. TFRs have dropped sharply since 1950 (Figure10-5). In 2004, the average global TFR was 2.8 childrenper woman. It was 1.5 in developed countries(down from 2.5 in 1950) <strong>and</strong> 3.1 in developing countries(down from 6.5 in 1950). The highest TFRs are inAfrica with a rate of 5.2 in 2004.So how many of us are likely to be here in 2050?Answer: From 7.2 to 10.6 billion, depending on theworld’s projected average TFR (Figure 10-6). Themedium projection is 8.9 billion people. About 97% ofthe growth in all three of these estimates is projected totake place in developing countries, where acutepoverty (living on less than $1 per day) is a way of lifefor about 1.4 billion people.WorldDevelopedcountries 1.62.8Developingcountries 3.1AfricaLatinAmerica 2.6AsiaOceaniaNorthAmericaEurope2.12.52.63.83.52.02.61.45 children per woman6.65.15.95.96.51950 2004Figure 10-5 Good news: decline in total fertility rates for variousgroupings of countries, 1950–2004. (Data from UnitedNations)Population (billions)1211109876543HighMediumLowMedium8.9High10.6Low7.221950 1960 1970 1980 1990 2000 2010 2020 2030 2040 2050YearFigure 10-6 UN world population projections, assuming that by2050 the world’s total fertility rate is 2.5 (high), 2.0 (medium), or1.5 (low) children per woman. The most likely projection is themedium one—8.9 billion by 2050. (Data from United Nations)How Have Fertility <strong>and</strong> Birth Rates Changedin the United States? Ups <strong>and</strong> DownsPopulation growth in the United States has sloweddown but is not close to leveling off.The population of the United States has grown from 76million in 1900 to 294 million in 2004, despite oscillationsin the country’s TFR (Figure 10-7) <strong>and</strong> birth rate(Figure 10-8, p. 180). A sharp rise in the birth rate occurredafter World War II. The period of high birthrates between 1946 <strong>and</strong> 1964 is known as the baby-boomperiod. This added 79 million people to the U.S. population.In 1957, the peak of the baby boom after WorldWar II, the TFR reached 3.7 children per woman. Sincethen it has generally declined <strong>and</strong> remained at or belowreplacement level since 1972.The drop in the TFR has led to a decline in the rateof population growth in the United States. But theBirths per woman4.03.53.02.52.12.01.51.00.5Baby boom(1946–64)Replacementlevel01920 1930 1940 1950 1960 1970 1980 1990 2000 2010YearFigure 10-7 Total fertility rates for the United States between1917 <strong>and</strong> 2004. (Data from Population Reference Bureau <strong>and</strong>U.S. Census Bureau)http://biology.brookscole.com/miller14179
Births per thous<strong>and</strong> population323028262422201816End of World War II14Demographictransition Depression Baby boomBaby bustEcho baby boom01910 1920 1930 1940 1950 1960 1970 1980 1990 2000 2010YearFigure 10-8 Birth rates in the United States, 1910–2004. (Data from U.S. Bureau of Census <strong>and</strong> U.S.Commerce Department)country’s population is still growing faster than that ofany other developed country <strong>and</strong> is not close to levelingoff.About 2.9 million people were added to the U.S.population in 2004. Approximately 59% of this growthwas the result of more births than deaths (1.7 million)<strong>and</strong> the rest came from legal <strong>and</strong> illegal immigration(1.2 million).How many people are likely to be living in theUnited States in 2050 <strong>and</strong> 2100? No one knows, but theU.S. Bureau of Census makes projections using differentassumptions about fertility rates <strong>and</strong> immigrationrates. Its medium projection is that the U.S. populationwill increase from 294 million in 2004 to 420 million by2050 <strong>and</strong> reach 571 million by 2100 (Figure 10-9). Incontrast, population growth has slowed in other majordeveloped countries since 1950 <strong>and</strong> most are expectedto have declining populations after 2010. Because of ahigh per capita rate of resource use, each addition tothe U.S. population has an enormous environmentalimpact (Figure 1-13, p. 15).How do the population dynamics of the UnitedStates compare with those of its neighbors Canada <strong>and</strong>Mexico? Find out by looking at Figure 10-10. In additionto an almost fourfold increase in population growth,Population in millions600500400300200100761900Total population19201940196019802000Year292Projections20202040571206020802100Figure 10-9 U.S. population growth, 1900–2004, <strong>and</strong> projectionsto 2100. (Data from U.S. Census Bureau)some amazing changes in lifestyles took place in theUnited States during the 20th century (Figure 10-11).What Factors Affect Birth Rates <strong>and</strong> FertilityRates? Reducing BirthsThe number of children women have is affectedby the cost of raising <strong>and</strong> educating children,educational <strong>and</strong> employment opportunities forwomen, infant deaths, marriage age, <strong>and</strong> availabilityof contraceptives <strong>and</strong> abortions.Many factors affect a country’s average birth rate <strong>and</strong>TFR. One is the importance of children as a part of thelabor force. Proportions of children working tend to behigher in developing countries—especially in rural areas,where children begin working to help raise cropsat an early age.Another economic factor is the cost of raising <strong>and</strong>educating children. Birth <strong>and</strong> fertility rates tend to belower in developed countries, where raising childrenis much more costly because they do not enter the laborforce until they are in their late teens or 20s.The availability of private <strong>and</strong> public pension systemsaffects how many children couples have. Pensionseliminate parents’ need to have many children to helpsupport them in old age.Urbanization plays a role. Why? Because peopleliving in urban areas usually have better access to familyplanning services <strong>and</strong> tend to have fewer childrenthan those living in rural areas where children areneeded to perform essential tasks.Another important factor is the educational <strong>and</strong> employmentopportunities available for women. TFRs tend tobe low when women have access to education <strong>and</strong>paid employment outside the home. In developingcountries, women with no education generally havetwo more children than women with a secondaryschool education.Another factor is the infant mortality rate. In areaswith low infant mortality rates, people tend to have a180 CHAPTER 10 Applying Population Ecology: The Human Population
United States Mexico CanadaPopulation(2004)32 million106 million294 millionProjected population(2025)36 million150 million349 millionInfant mortality rate6.75.225Life expectancy77 years75 years79 yearsTotal fertilityrate (TFR)2.01.72.8% populationunder age 1521%18%35%% populationover age 65Per capita GDP PPP5%12%13%$8,790$31,892$36,110Figure 10-10 Comparison of basic demographicdata for the United States (red),Mexico (blue), <strong>and</strong> Canada (yellow) in2004. (Per capita GDP PPP is a measure ofthe average purchasing power per personcompared to that in the United States.)(Data from U.S. Census Bureau <strong>and</strong> PopulationReference Bureau)Life expectancy47 years77 yearsMarried women workingoutside the home8%81%High schoolgraduates15%83%Homes withflush toilets10%98%Homes withelectricity2%99%Living insuburbs10%52%1900Hourly manufacturing jobwage (adjusted for inflation)Homicides per100,000 people$31.2$155.82000Figure 10-11 Some major changes thattook place in the United States between1900 <strong>and</strong> 2000. (Data from U.S. Bureauof the Census <strong>and</strong> Department ofCommerce)http://biology.brookscole.com/miller14181
Extremely EffectiveTotal abstinenceSterilizationVaginal ringHighly EffectiveIUD with slow-releasehormonesIUD plus spermicideVaginal pouch(“female condom”)IUDCondom (good br<strong>and</strong>)plus spermicideOral contraceptive100%99.6%98–99%98%98%97%95%95%93%smaller number of children because fewer children dieat an early age.Average age at marriage (or, more precisely, the averageage at which women have their first child) alsoplays a role. Women normally have fewer childrenwhen their average age at marriage is 25 or older.Birth rates <strong>and</strong> TFRs are also affected by the availabilityof legal abortions. Each year about 190 millionwomen become pregnant. The United Nations <strong>and</strong> theWorld Bank estimate that about 46 million of thesewomen get abortions: 26 million of them legal <strong>and</strong>20 million illegal (<strong>and</strong> often unsafe).The availability of reliable birth control methods (Figure10-12) allows women to control the number <strong>and</strong>spacing of the children they have. Religious beliefs, traditions,<strong>and</strong> cultural norms also play a role. In some countries,these factors favor large families <strong>and</strong> strongly opposeabortion <strong>and</strong> some forms of birth control.EffectiveCervical capCondom (good br<strong>and</strong>)Diaphragm plusspermicideRhythm method (Billings,Sympto-Thermal)Vaginal sponge impregnatedwith spermicideSpermicide (foam)Moderately EffectiveSpermicide (creams,jellies, suppositories)Rhythm method (dailytemperature readings)WithdrawalCondom (cheap br<strong>and</strong>)UnreliableDoucheChance (no method)10%40%75%74%74%70%86%84%83%82%89%84%Figure 10-12 Typical effectiveness rates of birth control methodsin the United States. Percentages are based on the numberof undesired pregnancies per 100 couples using a specificmethod as their sole form of birth control for a year. For example,an effectiveness rating of 93% for oral contraceptivesmeans that for every 100 women using the pill regularly for ayear, 7 will get pregnant. Effectiveness rates tend to be lower indeveloping countries, primarily because of lack of education.Globally about 39% of the world’s people using contraceptionrely on sterilization (32% of females <strong>and</strong> 7% of males), followedby IUDs (22%), the pill (14%), <strong>and</strong> male condoms (7%). Preferencesin the United States are female sterilization (26%), the pill(25%), male condoms (19%), <strong>and</strong> male sterilization (10%).(Data from Alan Guttmacher Institute, Henry J. Kaiser FamilyFoundation, <strong>and</strong> the United Nations Population Division)What Factors Affect Death Rates? ReducingDeathsDeath rates have declined because of increased foodsupplies, better nutrition, advances in medicine, improvedsanitation, <strong>and</strong> safer water supplies.The rapid growth of the world’s population over thepast 100 years was not caused by a rise in the crudebirth rate. Instead, it was caused largely by a decline incrude death rates, especially in developing countries.More people started living longer <strong>and</strong> fewer infantsdied because of increased food supplies <strong>and</strong> distribution,better nutrition, medical advances such asvaccines <strong>and</strong> antibiotics, improved sanitation, <strong>and</strong>safer water supplies (which curtailed the spread ofmany infectious diseases).Two useful indicators of overall health of peoplein a country or region are life expectancy (the averagenumber of years a newborn infant can expect to live)<strong>and</strong> the infant mortality rate (the number of babies outof every 1,000 born who die before their first birthday).Great news. The global life expectancy at birth increasedfrom 48 years to 67 years (76 years in developedcountries <strong>and</strong> 65 years in developing countries)between 1955 <strong>and</strong> 2004. It is projected to reach 74 indeveloping countries by 2050. Between 1900 <strong>and</strong> 2004,life expectancy in the United States increased from 47to 77 years <strong>and</strong> is projected to reach 82 years by 2050.Bad news. In the world’s poorest <strong>and</strong> least developedcountries, mainly in Africa, life expectancy is 49years or less. In many African countries life expectancyis expected to fall further because of more deaths fromAIDS.Infant mortality is viewed as the best single measureof a society’s quality of life because it reflects acountry’s general level of nutrition <strong>and</strong> health care. Ahigh infant mortality rate usually indicates insufficientfood (undernutrition), poor nutrition (malnutrition),182 CHAPTER 10 Applying Population Ecology: The Human Population
<strong>and</strong> a high incidence of infectious disease (usuallyfrom contaminated drinking water <strong>and</strong> weakened diseaseresistance from undernutrition <strong>and</strong> malnutrition).Good news. Between 1965 <strong>and</strong> 2004, the world’s infantmortality rate dropped from 20 per 1,000 livebirths to 7 in developed countries <strong>and</strong> from 118 to 61in developing countries. Bad news. At least 8 millioninfants (most in developing countries) die of preventablecauses during their first year of life—an averageof 22,000 mostly unnecessary infant deaths perday. This is equivalent to 55 jumbo jets, each loadedwith 400 infants under age 1, crashing each day withno survivors!The U.S. infant mortality rate declined from 165 in1900 to 7 in 2004. This sharp decline was a major factorin the marked increase in U.S. average life expectancyduring this period.Still some 40 countries had lower infant mortalityrates than the United States in 2004. Three factors keepthe U.S. infant mortality rate higher than it could be:inadequate health care for poor women during pregnancy<strong>and</strong> for their babies after birth, drug addiction among pregnantwomen, <strong>and</strong> a high teenage birth rate.Number of legal immigrants (thous<strong>and</strong>s)2,0001,8001,6001,4001,2001,00080060040020001820 1840 1860 1880 1900 1920 1940 1960 1980 2000Year19071914New lawsrestrictimmigrationGreatDepression2010Figure 10-13 Legal immigration to the United States, 1820–2001.The large increase in immigration since 1989 resulted mostly fromthe Immigration Reform <strong>and</strong> Control Act of 1986, which grantedlegal status to illegal immigrants who could show they had beenliving in the country for several years. (Data from U.S. Immigration<strong>and</strong> Naturalization Service)Case Study: Should the United StatesEncourage or Discourage Immigration?Immigration has played <strong>and</strong> continues to play a majorrole in the growth <strong>and</strong> cultural diversity of the U.S.population.Only a few countries such as Canada, Australia, <strong>and</strong>the United States encourage immigration. And internationalmigration to developed countries absorbsonly about 1% of the annual population growth in developingcountriesSince 1820 the United States has admitted almosttwice as many immigrants as all other countries combined!However, the number of legal immigrants (includingrefugees) has varied during different periodsbecause of changes in immigration laws <strong>and</strong> rates ofeconomic growth (Figure 10-13). Currently, immigrationaccounts for about 41% of the country’s annualpopulation growth.Between 1820 <strong>and</strong> 1960, most legal immigrants tothe United States came from Europe. Since 1960, mosthave come from Latin America (51%) <strong>and</strong> Asia (30%),followed by Europe (13%).What is the largest minority group in the UnitedStates? Answer: Latinos (67% of them from Mexico)made up 14% of the U.S. population in 2003. By 2050Latinos are projected to make up one of every fourpeople in the United States.In 1995, the U.S. Commission on Immigration Reformrecommended reducing the number of legal immigrantsfrom about 900,000 to 700,000 per year for atransition period <strong>and</strong> then to 550,000 a year. Some analystswant to limit legal immigration to about 20% of thecountry’s annual population growth. They would acceptimmigrants only if they can support themselves,arguing that providing immigrants with public servicesmakes the United States a magnet for the world’s poor.There is also support for sharply reducing illegalimmigration. But some are concerned that a crackdownon the country’s 8–10 million illegal immigrants canalso lead to discrimination against legal immigrants.Proponents of reducing immigration argue that itwould allow the United States to stabilize its populationsooner <strong>and</strong> help reduce the country’s enormousenvironmental impact. The public strongly supportsreducing U.S. immigration levels. A January 2002Gallup poll found that 58% of the people polled believedthat immigration rates should be reduced (upfrom 45% in January 2001). A 1993 Hispanic ResearchGroup survey found that 89% of Hispanic Americanssupported an immediate moratorium on immigration.Others oppose reducing current levels of legal immigration.They argue that this would diminish thehistorical role of the United States as a place of opportunityfor the world’s poor <strong>and</strong> oppressed. In addition,immigrants pay taxes, take many menial <strong>and</strong> lowpayingjobs that other Americans shun, open businesses,<strong>and</strong> create jobs. Moreover, according to the U.S.Census Bureau, after 2020 higher immigration levelswill be needed to supply enough workers as babyboomers retire.xHOW WOULD YOU VOTE? Should immigration into theUnited States (or the country where you live) be reduced?Cast your vote online at http://biology.brookscole.com/miller14.http://biology.brookscole.com/miller14183
10-2 POPULATION AGE STRUCTUREWhat Are Age Structure Diagrams?Sorting People by Age GroupsThe number of people in young, middle, <strong>and</strong> olderage groups determines how fast populations growor decline.As mentioned earlier, even if the replacement-levelfertility rate of 2.1 were magically achieved globallytomorrow, the world’s population would keep growingfor at least another 50 years (assuming no large increasein death rates). The reason is a population’s agestructure: the distribution of males <strong>and</strong> females ineach age group.Demographers construct a population age structurediagram by plotting the percentages or numbersof males <strong>and</strong> females in the total population in each ofthree age categories: prereproductive (ages 0–14), reproductive(ages 15–44), <strong>and</strong> postreproductive (ages 45 <strong>and</strong>up). Figure 10-14 presents generalized age structurediagrams for countries with rapid, slow, zero, <strong>and</strong> negativepopulation growth rates. Which of these figuresbest represents the country where you live?Figure 10-15 shows how the age structure diagramfor the United States changed between 1900 <strong>and</strong> 2000<strong>and</strong> how it is projected to change by 2050.How Does Age Structure Affect PopulationGrowth? Teenagers Are the Population Waveof the FutureThe number of people under age 15 is the major factordetermining a country’s future population growth.Any country with many people below age 15 (representedby a wide base in Figure 10-14, left) has a powerfulbuilt-in momentum to increase its populationsize unless death rates rise sharply. The number ofbirths will rise even if women have only one or twochildren, because a large number of girls will soon bemoving into their reproductive years.What is perhaps the world’s most important populationstatistic? Answer: 30% of the people on theplanet were under 15 years old in 2004. These 1.9 billionyoung people are poised to move into their prime reproductiveyears. In developing countries the numberis even higher: 33%, compared with 17% in developedcountries.We live in a demographically divided world. To seewhy, look at Figures 10-16 <strong>and</strong> 10-17 (p. 186).How Can Age Structure DiagramsBe Used to Make Population <strong>and</strong> EconomicProjections? Looking into a Crystal BallChanges in the distribution of a country’s age groupshave long-lasting economic <strong>and</strong> social impacts.Between 1946 <strong>and</strong> 1964, the United States had a babyboom that added 79 million people to its population.Over time this group looks like a bulge moving upthrough the country’s age structure (Figure 10-18,p. 186).Baby boomers now make up nearly half of alladult Americans. As a result, they dominate the population’sdem<strong>and</strong> for goods <strong>and</strong> services. They also playan increasingly important role in deciding who getselected <strong>and</strong> what laws are passed. Baby boomers whocreated the youth market in their teens <strong>and</strong> 20s areMaleFemaleMaleFemaleMaleFemaleMaleFemaleRapid Growth Slow Growth Zero Growth Negative GrowthGuatemalaNigeriaSaudi ArabiaUnited StatesAustraliaCanadaSpainAustriaGreeceGermanyBulgariaSwedenAges 0–14 Ages 15–44 Ages 45–85+Figure 10-14 Generalized population age structure diagrams for countries with rapid (1.5–3%), slow(0.3–1.4%), zero (0–0.2%), <strong>and</strong> negative population growth rates (a declining population). (Data from PopulationReference Bureau)184 CHAPTER 10 Applying Population Ecology: The Human Population
Age100+95–9990–9485–8980–8475–7970–7465–6960–6455–5950–5445–4940–4435–3930–3425–2920–2415–1910–145–90–4MaleFemale6 5 4 3 2 1 0 1 2 3 4 5 6Percentage of population 1900Figure 10-15 U.S. population by age <strong>and</strong> sex, 1900, 2000, <strong>and</strong>2050 (projected). (Data from U.S. Census Bureau)5 4 3 2 1 0 1 2 3 4 5Percentage of population 20004 3 2 1 0 1 2 3 4Percentage of population 2050Developed Countriesnow creating the 50-something market <strong>and</strong> will soonmove on to create a 60-something market. In 2011 thefirst baby boomers will turn 65, <strong>and</strong> the number ofAmericans over age 65 will grow sharply through2029. According to some analysts, the retirement ofbaby boomers is likely to create a shortage of workersin the United States unless immigrant workers replacesome of these retirees.Much of the economic burden of helping supporta large number of retired baby boomers will fall on thebaby-bust generation. It consists of people born between1965 <strong>and</strong> 1976 (when TFRs fell sharply to below 2.1;Figure 10-7).Retired baby boomers are likely to use their politicalclout to force the smaller number of people in thebaby-bust generation to pay higher income, healthcare,<strong>and</strong> Social Security taxes.In other respects, the baby-bust generation shouldhave an easier time than the baby-boom generation.Fewer people will be competing for educational opportunities,jobs, <strong>and</strong> services. Also, labor shortagesmay drive up their wages, at least for jobs requiringeducation or technical training beyond high school.However, this may not happen, if many Americanownedcompanies operating at the global level (multinationalcompanies) continue to export many low- <strong>and</strong>high-paying jobs to other countries.Members of the baby-bust group may find it difficultto get job promotions as they reach middle age becausemembers of the much larger baby-boom groupwill occupy most upper-level positions. Many babyboomers may delay retirement because of improvedhealth, the need to accumulate adequate retirementfunds, or extension of the retirement age needed to begincollecting Social Security. The baby-bust generationAgeAge85+80–8575–7970–7465–6960–6455–5950–5445–4940–4435–3930–3425–2920–2415–1910–145–90–485+80–8575–7970–7465–6960–6455–5950–5445–4940–4435–3930–3425–2920–2415–1910–145–90–4MaleFemale300 200 100 0 100 200 300Population (millions)Developing CountriesMaleFemale300 200 100 0 100 200 300Population (millions)Figure 10-16 Population structure by age <strong>and</strong> sex in developingcountries <strong>and</strong> developed countries, 2004. (Data from UnitedNations Population Division <strong>and</strong> Population Reference Bureau)http://biology.brookscole.com/miller14185
Population(2004)Populationprojected(2025)InfantmortalityrateLifeexpectancy6.7United States (highly developed)Brazil (moderately developed)Nigeria (less developed)179 million137 million33Total fertility2.0rate (TFR) 2.2%Populationunderage 15%Populationoverage 6512%6%3%Per capitaGDP PPP $7,450$80021%211 million206 million294 million349 million77 years71 years52 years30%5.744%Figure 10-17 Comparison of key demographic indicators in2004 for three countries, one highly developed (United States),one moderately developed (Brazil), <strong>and</strong> one less developed(Nigeria). (Data from Population Reference Bureau)100$36,110is being followed by the echo-boom generation consistingof people born since 1977.From these few projections, we can see that anybooms or busts in the age structure of a population createsocial <strong>and</strong> economic changes that ripple through asociety for decades.What Are Some Effects of Population Declinefrom Reduced Fertility? Sliding Down a HillToo Fast Can HurtRapid population decline as a result of more olderpeople <strong>and</strong> fewer young people can lead to longlastingeconomic <strong>and</strong> social problems.The populations of most of the world’s countries areprojected to grow throughout most of this century. By2004, however, 40 countries had populations that wereeither stable (annual growth rates at or below 0.3%) ordeclining. All are in Europe, except Japan. This meansthat about 14% of humanity (896 million people) livesin countries with stable or declining populations. By2050, the United Nations projects, the population sizeof most developed countries (but not the UnitedStates) will have stabilized.As the age structure of the world’s populationchanges <strong>and</strong> the percentage of people age 60 or olderincreases (Figure 10-19), more countries will begin experiencingpopulation declines. If population declineis gradual, its harmful effects usually can be managed.But rapid population decline, like rapid populationgrowth, can lead to serious economic <strong>and</strong> socialproblems. A country undergoing rapid population declinebecause of a “baby bust” or “birth dearth” has aAgeAgeAgeAgeFemales504080+706060MalesFemales80+70605040MalesFemales60504080+70MalesFemales80+70605040Males195530201008 4 4812162020 1612Millions302010012 1620819858 4 420 1612 24Millions242015302010012 162088 4 420 1612 24Millions24302010012 1620820358 4 420 1612 24Millions24Figure 10-18 Tracking the baby-boom generation in the United States. (Data from Population ReferenceBureau <strong>and</strong> U.S. Census Bureau)186 CHAPTER 10 Applying Population Ecology: The Human Population
Age Distribution (%)40353025201510501950 1970 1990 2010 2030 2050 2070 2090 2110 2130 2150YearUnder age 15 Age 60 or over Age 80 or overFigure 10-19 Global aging. Projected percentage of worldpopulation under age 15, age 60 or over, <strong>and</strong> age 80 or over,1950–2150, assuming the medium fertility projection shown inFigure 10-6. Between 1998 <strong>and</strong> 2050 the number of peopleover age 80 is projected to increase from 66 million to 370 million.The cost of supporting a much larger elderly population willplace enormous strains on the world’s economy. (Data from theUnited Nations)sharp rise in the proportion of older people. They consumean increasingly larger share of medical care, socialsecurity funds, <strong>and</strong> other costly public servicesfunded by a decreasing number of working taxpayers.Such countries can also face labor shortages unlessthey rely more on greatly increased automation or immigrationof foreign workers.Without babies to replenish the labor force <strong>and</strong>pay taxes, governments of countries such as Japan <strong>and</strong>some European countries facing rapid population declinewill have a hard time funding the pensions ofpeople who are living longer. To keep their finances inthe black they will probably need to take unpopularsteps, such as raising the retirement age, cutting retirementbenefits, raising taxes, <strong>and</strong> increasing legalimmigration.What Are Some Effects of PopulationDecline from a Rise in Death Rates? TheAIDS TragedyLarge numbers of deaths from AIDS disrupt acountry’s social <strong>and</strong> economic structure by removingmany young adults from its age structure.Globally between 2000 <strong>and</strong> 2050, AIDS is projected tocause the premature deaths of 278 million people in 53countries—38 of them in Africa. These prematuredeaths are almost equal to the entire current populationof the United States. Read this paragraph again<strong>and</strong> think about the enormity of this tragedy.Hunger <strong>and</strong> malnutrition kill mostly infants <strong>and</strong>children, but AIDS kills many young adults. Thischange in the age structure of a country has a numberof harmful effects. One is a sharp drop in average lifeexpectancy. In 16 African countries where up to a thirdof the adult population is infected with HIV, life expectancycould drop to 35–40 years of age.Another effect is a loss of a country’s most productiveyoung adult workers <strong>and</strong> trained personnel suchas scientists, farmers, engineers, teachers, <strong>and</strong> government,business, <strong>and</strong> health-care workers. This causes asignificant increase in the number of orphans whoseparents have died from AIDS—with 40 million orphansprojected in Africa by 2010. It also causes a sharpdrop in the number of productive adults available tosupport the young <strong>and</strong> elderly <strong>and</strong> to grow food.Analysts call for the international community—especially developed countries—to develop <strong>and</strong> funda massive program to help countries ravaged by AIDSin Africa <strong>and</strong> elsewhere. The program would have twomajor goals. One is to reduce the spread of HIVthrough a combination of improved education <strong>and</strong>health care. The other is to provide financial assistancefor education <strong>and</strong> health care <strong>and</strong> volunteer teachers<strong>and</strong> health-care <strong>and</strong> social workers to help compensatefor the missing young adult generation.10-3 SOLUTIONS: INFLUENCINGPOPULATION SIZEWhat Are the Advantages <strong>and</strong> Disadvantagesof Reducing Births? An ImportantControversyThere is disagreement over whether the worldshould encourage or discourage populationgrowth.The projected increase of the human population from6.4 to 8.9 billion or more between 2004 <strong>and</strong> 2050 (Figure10-6) raises an important question: Can the worldprovide an adequate st<strong>and</strong>ard of living for 2.5 billion morepeople without causing widespread environmental damage?Controversy surrounds this <strong>and</strong> two related questions:whether the earth is overpopulated, <strong>and</strong> whatmeasures, if any, should be taken to slow populationgrowth. To some the planet is already overpopulated.To others we should encourage population growthto help stimulate economic growth by having moreconsumers.Some analysts believe that asking how many peoplethe world can support is the wrong question. Theyliken it to asking how many cigarettes one can smokebefore getting lung cancer. Instead, they say, we shouldbe asking what the optimum sustainable population of theearth might be, based on the planet’s cultural carryingcapacity See the Guest Essay by Garrett Hardin on thishttp://biology.brookscole.com/miller14187
topic on the website for this chapter. Such an optimumlevel would allow most people to live in reasonablecomfort <strong>and</strong> freedom without impairing the ability ofthe planet to sustain future generations.What is the optimum population size for the world(or for a particular country)? No one knows. Some considerit a meaningless concept; some put it at 20 billion,others at 8 billion, <strong>and</strong> others as low as 2 billion.Those who do not believe the earth is overpopulatedpoint out that the average life span of the world’s6.4 billion people is longer today than at any time in thepast <strong>and</strong> is projected to get longer. They say that theworld can support billions more people. They also seemore people as the most valuable resource for solvingthe problems we face <strong>and</strong> stimulating economic growthby becoming consumers.Some believe that all people should be free to haveas many children as they want. And some view anyform of population regulation as a violation of their religiousbeliefs. Others see it as an intrusion into theirprivacy <strong>and</strong> personal freedom. Some developing countries<strong>and</strong> some members of minorities in developedcountries regard population control as a form of genocideto keep their numbers <strong>and</strong> power from rising.Proponents of slowing <strong>and</strong> eventually stoppingpopulation growth have a different view. They pointout that we fail to provide the basic necessities for oneout of six people on the earth today. If we cannot orwill not do this now, they ask, how will we be able todo this for the projected 2.5 billion more people by2050?Proponents of slowing population growth warnof two serious consequences if we do not sharplylower birth rates. One possibility is a higher death ratebecause of declining health <strong>and</strong> environmental conditionsin some areas—something that is alreadyhappening in parts of Africa. Another is increased resourceuse <strong>and</strong> environmental harm as more consumersincrease their already large ecological footprintin developed countries <strong>and</strong> in developing countriessuch as China <strong>and</strong> India that are undergoing rapideconomic growth.Population increase <strong>and</strong> the consumption thatgoes with it can increase environmental stresses suchas infectious disease, biodiversity losses, loss of tropicalforests, fisheries depletion, increasing water scarcity, pollutionof the seas, <strong>and</strong> climate change.Proponents of this view recognize that populationgrowth is not the only cause of these problems. Butthey argue that adding several hundred million morepeople in developed countries <strong>and</strong> several billionmore in developing countries can only intensify existingenvironmental <strong>and</strong> social problems.These analysts believe people should have thefreedom to produce as many children as they want,but only if it does not reduce the quality of other people’slives now <strong>and</strong> in the future, either by impairingthe earth’s ability to sustain life or by causing socialdisruption. They point out that limiting the freedom ofindividuals to do anything they want, in order to protectthe freedom of other individuals, is the basis ofmost laws in modern societies.xHOW WOULD YOU VOTE? Should the population of thecountry where you live be stabilized as soon as possible?Cast your vote online at http://biology.brookscole.com/miller14.How Can Economic Development HelpReduce Birth Rates? Economics Worked Once,But Will It Work Again?History indicates that as countries becomeeconomically developed, their birth <strong>and</strong> deathrates decline.Demographers have examined the birth <strong>and</strong> deathrates of western European countries that industrializedduring the 19th century. From these data they developeda hypothesis of population change known asthe demographic transition: as countries become industrialized,first their death rates <strong>and</strong> then their birthrates decline.According to this hypothesis, the transition takesplace in four stages (Figure 10-20):First is the preindustrial stage, when there is littlepopulation growth because harsh living conditionslead to both a high birth rate (to compensate for highinfant mortality) <strong>and</strong> a high death rate.Next is the transitional stage, when industrializationbegins, food production rises, <strong>and</strong> health care improves.Death rates drop <strong>and</strong> birth rates remain high,so the population grows rapidly (typically 2.5–3% ayear).During the third phase, called the industrial stage,the birth rate drops <strong>and</strong> eventually approachesthe death rate as industrialization, medical advances,<strong>and</strong> modernization become widespread. Populationgrowth continues, but at a slower <strong>and</strong> perhaps fluctuatingrate, depending on economic conditions. Mostdeveloped countries <strong>and</strong> a few developing countriesare in this third stage.The last phase is the postindustrial stage, when thebirth rate declines further, equaling the death rate <strong>and</strong>reaching zero population growth. Then the birth ratefalls below the death rate <strong>and</strong> population size decreasesslowly. Forty countries containing about 14%of the world’s population have entered this stage <strong>and</strong>more of the world’s developed countries are expectedto enter this phase by 2050.188 CHAPTER 10 Applying Population Ecology: The Human Population
80Stage 1PreindustrialStage 2TransitionalStage 3IndustrialStage 4PostindustrialHighFigure 10-20Generalized modelof the demographictransition.Birth rate <strong>and</strong> death rate(number per 1,000 per year)706050403020100Birth rateTotal populationDeath rateLow Increasing Very high Decreasing Low Zero NegativeGrowth rate over timeRelative population sizeLowIn most developing countries today, death rateshave fallen much more than birth rates. In otherwords, these developing countries are still in the transitionalstage, halfway up the economic developmentladder, with high population growth rates.Some economists believe that developing countrieswill make the demographic transition over thenext few decades. But some population analysts fearthat the still-rapid population growth in many developingcountries will outstrip economic growth <strong>and</strong>overwhelm local life-support systems. This couldcause many of these countries to be caught in a demographictrap at stage 2, the transition stage. This is nowhappening in a number of developing countries, especiallyin Africa. Indeed, some of the countries in Africabeing ravaged by the HIV/AIDS epidemic are fallingback to stage 1 as their death rates rise.Analysts also point out that some of the conditionsthat allowed developed countries to develop arenot available to many of today’s developing countries.One problem is a shortage of skilled workers to producethe high-tech products necessary to compete intoday’s global economy. Another is a lack of the financialcapital <strong>and</strong> other resources that allow rapid economicdevelopment.Two other problems hinder economic developmentin many developing countries. One is a sharp risein their debt to developed countries. Much of the incomeof such countries must be used to pay the intereston their debts. This leaves too little money for improvingsocial, health, <strong>and</strong> environmental conditions.Another problem is that since 1980 developingcountries have been receiving less economic assistancefrom developed countries. Indeed, since themid-1980s, developing countries have paid developedcountries $40–50 billion a year (mostly in debtinterest) more than they have received from thesecountries.How Can Family Planning Help Reduce Birth<strong>and</strong> Abortion Rates <strong>and</strong> Save Lives? Planningfor Babies WorksFamily planning has been a major factor in reducingthe number of births <strong>and</strong> abortions throughout mostof the world.Family planning provides educational <strong>and</strong> clinicalservices that help couples choose how many childrento have <strong>and</strong> when to have them. Such programs varyfrom culture to culture, but most provide informationon birth spacing, birth control, <strong>and</strong> health care forpregnant women <strong>and</strong> infants.Family planning has helped raise the use of modernforms of contraception by married women in theirreproductive years in developing countries from 10%of in the 1960s to 51% in 2004.Studies also show that family planning has beenresponsible for at least 55% of the drop in TFRs in developingcountries, from 6 in 1960 to 3.1 in 2004. Twoexamples of countries that have sharply reduced theirpopulation growth are Thail<strong>and</strong> (p. 176) <strong>and</strong> Iran(Case Study, p. 190). Family planning has also reducedthe number of legal <strong>and</strong> illegal abortions per year <strong>and</strong>the risk of maternal <strong>and</strong> fetus death from pregnancy.Despite such successes, there is also some badnews. First, according to John Bongaarts of the PopulationCouncil <strong>and</strong> the United Nations Population Fund,42% of all pregnancies in the developing countries areunplanned <strong>and</strong> 26% end with abortion. Second, an estimated150 million women in developing countrieswant to limit the number <strong>and</strong> determine the spacing oftheir children, but they lack access to contraceptiveservices. According to the United Nations, extendingfamily planning services to these women <strong>and</strong> to thosewho will soon be entering their reproductive yearscould prevent an estimated 5.8 million births a year<strong>and</strong> more than 5 million abortions a year!http://biology.brookscole.com/miller14189
Some analysts call for exp<strong>and</strong>ing family planningprograms to include teenagers <strong>and</strong> sexually active unmarriedwomen, who are excluded in many existingprograms. For teenagers, many advocate much greateremphasis on abstinence.Another suggestion is to develop programs thateducate men about the importance of having fewerchildren <strong>and</strong> taking more responsibility for raisingthem. Proponents also call for greatly increased researchon developing new, more effective, <strong>and</strong> moreacceptable birth control methods for men.Finally, a number of analysts urge pro-choice <strong>and</strong>pro-life groups to join forces in greatly reducingunplanned births <strong>and</strong> abortions, especially amongteenagers.Case Study: Family Planning in Iran:A Success StorySince 1989 Iran has used family planning <strong>and</strong> publiceducation to cut its rate of population growth in half<strong>and</strong> reduce the average number of children perwoman from 7 to 2.5.When Ayatollah Khomeini assumed power in Iran in1979, he did away with the family planning programsthe Shah of Iran had put into place in 1967. He sawlarge families as a way to increase the size of hisarmy.Iranians responded <strong>and</strong> the country’s populationgrowth reached 4.4%—one of the world’s highestrates. But this rapid growth in numbers began to overburdenthe country’s economy <strong>and</strong> environment.In 1989, the government reversed its policy <strong>and</strong> restoredits family planning program. Governmentagencies were mobilized to raise public awareness ofpopulation issues, encourage smaller families, <strong>and</strong>provide free modern contraception. Religious leadershelped by mounting a crusade for smaller families. TVstations were used to provide family planning informationthroughout the country.Iran became the first country to require couples totake a class on contraception before they could receivea marriage license. Between 1970 <strong>and</strong> 2000, the countryalso increased female literacy from 25% to 70% <strong>and</strong>female school enrollment from 60% to 90%.These efforts paid off. Between 1989 <strong>and</strong> 2004, thecountry cut its population growth rate from 2.5% to1.2% <strong>and</strong> its average family size from 7 children to2.5—a remarkable change in 15 years.How Can Empowering Women Help ReduceBirth Rates? Ensuring Education, Jobs, <strong>and</strong>RightsWomen tend to have fewer children if they are educated,have a paying job outside the home, <strong>and</strong> do nothave their human rights suppressed.What key factors lead women to have fewer <strong>and</strong>healthier children? Three things: education, payingjobs outside the home, <strong>and</strong> living in societies wheretheir rights are not suppressed.Roughly half of the world’s people are female.Women do almost all of the world’s domestic work<strong>and</strong> childcare, with little or no pay. Women also providemore unpaid health care than all the world’s organizedhealth services combined.They also do 60–80% of the work associated withgrowing food, gathering fuelwood, <strong>and</strong> hauling waterin rural areas of Africa, Latin America, <strong>and</strong> Asia (Figure10-21). As one Brazilian woman put it, “For poorwomen the only holiday is when you are asleep.”Globally women account for two-thirds of allhours worked but receive only 10% of the world’s income,<strong>and</strong> they own less than 2% of the world’s l<strong>and</strong>.In most developing countries, women do not have thelegal right to own l<strong>and</strong> or to borrow money. Women4:45 A.M.Wake,wash, <strong>and</strong>eat5:00 A.M.-5:30 A.M.Walk tofields5:30 A.M.-3:00 P.M.Work infields3:00 P.M.-4:00 P.M.Collectfirewood4:00 P.M.-5:30 P.M.Pound <strong>and</strong>grind corn5:30 P.M.-6:30 P.M.Collectwater6:30 P.M.-8:30 P.M.Cook forfamily <strong>and</strong>eat8:30 P.M.-9:30 P.M.Washdishes<strong>and</strong> children9:30 P.M.Go to bedFigure 10-21 Typical workday for a woman in rural Africa. In addition to their domestic work, rural Africanwomen perform about 75% of all agricultural work. (Data from United Nations)190 CHAPTER 10 Applying Population Ecology: The Human Population
also make up 70% of the world’s poor <strong>and</strong> 60% of the875 million illiterate adults worldwide who can neitherread nor write.Women’s representation in governments has beengradually increasing. Yet, only 11 of the world’s 190heads of state are women, <strong>and</strong> women hold just 14% ofthe seats in the world’s parliaments.According to United Nations Population Agency’sexecutive director Thorya Obaid, “Many women in thedeveloping world are trapped in poverty by illiteracy,poor health, <strong>and</strong> unwanted high fertility. All of thesecontribute to environmental degradation <strong>and</strong> tightenthe grip of poverty. If we are serious about sustainabledevelopment, we must break this vicious cycle.”Breaking out of this trap means giving womeneverywhere full legal rights <strong>and</strong> the opportunity to becomeeducated <strong>and</strong> earn income outside the home.Achieving this would slow population growth, promotehuman rights <strong>and</strong> freedom, reduce poverty, <strong>and</strong>slow environmental degradation—a win-win result.Empowering women by seeking gender equalitywill take some major social changes. This will be difficultto achieve in male-dominated societies but it canbe done.Good news. An increasing number of women in developingcountries are taking charge of their lives <strong>and</strong>reproductive behavior. They are not waiting around forthe slow processes of education <strong>and</strong> cultural change.As it exp<strong>and</strong>s, such bottom-up change by individualwomen will play an important role in stabilizing population<strong>and</strong> providing women with equal rights.Percentageof worldpopulationPopulationPopulation (2025)(estimated)Illiteracy (% of adults)Population under age 15 (%)Population growth rate (%)Total fertility rateInfant mortality rate1.7%0.6%17%22%17%20%1.1 billion1.3 billion1.4 billion1.4 billion36%6410-4 CASE STUDIES: INDIAAND CHINAWhat Success Has India Had in ControllingIts Population Growth? Some Progress butNot EnoughFor over five decades India has tried to control itspopulation growth with only modest success.The world’s first national family planning program beganin India in 1952, when its population was nearly400 million. In 2004, after 52 years of population controlefforts, India was the world’s second most populouscountry, with a population of 1.1 billion.In 1952, India added 5 million people to its population.In 2004 it added 18 million. Figure 10-22 comparesdemographic data for India <strong>and</strong> China.India faces a number of already serious poverty,malnutrition, <strong>and</strong> environmental problems that couldworsen as its population continues to grow rapidly. Byglobal st<strong>and</strong>ards, India’s people are poor. Nearly halfof India’s labor force is unemployed or can find onlyoccasional work.India currently is self-sufficient in food grain production.Still, about 40% of its population <strong>and</strong> 53% ofits children suffer from malnutrition, mostly becauseof poverty.Furthermore, India faces serious resource <strong>and</strong> environmentalproblems. With 17% of the world’s people,it has just 2.3% of the world’s l<strong>and</strong> resources <strong>and</strong>2% of the world’s forests. About half of the country’scropl<strong>and</strong> is degraded as a result of soil47%IndiaChina3.1 children per women (down from 5.3 in 1970)1.7 children per women (down from 5.7 in 1972)32erosion, waterlogging, salinization, overgrazing,<strong>and</strong> deforestation. In addition,over two-thirds of India’s water is seriouslypolluted <strong>and</strong> sanitation services oftenare inadequate.Without its long-st<strong>and</strong>ing familyplanning program, India’s population<strong>and</strong> environmental problems would begrowing even faster. Still, to its supportersthe results of the program have beendisappointing for several reasons: poorplanning, bureaucratic inefficiency, thelow status of women (despite constitutionalguarantees of equality), extremepoverty, <strong>and</strong> lack of administrative <strong>and</strong>financial support.Life expectancyGDP PPP per capita$2,65062 years71 years$4,520Figure 10-22 Comparison of basic demographicdata for India (green) <strong>and</strong> China (yellow)in 2004. (Data from United Nations <strong>and</strong>Population Reference Bureau).http://biology.brookscole.com/miller14191
The government has provided information aboutthe advantages of small families for years. Yet Indianwomen still have an average of 3.1 children. One reasonis that most poor couples believe they need manychildren to do work <strong>and</strong> care for them in old age. Anotheris the strong cultural preference for male children,which means some couples keep having childrenuntil they produce one or more boys. These factors inpart explain why even though 90% of Indian couplesknow of at least one modern birth control method,only 43% actually use one.Population experts expect China’s population topeak around 2040 <strong>and</strong> then begin a slow decline. Thishas led some members of China’s parliament to call foramending the country’s one-child policy so that someurban couples can have a second child. The goalwould be to provide more workers to help supportChina’s aging population.What lesson can other countries learn from China?One possibility is to try to curb population growth beforethey must choose between mass starvation <strong>and</strong> coercivemeasures that severely restrict human freedom.What Success Has China Had in ControllingIts Population Growth? Good Progress,Enforced with an Iron H<strong>and</strong>Since 1970 China has used a government-enforcedprogram to cut its birth rate in half <strong>and</strong> sharplyreduce its total fertility rate.Since 1970, China has made impressive efforts to feedits people <strong>and</strong> bring its population growth under control.Between 1972 <strong>and</strong> 2004, China cut its crude birthrate in half <strong>and</strong> cut its total fertility rate from 5.7 to 1.7children per woman (Figure 10-22).To achieve its sharp drop in fertility, China hasestablished the world’s most extensive, intrusive, <strong>and</strong>strict population control program. Couples are stronglyurged to postpone marriage <strong>and</strong> to have no more thanone child. Married couples who pledge to have no morethan one child receive extra food, larger pensions, betterhousing, free medical care, salary bonuses, freeschool tuition for their one child, <strong>and</strong> preferential treatmentin employment when their child enters the jobmarket. Couples who break their pledge lose suchbenefits.The government also provides married coupleswith ready access to free sterilization, contraceptives,<strong>and</strong> abortion. This helps explain why about 83% ofmarried women in China use modern contraception.Government officials realized in the 1960s that theonly alternative to strict population control was massstarvation. China is a dictatorship. Thus, unlike India,it has been able to impose a fairly consistent populationpolicy throughout its society.China has 21% of the world’s population. But ithas only 7% of the world’s fresh water <strong>and</strong> cropl<strong>and</strong>,4% of its forests, <strong>and</strong> 2% of its oil. Soil erosion in Chinais serious <strong>and</strong> apparently getting worse. In the 1970s,the Chinese government had a system of health clinicsthat provided basic health care for its huge rural farmpopulation. This system collapsed in the 1980s asChina embraced capitalist economic reforms. Accordingto government estimates, more than 800 millionpeople—9 of every 10 rural Chinese—now have nohealth insurance or social safety net.10-5 CUTTING GLOBAL POPULATIONGROWTHWhat Can We Do to Slow Population Growth?A New VisionExperience indicates that the best way to slowpopulation growth is a combination of investingin family planning, reducing poverty, <strong>and</strong> elevatingthe status of women.In 1994, the United Nations held its third once-in-adecadeConference on Population <strong>and</strong> Developmentin Cairo, Egypt. One of the conference’s goals was toencourage action to stabilize the world’s population at7.8 billion by 2050 instead of the projected 8.9 billion.The major goals of the resulting population plan, endorsedby 180 governments, are to do the followingby 2015:■ Provide universal access to family planning services<strong>and</strong> reproductive health care■ Improve health care for infants, children, <strong>and</strong> pregnantwomen■ Develop <strong>and</strong> implement national populationpolices■ Improve the status of women <strong>and</strong> exp<strong>and</strong> education<strong>and</strong> job opportunities for young women■ Provide more education, especially for girls <strong>and</strong>women■ Increase the involvement of men in child-rearingresponsibilities <strong>and</strong> family planning■Sharply reduce poverty■ Greatly reduce unsustainable patterns of production<strong>and</strong> consumptionThis is a tall order. But it can be done if developed<strong>and</strong> developing nations work together to implementsuch reforms. Some good news is that the experience ofJapan, Thail<strong>and</strong>, South Korea, Taiwan, Iran, <strong>and</strong> Chinaindicates that a country can achieve or come close toreplacement-level fertility within a decade or two.192 CHAPTER 10 Applying Population Ecology: The Human Population
Such experience also suggests that the best way toslow population growth is a combination of investingin family planning, reducing poverty, <strong>and</strong> elevatingthe status of women.In this chapter you have learned how the ecologicalprinciples of population dynamics can be appliedto the human population. In the next three chapters,you will learn how various principles of ecology canbe applied to help sustain the earth’s biodiversity.Our numbers exp<strong>and</strong> but Earth’s natural systems do not.LESTER R. BROWNCRITICAL THINKING1. Why is it rational for a poor couple in a developingcountry such as India to have four or five children? Whatchanges might lead such a couple to consider their behaviorirrational?2. Choose what you consider to be a major local, national,or global environmental problem, <strong>and</strong> describethe role of population growth in this problem. Compareyour answer with those of your classmates.3. Do you believe the population of (a) your own country<strong>and</strong> (b) the area where you live is too high? Explain.4. Should everyone have the right to have as many childrenas they want? Explain.5. Some people have proposed that the earth could solveits population problem by shipping people off to spacecolonies, each containing about 10,000 people. Assumingwe could build such large-scale, self-sustaining spacestations, how many people would have to be shipped offeach day to provide living spaces for the 80 million peopleadded to the earth’s population this year? Currentspace shuttles can h<strong>and</strong>le about 6 to 8 passengers. If thiscapacity could be increased to 100 passengers per shuttle,how many shuttles would have to be launched perday to offset the 80 million people added this year? Accordingto your calculations, determine whether thisproposal is a logical solution to the earth’s populationproblem.6. Some people believe the most important goal is tosharply reduce the rate of population growth in developingcountries, where 97% of the world’s populationgrowth is expected to take place. Some people in developingcountries agree that population growth in thesecountries can cause local environmental problems. Butthey contend that the most serious environmental problemthe world faces is disruption of the global lifesupportsystem for the human species by high levels ofresource consumption per person in developed countries,which use 80% of the world’s resources. What isyour view on this issue? Explain.7. Suppose the cloning of human beings becomes possiblewithout any serious health effects for cloned individuals.What effect might this have on the world’spopulation size <strong>and</strong> growth rate? Explain.8. Congratulations! You are in charge of the world. Listthe three most important features of your populationpolicy.PROJECTS1. Assume your entire class (or manageable groups ofyour class) is charged with coming up with a plan forhalving the world’s population growth rate within thenext 20 years. Develop a detailed plan that wouldachieve this goal, including any differences betweenpolicies in developing countries <strong>and</strong> those in developedcountries. Justify each part of your plan. Try to anticipatewhat problems you might face in implementingthe plan, <strong>and</strong> devise strategies for dealing with theseproblems.2. Prepare an age structure diagram for your community.Use the diagram to project future population growth <strong>and</strong>economic <strong>and</strong> social problems.3. Use the library or the Internet to find bibliographic informationabout Paul Hawken <strong>and</strong> Lester R. Brown, whosequotes appear at the beginning <strong>and</strong> end of this chapter.4. Make a concept map of this chapter’s major ideas, usingthe section heads, subheads, <strong>and</strong> key terms (in boldface).See material on the website for this book abouthow to prepare concept maps.LEARNING ONLINEThe website for this book contains study aids <strong>and</strong> manyideas for further reading <strong>and</strong> research. They include achapter summary, review questions for the entire chapter,flash cards for key terms <strong>and</strong> concepts, a multiple-choicepractice quiz, interesting Internet sites, references, <strong>and</strong> aguide for accessing thous<strong>and</strong>s of InfoTrac ® College Editionarticles. Log on tohttp://biology.brookscole.com/miller14Then click on the Chapter-by-Chapter area, choose Chapter10, <strong>and</strong> select a learning resource.http://biology.brookscole.com/miller14193
11 ManagingSustaining Terrestrial Biodiversity:<strong>and</strong> Protecting EcosystemsBiodiversityCASE STUDYReintroducing Wolvesto YellowstoneFigure 11-1 The gray wolf is a threatenedspecies in the lower 48 states. Ranchers,hunters, miners, <strong>and</strong> loggers have vigorouslyopposed efforts to return this keystonespecies to its former habitat in the YellowstoneNational Park area. However, wolveswere reintroduced beginning in 1995 <strong>and</strong>now number several hundred.At one time the gray wolf (Figure 11-1) ranged overmost of North America. But between 1850 <strong>and</strong> 1900 anestimated 2 million wolves were shot, trapped, <strong>and</strong>poisoned by ranchers, hunters, <strong>and</strong>government employees. The idea wasto make the West <strong>and</strong> the Great Plainssafe for livestock <strong>and</strong> for big game animalsprized by hunters.It worked. When Congresspassed the U.S. Endangered SpeciesAct in 1973, only about 400–500 graywolves remained in the lower 48states, primarily in Minnesota <strong>and</strong>Michigan. In 1974 the U.S. Fish <strong>and</strong>Wildlife Service (USFWS) listed thegray wolf as endangered in all 48lower states except Minnesota. Alaskawas also not included because it had6,000–8,000 gray wolves.Ecologists recognize the importantrole this keystone predatorspecies once played in parts of theWest <strong>and</strong> the Great Plains. Thesewolves culled herds of bison, elk, caribou,<strong>and</strong> mule deer, <strong>and</strong> kept downcoyote populations. They also provideduneaten meat for scavengerssuch as ravens, bald eagles, bears,ermines, <strong>and</strong> foxes.In recent years, herds of elk,moose, <strong>and</strong> antelope have exp<strong>and</strong>ed.<strong>Their</strong> larger numbers have devastatedsome vegetation, increased erosion, <strong>and</strong> threatenedthe niches of other wildlife species. Reintroducing akeystone species such as the gray wolf into a terrestrialecosystem is one way to help sustain its biodiversity<strong>and</strong> prevent environmental degradation.In 1987, the USFWS proposed reintroducing graywolves into the Yellowstone ecosystem. This broughtangry protests. Some objections came from rancherswho feared the wolves would attack their cattle <strong>and</strong>sheep; one enraged rancher said that it was “like reintroducingsmallpox.” Other protests came fromhunters who feared the wolves would kill too manybig game animals, <strong>and</strong> from mining <strong>and</strong> logging companieswho worried the government would halt theiroperations on wolf-populated federal l<strong>and</strong>s.Since 1995, federal wildlife officials have caughtgray wolves in Canada <strong>and</strong> relocated them in YellowstoneNational Park <strong>and</strong> northern Idaho. By 2004 therewere about 760 gray wolves in thesetwo areas.<strong>Their</strong> presence is causing a cascadeof ecological changes in Yellowstone.With wolves around, elk aregathering less near streams <strong>and</strong>rivers. This has spurred the growthof aspen <strong>and</strong> willow trees that attractbeavers, <strong>and</strong> elk killed by wolvesare an important food source forgrizzlies.The wolves have cut coyotepopulations in half. This has increasedpopulations of smaller animalssuch as ground squirrels <strong>and</strong>foxes hunted by coyotes, providingmore food for eagles <strong>and</strong> hawks. Between1995 <strong>and</strong> 2002 the wolves alsokilled 792 sheep, 278 cattle, <strong>and</strong> 62dogs in the Northern Rockies.In 2003, the U.S. Fish <strong>and</strong>Wildlife Service downgraded thegray wolf throughout most of thelower 48 states from endangered tothreatened. In 2004, the agency proposedremoving wolves from protectionunder the Endangered SpeciesAct in Idaho <strong>and</strong> Montana. Thiswould allow private citizens in thesestates to kill wolves that are attacking livestock orpets on private l<strong>and</strong>s. Conservationists say this actionis premature, warning that it could undermine one ofthe nation’s most successful conservation efforts.Population growth, economic development, <strong>and</strong>poverty are exerting increasing pressure on theworld’s forests, grassl<strong>and</strong>s, parks, wilderness, <strong>and</strong>other terrestrial storehouses of biodiversity. This chapter<strong>and</strong> the two that follow are devoted to helping usunderst<strong>and</strong> <strong>and</strong> sustain the earth’s biodiversity.
Forests precede civilizations, deserts follow them.FRANÇOIS-AUGUSTE-RENÉ DE CHATEAUBRIANDBiodiversityThis chapter addresses the following questions:■■■■■■■■■■■How have human activities affected the earth’sbiodiversity?What is conservation biology? What roledoes bioinfomatics play in helping sustainbiodiversity?What are the major types of public l<strong>and</strong>s in theUnited States, <strong>and</strong> how are they used?Why are forest resources important, <strong>and</strong> how arethey used, managed, <strong>and</strong> sustained?How should forests in the United States be used,managed, <strong>and</strong> sustained?How serious is tropical deforestation, <strong>and</strong> how canwe help sustain tropical forests?What problems do parks face, <strong>and</strong> how should wemanage them?How should we establish, design, protect, <strong>and</strong>manage terrestrial nature reserves?What is wilderness, <strong>and</strong> why is it important?What is ecological restoration, <strong>and</strong> why is itimportant?What can we do to help sustain the earth’sbiodiversity?Increase Factors• Middle stages ofsuccession• Moderate environmentaldisturbance• Small changes inenvironmental conditions• Physically diverse habitat• EvolutionDecrease Factors• Extreme environmentalconditions• Large environmentaldisturbance• Intense environmentalstress• Severe shortages ofkey resources• Nonnative speciesintroduction• Geographic isolationFigure 11-2 Factors that tend to increase or decrease theearth’s biodiversity.some extent at least half <strong>and</strong> probably about 83% ofthe earth’s l<strong>and</strong> surface (excluding Antarctica <strong>and</strong>Greenl<strong>and</strong>).About 82% of temperate deciduous forests havebeen cleared, fragmented, <strong>and</strong> dominated becausetheir soils <strong>and</strong> climate are very favorable for growing11-1 HUMAN IMPACTSON TERRESTRIAL BIODIVERSITYHow Have Human Activities AffectedGlobal Biodiversity? Increasing OurEcological FootprintWe have depleted <strong>and</strong> degraded some of theearth’s biodiversity <strong>and</strong> these threats are expectedto increase.Figure 11-2 lists factors that tend to increase or decreasebiodiversity. Many of our activities decreasebiodiversity (Figure 11-3). According to biodiversityexpert Edward O. Wilson, “The natural world is everywheredisappearing before our eyes—cut to pieces,mowed down, plowed under, gobbled up, replaced byhuman artifacts.”Consider a few examples of how human activitieshave decreased <strong>and</strong> degraded the earth’s terrestrialbiodiversity. According to the results of a 2002 studyon the impact of the human ecological footprint on theearth’s l<strong>and</strong> (Figure 9-12, p. 172), we have disturbed toHuman ActivitiesAgriculture, industry, economicproduction <strong>and</strong> consumption, recreationDegradation <strong>and</strong> destructionof natural ecosystemsAlteration of natural chemicalcycles <strong>and</strong> energy flowsClimatechangeHuman PopulationSize <strong>and</strong> resource useDirect EffectsChanges in number <strong>and</strong>distribution of speciesPollution of air, water,<strong>and</strong> soilIndirect EffectsLoss ofbiodiversityFigure 11-3 Natural capital degradation: major connectionsbetween human activities <strong>and</strong> the earth’s biodiversity.http://biology.brookscole.com/miller14195
food <strong>and</strong> urban development. Chaparral <strong>and</strong> thornscrub, temperate grassl<strong>and</strong>s, temperate rain forests,<strong>and</strong> tropical dry forests have also been greatly disturbedby human activities. Tundra, tropical deserts,<strong>and</strong> l<strong>and</strong> covered with ice are the least disturbed biomesbecause their harsh climates <strong>and</strong> poor soils makethem unappealing to most human activities.In the United States, at least 95% of the virginforests in the lower 48 states have been logged for lumber<strong>and</strong> to make room for agriculture, housing, <strong>and</strong>industry. In addition, 98% of tallgrass prairie in theMidwest <strong>and</strong> Great Plains has disappeared, <strong>and</strong> 99%of California’s native grassl<strong>and</strong> <strong>and</strong> 85% of its originalredwood forests are gone.By some estimates, humans use, waste, or destroyabout 10–55% of the net primary productivity of theplanet’s terrestrial ecosystems. And biologists estimatethat the current global extinction rate of species is atleast 100 times <strong>and</strong> probably 1,000 to 10,000 timeswhat it was before humans existed.These threats to the world’s biodiversity are projectedto increase sharply by 2018 (Figure 11-4). Studythis figure carefully.Figure 11-5 outlines the goals, strategies, <strong>and</strong> tacticsfor preserving <strong>and</strong> restoring the earth’s terrestrialecosystems (as discussed in this chapter) <strong>and</strong> preventingthe premature extinction of species (as discussed inChapter 12). Sustaining aquatic diversity is discussedin Chapter 13.Why Should We Care About Biodiversity?Sustaining a Vital Part of the World’s LifeSupport SystemBiodiversity should be protected from degradationby human activities because it exists <strong>and</strong> becauseof its usefulness to us.Biodiversity researchers contend that we should act topreserve the earth’s overall diversity because its genes,species, ecosystems, <strong>and</strong> ecological processes havetwo types of value. One is intrinsic or existence valuebecause these components of biodiversity exist, regardlessof their use to us.The other is instrumental value because of theirusefulness to us. There are two major types of instrumentalvalues. One consists of use values that benefit usin the form of economic goods <strong>and</strong> services, ecologicalservices, recreation, scientific information, <strong>and</strong> preservingoptions for such uses in the future.Another type consists of nonuse values. One is theexistence value in knowing that a redwood forest,wilderness, or endangered species exists, even if wewill never see it or get direct use from it. Aesthetic valueis another nonuse value because many people appreciatea tree, forest, wild species, or a vista because of itsbeauty. Bequest value is a third type of nonuse value. Itis based on a willingness of some people to pay toprotect some forms of natural capital for use by futuregenerations.Arctic Circle30°N60°NORTHAMERICAEUROPEASIATropic Of CancerPacificOceanAtlanticOceanAFRICAPacificOcean0°150° 120° 90° 30°W 0° 60°E 90°150°Tropic Of Capricorn30°SSOUTHAMERICAIndianOceanAUSTRALIA60°Antarctic CircleANTARCTICAProjected Status of Biodiversity1998–2018Critical <strong>and</strong> endangeredThreatenedStable or intactFigure 11-4 Natural capital degradation: projected status of the earth’s biodiversity between 1998 <strong>and</strong> 2018.(Data from World Resources Institute, World Conservation Monitoring Center, <strong>and</strong> Conservation International)196 CHAPTER 11 Sustaining Terrestrial Biodiversity: Managing <strong>and</strong> Protecting Ecosystems
The Species ApproachGoalProtect species frompremature extinctionStrategies• Identify endangeredspecies• Protect their criticalhabitatsTactics• Legally protectendangered species• Manage habitat• Propagate endangeredspecies in captivity• Reintroduce species intosuitable habitatsThe Ecosystem ApproachGoalProtect populations ofspecies in their naturalhabitatsStrategyPreserve sufficient areasof habitats in differentbiomes <strong>and</strong> aquaticsystemsTactics• Protect habitat areasthrough private purchaseor government action• Eliminate or reducepopulations of nonnativespecies from protectedareas• Manage protected areasto sustain native species• Restore degradedecosystemsgrowing of all scientific societies <strong>and</strong> there are a dozennew scientific journals in this field. Have you considereda career in this field?How Can Bioinfomatics Help ProtectBiodiversity? Providing Good InformationBioinfomatics analyzes <strong>and</strong> provides basic biological<strong>and</strong> ecological information to help us sustainbiodiversity.To underst<strong>and</strong> <strong>and</strong> sustain biodiversity, we need basicbiological <strong>and</strong> ecological information about the world’swild species. Bioinfomatics is the applied science ofmanaging, analyzing, <strong>and</strong> communicating biologicalinformation.Bioinfomatics uses tools such as high-resolutiondigitized images to photograph <strong>and</strong> analyze specimensof all known species <strong>and</strong> any new ones that areidentified. It also builds computer databases to holdthese images, DNA sequences for identifying bacteria<strong>and</strong> other microorganisms, <strong>and</strong> other biological informationabout the world’s species <strong>and</strong> ecosystems.Such information is readily available through the Internetto anyone who wants it.11-3 PUBLIC LANDSIN THE UNITED STATESFigure 11-5 Solutions: goals, strategies, <strong>and</strong> tactics for protectingbiodiversity.11-2 CONSERVATION BIOLOGYWhat Is Conservation Biology? EmergencyAction to Sustain BiodiversityConservation biology uses rapid response strategiesto stem the loss <strong>and</strong> degradation of the world’sbiodiversity.Conservation biology is a multidisciplinary sciencethat originated in the 1970s. Its goal is to use emergencyresponses to slow down the rate at which we aredestroying <strong>and</strong> degrading the earth’s biodiversity.Conservation biologists identify the most endangered<strong>and</strong> species-rich ecosystems, called hot spots. They thensend in Rapid Assessment Teams of biologists to evaluatethe situations, make recommendations, <strong>and</strong> takeemergency action to stem the loss of biodiversity insuch areas.Conservation biology is based on Aldo Leopold’sethical principle that something is right when it tendsto maintain the earth’s life-support systems for us <strong>and</strong>other species <strong>and</strong> wrong when it does not. The Societyof Conservation Biology is now one of the fastestWhat Are the Major Types of U.S. PublicL<strong>and</strong>s? L<strong>and</strong> for Current <strong>and</strong> FutureGenerationsMore than a third of the l<strong>and</strong> in the United States consistsof publicly owned national forests, resourcel<strong>and</strong>s, parks, wildlife refuges, <strong>and</strong> protected wildernessareas.No other nation has set aside as much of its l<strong>and</strong> forpublic use, resource extraction, enjoyment, <strong>and</strong> wildlifeas the United States. The federal government managesroughly 35% of the country’s l<strong>and</strong>, which belongsto every American. About 73% of this federal publicl<strong>and</strong> is in Alaska. Another 22% is in the western states(Figure 11-6, p. 198). The combined area of these publicl<strong>and</strong>s would cover up California <strong>and</strong> Alaska with l<strong>and</strong>to spare.Some federal public l<strong>and</strong>s are used for many purposes.One example is the National Forest System,which consists of 155 forests <strong>and</strong> 22 grassl<strong>and</strong>s. Theseforests, managed by the U.S. Forest Service, are usedfor logging, mining, livestock grazing, farming, oil <strong>and</strong>gas extraction, recreation, hunting, fishing, <strong>and</strong> conservationof watershed, soil, <strong>and</strong> wildlife resources.A second example is the National Resource L<strong>and</strong>s,managed by the Bureau of L<strong>and</strong> Management (BLM).These l<strong>and</strong>s are used primarily for mining, oil <strong>and</strong> gasextraction, <strong>and</strong> livestock grazing.http://biology.brookscole.com/miller14197
National parks <strong>and</strong> preservesNational forests(<strong>and</strong> Xs) National wildlife refugesFigure 11-6 Natural capital: national forests, national parks, <strong>and</strong> wildlife refuges managed by the U.S. federalgovernment. U.S. citizens jointly own these <strong>and</strong> other public l<strong>and</strong>s. (Data from U.S. Geological Survey)A third system consists of 542 National WildlifeRefuges that are managed by the U.S. Fish <strong>and</strong> WildlifeService (USFWS). Most refuges protect habitats <strong>and</strong>breeding areas for waterfowl <strong>and</strong> big game to providea harvestable supply for hunters; a few protect endangeredspecies from extinction. Permitted activities inmost refuges include hunting, trapping, fishing, oil<strong>and</strong> gas development, mining, logging, grazing, somemilitary activities, <strong>and</strong> farming.Uses of other public l<strong>and</strong>s are more restricted. Oneexample is the National Park System managed by theNational Park Service (NPS). It includes 56 major parks(mostly in the West) <strong>and</strong> 331 national recreation areas,monuments, memorials, battlefields, historic sites,198 CHAPTER 11 Sustaining Terrestrial Biodiversity: Managing <strong>and</strong> Protecting Ecosystems
parkways, trails, rivers, seashores, <strong>and</strong> lakeshores.Only camping, hiking, sport fishing, <strong>and</strong> boating cantake place in the national parks, but sport hunting,mining, <strong>and</strong> oil <strong>and</strong> gas drilling is allowed in NationalRecreation Areas.The most restricted public l<strong>and</strong>s are 660 roadlessareas that make up the National Wilderness PreservationSystem. These areas lie within the other types of publicl<strong>and</strong>s <strong>and</strong> are managed by agencies in charge of thosel<strong>and</strong>s. Most of these areas are open only for recreationalactivities such as hiking, sport fishing, camping,<strong>and</strong> nonmotorized boating.How Should U.S. Public L<strong>and</strong>s Be Managed?An Ongoing ControversySince the 1800s there has been controversy overhow U.S. public l<strong>and</strong>s should be used becauseof the valuable resources they contain.Federal public l<strong>and</strong>s contain valuable oil, natural gas,coal, timber, <strong>and</strong> mineral resources. Since the 1800sthere has been controversy over how the resources onthese l<strong>and</strong>s should be used <strong>and</strong> managed.Most conservation biologists <strong>and</strong> environmentaleconomists <strong>and</strong> many free-market economists believethe following four principles should govern use ofpublic l<strong>and</strong>:■ Protecting biodiversity, wildlife habitats, <strong>and</strong> theecological functioning of public l<strong>and</strong> ecosystemsshould be the primary goal.■ No one should receive government subsidies ortax breaks for using or extracting resources on publicl<strong>and</strong>s—a user-pays approach.■ The American people deserve fair compensationfor extraction of any resources from their property.■ All users or extractors of resources on public l<strong>and</strong>sshould be responsible for any environmental damagethey cause.Aldo Leopold’s l<strong>and</strong>-use ethic (Section 2-5, p. 30) is thebasis for most of these guiding principles.There is strong <strong>and</strong> effective opposition to theseideas. Economists, developers, <strong>and</strong> resource extractorstend to view public l<strong>and</strong>s in terms of their usefulnessin providing mineral, timber, <strong>and</strong> other resources <strong>and</strong>their ability to increase short-term economic growth.They have succeeded in blocking implementationof the four principles just listed. For example, in recentyears the government has given more than $1 billion ayear in subsidies to privately owned mining, logging,<strong>and</strong> grazing interests using U.S. public l<strong>and</strong>s.Some developers <strong>and</strong> resource extractors go further<strong>and</strong> have mounted a campaign to get the U.S.Congress to pass laws that would■ Sell public l<strong>and</strong>s or their resources to corporationsor individuals at less than fair market value.■ Slash federal funding for regulatory administrationof public l<strong>and</strong>s.■ Cut all old-growth forests in the national forests<strong>and</strong> replace them with tree plantations.■ Open all national parks, national wildlife refuges,<strong>and</strong> wilderness areas to oil drilling, mining, off-roadvehicles, <strong>and</strong> commercial development.■ Do away with the National Park Service <strong>and</strong>launch a 20-year construction program of private concessions<strong>and</strong> theme parks run by private firms in theformer national parks.■ Continue mining on public l<strong>and</strong>s under the provisionsof the 1872 Mining Law, which allows mininginterests to pay no royalties to taxpayers for hard-rockminerals they remove.■ Repeal the Endangered Species Act or modify it toallow economic factors to override protection of endangered<strong>and</strong> threatened species.■ Redefine government-protected wetl<strong>and</strong>s so thatabout half of them would no longer be protected.■ Prevent individuals or groups from legally challenginguses of public l<strong>and</strong> for private financial gain.xHOW WOULD YOU VOTE? Should much more of the U.S.public l<strong>and</strong>s (or government-owned l<strong>and</strong>s in the countrywhere you live) be opened to extraction of timber, mineral,<strong>and</strong> energy resources? Cast your vote online at http://biology.brookscole.com/miller14.11-4 MANAGING AND SUSTAININGFORESTSWhat Are the Major Types of Forests? Old-Growth, Second-Growth, <strong>and</strong> TreePlantationsSome forests have not been disturbed by humanactivities for several hundred years, others havegrown back after being cut, <strong>and</strong> some consist ofplanted st<strong>and</strong>s of a particular tree species.Forests with at least 10% tree cover occupy about 30%of the earth’s l<strong>and</strong> surface (excluding Greenl<strong>and</strong> <strong>and</strong>Antarctica). Figure 6-16 (p. 111) shows the distributionof the world’s boreal, temperate, <strong>and</strong> tropical forests.These forests provide many important ecological <strong>and</strong>economic services (Figure 11-7, p. 200).Forest managers <strong>and</strong> ecologists classify forestsinto three major types based on age <strong>and</strong> structure. Onetype is an old-growth forest: an uncut forest or regeneratedforest that has not been seriously disturbed byhuman activities or natural disasters for at least severalhundred years. Old-growth forests are storehousesof biodiversity because they provide ecologicalniches for a multitude of wildlife species (Figure 6-30,p. 122).http://biology.brookscole.com/miller14199
EcologicalServicesSupport energyflow <strong>and</strong>chemical cyclingReduce soilerosionAbsorb <strong>and</strong>release waterPurify waterPurify airInfluence local<strong>and</strong> regionalclimateStoreatmosphericcarbonProvidenumerouswildlife habitatsNatural CapitalForestsEconomicServicesFuelwoodLumberPulp to makepaperMiningLivestock grazingRecreationJobsFigure 11-7 Natural capital: major ecological <strong>and</strong> economicservices provided by forests.A second type is a second-growth forest: a st<strong>and</strong>of trees resulting from secondary ecological succession(Figure 8-12, p. 158). They develop after the trees in anarea have been removed by human activities (such asclear-cutting for timber or conversion to cropl<strong>and</strong>) orby natural forces (such as fire, hurricanes, or volcaniceruption).A tree plantation, also called a tree farm, is a thirdtype (see photo on p. vi). It is a managed tract withuniformly aged trees of one species that are harvestedby clear-cutting as soon as they become commerciallyvaluable. They are then replanted <strong>and</strong> clear-cut againin a regular cycle (Figure 11-8).Currently, about 63% of the world’s forests aresecondary-growth forests, 22% are old-growth forests,<strong>and</strong> 5% are tree plantations (that produce about onefifthof the world’s commercial wood). Five countries—Russia,Canada, Brazil, Indonesia, <strong>and</strong> Papua,New Guinea—have more than three-fourths of theworld’s remaining old-growth forests. Logging threatensabout 39% of these forests. The rest are not threatenedmostly because of their remoteness, not becauselaws protect them.What Are the Major Types of ForestManagement? Simple Tree Plantations<strong>and</strong> Diverse ForestsSome forests consist of one or two species ofcommercially important tree species that arecut down <strong>and</strong> replanted, <strong>and</strong> others containdiverse tree species harvested individually orin small groups.There are two forest management systems. One iseven-aged management, which involves maintainingtrees in a given st<strong>and</strong> at about the same age <strong>and</strong> size.In this approach, sometimes called industrial forestry, asimplified tree plantation replaces a biologically diverseold-growth or second-growth forest. The plantationconsists of one or two fast-growing <strong>and</strong> economicallydesirable species that can be harvested every6–10 years, depending on the species (Figure 11-8).A second type is uneven-aged management,which involves maintaining a variety of tree species ina st<strong>and</strong> at many ages <strong>and</strong> sizes to foster natural regeneration.Here the goals are biological diversity, longtermsustainable production of high-quality timber,selective cutting of individual mature or intermediateagedtrees, <strong>and</strong> multiple use of the forest for timber,wildlife, watershed protection, <strong>and</strong> recreation.The fate of the world’s remaining forests will bedecided mostly by governments, which own about80% of the remaining forests in developing countries.Governments in both developing <strong>and</strong> developedcountries are under conflicting pressures from thosewanting to log forests <strong>and</strong> convert them to agriculturall<strong>and</strong> <strong>and</strong> urban development <strong>and</strong> conservationistswho want to protect them—especially the world’s remainingold-growth forests.According to a 2001 study by the World WildlifeFund, intensive but sustainable management of as littleas one-fifth of the world’s forests—an area twice thesize of India—could meet the world’s current <strong>and</strong> futuredem<strong>and</strong> for commercial wood <strong>and</strong> fiber. This intensiveuse of the world’s tree plantations <strong>and</strong> some ofits secondary forests would leave the world’s remainingold-growth forest untouched.How Are Trees Harvested? Be Selectiveor Chop Them All DownTrees can be harvested individually from diverseforests, or an entire forest st<strong>and</strong> can be cut down inone or several phases.The first step in forest management is to build roadsfor access <strong>and</strong> timber removal. Even carefully designedlogging roads have a number of harmful effects(Figure 11-9). They include increased erosion <strong>and</strong> sedimentrunoff into waterways, habitat fragmentation,<strong>and</strong> biodiversity loss. Logging roads also expose200 CHAPTER 11 Sustaining Terrestrial Biodiversity: Managing <strong>and</strong> Protecting Ecosystems
Weak treesremovedFigure 11-8 Short (25- to 30-year)rotation cycle of cutting <strong>and</strong> regrowthof a monoculture tree plantationin modern industrial forestry. Intropical countries, where trees cangrow more rapidly year-round, therotation cycle can be 6–10 years.Clear cutforests to invasion by nonnative pests, diseases, <strong>and</strong>wildlife species. They also open once-inaccessibleforests to farmers, miners, ranchers, hunters, <strong>and</strong> offroadvehicle users. In addition, logging roads on publicl<strong>and</strong>s in the United States disqualify the l<strong>and</strong> forprotection as wilderness.Once loggers can reach a forest, they use variousmethods to harvest the trees (Figure 11-10, p. 202).With selective cutting, intermediate-aged or maturetrees in an uneven-aged forest are cut singly or insmall groups (Figure 11-10a). Selective cutting reducescrowding, encourages growth of younger trees, maintainsan uneven-aged st<strong>and</strong> of trees of differentspecies, <strong>and</strong> allows natural regeneration from surroundingtrees. It can also help protect the site fromsoil erosion <strong>and</strong> wind damage, remove diseased trees,<strong>and</strong> allow a forest to be used for multiple purposes.Sometimes loggers use a form of selective cuttingcalled high grading to selectively cut trees in many tropicalforests. It involves cutting <strong>and</strong> removing only the2530 Years of growth15105Seedlingsplantedlargest <strong>and</strong> best specimens ofthe most desirable species.Studies show that for everylarge tree cut down, 16 or 17other trees are damaged orpulled down because a networkof vines usually connectsthe trees in tropical forest canopies.This reduction of the forest canopycauses the forest floor to become warmer,drier, <strong>and</strong> more flammable <strong>and</strong> increases erosionof the forest’s thin <strong>and</strong> usually nutrient-poor soil.Some tree species grow best in full or moderatesunlight in medium to large clearings. Three majormethods are used to harvest such species. One is shelterwoodcutting, which removes all mature trees in anarea in two or three cuttings over a period of time (Figure11-10b).Another is seed-tree cutting where loggers harvestnearly all of a st<strong>and</strong>’s trees in one cutting butleave a few uniformly distributed seed-producingtrees to regenerate the st<strong>and</strong> (Figure 11-10c).The third approach is clear-cutting, which removesall trees from an area in a single cutting (Figure 11-10d).Figure 11-11 (p. 203) lists the advantages <strong>and</strong> disadvantagesof clear-cutting. Shelterwood <strong>and</strong> seed-tree cuttingare basically forms of clear-cutting carried out intwo or more phases.A clear-cutting variation that can provide a sustainabletimber yield without widespread destructionis strip cutting (Figure 11-10e). It involves clear-cuttingHighwayCleared plotsfor grazingHighwayOld growthCleared plotsfor agricultureFigure 11-9 Natural capital degradation: building roads into previously inaccessible forests paves the wayto their fragmentation, destruction, <strong>and</strong> degradation.http://biology.brookscole.com/miller14201
Cut 2Cut 1a. Selective Cutting b. Shelterwood Cuttingc. Seed-Tree Cutting d. Clear-Cuttinge. Strip CuttingUncutCut6–10 years agoCut3–5 years agoCut1 year agoUncutFigure 11-10 Tree harvesting methods.202 CHAPTER 11 Sustaining Terrestrial Biodiversity: Managing <strong>and</strong> Protecting Ecosystems
AdvantagesHigher timberyieldsMaximumeconomic returnin shortest timeCan reforest withgeneticallyimproved fastgrowingtreesShort time toestablish newst<strong>and</strong> of treesNeeds less skill<strong>and</strong> planningBest way toharvest treeplantationsGood for treespecies needingfull or moderatesunlight forgrowthT rade-OffsClear-Cutting ForestsDisadvantagesReducesbiodiversityDisruptsecosystemprocessesDestroys <strong>and</strong>fragments somewildlife habitatsLeaves moderateto large openingsIncreases soilerosionIncreases sedimentwater pollution <strong>and</strong>flooding whendone on steepslopesEliminates mostrecreational valuefor severaldecadesFigure 11-11 Trade-offs: advantages <strong>and</strong> disadvantages ofclear-cutting forests. Pick the single advantage <strong>and</strong> disadvantagethat you think are the most important.a strip of trees along the contour of the l<strong>and</strong>, with thecorridor narrow enough to allow natural regenerationwithin a few years. After regeneration, loggers cut anotherstrip above the first, <strong>and</strong> so on. This allows clearcuttingof a forest in narrow strips over severaldecades with minimal damage.What Are the Harmful <strong>Environmental</strong>Effects of Deforestation? BiodiversityLoss <strong>and</strong> Climate ChangeCutting down large forest areas reduces biodiversity<strong>and</strong> the ecological services forests provide <strong>and</strong> cancontribute to regional <strong>and</strong> global climate change.Deforestation is the temporary or permanent removalof large expanses of forest for agriculture or other uses.Harvesting timber <strong>and</strong> fuelwood from forests providesmany economic benefits (Figure 11-7, right). However,deforestation can have many harmful environmentaleffects (Figure 11-12) that can reduce the ecological servicesprovided by forests (Figure 11-7, left).If left alone long enough, forests that have beenlogged or converted to cropl<strong>and</strong> can revert to secondgrowth<strong>and</strong> even old-growth forests through secondaryecological succession. But this is not alwaysthe case. If deforestation occurs over a large enougharea, it can cause a region’s climate to become hotter<strong>and</strong> drier <strong>and</strong> prevent the return of a forest.Deforestation can also contribute to projectedglobal warming if trees are removed faster than theygrow back. When forests are cleared for agriculture orother purposes <strong>and</strong> burned the carbon stored in thetrees’ biomass is released into the atmosphere as thegreenhouse gas carbon dioxide (CO 2 ). Research indicatesthat when an old-growth forest is cut, it takes atleast 200 years for a replacement forest to accumulatethe same amount of carbon stored in the original forest.What Is Happening to the World’s Forests?Mixed NewsHuman activities have reduced the earth’s forestcover by 20–50% <strong>and</strong> deforestation is continuing at afairly rapid rate, except in most temperate forests inNorth America <strong>and</strong> Europe.Global estimates of forest cover change are difficult tomake because of lack of satellite <strong>and</strong> radar data, unmonitoredl<strong>and</strong>-use change, <strong>and</strong> different definitionsof what constitutes a forest. But forest surveys are improvingbecause of better satellite data.Natural Capital DegradationDeforestation• Decreased soil fertility from erosion• Runoff of eroded soil into aquatic systems• Premature extinction of species withspecialized niches• Loss of habitat for migratory species such asbirds <strong>and</strong> butterflies• Regional climate change from extensive clearing• Releases CO 2 into atmosphere from burning<strong>and</strong> tree decay• Accelerates floodingFigure 11-12 Natural capital degradation: harmful environmentaleffects of deforestation that can reduce the ecologicalservices provided by forests. Which two of these effects do youthink are the most serious?http://biology.brookscole.com/miller14203
Here are two pieces of bad news. First, surveys bythe World Resources Institute (WRI) indicate that overthe past 8,000 years human activities have reduced theearth’s original forest cover by 20–50%.Second, surveys by the UN Food <strong>and</strong> AgriculturalOrganization (FAO) <strong>and</strong> the World Resources Instituteindicate that the global rate of forest cover loss duringthe 1990s was between 0.2% <strong>and</strong> 0.5% a year, <strong>and</strong> atleast another 0.1–0.3% of the world’s forests were degraded.If correct, the world’s forests are being cleared<strong>and</strong> degraded at an exponential rate of 0.3–0.8% a year,with much higher rates in some areas. Over four-fifthsof these losses are taking place in the tropics. The WorldResources Institute estimates that if current deforestationrates continue, about 40% of the world’s remainingintact forests will have been logged or converted toother uses within 10–20 years, if not sooner.Here are two pieces of good news. First, the totalarea of many temperate forests in North America <strong>and</strong>Europe has increased slightly because of reforestationfrom secondary ecological succession on cleared forestareas <strong>and</strong> ab<strong>and</strong>oned cropl<strong>and</strong>s.Second, some of the cut areas of tropical foresthave increased tree cover from regrowth <strong>and</strong> plantingof tree plantations. But ecologists do not believe thattree plantations with their much lower biodiversityshould be counted as forest any more than cropl<strong>and</strong>sshould be counted as grassl<strong>and</strong>. According to ecologistMichael L. Rosenzweig, “Forest plantations are justcornfields whose stalks have gotten very tall <strong>and</strong>turned to wood. They display nothing of the majestyof natural forests.”xHOW WOULD YOU VOTE? Should there be a global effortto sharply reduce the cutting of old-growth forests? Cast yourvote online at http://biology.brookscole.com/miller14.How Much Are the World’s EcologicalServices Worth? Putting a Price Tag onMother Nature’s ServicesThe huge economic value of the ecological servicesprovided by the world’s forests <strong>and</strong> other ecosystemsis rarely counted in making decisions about how touse these ecosystems.Currently forests are valued mostly for their economicservices (Figure 11-7, right). But suppose we estimate<strong>and</strong> take into account the ecological services providedby forests (Figure 11-7, left). Then researchers say thatthe economic value of their long-term ecological serviceswould be much greater than their short-term economicservices.In 1997, a team of ecologists, economists, <strong>and</strong> geographersattempted to estimate the monetary worth ofthe earth’s natural ecological services (see top half ofback cover). According to this crude appraisal led byecological economist Robert Costanza of the Universityof Vermont, the economic value of income from theearth’s ecological services is at least $36 trillion peryear! This is fairly close to the $42 trillion value of all ofthe goods <strong>and</strong> services produced throughout the worldin 2004. To provide an annual natural income of $36trillion per year, the world’s natural capital would havea value of at least $500 trillion—an average of about$82,000 for each person on earth!Based on these estimates, biodiversity is the world’sbiggest financial asset. But unless this natural asset isgiven a financial value that is included in evaluatinghow we use forests <strong>and</strong> other ecological resources itwill be used unsustainably <strong>and</strong> destroyed or degradedfor short-term profit.To estimate the monetary values of the ecologicalservices provided by the world’s natural capital, theresearchers divided the earth’s surface into 16 biomes(Figure 6-16, p. 111) <strong>and</strong> aquatic life zones. They omitteddeserts <strong>and</strong> tundra because of a lack of data. Thenthey agreed on a list of 17 goods <strong>and</strong> services providedby nature <strong>and</strong> sifted through more than 100 studiesthat attempted to put a dollar value on such services inthe 16 different types of ecosystems.According to this appraisal, the world’s forestsprovide us with ecological services worth about $4.7trillion per year—equal in value to about one-tenth ofall of the goods <strong>and</strong> services produced in the worldin 2004.The researchers say their estimates could easily betoo low by a factor of 10 to 1 million or more. For example,their calculations included only estimates ofthe ecosystem services themselves, not the naturalcapital that generates them. They also omitted thevalue of nonrenewable minerals <strong>and</strong> fuels.They hope such estimates will call people’s attentionto three important facts. The earth’s ecosystemservices are essential for all humans <strong>and</strong> theireconomies, their economic value is huge, <strong>and</strong> they arean ongoing source of ecological income as long as theyare used sustainably.Why have we not changed our accounting systemto reflect these losses? One reason is that economicsavings provided by conserving nature benefit everyonenow <strong>and</strong> in the future, whereas profits made byexploiting nature are immediate <strong>and</strong> benefit a relativelysmall group of individuals. A second reason isthat many current government subsidies <strong>and</strong> tax incentivessupport destruction <strong>and</strong> degradation offorests <strong>and</strong> other ecosystems for short-term economicgain. We get more of what we reward.How Can We Manage Forests MoreSustainably? Making Sustaining ForestsProfitableWe can use forests more sustainably by including theeconomic value of their ecological services, harvesting204 CHAPTER 11 Sustaining Terrestrial Biodiversity: Managing <strong>and</strong> Protecting Ecosystems
trees no faster than they are replenished, <strong>and</strong> protectingold-growth <strong>and</strong> vulnerable areas.Biodiversity researchers <strong>and</strong> a growing number offoresters call for more sustainable forest management.Figure 11-13 lists ways to do this. Which two of thesesolutions do you believe are most important?Some conservation biologists suggest four ways toestimate how much of the world’s remaining forests toprotect. First, include estimates of the economic valueof their ecological services in all decisions. Second, protectenough forest so that the rate of forest loss <strong>and</strong>degradation by human <strong>and</strong> natural factors in a particulararea is balanced by the rate of forest renewal.Third, identify <strong>and</strong> protect forest areas that are centersof biodiversity <strong>and</strong> that are threatened by economicdevelopment. Fourth, establish <strong>and</strong> use methods toevaluate timber that has been grown sustainably, asdiscussed below.Solutions: How Can We Certify SustainablyGrown Timber? Set St<strong>and</strong>ards <strong>and</strong> Bringin Outside EvaluatorsOrganizations have developed st<strong>and</strong>ards forcertifying that timber has been harvested sustainably<strong>and</strong> that wood products have been produced fromsustainably harvested timber.Collins Pine owns <strong>and</strong> manages a large area of productivetimberl<strong>and</strong> in northeastern California. Since 1940the company has used selective cutting to help maintainecological, economic, <strong>and</strong> social sustainability ofits timberl<strong>and</strong>.SolutionsSustainable Forestry• Grow more timber on long rotations• Rely more on selective cutting <strong>and</strong> strip cutting• No clear-cutting, seed-tree, or shelterwood cutting onsteeply sloped l<strong>and</strong>• No fragmentation of remaining large blocks of forest• Sharply reduce road building into uncut forest areas• Leave most st<strong>and</strong>ing dead trees <strong>and</strong> fallen timber forwildlife habitat <strong>and</strong> nutrient recycling• Certify timber grown by sustainable methods• Include ecological services of trees <strong>and</strong> forests inestimating economic valueFigure 11-13 Solutions: ways to manage forests moresustainably.Since 1993 Scientific Certification Systems (SCS)has evaluated the company’s timber production. SCSis part of the nonprofit Forest Stewardship Council(FSC). It was formed in 1993 to develop a list of environmentallysound practices for use in certifying timber<strong>and</strong> products made from such timber.Each year SCS evaluates Collins’s l<strong>and</strong>holdings toensure that cutting has not exceeded long-term forestregeneration, roads <strong>and</strong> harvesting systems have notcaused unreasonable ecological damage, soils are notdamaged, downed wood (boles) <strong>and</strong> st<strong>and</strong>ing deadtrees (snags) are left to provide wildlife habitat, <strong>and</strong>the company is a good employer <strong>and</strong> a good stewardof its l<strong>and</strong> <strong>and</strong> water resources.Another successful example of sustainable forestrycertification involves the Menominee nation. Since 1890it has selectively harvested trees of mixed species <strong>and</strong>ages from its tribal reservation l<strong>and</strong> near Green Bay,Wisconsin—the state’s single largest tract of virgin forest.Each year the Rain Forest Alliance’s Smart WoodProgram evaluates whether the Menominee harvestlumber from the tribal forest in an environmentally <strong>and</strong>socially responsible manner.In 2001 the World Wildlife Fund (WWF) called onthe world’s five largest companies that harvest <strong>and</strong>process timber <strong>and</strong> buy wood products to adopt theFSC’s sustainable management principles. Accordingto the WWF, by doing this these five companies couldessentially halt logging of old-growth forests <strong>and</strong> stillmeet the world’s industrial wood <strong>and</strong> wood fiberneeds using one-fifth of the world’s forests.Good news. In 2002, Mitsubishi, one of the world’slargest forestry companies, announced that it wouldhave third parties certify its forestry operations usingst<strong>and</strong>ards developed by the Forest Stewardship Council.And Home Depot, Lowes, Andersen, <strong>and</strong> othermajor sellers of wood products in the United Stateshave agreed to sell only wood certified as being sustainablygrown by independent groups such as theForest Stewardship Council (to the degree that certifiedwood is available).11-5 FOREST RESOURCES ANDMANAGEMENT IN THE UNITEDSTATESWhat Is the Status of Forests in the UnitedStates? Encouraging NewsU.S. forests cover more area than they did in 1920,more wood is grown than cut, <strong>and</strong> the country has setaside large areas of protected forests.Forests cover about 30% of the U.S. l<strong>and</strong> area, providehabitats for more than 80% of the country’s wildlifespecies, <strong>and</strong> supply about two-thirds of the nation’stotal surface water.http://biology.brookscole.com/miller14205
Good news. Forests (including tree plantations) inthe United States cover more area than they did in1920. Many of the old-growth or frontier forests thatwere cleared or partially cleared between 1620 <strong>and</strong>1960 have grown back naturally as fairly diverse second-growth(<strong>and</strong> in some cases third-growth) forestin every region of the United States, except much ofthe West. In 1995, environmental writer Bill McKibbencited forest regrowth in the United States—especiallyin the East—as “the great environmental story of theUnited States, <strong>and</strong> in some ways the whole world.”Also, every year more wood is grown in theUnited States than is cut, <strong>and</strong> each year the total areaplanted with trees increases. In addition, the UnitedStates was the world’s first country to set aside largeareas of forest in protected areas. By 2000, protectedforests made up about 40% of the country’s total forestarea, mostly in the national forests (Figure 11-6).Bad news. Since the mid-1960s, an increasing areaof the nation’s remaining old-growth <strong>and</strong> fairly diversesecond-growth forests has been clear-cut <strong>and</strong> replacedwith biologically simplified tree plantations. Accordingto biodiversity researchers, this reduces overall forestbiodiversity <strong>and</strong> disrupts ecosystem processes suchas energy flow <strong>and</strong> chemical cycling. Some environmentallyconcerned citizens have protested the cuttingdown of ancient trees <strong>and</strong> forests (Individuals Matter,below).How Can We Reduce the Harmful Effectsof Insects <strong>and</strong> Pathogens on U.S. Forests?Dealing with Bugs <strong>and</strong> DiseasesWe can reduce tree damage from insects <strong>and</strong>diseases by inspecting imported timber, removingdiseased <strong>and</strong> infected trees, <strong>and</strong> using chemicals<strong>and</strong> natural predators to help control insectpests.Figure 11-14 shows some of the nonnative species ofpests that are causing serious damage to certain treespecies in parts of the United States. There are severalways to reduce the harmful impacts of tree diseases<strong>and</strong> of insects on forests. One is to ban imported timberthat might introduce harmful new pathogens or insectpests. Another is to selectively remove or clear-cutinfected <strong>and</strong> infested trees.We can also develop tree species that are geneticallyresistant to common tree diseases. And we cancontrol insect pests by applying conventional pesticidesor using biological control (bugs that eat harmfulbugs) combined with very small amounts of conventionalpesticides.Butterfly in a Redwood TreeINDIVIDUALSMATTERButterfly is thenickname givento Julia Hill. Thisyoung womanspent 2 years ofher life on asmall platform near the top of agiant redwood tree in California toprotest the clear-cutting of aforest of these ancient trees, someof them more than 1,000 yearsold.She <strong>and</strong> other protesters wereillegally occupying these trees as aform of nonviolent civil disobedienceused decades ago by MahatmaG<strong>and</strong>hi in his successful efforts toend the British occupation of India.Butterfly had never participated inany environmental protest or act ofcivil disobedience.She went to the site to expressher belief that it was wrong to cutdown these ancient giants for shorttermeconomic gain, even if youown them. She planned to stay onlyfor a few days.But after seeing the destruction<strong>and</strong> climbing one of these magnificenttrees she ended up staying inthe tree for 2 years to bring publicityto what was happening <strong>and</strong> helpsave the surrounding trees. She becamea media symbol of the protest<strong>and</strong> during her stay used a cellphone to communicate with membersof the mass media throughoutthe world to help develop publicsupport for saving the trees.Can you imagine spending 2years of your life in a tree on a platformnot much bigger than a kingsizedbed 55 meters (180 feet) abovethe ground <strong>and</strong> enduring highwinds, intense rainstorms, snow,<strong>and</strong> ice? She was not living in aquiet pristine forest. All round herwas the noise of trucks, chainsaws,<strong>and</strong> helicopters trying to scare herinto returning to the ground.She lost her courageous battle tosave the surrounding forest butpersuaded Pacific LumberMAXXAM to save her tree (calledLuna) <strong>and</strong> a 60-meter (200-foot)buffer zone around it. Not long aftershe descended from the treesomeone used a chainsaw to seriouslydamage it, <strong>and</strong> cables <strong>and</strong>steel plates have been used to preserveit.But maybe she <strong>and</strong> the earth didnot lose. A book she wrote abouther st<strong>and</strong>, <strong>and</strong> her subsequent travelsto campuses all over the world,have inspired a number of youngpeople to st<strong>and</strong> up for protectingbiodiversity <strong>and</strong> other environmentalcauses.She was leading by following inthe tradition of Gh<strong>and</strong>i, who said,“My life is my message.” Wouldyou spend a day or a week of yourlife protesting something that youbelieved to be wrong?206 CHAPTER 11 Sustaining Terrestrial Biodiversity: Managing <strong>and</strong> Protecting Ecosystems
Sudden oak death White pine blister rust Pine shoot beetle Beech bark disease Hemlock woolly adelgidFigure 11-14 Some of the nonnative insect species that have invaded U.S. forests <strong>and</strong> are causing billions ofdollars in damages <strong>and</strong> tree loss. The light green <strong>and</strong> orange colors show areas where green or red overlapwith yellow. (Data from U.S. Forest Service)How Do Fires Affect U.S. Forests? Surface,Crown, <strong>and</strong> Ground FiresForest fires can burn away flammable underbrush<strong>and</strong> small trees, burn large trees <strong>and</strong> leap from treetopto treetop, or burn flammable materials found underthe ground.Three types of fires can affect forest ecosystems. Some,called surface fires (Figure 11-15, left. p. 208), usuallyburn only undergrowth <strong>and</strong> leaf litter on the forestfloor. These fires can kill seedlings <strong>and</strong> small trees butspare most mature trees <strong>and</strong> allow most wild animalsto escape.Occasional surface fires have a number of ecologicalbenefits. They burn away flammable ground material<strong>and</strong> help prevent more destructive fires. They alsorelease valuable mineral nutrients (tied up in slowlydecomposing litter <strong>and</strong> undergrowth), stimulate thegermination of certain tree seeds (such as those of thegiant sequoia <strong>and</strong> jack pine), <strong>and</strong> help controlpathogens <strong>and</strong> insects. In addition, some wildlifespecies such as deer, moose, elk, muskrat, woodcock,<strong>and</strong> quail depend on occasional surface fires to maintaintheir habitats <strong>and</strong> provide food in the form of vegetationthat sprouts after fires.Some extremely hot fires, called crown fires (Figure11-15, right), may start on the ground but eventuallyburn whole trees <strong>and</strong> leap from treetop to treetop.They usually occur in forests that have had no surfacefires for several decades. This allows dead wood,leaves, <strong>and</strong> other flammable ground litter to build up.These rapidly burning fires can destroy most vegetation,kill wildlife, increase soil erosion, <strong>and</strong> burn ordamage human structures in their paths.http://biology.brookscole.com/miller14207
Figure 11-15 Surface fires (left) usually burn undergrowth<strong>and</strong> leaf litter on a forest floor <strong>and</strong> canhelp prevent more destructive crown fires (right)by removing flammable ground material. Sometimescarefully controlled surface fires are deliberatelyset to prevent buildup of flammable groundmaterial in forests.Surface fireCrown fireSometimes surface fires go underground <strong>and</strong> burnpartially decayed leaves or peat. Such ground fires aremost common in northern peat bogs. They may smolderfor days or weeks <strong>and</strong> are difficult to detect <strong>and</strong>extinguish.Solutions: How Can We Reduce ForestDamage from Fire? Set Little Fires, AllowSome Fires to Burn, <strong>and</strong> Clear VegetationNear BuildingsWe can reduce fire damage by setting controlledsurface fires to prevent buildup of flammablematerial, allowing fires on public l<strong>and</strong>s toburn unless they threaten human structures<strong>and</strong> lives, <strong>and</strong> clearing small areas aroundbuildings.Two ways to help protect forest resources from fire areprevention <strong>and</strong> prescribed burning (setting controlledground fires to prevent buildup of flammable material).Ways to prevent forest fires include requiringburning permits, closing all or parts of a forest to travel<strong>and</strong> camping during periods of drought <strong>and</strong> high firedanger, <strong>and</strong> educating the public about the ecologicaleffects of fire on forests.In the United States, the Smokey Bear educationalcampaign of the Forest Service <strong>and</strong> the National AdvertisingCouncil has prevented countless forest fires. Ithas also saved many lives <strong>and</strong> prevented billions of dollarsin losses of trees, wildlife, <strong>and</strong> human structures.However, this educational program convincedmuch of the public that all forest fires are bad <strong>and</strong>should be prevented or put out. Ecologists warn thattrying to prevent all forest fires increases the likelihoodof destructive crown fires by allowing buildup ofhighly flammable underbrush <strong>and</strong> smaller trees insome forests.According to the U.S. Forest Service, severe firescould threaten about 40% of all federal forest l<strong>and</strong>s,mainly through fuel buildup from past rigorous fireprotection programs (the Smokey Bear era), increasedlogging in the 1980s that left behind highly flammablelogging debris (called slash), <strong>and</strong> greater public use offederal forest l<strong>and</strong>s. In addition, an estimated 40 millionpeople now live in remote forested areas or areaswith highly flammable chaparral vegetation with ahigh wildfire risk.Ecologists <strong>and</strong> forest fire experts propose severalstrategies for reducing the harm from fires to forests<strong>and</strong> people. One is to set small prescribed surface firesor clear out (thin) flammable small trees <strong>and</strong> underbrushin the highest-risk forest areas. But prescribedfires require careful planning <strong>and</strong> monitoring to keepthem from getting out of control.During the spring of 2000, for example, a poorlyplanned prescribed fire got out of h<strong>and</strong> in an areamanaged by the Park Service near Los Alamos, NewMexico. The result was a 33-day fire that burned 19,000hectares (47,000 acres), destroyed or damaged 280homes, damaged 40 structures at the Los AlamosNational Laboratory, <strong>and</strong> caused an estimated $1 billionin damages. In parts of fire-prone California, localofficials are using goats as an alternative to prescribedburns (Solutions, right).Another strategy is to allow many fires in nationalparks, national forests, <strong>and</strong> wilderness areas to burn<strong>and</strong> remove flammable underbrush <strong>and</strong> smaller treesas long as the fires do not threaten human structures<strong>and</strong> life. A third approach is to protect houses or otherbuildings by thinning a zone of 46–61 meters (150–200feet) around such buildings <strong>and</strong> eliminating flammablematerials such as wooden roofs.In 2003, the U.S. Congress passed a law called theHealthy Forests Initiative. Under this law, timber companiesare allowed to cut down economically valuablemedium <strong>and</strong> large trees in most national forestsfor 10 years in return for clearing away smaller, morefire-prone trees <strong>and</strong> underbrush. The law also exemptsmost thinning projects from environmentalreviews <strong>and</strong> appeals currently required by forest protectionlaws.Will the law achieve the stated goal of reducingwildfires? According to biologists <strong>and</strong> many forest firescientists, this law is likely to increase the chances of se-208 CHAPTER 11 Sustaining Terrestrial Biodiversity: Managing <strong>and</strong> Protecting Ecosystems
vere forest fires for two reasons. First, removing themost fire-resistant large trees—the ones that are valuableto timber companies—encourages dense growthsof highly flammable young trees <strong>and</strong> rapidly growingunderbrush. Second, removing the large <strong>and</strong> mediumtrees leaves behind highly flammable slash. Many ofthe worst fires in U.S. history—including some ofthose during the 1990s—burned through cleared forestareas containing slash.Fire scientists agree that some forests on publicl<strong>and</strong>s need thinning to reduce the chances of catastrophicfires, but they believe a program to accomplishthis should focus on two goals. One is to reduceground-level fuel <strong>and</strong> vegetation in dry forest types<strong>and</strong> leave widely spaced medium <strong>and</strong> large trees thatare the most fire resistant <strong>and</strong> thus can help forestrecovery after a fire. These trees also provide criticalwildlife habitat, especially as st<strong>and</strong>ing dead trees(snags) <strong>and</strong> logs where many animals live. The othergoal would emphasize clearing of flammable vegetationaround individual homes <strong>and</strong> buildings <strong>and</strong> nearcommunities that are especially vulnerable to wildfire.Critics of the Healthy Forests law say that thesegoals could be accomplished at a much lower cost totaxpayers by a law that would give grants to communitiesespecially vulnerable to wildfires for thinningforests <strong>and</strong> protecting homes <strong>and</strong> buildings in theirareas.Goats to the RescueCalifornia has thous<strong>and</strong>s ofwildfires every year. Prescribedburns are used to keep flammableunderbrush down, but someSOLUTIONS officials are worried about suchburns getting out of control.Officials in California cities such as Monterey,Malibu, Berkeley, <strong>and</strong> Oakl<strong>and</strong> are using goats tohelp reduce the flammable vegetation on surroundinghills during the state’s six-month fire season.This low-tech approach is working. It takes aherd of about 350 goats one day to eat their waythrough an acre of underbrush.The goats are kept in movable pens, with electricfencing <strong>and</strong> water troughs. Before turning theherd loose, botanists put fences around smallplants <strong>and</strong> trees that are rare or endangered. Dogsare typically used to herd the goats <strong>and</strong> help protectthem from predators.Critical ThinkingCan you think of any disadvantages of using goatsto clear flammable underbrush? Are there anyother animals that could do this job?xHOW WOULD YOU VOTE? Do you support the HealthyForests Act that allows timber companies to remove large<strong>and</strong> medium trees from most national forests without having toobey most environmental laws in exchange for thinning outflammable smaller trees <strong>and</strong> underbrush? Cast your voteonline at http://biology.brookscole.com/miller14.Case Study: How Should U.S. NationalForests Be Managed? An OngoingControversyThere is controversy over whether U.S. nationalforests should be managed primarily for timber,their ecological services, recreation, or a mix ofthese uses.For decades there has been controversy over the use ofresources in the national forests. Timber companiespush to cut as much of the timber in these forests aspossible at low prices. Biodiversity experts <strong>and</strong> environmentalistscall for sharply reducing or eliminatingtree harvesting in national forests <strong>and</strong> using more sustainableforest management practices (Figure 11-13)for timber cutting in these forests. They believe thatnational forests should be managed primarily to providerecreation <strong>and</strong> to sustain biodiversity, water resources,<strong>and</strong> other ecological services.Between 1930 <strong>and</strong> 1988, timber harvesting fromnational forests increased sharply. One reason is thattimber companies pressured Congress to increase timberharvests. Also, Congress passed a law that allowsthe Forest Service to keep most of the money it makeson timber sales. This makes timber cutting a key wayfor the Forest Service to increase its budget.In addition, a 1908 law gives counties within theboundaries of national forests one-fourth of the grossreceipts from timber sales. This encourages countygovernments to push for increased timber harvesting.By law, the Forest Service must sell timber for noless than the cost of reforesting the cleared l<strong>and</strong>. Butthis price does not include the government-subsidizedcost of building <strong>and</strong> maintaining access roads for timberremoval by logging companies.The Forest Service’s timber-cutting program losesmoney because revenue from timber sales does notcover the costs of road building, timber sale preparation,administration, <strong>and</strong> other overhead costs. Becauseof such government subsidies, timber sales fromU.S. federal l<strong>and</strong>s have lost money for taxpayers in 97of the last 100 years!According to a 2000 study by the accounting firmEconorthwest, recreation, hunting, <strong>and</strong> fishing in nationalforests add 10 times more money to the nationaleconomy <strong>and</strong> provide 7 times more jobs than does extractionof timber <strong>and</strong> other resources. Figure 11-16(p. 210) lists advantages <strong>and</strong> disadvantages of loggingin national forests.http://biology.brookscole.com/miller14209
AdvantagesHelps meetcountry’s timberneedsCut areas growbackTrade-OffsLogging in U.S. National ForestsKeeps lumber<strong>and</strong> paper pricesdownProvides jobs innearbycommunitiesPromoteseconomic growthin nearbycommunitiesDisadvantagesProvides only 4% oftimber needsAmple privateforest l<strong>and</strong> to meettimber needsHas little effect ontimber <strong>and</strong> paperpricesDamages nearbyrivers <strong>and</strong> fisheriesRecreation innational forestsprovides more localjobs <strong>and</strong> incomefor localcommunities thanloggingDecreasesrecreationalopportunitiesOne way to reduce the pressure to harvest trees forpaper production in national <strong>and</strong> private forests is tomake paper by using fiber that does not come fromtrees. Tree-free fibers for making paper come from twosources: agricultural residues left over from crops (suchas wheat, rice, <strong>and</strong> sugar) <strong>and</strong> fast-growing crops (such askenaf <strong>and</strong> industrial hemp).China uses tree-free pulp from rice straw <strong>and</strong>other agricultural wastes left after harvest to make almosttwo-thirds of its paper. Most of the small amountof tree-free paper produced in the United States ismade from the fibers of a rapidly growing woody annualplant called kenaf (pronounced “kuh-NAHF”; seephoto on p. vii).Compared to pulpwood, kenaf needs less herbicidebecause it grows faster than most weeds <strong>and</strong> reducesinsecticide use because its outer fibrous coveringis nearly insect proof. Growing kenaf does not depletesoil nitrogen because it is a nitrogen fixer. And breakingdown kenaf fibers takes less energy <strong>and</strong> fewerchemicals <strong>and</strong> thus produces less toxic wastewaterthan using conventional trees. According to the USDAkenaf is “the best option for tree-free papermaking inthe United States” <strong>and</strong> could replace wood-based paperwithin 20–30 years.Figure 11-16 Trade-offs: advantages <strong>and</strong> disadvantages ofallowing logging in U.S. national forests. Pick the single advantage<strong>and</strong> disadvantage that you think are the most important.Explain.How Can We Reduce the Need to HarvestTrees for Timber <strong>and</strong> Papermaking?Stop Waste <strong>and</strong> Make Paper fromTree-Free FibersAlmost two-thirds of the wood consumed in theUnited States is wasted, <strong>and</strong> much of the paper weuse could be made from agricultural residues <strong>and</strong>fast-growing crops such as kenaf.One way to reduce the pressure to harvest trees onpublic <strong>and</strong> private l<strong>and</strong> in the United States (<strong>and</strong> elsewhere)is to improve the efficiency of wood use. Accordingto the Worldwatch Institute <strong>and</strong> forestry analysts,up to 60% of the wood consumed in the United Statesis wasted unnecessarily. This occurs because of inefficientuse of construction materials, excess packaging,overuse of junk mail, inadequate paper recycling, <strong>and</strong>failure to reuse wooden shipping containers.Only 4% of the total U.S. production of softwoodtimber comes from the national forests. Thus, reducingthe waste of wood <strong>and</strong> paper products by only 4%could eliminate the need to remove any timber from nationalforests. This would allow these l<strong>and</strong>s to be usedprimarily for recreation <strong>and</strong> biodiversity protection.11-6 TROPICAL DEFORESTATIONHow Fast Are Tropical Forests BeingCleared <strong>and</strong> Degraded <strong>and</strong> Why ShouldWe Care? Protecting the PricelessLarge areas of ecologically <strong>and</strong> economicallyimportant tropical forests are being cleared <strong>and</strong>degraded at a fast rate.Tropical forests cover about 6% of the earth’s l<strong>and</strong>area—roughly the area of the lower 48 states. Climatic<strong>and</strong> biological data suggest that mature tropical forestsonce covered at least twice as much area as they do today,with most of the destruction occurring since 1950.Satellite scans <strong>and</strong> ground-level surveys used to estimateforest destruction indicate that large areas oftropical forests are being cut rapidly in parts of SouthAmerica (especially Brazil), Africa, <strong>and</strong> Asia.Studies indicate that more than half of the world’sspecies of terrestrial plants <strong>and</strong> animals live in tropicalrain forests. Brazil has about 40% the world’s remainingtropical rain forest in the vast Amazon basin,which is about two-thirds the size of the continentalUnited States. In 1970, deforestation affected only 1%of the area of the Amazon basin. By 2003, almost 20%had been deforested or degraded.According to a 2001 study by Penn State researcherJames Alcock, without immediate <strong>and</strong> aggressiveaction to reduce current forest destruction210 CHAPTER 11 Sustaining Terrestrial Biodiversity: Managing <strong>and</strong> Protecting Ecosystems
<strong>and</strong> degradation practices, Brazil’s original Amazonrain forests may largely disappear within 40–50 years.You probably have not heard about the loss ofmost of Brazil’s Atlantic coastal rain forest. This less famousforest once covered about 12% of Brazil’s l<strong>and</strong>area. Now 93% of it has been cleared <strong>and</strong> most of whatis left is recovering from previous cutting episodes.This represents a major loss of biodiversity because anarea in this forest a little larger than two typical suburbanhouse lots in the United States has 450 tree species!The entire United States has only about 865 native treespecies.There are disagreements about how rapidly tropicalforests are being deforested <strong>and</strong> degraded becauseof three factors. First, it is difficult to interpret satelliteimages. Second, some countries hide or exaggerate deforestationrates for political <strong>and</strong> economic reasons.Third, governments <strong>and</strong> international agencies defineforest, deforestation, <strong>and</strong> forest degradation in differentways.For these reasons, estimates of global tropical forestloss vary from 50,000 square kilometers (19,300 squaremiles) to 170,000 square kilometers (65,600 squaremiles) per year. This is high enough to lose or degradehalf of the world’s remaining tropical forests in 35–117years.Most biologists believe that cutting <strong>and</strong> degradingmost remaining old-growth tropical forests is a seriousglobal environmental problem because of the importantecological <strong>and</strong> economic services they provide(Figure 11-7). For example, tropical forest plants providechemicals used as blueprints for making most ofthe world’s prescription drugs (Figure 11-17). And cuttingthese forests faster than they can grow back contributesto projected global warming because theseforests are a storehouse for huge quantities of carbon,safely stored as organic compounds in plant biomass.What <strong>Causes</strong> Tropical Deforestation <strong>and</strong>Degradation? The Big FiveThe primary causes of tropical deforestation <strong>and</strong>degradation are population growth, poverty, environmentallyharmful government subsidies, debtsowed to developed countries, <strong>and</strong> failure to valueecological services.Tropical deforestation results from a number of interconnectedprimary <strong>and</strong> secondary causes (Figure11-18, p. 212). Population growth <strong>and</strong> povertycombine to drive subsistence farmers <strong>and</strong> the l<strong>and</strong>lesspoor to tropical forests, where they try to grow enoughfood to survive. Government subsidies can acceleratedeforestation by making timber or other tropical forestresources cheap, relative to the economic value of theecological services they provide. Governments in Indonesia,Mexico, <strong>and</strong> Brazil also encourage the poor tocolonize tropical forests by giving them title to l<strong>and</strong>they clear. This can help reduce poverty but can lead toRauvolfiaRauvolfia sepentina,Southeast AsiaTranquilizer, highblood pressuremedicationPacific yewTaxus brevifolia,Pacific NorthwestOvarian cancerFoxgloveDigitalis purpurea,EuropeDigitalis for heart failureCinchonaCinchona ledogeriana,South AmericaQuinine for malaria treatmentRosy periwinkleCathranthus roseus,MadagascarHodgkin's disease,lymphocytic leukemiaFigure 11-17 Natural capital: nature’s pharmacy. Parts of these <strong>and</strong> a number of other plants <strong>and</strong> animals(many of them found in tropical forests) are used to treat a variety of human ailments <strong>and</strong> diseases. Nine of theten leading prescription drugs originally came from wild organisms. About 2,100 of the 3,000 plants identifiedby the National Cancer Institute as sources of cancer-fighting chemicals come from tropical forests. Despitetheir economic <strong>and</strong> health potential, fewer than 1% of the estimated 125,000 flowering plant species in tropicalforests (<strong>and</strong> a mere 1,100 of the world’s 260,000 known plant species) have been examined for their medicinalproperties. Once the active ingredients in the plants have been identified, they can usually be produced synthetically.Many of these tropical plant species are likely to become extinct before we can study them.Neem treeAzadirachta indica,IndiaTreatment of manydiseases, insecticide,spermicidehttp://biology.brookscole.com/miller14211
• Oil drilling• Mining• Flooding from dams•Tree plantations• Cattle ranching• Cash crops• Settler farming• Fires• Logging• RoadsSecondary <strong>Causes</strong>• Not valuingecological services• Exports• Government policies• Poverty• Population growthBasic <strong>Causes</strong>Figure 11-18 Natural capital degradation: major interconnected primary <strong>and</strong>secondary causes of the destruction <strong>and</strong> degradation of tropical forests. The importanceof specific secondary causes varies in different parts of the world.environmental degradation unless the new settlers aretaught how to use such forests more sustainably. In addition,international lending agencies encourage developingcountries to borrow huge sums of money fromdeveloped countries to finance projects such as roads,mines, logging operations, oil drilling, <strong>and</strong> dams intropical forests. Another cause is failure to value ecologicalservices of forests (Figure 11-7, left).The depletion <strong>and</strong> degradation of a tropical forestbegins when a road is cut deep into the forest interiorfor logging <strong>and</strong> settlement <strong>and</strong> hunters are hired to killwild animals to provide loggers <strong>and</strong> other work crewswith meat.Loggers typically use selective cutting to removethe best timber (high grading). This topples manyother trees because of their shallow roots <strong>and</strong> the networkof vines connecting trees in the forest’s canopy.Timber exports to developed countries contribute significantlyto tropical forest depletion <strong>and</strong> degradation.But domestic use accounts for more than 80% of thetrees cut in developing countries.After the best timber has been removed, timbercompanies often sell the l<strong>and</strong> to ranchers. Within a fewyears they typically overgraze it <strong>and</strong> sell it to settlerswho have migrated to the forest hoping to grow enoughfood to survive. Then they move their l<strong>and</strong>-degradingranching operations to another forest area. Accordingto a 2004 report by the Center for International ForestryResearch, the rapid spread in cattle ranching is thebiggest threat to the Amazon’s tropical forests.The settlers cut most of the remaining trees, burnthe debris after it has dried for about a year, <strong>and</strong> plantcrops using slash-<strong>and</strong>-burn agriculture (Figure 2-2,p. 22). They can also endanger some wild species byhunting them for what is called bushmeat. After a fewyears of crop growing <strong>and</strong> rain erosion, the nutrientpoortropical soil is depleted of nutrients. Then thesettlers move on to newly cleared l<strong>and</strong>.In some areas—especially Africa <strong>and</strong>Latin America—large sections of tropicalforest are cleared for raising cash cropssuch as sugarcane, bananas, pineapples,strawberries, <strong>and</strong> coffee—mostly forexport to developed countries. Tropicalforests are also cleared for mining <strong>and</strong> oildrilling <strong>and</strong> to build dams on rivers thatflood large areas of the forest.Healthy rain forests do not burn. Butincreased logging, settlements, grazing, <strong>and</strong>farming along roads built in these forests resultsin fragments of forest (Figure 11-9,p. 201) that dry out. This makes such areaseasier to ignite by lightning <strong>and</strong> for farmers<strong>and</strong> ranchers to burn. In addition to destroying<strong>and</strong> degrading biodiversity, this releaseslarge amounts of carbon dioxide intothe atmosphere.Solutions: How Can We Reduce Deforestation<strong>and</strong> Degradation of Tropical Forests?Prevention Is BestThere are a number of ways to slow <strong>and</strong> reduce thedeforestation <strong>and</strong> degradation of tropical forests.Analysts have suggested various ways to protecttropical forests <strong>and</strong> use them more sustainably (Figure11-19). One method is to help new settlers in tropicalforests learn how to practice small-scale sustainableagriculture <strong>and</strong> forestry. The Lac<strong>and</strong>on MayaIndians of Chiapas, Mexico, for example, use a multilayeredsystem of agroforestry to cultivate as many as75 crop species on 1-hectare (2.5-acre) plots for up to7 years. After that, they plant a new plot to allow regenerationof the soil in the original plot.In the lush rain forests of Peru’s Palcazú Valley,Yaneshé Indians use strip cutting (Figure 11-10e) toharvest tropical trees for lumber. Tribe members alsoact as consultants to help other forest dwellers set upsimilar systems.Another approach is to sustainably harvest someof the renewable resources such as fruits <strong>and</strong> nuts inrain forests. For example, about 6,000 families in thePetén region of Guatemala make a comfortable livingby sustainably extracting various rain forest products.212 CHAPTER 11 Sustaining Terrestrial Biodiversity: Managing <strong>and</strong> Protecting Ecosystems
SolutionsSustaining Tropical ForestsFigure 11-19 Solutions: ways to protecttropical forests <strong>and</strong> use them moresustainably. Which two of these solutionsdo you believe are the most important?PreventionRestorationProtect most diverse <strong>and</strong>endangered areasReforestationEducate settlers about sustainableagriculture <strong>and</strong> forestryPhase out subsidies that encourageunsustainable forest useAdd subsidies that encouragesustainable forest useRehabilitation of degradedareasProtect forests with debt-for-natureswaps <strong>and</strong> conservation easementsCertify sustainably grown timberReduce illegal cuttingReduce povertySlow population growthConcentrate farming <strong>and</strong>ranching on already-clearedareasAnother approach is to use debt-for-nature swaps tomake it financially profitable for countries to protecttropical forests. In such a swap, participating countriesact as custodians of protected forest reserves inreturn for foreign aid or debt relief. Since the firstdebt-for-nature swap in 1987, governments <strong>and</strong> privategroups have carried out more than 20 such swapsin 10 countries.Another important tool is using an internationalsystem for evaluating <strong>and</strong> certifying tropical timberproduced by sustainable methods. Loggers can alsouse gentler methods for harvesting trees. For example,cutting canopy vines (lianas) before felling a tree canreduce damage to neighboring trees by 20–40%, <strong>and</strong>using the least obstructed paths to remove the logs canhalve the damage to other trees. In addition, governments<strong>and</strong> individuals can mount efforts to reforest<strong>and</strong> rehabilitate degraded tropical forests <strong>and</strong> watersheds(Individuals Matter, p. 214). Another suggestionis to clamp down on illegal logging.Solutions: The Incredible Neem TreeThe neem tree could eventually benefit almosteveryone on the earth.Suppose a single plant existed that could quickly reforestdegraded l<strong>and</strong>, supply fuelwood <strong>and</strong> lumber indry areas, provide natural alternatives to toxic pesticides,be used to treat numerous diseases, <strong>and</strong> helpcontrol human population growth? There is one: theneem tree, a broadleaf evergreen member of the mahoganyfamily.This remarkable tropical species, native to India<strong>and</strong> Burma, is ideal for reforestation because it cangrow to maturity in only 5–7 years. It grows well inpoor soil in semiarid l<strong>and</strong>s such as those in Africa, providingabundant fuelwood, lumber, <strong>and</strong> lamp oil.It also contains various natural pesticides. Chemicalsfrom its leaves <strong>and</strong> seeds can repel or kill morethan 200 insect species, including termites, gypsymoths, locusts, boll weevils, <strong>and</strong> cockroaches.Extracts from neem seeds <strong>and</strong> leaves (Figure 11-17)can fight bacterial, viral, <strong>and</strong> fungal infections. Villagerscall the tree a “village pharmacy” because itschemicals can relieve so many different health problems.People also use the tree’s twigs as an antiseptictoothbrush <strong>and</strong> the oil from its seeds to make toothpaste<strong>and</strong> soap.That is not all. Neem-seed oil evidently acts as astrong spermicide <strong>and</strong> may help in the development ofa much-needed male birth control pill. According to astudy by the U.S. National Academy of Sciences, theneem tree “may eventually benefit every person on theplanet.”Despite its numerous advantages, ecologists cautionagainst widespread planting of neem trees outsideits native range. As a nonnative species, it couldtake over <strong>and</strong> displace native species because of itshttp://biology.brookscole.com/miller14213
Kenya’s Green Belt MovementINDIVIDUALSMATTERIn Kenya, WangariMaathai foundedthe Green BeltMovement in1977. The goalsof this women’sself-help group are to establish treenurseries, raise seedlings, <strong>and</strong> plant<strong>and</strong> protect a tree for each ofKenya’s 32 million people. By 2003,the 50,000 members of this grassrootsgroup had established 6,000village nurseries <strong>and</strong> planted <strong>and</strong>protected more than 20 milliontrees.The success of this project hassparked the creation of similar programsin more than 30 other Africancountries. She has said,I don’t really know why I care somuch. I just have something insideme that tells me that there is a problem<strong>and</strong> I have to do somethingabout it. And I’m sure it’s the samevoice that is speaking to everyoneon this planet, at least everybodywho seems to be concerned aboutthe fate of the world, the fate of thisplanet.Figure 11-A Wangari Maathai, the first Kenyan womanto earn a Ph.D. (in anatomy) <strong>and</strong> to head an academicdepartment (veterinary medicine) at the University ofNairobi, organized the internationally acclaimedGreen Belt Movement in 1977. For her work in protectingthe environment she has received manyhonors, including the Goldman Prize, the RightLivelihood Award, the UN Africa Prize for Leadership,<strong>and</strong> the Golden Ark Award. After years ofbeing harrassed, beaten, <strong>and</strong> jailed for opposinggovernment policies, she was elected to Kenya’sparliament as a member of the Green Party in 2002.In 2003 she was also appointed Assistant Minister forEnvironment, Natural Resources, <strong>and</strong> Wildlife.rapid growth <strong>and</strong> resistance to pests. But proponentssay the benefits of neem trees far outweigh such risks.What do you think?11-7 NATIONAL PARKSWhat Are National Parks <strong>and</strong> How Are TheyThreatened? Under AssaultCountries have established over 1,100 nationalparks but most are threatened by humanactivities.Today, more than 1,100 national parks larger than 10square kilometers (4 square miles) are located in morethan 120 countries.According to a 1999 study by the World Bank <strong>and</strong>the World Wildlife Fund, only 1% of the parks in developingcountries receive protection. Local people invademost of the unprotected parks in search of wood,cropl<strong>and</strong>, game animals, <strong>and</strong> other natural productsfor their daily survival. Loggers, miners, <strong>and</strong> wildlifepoachers (who kill animals to obtain <strong>and</strong> sell itemssuch as rhino horns, elephant tusks, <strong>and</strong> furs) also invademany of these parks. Park services in developingcountries typically have too little money <strong>and</strong> too fewpersonnel to fight these invasions, either by force or byeducation.Another problem is that most national parks aretoo small to sustain many large animal species. Also,many parks suffer from invasions by nonnativespecies that can reduce the populations of some nativespecies <strong>and</strong> cause ecological disruption.Case Study: National Parks in the UnitedStatesNational parks in the United States face manythreats.The U.S. national park system, established in 1912, has56 national parks (sometimes called the country’scrown jewels), most of them in the West (Figure 11-6).State, county, <strong>and</strong> city parks supplement these nationalparks. Most state parks are located near urbanareas <strong>and</strong> have about twice as many visitors per yearas the national parks.Popularity is one of the biggest problems of national<strong>and</strong> state parks in the United States. During thesummer, users entering the most popular U.S. national<strong>and</strong> state parks often face hour-long backups <strong>and</strong> experiencenoise, congestion, eroded trails, <strong>and</strong> stress insteadof peaceful solitude.Many visitors expect parks to have grocerystores, laundries, bars, golf courses, video arcades,<strong>and</strong> other facilities found in urban areas. U.S. ParkService rangers spend an increasing amount of theirtime on law enforcement <strong>and</strong> crowd control instead ofconservation, management, <strong>and</strong> education. Manyoverworked <strong>and</strong> underpaid rangers are leaving forbetter-paying jobs.In some parks noisy dirt bikes, dune buggies,snowmobiles, <strong>and</strong> other off-road vehicles (ORVs)degrade the aesthetic experience for many visitors,destroy or damage fragile vegetation, <strong>and</strong> disturbwildlife.Many parks suffer damage from the migration ordeliberate introduction of nonnative species. Europeanwild boars (imported to North Carolina in 1912214 CHAPTER 11 Sustaining Terrestrial Biodiversity: Managing <strong>and</strong> Protecting Ecosystems
• Integrate plans for managing parks <strong>and</strong> nearbyfederal l<strong>and</strong>s• Add new parkl<strong>and</strong> near threatened parks• Buy private l<strong>and</strong> inside parks• Locate visitor parking outside parks <strong>and</strong> use shuttlebuses for entering <strong>and</strong> touring heavily used parks• Increase funds for park maintenance <strong>and</strong> repairs• Survey wildlife in parksSolutionsNational Parks• Raise entry fees for visitors <strong>and</strong> use funds for parkmanagement <strong>and</strong> maintenance• Limit number of visitors to crowded park areas• Increase number <strong>and</strong> pay of park rangers• Encourage volunteers to give visitor lectures <strong>and</strong> tours• Seek private donations for park maintenance <strong>and</strong> repairsFigure 11-20 Solutions: suggestions for sustaining <strong>and</strong> exp<strong>and</strong>ingthe national park system in the United States. Whichtwo of these solutions do you believe are the most important?(Wilderness Society <strong>and</strong> National Parks <strong>and</strong> ConservationAssociation)for hunting) threaten vegetation in part of the GreatSmoky Mountains National Park. Nonnative mountaingoats in Washington’s Olympic National Park tramplenative vegetation <strong>and</strong> accelerate soil erosion. Whilesome nonnative species have moved into parks, someeconomically valuable native species of animals <strong>and</strong>plants (including many threatened or endangeredspecies) are killed or removed illegally in almost half ofU.S. national parks.Nearby human activities that threaten wildlife<strong>and</strong> recreational values in many national parks includemining, logging, livestock grazing, coal-burningpower plants, water diversion, <strong>and</strong> urban development.Polluted air, drifting hundreds of kilometers,kills ancient trees in California’s Sequoia NationalPark <strong>and</strong> often blots out the awesome views atArizona’s Gr<strong>and</strong> Canyon. According to the NationalPark Service, air pollution affects scenic views in mostnational parks more than 90% of the time.Analysts have made a number of suggestions forsustaining <strong>and</strong> exp<strong>and</strong>ing the national park system inthe United States (Figure 11-20).Private concessionaires provide campgrounds, restaurants,hotels, <strong>and</strong> other services for park visitors.Some analysts call for requiring concessionaires to competefor contracts <strong>and</strong> pay franchise fees equal to 22% oftheir gross (not net) receipts. Currently concessionairesin national parks pay the government an average ofonly about 6–7% of their gross receipts in franchise fees.And many large concessionaires with long-term contractspay as little as 0.75% of their gross receipts.11-8 NATURE RESERVESHow Much of the Earth’s L<strong>and</strong> Should WeProtect from Human Exploitation? TheAnswer Is MoreEcologists believe that we should protect more l<strong>and</strong>to help sustain the earth’s biodiversity.Most ecologists <strong>and</strong> conservation biologists believe thebest way to preserve biodiversity is through a worldwidenetwork of protected areas. Currently about 12%of the earth’s l<strong>and</strong> area has been protected strictly orpartially in nature reserves, parks, wildlife refuges,wilderness, <strong>and</strong> other areas. In other words, we havereserved 88% of the earth’s l<strong>and</strong> for us, <strong>and</strong> most of theremaining 12% we have protected is ice, tundra, ordesert where we do not want to live because it is toocold or too hot.And this 12% figure is misleading because no morethan 5% of these areas are actually protected. Thus, wehave strictly protected only about 7% of the earth’s terrestrialareas from potentially harmful human activities.Conservation biologists call for protecting at least20% of the earth’s l<strong>and</strong> area in a global system of biodiversityreserves that includes multiple examples of allthe earth’s biomes. Setting aside <strong>and</strong> helping sustainsuch a system will take action <strong>and</strong> funding by nationalgovernments (Case Study, p. 216), private groups (Solutions,p. 216), <strong>and</strong> cooperative ventures involvinggovernments, businesses, <strong>and</strong> private conservationgroups. Protection does not mean just drawing dottedlines around an area; it refers to ecologically soundmanagement of areas.Some progress is being made. In 2001, the Braziliangovernment launched a program to establish 80parks in the Amazon River basin on governmentownedl<strong>and</strong>s <strong>and</strong> asked the World Wildlife Fund tohelp plan the system.In 2002 Canada announced plans to create 10 hugenew national parks <strong>and</strong> five new marine conservationareas by 2007. This will almost double the area occupiedby the country’s current 39 national parks. And in2002 Gabon announced plans to set aside 10% of itsl<strong>and</strong> area for a system of national parks.On the other h<strong>and</strong>, most developers <strong>and</strong> resourceextractors oppose protecting even the current 12% ofthe earth’s remaining undisturbed ecosystems. Theycontend that most of these areas contain valuable resourcesthat would add to economic growth.http://biology.brookscole.com/miller14215
Ecologists <strong>and</strong> conservation biologists disagree.They view protected areas as isl<strong>and</strong>s of biodiversitythat help sustain all life <strong>and</strong> economies <strong>and</strong> that serve ascenters of future evolution See Norman Myer’s GuestEssay on this topic on the website for this chapter.xHOW WOULD YOU VOTE? Should at least 20% of theearth’s l<strong>and</strong> area be strictly protected from economic development?Cast your vote online at http://biology.brookscole.com/miller14.GuanacasteArenalBajoTempisqueCordilleraVolcanica CentralNicaraguaCostaRicaCaribbean SeaLlanuras deTortugueroLa AmistadCase Study: What Has Costa Rica Done toProtect Some of Its L<strong>and</strong> from Degradation?A Global Conservation LeaderCosta Rica has devoted a larger proportion of l<strong>and</strong>than any other country to conserving its significantbiodiversity.Tropical forests once completely covered CentralAmerica’s Costa Rica, which is smaller in area thanWest Virginia <strong>and</strong> about one-tenth the size of France.Between 1963 <strong>and</strong> 1983, politically powerful ranchingfamilies cleared much of the country’s forests to grazecattle. They exported most of the beef produced to theUnited States <strong>and</strong> western Europe.Despite such widespread forest loss, tiny CostaRica is a superpower of biodiversity, with an estimated500,000 plant <strong>and</strong> animal species. A single park inCosta Rica is home to more bird species than all ofNorth America.In the mid-1970s, Costa Rica established a systemof reserves <strong>and</strong> national parks that by 2003 includedabout a quarter of its l<strong>and</strong>—6% of it in reserves for indigenouspeoples. Costa Rica now devotes a largerproportion of its l<strong>and</strong> to biodiversity conservationthan any other country!The country’s parks <strong>and</strong> reserves are consolidatedinto eight megareserves designed to sustain about 80%of Costa Rica’s biodiversity (Figure 11-21). Each reservecontains a protected inner core surrounded bybuffer zones that local <strong>and</strong> indigenous people use forsustainable logging, food growing, cattle grazing,hunting, fishing, <strong>and</strong> eco-tourism.Costa Rica’s biodiversity conservation strategyhas paid off. Today, the $1 billion a year tourism business—almosttwo-thirds of it from eco-tourists—is thecountry’s largest source of income.To reduce deforestation the government has eliminatedsubsidies for converting forests to cattle grazingl<strong>and</strong>. And it pays l<strong>and</strong>owners to maintain or restoretree coverage. This helps stabilize the climate by absorbingcarbon dioxide, controlling flooding, <strong>and</strong> purifyingwater. The goal is to make sustaining forestsprofitable. As a result Costa Rica has gone from havingone of the world’s highest deforestation rates to one ofthe lowest.Pacifico CentralPacific OceanPeninsula OsaPanamaFigure 11-21 Solutions: Costa Rica has consolidated itsparks <strong>and</strong> reserves into eight megareserves designed to sustainabout 80% of the country’s rich biodiversity.A concern is that without careful government control,the 1 million tourists visiting Costa Rica each yearcould degrade some of the protected areas. Increasedtourism could also stimulate the building of too manyhotels, resorts, <strong>and</strong> other potentially harmful forms ofdevelopment.Solutions: The Nature Conservancy:L<strong>and</strong> Conservation through PrivateActionThe Nature Conservancy has used private <strong>and</strong>corporate donations to create the world’s largestsystem of private natural areas <strong>and</strong> wildlifesanctuaries.Since its founding by a group of professional ecologistsin 1951, the Nature Conservancy—with more than 1 millionmembers worldwide—has created the world’slargest system of private natural areas <strong>and</strong> wildlifesanctuaries in 30 countries.The organization uses private <strong>and</strong> corporate donationsto maintain a fund for buying ecologically importantpieces of l<strong>and</strong> or wetl<strong>and</strong>s threatened bydevelopment or other human activities. If it cannotbuy l<strong>and</strong> for habitat protection, the conservancy helpsl<strong>and</strong>owners obtain tax benefits in exchange for acceptinglegal restrictions or conservation easementspreventing development. L<strong>and</strong>owners also receivesizable tax deductions by donating their l<strong>and</strong> to theNature Conservancy in exchange for lifetime occupancyrights.According to John C. Sawhill, former president ofthe Nature Conservancy, “In the end, our society willbe defined not only by what we create, but by what werefuse to destroy.”216 CHAPTER 11 Sustaining Terrestrial Biodiversity: Managing <strong>and</strong> Protecting Ecosystems
Should Reserves Be as Large as Possible?Generally, But Not AlwaysLarge reserves usually are the best way to protectbiodiversity, but in some places several well-placed,medium-sized, <strong>and</strong> isolated reserves can do the job.Large reserves sustain more species <strong>and</strong> providegreater habitat diversity than do small reserves. Theyalso minimize the area of outside edges exposed tonatural disturbances (such as fires <strong>and</strong> hurricanes), invadingspecies, <strong>and</strong> human disturbances from nearbydeveloped areas.However, research indicates that in some locales,several well-placed, medium-sized, <strong>and</strong> isolated reservesmay better protect a wider variety of habitats<strong>and</strong> preserve more biodiversity than a single large reserveof the same area. A mixture of large <strong>and</strong> smallreserves (Figure 11-21) may be the best way to protecta variety of species <strong>and</strong> communities against a numberof different threats.Establishing protected habitat corridors between reservescan help support more species <strong>and</strong> allow migrationof vertebrates that need large ranges. They alsopermit migration of individuals <strong>and</strong> populations whenenvironmental conditions in a reserve deteriorate <strong>and</strong>help preserve animals that must make seasonal migrationsto obtain food. Corridors may also enable somespecies to shift their ranges if global climate changemakes their current ranges uninhabitable.On the other h<strong>and</strong>, corridors can threaten isolatedpopulations by allowing movement of pest species,disease, fire, <strong>and</strong> exotic species between reserves.They also increase exposure of migrating species tonatural predators, human hunters, <strong>and</strong> pollution. Inaddition, corridors can be costly to acquire, protect,<strong>and</strong> manage.A buffer zone surrounds <strong>and</strong> protects the core area.In this zone, emphasis is on nondestructive research,education, <strong>and</strong> recreation. Local people can also carryout sustainable logging, agriculture, livestock grazing,hunting, <strong>and</strong> fishing in this buffer zone, as long as suchactivities do not harm the core.Finally, a second buffer, or transition zone, surroundsthe inner buffer. In this zone local people canengage in more intensive but sustainable forestry,grazing, hunting, fishing, agriculture, <strong>and</strong> recreationthan in the inner buffer zone. Doing this can enlist localpeople as partners in protecting a reserve from unsustainableuses.So far, most biosphere reserves fall short of theideal <strong>and</strong> receive too little funding for their protection<strong>and</strong> management. An international fund to help countriesprotect <strong>and</strong> manage biosphere reserves wouldcost about $100 million per year—about what theworld’s nations spend on weapons every 90 minutes.What Is Adaptive Ecosystem Management?Cooperation <strong>and</strong> FlexibilityPeople with competing interests can work togetherto develop adaptable plans for managing <strong>and</strong>sustaining nature reserves.Managing <strong>and</strong> sustaining a nature reserve is difficult.One problem is that reserves are constantly changingin response to environmental changes. Another is thatthey are affected by a variety of biological, cultural,Biosphere ReserveWhat Are Biosphere Reserves?A Great IdeaBiosphere reserves have an inner protected coresurrounded by two buffer zones that can be usedby local people for sustainable extraction of resourcesfor food <strong>and</strong> fuel.In 1971, the UN Educational, Scientific, <strong>and</strong> CulturalOrganization (UNESCO) created the Man <strong>and</strong> theBiosphere (MAB) Programme. A major goal of the programis to establish at least one (<strong>and</strong> ideally five ormore) biosphere reserves in each of the earth’s 193 biogeographicalzones. Today there are more than 425biosphere reserves in 95 countries.Each reserve must be large enough to containthree zones (Figure 11-22). The core area contains an importantecosystem that the government legally protectsfrom all human activities except nondestructiveresearch <strong>and</strong> monitoring.Tourism <strong>and</strong>education centerCore areaBuffer zone 1Buffer zone 2HumansettlementsResearchstationFigure 11-22 Solutions: a model biosphere reserve. In traditionalparks <strong>and</strong> wildlife reserves, well-defined boundaries keeppeople out <strong>and</strong> wildlife in. By contrast, biosphere reserves recognizepeople’s needs for access to sustainable use of variousresources in parts of the reserve.http://biology.brookscole.com/miller14217
Monitor<strong>and</strong> assessattainmentDevelopor reviseecologicalgoalsDevelopor reviseecologicalmodelan emergency action strategy that identifies <strong>and</strong> quicklyprotects biodiversity hot spots. These “ecological arks”are areas especially rich in plant <strong>and</strong> animal speciesthat are found nowhere else <strong>and</strong> are in great danger ofextinction or serious ecological disruption.Figure 11-24 shows 25 hot spots. They contain almosttwo-thirds of the earth’s terrestrial biodiversity<strong>and</strong> are the only locations for more than one-third ofthe planet’s known terrestrial plant <strong>and</strong> animal species.According to Norman Myers : “I can think of no otherbiodiversity initiative that could achieve so much at acomparatively small cost, as the hot spots strategy.”Implementor modifystrategiesDevelopor revisea planFigure 11-23 Solutions: the adaptive ecosystem managementprocess.economic, <strong>and</strong> political factors. In addition, their size,shape, <strong>and</strong> biological makeup often are determined bypolitical, legal, <strong>and</strong> economic factors that depend onl<strong>and</strong> ownership <strong>and</strong> conflicting public dem<strong>and</strong>s ratherthan by ecological principles <strong>and</strong> considerations.One way to deal with these uncertainties <strong>and</strong> conflictsis through adaptive ecosystem management. It isbased on using four principles. First, integrate ecological,economic, <strong>and</strong> social principles to help maintain<strong>and</strong> restore the sustainability <strong>and</strong> biological diversityof reserves while supporting sustainable economies<strong>and</strong> communities. Second, seek ways to get governmentagencies, private conservation organizations, scientists,business interests, <strong>and</strong> private l<strong>and</strong>owners toreach a consensus on how to achieve common conservationobjectives.Third, view all decisions <strong>and</strong> strategies as scientific<strong>and</strong> social experiments <strong>and</strong> use failures as opportunitiesfor learning <strong>and</strong> improvement. Fourth, emphasizecontinual information gathering, monitoring, reassessment,flexibility, adaptation, <strong>and</strong> innovation in the faceof uncertainty <strong>and</strong> usually unpredictable change. Figure11-23 summarizes the adaptive ecosystem managementprocess.What Areas Should Receive Top Priorityfor Establishing Reserves? Hot SpotsWe can prevent or slow down losses of biodiversity byconcentrating efforts on protecting hot spots wheresignificant biodiversity is under immediate threat.In reality, few countries are physically, politically, orfinancially able to set aside <strong>and</strong> protect large biodiversityreserves. To protect as much of the earth’s remainingbiodiversity as possible conservation biologists useWhat Is Wilderness <strong>and</strong> Why Is It Important?L<strong>and</strong> Protected from UsWilderness is l<strong>and</strong> legally set aside in a large enougharea to prevent or minimize harm from humanactivities.One way to protect undeveloped l<strong>and</strong>s from humanexploitation is by legally setting them aside as wilderness.According to the U.S. Wilderness Act of 1964,wilderness consists of areas “of undeveloped l<strong>and</strong>affected primarily by the forces of nature, where manis a visitor who does not remain.” U.S. PresidentTheodore Roosevelt summarized what we shoulddo with wilderness: “Leave it as it is. You cannot improveit.”The U.S. Wilderness Society estimates that awilderness area should contain at least 4,000 squarekilometers (1,500 square miles); otherwise it can be affectedby air, water, <strong>and</strong> noise pollution from nearbyhuman activities.Wilderness supporters cite several reasons for preservingwild places. One is that they are areas wherepeople can experience the beauty of nature <strong>and</strong> observenatural biological diversity. Such areas can alsoenhance the mental <strong>and</strong> physical health of visitors byallowing them to get away from noise, stress, development,<strong>and</strong> large numbers of people. Wilderness preservationistJohn Muir advised us,Climb the mountains <strong>and</strong> get their good tidings.Nature’s peace will flow into you as the sunshine intothe trees. The winds will blow their freshness into you,<strong>and</strong> the storms their energy, while cares will drop offlike autumn leaves.Even those who never use wilderness areas maywant to know they are there, a feeling expressed bynovelist Wallace Stegner:Save a piece of country... <strong>and</strong> it does not matter inthe slightest that only a few people every year will gointo it. This is precisely its value.... We simply needthat wild country available to us, even if we never domore than drive to its edge <strong>and</strong> look in. For it can be a218 CHAPTER 11 Sustaining Terrestrial Biodiversity: Managing <strong>and</strong> Protecting Ecosystems
Figure 11-24 Endangered natural capital: twenty-five hot spots identified by ecologists as important butendangered centers of biodiversity that contain a large number of endemic plant <strong>and</strong> animal species foundnowhere else. Research is adding new hot spots to this list. (Data from the Center for Applied BiodiversityScience at Conservation International)means of reassuring ourselves of our sanity as creatures,a part of the geography of hope.Some critics oppose protecting wilderness for itsscenic <strong>and</strong> recreational value for a small number ofpeople. They believe this is an outmoded concept thatkeeps some areas of the planet from being economicallyuseful to humans.Most biologists disagree. To them the most importantreasons for protecting wilderness <strong>and</strong> other areasfrom exploitation <strong>and</strong> degradation are to preserve theirbiodiversity as a vital part of the earth’s natural capital<strong>and</strong> to protect them as centers for evolution in response tomostly unpredictable changes in environmental conditions.In other words, wilderness is a biodiversity savingsaccount <strong>and</strong> an eco-insurance policy.Some analysts also believe wilderness should bepreserved because the wild species it contains have aright to exist (or struggle to exist) <strong>and</strong> play their rolesin the earth’s ongoing saga of biological evolution <strong>and</strong>ecological processes, without human interference.Case Study: How Much Wilderness Has BeenProtected in the United States? Fightingfor Crumbs <strong>and</strong> LosingOnly a small percentage of the l<strong>and</strong> area of theUnited States has been set aside as wilderness.In the United States, preservationists have been tryingto save wild areas from development since 1900. Overall,they have fought a losing battle. Not until 1964 didCongress pass the Wilderness Act. It allowed the governmentto protect undeveloped tracts of public l<strong>and</strong>from development as part of the National WildernessPreservation System.The area of protected wilderness in the UnitedStates increased tenfold between 1970 <strong>and</strong> 2000. Still,only about 4.6% of U.S. l<strong>and</strong> is protected as wilderness—almostthree-fourths of it in Alaska. Only 1.8%of the l<strong>and</strong> area of the lower 48 states is protected,most of it in the West. In other words, Americans havereserved 98% of the continental United States to beused as they see fit <strong>and</strong> have protected only about 2%as wilderness. According to a 1999 study by the WorldConservation Union (IUCN), the United States ranks42nd among nations in terms of terrestrial area protectedas wilderness, <strong>and</strong> Canada is in 36th place.In addition, only 4 of the 413 wilderness areas inthe lower 48 states are larger than 4,000 square kilometers(1,500 square miles). Also, the system includesonly 81 of the country’s 233 distinct ecosystems. Mostwilderness areas in the lower 48 states are threatenedhabitat isl<strong>and</strong>s in a sea of development.Almost 400,000 square kilometers (150,000 squaremiles) in scattered blocks of public l<strong>and</strong>s could qualifyhttp://biology.brookscole.com/miller14219
for designation as wilderness—about 60% of it in thenational forests. For two decades, these areas havebeen protected while they were evaluated for wildernessprotection. Wilderness supporters would like tosee all of these areas protected as part of the wildernesssystem.This is unlikely because of the political strength ofindustries that see these areas as sources of resourcesfor increased profits <strong>and</strong> short-term economic growth.The political efforts of these industries paid off when,in 2003, the Bush administration ceased protectingareas under consideration for classification as wilderness.This opens up many of these l<strong>and</strong>s to road building,mining, oil drilling, logging, <strong>and</strong> off-road vehicleuse. Such activities would also disqualify these areasfor wilderness protection in the future.Some wilderness advocates go further <strong>and</strong> call forcreating wilderness recovery areas. They would do thisby closing <strong>and</strong> obliterating nonessential roads in largeareas of public l<strong>and</strong>s, restoring wildlife habitats, allowingnatural fires to burn, <strong>and</strong> reintroducing keyspecies that have been driven from such areas.Some ecologists <strong>and</strong> conservation biologists call fordevelopment of The Wildl<strong>and</strong>s Project (TWP) to establisha network of protected wildl<strong>and</strong>s <strong>and</strong> ecosystemsthroughout as much of the United States as possible.Accomplishing this would require cooperative effortsamong government agencies, scientists, conservationgroups, <strong>and</strong> private owners <strong>and</strong> users. It is unlikely thatsuch projects will be implemented because of strong oppositionto expansion of wilderness areas.11-9 ECOLOGICAL RESTORATIONHow Can We Rehabilitate <strong>and</strong> RestoreDamaged Ecosystems? Making Amendsfor Our ActionsScientists have developed a number of techniques forrehabilitating <strong>and</strong> restoring degraded ecosystems <strong>and</strong>creating artificial ecosystems.Bad news. Almost every natural place on the earth hasbeen affected or degraded to some degree by humanactivities. Good news. Much of the environmentaldamage we have inflicted on nature is at least partiallyreversible through ecological restoration: theprocess of repairing damage caused by humans to thebiodiversity <strong>and</strong> dynamics of natural ecosystems. Examplesinclude replanting forests, restoring grassl<strong>and</strong>s,restoring wetl<strong>and</strong>s, reclaiming urban industrialareas (brownfields), reintroducing native species, removinginvasive species, <strong>and</strong> freeing river flows byremoving dams.Farmer <strong>and</strong> philosopher Wendell Berry says weshould try to answer three questions in decidingwhether <strong>and</strong> how to modify or rehabilitate naturalecosystems. First, what is here? Second, what will naturepermit us to do here? Third, what will nature helpus do here?By studying how natural ecosystems recover, scientistsare learning how to speed up repair operationsusing a variety of approaches. They include thefollowing:■ Restoration: trying to return a particular degradedhabitat or ecosystem to a condition as similar as possibleto its natural state. However, we often lack knowledgeabout the previous composition of a degradedarea <strong>and</strong> changes in climate, soil, <strong>and</strong> species compositioncan make it impossible to restore an area to itsearlier state.■ Rehabilitation: attempts to turn a degraded ecosystemback into a functional or useful ecosystemwithout trying to restore it to its original condition.Examples include removing pollutants <strong>and</strong> replantingareas such as mining sites, l<strong>and</strong>fills, <strong>and</strong> clear-cutforests to reduce soil erosion.■ Remediation: cleaning up chemical contaminantsfrom a site by physical or chemical methods to protecthuman health <strong>and</strong> as a first step toward redevelopmentof a site for human use. For example, anab<strong>and</strong>oned <strong>and</strong> polluted industrial plant—called abrownfield—may be cleaned up <strong>and</strong> then redevelopedinto office buildings, apartments, a sports field, or apark.■ Replacement: replacing a degraded ecosystem withanother type of ecosystem. For example, a productivepasture or tree farm may replace a degraded forest.■ Creating artificial ecosystems: Examples are the creationof artificial wetl<strong>and</strong>s.Researchers have suggested five basic sciencebasedprinciples for carrying out ecological restoration.■ Mimic nature <strong>and</strong> natural processes <strong>and</strong> ideally letnature do most of the work, usually through secondaryecological succession.■ Recreate important ecological niches that havebeen lost.■ Rely on pioneer species, keystone species, foundationspecies, <strong>and</strong> natural ecological succession to facilitatethe restoration process.■ Control or remove harmful nonnative species.■ If necessary, reconnect small patches to form largerones <strong>and</strong> create corridors where existing patches areisolated.Some analysts worry that environmental restorationcould encourage continuing environmental destruction<strong>and</strong> degradation by suggesting any ecologicalharm we do can be undone. Some go further <strong>and</strong>say that we do not underst<strong>and</strong> the incredible complex-220 CHAPTER 11 Sustaining Terrestrial Biodiversity: Managing <strong>and</strong> Protecting Ecosystems
ity of ecosystems well enough to restore or managedamaged natural ecosystems.And ecologists point out that preventing ecosystemdamage in the first place is cheaper <strong>and</strong> more effectivethan any form of ecological restoration. Accordingto ecological restoration expert John Berger, “Thepurpose of ecological restoration is to repair previousdamage, not legitimize further destruction.”Restorationists agree that restoration should notbe used as an excuse for environmental destruction.But they point out that so far we have been able to protector preserve no more than about 7% of nature fromthe effects of human activities. So ecological restorationis badly needed for much of the world’s ecosystemsthat we have damaged.They also point out that if a restored ecosystemdiffers from the original system this is better thannothing. And natural ecosystems are always changinganyway. They also contend that increased experiencewill improve the effectiveness of ecologicalrestoration.xHOW WOULD YOU VOTE? Should we mount a massiveeffort to restore ecosystems we have degraded even thoughthis will be quite costly? Cast your vote online at http://biology.brookscole.com/miller14.Case Study: Ecological Restoration of aTropical Dry Forest in Costa RicaA degraded tropical dry forest in Costa Rica is beingrestored in a cooperative venture between tropicalecologists <strong>and</strong> local people.Costa Rica is the site of one of the world’s largest ecologicalrestoration projects. In the lowl<strong>and</strong>s of the country’sGuanacaste National Park (Figure 11-21), a smalltropical dry deciduous forest has been burned, degraded,<strong>and</strong> fragmented by large-scale conversion tocattle ranches <strong>and</strong> farms.Now it is being restored <strong>and</strong> relinked to the rainforest on adjacent mountain slopes. The goal is to eliminatedamaging nonnative grass <strong>and</strong> cattle <strong>and</strong> reestablisha tropical dry forest ecosystem over the next100–300 years.Daniel Janzen, professor of biology at the Universityof Pennsylvania <strong>and</strong> a leader in the field ofrestoration ecology, has helped galvanize internationalsupport <strong>and</strong> has raised more than $10 million for thisrestoration project. He recognizes that ecologicalrestoration <strong>and</strong> protection of the park will fail unlessthe people in the surrounding area believe they willbenefit from such efforts. Janzen’s vision is to make thenearly 40,000 people who live near the park an essentialpart of the restoration of the degraded forest, aconcept he calls biocultural restoration.By actively participating in the project, local residentsreap educational, economic, <strong>and</strong> environmentalbenefits. Local farmers make money by sowing largeareas with tree seeds <strong>and</strong> planting seedlings started inJanzen’s lab. Local grade school, high school, <strong>and</strong> universitystudents <strong>and</strong> citizens’ groups study the ecologyof the park <strong>and</strong> go on field trips to the park. The park’slocation near the Pan American Highway makes it anideal area for eco-tourism, which stimulates the localeconomy.The project also serves as a training ground intropical forest restoration for scientists from all overthe world. Research scientists working on the projectgive guest classroom lectures <strong>and</strong> lead some of thefield trips.Janzen recognizes that in a few decades today’schildren will be running the park <strong>and</strong> the local politicalsystem. If they underst<strong>and</strong> the ecological importanceof their local environment, they are more likelyto protect <strong>and</strong> sustain its biological resources. He believesthat education, awareness, <strong>and</strong> involvement—not guards <strong>and</strong> fences—are the best ways to restore degradedecosystems <strong>and</strong> protect largely intact ecosystemsfrom unsustainable use.11-10 WHAT CAN WE DO?What Should Be Our Priorities? An Eight-StepProgramBiodiversity expert Edward O. Wilson has proposedeight priorities for protecting most of the world’sremaining ecosystems <strong>and</strong> species.In 2002, Edward O. Wilson, considered to be one of theworld’s foremost experts on biodiversity, published abook called The Future of Life (Knopf, New York). Inthis book, he proposed the following priorities for protectingmost of the world’s remaining ecosystems <strong>and</strong>species:■ Take immediate action to preserve the world’s biologicalhot spots (Figure 11-24).■ Keep intact the world’s remaining old-growth forests<strong>and</strong> cease all logging of such forests.■ Complete the mapping of the world’s terrestrial<strong>and</strong> aquatic biodiversity so we know what we have <strong>and</strong>ca make conservation efforts more precise <strong>and</strong> costeffective.■ Determine the world’s marine hot spots <strong>and</strong> assign themthe same priority for immediate action as for those onl<strong>and</strong>—more on this in Chapter 13.■ Concentrate on protecting <strong>and</strong> restoring everywhere theworld’s lakes <strong>and</strong> river systems, which are the most threatenedecosystems of all—more on this Chapter 13.■ Ensure that the full range of the earth’s terrestrial <strong>and</strong>aquatic ecosystems are included in a global conservationstrategy.http://biology.brookscole.com/miller14221
■ Make conservation profitable. This involves findingways to raise the income of people who live in or nearnature reserves so they can become partners in theirprotection <strong>and</strong> sustainable use. It also requires providingfinancial help from private <strong>and</strong> governmentsources to governments that protect their forests <strong>and</strong>other nature reserves.■ Initiate ecological restoration products worldwide toheal some of the damage we have done <strong>and</strong> increasethe share of the earth’s l<strong>and</strong> <strong>and</strong> water allotted to therest of nature.According to Wilson, such a conservation strategywould cost about $30 billion per year—an amount thatcould be provided by a tax of one cent per cup of coffee.According to biologist David Suzuhi, “We musttry our best in everything we do not to disrupt the naturalsystems around us because, ultimately, we arecompletely dependent on them. That is what sustainabilityall about.”This strategy for protecting the earth’s preciousbiodiversity will not be implemented without bottomuppolitical pressure on elected officials from individualcitizens <strong>and</strong> groups. It will also require cooperationamong key people in government, the private sector,science, <strong>and</strong> engineering using adaptive management(Figure 11-23). Figure 11-25 lists some ways you canhelp sustain the earth’s terrestrial biodiversity.We abuse l<strong>and</strong> because we regard it as a commodity belongingto us. When we see l<strong>and</strong> as a community to which we belong,we may begin to use it with love <strong>and</strong> respect.ALDO LEOPOLDWhat Can You Do?Sustaining Terrestrial Biodiversity• Plant trees <strong>and</strong> take care of them.• Recycle paper <strong>and</strong> buy recycled paper products.• Buy wood <strong>and</strong> wood products made from treesthat have been grown sustainably.• Help rehabilitate or restore a degraded area offorest or grassl<strong>and</strong> near your home.• When building a home, save all the trees <strong>and</strong> asmuch natural vegetation <strong>and</strong> soil as possible.• L<strong>and</strong>scape your yard with a diversity of plantsnatural to the area instead of having amonoculture lawn.Figure 11-25 What can you do? Ways to help sustain terrestrialbiodiversity.CRITICAL THINKING1. Do you agree or disagree with the program that reintroducedpopulations of the gray wolf in the Yellowstoneecosystem? Explain. Do you favor reintroducing grizzlybears to Yellowstone or other public l<strong>and</strong>s in the westernUnited States? Explain.2. Explain why you agree or disagree with (a) the fourprinciples that biologists <strong>and</strong> some economists have suggestedfor using public l<strong>and</strong> in the United States (p. 199)<strong>and</strong> (b) the nine suggestions made by developers <strong>and</strong> resourceextractors for managing <strong>and</strong> using U.S. publicl<strong>and</strong> (p. 199).3. Explain why you agree or disagree with each of theproposals for providing more sustainable use of foreststhroughout the world, listed in Figure 11-13, p. 205.4. Should there be a ban on the use of off-road motorizedvehicles <strong>and</strong> snowmobiles on all public l<strong>and</strong>s?Explain.5. Should the U.S. government (or the government of thecountry where you live) continue providing private companiesthat harvest timber from public l<strong>and</strong>s with subsidiesfor reforestation <strong>and</strong> for building <strong>and</strong> maintainingaccess roads? Explain.6. In the early 1990s, Miguel Sanchez, a subsistencefarmer in Costa Rica, was offered $600,000 by a hotel developerfor a piece of l<strong>and</strong> that he <strong>and</strong> his family hadbeen using sustainably for many years. The l<strong>and</strong> containedan old-growth rain forest <strong>and</strong> a black s<strong>and</strong> beachin an area under rapid development. Sanchez refused theoffer. What would you have done if you were a poor subsistencefarmer in Miguel Sanchez’s position? Explainyour decision.7. Should developed countries provide most of themoney to preserve remaining tropical forests in developingcountries? Explain.8. If ecosystems are undergoing constant change, whyshould we (a) establish <strong>and</strong> protect nature reserves <strong>and</strong>(b) carry out ecological restoration?9. Congratulations! You are in charge of protecting <strong>and</strong>sustaining the world’s terrestrial biodiversity. List thethree most important features of your policies for using<strong>and</strong> managing (a) forests <strong>and</strong> (b) parks.PROJECTS1. Obtain a topographic map of the region where youlive <strong>and</strong> use it to identify local, state, <strong>and</strong> federallyowned l<strong>and</strong>s in the form of parks, rangel<strong>and</strong>, forests,<strong>and</strong> wilderness areas. Identify the government agencyor agencies responsible for managing each of theseareas, <strong>and</strong> try to evaluate how well these agencies arepreserving the natural resources on this public l<strong>and</strong> onyour behalf.2. What has happened to the biome in which you live duringthe past 50 years? How much, if any, of it remains in its222 CHAPTER 11 Sustaining Terrestrial Biodiversity: Managing <strong>and</strong> Protecting Ecosystems
original state? How much of it should be protected fromfurther degradation? How much of it could be restored?3. If possible, try to visit (a) a diverse old-growth forest,(b) an area that has been recently clear-cut, <strong>and</strong> (c) anarea that was clear-cut 5–10 years ago. Compare the biodiversity,soil erosion, <strong>and</strong> signs of rapid water runoff ineach of the three areas.4. For many decades, New Zeal<strong>and</strong> has had a policy ofmeeting all its dem<strong>and</strong> for wood <strong>and</strong> wood products bygrowing timber on intensively managed tree plantations.Use the library or Internet to evaluate the effectivenessof this approach <strong>and</strong> its major advantages <strong>and</strong>disadvantages.5. Use the library <strong>and</strong> Internet to find one example of asuccessful ecological restoration project not discussed inthis chapter <strong>and</strong> one that failed. For your example, describethe strategy used, the ecological principles involved,<strong>and</strong> why the project succeeded or failed.6. Use the library or the Internet to find bibliographic informationabout François-Auguste-René de Chateaubri<strong>and</strong><strong>and</strong> Aldo Leopold, whose quotes appear at the beginning<strong>and</strong> end of this chapter.7. Make a concept map of this chapter’s major ideas, usingthe section heads, subheads, <strong>and</strong> key terms (in boldface).Look on the website for this book for informationabout making concept maps.LEARNING ONLINEThe website for this book contains study aids <strong>and</strong> manyideas for further reading <strong>and</strong> research. They include achapter summary, review questions for the entire chapter,flash cards for key terms <strong>and</strong> concepts, a multiple-choicepractice quiz, interesting Internet sites, references, <strong>and</strong> aguide for accessing thous<strong>and</strong>s of InfoTrac ® College Editionarticles. Log on tohttp://biology.brookscole.com/miller14Then click on the Chapter-by-Chapter area, choose Chapter11, <strong>and</strong> select a learning resource.http://biology.brookscole.com/miller14223
12 TheSustaining Biodiversity:Species ApproachBiodiversityCASE STUDYThe Passenger Pigeon:Gone ForeverIn 1813, bird expert John James Audubon saw a singleflock of passenger pigeons that he estimated was 16kilometers (10 miles) wide <strong>and</strong> hundreds of kilometerslong, <strong>and</strong> contained perhaps a billion birds. Theflock took three days to fly past him <strong>and</strong> was so densethat it darkened the skies.By 1914, the passenger pigeon (Figure 12-1) haddisappeared forever. How could a species that wasonce the most common bird in North America <strong>and</strong>probably the world become extinct in only a fewdecades? The answer is, humans wiped them out. Themain reasons for the extinction of this species wereuncontrolled commercial hunting <strong>and</strong> loss of thebird’s habitat <strong>and</strong> food supply as forests were clearedto make room for farms <strong>and</strong> cities.Passenger pigeons were good to eat, their feathersmade good pillows, <strong>and</strong> their bones were widelyused for fertilizer. They were easy to kill because theyflew in gigantic flocks <strong>and</strong> nested in long, narrowcolonies.Commercial hunters would capture one pigeonalive, sew its eyes shut, <strong>and</strong> tie it to a perch called astool. Soon a curious flock would l<strong>and</strong> beside this“stool pigeon”—a term we now use to describe someonewho turns in another person for breaking the law.Then the birds would be shot or ensnared by nets thatmight trap more than 1,000 birds at once.Beginning in 1858, passenger pigeon hunting becamea big business. Shotguns, traps, artillery, <strong>and</strong>even dynamite were used. People burned grass orsulfur below their roosts to suffocate the birds. Shootinggalleries used live birds as targets. In 1878, oneprofessional pigeon trapper made $60,000 by killing 3million birds at their nesting grounds near Petoskey,Michigan!By the early 1880s, only a few thous<strong>and</strong> birds remained.At that point, recovery of the species wasdoomed because the females laid only one egg per nesteach year. On March 24, 1900, a young boy in Ohioshot the last known wild passenger pigeon. The lastpassenger pigeon on earth, a hen named Martha afterMartha Washington, died in the Cincinnati Zoo inJohn James Audubon/The New York Historical SocietyFigure 12-1 Lost natural capital: passenger pigeons have beenextinct in the wild since 1900. The last known passenger pigeon diedin the Cincinnati Zoo in 1914.1914. Her stuffed body is now on view at the NationalMuseum of Natural History in Washington, D.C.Eventually all species become extinct or evolveinto new species. But biologists estimate that humanactivities have increased the natural rate of extinctionby a factor of 1,000 to 10,000—perhaps more. Studiesindicate that this rate of loss of biodiversity is expectedto increase as the human population grows,consumes more resources, disturbs more of the earth’sl<strong>and</strong> <strong>and</strong> aquatic systems, <strong>and</strong> uses more of the earth’snet plant productivity that supports all species.
The last word in ignorance is the person who says of an animalor plant: “What good is it?” . . . If the l<strong>and</strong> mechanismas a whole is good, then every part of it is good, whether weunderst<strong>and</strong> it or not .... Harmony with l<strong>and</strong> is like harmonywith a friend; you cannot cherish his right h<strong>and</strong> <strong>and</strong> chop offhis left.ALDO LEOPOLDThis chapter addresses the following questions:■■■■■How do biologists estimate extinction rates,<strong>and</strong> how are human activities affecting theserates?Why should we care about biodiversity <strong>and</strong> speciesextinction?What human activities endanger wildlife?How can we help prevent premature extinction ofspecies?What is reconciliation ecology, <strong>and</strong> how can it beused to help prevent premature extinction ofspecies?12-1 SPECIES EXTINCTIONWhat Are Three Types of Species Extinction?Local, Ecological, <strong>and</strong> BiologicalSpecies can become extinct locally, ecologically, orglobally.Biologists distinguish among three levels of species extinction.One is local extinction. It occurs when a speciesis no longer found in an area it once inhabited but isstill found elsewhere in the world. Most local extinctionsinvolve losses of one or more populations of aspecies.The second type is ecological extinction. It occurswhen so few members of a species are left that it canno longer play its ecological roles in the biologicalcommunities where it is found.The third type is biological extinction, when a speciesis no longer found anywhere on the earth (Figures 12-1<strong>and</strong> 12-2). Biological extinction is forever.What Are Endangered <strong>and</strong> ThreatenedSpecies? Ecological Smoke AlarmsAn endangered species could soon becomeextinct <strong>and</strong> a threatened species is likely to becomeextinct.Biologists classify species heading toward biological extinctionas either endangered or threatened (Figure 12-3,p. 226). An endangered species has so few individualsurvivors that the species could soon become extinctover all or most of its natural range. A threatened, orvulnerable, species is still abundant in its natural rangebut because of declining numbers is likely to become endangeredin the near future.Some species have characteristics that make themmore vulnerable than others to ecological <strong>and</strong> biologicalextinction (Figure 12-4, p. 228). As biodiversity expertEdward O. Wilson puts it, “the first animalspecies to go are the big, the slow, the tasty, <strong>and</strong> thosewith valuable parts such as tusks <strong>and</strong> skins.”A 2000 joint study by the World ConservationUnion <strong>and</strong> Conservation International <strong>and</strong> a 1999 studyby the World Wildlife Fund found that human activitiesthreaten several types of species with premature extinction(Figure 12-5, p. 228). And a 2000 survey by theNature Conservancy <strong>and</strong> the Association for BiodiversityInformation found that about one-third of 21,000animal <strong>and</strong> plant species in the United States are vulnerableto premature extinction.Passenger pigeon Great auk Dodo Dusky seaside sparrow Aepyornis(Madagascar)Figure 12-2 Lost natural capital: some animal species that have become prematurely extinct largely becauseof human activities, mostly habitat destruction <strong>and</strong> overhunting.http://biology.brookscole.com/miller14225
Grizzly bear(threatened)Kirkl<strong>and</strong>’s warblerWhite top pitcher plantArabian oryx(Middle East)African elephant(Africa)Mojave desert tortoise(threatened)Swallowtail butterflyHumpback chubGolden lion tamarin(Brazil)Siberian tiger(Siberia)West Virginia springsalam<strong>and</strong>erGiant p<strong>and</strong>a(China)Whooping craneKnowlton cactusBlue whaleMountain gorilla(Africa)Pine barrenstree frog (male)Swamp pinkHawksbill sea turtleEl Segunda blue butterflyFigure 12-3 Endangered natural capital: species that are endangered or threatened with premature extinctionlargely because of human activities. Almost 30,000 of the world’s species <strong>and</strong> 1,200 of those in the UnitedStates are officially listed as in danger of becoming extinct. Most biologists believe the actual number ofspecies at risk is much larger.226 CHAPTER 12 Sustaining Biodiversity: The Species Approach
Florida manatee Northern spotted owl Gray wolfFlorida panther Bannerman’s turaco(threatened)(Africa)Devil’s hole pupfish Snow leopardSymphoniaBlack-footed ferret Utah prairie dog(Central Asia)(Madagascar)Ghost bat(Australia)California condorBlack lace cactusBlack rhinoceros(Africa)Oahu tree snailHow Do Biologists Estimate Extinction Rates?Peering into a Cloudy Looking GlassScientists use measurements <strong>and</strong> models to estimateextinction rates.Evolutionary biologists estimate that 99.9% of all speciesthat ever existed are now extinct because of a combinationof background extinction, mass extinctions,<strong>and</strong> mass depletions taking place over thous<strong>and</strong>s tomillions of years. Biologists also talk of an extinctionspasm, in which large numbers of species are lost over aperiod of a few centuries or at most 1,000 years.Biologists trying to catalog extinctions have threeproblems. First, the extinction of a species typicallytakes such a long time that it is not easy to document.Second, we have identified only about 1.4–1.8 million ofthe world’s estimated 5–100 million species. Third, weknow little about most of the species we have identified.The truth is we do not know how many speciesare becoming extinct each year mostly because of ouractivities. But scientists do the best they can with thetools they have to estimate past <strong>and</strong> projected futureextinction rates.One approach is to study past records documentingthe rate at which mammals <strong>and</strong> birds have becomeextinct since we came on the scene <strong>and</strong> comparing thiswith the fossil records of such extinctions prior to ourarrival. For example, there is a detailed study on extinctionof Pacific isl<strong>and</strong> birds by early human colonists.Since the 1960s the International Union for the Conservationof Nature <strong>and</strong> Natural Resources (IUCN)—alsoknown as the World Conservation Union—has kepthttp://biology.brookscole.com/miller14227
CharacteristicLow reproductive rate(K-strategist)Specialized nicheNarrow distributionFeeds at high trophiclevelFixed migratory patternsRareCommercially valuableLarge territoriesExamplesBlue whale, giant p<strong>and</strong>a,rhinocerosBlue whale, giant p<strong>and</strong>a,Everglades kiteMany isl<strong>and</strong> species,elephant seal, desert pupfishBengal tiger, bald eagle,grizzly bearBlue whale, whooping crane,sea turtlesMany isl<strong>and</strong> species,African violet, some orchidsSnow leopard, tiger,elephant, rhinoceros,rare plants <strong>and</strong> birdsCalifornia condor, grizzlybear, Florida pantherrelationship suggests that on average, a 90% loss ofhabitat causes the extinction of about 50% of thespecies living in that habitat. For example, scientistsestimate that about 50% of the world’s existing terrestrialspecies live in tropical forests <strong>and</strong> that about onethirdof the remaining tropical forests will be cut orburned during the next few decades. If these assumptionsare valid, the species–area relationship suggestsabout 1 million species in these tropical forests will becomeextinct during this period.The methods just described give similar estimatesof past <strong>and</strong> future extinction rates. They also providestrong evidence that human actions have caused recentextinctions <strong>and</strong> that the situation will get worse.Scientists also use models to estimate the risk that aparticular population of a species will become endangeredor extinct within a certain time.Estimates of future extinction rates vary becauseof differing assumptions about the earth’s total numberof species, the proportion of these species found intropical forests, the rate at which tropical forests arebeing cleared, <strong>and</strong> the reliability of the methods usedto make these estimates.Figure 12-4 Characteristics of species that are prone to ecological<strong>and</strong> biological extinction.FishMammalsReptilesPlantsBirds14%12%20%24%34% (51% of freshwater species)Figure 12-5 Endangered natural capital: percentage of varioustypes of species threatened with premature extinction becauseof human activities. (Data from World ConservationUnion, Conservation International, <strong>and</strong> World Wildlife Fund)Red Lists that have become the world st<strong>and</strong>ard for listingall threatened species throughout the world. Theselists provide baseline information on how some of theearth’s biodiversity changes over time. Biologists usethese lists to identify species that have become extinct<strong>and</strong> to determine shifts in the types <strong>and</strong> numbers ofspecies endangered by human activities.Another way that biologists project future extinctionrates is to observe how the number of species presentincreases with the size of an area. This species–areaHow Are Human Activities AffectingExtinction Rates? Taking Out More SpeciesBiologists estimate that the current rate of extinctionis at least 1,000 to 10,000 times the rate before wearrived.In due time all species become extinct, but there is considerableevidence that we are hastening the final exitfor a growing number of species. Before we came onthe scene the estimated extinction rate was roughlyone species per million annually. This amounted to anannual extinction rate of about 0.0001% per year.Using the methods just described, biologists conservativelyestimate that the current rate of extinctionis at least 1,000 to 10,000 times the rate before we arrived.This amounts to an annual extinction rate of0.1% to 1% per year.So how many species are we probably losing prematurelyeach year? This depends on how manyspecies are on the earth. Assuming that the extinctionrate is 0.1%, each year we are losing 5,000 species peryear if there are 5 million species, 14,000 if there are 14million species (biologists’ current best guess), <strong>and</strong>100,000 if there are 100 million species.Most biologists would consider the prematureloss of 1 million species over 100–200 years an extinctioncrisis or spasm that if kept up would lead to amass depletion or even a mass extinction. At an extinctionrate of 0.1% a year, the time it would take to lose 1million species would be 200 years if there were a totalof 5 million species, 71 years with a total of 14 millionspecies, <strong>and</strong> 10 years with 100 million species. Howmany years would it take to lose 1 million species for228 CHAPTER 12 Sustaining Biodiversity: The Species Approach
each of these three species estimates if the extinctionrate is 1% a year?According to researchers Edward O. Wilson <strong>and</strong>Stuart Primm, at a 1% extinction rate at least 20% ofthe world’s current animal <strong>and</strong> plant species could begone by 2030 <strong>and</strong> 50% could vanish by the end of thiscentury. In the words of biodiversity expert NormanMyers, “Within just a few human generations, weshall—in the absence of greatly exp<strong>and</strong>ed conservationefforts—impoverish the biosphere to an extentthat will persist for at least 200,000 human generationsor twenty times longer than the period since humansemerged as a species.”Most biologists consider extinction rates of 0.1–1%to be conservative estimates for several reasons. First,both the rate of species loss <strong>and</strong> the extent of biodiversityloss are likely to increase during the next 50–100years because of the projected exponential growth ofthe world’s human population <strong>and</strong> per capita resourceuse. In other words, the size of our already large ecologicalfootprint (Figure 1-7, p. 10 <strong>and</strong> Figure 9-12,p. 172) is likely to increase.Second, current <strong>and</strong> projected extinction rates aremuch higher than the global average in parts of theworld that are endangered centers of biodiversity.Conservation biologists estimate that such biologicallyrich areas could lose one-fourth to one-half of their estimatedspecies within a few decades. They urge us tofocus our efforts on slowing the much higher rates ofextinction in such hot spots (Figure 11-24, p. 219) as thebest <strong>and</strong> quickest way to protect much of the earth’sbiodiversity from being lost prematurely.Third, we are eliminating, degrading, <strong>and</strong> simplifyingmany biologically diverse environments—suchas tropical forests, tropical coral reefs, wetl<strong>and</strong>s, <strong>and</strong>estuaries—that serve as potential colonization sites forthe emergence of new species. Thus, in addition to increasingthe rate of extinction, we may also be limitinglong-term recovery of biodiversity by reducing therate of speciation for some types of species. In otherwords, we are also creating a speciation crisis. SeeNorman Myers Guest Essay on this topic on the websitefor this chapter.Philip Levin, Donald Levin, <strong>and</strong> other biologistsalso argue that the increasing fragmentation <strong>and</strong> disturbanceof habitats throughout the world may increasethe speciation rate for rapidly reproducing opportunistspecies such as weeds, rodents, <strong>and</strong> cockroaches <strong>and</strong>other insects. Thus the real threat to biodiversity fromcurrent human activities may not be a permanent declinein the number of species but a long-term erosion inthe earth’s variety of species <strong>and</strong> habitats.Some people, most of them not biologists, say thecurrent estimated extinction rates are too high <strong>and</strong> arebased on inadequate data <strong>and</strong> models. Researchersagree that their estimates of extinction rates are basedon inadequate data <strong>and</strong> sampling. They continuallystrive to get better data <strong>and</strong> improve the models theyuse to estimate extinction rates.However, they point to clear evidence that humanactivities have increased the rate of species extinction<strong>and</strong> that this rate is likely to rise. According to thesebiologists, arguing over the numbers <strong>and</strong> waiting toget better data <strong>and</strong> models should not be used as excusesfor inaction. They call for us to implement a precautionarystrategy now to help prevent a significantdecrease in the earth’s genetic, species, ecological, <strong>and</strong>functional diversity.To these biologists, we are not heeding the warningof Aldo Leopold about preserving biodiversity aswe tinker with the earth: “To keep every cog <strong>and</strong>wheel is the first precaution of intelligent tinkering.”12-2 IMPORTANCE OF WILD SPECIESWhy Should We Preserve Wild Species? TheyHave ValueWe should not cause the premature extinction ofspecies because of the economic <strong>and</strong> ecologicalservices they provide.So what is all the fuss about? If all species eventuallybecome extinct, why should we worry about losing afew more because of our activities? Does it matter thatthe passenger pigeon, the 80–100 remaining Floridapanthers, or some unknown plant or insect in a tropicalforest becomes prematurely extinct because of ouractivities?We know that new species eventually evolve totake the place of ones lost through extinction spasms,mass depletions, or mass extinctions. So why shouldwe care if we speed up the extinction rate over the next50–100 years? The answer is that it will take at least5 million years for speciation to rebuild the biodiversity weare likely to destroy during this century!Conservation biologists <strong>and</strong> ecologists say weshould act now to prevent the premature extinction ofspecies because of their instrumental value based ontheir usefulness to us in the form of economic <strong>and</strong> ecologicalservices. For example, species provide economicvalue in the form of food crops, fuelwood <strong>and</strong>lumber, paper, <strong>and</strong> medicine (Figure 11-17, p. 211).Another instrumental value is the genetic informationin species. Genetic engineers use this informationto produce new types of crops (Figure 5-11, p. 98) <strong>and</strong>foods <strong>and</strong> edible vaccines for viral diseases such ashepatitis B. Carelessly eliminating many of the speciesmaking up the world’s vast genetic library is likeburning books before we read them. Wild species alsoprovide a way for us to learn how nature works <strong>and</strong>sustains itself.The earth’s wild plants <strong>and</strong> animals also provideus with recreational pleasure. Each year Americanshttp://biology.brookscole.com/miller14229
spend over three times as many hours watchingwildlife—doing nature photography <strong>and</strong> bird watching,for example—as they spend on watching moviesor professional sporting events.Wildlife tourism, or eco-tourism, generates at least$500 billion per year worldwide, <strong>and</strong> perhaps twicethat much. Conservation biologist Michael Soulé estimatesthat one male lion living to age 7 generates$515,000 in tourist dollars in Kenya but only $1,000 ifkilled for its skin. Similarly, over a lifetime of 60 yearsa Kenyan elephant is worth about $1 million in ecotouristrevenue—many times more than its tusks areworth when sold illegally for their ivory.Ideally, eco-tourism should not cause ecologicaldamage. In addition, it should provide income for localpeople to motivate them to preserve wildlife <strong>and</strong>funds for the purchase <strong>and</strong> maintenance of wildlifepreserves <strong>and</strong> conservation programs. Much ecotourismdoes not meet these st<strong>and</strong>ards, <strong>and</strong> excessive<strong>and</strong> unregulated eco-tourism can destroy or degradefragile areas <strong>and</strong> promote premature species extinction.The website for this chapter lists some guidelinesfor evaluating eco-tours.Case Study: Why Should We Care about Bats?Ecological AlliesBecause of the important ecological <strong>and</strong> economicroles bats play, we should view them as valuableallies, not as enemies to kill.Worldwide there are 950 known species of bats—theonly mammals that can fly. However, bats have twotraits that make them vulnerable to extinction. First,they reproduce slowly. Second, many bat species livein huge colonies in caves <strong>and</strong> ab<strong>and</strong>oned mines,which people sometimes block. This prevents themfrom leaving to get food <strong>and</strong> can disturb theirhibernation.Bats play important ecological roles. About 70% ofall bat species feed on crop-damaging nocturnal insects<strong>and</strong> other insect pest species such as mosquitoes.This makes them the major nighttime SWAT team forsuch insects.In some tropical forests <strong>and</strong> on many tropical isl<strong>and</strong>s,pollen-eating bats pollinate flowers, <strong>and</strong> fruiteatingbats distribute plants throughout tropical forestsby excreting undigested seeds.As keystone species, such bats are vital for maintainingplant biodiversity <strong>and</strong> for regenerating largeareas of tropical forest cleared by human activities. Ifyou enjoy bananas, cashews, dates, figs, avocados, ormangos, you can thank bats.Many people mistakenly view bats as fearsome,filthy, aggressive, rabies-carrying bloodsuckers. Butmost bat species are harmless to people, livestock, <strong>and</strong>crops. In the United States, only 10 people have died ofbat-transmitted disease in four decades of recordkeeping; more Americans die each year from fallingcoconuts.Because of unwarranted fears of bats <strong>and</strong> lack ofknowledge about their vital ecological roles, severalbat species have been driven to extinction. Currently,about one-fourth of the world’s bat species, includingthe ghost bat (Figure 12-3), are listed as endangered orthreatened. Conservation biologists urge us to viewbats as valuable allies, not as enemies.What Is the Intrinsic Value of Species?Existence RightsSome people believe that each wild species has aninherent right to exist.Some people believe that each wild species also has intrinsicor existence value based on its inherent right toexist <strong>and</strong> play its ecological roles regardless of its usefulnessto us. Biologist Edward O. Wilson believesmost people feel obligated to protect other species <strong>and</strong>the earth’s biodiversity because most humans seem tohave a natural affinity for nature that he calls biophilia(Connections, right). As novelist Fyodor Dostoevskysaid in his 1889 novel The Brothers Karamazov, “Lovethe animals, love the plants, love everything. If youlove everything, you will perceive the divine mysteryin things. Once you perceive it, you will begin to comprehendit better every day. And you will come at lastto love the whole world with an all-embracing love.”Some people distinguish between the survivalrights of plants <strong>and</strong> those of animals, mostly for practicalreasons. Poet Alan Watts once said he was a vegetarian“because cows scream louder than carrots.”Other people distinguish among various types ofspecies. For example, they might think little about gettingrid of the world’s mosquitoes, cockroaches, rats,or disease-causing bacteria.Some proponents of existence rights such as NobelPrize winner Albert Schweitzer go further <strong>and</strong> assertthat each individual organism has a right to survivewithout human interference. Others apply this to individualsof some species but not to those of other species.Unless they are strict vegetarians, for example, somepeople see no harm in having others kill domesticatedanimals in slaughterhouses to provide them with meat,leather, <strong>and</strong> other products. But these same peoplemight deplore the killing of wild animals such as deer,squirrels, or rabbits. Where do you st<strong>and</strong> on this issue?Some conservation biologists also caution us notto focus primarily on protecting relatively big organisms—theplants <strong>and</strong> animals we can see <strong>and</strong> are familiarwith. They remind us that the true foundationof the earth’s ecosystems <strong>and</strong> ecological processes arethe invisible bacteria, <strong>and</strong> the algae, fungi, <strong>and</strong> othermicroorganisms that decompose the bodies of larger organisms<strong>and</strong> recycle the nutrients needed by all life(Case Study, p. 56).230 CHAPTER 12 Sustaining Biodiversity: The Species Approach
BiophiliaBiologist EdwardO. Wilson contendsthat becauseof the billions ofCONNECTIONS years of biologicalconnections leadingto the evolution of the humanspecies, we have an inherent affinityfor the natural world. He calls thisphenomenon biophilia (love of life).Evidence of this natural <strong>and</strong>emotional affinity for life is seen inthe preference most people have foralmost any natural scene over onefrom an urban environment. Givena choice, most people prefer to livein an area where they can see water,grassl<strong>and</strong>, or a forest. More peoplevisit zoos <strong>and</strong> aquariums than attendall professional sporting eventscombined.In the 1970s I was touring thespace center at Cape Canaveral inFlorida. During our bus ride thetour guide pointed out each of theab<strong>and</strong>oned multimillion-dollarlaunch sites <strong>and</strong> gave a brief historyof each launch. Most of us wereutterly bored. Suddenly peoplestarted rushing to the front of thebus <strong>and</strong> staring out the windowwith great excitement. What theywere looking at was a baby alligator—adramatic example of howbiophilia can triumph overtechnophilia.Not everyone has biophilia.Some have the opposite feelingabout many or most forms of life.This fear of life is called biophobia.Biophobia varies in intensity <strong>and</strong>degree with individuals based onheredity <strong>and</strong> experience with variousforms of life. For example,some movies, books, <strong>and</strong> TV programscondition us to fear or berepelled by certain species suchas snakes, spiders, insects (especiallyones that bite, sting, or crawlaround our houses such as cockroaches,bats, sharks, rats, <strong>and</strong>bacteria). Throughout this book Ihave tried to show you the importantecological roles such speciesplay.But I underst<strong>and</strong> that many ofyou will fear many of these speciesregardless of how useful they are tous <strong>and</strong> the functioning of ecosystems.Fear is a difficult emotion toovercome.Critical ThinkingDo you have an affinity for wildlife<strong>and</strong> wild ecosystems (biophilia)? Ifso, how do you display this love ofwildlife in your daily actions? Whatpatterns of your consumption helpdestroy <strong>and</strong> degrade wildlife?12-3 EXTINCTION THREATS FROMHABITAT LOSS AND DEGRADATIONWhat Is the Role of Habitat Loss <strong>and</strong> Degradation?Creating Homeless SpeciesThe greatest threat to a species is the loss <strong>and</strong> degradationof the place where it lives.Figure 12-6 shows the basic <strong>and</strong> secondary causes ofthe endangerment <strong>and</strong> premature extinction of wildspecies. Conservation biologists sometimes summarizethe main secondary factors leading to prematureextinction using the acronym HIPPO for habitat destruction<strong>and</strong> fragmentation, invasive (alien) species,population growth (too many people consuming toomany resources), pollution, <strong>and</strong> overharvesting.HabitatlossHabitat degradation<strong>and</strong> fragmentationIntroducingnonnative speciesOverfishingClimate changePredator <strong>and</strong> pest controlSecondary <strong>Causes</strong>PollutionCommercialhunting <strong>and</strong> poachingSale of exotic pets<strong>and</strong> decorative plantsFigure 12-6 Basic <strong>and</strong> secondarycauses of depletion <strong>and</strong>premature extinction of wildspecies. The two biggest directcauses of wildlife depletion <strong>and</strong>premature extinction are loss,fragmentation, <strong>and</strong> degradationof habitat, <strong>and</strong> deliberate or accidentalintroduction of nonnativespecies into ecosystems.• Population growth• Rising resource use• No environmentalaccounting• PovertyBasic <strong>Causes</strong>http://biology.brookscole.com/miller14231
According to biodiversity researchers, the greatestthreat to wild species is habitat loss (Figure 12-7),degradation, <strong>and</strong> fragmentation. In other words, manyspecies have a hard time surviving after we take overtheir ecological “house” <strong>and</strong> food supplies <strong>and</strong> makethem homeless.Deforestation of tropical forests is the greatesteliminator of terrestrial species followed by the destructionof wetl<strong>and</strong>s <strong>and</strong> plowing of grassl<strong>and</strong>s.Globally, temperate biomes have been affected moreby habitat loss <strong>and</strong> degradation than have tropical biomesbecause of widespread development in temperatecountries over the past 200 years. Emphasis is nowshifting to many tropical biomes.According to the Nature Conservancy, the majortypes of habitat disturbance threatening endangeredspecies in the United States are, in order of importance:agriculture, commercial development, water development,outdoor recreation (including off-road vehicles),livestock grazing, <strong>and</strong> pollution.Range 100 years agoRange today(about 2,300 left)Range in 1700Range today(about 2,400 left)Indian TigerBlack RhinoProbable range 1600Range today(300,000 left)African ElephantFormer rangeRange today(34,000–54,000 left)Asian or Indian ElephantFigure 12-7 Degraded natural capital: reductions in the ranges of four wildlife species, mostly the result ofhabitat loss <strong>and</strong> hunting. What will happen to these <strong>and</strong> millions of other species when the world’s humanpopulation doubles <strong>and</strong> per capita resource consumption rises sharply in the next few decades? (Data fromInternational Union for the Conservation of Nature <strong>and</strong> World Wildlife Fund)232 CHAPTER 12 Sustaining Biodiversity: The Species Approach
Isl<strong>and</strong> species, many of them endemic speciesfound nowhere else on earth, are especially vulnerableto extinction when their habitats are destroyed, degraded,or fragmented.What Is the Role of Habitat Fragmentation?Isolating <strong>and</strong> Weakening Populationsof SpeciesSpecies are more vulnerable to extinction whentheir habitats are divided into smaller, more isolatedpatches.Habitat fragmentation occurs when a large, continuousarea of habitat is reduced in area <strong>and</strong> divided intosmaller, more scattered, <strong>and</strong> isolated patches or “habitatisl<strong>and</strong>s.” This divides populations of a species intosmaller <strong>and</strong> more isolated groups that are more vulnerableto predators, invasion by more competitivespecies, disease, <strong>and</strong> catastrophic events such as astorm or fire. Also, it creates barriers that can hindersome species from dispersing <strong>and</strong> colonizing new areas,getting enough to eat, <strong>and</strong> finding mates.Certain types of species are especially vulnerableto local <strong>and</strong> regional extinction because of habitat fragmentation.They include species that are rare, thatneed to roam unhindered over large areas, <strong>and</strong> thatcannot rebuild their population because of a low reproductivecapacity. Also included are species withspecialized niches <strong>and</strong> species that are sought by peoplefor furs, food, medicines, or other uses.The theory of isl<strong>and</strong> biogeography (p. 145) hasbeen used to underst<strong>and</strong> the effects of fragmentationon species extinction <strong>and</strong> to develop ways to help preventsuch extinction.Case Study: How Do Human ActivitiesAffect Bird Species? A Disturbing Messagefrom the BirdsOur activities are causing serious declines in thepopulations of many bird species.Approximately 70% of the world’s 9,800 known birdspecies are declining in numbers <strong>and</strong> about one ofevery six bird species is threatened with extinction,mostly because of habitat loss <strong>and</strong> fragmentation. A2002 National Audubon Society study found that aquarter of all U.S. bird species are declining in numbersor are at risk of disappearing. Figure 12-8 showsthe 10 most threatened U.S. songbird species accordingto a 2002 study by the National Audubon Society.Cerulean warbler Sprague’s pipitBichnell’s thrushBlack-capped vireo Golden-cheeked warblerFlorida scrub jay California gnatcatcher Kirtl<strong>and</strong>’s warbler Henslow’s sparrow Bachman’s warblerFigure 12-8 Threatened natural capital: ten most threatened species of U.S. songbirds according to a 2002study by the National Audubon Society. Most of these species are threatened because of habitat loss <strong>and</strong> fragmentationfrom human activities. Almost 1,200 species—about 12% of the world’s 9,800 known bird species—may face premature extinction during this century.http://biology.brookscole.com/miller14233
Nonnative species are the second greatest threat tobirds. They include bird-eating cats, rats, brown-treesnakes, <strong>and</strong> mongooses.Birds can also be loved to death. A third of theworld’s 330 parrot species are threatened from a combinationof habitat loss <strong>and</strong> capture for the pet trade (oftenillegal), especially in Europe <strong>and</strong> the United States.At least 23 species of seabirds face extinction becausethey are being drowned after becoming hookedon miles of baited lines put out by fishing boats. Millionsof migrating birds are also killed each year whenthey collide with power lines, communications towers,<strong>and</strong> skyscrapers that we have erected in the middle oftheir migration routes. For example, each year U.S.hunters kill about 121 million birds. But about 1 billionbirds are killed in the U.S. each year by flying intoglass windows.Other threats to birds are oil spills, exposure topesticides, herbicides that destroy their habitats, <strong>and</strong>swallowing toxic lead shotgun pellets left in wetl<strong>and</strong>s<strong>and</strong> lead sinkers left by anglers. Poorly regulated illegalhunting <strong>and</strong> capture also take a heavy toll.Conservation biologists view this decline of birdspecies as an early warning of the greater loss of biodiversityto come. The reason is that birds are excellentenvironmental indicators because they live in every climate<strong>and</strong> biome, respond quickly to environmentalchanges in their habitats, <strong>and</strong> are easy to track <strong>and</strong>count.Besides serving as indicator species, birds play importantecological roles. These include helping controlpopulations of rodents <strong>and</strong> insects (which decimatemany tree species), pollinating a variety of floweringplants, spreading plants throughout their habitats byconsuming <strong>and</strong> excreting plant seeds, <strong>and</strong> scavengingdead animals. Conservation biologists urge us to listenmore carefully to what birds are telling us about thestate of the environment.provide more than 98% of the U.S. food supply. Similarly,nonnative tree species are grown in about 85% ofthe world’s tree plantations. Some deliberately introducedspecies have also helped control pests.The problem is that some introduced species haveno natural predators, competitors, parasites, or pathogensto help control their numbers in their new habitats.Such species can reduce or wipe out populationsof many native species <strong>and</strong> trigger ecological disruptions.Figure 12-9 shows some of the estimated 50,000nonnative species deliberately or accidentally introducedinto the United States that have caused ecological<strong>and</strong> economic harm.After habitat loss <strong>and</strong> degradation, the deliberateor accidental introduction of nonnative species intoecosystems is the biggest cause of animal <strong>and</strong> plantextinctions. Nonnative species threaten almost half ofthe more than 1,260 endangered <strong>and</strong> threatened speciesin the United States <strong>and</strong> 95% of those in the stateof Hawaii, according to the U.S. Fish <strong>and</strong> WildlifeService. They are also blamed for about two-thirds offish extinctions in the United States between 1900 <strong>and</strong>2000. One example of a deliberately introduced plantspecies is the kudzu (“CUD-zoo”) vine, which growsrampant in the southeastern United States (see CaseStudy below).Deliberately introduced animal species have alsocaused ecological <strong>and</strong> economic damage. An exampleis the estimated 1 million European wild (feral) boars, orhogs (Figure 12-9), found in parts of Florida, Texas, <strong>and</strong>other states. They breed like rabbits, have razor-sharptusks, compete for food with endangered animals, rootup farm fields, <strong>and</strong> cause traffic accidents. Game <strong>and</strong>wildlife officials have had little success in controllingtheir numbers with hunting <strong>and</strong> trapping <strong>and</strong> saythere is no way to stop them. Another example is theestimated 30 million feral cats <strong>and</strong> 41 million outdoor petcats introduced into the United States; they kill about568 million birds per year!12-4 EXTINCTION THREATSFROM NONNATIVE SPECIESWhat Is the Role of Deliberately IntroducedSpecies? Good <strong>and</strong> Bad NewsMany nonnative species provide us with food,medicine, <strong>and</strong> other benefits but a few can wipe outsome native species, disrupt ecosystems, <strong>and</strong> causelarge economic losses.We depend heavily on nonnative organisms for ecosystemservices, food, shelter, medicine, <strong>and</strong> aestheticenjoyment.According to a 2000 study by ecologist DavidPimentel, introduced species such as corn, wheat, rice,other food crops, cattle, poultry, <strong>and</strong> other livestockCase Study: Deliberate Introduction of theKudzu Vine: Unintended ConsequencesThe rapidly growing kudzu vine has spread throughoutmuch of the southern United States <strong>and</strong> is almostimpossible to control.In the 1930s the kudzu vine was imported from Japan<strong>and</strong> planted in the southeastern United States to helpcontrol soil erosion. It does control erosion. But it is soprolific <strong>and</strong> difficult to kill that it engulfs hillsides, gardens,trees, ab<strong>and</strong>oned houses <strong>and</strong> cars, stream banks,Figure 12-9 (facing page) Threats to natural capital: somenonnative species that have been deliberately or accidentallyintroduced into the United States.234 CHAPTER 12 Sustaining Biodiversity: The Species Approach
Deliberately Introduced SpeciesPurple loosestrife European starling African honeybee Nutria Salt cedar(“Killer bee”)(Tamarisk)Marine toad(Giant toad)Water hyacinthJapanese beetleHydrillaEuropean wild boar(Feral pig)Accidentally Introduced SpeciesSea lamprey(attached to lake trout)Argentina fire antBrown tree snakeEurasian ruffeCommon pigeon(Rock dove)Formosan termite Zebra musselAsian long-horned beetle Asian tiger mosquito Gypsy moth larvaehttp://biology.brookscole.com/miller14235
Figure 12-10 Kudzu taking over a house <strong>and</strong> a truck. This vinecan grow 5 centimeters (2 inches) per hour <strong>and</strong> is now foundfrom east Texas to Florida <strong>and</strong> as far north as southeasternPennsylvania <strong>and</strong> Illinois. Kudzu was deliberately introducedinto the United States for erosion control, but it cannot bestopped by being dug up or burned. Grazing by goats <strong>and</strong> repeateddoses of herbicides can destroy it, but goats <strong>and</strong> herbicidesalso destroy other plants, <strong>and</strong> herbicides can contaminatewater supplies. Recently, scientists have found a commonfungus (Myrothecium verrucaria) that can kill kudzu within a fewhours, apparently without harming other plants.patches of forest, <strong>and</strong> anything else in its path (Figure12-10).This vine, sometimes called “the vine that ate theSouth,” has spread throughout much of the southernUnited States. It could spread as far north as the GreatLakes by 2040 if projected global warming occurs.Kudzu is considered a menace in the UnitedStates. But Asians use a powdered kudzu starch inbeverages, gourmet confections, <strong>and</strong> herbal remediesfor a range of diseases. A Japanese firm has built alarge kudzu farm <strong>and</strong> processing plant in Alabama<strong>and</strong> ships the extracted starch to Japan.Although kudzu can engulf <strong>and</strong> kill trees, it couldeventually help save trees from loggers. Research atthe Georgia Institute of Technology indicates thatkudzu may be used as a source of tree-free paper.What Is the Role of AccidentallyIntroduced Species? Aliens TakingOverAgrowing number of accidentally introduced speciesare causing serious economic <strong>and</strong> ecological damage.Many unwanted nonnative invaders arrive from othercontinents as stowaways on aircraft, in the ballast waterof tankers <strong>and</strong> cargo ships, <strong>and</strong> as hitchhikers onimported products such as wooden packing crates.Cars <strong>and</strong> trucks can spread seeds of nonnative speciesimbedded in tire treads.In the late 1930s, the extremely aggressiveArgentina fire ant (Figure 12-9) was introduced accidentallyinto the United States in Mobile, Alabama. Theants may have arrived on shiploads of lumber or coffeeimported from South America or by hitching a ridein the soil-containing ballast water of cargo ships.These ants spawn <strong>and</strong> spread rapidly. Bother them,<strong>and</strong> up to 100,000 ants can swarm out of their nest to attackyou with their painful <strong>and</strong> burning stings.Without natural predators, fire ants have spreadrapidly by l<strong>and</strong> <strong>and</strong> water (they can float) throughoutthe South, from Texas to Florida <strong>and</strong> as far north asTennessee <strong>and</strong> North Carolina (Figure 12-11). They arealso found in Puerto Rico <strong>and</strong> recently have invadedCalifornia <strong>and</strong> New Mexico.Wherever fire ants have gone, they have sharplyreduced or wiped out up to 90% of native ant populations.<strong>Their</strong> extremely painful stings have killeddeer fawns, birds, livestock, pets, <strong>and</strong> at least 80 peopleallergic to their venom. These ants have invadedcars <strong>and</strong> caused accidents by attacking drivers, damagedcrops (such as soybeans, corn, strawberries, <strong>and</strong>potatoes), disrupted phone service <strong>and</strong> electricalpower, caused fires by chewing through undergroundcables, <strong>and</strong> cost the United States an estimated$600 million per year. <strong>Their</strong> large mounds,which raise large boils on the l<strong>and</strong>, can ruin cropfields, <strong>and</strong> their painful stings can make backyardsuninhabitable.Widespread pesticide spraying in the 1950s <strong>and</strong>1960s temporarily reduced fire ant populations. Butthis chemical warfare hastened the advance of therapidly multiplying fire ant by reducing populationsof many native ant species. Worse, it promoted devel-19182000Figure 12-11Natural capitaldegradation:expansion of theArgentina fire ant insouthern states,1918–2000. Thisinvader is alsofound in PuertoRico, New Mexico,<strong>and</strong> California.(Data from U.S.Department ofAgriculture)236 CHAPTER 12 Sustaining Biodiversity: The Species Approach
The Termite from HellForget killer bees<strong>and</strong> fire ants. Thehomeowner’snightmare is theCASE STUDY Formosan termite(Figure 12-9). It isthe most voracious, aggressive, <strong>and</strong>prolific of more than 2,000 knowntermite species.These termites probably arrivedon the U.S. mainl<strong>and</strong> from Hawaiiduring or soon after World War II.They were stowaways in woodenpacking materials on military cargoships that docked in southern portssuch as New Orleans, Louisiana,<strong>and</strong> Houston, Texas.Formosan termites consumewood nine times faster than domestictermites. <strong>Their</strong> huge colonies cancontain up to 73 million insectscompared to about 1 million in thecolonies of most native termites.Domestic termite colonies haveto be in contact with soil, which canbe chemically treated around theoutside of a building to reduce infestation.But Formosan termitescan establish a colony in an attic<strong>and</strong> in trees. This makes applyingpesticides around the perimeter ofa building virtually worthless infighting these pests.Over the past decade, theFormosan termite has caused moredamage in New Orleans than hurricanes,floods, <strong>and</strong> tornadoes combined.Infestations affect as manyas 90% of the houses <strong>and</strong> one-thirdof the oak trees in the city. The famousFrench Quarter has one ofthe world’s most concentratedinfestations.Once confined to Louisiana,these termites have invaded at leasta dozen other states, including Alabama,Florida, Mississippi, North<strong>and</strong> South Carolina, Texas, <strong>and</strong>California. They cause at least $1.1billion in damage each year <strong>and</strong> thedamage is increasing.In New Orleans, the U.S. Departmentof Agriculture is using a varietyof techniques in an attempt tocontrol the species in a heavily infested15-block area of the FrenchQuarter. They hope to develop techniquesfor dealing with these invaderselsewhere.One method is to bait the termitesby putting out blocks ofwood to detect their presence. Oncethe termites are found in a block ofwood it is replaced by anotherblock that is baited with a pesticidetoxic to termites. Termites feedingon this wood carry the pesticideback to their nest, where it isspread to other members of thenest.Scientists have also found a cottonymold that can kill 100% of thetermites in contact with it within aweek. They are working on amethod for producing the mold <strong>and</strong>using it as part of the bait approach.Critical ThinkingWhat important ecological roles dotermites play in nature? If the Formosantermite <strong>and</strong> other termitespecies could be eradicated (ahighly unlikely possibility), wouldyou favor doing this? Explain.opment of genetic resistance to pesticides in therapidly multiplying fire ants through natural selection.In other words, we helped wipe out their competitors<strong>and</strong> make them genetically stronger.Researchers at the U.S. Department of Agricultureare experimenting with use of biological controls suchas a tiny parasitic Brazilian fly <strong>and</strong> a pathogen importedfrom South America to reduce fire ant plantations.Tests are underway to see if sending in thesestealth agents will work. But before widespread use ofbiological control agents, researchers must be surethey will not cause problems for native ant species orbecome pests themselves. Fire ants are not all bad.They prey on some other insect pests, including ticks<strong>and</strong> horse fly larvae. Another unplanned for harmfulinvader is the Formosan termite (Case Study, above).Solutions: How Can We Reduce Threatsfrom Nonnative Species? PreventionPaysPrevention is the best way to reduce the threats fromnonnative species because once they have arrived it isdifficult <strong>and</strong> expensive to slow their spread.Once a nonnative species gets established in an ecosystem,its wholesale removal is almost impossible—somewhat like trying to get smoke back into a chimneyor trying to unscramble an egg. Thus the best wayto limit the harmful impacts of nonnative species is toprevent them from being introduced <strong>and</strong> becomingestablished.There are several ways to do this. One is to identifymajor characteristics that allow species to become successfulinvaders <strong>and</strong> the types of ecosystems that arevulnerable to invaders (Figure 12-12, p. 238). Such informationcan be used to screen out potentially harmfulinvaders. In 2003, marine ecologist Kevin Lafferty<strong>and</strong> his colleagues reported that many invading animalspecies gained a competitive advantage in theirnew homes because they leave behind about half oftheir native parasites <strong>and</strong> diseases.We can also inspect imported goods that are likelyto contain invader species. A third strategy is to identifymajor harmful invader species <strong>and</strong> pass internationallaws banning their transfer from one country toanother, as is now done for endangered species.Prevention <strong>and</strong> control can help. But many ofthese invaders are tiny, hard to detect, <strong>and</strong> able tohttp://biology.brookscole.com/miller14237
Characteristics ofSuccessfulInvader Species• High reproductive rate,short generation time(r-selected species)• Pioneer species• Long lived• High dispersal rate• Release growth-inhibitingchemicals into soil• Generalists• High genetic variabilityCharacteristics ofEcosystems Vulnerableto Invader Species• Similar climate to habitatof invader• Absence of predators oninvading species• Early successionalsystems• Low diversity of nativespecies• Absence of fire• Disturbed by humanactivitiesFigure 12-12 Threats to natural capital: some general characteristicsof successful invader species <strong>and</strong> ecosystems vulnerableto invading species.breed rapidly. We also need to remind ourselves thatthe globalization of our economies <strong>and</strong> lifestyles iswhat helps bring these new <strong>and</strong> unwanted biologicalimmigrants into countries throughout the world.Case Study: Exploding Deer Populationsin the United States: Should We Put Bambion Birth Control?In suburban areas we can trap <strong>and</strong> move deer somewhereelse, put them on birth control, sterilize them,or not plant their favorite foods around houses.Arelated problem is the explosion of deer populationsin suburban areas. In this case we are the invaderspecies. Americans have increasingly moved into thewoods habitat of deer <strong>and</strong> provided them with flowers,garden crops, <strong>and</strong> other plants they like to eat.Deer are edge species that like to live in the woodsfor security <strong>and</strong> venture into nearby fields, lawns, orgardens for food. Suburbanization has created an allyou-can-eatedge paradise for deer. The deer also raidnearby farmers’ fields <strong>and</strong> orchards, threaten rareplants <strong>and</strong> animals in some areas, <strong>and</strong> spread Lymedisease (carried by deer ticks) to humans.You may be surprised to learn that deer kill <strong>and</strong>injure more people each year in the United States thanany other wild species. Collisions between deer <strong>and</strong>vehicles occur more than 1.5 million times each year,injure thous<strong>and</strong>s of people, typically kill at least 200people annually, <strong>and</strong> cause more than $1 billion in additionaldamages.There are no easy answers to the deer populationproblem in the suburbs. Increased hunting—by changinghunting rules to allow killing of more female deer(does)—can cut down the overall deer population. Butthis will have little effect on deer living near suburbanareas because it is too dangerous to allow huntingthere. Deer could also be trapped <strong>and</strong> moved somewhereelse, but this is expensive <strong>and</strong> must be repeatedevery few years. And where are we going to take them?Darts loaded with deer contraceptive could befired into does each year to hold down the birth rate.But this is also expensive <strong>and</strong> must be repeated eachyear. One possibility is an experimental single-shotcontraceptive vaccine that causes does to stop producingeggs for several years. Another approach, beingtested by state biologists in Connecticut, is to trapdominant males <strong>and</strong> use chemical injections to sterilizethem. However, both these approaches will requireyears of testing.Meanwhile, if you live in the suburbs, expect deerto chow down on your shrubs, flowers, <strong>and</strong> gardenplants. They have to eat every day like you do. Youmight consider not planting their favorite foodsaround your house.12-5 EXTINCTION THREATS FROMPOACHING AND HUNTINGHow Serious Is the Illegal Taking or Killingof Wild Species? Making Big MoneySome protected species are killed for their valuableparts or are sold live to collectors.Organized crime has moved into illegal wildlife smugglingbecause of the huge profits involved. Smugglingwildlife—including many endangered species—is thethird largest <strong>and</strong> most lucrative illegal cross-bordersmuggling activity after arms <strong>and</strong> drugs. At least twothirdsof all live animals illegally smuggled around theworld die in transit.Poverty is one reason behind the illegal smugglingof wild species. Some poor people struggling tosurvive in areas with rich stores of wildlife kill or trapsuch species to make enough money to survive <strong>and</strong>feed their families. What would you do in the same situation?Others are professional poachers.To poachers, a live mountain gorilla is worth$150,000, a p<strong>and</strong>a pelt $100,000 (only about 1,500 p<strong>and</strong>asare left in the wild), a chimpanzee $50,000, <strong>and</strong> anImperial Amazon macaw $30,000. A rhinoceros horn isworth as much as $28,600 per kilogram ($13,000 perpound) because of its use in dagger h<strong>and</strong>les in theMiddle East <strong>and</strong> as a fever reducer <strong>and</strong> alleged aphrodisiacin China—the world’s largest consumer ofwildlife—<strong>and</strong> other parts of Asia.In 1950, an estimated 100,000 tigers existed in theworld. Despite international protection, today fewerthan 7,500 tigers remain in the wild (about 4,000 in India),mostly because of habitat loss <strong>and</strong> poaching for238 CHAPTER 12 Sustaining Biodiversity: The Species Approach
© Karl Ammann. Biosynergy Institutefur <strong>and</strong> bones. Bengal tigers are at risk because a tigerfur sells for $100,000 in Tokyo. With the body parts of asingle tiger worth $5,000–20,000, it is not surprisingthat illegal hunting has skyrocketed, especially inIndia. Without emergency action, few or no tigers maybe left in the wild within 20 years.As commercially valuable species become endangered,their black market dem<strong>and</strong> soars. This increasestheir chances of premature extinction from poaching.Most poachers are not caught. And the money theycan make far outweighs the small risk of being caught,fined, or imprisoned.Case Study: The Rising Dem<strong>and</strong> for Bushmeatin Africa: Hungry People Trying to SurviveRapid population growth in parts of Africa has increasedthe number of people hunting wild animalsfor food or for sale of their meat to restaurants.Indigenous people in much of West <strong>and</strong> Central Africahave sustainably hunted wildlife for bushmeat as asource of food for centuries. But in the last twodecades the level of hunting for bushmeat in some areashas skyrocketed.In forests throughout West <strong>and</strong> Central Africa virtuallyevery type of wild animal is being hunted by localpeople, frequently illegally, for food or to supplyrestaurants (Figure 12-13). The bushmeat trade isalso increasing in Southeast Asia, the Caribbean, <strong>and</strong>Central <strong>and</strong> South America.Figure 12-13 Bushmeat, such as this gorilla head, is consumedas a source of protein by local people in parts of WestAfrica <strong>and</strong> sold in the national <strong>and</strong> international marketplace.You can find bushmeat on the menu in Cameroon <strong>and</strong> theCongo in West Africa as well as in Paris, France, <strong>and</strong> Brussels,Belgium—often supplied by illegal poaching.Killing wild animals for bushmeat has becomemore widespread for four reasons. First, an eightfoldincrease in Africa’s population during the last centuryhas led more people to survive by hunting wild animals.Second, logging roads have allowed miners,ranchers, <strong>and</strong> settlers to move into once inaccessibleforests. Third, restaurants in many parts of the worldhave begun serving bushmeat dishes. Fourth, manypeople living in poverty find that selling wild animalsor their valuable parts to collectors, meat suppliers, <strong>and</strong>poachers is a way to make enough money to survive.So what is the big deal? After all, people have toeat. And for most of the time our species has beenaround we survived by hunting <strong>and</strong> gathering wildspecies.The problem is that the current depletion of bushmeatspecies in some areas has ecological impacts. Ithas caused the local extinction of many animals in WestAfrica <strong>and</strong> has driven one species—Miss Waldron’s redcolobus monkey—to complete extinction. It is also afactor in greatly reducing gorilla, orangutan, <strong>and</strong> chimpanzeepopulations. For example, wealthy patrons ofsome restaurants regard gorilla meat as a source of status<strong>and</strong> power.It also threatens forest carnivores such as crownedeagles <strong>and</strong> leopards by depleting their main preyspecies. The forest itself is also changed because of thedecrease in seed-dispersing animals.12-6 OTHER EXTINCTIONTHREATSWhat Is the Role of Predator Control? If TheyBother You, Kill ThemKilling predators that bother us or cause economiclosses threatens some species with prematureextinction.People try to exterminate species that compete withthem for food <strong>and</strong> game animals. For example, U.S.fruit farmers exterminated the Carolina parakeetaround 1914 because it fed on fruit crops. The specieswas easy prey because when one member of a flockwas shot, the rest of the birds hovered over its body,making themselves easy targets.African farmers kill large numbers of elephants tokeep them from trampling <strong>and</strong> eating food crops. Eachyear, U.S. government animal control agents shoot,poison, or trap thous<strong>and</strong>s of coyotes, prairie dogs,wolves, bobcats, <strong>and</strong> other species that prey on livestock,on species prized by game hunters, <strong>and</strong> on cropsor fish raised in aquaculture ponds. Since 1929 U.S.ranchers <strong>and</strong> government agencies have poisoned 99%of North America’s prairie dogs because horses <strong>and</strong>cattle sometimes step into the burrows <strong>and</strong> break theirhttp://biology.brookscole.com/miller14239
legs. This has also nearly wiped out the endangeredblack-footed ferret (Figure 12-3; about 600 are left inthe wild), which preyed on the prairie dog. This is anotherexample of unintended consequences because ofnot underst<strong>and</strong>ing the connections between species.What Is the Role of the Market for ExoticPets <strong>and</strong> Decorative Plants? Are We ReallyPet <strong>and</strong> Plant Lovers?Legal <strong>and</strong> illegal trade in wildlife species used as petsor for decorative purposes threatens some specieswith extinction.The global legal <strong>and</strong> illegal trade in wild species foruse as pets is a huge <strong>and</strong> very profitable business.However, for every live animal captured <strong>and</strong> sold inthe pet market, an estimated 50 others are killed.About 25 million U.S. households have exoticbirds as pets, 85% of them imported. More than 60 birdspecies, mostly parrots, are endangered or threatenedbecause of this wild bird trade. According to the U.S.Fish <strong>and</strong> Wildlife Service, collectors of exotic birdsmay pay $10,000 for a threatened hyacinth macawsmuggled out of Brazil; however, during its lifetime asingle macaw left in the wild might yield as much as$165,000 in tourist income. A 1992 study suggestedthat keeping a pet bird indoors for more than 10 yearsdoubles a person’s chances of getting lung cancer frominhaling tiny particles of bird d<strong>and</strong>er.Other wild species whose populations are depletedbecause of the pet trade include amphibians,reptiles, mammals, <strong>and</strong> tropical fish (taken mostlyfrom the coral reefs of Indonesia <strong>and</strong> the Philippines).Divers commonly catch tropical fish by using plasticsqueeze bottles of cyanide to stun them. For each fishcaught alive, many more die. In addition, the cyanidesolution kills the coral animals that create the reef,which is a center for marine biodiversity.Things do not have to be this way. Pilai Poonswaddecided to do something about poachers taking hornbills—large,beautiful, <strong>and</strong> rare birds—from a rainforest in Thail<strong>and</strong>. She visited the poachers in their villages<strong>and</strong> showed them why the birds are worth morealive than dead. Now she has a number of ex-poachersearning much more money than they did before bytaking eco-tourists into the forest to see these magnificentbirds. Because of their vested financial interest inpreserving the hornbills, they also help protect themfrom poachers.Some exotic plants, especially orchids <strong>and</strong> cacti,are endangered because they are gathered (often illegally)<strong>and</strong> sold to collectors to decorate houses, offices,<strong>and</strong> l<strong>and</strong>scapes. The United States imports about 75%of all orchids <strong>and</strong> 99% of all live cacti sold each year. Acollector may pay $5,000 for a single rare orchid, <strong>and</strong> asingle rare mature crested saguaro cactus can earn cactusrustlers as much as $15,000.In other words, collecting exotic pets <strong>and</strong> plantskills large numbers of them <strong>and</strong> endangers many ofthese species <strong>and</strong> others that depend on them. Aresuch collectors lovers or haters of the species they collect?Should we leave most exotic species in the wild?What Are the Roles of Climate Change<strong>and</strong> Pollution? Speeding Up the Treadmill<strong>and</strong> Poisoning SpeciesProjected climate change <strong>and</strong> exposure to pollutantssuch as pesticides can threaten some species withpremature extinction.Most natural climate changes in the past have takenplace over long periods of time. This gave speciesmore time to adapt or evolve into new species to cope.But considerable evidence indicates that human activitiessuch as greenhouse gas emissions <strong>and</strong> deforestationmay bring about rapid climate change during thiscentury. This could change the habitats many species<strong>and</strong> accelerate extinction of some species.According to a 2000 study by the World WildlifeFund, global warming could increase extinction by alteringone-third of the world’s wildlife habitats by2100. This includes 70% of the habitat in high-altitudearctic <strong>and</strong> boreal biomes. Ten of the world’s 17 penguinspecies are endangered or threatened mostly becauseof higher temperatures in their polar habitats.Another problem is that some species may not haveenough time to adapt or migrate to areas with more favorableclimates.Pollution threatens populations <strong>and</strong> species in anumber of ways. A major extinction threat is from theunintended effects of pesticides. According to the U.S.Fish <strong>and</strong> Wildlife Service, each year in the United States,pesticides kill about one-fifth of the country’s beneficialhoneybee colonies, more than 67 million birds, <strong>and</strong> 6–14million fish. They also threaten about one-fifth of thecountry’s endangered <strong>and</strong> threatened species.12-7 PROTECTING WILD SPECIES: THERESEARCH AND LEGAL APPROACHHow Can International Treaties Help ProtectEndangered Species? Some SuccessInternational treaties have helped reduce theinternational trade of endangered <strong>and</strong> threatenedspecies, but enforcement is difficult.Several international treaties <strong>and</strong> conventions helpprotect endangered or threatened wild species. One ofthe most far-reaching is the 1975 Convention on Interna-240 CHAPTER 12 Sustaining Biodiversity: The Species Approach
tional Trade in Endangered Species (CITES). This treaty,now signed by 160 countries, lists some 900 speciesthat cannot be commercially traded as live specimensor wildlife products because they are in danger of extinction.The treaty also restricts international trade of29,000 other species because they are at risk of becomingthreatened.CITES has helped reduce international trade inmany threatened animals, including elephants, crocodiles,<strong>and</strong> chimpanzees. However, the effects of thistreaty are limited because enforcement is difficult <strong>and</strong>varies from country to country, <strong>and</strong> convicted violatorsoften pay only small fines. Also, member countriescan exempt themselves from protecting any listedspecies. And much of the highly profitable illegal tradein wildlife <strong>and</strong> wildlife products goes on in countriesthat have not signed the treaty.The Convention on Biological Diversity (CBD), ratifiedby 186 countries, legally binds signatory governmentsto reversing the global decline of biologicaldiversity. The treaty requires each signatory nation toinventory its biodiversity <strong>and</strong> develop a national conservationstrategy—a detailed plan for managing <strong>and</strong>preserving its biodiversity.Implementing this treaty has been slow becausesome key countries such as the United States have notratified it. Also, it has no severe penalties or other enforcementmechanisms.How Can National Laws Help ProtectEndangered Species? A Tough <strong>and</strong>Controversial Act in the United StatesOne of the world’s most far-reaching <strong>and</strong> controversialenvironmental laws is the U.S. EndangeredSpecies Act passed in 1973.The United States controls imports <strong>and</strong> exports of endangeredwildlife <strong>and</strong> wildlife products through twolaws. One is the Lacey Act of 1900. It prohibits transportinglive or dead wild animals or their parts acrossstate borders without a federal permit.The other is the Endangered Species Act of 1973(ESA), which was amended in 1982, 1985, <strong>and</strong> 1988. Itwas designed to identify <strong>and</strong> legally protect endangeredspecies in the United States <strong>and</strong> abroad. This actis probably the most far-reaching environmental lawever adopted by any nation, which has made it controversial.Canada <strong>and</strong> a number of other countries havesimilar laws.The National Marine Fisheries Service (NMFS) isresponsible for identifying <strong>and</strong> listing endangered <strong>and</strong>threatened ocean species, <strong>and</strong> the U.S. Fish <strong>and</strong>Wildlife Services (USFWS) identifies <strong>and</strong> lists all otherendangered <strong>and</strong> threatened species. Any decision byeither agency to add or remove a species from the listmust be based on biological factors alone, without considerationof economic or political factors.The act also forbids federal agencies to carry out,fund, or authorize projects that would jeopardize anendangered or threatened species or destroy or modifythe critical habitat it needs to survive. However, in2003 Congress exempted the Defense Departmentfrom this requirement <strong>and</strong> from the Marine MammalProtection Act.On private l<strong>and</strong>s, fines up to $100,000 <strong>and</strong> oneyearimprisonment can be imposed to ensure protectionof the habitats of endangered species. This part ofthe act has been controversial because many of thelisted species live totally or partially on private l<strong>and</strong>.The act also makes it illegal for Americans to sellor buy any product made from an endangered orthreatened species. These species cannot be hunted,killed, collected, or injured in the United States, <strong>and</strong>this protection has been extended to threatened <strong>and</strong>endangered foreign species.In 2003, however, the Bush administration proposedeliminating protection of foreign species, causingan uproar by conservationists. With this rule change,American hunters, circuses, <strong>and</strong> the pet industry couldpay individuals or governments to kill, capture, <strong>and</strong>import animals that are on the brink of extinction inother countries.xHOW WOULD YOU VOTE? Should the U.S. EndangeredSpecies Act no longer protect threatened <strong>and</strong> endangeredspecies in other countries? Cast your vote online athttp://biology.brookscole.com/miller14.Between 1973 <strong>and</strong> 2004, the number of U.S.species on the official endangered <strong>and</strong> threatened listincreased from 92 to about 1,260 species—60% of themplants <strong>and</strong> 40% animals. According to a 2000 study bythe Nature Conservancy, about one-third of the country’sspecies are at risk of extinction, <strong>and</strong> 15% of allspecies are at high risk. This amounts to about 30,000species, compared to the 1,260 species currently protectedunder the ESA. The study also found that manyof the country’s rarest <strong>and</strong> most imperiled species areconcentrated in a few hot spots (Figure 12-14, p. 242).What Are Critical Habitat Designations<strong>and</strong> Recovery Plans? How to RebuildPopulationsThe Endangered Species Act requires protecting thecritical habitat <strong>and</strong> developing a recovery plan foreach listed species, but lack of funding <strong>and</strong> politicalopposition hinder these efforts.The ESA generally requires the secretary of the interiorto designate <strong>and</strong> protect the critical habitat needed forhttp://biology.brookscole.com/miller14241
Top Six Hot Spots1 Hawaii2 San Francisco Bay area3 Southern Appalachians4 Death Valley5 Southern California6 Florida Panh<strong>and</strong>le25436Concentration of rare species1LowModerateHighFigure 12-14 Threatened natural capital: biodiversity hot spots in the United States. This map shows areasthat contain the largest concentrations of rare <strong>and</strong> potentially endangered species. (Data from State NaturalHeritage Programs, the Nature Conservancy, <strong>and</strong> Association for Biodiversity Information)the survival <strong>and</strong> recovery of each listed species. So farcritical habitats have been established for only aboutone-third of the species on the ESA list, mostly becauseof political pressure <strong>and</strong> a lack of funds. Beginning in2001 the Bush administration stopped listing newspecies <strong>and</strong> designating critical habitat for listedspecies unless required by court order.Getting listed is only half the battle. Next, theUSFWS or the NMFS is supposed to prepare a plan tohelp the species recover. By 2004, final recovery planshad been developed <strong>and</strong> approved for 79% of the listedendangered or threatened species in the United States.Examples of successful recovery plans include thosefor the American alligator, the gray wolf, the bald eagle,<strong>and</strong> the peregrine falcon. Bad news. About half ofcurrent recovery plans exist only on paper, mostly becauseof political opposition <strong>and</strong> limited funds.Should the Government CompensateL<strong>and</strong>owners When Endangered SpeciesDecrease the Economic Value of <strong>Their</strong> L<strong>and</strong>?Private Versus Public Property RightsThere is controversy over whether the governmentshould compensate private property owners whosuffer financial losses when it restricts how they canuse their l<strong>and</strong> because of the presence of threatenedor endangered species.Critical habitats for more than half of the listed endangered<strong>and</strong> threatened species in the United States arefound on private l<strong>and</strong>. One controversy over the ESAis the political <strong>and</strong> legal issue of whether federal <strong>and</strong>state governments must compensate private propertyowners when government laws or regulations limithow the owners can use their property <strong>and</strong> decreaseits financial value. Many people who own l<strong>and</strong> onwhich threatened or endangered species live think thelaw goes too far <strong>and</strong> infringes on their property rights.The Fifth Amendment of the U.S. Constitutiongives the government the power, known as eminent domain,to force a citizen to sell property needed for apublic good. For example, suppose the governmentneeds some or all of l<strong>and</strong> you own for a road. It canlegally take your l<strong>and</strong> but must reimburse you basedon the l<strong>and</strong>’s fair market value.The current controversy is over whether the Constitutionrequires the government to compensate youif instead of taking your property (a physical taking) itreduces its value by not allowing you to do certainthings with it (a regulatory taking). For example, youmight not be allowed to build on some or all of yourproperty or to harvest trees from your l<strong>and</strong> becausethese areas are habitats for an endangered species.This can decrease the value of one’s property. Forexample, a property owner in Travis, Texas, saw herl<strong>and</strong> decrease in value from $830,000 to $38,000 becauseit contained two endangered bird species: theblack-capped vireo <strong>and</strong> the golden-cheeked warbler.Should she be compensated for this loss by the federalgovernment?242 CHAPTER 12 Sustaining Biodiversity: The Species Approach
Most people would say yes. The problem is thatrequiring government compensation for regulatorytakings would cost so much that it could cripple thefinancial ability of state <strong>and</strong> federal governments toprotect the public good by enforcing existing or futureenvironmental, l<strong>and</strong>-use, health, <strong>and</strong> safety laws. Thehigh costs involved could also hinder passage of anynew environmental l<strong>and</strong>-use, environmental, health,<strong>and</strong> safety laws because of lack of funds to compensatecitizens <strong>and</strong> businesses. Some anti-environmentalists<strong>and</strong> elected officials opposed to the ESA push for requiringcompensation for regulatory takings as a wayto weaken or gut the ESA.The controversy over regulatory takings is a continuationof the long-st<strong>and</strong>ing conflict over two typesof freedoms: the right to be protected by law from thedamaging actions of others <strong>and</strong> the right to do as onepleases without undue government interference.Achieving a balance between these conflicting types ofindividual rights is a difficult problem that governmentshave been wrestling with for centuries.How Can We Encourage Private L<strong>and</strong>ownersto Protect Endangered Species? Trying to FindWin-Win CompromisesCongress has amended the Endangered Species Actto help l<strong>and</strong>owners protect endangered species ontheir l<strong>and</strong>.The ESA has encouraged some developers, timbercompanies, <strong>and</strong> other private l<strong>and</strong>owners to avoidgovernment regulation <strong>and</strong> possible loss of economicvalue by managing their l<strong>and</strong> to reduce its use by endangeredspecies. The National Association for Homebuilders,for example, has published practical tips fordevelopers <strong>and</strong> other l<strong>and</strong>owners to avoid ESA issues.Suggestions include planting crops, plowing fields betweencrops to prevent native vegetation <strong>and</strong> endangeredspecies from occupying the fields, clearingforests, <strong>and</strong> burning or managing vegetation to makeit unsuitable for local endangered species. Somel<strong>and</strong>owners who discover small populations of endangeredanimals may also be tempted to use the “shoot,shovel, <strong>and</strong> shut up” solution.Congress changed the ESA in several ways to helpdeal with these <strong>and</strong> other problems associated with theregulatory takings issue. In 1982, Congress amendedthe ESA to allow the secretary of the interior to usehabitat conservation plans (HCPs). They are designed tostrike a compromise between the interests of privatel<strong>and</strong>owners <strong>and</strong> those of endangered <strong>and</strong> threatenedspecies.With an HCP, l<strong>and</strong>owners, developers, or loggersare allowed to destroy some critical habitat or kill allor part of an endangered or threatened species populationon private l<strong>and</strong> in exchange for taking steps toprotect that species. Such measures might include settingaside a part of the species’ habitat as a protectedarea, protecting critical nesting sites, maintainingtravel corridors for the species involved, paying to relocatethe species to another suitable habitat, removingcompetitors <strong>and</strong> predators, or paying money to havethe government buy suitable habitat elsewhere.Once the plan is approved it cannot be changed,even if new data show that the plan cannot protect aspecies <strong>and</strong> help it recover. By 2004, some 400 HCPshad been developed.Some wildlife conservationists support this approachbecause it can help head off use of evasive techniques<strong>and</strong> reduce political pressure to weaken or eliminatethe ESA. However, there are two major criticismsof HCPs. One is that many of them have been approvedwithout enough scientific evaluation of their effects ona species’ recovery. Another problem is that manyplans are political compromises that do not protect thespecies or make inadequate provisions for its recovery.In 1999, the USFWS approved two new approachesfor encouraging private l<strong>and</strong>owners to protect threatenedor endangered species. One is safe harbor agreementsin which l<strong>and</strong>owners voluntarily agree to takespecified steps to restore, improve, or maintain habitatfor threatened or endangered species located on theirl<strong>and</strong>. In return, l<strong>and</strong>owners get technical help. Theyalso receive government assurances that the natural resourcesinvolved will not face future restrictions oncethe agreement is over, <strong>and</strong> that after the agreement hasexpired l<strong>and</strong>owners can return the property to its originalcondition without penalty.Another method is the use of voluntary c<strong>and</strong>idateconservation agreements in which l<strong>and</strong>owners agree totake specific steps to help conserve a species whosepopulation is declining but is not yet listed as endangeredor threatened. Participating l<strong>and</strong>owners receivetechnical help <strong>and</strong> assurances that no additional resource-userestrictions will be imposed on the l<strong>and</strong>covered by the agreement if the species is listed as endangeredor threatened in the future.Should the Endangered Species Act BeWeakened? One Side of the StorySome believe that the Endangered Species Actshould be weakened or repealed because it has beena failure, tramples on private property rights, <strong>and</strong>hinders economic development of private l<strong>and</strong>.Since 1992 Congress has been debating the reauthorizationof the ESA with proposals ranging from eliminatingthe act, to weakening it, to strengthening it.The strongest opposition to the act is in the westernUnited States where most public l<strong>and</strong>s are located.Many westerners view the federal regulatory agenciesmanaging these public l<strong>and</strong>s as an enemy that wantshttp://biology.brookscole.com/miller14243
to take away private property rights <strong>and</strong> restrict industriesfrom having access to rich biological <strong>and</strong> mineralresources found on public l<strong>and</strong>s. Many of these peoplebelieve that the ESA puts the rights <strong>and</strong> welfare of endangeredplants <strong>and</strong> animals above those of people.Many opponents of the ESA also contend that ithas not worked <strong>and</strong> has caused severe economic lossesby hindering development on private l<strong>and</strong> that containsendangered or threatened species. Since 1995, effortsto weaken the ESA have included the followingsuggested changes:■ Make protection of endangered species on privatel<strong>and</strong> voluntary.■ Have the government compensate l<strong>and</strong>owners if itforces them to stop using part of their l<strong>and</strong> to protectendangered species (the regulatory takings issue).■ Make it harder <strong>and</strong> more expensive to list newlyendangered species by requiring government wildlifeofficials to navigate through a series of hearings <strong>and</strong>peer review panels.■ Eliminate the need to designate critical habitats becausedeveloping <strong>and</strong> implementing a recovery planis more important. And designating critical habitats isa lengthy, complex, <strong>and</strong> costly process that delays developmentof recovery plans. Also, dealing with lawsuitsfor failure to develop critical habitats takes upmost of the limited funds for carrying out the ESA.■ Allow the secretary of the interior to permit a listedspecies to become extinct <strong>and</strong> to determine whether aspecies should be listed.■ Allow the secretary of the interior to give any state,county, or l<strong>and</strong>owner permanent exemption from thelaw.Other critics want do away with the ESA entirely.But since this is politically unpopular with the Americanpublic, most efforts are designed to weaken the act<strong>and</strong> reduce its already meager funding.Should the Endangered Species ActBe Strengthened? The Other Sideof the StoryAccording to most conservation biologists, theEndangered Species Act should be strengthened<strong>and</strong> modified to develop a new system to protect<strong>and</strong> sustain the country’s biodiversity.Most conservation biologists <strong>and</strong> wildlife scientistsagree that the ESA has some deficiencies <strong>and</strong> needs tobe simplified <strong>and</strong> streamlined. But they contend thatthe ESA has not been a failure (see Case Study, below).They also contest the charge that the ESA hascaused severe economic losses. Government recordsshow that since 1979 only about 0.05% of the almost200,000 projects evaluated by the USFWS have beenblocked or canceled as a result of the ESA. In addition,What Has the Endangered Species Act Accomplished?Critics of the ESAcall it an expensivefailure becauseonly 37 speciesCASE STUDY have been removedfrom theendangered list. Fourteen of thesespecies recovered, 8 became extinct,<strong>and</strong> the rest were removed because oftechnical errors or discovery of newpopulations.Most biologists agree that the actneeds strengthening <strong>and</strong> modification.But they disagree that the acthas been a failure, for four reasons.First, species are listed onlywhen they are in serious danger ofextinction. This is like setting up apoorly funded hospital emergencyroom that takes only the most desperatecases, often with little hopefor recovery, <strong>and</strong> saying it should beshut down because it has not savedenough patients.Second, it takes decades for mostspecies to become endangered orthreatened. Thus it usually takesdecades to bring a species in criticalcondition back to the point where itcan be removed from the list. Expectingthe ESA—which has beenin existence only since 1973—toquickly repair the biological depletionof many decades is unrealistic.Third, the most important measureof the law’s success is that thecondition of almost 40% of the listedspecies is stable or improving. A hospitalemergency room taking onlythe most desperate cases <strong>and</strong> thenstabilizing or improving the conditionof 40% of its patients would beconsidered an astounding success!Fourth, the federal endangeredspecies budget was only $58 millionin 2005—about what the Departmentof Defense spends in a littlemore than an hour or 20¢ a year perU.S. citizen. To supporters of theESA, it is amazing that so much hasbeen accomplished in stabilizing orimproving the condition of almost40% of the listed species on a shoestringbudget.Yes, the act can be improved <strong>and</strong>federal regulators have sometimesbeen too heavy-h<strong>and</strong>ed in enforcingit. But instead of gutting or doingaway with this important act, biologistscall for it to be strengthened<strong>and</strong> modified to help protectecosystems <strong>and</strong> the nation’s overallbiodiversity.Some critics say that only 20% ofthe endangered species are stable orimproving. If correct, this is still anincredible bargain.Critical ThinkingShould the budget for the EndangeredSpecies Act be drastically increased?Explain.244 CHAPTER 12 Sustaining Biodiversity: The Species Approach
the act allows for economic concerns. By law, a decisionto list a species must be based solely on science. Butonce a species is listed, economic considerations can beweighed against species protection in protecting criticalhabitat <strong>and</strong> designing <strong>and</strong> implementing recoveryplans. Also, private l<strong>and</strong>s designated as critical habitatsare not affected by the ESA unless the l<strong>and</strong>ownerplans an action that requires a federal permit.Furthermore, the act authorizes a special cabinetlevelpanel, nicknamed the “God Squad,” to exemptany federal project from having to comply with the actif the economic costs are too high.Finally, the act allows the government to issue permits<strong>and</strong> exemptions to l<strong>and</strong>owners with listed speciesliving on their property <strong>and</strong> use habitat conservationplans, safe harbor agreements, <strong>and</strong> c<strong>and</strong>idate conservationagreements to bargain with private l<strong>and</strong>owners.A study by the U.S. National Academy of Sciencesrecommended three major changes to make the ESAmore scientifically sound <strong>and</strong> effective.■ Greatly increase the meager funding for implementingthe act.■ Develop recovery plans more quickly.■ When a species is first listed, establish a core of itssurvival habitat as a temporary emergency measurethat could support the species for 25–50 years.Some suggest concentrating limited ESA funds onprotecting species that have the best chances of surviving<strong>and</strong> that play important ecological <strong>and</strong> economicroles. Some say this is unethical because all speciesshould have a right to exist. But proponents argue thatbecause of limited funding we are already decidingwhich species to save <strong>and</strong> that this is a better use oflimited funds. What do you think?Most biologists <strong>and</strong> wildlife conservationists believethe United States should modify the act to emphasizeprotecting <strong>and</strong> sustaining biological diversity<strong>and</strong> ecological functioning rather than attempting tosave individual species. This new ecosystems approachwould follow three principles:■ Find out what species <strong>and</strong> ecosystems the countryhas.■ Locate <strong>and</strong> protect the most endangered ecosystems<strong>and</strong> species within such systems.■ Put more emphasis on preventing species frombecoming threatened <strong>and</strong> ecosystems from becomingdegraded.■ Provide private l<strong>and</strong>owners who agree to help protectendangered ecosystems with significant financialincentives (tax breaks, write-offs) <strong>and</strong> technical help.xHOW WOULD YOU VOTE? Should the Endangered SpeciesAct be modified to protect the nation’s overall biodiversity?Cast your vote online at http://biology.brookscole.com/miller14.12-8 PROTECTING WILD SPECIES:THE SANCTUARY APPROACHWhat Is the Role of Wildlife Refuges <strong>and</strong>Other Protected Areas? Protect the Homesof Species in TroubleThe United States has set aside 542 federal refugesfor wildlife, but many refuges are suffering fromenvironmental degradation.In 1903, President Theodore Roosevelt established thefirst U.S. federal wildlife refuge at Pelican Isl<strong>and</strong>,Florida. Since then the National Wildlife RefugeSystem has grown to 542 refuges. Since 1995 visits tonational parks have leveled off while those to wildliferefuges have almost doubled. More than 35 millionAmericans visit these refuges each year to hunt, fish,hike, or watch birds <strong>and</strong> other wildlife.More than three-fourths of the refuges are concentratedalong major bird migration corridors or flyways(Figure 12-15, p. 246). They serve as vital wetl<strong>and</strong> sanctuariesfor protecting millions of migratory waterfowlas they journey north <strong>and</strong> south each year to find food,suitable climate, <strong>and</strong> other conditions necessary forreproduction.About one-fifth of U.S. endangered <strong>and</strong> threatenedspecies have habitats in the refuge system, <strong>and</strong>some refuges have been set aside for specific endangeredspecies. These have helped Florida’s key deer,the brown pelican, <strong>and</strong> the trumpeter swan to recover.Conservation biologists call for setting aside morerefuges to help protect endangered plants. They alsourge Congress <strong>and</strong> state legislatures to allow ab<strong>and</strong>onedmilitary l<strong>and</strong>s that contain significant wildlifehabitat to become national or state wildlife refuges.Bad news. According to a General Accounting Officestudy, activities considered harmful to wildlife occurin nearly 60% of the nation’s wildlife refuges. A2002 study by the National Wildlife Refuge Associationfound that invasions by nonnative species arewreaking havoc on many of the nation’s wildliferefuges. Also, too much hunting <strong>and</strong> fishing <strong>and</strong> use ofpowerboats <strong>and</strong> off-road vehicles can take their toll onwildlife populations in heavily used refuges.Can Gene Banks, Botanical Gardens,<strong>and</strong> Farms Help Save Most EndangeredPlant Species? Important but LimitedSolutionsEstablishing gene banks <strong>and</strong> botanical gardens<strong>and</strong> using farms to raise threatened species can helpprotect species from extinction, but these options lackfunding <strong>and</strong> storage space.Gene or seed banks preserve genetic information <strong>and</strong> endangeredplant species by storing their seeds in refrigerated,low-humidity environments. The world’s morehttp://biology.brookscole.com/miller14245
North American–SouthAmerican flywaysEuropean–AfricanflywaysAsian flywaysFigure 12-15 Natural capital: major flyways used by migratory birds, mostly waterfowl. Each route has anumber of subroutes. Some countries along such flyways have entered into agreements <strong>and</strong> treaties to protectcrucial habitats, especially wetl<strong>and</strong>s, needed by such species, both along their migration routes <strong>and</strong> at eachend of their journeys.than 100 seed banks have focused on storing seeds ofthe approximately 100 plant species that provide uswith food—with just 14 plants providing about 90% ofthe calories in our food. Some banks are beginning tostore seeds for a wider range of species that may bethreatened with extinction or a loss of genetic diversity.Scientists urge the establishment of many moresuch banks, especially in developing countries.But seed banks are expensive to operate <strong>and</strong> canbe destroyed by accidents. Also, because stored seedsdo not evolve, they may not survive when used in thefuture.The world’s 1,600 botanical gardens <strong>and</strong> arboretumscontain living plants, representing almost one-third ofthe world’s known plant species. However, they containonly about 3% of the world’s rare <strong>and</strong> threatenedplant species.Botanical gardens also help educate an estimated150 million visitors a year about the need for plantconservation. But these sanctuaries have too little storagecapacity <strong>and</strong> too little funding to preserve most ofthe world’s rare <strong>and</strong> threatened plants.We can take pressure off some endangered orthreatened species by raising them on farms for commercialsale. One example is the use of farms inFlorida to raise alligators for meat <strong>and</strong> hides. Anotherexample is butterfly farms in Papua New Guinea, wheremany butterfly species are threatened by habitat destruction<strong>and</strong> fragmentation, commercial overexploitation,<strong>and</strong> environmental degradation.Can Zoos <strong>and</strong> Aquariums Help Protect MostEndangered Animal Species? Important butExpensive <strong>and</strong> LimitedZoos <strong>and</strong> aquariums can help protect endangeredanimal species, but lack funding <strong>and</strong> storage space.Zoos, aquariums, game parks, <strong>and</strong> animal researchcenters are being used to preserve some individuals ofcritically endangered animal species, with the longtermgoal of reintroducing the species into protectedwild habitats. Two techniques for preserving endangeredterrestrial species are egg pulling <strong>and</strong> captivebreeding. Egg pulling involves collecting wild eggs laidby critically endangered bird species <strong>and</strong> then hatchingthem in zoos or research centers. In captive breeding,some or all of the wild individuals of a critically endangeredspecies are captured for breeding in captiv-246 CHAPTER 12 Sustaining Biodiversity: The Species Approach
ity, with the aim of reintroducing the offspring into thewild.Other techniques for increasing the populations ofcaptive species include artificial insemination, surgicalimplantation of eggs of one species into a surrogatemother of another species (embryo transfer), use of incubators,<strong>and</strong> cross-fostering (in which the young of arare species are raised by parents of a similar species).Scientists also use computer databases of the familylineages of species in zoos <strong>and</strong> DNA analysis to matchindividuals for mating—a computer dating service forzoo animals—<strong>and</strong> to prevent genetic erosion throughinbreeding.Proponents urge zoos <strong>and</strong> wildlife managers tocollect <strong>and</strong> freeze cells of endangered species for possiblecloning. They believe that such miniature frozenzoos could play a role in bringing back depletedspecies in the future.The ultimate goal of captive breeding programs isto build up populations to a level where they can bereintroduced into the wild. However, before conservationbiologists attempt a reintroduction they study thefactors that originally caused the species to become endangered,whether these factors still exist, <strong>and</strong> whetherthere is enough suitable habitat available.After more than two decades of captive breedingefforts, only a h<strong>and</strong>ful of endangered species havebeen returned to the wild. Examples shown in Figure12-3 include the black-footed ferret, California condor,Arabian oryx, <strong>and</strong> golden lion tamarin. Most reintroductionsfail because of lack of suitable habitat,inability of individuals bred in captivity to survive inthe wild, or renewed overhunting or capture of somereturned species.Lack of space <strong>and</strong> money limits efforts to maintainpopulations of endangered animal species in zoos <strong>and</strong>research centers. The captive population of each speciesmust number 100–500 individuals to avoid extinctionthrough accident, disease, or loss of genetic diversitythrough inbreeding. Recent genetic research indicatesthat 10,000 or more individuals are needed for an endangeredspecies to maintain its capacity for biologicalevolution.According to one estimate, using all the space inthe 201 accredited U.S. zoos for captive breeding couldsustain only about 100 large animal species on a longtermbasis. Thus the major conservation role of zooswill be to help educate the public about the ecologicalimportance of the species they display <strong>and</strong> the need toprotect habitat.Public aquariums that exhibit unusual <strong>and</strong> attractivefish <strong>and</strong> some marine animals such as seals <strong>and</strong>dolphins also help educate the public about the needto protect such species. In the United States, more than35 million people visit aquariums each year. However,public aquariums have not served as effective genebanks for endangered marine species, especially marinemammals that need large volumes of water.Instead of seeing zoos <strong>and</strong> aquariums as sanctuaries,some critics see most of them as prisons for oncewild animals. They also contend that zoos <strong>and</strong> aquariumsfoster the false notion that we do not need to preservelarge numbers of wild species in their naturalhabitats.Some people criticize zoos <strong>and</strong> aquariums forputting on shows with animals wearing clothes, ridingbicycles, or performing tricks. They see this as fosteringthe idea that the animals are there primarily to entertainus by doing things people do <strong>and</strong> in the processraising money for their keepers.Conservation biologists point out that zoos,aquariums, <strong>and</strong> botanical gardens, regardless of theirbenefits <strong>and</strong> drawbacks, are not biologically or economicallyfeasible solutions for most of the world’scurrent endangered species <strong>and</strong> the much larger numberexpected over the next few decades.12-9 RECONCILIATIONECOLOGYWhat Is Reconciliation Ecology? RethinkingConservation StrategyReconciliation ecology involves finding ways to sharethe places we dominate with other species.In 2003, ecologist Michael L. Rosenzweig wrote thebook Win-Win Ecology: How Earth’s Species Can Survivein the Midst of Human Enterprise (Oxford UniversityPress). He strongly supports the eight-point programof Edward O. Wilson to help save the earth’s naturalhabitats by establishing <strong>and</strong> protecting nature reserves(p. 221). He also supports the species protection strategiesdiscussed in this chapter.But he contends that in the long run these approacheswill fail for two reasons. One is that currentreserves are devoted to saving only about 7% of nature.To Rosenzweig the real challenge is to help sustain wildspecies in the human-dominated portion of nature thatmakes up 93% of the planetary ecological “cake”The other problem is that setting aside funds <strong>and</strong>refuges <strong>and</strong> passing laws to protect endangered <strong>and</strong>threatened species are essentially desperate attempts tosave species that are in deep trouble. This can help a fewspecies, but the real challenge is learning how to keepspecies from getting to such a point in the first place.Rosenzweig suggests that we develop a new formof conservation biology called reconciliation ecology.It is the science of inventing, establishing, <strong>and</strong> maintainingnew habitats to conserve species diversity inhttp://biology.brookscole.com/miller14247
places where people live, work, or play. In otherwords, we need to learn how to share the spaces wedominate with other species.How Can We Implement ReconciliationEcology? Observe, Be Creative, <strong>and</strong> Cooperatewith Your NeighborsSome people are finding creative ways to practice reconciliationecology in their neighborhoods <strong>and</strong> cities.Practicing reconciliation ecology begins by looking atthe habitats we prefer. Given a choice, most peopleprefer a grassy <strong>and</strong> fairly open habitat with a few scatteredtrees. We also like water <strong>and</strong> prefer to live near astream, lake, river, or ocean. We also love flowers.The problem is that most species do not like whatwe like or cannot survive in the habitats we prefer. Nowonder so few of them live with us.So what do we do? Reconciliation ecology goesbeyond efforts to attract birds to backyards. For example,providing a self-sustaining habitat for a butterflyspecies may require 20 or so neighbors to b<strong>and</strong> together.Doing this for an insect-eating bat speciescould help keep down mosquitoes <strong>and</strong> other pesky insectsin a neighborhood.The safe harbor agreements <strong>and</strong> voluntary c<strong>and</strong>idateconservation agreements that are part of theEndangered Species Act are examples of reconciliationecology in action. They reward responsible stewardshipby private l<strong>and</strong>owners who take voluntary actionsto help protect endangered or threatened speciesor species that may soon become threatened. For example,people have worked together to help preservebluebirds within human dominated habitats (CaseStudy, below).Another form of restoration ecology involves replacingsome monoculture yards in neighborhoodswith diverse yards using plant species adapted to localclimates that are selected to attract certain species. Thiswould make neighborhoods more biologically diverse<strong>and</strong> interesting, keep down insect pests, <strong>and</strong> requireless use of noisy <strong>and</strong> polluting lawnmowers.Communities could have contests <strong>and</strong> awards forpeople designing the most biodiverse <strong>and</strong> speciesfriendlyyards <strong>and</strong> gardens. Signs could describe thetype of ecosystem being mimicked <strong>and</strong> the species beingprotected as a way to educate <strong>and</strong> encourage experimentsby other people.In Berlin, Germany, people have planted gardenson many large rooftops. These can be designed to supporta variety of species by varying the depth <strong>and</strong> typeof soil <strong>and</strong> their exposure to sun. Such roofs also saveenergy by providing insulation, help cool cities, <strong>and</strong>conserve water by reducing evapotranspiration. Reconciliationecology proponents call for a global campaignto use the roofs of the world to help sustain biodiversity.San Francisco’s Golden Gate Park is a 410-hectare(1,012-acre) oasis of gardens <strong>and</strong> trees in the midst of alarge city. It is a good example of reconciliation ecologybecause it was designed <strong>and</strong> planted by humanswho transformed it from a system of s<strong>and</strong> dunes.Using Reconciliation Ecology to Protect Bluebirds?Let me tell you astory about bluebirds.Bad news.Populations ofCASE STUDY bluebirds in muchof the easternUnited States are decliningThere are two reasons. One isthat these birds nest in tree holes ofa certain size. Dead <strong>and</strong> dying treesonce provided plenty of these holes.But today timber companies oftencut down all of the trees, <strong>and</strong> homeownersmanicure their property byremoving dead <strong>and</strong> dying trees.A second reason is that two aggressive,abundant, <strong>and</strong> nonnativebird species—starlings <strong>and</strong> housesparrows—also like to nest in treeholes <strong>and</strong> take them away frombluebirds. To make matters worse,starlings eat the blueberries thebluebirds need to survive duringthe winter.Good news. People have come upwith a creative way to help save thebluebird. They have designed nestboxes with holes large enough toaccommodate bluebirds but toosmall for starlings. They also foundthat house sparrows like shallowboxes, so they made the bluebirdboxes deep enough to make themunattractive nesting sites for thesparrows.In 1979, the North AmericanBluebird Society was founded tospread the word <strong>and</strong> encouragepeople to use bluebird boxes ontheir property <strong>and</strong> to keep housecats away from nesting bluebirds.Now bluebird numbers are buildingback up.Properly designed nest boxes arealso being used to boost the populationof red-cockaded woodpeckerson Florida’s Elgin Air Force Base.Nest boxes in swampl<strong>and</strong>s havedone the same thing for America’swood ducks.Restoration ecology works! Perhapsyou might want to consider acareer in this exciting new field.Critical ThinkingSee if you can come up with a reconciliationproject to help protectthreatened bird or other species inyour neighborhood or on thegrounds of your school.248 CHAPTER 12 Sustaining Biodiversity: The Species Approach
The Department of Defense controls large areas ofl<strong>and</strong> in the United States. Rosenzweig <strong>and</strong> other reconciliationecologists believe that some of this l<strong>and</strong> couldserve as laboratories for developing <strong>and</strong> testing reconciliationecology ideas.Some college campuses <strong>and</strong> schools might alsoserve as reconciliation ecology laboratories. Howabout your campus or school?In this chapter, we have seen that protecting theterrestrial species that make up part of the earth’s biodiversityfrom premature extinction is a difficult, controversial,<strong>and</strong> challenging responsibility. Figure 12-16lists some things you can do to help prevent the prematureextinction of species.We know what to do. Perhaps we will act in time.EDWARD O. WILSONWhat Can You Do?Protecting Species• Do not but furs, ivory products, <strong>and</strong> othermaterials made from endangered or threatenedanimal species.• Do not buy wood <strong>and</strong> paper productsproduced by cutting remaining old-growthforests in the tropics.• Do not buy birds, snakes, turtles, tropical fish,<strong>and</strong> other animals that are taken from the wild.• Do not buy orchids, cacti, <strong>and</strong> other plantsthat are taken from the wild.Figure 12-16 What can you do? Ways to help prematureextinction of species.CRITICAL THINKING1. How do (a) population growth, (b) poverty, <strong>and</strong> (c) climatechange affect biodiversity?2. Discuss your gut-level reaction to the following statement:“Eventually all species become extinct. Thus itdoes not really matter that the passenger pigeon is extinct<strong>and</strong> that the whooping crane, the California condor,<strong>and</strong> the world’s remaining rhinoceros <strong>and</strong> tiger speciesare endangered mostly because of human activities.” Behonest about your reaction, <strong>and</strong> give arguments for yourposition.3. (a) Do you accept the ethical position that each specieshas the inherent right to survive without human interference,regardless of whether it serves any useful purposefor humans? Explain. Would you extend this right toAnopheles mosquito species, which transmit malaria, <strong>and</strong>to infectious bacteria? (b) Do you believe each individualof an animal species has an inherent right to survive? Explain.Would you extend such rights to individual plants<strong>and</strong> microorganisms <strong>and</strong> to tigers that have killed people?Explain.4. Explain why you agree or disagree with (a) using animalsfor research, (b) keeping animals captive in a zoo oraquarium, <strong>and</strong> (c) killing surplus animals produced by acaptive-breeding program in a zoo when no suitablehabitat is available for their release.5. What would you do if (a) your yard <strong>and</strong> house are invadedby fire ants, (b) you find bats flying around youryard at night, <strong>and</strong> (c) deer invade your yard <strong>and</strong> eat yourshrubs <strong>and</strong> vegetables?6. Which of the following statements best describesyour feelings toward wildlife? (a) As long as it staysin its space, wildlife is OK. (b) As long as I do not need itsspace, wildlife is OK. (c) I have the right to use wildlifehabitat to meet my own needs. (d) When you have seenone redwood tree, fox, elephant, or some other form ofwildlife, you have seen them all, so lock up a few of eachspecies in a zoo or wildlife park <strong>and</strong> do not worry aboutprotecting the rest. (e) Wildlife should be protected.7. List your three favorite wild species. Examine whythey are your favorites. Are they cute <strong>and</strong> cuddly looking,like the giant p<strong>and</strong>a <strong>and</strong> the koala? Do they havehumanlike qualities, like apes or penguins that walk upright?Are they large, like elephants or blue whales? Arethey beautiful, like tigers <strong>and</strong> monarch butterflies? Areany of them plants? Are any of them species such asbats, sharks, snakes, or spiders that most people areafraid of? Are any of them microorganisms that helpkeep you alive? Reflect on what your choice of favoritespecies tells you about your attitudes toward mostwildlife.8. <strong>Environmental</strong> groups in a heavily forested state wantto restrict logging in some areas to save the habitat of anendangered squirrel. Timber company officials argue thatthe well-being of one type of squirrel is not as importantas the well-being of the many families affected if the restrictioncauses them to lay off hundreds of workers. Ifyou had the power to decide this issue, what would youdo <strong>and</strong> why? Can you come up with a compromise?9. Explain why some developers <strong>and</strong> extractors ofresources on public l<strong>and</strong> oppose the development ofnational databases of the species found in a particularcountry.10. Congratulations! You are in charge of preventing thepremature extinction of the world’s existing species fromhuman activities. What would be the three major componentsof your program to accomplish this goal?PROJECTS1. Make a log of your own consumption of all productsfor a single day. Relate your level <strong>and</strong> types of consumptionto the (a) decline of wildlife species <strong>and</strong> (b) increasedhttp://biology.brookscole.com/miller14249
destruction, degradation, <strong>and</strong> fragmentation of wildlifehabitats in the United States (or the country where youlive) <strong>and</strong> in tropical forests.2. Identify examples of habitat destruction or degradationin your community that have had harmful effects onthe populations of various wild plant <strong>and</strong> animal species.Develop a management plan for rehabilitating thesehabitats <strong>and</strong> species.3. Choose a particular animal or plant species that interestsyou <strong>and</strong> use the library or the Internet to find out(a) its numbers <strong>and</strong> distribution, (b) whether it is threatenedwith extinction, (c) the major future threats to itssurvival, (d) actions that are being taken to help sustainthis species, <strong>and</strong> (e) a type of reconciliation ecology thatmight be useful in sustaining this species.4. Work with your classmates to develop an experimentin reconciliation ecology for your campus.5. Use the library or the Internet to find bibliographicinformation about Aldo Leopold <strong>and</strong> Edward O. Wilson,whose quotes appear at the beginning <strong>and</strong> end of thischapter.6. Make a concept map of this chapter’s major ideas, usingthe section heads, subheads, <strong>and</strong> key terms (in boldface).Look on the website for this book for informationabout making concept maps.LEARNING ONLINEThe website for this book contains study aids <strong>and</strong> manyideas for further reading <strong>and</strong> research. They include achapter summary, review questions for the entire chapter,flash cards for key terms <strong>and</strong> concepts, a multiple-choicepractice quiz, interesting Internet sites, references, <strong>and</strong> aguide for accessing thous<strong>and</strong>s of InfoTrac ® College Editionarticles. Log on tohttp://biology.brookscole.com/miller14Then click on the Chapter-by-Chapter area, choose Chapter12, <strong>and</strong> select a learning resource.250 CHAPTER 12 Sustaining Biodiversity: The Species Approach
13 SustainingAquatic BiodiversityBiodiversityCASE STUDYA Biological Roller CoasterRide in Lake VictoriaLake Victoria, shared by Kenya, Tanzania, <strong>and</strong> Ug<strong>and</strong>ain East Africa, is the world’s second largest freshwaterlake (Figure 13-1, left). It has been in ecological troublefor more than two decades.Until the early 1980s, Lake Victoria had more than500 species of fish found nowhere else. About 80% ofthem were small algae-eating fishes known as cichlids(pronounced “SIK-lids”), each with a slightly differentecological niche.Since 1980 some 200 of the cichlid species havebecome extinct, <strong>and</strong> some of those that remain are introuble.Four factors caused this dramatic loss of aquaticbiodiversity. First, there was a large increase in the populationof the Nile perch (Figure 13-1, right). This fishwas deliberately introduced into the lake during the1950s <strong>and</strong> 1960s to stimulate local economies <strong>and</strong> thefishing industry, which exports large amounts of thefish to several European countries. The population ofthis large, prolific, <strong>and</strong> ravenous fish exploded by displacingthe cichlids <strong>and</strong> by 1985 had wiped out manyof them.Also, the native people who depended on thecichlids for protein cannot afford the perch, <strong>and</strong> themechanized fishing industry has put most small-scalefishers <strong>and</strong> fish vendors out of business. This has increasedpoverty <strong>and</strong> protein malnutrition.Second, in the 1980s the lake began experiencingfrequent algal blooms because of nutrient runofffrom surrounding farms, deforested l<strong>and</strong>, untreatedsewage, <strong>and</strong> declines in the populations of the algaeeatingcichlids. This greatly decreased oxygen levelsin the lower depths of the lake <strong>and</strong> drove remainingnative cichlids <strong>and</strong> other fish species to shallowerwaters, where they are more vulnerable to fishingnets. The turbid water caused by eutrophication alsomade it hard for female cichlids to select mates bycolor <strong>and</strong> can lead to the extinction of some species.Third, since 1987 the nutrient-rich lake has beeninvaded by the water hyacinth (Figure 12-9, p. 235).This rapidly growing plant carpeted large areas ofthe lake, blocked sunlight, deprived fish <strong>and</strong> planktonof oxygen, <strong>and</strong> reduced the diversity of importantaquatic plant species. Good news. The population ofwater hyacinths has been reduced sharply by introducingtwo weevils for biological control <strong>and</strong> mechanicalremoval at strategic locations.Fourth, the Nile perch now shows signs of beingoverfished. This may allow a gradual return of someof the remaining cichlids.This ecological story shows the dynamics of largeaquatic systems <strong>and</strong> illustrates that we can never dojust one thing when we intrude into an ecosystem ofconnected species. There are always unintendedconsequences.AFRICASUDANKENYALAKEVICTORIAETHIOPIAFigure 13-1 Althoughthe Nile perch (right) is afine food fish, it hasplayed a key role in amajor loss of biodiversityin East Africa’s LakeVictoria (left).BURUNDIZAIRETANZANIAINDIAN OCEAN
The coastal zone may be the single most important portion ofour planet. The loss of its biodiversity may have repercussionsfar beyond our worst fears.G. CARLETON RAYThis chapter addresses the following questions:■■■■■■What is aquatic biodiversity, <strong>and</strong> what is its economic<strong>and</strong> ecological importance?How are human activities affecting aquaticbiodiversity?How can we protect <strong>and</strong> sustain marinebiodiversity?How can we manage <strong>and</strong> sustain the world’smarine fisheries?How can we protect, sustain, <strong>and</strong> restorewetl<strong>and</strong>s?How can we protect, sustain, <strong>and</strong> restore lakes,rivers, <strong>and</strong> freshwater fisheries?13-1 AN OVERVIEW OF AQUATICBIODIVERSITYWhat Do We Know about the Earth’sAquatic Biodiversity? Some but Not NearlyEnoughWe know fairly little about the biodiversityof the world’s marine <strong>and</strong> freshwater systems.The world’s interconnected oceans cover 71% of theplanet’s surface. The oceans support a variety ofspecies at different depths (Figure 7-6, p. 131, <strong>and</strong> Figure13-2).About 63% of the roughly 25,000 known fishspecies exist in marine systems—50% in coastal waters,12% in the deep sea, <strong>and</strong> 1% in open ocean. Theremaining 37% live in freshwater systems.Freshwater aquatic systems also contain a varietyof visible plant <strong>and</strong> animal species (Figure 13-3, p. 254)<strong>and</strong> microscopic species. Many lakes contain an assortmentof species found in different layers (Figure 7-16,p. 139). As they flow from their mountain (headwater)streams to the ocean, river systems have a variety ofecological habitats that support different aquaticspecies (Figure 7-18, p. 140).We have explored only about 5% of the earth’sglobal ocean <strong>and</strong> know fairly little about its biodiversity<strong>and</strong> how it works. We also know fairly little aboutfreshwater biodiversity. Scientific investigation ofpoorly understood marine <strong>and</strong> freshwater aquatic systemsis a research frontier whose study could result inimmense ecological <strong>and</strong> economic benefits.In 2003, a three-year study by the Pew OceansCommission found that the coastal waters of theUnited States are in deep trouble <strong>and</strong> that laws protectingthem need fundamental reforms. Here are fourof the commission’s major recommendations. First,pass a National Ocean Policy Act that commits thecountry to protect, sustain, <strong>and</strong> restore the livingoceans. Second, double the federal budget for ocean research.Third, base fisheries management on preservingaquatic ecosystems <strong>and</strong> habitats rather than relyingmostly on catch limits for individual species.Fourth, set up a network of marine reserves, linked byprotected corridors, to help protect fish breeding <strong>and</strong>nursery grounds.What Are Some General Patternsof Marine Biodiversity? Abundant Lifenear the Water’s Edge <strong>and</strong> in theDeepCoral reefs, coastal areas, <strong>and</strong> the ocean bottomare centers of marine biodiversity.Despite the lack of knowledge about overall marinebiodiversity, scientists have established several generalpatterns. First, the greatest marine biodiversity occursin coral reefs (Figure 7-12, p. 136), estuaries, <strong>and</strong> thedeep-ocean floor. Second, biodiversity is higher nearcoasts than in the open sea because of the greater varietyof producers, habitats, <strong>and</strong> nursery areas in coastalareas.Third, biodiversity is higher in the bottom (benthic)region of the ocean than in the surface (pelagic) regionbecause of the greater variety of habitats <strong>and</strong> foodsources on the ocean bottom. Fourth, the lowest marinebiodiversity probably is found in the middle depths ofthe open ocean. Can you explain why?Why Should We Care about AquaticBiodiversity? Keeping Us Alive <strong>and</strong>Supporting Our EconomiesThe world’s marine <strong>and</strong> freshwater systemsprovide important ecological <strong>and</strong> economicservices.Marine systems provide a variety of important ecological<strong>and</strong> economic services (Figure 7-5, p. 130).Globally, we get about 6% of our total protein <strong>and</strong> almosta fifth of our animal protein from marine fish<strong>and</strong> shellfish.Seaweed <strong>and</strong> other organisms provide chemicalsused in cosmetics <strong>and</strong> pharmaceuticals worth $400million per year. Chemicals from several types of al-252 CHAPTER 13 Sustaining Aquatic Biodiversity
CobiaHogfishKelpCarrageenPacific sailfishMorayBatfishYellow jackRed snapperRed algaeStriped drumAngelfishBladder kelpSea lettuceOrange roughyChinook salmonDevilfishGreat barracudaPorcupine fishLaminariaSockeye salmonGrouperDulseChilean sea bassFigure 13-2 Natural capital: marine biodiversity. Some oceaninhabitants.gae, sea anemones (Figure 8-10b, p. 155), sponges, <strong>and</strong>mollusks have antibiotic <strong>and</strong> anticancer properties.Anticancer chemicals have also been extracted fromporcupine fish, puffer fish, <strong>and</strong> shark liver. We usechemicals from seaweeds <strong>and</strong> octopuses to treat hypertension<strong>and</strong> coral material to reconstruct our bones.These are only a few of many examples.Freshwater systems also provide important ecological<strong>and</strong> economic services (Figure 7-15, p. 138). Althoughlakes, rivers, <strong>and</strong> wetl<strong>and</strong>s occupy only 1% ofthe earth’s surface, they provide ecological <strong>and</strong> economicservices worth trillions of dollars per year.13-2 HUMAN IMPACTS ON AQUATICBIODIVERSITYHow Has Habitat Loss <strong>and</strong> DegradationAffected Marine Biodiversity? Our LargeAquatic FootprintsHuman activities have destroyed or degraded a largeproportion of the world’s coastal wetl<strong>and</strong>s, coral reefs,mangroves, <strong>and</strong> ocean bottom.The greatest threat to the biodiversity of the world’soceans is loss <strong>and</strong> degradation of habitats. Here are fourhttp://biology.brookscole.com/miller14253
BluegillWhite bassBrook troutWhite waterlilyBulrushMuskellungeRainbow troutRainbow darterWater lettuceBowfishWater hyacinthBladderwortLargemouth black bassBlack crappieWhite sturgeonAmerican smeltYellow perchVelvet cichlidWalleyed pikeEelgrassLongnose garDuckweedCommon piranhaCarpChannel catfishEgyptianwhite lotusAfrican lungfishFigure 13-3 Natural capital: freshwater biodiversity. Some inhabitants of freshwater rivers <strong>and</strong> lakes.examples. First, during the last century we lost abouthalf of the world’s coastal wetl<strong>and</strong>s. This can decreasefish catches in coastal waters because coastal wetl<strong>and</strong>s<strong>and</strong> marshes provide essential spawning, feeding, <strong>and</strong>nursery areas for major commercial fish species.Second, more than one-fourth of the world’s diversecoral reefs have been severely damaged, mostlyby human activities (Figure 7-13, p. 137). By 2050 another70% of the world’s coral reefs may be severelydamaged or eliminated.Third, more than a third of the world’s originalmangrove forest swamps have disappeared, mostlybecause of clearing for coastal development, growingcrops, <strong>and</strong> aquaculture shrimp farms. Such activitiesthreaten many of the world’s remaining mangrovesystems.Fourth, many bottom habitats are being degraded<strong>and</strong> destroyed by dredging operations <strong>and</strong> trawlerboats, which like giant submerged bulldozers draghuge nets weighted down with heavy chains <strong>and</strong> steelplates over ocean bottoms to harvest bottom fish <strong>and</strong>shellfish. Each year thous<strong>and</strong>s of trawlers scrape <strong>and</strong>disturb an area of ocean bottom equal to the combinedsize of Brazil <strong>and</strong> India <strong>and</strong> about 150 times largerthan the area of forests clear-cut each year. Recovery inheavily trawled areas rarely is possible because of re-254 CHAPTER 13 Sustaining Aquatic Biodiversity
peated scraping. Slow-growing, long-lived corals,sponges, <strong>and</strong> fish are particularly vulnerable to trawling.In 2004, some 1,134 scientists signed a statementurging the United Nations to declare a moratorium onbottom trawling on the high seas.How Have Human Activities AffectedMarine Fish Populations <strong>and</strong> Species? GoneFishing, Fish GoneAbout three-fourths of the world’s commerciallyvaluable marine fish species are overfished or fishednear their limits.Studies indicate that about three-fourths of the world’s200 commercially valuable marine fish species (40% inU.S. waters) are either overfished or fished to their estimatedsustainable yield. Overfishing is the greatestthreat to populations of fish that live in surface waters.Populations of bottom-dwelling fish are affected by acombination of overfishing <strong>and</strong> disruption of habitatby trawler fishing.In most cases, overfishing leads to commercial extinction.This is usually only a temporary depletion offish stocks, as long as depleted areas <strong>and</strong> fisheries areallowed to recover. But this is changing. Today fish arehunted throughout the world’s oceans by a global fleetof millions of fishing boats—some of them longer thana football field. These fleets, most supported by governmentsubsidies, use sonar, satellite global positioningsystems, <strong>and</strong> aircraft to find fish. Then they catchthem by deploying gigantic nets or lines containingmany thous<strong>and</strong>s of hooks that can stretch as far as 80kilometers (50 miles). Modern industrial fishing cancause 80% depletion of a target fish species in only10–15 years.One result of the increasingly efficient global huntfor fish is that big fish in many populations of commerciallyvaluable species are becoming scarce. In 2003, fishery scientistsRansom Myers <strong>and</strong> Boris Worm looked at fishingdata for 13 commercial fisheries since 1952. <strong>Their</strong>data indicate that during the last 45 years the abundanceof large open-ocean fish such as swordfish, marlins,tunas, <strong>and</strong> sharks <strong>and</strong> bottom-dwelling groundfishsuch as cod plummeted by 90%! A 2004 study byJeffrey Hutchings <strong>and</strong> John Reynolds found that 230populations of marine fish have suffered an 83% dropin breeding population size from known historic levels.Many depleted species, like the bottom-dwellingNorth Atlantic cod, may never recover because toomuch of their habitat has been destroyed or degradedor there are too few survivors to find mates. For example,after stocks had dropped by 97–99% since the early1960s, Canada closed its cod fishery, putting thous<strong>and</strong>sout of work. After a decade there is no sign of recovery.The smaller fish are next. As the fishing industry hasdepleted its most valuable <strong>and</strong> larger species, it has begunworking its way down marine food webs to exploitsmaller <strong>and</strong> faster-growing varieties at lowertrophic levels (Figure 13-4). If this process continues, itwill begin to unravel food webs, disrupt marineecosystems, <strong>and</strong> hinder the recovery of fish feeding athigher trophic levels because the species they eat havealso been overfished.If this happens, the most abundant remainingspecies will be jellyfish, barnacles, <strong>and</strong> plankton. If wekeep vacuuming the seas, McDonald’s may beginserving barnacle burgers instead of fish s<strong>and</strong>wiches.Most fishing boats are after one or a small numberof commercially valuable species. However, their giganticnets <strong>and</strong> incredibly long lines of hooks alsocatch nontarget species, called bycatch. Almost onethirdof the world’s annual fish catch consists of suchspecies that are thrown overboard dead or dying. Inaddition to wasting potential sources of food, this c<strong>and</strong>eplete the populations of bycatch species that playimportant ecological roles in oceanic food webs.Global freshwaterGlobal marine3.53.53.43.43.33.3Mean trophic level3.23.13.02.92.82.72.62.51950 1960 1970 1980 1990YearMean trophic level3.23.13.02.92.82.72.62.51950 1960 1970 1980 1990YearFigure 13-4 Meantrophic levels of theglobal marine (right)<strong>and</strong> freshwater (left)fish catch have declinedsince 1950.(Daniel Pauly)http://biology.brookscole.com/miller14255
To sum it up: Many species are overfished, big fish arebecoming scarce, smaller fish are next, <strong>and</strong> we throw away30% of the fish we catch.How Have Human Activities Affected theSurvival of Aquatic Species? Many Extinctionson the HorizonMarine <strong>and</strong> aquatic fish are threatened with prematureextinction by human activities more than anyother group of species.Human activities such as overfishing, habitat destruction<strong>and</strong> degradation, invasions by nonnative species,<strong>and</strong> pollution are endangering a number of aquaticspecies. According to marine biologists, at least 1,200marine species have become extinct in the past fewhundred years, <strong>and</strong> many thous<strong>and</strong>s of additional marinespecies could disappear during this century. Indeed,fish are threatened with extinction by human activitiesmore than any other group of species (Figure 12-5, p. 228).Also, according to the UN Food <strong>and</strong> AgricultureOrganization <strong>and</strong> the World Wildlife Fund, at least afifth of the world’s 10,000 known freshwater fishspecies (37% in the United States) are threatened withextinction or have already become extinct. Indeed,freshwater animals are disappearing five times fasterthan l<strong>and</strong> animals.The tiny seahorse is vulnerable to global extinctionchiefly because in dried form it is used in traditionalChinese medicine to treat heart disease, asthma,impotence, <strong>and</strong> a host of other ills.How Have Nonnative Species Affected FishPopulations <strong>and</strong> Species? Alien InvadersHave Hit the WaterNonnative species are an increasing threat to marine<strong>and</strong> freshwater biodiversity.Another problem is the deliberate or accidental introductionof hundreds of nonnative species (Figure 12-9,p. 235) into coastal waters, wetl<strong>and</strong>s, <strong>and</strong> lakesthroughout the world. These bioinvaders can displaceor cause the extinction of native species <strong>and</strong> disruptecosystem functions, as happened to Lake Victoria(p. 251). Bioinvaders are blamed for about two-thirdsof fish extinctions in the United States between 1900<strong>and</strong> 2000. Invasive aquatic species cost the UnitedStates an average of about $16 million per hour!Many aquatic invaders arrive in the ballast waterof ships when it is discharged in the waters of ports.One way to reduce this threat is to require ships todischarge their ballast water <strong>and</strong> replace it with saltwater at sea before entering ports. Other ways are torequire ships to sterilize their ballast water or pumpnitrogen into it (Individuals Matter, p. 257).Let us take a look at two aquatic invader species.The Asian swamp eel has invaded the waterways ofsouth Florida, probably after escaping from a homeaquarium. This rapidly reproducing eel eats almostanything—including many prized fish species—bysucking them in like a vacuum cleaner. It can eludecold weather, drought, fires, <strong>and</strong> predators (includinghumans with nets) by burrowing into mud banks. It isalso resistant to waterborne poisons because it canbreathe air <strong>and</strong> can wriggle across dry l<strong>and</strong> to invadenew waterways, ditches, canals, <strong>and</strong> marshes. Eventuallyit could take over much of the waterways of thesoutheastern United States as far north as ChesapeakeBay. You have to admire a species with such an arrayof survival skills.The purple loosestrife (Figure 12-9, p. 235) is a perennialplant that grows in wetl<strong>and</strong>s in parts of Europe. Inthe early 1880s, it was imported into the United Statesas an ornamental plant. It was also released accidentallyinto U.S. waterways in ballast water contaminatedwith its seeds.A single plant can produce more than 2.5 millionseeds a year. The seeds are spread by water, in mud,<strong>and</strong> by becoming attached to wildlife, livestock, people,<strong>and</strong> tire treads.Few native plants can compete with this prolific<strong>and</strong> highly productive plant. This explains why it hasspread to temperate <strong>and</strong> boreal wetl<strong>and</strong>s in 35 states(Figure 13-5) <strong>and</strong> into southeastern Canada.As it spreads, it reduces wetl<strong>and</strong> biodiversity bydisplacing native vegetation <strong>and</strong> reducing habitat forsome forms of wetl<strong>and</strong> wildlife. Some conservationistscall this plant the “purple plague.”Hopeful news. Some states have recently introducedtwo natural predators of loosestrife from Europe: aweevil species <strong>and</strong> a leaf-eating beetle. It will take sometime to determine the effectiveness of this biologicalPresentNot presentNo dataFigure 13-5 Natural capital degradation: distribution of purpleloosestrife in wetl<strong>and</strong>s in the lower 48 states. This nonnativespecies from Eurasia was introduced deliberately into theUnited States in the early 1980s <strong>and</strong> has spread to wetl<strong>and</strong>s in35 states. (U.S. Department of Agriculture)256 CHAPTER 13 Sustaining Aquatic Biodiversity
control approach <strong>and</strong> to be sure the introduced speciesthemselves do not become pests.13-3 PROTECTING AND SUSTAININGMARINE BIODIVERSITYWhy Is It Difficult to Protect MarineBiodiversity? Out of Sight, Out of MindCoastal development, the invisibility <strong>and</strong> vastnessof the world’s oceans, <strong>and</strong> lack of legal jurisdictionhinder protection of marine biodiversity.There are several reasons why protecting marine biodiversityis difficult. One is rapidly growing coastaldevelopment <strong>and</strong> the accompanying massive inputs ofsediment <strong>and</strong> other wastes from l<strong>and</strong> into coastal waters.This harms shore-hugging species <strong>and</strong> threatensbiologically diverse <strong>and</strong> highly productive coastalecosystems such as coral reefs, marshes, <strong>and</strong> mangroveforest swamps.Another factor is that much of the damage to theoceans <strong>and</strong> other bodies of water is not visible to mostpeople. And many people incorrectly view the seas asan inexhaustible resource that can absorb an almost infiniteamount of waste <strong>and</strong> pollution.In addition, most of the world’s ocean area liesoutside the legal jurisdiction of any country. Thus it isan open-access resource, subject to overexploitationbecause of the tragedy of the commons.How Can We Protect Endangered <strong>and</strong>Threatened Marine Species? LegalAgreements <strong>and</strong> AwarenessWe can use laws, international treaties, <strong>and</strong> educationto help reduce the premature extinction of marinespecies.One widely used method for protecting biodiversity isidentifying <strong>and</strong> protecting endangered, threatened,<strong>and</strong> rare species, as has been done to help save a numberof endangered terrestrial species (Chapter 12).This strategy has also been used to protect a numberof endangered <strong>and</strong> threatened marine reptiles (turtles)<strong>and</strong> mammals (especially whales, seals, <strong>and</strong> sea lions;Figure 13-6, p. 258). Each year plastic itemsdumped from ships <strong>and</strong> left as litter on beaches threatenthe lives of millions of marine mammals, turtles, <strong>and</strong>seabirds that ingest, become entangled in, choke on, orare poisoned by such debris (see photo on p. viii).Three of eight major sea turtle species (Figure 13-7,p. 258) are endangered (Kemp’s ridley, leatherbacks,<strong>and</strong> hawksbills), <strong>and</strong> the rest are threatened, mostlybecause of four factors. First is loss or degradation ofbeach habitat where they come ashore to lay eggs. Secondis the legal <strong>and</strong> illegal taking of eggs. Third is theincreased use of turtles as sources of food, medicinalINDIVIDUALSMATTERKilling Invader Species<strong>and</strong> Saving ShippingCompanies MoneyA large cargo ship typically has adozen or more ballast tanks belowdeck. Each tank is the size of ahigh school gymnasium <strong>and</strong>holds millions of gallons of water.When a ship takes on cargo <strong>and</strong> leaves port itpumps water into the ballast tanks to keep it low inthe water, submerge its rudder, <strong>and</strong> help maintainstability. This water also contains large numbers offish, crabs, clams, <strong>and</strong> other species (many of themmicroscopic) found in the port’s local waters.When the ship’s cargo is removed at its destinationits ballast water is released until the shipis loaded again. This dumps millions of foreignorganisms into rivers <strong>and</strong> bays. Thus cargo shipsmoving about 80% of the goods traded internationallyplay the primary role in the release of nonnativeaquatic organisms into various parts of theworld.In 2002, researchers Mario Tamburri <strong>and</strong>Kerstin Wasson found that pumping nitrogengas into ballast tanks while a ship is at sea virtuallyeliminates dissolved oxygen in the ballastwater. This saves the shipping industry money byreducing corrosion of a ship’s steel compartments.In addition, within three days it kills most fish,crabs, clams, <strong>and</strong> other potential invader specieslurking in the ballast tanks.ingredients, tortoiseshell (for jewelry), <strong>and</strong> leatherfrom their flippers. Fourth, many turtles are unintentionallycaptured <strong>and</strong> drowned by commercial fishingboats—especially shrimp trawlers <strong>and</strong> those usinglong lines of hooks. Conservationists estimate thateach year the global longline fishing industry unintentionallyhooks <strong>and</strong> kills as many as 40,000 sea turtles asbycatch. In 2004 the United States banned long-lineswordfish fishing off the Pacific coast to save dwindlingsea turtle populations.Until recently, U.S. shrimp trawling boats killed asmany as 55,000 sea turtles (mostly endangered loggerheads<strong>and</strong> Kemp’s ridleys) each year. To reduce thisslaughter, since 1989 the U.S. government has requiredoffshore shrimp trawlers to use turtle exclusion devices(TEDs). In 2004 researchers at the NationalMarine Fisheries Service reported that longline fishingboats using a rounder hook with a smaller opening<strong>and</strong> baited with mackerel instead of squid could reducethe sea turtle bycatch by 65–90%.National <strong>and</strong> international laws <strong>and</strong> treaties tohelp protect marine species include the 1975 Conventionon International Trade in Endangered Specieshttp://biology.brookscole.com/miller14257
Bowhead whaleBowhead whaleBowhead whaleNorthern rightwhaleFin whaleHawksbillturtleHawaiianmonk sealHumpbackwhaleGreenturtleKemp'sridley turtleLeatherbackturtleHawksbillturtleGreenturtleHawksbillturtleFin whaleOliveridleyturtleLeatherbackturtleNorthern rightwhaleHumpbackwhaleMediterraneanmonk sealSaimaa sealOliveridleyturtleLeatherbackturtleBowhead whaleJapanesesea lionLeatherbackturtleOliveridleyturtleHawksbillturtleGreenturtleHumpbackwhaleHumpbackwhaleHawksbillturtleHawksbillturtleHumpbackwhaleGreenturtleLeatherbackturtleFin whaleFin whaleWhaleTurtleSealSea lionFigure 13-6 Natural capital degradation: endangered <strong>and</strong> threatened marine mammals (whales, seals, <strong>and</strong>sea lions) <strong>and</strong> reptiles (turtles). Many marine fish, seabirds, <strong>and</strong> invertebrate species are also threatened.Loggerhead119 centimetersOlive ridley76 centimetersHawksbill89 centimetersBlack turtle99 centimetersAustralianflatback99 centimetersLeatherback188 centimetersGreen turtle124 centimetersKemp’s ridley76 centimetersFigure 13-7 Natural capital degradation: major species of sea turtles that have roamed the seas for 150 millionyears, showing their relative adult sizes. Three of these species (Kemp’s ridley, leatherbacks, <strong>and</strong> hawksbills)are endangered, <strong>and</strong> the rest are threatened as a result of human activities.258 CHAPTER 13 Sustaining Aquatic Biodiversity
(CITES), the 1979 Global Treaty on Migratory Species,the U.S. Marine Mammal Protection Act of 1972, theU.S. Endangered Species Act of 1973 (p. 241), the U.S.Whale Conservation <strong>and</strong> Protection Act of 1976, <strong>and</strong>the 1995 International Convention on BiologicalDiversity.Public aquariums that exhibit unusual <strong>and</strong> attractivefish <strong>and</strong> some marine animals such as seals <strong>and</strong>dolphins have played an important role in educatingthe public about the need to protect such species.Case Study: Should Commercial WhalingBe Resumed? An Ongoing ControversyAfter many of the world’s whale species wereoverharvested, commercial whaling wasbanned in 1970, but there are efforts to overturnthis ban.Cetaceans are an order of mostly marine mammalsranging in size from the 0.9-meter (3-foot) porpoise tothe giant 15- to 30-meter (50- to 100-foot) blue whale.They are divided into two major groups: toothed whales<strong>and</strong> baleen whales (Figure 13-8, p. 260).Toothed whales, such as the porpoise, sperm whale,<strong>and</strong> killer whale (orca), bite <strong>and</strong> chew their food <strong>and</strong>feed mostly on squid, octopus, <strong>and</strong> other marine animals.Baleen whales, such as the blue, gray, humpback,<strong>and</strong> finback, are filter feeders. Instead of teeth theyhave several hundred horny plates made of baleen, orwhalebone, that hang down from the upper jaw. Theseplates filter plankton from the seawater, especially tinyshrimplike krill (Figure 4-19, p. 69). Baleen whales arethe more abundant of the two cetacean groups.Whales are fairly easy to kill because of their largesize <strong>and</strong> their need to come to the surface to breathe.Mass slaughter has become efficient with the use ofradar <strong>and</strong> airplanes to locate them, fast ships, harpoonguns, <strong>and</strong> inflation lances that pump dead whales fullof air <strong>and</strong> make them float.Whale harvesting, mostly in international waters,has followed the classic pattern of a tragedy of thecommons, with whalers killing an estimated 1.5 millionwhales between 1925 <strong>and</strong> 1975. This overharvestingreduced the populations of 8 of the 11 majorspecies to the point at which it no longer paid to hunt<strong>and</strong> kill them (commercial extinction). It also drove somecommercially prized species such as the giant bluewhale to the brink of biological extinction (see CaseStudy, p. 260).In 1946, the International Convention for theRegulation of Whaling established the InternationalWhaling Commission (IWC), which now has 49 nationmembers. Its mission was to regulate the whaling industryby setting annual quotas to prevent overharvesting<strong>and</strong> commercial extinction.This did not work well for two reasons. First, IWCquotas often were based on inadequate data or ignoredby whaling countries. Second, without powers ofenforcement the IWC was not able to stop the declineof most commercially hunted whale species.In 1970, the United States stopped all commercialwhaling <strong>and</strong> banned all imports of whale products.Under pressure from environmentalists, the U.S. government,<strong>and</strong> governments of many nonwhalingcountries in the IWC, the IWC has imposed a moratoriumon commercial whaling since 1986. It worked.The estimated number of whales killed commerciallyworldwide dropped from 42,480 in 1970 to about 1,200in 2004.Despite the ban, IWC members Japan <strong>and</strong> Norwayhave continued to hunt certain whale species, <strong>and</strong>Icel<strong>and</strong> resumed hunting whales in 2002—stating thata certain number of whales needed to be harvested forscientific purposes. Japan, Norway, Icel<strong>and</strong>, Russia,<strong>and</strong> a growing number of small tropical isl<strong>and</strong> countries—whichJapan brought into the IWC to support itsposition—continue working to overthrow the IWCban on commercial whaling <strong>and</strong> reverse the internationalban on buying <strong>and</strong> selling whale products.They argue that commercial whaling should be allowedbecause it has long been a traditional part of theeconomies <strong>and</strong> cultures of countries such as Japan,Icel<strong>and</strong>, <strong>and</strong> Norway. They also contend that the ban isbased on emotion, not updated scientific estimates ofwhale populations.The moratorium on commercial whaling has ledto a sharp rebound in the estimated populations ofsperm, pilot, <strong>and</strong> minke whales. Proponents of resumingwhaling see no scientific reason for not resumingcontrolled <strong>and</strong> sustainable hunting of these species<strong>and</strong> other whale species with populations of at least1 million.Conservationists disagree. Some argue that whalesare peaceful, intelligent, sensitive, <strong>and</strong> highly socialmammals that pose no threat to humans <strong>and</strong> should beprotected for ethical reasons. Others question IWC estimatesof the allegedly recovered whale species, notingthe inaccuracy of past IWC estimates of whale populations.Also, many conservationists fear that openingthe door to any commercial whaling may eventuallylead to widespread harvests of most whale species byweakening current international disapproval <strong>and</strong> legalsanctions against commercial whaling.Proponents of resuming whaling say that peoplein other countries have no right to tell Japanese,Norwegians, <strong>and</strong> other whaling culture countries thatbecause we like whales they must not eat them. Thiswould be like people in India who consider cows sacredtelling Americans <strong>and</strong> Europeans that theyshould not be allowed to eat beef.xHOW WOULD YOU VOTE? Should commercial whalingbe resumed? Cast your vote online at http://biology.brookscole.com/miller14.http://biology.brookscole.com/miller14259
Case Study: Near Extinction of the BlueWhale: Big Species are Easy to KillCommercial whaling almost drove the blue whale toextinction <strong>and</strong> it may never recover.The biologically endangered blue whale (Figure 13-8)is the world’s largest animal. Fully grown, it is longerthan three train boxcars <strong>and</strong> weighs more than 25 elephants.The adult has a heart the size of a VolkswagenAtlanticwhite-sideddolphinHarborporpoiseCommondolphinKillerwhaleBelugawhaleBottlenosedolphinFalse killerwhaleCuvier'sbeakedwhalePilotwhaleNarwhalPygmyspermwhaleSpermwhaleSquidBaird'sbeakedwhale05 10152025 30m0 10 20 3040 50607080 90 100ftOdontocetes (Toothed Whales)Figure 13-8 Natural capital: examples of cetaceans, which can be classified as either toothed whales orbaleen whales.260 CHAPTER 13 Sustaining Aquatic Biodiversity
Beetle car, <strong>and</strong> some of its arteries are so big that achild could swim through them.Blue whales spend about 8 months a year inAntarctic waters. There they find an abundant supplyof krill (Figure 4-19, p. 69), which they filter by thetrillions daily from seawater. During the winter theymigrate to warmer waters where their young areborn.Humpback whaleBowhead whaleRight whaleMinkewhaleBlue whaleFeedingon krillFin whaleSei whaleMysticetes (Baleen Whales)Gray whalehttp://biology.brookscole.com/miller14261
Before commercial whaling began an estimated200,000 blue whales roamed the Antarctic Ocean. Todaythe species has been hunted to near biological extinctionfor its oil, meat, <strong>and</strong> bone. There are probablyfewer than 10,000 of these whales left.A combination of prolonged overharvesting <strong>and</strong>certain natural characteristics of blue whales caused itsdecline. <strong>Their</strong> huge size made them easy to spot. Theywere caught in large numbers because they groupedtogether in their Antarctic feeding grounds. They alsotake 25 years to mature sexually <strong>and</strong> have only one offspringevery 2–5 years. This low reproductive ratemakes it difficult for the species to recover once itspopulation falls beneath a certain threshold.Blue whales have not been hunted commerciallysince 1964 <strong>and</strong> have been classified as an endangeredspecies since 1975. Despite this protection, some marinebiologists fear that too few blue whales remain forthe species to recover <strong>and</strong> avoid extinction. Others believethat with continued protection they will make aslow comeback.What Is the Role of InternationalAgreements <strong>and</strong> Protected MarineSanctuaries? Hopeful but LimitedProgressNations have established various types ofmarine sanctuaries, but most receive only partialprotection <strong>and</strong> fully protected areas make upless than 0.01% of the world’s ocean area.Under the United Nations Law of the Sea, all coastalnations have sovereignty over the waters <strong>and</strong> seabedup to 19 kilometers (12 miles) offshore. They also havealmost total jurisdiction over their Exclusive EconomicZone (EEZ), which extends 320 kilometers (200 miles)offshore. Taken together, the nations of the world havejurisdiction over 36% of the ocean surface <strong>and</strong> 90% ofthe world’s fish stocks. However, instead of using thislaw to protect their fishing grounds, many governmentspromoted overfishing, subsidized new fishingfleets, <strong>and</strong> failed to establish <strong>and</strong> enforce stricter regulationof fish catchesSince 1986 the World Conservation Union (IUCN)has helped establish a global system of marine protectedareas (MPAs), mostly at the national level. An MPA isan area of ocean protected from some or all human activities.The 1,300 existing MPAs provide partial protectionfor about 0.2% of the earth’s total ocean area.In addition, the United Nations EnvironmentProgramme has spearheaded efforts to develop 12 regionalagreements to protect large marine areas sharedby several countries.And about 90 of the world’s 350 biosphere reserves(p. 217) include coastal or marine habitats. Marinereserves—also known as fully protected areas orno-take MPAs—are areas where no extraction <strong>and</strong>alteration of any living or nonliving resources is allowed.More than 20 coastal nations, including theUnited States, have established marine reserves thatvary widely in size. In 2002, the Australian governmentestablished the world’s largest marine reserve.Scientific studies show that within fully protectedmarine reserves, fish populations double, fish sizegrows by almost a third, fish reproduction triples, <strong>and</strong>species diversity increases by almost one-fourth. Furthermore,this improvement happens within 2–4 yearsafter strict protection begins <strong>and</strong> lasts for decades.However, less than 0.01% of the world’s oceanarea consists of fully protected marine reserves. In theUnited States the total area of fully protected marinehabitat is only about 130 square kilometers (50 squaremiles). In other words, we have failed to strictly protect99.99% of the world’s ocean area from human exploitation.In 1997, a group of international marine scientistscalled for governments to increase fully protectedmarine reserves to at least 20% of the ocean’s surfaceby 2020. The 2003 Pew Fisheries Commission studyrecommended establishing many more protected marinereserves in U.S. coastal waters <strong>and</strong> connectingthem with protected corridors so fish can move back<strong>and</strong> forth. In 2004 marine biologist Elliott Norse proposedestablishment of moveable marine reserves thatmove with the animals as they migrate through theoceans.What Is the Role of Integrated CoastalManagement? Cooperation Can WorkSome communities have worked togetherto develop integrated plans for managing theircoastal areas.Integrated coastal management is a community-based effortto develop <strong>and</strong> use coastal resources more sustainably.The overall aim is for groups competing for theuse of coastal resources to identify shared problems<strong>and</strong> goals. Then they attempt to develop workable,cost-effective, <strong>and</strong> adaptable solutions that preservebiodiversity <strong>and</strong> environmental quality while meetingeconomic <strong>and</strong> social needs. In other words, develop<strong>and</strong> implement integrated plans using the principlesof adaptive ecosystem management (Figure 11-23, p. 218).Ideally, the overall goal is to zone the l<strong>and</strong> <strong>and</strong> seaportions of an entire coastal area. Such zoning wouldinclude some fully protected marine reserves whereno exploitive human activities are allowed <strong>and</strong> otherzones where different kinds <strong>and</strong> levels of human activitiesare permitted. Australia’s huge Great Barrier ReefMarine Park is managed this way. Currently, morethan 100 integrated coastal management programs arebeing developed throughout the world.In the United States, 90 coastal counties are workingto establish coastal management systems, butfewer than 20 of these plans have been implemented.262 CHAPTER 13 Sustaining Aquatic Biodiversity
What Role Can ReconciliationEcology Play? Share the Spaces WeDominateWe can greatly increase the use ofreconciliation ecology in protecting, sustaining,<strong>and</strong> restoring aquatic systems.Reconciliation ecology (p. 247) has a role to play in protecting,sustaining, <strong>and</strong> restoring aquatic systems. Hereare two examples given by Michael L. Rosenzweig.One involves large numbers of American crocodilestaking up residence in 38 long canals dug to providecooling water for Florida’s Turkey Point electric powerplant. The sides of each canal are topped with berms ofthe dirt dredged to dig them out. The berms support avariety of plants <strong>and</strong> small trees, including red mangroves.In addition, a group of American crocodilesshowed up <strong>and</strong> began living <strong>and</strong> breeding in thecanals. This was not a planned experiment in reconciliationecology. It just happened.Now we zoom to the city of Eliat, Israel, at one tipof the Red Sea. There we find a magnificent coral reefat the water’s edge, which is a major tourist attraction.To help protect the reef from excessive development<strong>and</strong> destructive tourism, Israelset aside part of the reef as a naturereserve.The bad news is that mostof the rest of the reef is gone as aresult of tourism, industry, <strong>and</strong>inadequate sewage treatment.Enter Reuven Yosef, a pioneerin reconciliation ecology, whohas developed an underwaterrestaurant called the Red SeaStar Restaurant. Take an elevatordown two floors <strong>and</strong> walkinto a restaurant surroundedwith windows looking out intoa beautiful coral reef.This reef was created frombroken pieces of coral. Whendivers find broken pieces of coralin the nearby reserve they bringthem to Yosef’s coral hospital.Most pieces of broken coralsoon become infected <strong>and</strong> die.But researchers have learnedhow to treat the coral fragmentswith antibiotics <strong>and</strong> store themwhile they are healing in largetanks of fresh seawater.After several months ofhealing, divers bring the fragmentsto the watery area outsidethe Red Sea Star Restaurant’swindows. There they are wiredFishery RegulationsSet catch limits well below themaximum sustainable yieldImprove monitoring <strong>and</strong>enforcement of regulationsEconomic ApproachesSharply reduce or eliminatefishing subsidiesCharge fees for harvesting fish<strong>and</strong> shellfish from publicly ownedoffshore watersCertify sustainable fisheriesProtected AreasEstablish no-fishing areasEstablish more marine protected areasRely more on integratedcoastal managementConsumer InformationLabel sustainably harvested fishPublicize overfished <strong>and</strong>threatened speciesto panels of iron mesh cloth. The coral grow <strong>and</strong> coverthe iron matrix. Then fish <strong>and</strong> other creatures show up.Using his creativity <strong>and</strong> working with nature,Yosef has helped create a small coral reef <strong>and</strong> providesa beautiful place for restaurant customers to see thereef without having to be divers or snorklers.We need to greatly increase experiments in reconciliationecology in the world’s aquatic systems. Perhapsyou can begin such an experiment in your area. You alsomight want to consider this field as a career choice.13-4 MANAGING AND SUSTAININGTHE WORLD’S MARINE FISHERIESHow Can We Manage Fisheries to SustainStocks <strong>and</strong> Protect Biodiversity? ManyIdeasThere are a number of ways to manage marine fisheriesmore sustainably <strong>and</strong> protect marine biodiversity.Overfishing is a serious threat to biodiversity incoastal waters <strong>and</strong> to some marine species in openoceanwaters. Figure 13-9 lists measures that analystsSolutionsManaging FisheriesBycatchUse wide-meshed nets to allowescape of smaller fishUse net escape devices forseabirds <strong>and</strong> sea turtlesBan throwing edible <strong>and</strong>marketable fish back into the seaAquacultureRestrict coastal locations forfish farmsControl pollution more strictlyDepend more on herbivorousfish speciesNonative InvasionsKill organisms in ship ballast waterFilter organisms from ship ballastwaterDump ballast water far at sea <strong>and</strong>replace with deep-sea waterFigure 13-9 Solutions: ways to manage fisheries more sustainably <strong>and</strong> protect marine biodiversity.http://biology.brookscole.com/miller14263
have suggested for managing global fisheries moresustainably <strong>and</strong> protecting marine biodiversity. Mostof these approaches rely on some sort of governmentregulation.But in nature there are almost always surprises becausewe still have little underst<strong>and</strong>ing of how ecosystemswork. For example, researchers have found thatreducing fishing to protect fish stocks can harm populationsof some seabirds.In the North Sea, the bycatch tossed back into thesea is eaten by a seabird species called the great skua.Because of such an abundance of food the size of thegreat skua population rose sharply. But reducing fishquotas has meant fewer discards for these seabirds. Tomake up for the loss these birds have been preying inother seabirds such as kittiwakes <strong>and</strong> puffins—anotherexample of unintended consequences from our actions.One way to reduce overfishing is to develop bettermeasurements <strong>and</strong> models for projecting fish populations.Until recently, management of commercial fisherieshas been based primarily on the maximumsustained yield (MSY). It involves using a mathematicalmodel to project the maximum number of fish that canbe harvested annually from a fish stock without causinga population drop.But experience has shown that the MSY concepthas helped hasten the collapse of most commerciallyvaluable stocks for several reasons. First, populations<strong>and</strong> growth rates of fish stocks are difficult to measure.Second, population sizes of fish stocks usually arebased on unreliable <strong>and</strong> sometimes underreportedcatch figures by fishers. Third, harvesting a particularspecies at its estimated maximum sustainable level canaffect the populations of other target <strong>and</strong> nontargetfish species <strong>and</strong> other marine organisms—those peskyconnections again. Fourth, fishing quotas are difficultto enforce <strong>and</strong> many groups managing fisheries haveignored projected MSYs for short-term political or economicreasons.In recent years, fishery biologists <strong>and</strong> managershave begun placing more emphasis on the optimumsustained yield (OSY) concept. This approach attemptsto take into account interactions with other species <strong>and</strong>to provide more room for error. But it still depends onthe poorly understood biology of fish <strong>and</strong> changingocean conditions. Also, many bodies governing fisheriesignore OSY estimates for short-term political <strong>and</strong>economic reasons.Another approach is multispecies management of anumber of interacting species, which takes into accounttheir competitive <strong>and</strong> predator–prey interactions. Suchmodels are still in the development <strong>and</strong> testing stage.A more ambitious approach is to develop complexcomputer models for managing multispecies fisheriesin large marine systems. However, it is a political challengeto get groups of nations to cooperate in planning<strong>and</strong> managing them.Despite the scientific <strong>and</strong> political difficulties, somelimited management of several large marine systems isunder way. Examples include the Mediterranean Sea by17 of the 18 nations involved <strong>and</strong> the Great Barrier Reefunder the exclusive control of Australia.A basic problem is the uncertainties built into usingany of these approaches. As a result, many fisheryscientists <strong>and</strong> environmentalists are increasingly interestedin using the precautionary principle for managingfisheries <strong>and</strong> large marine systems. This means sharplyreducing fish harvests <strong>and</strong> closing some overfished areasuntil they recover <strong>and</strong> we have more informationabout what levels of fishing can be sustained.Should Governments Control Access toFisheries? Regulation <strong>and</strong> CooperationCan WorkSome fishing communities regulate fish harvestson their own <strong>and</strong> others work with the governmentto regulate them.By international law, a country’s offshore fishing zoneextends to 370 kilometers (200 nautical miles, or 230statute miles) from its shores. Foreign fishing vesselscan take certain quotas of fish within such zones,called exclusive economic zones, but only with a government’spermission.Ocean areas beyond the legal jurisdiction of anycountry are known as the high seas. International maritimelaw <strong>and</strong> international treaties set some limits onthe use of the living <strong>and</strong> mineral common-property resourcesin the high seas. But such laws <strong>and</strong> treaties aredifficult to monitor <strong>and</strong> enforce.Traditionally, many coastal fishing communitieshave developed allotment <strong>and</strong> enforcement systemsthat have sustained their fisheries, jobs, <strong>and</strong> communitiesfor hundreds <strong>and</strong> sometimes thous<strong>and</strong>s of years.An example is Norway’s Lofoten fishery, one of theworld’s largest cod fisheries. For 100 years it has beenself-regulated, with no government quota regulations<strong>and</strong> no participation by the Norwegian government.Cooperation can work.However, the influx of large modern fishing boats<strong>and</strong> fleets has weakened the ability of many coastalcommunities to regulate <strong>and</strong> sustain local fisheries.Many community management systems have been replacedby comanagement, in which coastal communities<strong>and</strong> the government work together to manage fisheries.In this approach, a central government typicallysets quotas for various species, divides the quotasamong communities, <strong>and</strong> may limit fishing seasons<strong>and</strong> regulate the type of fishing gear that can be usedto harvest a particular species.Each community then allocates <strong>and</strong> enforces itsquota among its members based on its own rules. Oftencommunities focus on managing inshore fisheries<strong>and</strong> the central government manages the offshore fish-264 CHAPTER 13 Sustaining Aquatic Biodiversity
eries. When it works, community-based comanagementillustrates that the tragedy of the commons is notinevitable.Should We Use the Marketplaceto Control Access to Fisheries? Good<strong>and</strong> Bad News about an InterestingIdeaSome countries try to prevent overfishingby giving each fishing vessel quotas that can bebought or sold in the marketplace.Some countries are using a market-based systemcalled individual transfer quotas (ITQs) to help controlaccess to fisheries. The government gives each fishingvessel owner a specified percentage of the total allowablecatch (TAC) for a fishery in a given year.Owners are permitted to buy, sell, or lease theirquotas like private property. Currently about 50 of theworld’s fisheries are managed by the ITQ system. Itwas introduced in New Zeal<strong>and</strong> in 1986 <strong>and</strong> in Icel<strong>and</strong>in 1990. In these countries there has been some reductionin overfishing <strong>and</strong> the overall fishing fleet <strong>and</strong> anend to government fishing subsidies that encourageoverfishing.But enforcement has been difficult, some fishers illegallyexceed their quotas, <strong>and</strong> the wasteful bycatchhas not been reduced.<strong>Environmental</strong>ists have identified four problemswith the ITQ approach <strong>and</strong> have made suggestions forits improvement. First, in effect it transfers ownershipof publicly owned fisheries to private commercial fishersbut still makes the public responsible for the costsof enforcing <strong>and</strong> managing the system. Remedy: Collectfees (not to exceed 5% of the value of the catch) fromquota holders to pay for the costs of government enforcement<strong>and</strong> management of the ITQ system.Second, it can squeeze out small fishing vessels<strong>and</strong> companies because they do not have the capital tobuy ITQs from others. For example, 5 years after theITQ system was implemented in New Zeal<strong>and</strong>, threecompanies controlled half the ITQs. Remedy: Do not allowany fisher or fishing company to accumulate morethan a fifth of the total quota of a fishery.Third, the ITQ system can increase poaching <strong>and</strong>sales of illegally caught fish on the black market, as hashappened to some extent in New Zeal<strong>and</strong>. Some ofthis comes from small-scale fishers who receive noquota or too small a quota to make a living. Some alsocomes from larger-scale fishers who deliberately exceedtheir quotas. Remedy: Require strict record keeping<strong>and</strong> have well-trained observers on all fishing vesselswith quotas.Fourth, the fishing quotas (TACS) are often set toohigh to prevent overfishing. Remedy: Leave 10–50% ofthe estimated MSY of an ITQ fishery as a buffer to protectthe fishery from unexpected decline.13-5 PROTECTING, SUSTAINING,AND RESTORING WETLANDSHow Are Wetl<strong>and</strong>s Protected in the UnitedStates? Some ProgressRequiring government permits for filling or destroyingU.S. wetl<strong>and</strong>s has slowed their loss, but thereare continuing attempts to weaken this protection.Coastal <strong>and</strong> inl<strong>and</strong> wetl<strong>and</strong>s are important reservoirsof aquatic biodiversity that provide many vital ecological<strong>and</strong> economic services. In the United States, a federalpermit is required to fill or to deposit dredged materialinto wetl<strong>and</strong>s occupying more than 1.2 hectares(3 acres). According to the U.S. Fish <strong>and</strong> WildlifeService, this law helped cut the average annual wetl<strong>and</strong>loss by 80% between 1969 <strong>and</strong> 2002.There are continuing attempts to weaken wetl<strong>and</strong>sprotection by using unscientific criteria to classify areasas wetl<strong>and</strong>s. Also, only about 8% of remaining inl<strong>and</strong>wetl<strong>and</strong>s is under federal protection, <strong>and</strong> federal, state,<strong>and</strong> local wetl<strong>and</strong> protection is weak.The stated goal of current U.S. federal policy is zeronet loss in the function <strong>and</strong> value of coastal <strong>and</strong> inl<strong>and</strong>wetl<strong>and</strong>s. A policy known as mitigation banking allowsdestruction of existing wetl<strong>and</strong>s as long as an equalarea of the same type of wetl<strong>and</strong> is created or restored.Some wetl<strong>and</strong> restoration projects have been successful(Individuals Matter, p. 266).However, a 2001 study by the National Academyof Sciences found that at least half of the attempts tocreate new wetl<strong>and</strong>s fail to replace lost ones <strong>and</strong> mostof the created wetl<strong>and</strong>s do not provide the ecologicalfunctions of natural wetl<strong>and</strong>s. In addition, wetl<strong>and</strong>creation projects often fail to meet the st<strong>and</strong>ards set forthem <strong>and</strong> are not adequately monitored.Figure 13-10 lists ways to help sustain wetl<strong>and</strong>s inthe United States <strong>and</strong> elsewhere. Many developers,SolutionsProtecting Wetl<strong>and</strong>sLegally protect existing wetl<strong>and</strong>sSteer development away from existing wetl<strong>and</strong>sUse mitigation banking only as a last resortRequire creation <strong>and</strong> evaluation of a new wetl<strong>and</strong> beforedestroying an existing wetl<strong>and</strong>Restore degraded wetl<strong>and</strong>sTry to prevent <strong>and</strong> control invasions by nonnative speciesFigure 13-10 Solutions: ways to help sustain the world’swetl<strong>and</strong>s.http://biology.brookscole.com/miller14265
Restoring a Wetl<strong>and</strong>INDIVIDUALSMATTERHumans havedrained, filled in,or covered overswamps, marshes,<strong>and</strong> other wetl<strong>and</strong>sfor centuries.They have done this to create ricefields <strong>and</strong> other l<strong>and</strong> to grow crops,create l<strong>and</strong> for urban development<strong>and</strong> highways, reduce disease suchas malaria caused by mosquitoes,<strong>and</strong> extract minerals, oil, <strong>and</strong> naturalgas.Some people have begun toquestion such practices as we learnmore about the ecological <strong>and</strong> economicimportance of coastal <strong>and</strong> inl<strong>and</strong>wetl<strong>and</strong>s. Can we turn backthe clock to restore or rehabilitatelost marshes?California rancher Jim Callenderdecided to try. In 1982, he bought 20hectares (50 acres) of a SacramentoValley rice field that had been amarsh until the early 1970s. To growrice, the previous owner had destroyedthe marsh by bulldozing,draining, leveling, uprooting thenative plants, <strong>and</strong> spraying withchemicals to kill the snails <strong>and</strong> otherfood of the waterfowl.Callender <strong>and</strong> his friends set outto restore the marshl<strong>and</strong>. They hollowedout low areas, built up isl<strong>and</strong>s,replanted bulrushes <strong>and</strong>other plants that once were there,reintroduced smartweed <strong>and</strong> otherplants needed by birds, <strong>and</strong> plantedfast-growing Peking willows. Afteryears of care, h<strong>and</strong> planting, <strong>and</strong>annual seeding with a mixture ofwatergrass, smartweed, <strong>and</strong> rice,the marsh is once again a part of thePacific flyway used by migratorywaterfowl (Figure 12-15, p. 246).Jim Callender <strong>and</strong> others haveshown that at least part of the continent’sdegraded or destroyed wetl<strong>and</strong>scan be reclaimed with scientificknowledge <strong>and</strong> hard work.Such restoration is useful, but tomost ecologists the real challenge isto protect remaining wetl<strong>and</strong>s fromharm in the first place.farmers, <strong>and</strong> resource extractors vigorously opposethese suggestions.Case Study: Restoring the Florida Everglades:Will It Work?The world’s largest ecological restoration project involvestrying to undo some of the damage inflictedon Florida’s Everglades by human activities.South Florida’s Everglades was once a 100-kilometerwide(60-mile-wide), knee-deep sheet of water flowingslowly south from Lake Okeechobee to Florida Bay(Figure 13-11). As this shallow body of water trickledsouth it created a vast network of wetl<strong>and</strong>s with a varietyof wildlife habitats.But since 1948 much of the southward naturalflow of the Everglades has been diverted <strong>and</strong> disruptedby a system of canals, levees, spillways, <strong>and</strong>pumping stations. The most devastating blow came inthe 1960s, when the U.S. Army Corps of Engineerstransformed the me<strong>and</strong>ering 103-mile-long KissimmeeRiver (Figure 13-11) into a straight 84-kilometer (56-mile) canal. The canal provided flood control byspeeding the flow of water but drained large wetl<strong>and</strong>snorth of Lake Okeechobee, which farmers then turnedinto cow pastures.Below Lake Okeechobee, farmers planted <strong>and</strong> fertilizedvast agricultural fields of sugarcane <strong>and</strong> vegetables.Historically the Everglades has been a nutrient–poor aquatic system, with low phosphorus levels. Butrunoff of phosphorus from fertilizers has greatly increasedphosphorus levels. This large nutrient inputhas stimulated the growth of nonnative plants such ascattails, which have taken over <strong>and</strong> displaced sawgrass, choked waterways, <strong>and</strong> disrupted food webs ina vast area of the Everglades.Mostly as a result of these human alterations, thenatural Everglades has shrunk to half its original size<strong>and</strong> dried out, leaving large areas vulnerable to summerwildfires. Urbanization has also contributed to theloss of biodiversity in the Everglades by fragmentingmuch of its habitat.To help preserve the lower end of the system, in1947 the U.S. government established EvergladesNational Park, which contains about a fifth of the remainingEverglades. But this did not work—as conservationistshad predicted—because the massive plumbing<strong>and</strong> l<strong>and</strong> development project to the north cut offmuch of the water flow needed to sustain the park’swildlife.As a result, 90% of the park’s wading birds havevanished, <strong>and</strong> populations of other vertebrates, fromdeer to turtles, are down 75–95%. Florida Bay, south ofthe Everglades is a shallow estuary with many tiny isl<strong>and</strong>sor keys. Large volumes of fresh water that onceflowed through the park into Florida Bay have beendiverted for crops <strong>and</strong> cities, causing the bay to becomesaltier <strong>and</strong> warmer. This <strong>and</strong> increased nutrientinput from crop fields <strong>and</strong> cities have stimulated thegrowth of large algae blooms that sometimes cover40% of the bay. This has threatened the coral reefs <strong>and</strong>the diving, fishing, <strong>and</strong> tourism industries of the bay<strong>and</strong> Florida Keys—another example of unintendedconsequences.By the 1970s, state <strong>and</strong> federal officials recognizedthat this huge plumbing project threatens wildlife—amajor source of tourism income for Florida—<strong>and</strong> thewater supply for the 6 million residents of south266 CHAPTER 13 Sustaining Aquatic Biodiversity
GULF OFMEXICOAgricultural areaTreatment marshWaterconservation areaCanalArea ofdetailFLORIDAFLORIDAFort MyersNaplesKissimmeeRiverChannelized( )Unchannelized( )LakeOkeechobeeEvergladesNationalParkFlorida Bay0 200 20 40WestPalmBeachFortLauderdaleMiamiATLANTICOCEANKey Largo40 60miles60 kilometersFigure 13-11 The world’s largest ecological restoration project is an attemptto undo <strong>and</strong> redo an engineering project that has been destroying Florida’sEverglades <strong>and</strong> threatening water supplies for south Florida’s growing population.Florida <strong>and</strong> the 6 million more people projected to beliving there by 2050.After more than 20 years of political haggling, in1990 Florida’s state government <strong>and</strong> the federal governmentagreed on the world’s largest ecologicalrestoration project. It is to be carried out by the U.S.Army Corps of Engineers between 2000 <strong>and</strong> 2038, withFlorida <strong>and</strong> the federal government sharing its projected$7.8 billion cost.The project has several ambitious goals. First, restorethe curving flow of more than half of the KissimmeeRiver. Second, remove 400 kilometers (250 miles) ofcanals <strong>and</strong> levees blocking water flow south of LakeOkeechobee. Third, buy 240 square kilometers (93square miles) of farml<strong>and</strong> <strong>and</strong> allow it to flood to createartificial marshes to filter agricultural runoff before itreaches Everglades National Park. Fourth, create a networkof artificial marshes. Fifth, create 18 large reservoirsto ensure an adequate water supply for southFlorida’s current <strong>and</strong> projected population<strong>and</strong> the lower Everglades. Sixth, build newcanals, reservoirs, <strong>and</strong> huge pumping systemsto capture 80% of the water currently flowingout to sea <strong>and</strong> return it to the Everglades.Will this huge ecological restoration projectwork? It depends not only on the abilitiesof scientists <strong>and</strong> engineers but also on prolongedpolitical <strong>and</strong> economic support fromcitizens, Florida’s politically powerful sugarcane<strong>and</strong> agricultural industries, <strong>and</strong> electedstate <strong>and</strong> federal officials.Bad news. The carefully negotiated plan isunraveling. In 2003, sugarcane growers persuadedthe Florida legislature to increase theamount of phosphorus they could discharge<strong>and</strong> extend the deadline for doing this from2006 to 2016.According to critics, the main goal of theEverglades restoration plan is to provide waterfor urban <strong>and</strong> agricultural developmentwith ecological restoration as a secondarygoal. Also, the plan does not specify howmuch of the water rerouted toward south <strong>and</strong>central Florida will go to the parched park insteadof to increased industrial, agricultural,<strong>and</strong> urban development. In 2002, a NationalAcademy of Sciences panel said that the planwould probably not clear up Florida Bay’s nutrientenrichment problems.The need to make expensive <strong>and</strong> politicallycontroversial efforts to undo some of thedamage to the Everglades caused by 120 yearsof agricultural <strong>and</strong> urban development is anotherexample of failure to heed two fundamentallessons from nature: Prevention is thecheapest <strong>and</strong> best way to go <strong>and</strong> there are almostalways unintended consequences becausewe can never do one thing when we intervenein nature.13-6 PROTECTING, SUSTAINING,AND RESTORING LAKES AND RIVERSCase Study: Can the Great Lakes SurviveRepeated Invasions by Alien Species? TheyKeep ComingInvasions by nonnative species have upset theecological functioning of the Great Lakes for decades,<strong>and</strong> more invaders keep arriving.Invasions by nonnative species is a major threat to thebiodiversity <strong>and</strong> ecological functioning of lakes, as illustratedby what has happened to the Great Lakes.Collectively, the Great Lakes are the world’slargest body of fresh water. Since the 1920s, they havehttp://biology.brookscole.com/miller14267
een invaded by at least 162 nonnative species <strong>and</strong> thenumber keeps rising. Many of the alien invaders arriveon the hulls or in bilge water discharges of oceangoingships that have been entering the Great Lakes throughthe St. Lawrence seaway for over 40 years.One of the biggest threats, sea lampreys, reached thewestern lakes through the Well<strong>and</strong> Canal as early as1920. This parasite attaches itself to almost any kind offish <strong>and</strong> kills the victim by sucking out its blood(Figure 12-9, p. 235). Over the years it has depleted populationsof many important sport fish species such aslake trout.The United States <strong>and</strong> Canada keep the lampreypopulation down by applying a chemical that killstheir larvae in their spawning streams—at a cost ofabout $15 million a year.In 1986, larvae of the zebra mussel (Figure 12-9,p. 235) arrived in ballast water discharged from aEuropean ship near Detroit, Michigan. This thumbnailsizednonnative species reproduces rapidly <strong>and</strong> has noknown natural enemies in the Great Lakes. As a result,it has displaced other mussel species <strong>and</strong> depleted thefood supply for some other Great Lakes species. Themussels have also clogged irrigation pipes, shut downwater intake systems for power plants <strong>and</strong> city watersupplies, fouled beaches, <strong>and</strong> grown in huge masseson boat hulls, piers, pipes, rocks, <strong>and</strong> almost any exposedaquatic surface. This mussel has also spread tofreshwater communities in parts of southern Canada<strong>and</strong> 18 states in the United States.Possible good news. In 2001, scientists at Indiana’sPurdue University Calumet reported on the use of anoscillating dipole apparatus to produce what is popularlyknown as a “zebra mussel death ray.” It emits extremelylow frequency electromagnetic waves that cankill zebra mussels, apparently without harming theenvironment or other species. This approach is beingevaluated. New methods for treating ballast waterhave also been developed (Individuals Matter, p. 257).Zebra mussels may not be good for us <strong>and</strong> somefish species but they can benefit a number of aquaticplants. By consuming algae <strong>and</strong> other microorganisms,the mussels increase water clarity, which permitsdeeper penetration of sunlight <strong>and</strong> more photosynthesis.This allows some native plants to thrive <strong>and</strong> returnthe plant composition of Lake Erie (<strong>and</strong> presumablyother lakes) closer to what it was 100 years ago. Becausethe plants provide food <strong>and</strong> increase dissolved oxygen,their comeback may benefit certain aquatic animals.More bad news. In 1991, a larger <strong>and</strong> potentiallymore destructive species, the quagga mussel, invadedthe Great Lakes, probably discharged in the ballastwater of a Russian freighter. It can survive at greaterdepths <strong>and</strong> tolerate more extreme temperatures thanthe zebra mussel. There is concern that it may eventuallycolonize areas such as Chesapeake Bay <strong>and</strong> waterwaysin parts of Florida.The Asian carp is also expected to reach the GreatLakes soon. These highly prolific fish, which canquickly grow as long as 1.2 meters (4 feet) <strong>and</strong> weighup to 50 kilograms (110 pounds), have no naturalpredators in the Great Lakes.Case Study: Managing the Columbia RiverBasin for People <strong>and</strong> Salmon: A DifficultBalancing ActConstructing a large number of dams along theColumbia River has provided many human benefitsbut has threatened wild salmon populations.Rivers <strong>and</strong> streams provide important ecological <strong>and</strong>economic services (Figure 13-12). But these servicescan be disrupted by overfishing, pollution, dams, <strong>and</strong>Puget SoundPACIFIC OCEANBRITISH COLUMBIAWASHINGTONBonnevilleDamPortl<strong>and</strong>WillametteValleyGr<strong>and</strong> CouleeDamSeattleOREGONCALIFORNIANatural CapitalEcological Services of Rivers• Deliver nutrients to sea to help sustaincoastal fisheries• Deposit silt that maintains deltas• Purify water• Renew <strong>and</strong> renourish wetl<strong>and</strong>s• Provide habitats for wildlifeFigure 13-12 Natural capital: important ecological servicesprovided by rivers.Yaki maColumbia RiverPelton DamSpokaneRiverRiverColumbiaRiverSnakeNEVADAHell’s CanyonDamIDAHOPayette RiverBoiseSnake RiverCityDamALBERTACANADAUNITED STATESUTAHSASKATCHEWANMONTANAFigure 13-13 Degraded natural capital: the Columbia Riverbasin. (Data from Northwest Power Planning Council)WYOMING268 CHAPTER 13 Sustaining Aquatic Biodiversity
water withdrawal for irrigation. An example of suchdisruption is the Columbia River—North America’sfourth largest river (Figure 13-13).This basin has the world’s largest hydroelectricpower system. It has 119 dams, 19 of which are majorgenerators of inexpensive hydroelectric power. It alsosupplies municipal <strong>and</strong> industrial water for severalmajor urban areas <strong>and</strong> is a source of water for irrigatinglarge areas of agricultural l<strong>and</strong>.Salmon are migratory fish that spawn in the upperreaches of streams <strong>and</strong> rivers. <strong>Their</strong> offspring migratedownstream to the ocean, where they spend most oftheir adult lives. The adults complete their life cycle byreturning to their place of birth to spawn <strong>and</strong> die (Figure13-14, left). A series of dams <strong>and</strong> extensive forestclearing of l<strong>and</strong> adjacent to stream banks can severelydisrupt the salmon life cycle because salmon need freeflowing rivers to return, spawn, <strong>and</strong> lay eggs at thesites where they were hatched. This requires not cuttingnearby forests that can cloud salmon spawningsites with silt <strong>and</strong> cover spawned eggs. In other words,salmon need nearby intact forests.In 2001 research by ecologist Thomas Reimichenindicated that salmon can improve the health of thenearby forests. This occurs because bears feeding onlarge amounts of the salmon strew half-eaten salmonFish change formHuman captureFish enter rivers<strong>and</strong> head forspawning areasSalmonprocessingplantTo hatcheryIn the fall spawning salmondeposit eggs in gravel nests <strong>and</strong> dieGrow to maturityin Pacific Oceanin 1–2 yearsNormalLifeCycleFry hatch in the spring . . .ModifiedLifeCycleEggs are taken from adultfemales <strong>and</strong> fertilized withsperm “milked” from malesGrow to smolt<strong>and</strong> enter the ocean . . .And grow in the streamfor 1–2 yearsEggs <strong>and</strong> young arecared for in the hatcheryFingerlings migrate downstream . . .Fingerlings arereleased into riverFigure 13-14 Normal life cycle of wild salmon (left) <strong>and</strong> human-modified life cycle of hatchery-raised salmon(right). Salmon spend part of their lives in fresh water <strong>and</strong> part in salt water.http://biology.brookscole.com/miller14269
carcasses on the forest floor. As they decompose thecarcasses help fertilize the forest <strong>and</strong> provide food fora variety of insects <strong>and</strong> other scavengers. Anotherstudy indicated that trees in forests along streams inthe Pacific Northwest with healthy salmon populationsgrow up to three times faster than those alongstreams without salmon.Thus such forests <strong>and</strong> salmon need each other forgood health. Since the dams were built, the ColumbiaRiver’s wild Pacific salmon population has droppedby 94% <strong>and</strong> nine Pacific Northwest salmon species arelisted as endangered or threatened. The dams are notthe only cause of this decline. Other factors includeoverfishing of salmon in the Pacific Ocean, destructionof salmon spawning grounds in streams by sedimentfrom logging <strong>and</strong> mining, <strong>and</strong> withdrawals of waterfor irrigation <strong>and</strong> other human uses. Also, the lack ofshade in salmon spawning streams where all of thetrees have been cut makes the water too hot for survivalof salmon eggs.Commercial fishing operations have modified thewild salmon’s natural cycle by using salmon ranching,a form of aquaculture in which salmon eggs <strong>and</strong>young are raised in a hatchery <strong>and</strong> then released (Figure13-14, right). But ranch salmon that escape <strong>and</strong> interbreedwith wild ones reduce the genetic diversity ofthe wild fish <strong>and</strong> their ability to survive.In 1980, the U.S. Congress passed the NorthwestPower Act. It has two main goals, which often conflictwith one another. One was to develop <strong>and</strong> implementlong-range plans to meet the region’s electricity needs.The other was to rebuild wild <strong>and</strong> hatchery-raisedsalmon <strong>and</strong> other fish populations.Figure 13-15 lists some of the strategies that havebeen used to help restore wild salmon populations.The federal government has spent over $3 billion inefforts to save the salmon but none have been effective.<strong>Environmental</strong>ists, Native American tribes, <strong>and</strong>commercial salmon fishers want the government toremove four small hydroelectric dams on the lowerSnake River in Washington to restore salmon spawninghabitat. Farmers, barge operators, <strong>and</strong> aluminumworkers argue that removing the dams would hurt localeconomies by reducing irrigation water, eliminatingcheap transportation of commodities by ship in theaffected areas, <strong>and</strong> reducing the supply of cheap electricityfor industries <strong>and</strong> consumers.Can this wild salmon restoration project work? Noone knows because it will take decades to see whetherthe salmon populations can be rebuilt. Despite problems,this program demonstrates that people with diverse<strong>and</strong> often conflicting economic, political, <strong>and</strong> environmentalinterests can work together to try newideas <strong>and</strong> develop potentially sustainable solutions tocomplex resource management issues. It is an exampleof a large-scale reconciliation ecology project.Critics of this expensive salmon restoration programargue that populations of wild salmon are stablein Alaska, so we should not care that wild salmon aredeclining in the Pacific Northwest. They also contendthat the economic costs to the hydroelectric power,shipping, <strong>and</strong> timber industries <strong>and</strong> to farmers <strong>and</strong>consumers exceed the value of saving wild salmon.Some have worked to restore salmon populations inspecific streams (Individuals Matter, below).xHOW WOULD YOU VOTE? Should federal efforts to rebuildwild salmon populations in the Columbia River Basin be ab<strong>and</strong>oned?Cast your vote online at http://biology.brookscole.com/miller14.The Man Who Planted Trees to Restore a StreamINDIVIDUALSMATTERIn 1980 heart problemsforced JohnBeal, an engineerwith the BoeingCompany, to takesome time off. Toimprove his health he began takingdaily walks. His strolls took him bya small stream called Hamm Creekthat flows from the southwest hillsof Seattle, Washington, into theDuwamish River that empties intoPuget Sound.He remembered when thestream was a spawning ground forsalmon <strong>and</strong> evergreen trees lined itsbanks. Now the polluted streamhad no fish <strong>and</strong> the trees weregone.He decided to restore HammCreek. He persuaded companies tostop polluting the creek <strong>and</strong> hauledout many truckloads of garbage.Then he began a 15-year project ofplanting thous<strong>and</strong>s of trees alongthe stream’s banks. He also restorednatural waterfalls <strong>and</strong> ponds <strong>and</strong>salmon spawning beds.At first he worked alone, butword spread <strong>and</strong> other peoplejoined him. TV news reports <strong>and</strong>newspaper articles about therestoration project brought morevolunteers.The creek’s water now runsclear, its vegetation has been restored,<strong>and</strong> salmon have returnedto spawn. His reward is the personalsatisfaction he feels abouthaving made a difference forHamm Creek <strong>and</strong> his community.His dedication to making the worlda better place is an outst<strong>and</strong>ing exampleof the idea that all sustainabilityis local.270 CHAPTER 13 Sustaining Aquatic Biodiversity
SolutionsRebuilding Salmon PopulationsBuilding upstream hatcheriesReleasing juvenile salmon from hatcheries tounderpopulated streamsReleasing extra water from dams to wash juvenilesalmon downstreamBuilding fish ladders so adult salmon can bypass damsduring upstream migrationUsing trucks <strong>and</strong> barges to transport salmon around damsReducing silt runoff from logging roads above salmonspawning streamsBanning dams from some stream areasFigure 13-15 Solutions: Some strategies used to rebuildsalmon populations in the Columbia River basin.How Can Freshwater Fisheries Be Managed<strong>and</strong> Sustained? Encourage Some Species<strong>and</strong> Discourage OthersFreshwater fisheries can be sustained by building<strong>and</strong> protecting populations of desirable species,preventing overfishing, <strong>and</strong> decreasing populationsof less desirable species.Sustainable management of freshwater fish involvesencouraging populations of commercial <strong>and</strong> sport fishspecies, preventing such species from being overfished,<strong>and</strong> reducing or eliminating populations of lessdesirable species. Ways to do this include regulatingthe time <strong>and</strong> length of fishing seasons <strong>and</strong> the number<strong>and</strong> size of fish that can be taken.Other techniques include building reservoirs <strong>and</strong>farm ponds <strong>and</strong> stocking them with fish, fertilizing nutrient-poorlakes <strong>and</strong> ponds, <strong>and</strong> protecting <strong>and</strong> creatingfish spawning sites. In addition, fishery managerscan protect fish habitats from sediment buildup <strong>and</strong>other forms of pollution, prevent excessive growth ofaquatic plants from large inputs of plant nutrients, <strong>and</strong>build small dams to control water flow.Improving habitats, breeding genetically resistantfish varieties, <strong>and</strong> using antibiotics <strong>and</strong> disinfectantscan control predators, parasites, <strong>and</strong> diseases. Hatcheriescan be used to restock ponds, lakes, <strong>and</strong> streamswith prized species such as trout <strong>and</strong> salmon, <strong>and</strong> entireriver basins can be managed to protect valuedspecies such as salmon. Some individuals haveworked to help restore degraded streams.How Can Wild <strong>and</strong> Scenic Rivers BeProtected <strong>and</strong> Restored? Let More of ThemRun FreeA federal law helps protect a tiny fraction ofU.S. wild <strong>and</strong> scenic rivers from dams <strong>and</strong> otherforms of development.In 1968, the U.S. Congress passed the National Wild<strong>and</strong> Scenic Rivers Act. It established the NationalWild <strong>and</strong> Scenic Rivers System to protect rivers <strong>and</strong>river segments with outst<strong>and</strong>ing scenic, recreational,geological, wildlife, historical, or cultural values.Congress established a three-tiered classificationscheme. Wild rivers are rivers or segments of rivers thatare relatively inaccessible <strong>and</strong> untamed <strong>and</strong> that arenot permitted to be widened, straightened, dredged,filled, or dammed. The only activities allowed arecamping, swimming, nonmotorized boating, sporthunting, <strong>and</strong> sport <strong>and</strong> commercial fishing.Scenic rivers are free of dams, mostly undeveloped,accessible in some places by roads, <strong>and</strong> of great scenicvalue. Recreational rivers are rivers or sections of riversthat are readily accessible by roads <strong>and</strong> that may havesome dams or development along their shores.Currently only 0.2% of the country’s 6 millionkilometers (3.5 million miles) are protected by theWild <strong>and</strong> Scenic Rivers System. In contrast, dams <strong>and</strong>reservoirs are found on 17% of the country’s total riverlength.<strong>Environmental</strong>ists urge Congress to add 1,500additional river segments to the system, a goal vigorouslyopposed by some local communities <strong>and</strong> antienvironmentalgroups. Achieving this goal wouldprotect about 2% of the country’s river systems. Thatis still 98% for us <strong>and</strong> only 2% for the wild rivers <strong>and</strong>their species.In this chapter we have seen that threats to aquaticbiodiversity are real <strong>and</strong> growing <strong>and</strong> are even greaterthan threats to terrestrial biodiversity. Keys to sustaininglife in the earth’s aquatic systems include greatly increasingresearch to learn more about aquatic life,greatly exp<strong>and</strong>ing efforts to protect <strong>and</strong> restore aquaticbiodiversity, <strong>and</strong> promoting integrated ecological managementof connected terrestrial <strong>and</strong> aquatic systems.These things can be done if enough people insist on it.To promote conservation, fishers <strong>and</strong> officials need to viewfish as a part of a larger ecological system, rather than simplyas a commodity to extract.ANNE PLATT MCGINNCRITICAL THINKING1. What three actions would you take to deal with theecological <strong>and</strong> economic problems of Africa’s LakeVictoria?http://biology.brookscole.com/miller14271
2. Why is marine biodiversity higher (a) near coasts thanin the open sea <strong>and</strong> (b) on the ocean’s bottom than at itssurface?3. Why is it more difficult to identify <strong>and</strong> protect endangeredmarine species than to protect such species on l<strong>and</strong>?4. List three methods for using the precautionary principleas a way to manage marine fisheries <strong>and</strong> help protectmarine biodiversity.5. Should fishers harvesting fish from a country’s publiclyowned waters be required to pay the government(taxpayers) fees for the fish they catch? Explain. If yourlivelihood depended on commercial fishing, would yoube for or against such fees?6. Are you for or against using Individual TransferQuotas (p. 265) as the major method for managing fisheries?Explain. What are the alternatives?7. Are you for or against using mitigation banking tohelp sustain wetl<strong>and</strong>s? Explain. What restrictions, if any,would you put on such activities?8. Congratulations! You are in charge of protecting theworld’s aquatic biodiversity. List the three most importantpoints of your policy to accomplish this goal.PROJECTS1. Survey the condition of a nearby wetl<strong>and</strong>, coastalarea, river, or stream. Has its condition improved ordeteriorated during the last 10 years? What local, state, ornational efforts are being used to protect this aquatic system?Develop a plan for protecting it.2. Work with your classmates to develop an experimentin aquatic reconciliation ecology for your campus or localcommunity.3. Use the library or the Internet to find bibliographic informationabout G. Carleton Ray <strong>and</strong> Anne Platt McGinn,whose quotes appear at the beginning <strong>and</strong> end of thischapter.4. Make a concept map of this chapter’s major ideas, usingthe section heads, subheads, <strong>and</strong> key terms (in boldface).Look on the website for this book about how toprepare concept maps.LEARNING ONLINEThe website for this book contains study aids <strong>and</strong> manyideas for further reading <strong>and</strong> research. They include achapter summary, review questions for the entire chapter,flash cards for key terms <strong>and</strong> concepts, a multiple-choicepractice quiz, interesting Internet sites, references, <strong>and</strong> aguide for accessing thous<strong>and</strong>s of InfoTrac ® College Editionarticles. Log on tohttp://biology.brookscole.com/miller14Then click on the Chapter-by-Chapter area, choose Chapter13, <strong>and</strong> select a learning resource.272 CHAPTER 13 Sustaining Aquatic Biodiversity
14 Food<strong>and</strong> Soil ResourcesSoilBiodiversityCASE STUDYGrowing Perennial Cropson the Kansas Prairieby Copying NatureThink about farms in Kansas <strong>and</strong> you probably pictureseemingly endless fields of wheat or corn plowedup <strong>and</strong> planted each year. By 2040, the picture mightchange, thanks to pioneering research at the nonprofitL<strong>and</strong> Institute near Salina, Kansas.The institute, headed by plant geneticist WesJackson, is experimenting with an ecological approachto agriculture on the midwestern prairie. It relies onplanting a mixture of different crops in the same area,a technique called polyculture. This involves planting amix of perennial grasses (Figure 14-1, right), legumes(a source of nitrogen fertilizer, Figure 14-1, left), sunflowers,grain crops, <strong>and</strong> plants that provide naturalinsecticides in the same field.The goal is to raise food by mimicking many ofthe natural conditions of the prairie without losingfertile grassl<strong>and</strong> soil. Institute researchers believe thatperennial polyculture can be blended with modern monocultureto help reduce the latter’s harmful environmentaleffects.Because these plants are perennials, there is noneed to plow up <strong>and</strong> prepare the soil each year to replantthem. This takes much less labor than conventionalmonoculture or diversified organic farms thatgrow annual crops. It also reduces soil erosion becausethe unplowed soil is not exposed to wind <strong>and</strong>rain. And it reduces the need for irrigation becausethe deep roots of such perennials retain more waterthan annuals. There is also less pollution from chemicalfertilizers <strong>and</strong> pesticides. This sounds like a winwinsolution.Thirty-six years of research by the institute haveshown that various mixtures of perennials grown inparts of the midwestern prairie could be used as importantsources of food. One such mix of perennialcrops includes eastern grama grass (a warm-seasongrass that is a relative of corn with three times asmuch protein as corn <strong>and</strong> twice as much as wheat;Figure 14-1, right), mammoth wildrye (a cool-seasongrass distantly related to rye, wheat, <strong>and</strong> barley), Illinoisbundleflower (a wild nitrogen-producing legumethat can enrich the soil <strong>and</strong> whose seeds can serve aslivestock feed; Figure 14-1, left), <strong>and</strong> Maximilian sunflower(which produces seeds with as much protein assoybeans).This important research may eventually helpus come closer to producing <strong>and</strong> distributing enoughfood to meet everyone’s basic nutritional needs <strong>and</strong>doing this without degrading the soil, water, air,<strong>and</strong> biodiversity that support all food production.However, this will require more evaluation of thecosts involved <strong>and</strong> the feasibility of integrating suchpractices into conventional agricultural productionsystems.Figure 14-1 Solutions: The L<strong>and</strong> Institute in Salina,Kansas, is a farm, a prairie laboratory, <strong>and</strong> a schooldedicated to changing the way we grow food. It advocatesgrowing a diverse mixture (polyculture) of edibleperennial plants to supplement traditional annualmonoculture crops. Two of these perennial crops areeastern grama grass (bottom) <strong>and</strong> the Illinois bundleflower(top left).
There are two spiritual dangers in not owning a farm. One isthe danger of supposing that breakfast comes from the grocery,<strong>and</strong> the other that heat comes from the furnace.ALDO LEOPOLDThis chapter analyzes the world’s crop, meat, <strong>and</strong> fishproduction systems <strong>and</strong> how they can be made moresustainable. It addresses the following questions:■■■■■■■How is the world’s food produced?How are green revolution <strong>and</strong> traditional methodsused to raise crops?How are soils being degraded <strong>and</strong> eroded, <strong>and</strong>what can be done to reduce these losses?How much has food production increased, howserious is malnutrition, <strong>and</strong> what are the environmentaleffects of producing food?How can we increase production of crops, meat,<strong>and</strong> fish <strong>and</strong> shellfish?How do government policies affect foodproduction?How can we design <strong>and</strong> shift to more sustainableagricultural systems?14-1 HOW IS FOOD PRODUCED?What Systems Provide Us with Food?The Challenges AheadCropl<strong>and</strong>s, rangel<strong>and</strong>s, <strong>and</strong> ocean fisheriessupply most of our food <strong>and</strong> since 1950production from all three systems has increaseddramatically.Historically, humans have depended on three systemsfor their food supply. Cropl<strong>and</strong>s mostly produce grains,<strong>and</strong> provide about 77% of the world’s food. Rangel<strong>and</strong>sproduce meat, mostly from grazing livestock, <strong>and</strong>supply about 16% of the world’s food. Ocean fisheriessupply about 7% of the world’s food.Since 1950 there has been a staggering increase inglobal food production from all three systems. Thisoccurred because of technological advances such asincreased use of tractors <strong>and</strong> farm machinery <strong>and</strong>high-tech fishing boats <strong>and</strong> gear; inorganic chemicalfertilizers; irrigation; pesticides; high-yield varieties ofwheat, rice, <strong>and</strong> corn; densely populated feedlots <strong>and</strong>enclosed pens for raising cattle, pigs, <strong>and</strong> chickens;<strong>and</strong> aquaculture ponds <strong>and</strong> ocean cages for raisingsome types of fish <strong>and</strong> shellfish.We face important challenges in increasing foodproduction without causing serious environmentalharm. To feed the world’s 8.9 billion people projectedto exist in 2050, we must produce <strong>and</strong> equitably distributemore food than has been produced since agriculturebegan about 10,000 years ago, <strong>and</strong> do it in anenvironmentally sustainable manner.Can we do this? Some analysts say we can, mostlyby using genetic engineering (Figure 5-11, p. 98). Othershave doubts. They are concerned that environmentaldegradation, pollution, lack of water for irrigation,overgrazing by livestock, overfishing, <strong>and</strong> loss of vitalecological services may limit future food production.A key problem is that human activities continue totake over or degrade more of the planet’s net primaryproductivity, which supports all life.We also face the challenge of sharply reducingpoverty because about one out of five people do nothave enough l<strong>and</strong> to grow their own food or enoughmoney to buy sufficient food—regardless of howmuch is available.What Plants <strong>and</strong> Animals Feed the World?Our Three Most Important CropsWheat, rice, <strong>and</strong> corn provide more than halfof the calories in the food consumed by the world’speople.The earth has perhaps 30,000 plant species with partsthat people can eat. Since the beginning of agricultureabout 10,000 of the species have been used as a sourceof food for people <strong>and</strong> livestock. Today only 14 plant<strong>and</strong> 8 terrestrial animal species supply an estimated90% of our global intake of calories. Just three graincrops—wheat, rice, <strong>and</strong> corn—provide more than halfthe calories people consume. These three grains, <strong>and</strong>most other food crops, are annuals, whose seeds mustbe replanted each year. This dependence on just a fewplant species for food represents a dramatic reductionin agricultural biodiversity.Two-thirds of the world’s people survive primarilyon traditional grains (mainly rice, wheat, <strong>and</strong> corn),mostly because they cannot afford meat. As incomesrise most people consume more meat <strong>and</strong> other productsof domesticated livestock, which in turn meansmore grain consumption by those animals.Fish <strong>and</strong> shellfish are an important source of foodfor about 1 billion people, mostly in Asia <strong>and</strong> in coastalareas of developing countries. But on a global scalefish <strong>and</strong> shellfish supply only 7% of the world’s food<strong>and</strong> about 6% of the protein in the human diet.What Are the Major Types of FoodProduction? High-Input <strong>and</strong> Low-InputAgricultureAbout 80% of the world’s food supply isproduced by industrialized agriculture <strong>and</strong> 20% bysubsistence agriculture.274 CHAPTER 14 Food <strong>and</strong> Soil Resources
Industrialized agricultureShifting cultivationPlantation agricultureNomadic herdingIntensive traditional agricultureNo agricultureFigure 14-2 Locations of the world’s principal types of food production. Excluding Antarctica <strong>and</strong> Greenl<strong>and</strong>,agricultural systems cover almost one-third of the earth’s l<strong>and</strong> surface.There are two major types of agricultural systems: industrialized<strong>and</strong> traditional. Industrialized agriculture,or high-input agriculture, uses large amounts of fossilfuel energy, water, commercial fertilizers, <strong>and</strong> pesticidesto produce single crops (monocultures) or livestockanimals for sale. Practiced on about a fourth of allcropl<strong>and</strong>, mostly in developed countries (Figure 14-2),high-input industrialized agriculture has spread sincethe mid-1960s to some developing countries.Plantation agriculture is a form of industrializedagriculture used primarily in tropical developingcountries. It involves growing cash crops (such as bananas,coffee, soybeans, sugarcane, cocoa, <strong>and</strong> vegetables)on large monoculture plantations, mostly for salein developed countries.An increasing amount of livestock production indeveloped countries is industrialized. Large numbersof cattle are brought to densely populated feedlots,where they are fattened up for about 4 months beforeslaughter. Most pigs <strong>and</strong> chickens in developed countriesspend their lives in densely populated pens <strong>and</strong>cages <strong>and</strong> eat mostly grain grown on cropl<strong>and</strong>.Traditional agriculture consists of two main types,which together are practiced by about 2.7 billion people(42% of the world’s people) in developing countries<strong>and</strong> provide about a fifth of the world’s foodsupply. Traditional subsistence agriculture typicallyuses mostly human labor <strong>and</strong> draft animals to produceonly enough crops or livestock for a farm family’s survival.Examples of this very low-input type of agricultureinclude numerous forms of shifting cultivation intropical forests <strong>and</strong> nomadic livestock herding.In traditional intensive agriculture, farmers increasetheir inputs of human <strong>and</strong> draft labor, fertilizer,<strong>and</strong> water to get a higher yield per area of cultivatedl<strong>and</strong>. They produce enough food to feed their families<strong>and</strong> to sell for income.Cropl<strong>and</strong>s, like natural ecosystems, provide importantecological <strong>and</strong> economic services listed in Figure14-3 (p. 276). Indeed, agriculture is the world’shttp://biology.brookscole.com/miller14275
EcologicalServicesCropl<strong>and</strong>s• Help maintain water flow <strong>and</strong>soil infiltration•Provide partial erosionprotection• Can build soil organic matter• Store atmospheric carbon•Provide wildlife habitat forsome speciesNatural CapitalEconomicServices• Food crops• Fiber crops•Crop geneticresources• JobsFigure 14-3 Natural capital: ecological <strong>and</strong> economicservices provided by cropl<strong>and</strong>s.largest industry, providing a living for one of everyfive (1.3 billion) people.14-2 PRODUCING FOOD BY GREENREVOLUTION AND TRADITIONALTECHNIQUESHow Have Green Revolutions IncreasedFood Production? High-Input Monoculturesin ActionSince 1950, most of the increase in global foodproduction has come from using high-inputagriculture to produce more crops on each unitof l<strong>and</strong>.Farmers can produce more food by farming more l<strong>and</strong>or getting higher yields per unit of area from existingcropl<strong>and</strong>. Since 1950, most of the increase in globalfood production has come from increased yields perunit of area of cropl<strong>and</strong> in a process called the greenrevolution.The green revolution involves three steps. First,develop <strong>and</strong> plant monocultures (Figure 6-25, p. 118)of selectively bred or genetically engineered highyieldvarieties of key crops such as rice, wheat, <strong>and</strong>corn. Second, produce high yields by using large inputsof fertilizer, pesticides, <strong>and</strong> water. Third, increase thenumber of crops grown per year on a plot of l<strong>and</strong>through multiple cropping.This high-input approach dramatically increasedcrop yields in most developed countries between 1950<strong>and</strong> 1970 in what is called the first green revolution (Figure14-4, blue areas).A second green revolution has been taking placesince 1967. It involves introducing fast-growing dwarfvarieties of rice (Figure 14-5) <strong>and</strong> wheat (developed byNorman Bourlag, who later received a Nobel PeacePrize for his work) into several developing countriesin tropical <strong>and</strong> subtropical climates (Figure 14-4, greenareas). Producing more food on less l<strong>and</strong> is also an importantway to protect biodiversity by saving large areasof forests, grassl<strong>and</strong>s, wetl<strong>and</strong>s, <strong>and</strong> easily erodedmountain terrain from being used to grow food.Yield increases depend not only on fertile soil <strong>and</strong>ample water but also on high inputs of fossil fuels torun machinery, produce <strong>and</strong> apply inorganic fertilizers<strong>and</strong> pesticides, <strong>and</strong> pump water for irrigation. All told,high-input green revolution agriculture uses about 8%of the world’s oil output.Case Study: Industrial Food Productionin the United States: A Success StoryAmerica’s industrialized agricultural systemproduces about 17% of the world’s grain but hasa larger environmental impact than any otherAmerican industry.In the United States industrialized farming has becomeagribusiness as big companies <strong>and</strong> larger family-ownedfarms have taken control of almost three-fourths of U.S.food production. According to environmental educatorDavid Orr, “the U.S. food system is increasingly dominatedby ‘superfarms’, which are roughly to farmingwhat WalMart is to retailing.”In total annual sales, agriculture is bigger than theautomotive, steel, <strong>and</strong> housing industries combined. Itgenerates about 18% of the country’s gross national income<strong>and</strong> almost a fifth of all jobs in the private sector,employing more people than any other industry. Withonly 0.3% of the world’s farm labor force, U.S. farmsproduce about 17% of the world’s grain <strong>and</strong> nearlyhalf of the world’s corn <strong>and</strong> soybean exports.Since 1950, U.S. farmers have used green revolutiontechniques to more than double the yield of keycrops such as wheat, corn, <strong>and</strong> soybeans without cultivatingmore l<strong>and</strong>. Such increases in the yield perhectare of key crops have kept large areas of forests,grassl<strong>and</strong>s, wetl<strong>and</strong>s, <strong>and</strong> easily erodible l<strong>and</strong> frombeing converted to farml<strong>and</strong>.In addition, the country’s agricultural system hasbecome increasingly efficient. While the U.S. output ofcrops, meat, <strong>and</strong> dairy products has been increasingsteadily since 1975, the major inputs of labor <strong>and</strong> resources—withthe exception of pesticides—to produceeach unit of that output have fallen steadily since 1950.U.S. consumers now spend only about 2% of theirincome on domestically produced food, compared toabout 11% in 1948. Adjusted for inflation, U.S. farmproducts now cost about one-third of what they did in276 CHAPTER 14 Food <strong>and</strong> Soil Resources
First green revolution(developed countries)Second green revolution(developing countries)Major international agriculturalresearch centers <strong>and</strong> seed banksFigure 14-4 Countries whose crop yields per unit of l<strong>and</strong> area increased during the two green revolutions. Thefirst (blue) took place in developed countries between 1950 <strong>and</strong> 1970; the second (green) has occurred since1967 in developing countries with enough rainfall or irrigation capacity. Several agricultural research centers<strong>and</strong> gene or seed banks (red dots) play a key role in developing high-yield crop varieties.International Rice Research Institute, ManilaFigure 14-5 Solutions: highyield,semidwarf variety of ricecalled IR-8 (left), developed aspart of the second green revolution.Crossbreeding two parentstrains of rice produced it:PETA from Indonesia (center)<strong>and</strong> DGWG from China (right).The shorter <strong>and</strong> stiffer stalksof the new variety allow theplants to support larger headsof grain without toppling over<strong>and</strong> increase the benefit ofapplying more fertilizer.http://biology.brookscole.com/miller14277
1910. People in developing countries typically spendup to 40% of their income on food. And the 1.1 billionof the world’s poor struggling to live on $1 a day orless spend about 70% of their income on food.The industrialization of agriculture has been madepossible by the availability of cheap energy, most of itfrom oil. Putting food on the table consumes about17% of all commercial energy used in the United Stateseach year (Figure 14-6). Good news. The input of energyneeded to produce a unit of food has fallen considerably<strong>and</strong> most plant crops in the United States providemore food energy than the energy used to grow them.Bad news. If we include livestock, the U.S. foodproduction system uses about three units of fossil fuelenergy to produce one unit of food energy. That energyefficiency is much lower if we look at the wholeU.S. food system. Considering the energy used togrow, store, process, package, transport, refrigerate,<strong>and</strong> cook all plant <strong>and</strong> animal food, about 10 units ofnonrenewable fossil fuel energy are needed to put 1 unit offood energy on the table. By comparison, every unit ofenergy from human labor in traditional subsistencefarming provides at least 1 unit of food energy <strong>and</strong> upto 10 units using traditional intensive farming.What Growing Techniques Are Usedin Traditional Agriculture? Low-InputAgrodiversity in ActionMany traditional farmers in developing countriesuse low-input agriculture to produce a varietyof different crops on each plot of l<strong>and</strong>.Traditional farmers in developing countries grow aboutone-fifth of the world’s food on about three-fourths ofits cultivated l<strong>and</strong>. Many traditional farmers simultaneouslygrow several crops on the same plot, a practiceknown as interplanting. Such crop diversity reducesthe chance of losing most or all of the year’s food supplyto pests, bad weather, <strong>and</strong> other misfortunes.Interplanting strategies vary. One type, polyvarietalcultivation, involves planting a plot with severalvarieties of the same crop. Another is intercropping—growing two or more different crops at the same timeon a plot (for example, a carbohydrate-rich grain thatuses soil nitrogen <strong>and</strong> a protein-rich legume that putsit back). A third type is agroforestry, or alley cropping,in which crops <strong>and</strong> trees are grown together (see IndividualsMatter, at right).A fourth type is polyculture, in which many differentplants maturing at various times are plantedtogether. Low-input polyculture has a number of advantages.There is less need for fertilizer <strong>and</strong> waterbecause root systems at different depths in the soilcapture nutrients <strong>and</strong> moisture efficiently. It providesmore protection from wind <strong>and</strong> water erosion becausethe soil is covered with crops year-round. There is littleor no need for insecticides because multiple habitatsare created for natural predators of crop-eating insects.Also, there is little or no need for herbicides becauseweeds have trouble competing with the multitude ofcrop plants. The diversity of crops raised provides insuranceagainst bad weather. This is a way of growingfood by copying nature. Wes Jackson is carrying outresearch on polyculture to grow perennial crops onprairie l<strong>and</strong> in the United States (see case study at thebeginning of this chapter).Recent ecological research found that on average,low-input polyculture produces higher yields perhectare of l<strong>and</strong> than high-input monoculture. For example,a 2001 study by ecologists Peter Reich <strong>and</strong>David Tilman found that carefully controlled polycultureplots with 16 different species of plants consistentlyoutproduced plots with 9, 4, or only 1 type ofplant species.Traditional farmers in arid <strong>and</strong> semiarid areaswith low natural soil fertility have developed innovativemethods to boost crop production. For example, inthe African countries of Niger <strong>and</strong> Burkina Faso, a4%2% 6% 5%Crops Livestock Food processingFood distribution <strong>and</strong> preparationFood production17% of total U.S.commercialenergy useFigure 14-6 In the United States, industrialized agriculture uses about 17% of all commercial energy. In theUnited States, food travels an average of 2,400 kilometers (1,500 miles) from farm to table. (Data from DavidPimentel <strong>and</strong> Worldwatch Institute)278 CHAPTER 14 Food <strong>and</strong> Soil Resources
Low-Tech Sustainable Agriculture in AfricaINDIVIDUALSMATTERIn 2003, Cubanbornsoil scientistPedro Sanchezwas awarded theWorld Food Prize,the “Nobel Prize”of agriculture. He received it for developinga low-tech <strong>and</strong> sustainableform of agriculture that has increasedcrop yields fourfold, restoreddepleted soils, <strong>and</strong> helpedmore than 150,000 Africans (most insub-Saharan Africa) escape fromhunger <strong>and</strong> poverty.Since 1992 Sanchez has beenworking with scientists in Kenya,Africa, to develop an effective cultivationsystem that grows crops <strong>and</strong>trees together.A basic problem is that manyAfrican soils are thin <strong>and</strong> often depletedof nitrogen <strong>and</strong> phosphorusafter several years of intense cropgrowing. Adding commercial inorganicfertilizers would help, butmost African farmers cannot affordthem.Sanchez <strong>and</strong> his colleagues developedthe following soil replenishment<strong>and</strong> crop-growth system todeal with these problems. First, atthe beginning of the rainy seasonfarmers plant corn in rows betweenlocal varieties of fast-growing trees(Figure 14-14c, p. 285). The corn isharvested <strong>and</strong> the trees are allowedto grow for a year.Second, just before the secondcorn-planting season the trees arecut down <strong>and</strong> their leaves are duginto the soil to add nitrogen. In addition,the trees can be used for firewood,which also helps preventdeforestation.Third, phosphorus is added tothe soil by crushing small depositsof phosphate rock found throughoutmuch of Africa. Africa’s mildlyacidic soils help dissolve the phosphatefertilizer into the soluble formof phosphate needed by corn plants.Fourth, farmers chop up theleaves <strong>and</strong> stems of a weedy shrubcalled the Mexican sunflower that isfound along many roadside <strong>and</strong>farm boundaries. They place theplant pieces in planting holes withcorn seed to provide micronutrientsneeded for healthy crop growth.This four-part technologicallysimple system can then be used toprovide food <strong>and</strong> restore depletedsoil on a more sustainable basis. Thesystem also helps empower the womenwho raise most of the crops inAfrica by bringing in extra income.farmer innovation called tassas has tripled yields on atleast 100,000 hectares (250,000) acres of unproductivel<strong>and</strong>. Tassas are small pits dug in the soil, filled withmanure, <strong>and</strong> then planted with crops once they fillwith infrequent rain.14-3 SOIL EROSION ANDDEGRADATIONWhat <strong>Causes</strong> Soil Erosion? The Big ThreeWater, wind, <strong>and</strong> people cause soil erosion.Most people in developed countries get their foodfrom grocery stores, fast-food chains, <strong>and</strong> restaurants.But we need to remind ourselves that all food comesfrom the earth or soil—the base of life. This explains whypreserving the world’s topsoil (Figure 4-25, p. 73) isthe key to producing enough food to feed the world’sgrowing population.L<strong>and</strong> degradation occurs when natural or humaninducedprocesses decrease the future ability of l<strong>and</strong> tosupport crops, livestock, or wild species. One type ofl<strong>and</strong> degradation is soil erosion: the movement of soilcomponents, especially surface litter <strong>and</strong> topsoil fromone place to another. The two main agents of erosionare flowing water <strong>and</strong> wind, with water causing mostsoil erosion (see photo on p. ix, right).Some soil erosion is natural <strong>and</strong> some is caused byhuman activities. In undisturbed vegetated ecosystems,the roots of plants help anchor the soil, <strong>and</strong> usuallysoil is not lost faster than it forms. Soil becomesmore vulnerable to erosion through human activitiesthat destroy plant cover, including farming, logging,construction, overgrazing by livestock, off-road vehicleuse, <strong>and</strong> deliberate burning of vegetation.Soil erosion has two major harmful effects. One isloss of soil fertility through depletion of plant nutrientsin topsoil. The other harmful effect occurs wheneroded soil ends up as sediment in nearby surface waters,where it can pollute water, kill fish <strong>and</strong> shellfish,<strong>and</strong> clog irrigation ditches, boat channels, reservoirs,<strong>and</strong> lakes.Soil, especially topsoil, is classified as a renewableresource because natural processes regenerate it. However,if topsoil erodes faster than it forms on a piece ofl<strong>and</strong>, it eventually becomes nonrenewable.How Serious Is Global Soil Erosion? MostlyBad NewsSoil is eroding faster than it is forming on more than athird of the world’s cropl<strong>and</strong>, <strong>and</strong> much of this l<strong>and</strong>also suffers from salt buildup <strong>and</strong> waterlogging.A 1992 joint survey by the United Nations (UN)Environment Programme <strong>and</strong> the World ResourcesInstitute estimated that topsoil is eroding faster than itforms on about 38% of the world’s cropl<strong>and</strong> (Figure14-7, p. 280). According to a 2000 study by theConsultative Group on International AgriculturalResearch, soil erosion <strong>and</strong> degradation has reducedfood production on about 16% of the world’s cropl<strong>and</strong>.http://biology.brookscole.com/miller14279
Areas of serious concernAreas of some concernStable or nonvegetative areasFigure 14-7 Natural capital degradation: global soil erosion. (Data from UN Environment Programme <strong>and</strong> theWorld Resources Institute)Soil expert David Pimentel estimates that worldwidesoil erosion causes damages of at least $375 billion peryear (an average of $42 million per hour), including directdamage to agricultural l<strong>and</strong>s <strong>and</strong> indirect damageto waterways, infrastructure, <strong>and</strong> human health. Seehis Guest Essay on this subject on the website for thischapter.Some analysts contend that erosion estimates areoverstated because they underestimate the abilities ofsome local farmers to restore degraded l<strong>and</strong>. The UNFood <strong>and</strong> Agriculture Organization (FAO) also pointsout that much of the eroded topsoil does not go far <strong>and</strong>is deposited further down a slope, valley, or plain. Insome places, the loss in crop yields in one area couldbe offset by increased yields elsewhere.Case Study: Soil Erosion in the United StatesToday; Some Hopeful NewsSoil in the United States erodes faster than it formson most cropl<strong>and</strong>, but since 1987 erosion has beencut by about two-thirds.In the 1930s, several midwestern states lost largeamounts of topsoil as a result of poor cultivation practices<strong>and</strong> prolonged drought (Case Study, next page).This taught the country some important lessons aboutthe need for soil conservation.The situation has improved dramatically sincethen. But according to the Natural Resources ConservationService, soil on cultivated l<strong>and</strong> in the UnitedStates is still eroding about 16 times faster than it canform. Erosion rates are even higher in heavily farmedregions. An example is the Great Plains, which has lostone-third or more of its topsoil in the 150 years since itwas first plowed.Good news. Of the world’s major food-producingnations, only the United States is sharply reducingsome of its soil losses through a combination of plantingcrops without disturbing the soil <strong>and</strong> governmentsponsoredsoil conservation programs.The 1985 Food Security Act (Farm Act) establisheda strategy for reducing soil erosion in the UnitedStates. In the first phase of this program, farmers receivea subsidy for taking highly erodible l<strong>and</strong> out ofproduction <strong>and</strong> replanting it with soil-saving grass ortrees for 10–15 years. In 2003, roughly one-tenth of U.S.cropl<strong>and</strong> was in this Conservation Reserve Program(CRP).280 CHAPTER 14 Food <strong>and</strong> Soil Resources
According to the U.S. Department of Agriculture,since 1985 this program has cut soil losses on cropl<strong>and</strong>in the United States by about two-thirds. And between1982 <strong>and</strong> 1997, the area of U.S. farml<strong>and</strong> with thegreatest potential for wind erosion <strong>and</strong> water erosiondecreased by nearly one-third. If lawmakers continueto support this program, it could eventually cut suchsoil losses as much as 80%.A second provision of the Farm Act authorizes thegovernment to forgive all or part of farmers’ debts tothe Farmers Home Administration if they agree not tofarm highly erodible cropl<strong>and</strong> or wetl<strong>and</strong>s for 50years. The farmers must plant trees or grass on thisl<strong>and</strong> or restore it to wetl<strong>and</strong>.These efforts to slow soil erosion are important.But effective soil conservation is practiced today ononly about half of all U.S. agricultural l<strong>and</strong> <strong>and</strong> onabout half of the country’s most erodible cropl<strong>and</strong>.Case Study: The Dust Bowl: An<strong>Environmental</strong> Lesson from NatureIn the 1930s, a large area of cropl<strong>and</strong> in the midwesternUnited States had to be ab<strong>and</strong>oned becauseof severe soil erosion caused by a combination ofpoor cultivation practices <strong>and</strong> prolonged drought.In the 1930s, Americans learned a harsh environmentallesson when much of the topsoil in several dry <strong>and</strong>windy midwestern states was lost through a combinationof poor cultivation practices <strong>and</strong> prolongeddrought.Before settlers began grazing livestock <strong>and</strong> plantingcrops there in the 1870s, the deep <strong>and</strong> tangled rootsystems of native prairie grasses anchored the fertiletopsoil firmly in place. But plowing the prairie tore upthese roots, <strong>and</strong> the agricultural crops the settlersplanted annually in their place had less extensive rootsystems.After each harvest, the l<strong>and</strong> was plowed <strong>and</strong> leftbare for several months, exposing it to high winds.Overgrazing by livestock in some areas also destroyedlarge expanses of grass, denuding the ground.The stage was set for severe wind erosion <strong>and</strong>crop failures; all that was needed was a long drought.One came between 1926 <strong>and</strong> 1937 when the annualprecipitation dropped by about almost two-thirds. Inthe 1930s, dust clouds created by hot, dry windstormsblowing across the barren exposed soil darkened thesky at midday in some areas; rabbits <strong>and</strong> birds chokedto death on the dust.During May 1934, a cloud of topsoil blown off theGreat Plains traveled some 2,400 kilometers (1,500miles) <strong>and</strong> blanketed most of the eastern UnitedStates with dust. Laundry hung out to dry by womenin Georgia quickly became covered with dust blownin from the Midwest. Journalists gave the worst-hitColoradoNew MexicoMEXICODustBowlKansasOklahomaTexasFigure 14-8 The Dust Bowl of the Great Plains, where a combinationof extreme drought <strong>and</strong> poor soil conservation practicesled to severe wind erosion of topsoil in the 1930s.part of the Great Plains a new name: the Dust Bowl(Figure 14-8).During the “dirty thirties,” large areas of cropl<strong>and</strong>were stripped of topsoil <strong>and</strong> severely eroded. Thistriggered one of the largest internal migrations in U.S.history. Thous<strong>and</strong>s of farm families from Oklahoma,Texas, Kansas, <strong>and</strong> Colorado ab<strong>and</strong>oned their dustchokedfarms <strong>and</strong> dead livestock <strong>and</strong> migrated toCalifornia or to the industrial cities of the Midwest <strong>and</strong>East. Most found no jobs because the country was inthe midst of the Great Depression.In May 1934, Hugh Bennett of the U.S. Departmentof Agriculture (USDA) went before a congressionalhearing in Washington to plead for new programsto protect the country’s topsoil. Lawmakerstook action when Great Plains dust began seeping intothe hearing room.In 1935, the United States passed the Soil ErosionAct, which established the Soil Conservation Service(SCS) as part of the USDA. With Bennett as its firsthead, the SCS (now called the Natural ResourcesConservation Service) began promoting sound soilconservation practices, first in the Great Plains states<strong>and</strong> later elsewhere. Soil conservation districts wereformed throughout the country, <strong>and</strong> farmers <strong>and</strong>ranchers were given technical assistance in setting upsoil conservation programs.What Is Desertification, <strong>and</strong> How SeriousIs It? Decreasing L<strong>and</strong> ProductivityAbout one-third of the world’s l<strong>and</strong> has lost someof its productivity from a combination of drought<strong>and</strong> human activities that reduce or degradetopsoil.In desertification, the productive potential of arid orsemiarid l<strong>and</strong> falls by 10% or more because of a combinationof natural climate change that causes prolongeddrought <strong>and</strong> human activities that reduce or degradehttp://biology.brookscole.com/miller14281
ModerateSevereVery severeFigure 14-9 Natural capital degradation: desertification of arid <strong>and</strong> semiarid l<strong>and</strong>s. It is caused by a combinationof prolonged drought <strong>and</strong> human activities that expose soil to erosion. (Data from UN EnvironmentProgramme <strong>and</strong> Harold E. Drengue)topsoil. The process can be moderate (a 10–25% drop inproductivity), severe (a 25–50% drop), or very severe (adrop of 50% or more, usually creating huge gullies <strong>and</strong>s<strong>and</strong> dunes). Note that only in extreme cases does desertificationlead to what we call desert.Over thous<strong>and</strong>s of years the earth’s deserts haveexp<strong>and</strong>ed <strong>and</strong> contracted, mostly because of naturalclimate changes. However, human activities can acceleratedesertification in some parts of the world (Figure14-9). Study Figure 14-9 to find out the areas of theworld most affected by desertification. Is it a problemwhere you live?According to a 2003 UN conference on desertification,about a third of the world’s l<strong>and</strong> <strong>and</strong> 70% of alldryl<strong>and</strong>s is suffering from the effects of desertification.UN officials estimate that this loss of soil productivitythreatens the livelihoods of at least 250 million peoplein 110 countries (70 in Africa). China is facing seriousdesertification, as its portion of the Gobi Desert exp<strong>and</strong>edby an area half the size of Pennsylvania between1994 <strong>and</strong> 1999.Figure 14-10 summarizes the major causes <strong>and</strong>consequences of desertification. We cannot controlwhen or where prolonged droughts may occur, but wecan reduce overgrazing, deforestation, <strong>and</strong> destructiveforms of planting, irrigation, <strong>and</strong> mining that leavesoil barren. We can also restore l<strong>and</strong> suffering from desertificationby planting trees <strong>and</strong> grasses that anchorsoil <strong>and</strong> hold water.How Do Excess Salts <strong>and</strong> Water DegradeSoils? Crop Losses from Too Much Salt<strong>and</strong> WaterRepeated irrigation can cause loss of cropproductivity by salt buildup in the soil <strong>and</strong>waterlogging of crop plants.The one-fifth of the world’s cropl<strong>and</strong> that is irrigatedproduces almost 40% of the world’s food. But irrigationhas a downside. Most irrigation water is a dilutesolution of various salts, picked up as the water flowsover or through soil <strong>and</strong> rocks. Irrigation water not ab-282 CHAPTER 14 Food <strong>and</strong> Soil Resources
OvergrazingDeforestationErosion<strong>Causes</strong>SalinizationSoil compactionNatural climatechangeConsequencesWorsening droughtFamineEconomic lossesLower livingst<strong>and</strong>ards<strong>Environmental</strong>refugeesFigure 14-10 <strong>Causes</strong> <strong>and</strong> consequences of desertification.sorbed into the soil evaporates, leaving behind a thincrust of dissolved salts (such as sodium chloride) inthe topsoil.Repeated annual applications of irrigation waterlead to the gradual accumulation of salts in the uppersoil layers. This accumulation of salts is called salinization(Figure 14-11). It stunts crop growth, lowerscrop yields, <strong>and</strong> eventually kills plants <strong>and</strong> ruins thel<strong>and</strong> (see figure on p. ix, left).EvaporationEvaporation TranspirationEvaporationAccording to a 1995 study, severe salinization hasreduced yields on about a fifth of the world’s irrigatedcropl<strong>and</strong>, <strong>and</strong> almost another third has been moderatelysalinized. The most severe salinization occurs inAsia, especially in China, India, <strong>and</strong> Pakistan.Salinization affects almost one-fourth of irrigatedcropl<strong>and</strong> in the United States. But the proportion ismuch higher in some heavily irrigated western states.We know how to prevent <strong>and</strong> deal with soilsalinization, as summarized in Figure 14-12. But someof these remedies are expensive.Another problem with irrigation is waterlogging(Figure 14-11). Farmers often apply large amounts ofirrigation water to leach salts deeper into the soil. Butwithout adequate drainage, water accumulates underground<strong>and</strong> gradually raises the water table. SalineSolutionsSoil SalinizationWaterloggingPreventionCleanupLess permeableclay layerReduce irrigationFlushing soil(expensive <strong>and</strong>wastes water)Salinization1. Irrigation water containssmall amounts ofdissolved salts.2.Evaporation <strong>and</strong> transpirationleave saltsbehind.Waterlogging1.Precipitation <strong>and</strong>irrigation waterpercolate downward.2. Water table rises.Switch to salttolerantcrops(such as barley,cotton, sugarbeet)Not growing cropsfor 2–5 yearsInstallingundergrounddrainage systems(expensive)3. Salt builds up in soil.Figure 14-11 Natural capital degradation: salinization <strong>and</strong>waterlogging of soil on irrigated l<strong>and</strong> without adequatedrainage can decrease crop yields.Figure 14-12 Solutions: methods for preventing <strong>and</strong> cleaningup soil salinization.http://biology.brookscole.com/miller14283
water then envelops the deep roots of plants, loweringtheir productivity <strong>and</strong> killing them after prolonged exposure.At least one-tenth of the world’s irrigatedcropl<strong>and</strong> suffers from waterlogging, <strong>and</strong> the problemis getting worse.14-4 SOIL CONSERVATIONHow Can Conservation Tillage Reduce SoilErosion? Do Not Disturb the SoilModern farm machinery can plant crops withoutdisturbing the soil.Soil conservation involves using ways to reduce soilerosion <strong>and</strong> restore soil fertility. For hundreds ofyears, farmers have used various methods to reducesoil erosion, mostly by keeping the soil covered withvegetation.In conventional-tillage farming, farmers plowthe l<strong>and</strong> <strong>and</strong> then break up <strong>and</strong> smooth the soil tomake a planting surface. In areas such as the midwesternUnited States, harsh winters prevent plowing justbefore the spring growing season. Thus crop fieldsoften are plowed in the fall. This leaves the soil bareduring the winter <strong>and</strong> early spring <strong>and</strong> makes it vulnerableto erosion.Many U.S. farmers use conservation-tillage farmingto disturb the soil as little as possible while plantingcrops. With minimum-tillage farming, the soil is notdisturbed over the winter. Then at planting time specialtillers break up <strong>and</strong> loosen the subsurface soil withoutturning over the topsoil, previous crop residues, orany cover vegetation. In no-till farming, special plantingmachines inject seeds, fertilizers, <strong>and</strong> weed killers (herbicides)into thin slits made in the unplowed soil <strong>and</strong>then smooth over the cut. Figure 14-13 lists the advantages<strong>and</strong> disadvantages of conservation tillage.In 2003, farmers used conservation tillage on about45% of U.S. cropl<strong>and</strong>. The USDA estimates that usingconservation tillage on 80% of U.S. cropl<strong>and</strong> would reducesoil erosion by at least half. Conservation tillagealso has great potential to reduce soil erosion <strong>and</strong> raisecrop yields in the Middle East <strong>and</strong> in Africa.What Other Methods Can ReduceSoil Erosion? Several Tried <strong>and</strong> TrueMethodsFarmers have developed a number of ways to growcrops that reduce soil erosion.Figure 14-14 show some of the methods farmers haveused to reduce soil erosion. One is terracing, whichcan reduce soil erosion on steep slopes by convertingthe l<strong>and</strong> into a series of broad, nearly level terracesthat run across the l<strong>and</strong> contour (Figure 14-14a). Thisretains water for crops at each level <strong>and</strong> reduces soilerosion by controlling runoff.Another method is contour farming, which involvesplowing <strong>and</strong> planting crops in rows acrossthe slope of the l<strong>and</strong> rather than up <strong>and</strong> down (Figure14-14b). Each row acts as a small dam to helphold soil <strong>and</strong> to slow water runoff.Farmers also use strip cropping to reduce soil erosion(Figure 14-14b). It involves planting alternatingstrips of a row crop (such as corn or cotton) <strong>and</strong> anothercrop that completely covers the soil (such asgrass or a grass <strong>and</strong> legume mixture). The cover croptraps soil that erodes from the row crop, catches <strong>and</strong>reduces water runoff, <strong>and</strong> helps prevent the spread ofpests <strong>and</strong> plant diseases.One way to reduce erosion is to leave crop residueson the l<strong>and</strong> after the crops are harvested. Another is toplant cover crops such as alfalfa, clover, or rye immediatelyafter harvest to help protect <strong>and</strong> hold the soil.Another method for slowing erosion is alley croppingor agroforestry, in which several crops are plantedtogether in strips or alleys between trees <strong>and</strong> shrubsthat can provide fruit or fuelwood (Figure 14-14c). Thetrees or shrubs provide shade (which reduces waterloss by evaporation) <strong>and</strong> help retain <strong>and</strong> slowly releasesoil moisture. They also can provide fruit, fuelwood,<strong>and</strong> trimmings that can be used as mulch (green manure)for the crops <strong>and</strong> as fodder for livestock.AdvantagesReduces erosionSaves fuelCuts costsHolds more soilwaterReduces soilcompactionAllows severalcrops per seasonDoes not reducecrop yieldsReduces CO 2release from soilT rade-OffsConservation TillageDisadvantagesCan increaseherbicide use forsome cropsLeaves stalks thatcan harbor croppests <strong>and</strong> fungaldiseases <strong>and</strong>increase pesticideuseRequiresinvestment inexpensiveequipmentFigure 14-13 Trade-offs: advantages <strong>and</strong> disadvantages ofusing conservation tillage. Pick the single advantage <strong>and</strong> disadvantagethat you think are the most important.284 CHAPTER 14 Food <strong>and</strong> Soil Resources
(a) Terracing(b) Contour planting <strong>and</strong> strip cropping(c) Alley cropping(d) WindbreaksFigure 14-14 Solutions: in addition to conservation tillage, soil conservation methods include (a) terracing,(b) contour planting <strong>and</strong> strip cropping, (c) alley cropping or agroforestry, <strong>and</strong> (d) windbreaks.Some farmers establish windbreaks, or shelterbelts,of trees (Figure 14-14d) to reduce wind erosion,help retain soil moisture, supply wood for fuel, <strong>and</strong>provide habitats for birds, pest-eating <strong>and</strong> pollinatinginsects, <strong>and</strong> other animals.Some governments use l<strong>and</strong> classification to identifyeasily erodible (marginal) l<strong>and</strong> that should beneither planted in crops nor cleared of vegetation.In the United States, the Natural Resources ConservationService has set up a classification system toidentify types of l<strong>and</strong> that are suitable or unsuitable forcultivation.How Can We Maintain <strong>and</strong> Restore SoilFertility? Conservation <strong>and</strong> FertilizersSoil conservation can reduce loss of soil nutrients,<strong>and</strong> applying inorganic <strong>and</strong> organic fertilizers canhelp restore lost nutrients.The best way to maintain soil fertility is through soilconservation. The next best thing to do is to restoresome of the plant nutrients that have been washed,blown, or leached out of soil or removed by repeatedcrop harvesting.Fertilizers can partially restore lost plant nutrients.Farmers can use organic fertilizer from plant <strong>and</strong>animal materials or commercial inorganic fertilizerproduced from various minerals.There are several types of organic fertilizer. One isanimal manure: the dung <strong>and</strong> urine of cattle, horses,poultry, <strong>and</strong> other farm animals. It improves soil structure,adds organic nitrogen, <strong>and</strong> stimulates beneficialsoil bacteria <strong>and</strong> fungi.Manure use in the United States has decreased becausemost farmers no longer raise crops <strong>and</strong> livestockon the same farm <strong>and</strong> it costs too much to transport animalmanure from feedlots near urban areas to distantrural crop-growing areas. Also, tractors <strong>and</strong> other motorizedfarm machinery have largely replaced horses<strong>and</strong> other draft animals that added manure to the soil.Burning poultry wastes to produce electricityleaves a phosphorus-rich ash. Researchers at the U.S.Department of Agriculture are evaluating its value asan organic fertilizer. Also, Canada-based Internationalhttp://biology.brookscole.com/miller14285
AdvantagesT rade-OffsInorganic Commercial FertilizersEasy to transportEasy to storeEasy to applyInexpensive toproduceHelp feed oneof every threepeople in theworldWithoutcommercialinorganicfertilizers, worldfood outputcould dropby 40%DisadvantagesDo not add humus tosoilReduce organicmatter in soilReduce ability of soilsto hold waterLower oxygen contentof soilSupply only 2 or 3 of20 or so nutrientsneeded by plantsRequire largeamounts of energy toproduce, transport,<strong>and</strong> applyRelease thegreenhouse gasnitrous oxide (N 2 O)Runoff can overfertilizenearby lakes<strong>and</strong> kill fishFigure 14-15 Trade-offs: advantages <strong>and</strong> disadvantages ofusing inorganic commercial fertilizers to enhance or restore soilfertility. Pick the single advantage <strong>and</strong> disadvantage that youthink are the most important.way to reduce such losses is crop rotation. Farmersplant areas or strips with nutrient-depleting crops oneyear. The next year they plant the same areas withlegumes (whose root nodules add nitrogen to thesoil). A typical rotation is corn soybeans (alegume) oats alfalfa (a legume). In additionto helping restore soil nutrients, this method reduceserosion by keeping the soil covered with vegetation. Italso helps reduce crop losses to insects by presentingthem with a changing target.Can Inorganic Fertilizers Save the Soil?A Partial SolutionInorganic fertilizers can help restore soil fertilityif they are used with organic fertilizers <strong>and</strong> theirharmful environmental effects are controlled.Many farmers (especially in developed countries) relyon commercial inorganic fertilizers. The active ingredientstypically are inorganic compounds containing nitrogen,phosphorus, <strong>and</strong> potassium. Other plant nutrients mayalso be present in low or trace amounts. These fertilizersaccount for about one-fourth of the world’s cropyield. According to Canadian geographer Vaclav Smil,without synthetic inorganic fertilizer we could onlyfeed 2–3 million people.Figure 14-15 lists the advantages <strong>and</strong> disadvantagesof using inorganic fertilizers to enhance or restoresoil fertility. Inorganic chemical fertilizers canreplace depleted inorganic nutrients, but they do notreplace organic matter. Thus for healthy soil, both inorganic<strong>and</strong> organic fertilizers should be used.Bio-Recovery Corporation has developed a bacterialprocess that converts biodegradable human <strong>and</strong> animalwastes into pathogen free, nutrient rich organicfertilizer in only 72 hours.A second type of organic fertilizer called greenmanure consists of freshly cut or growing green vegetationplowed into the soil to increase the organic matter<strong>and</strong> humus available to the next crop.A third type is compost, produced when microorganismsin soil break down organic matter such asleaves, food wastes, paper, <strong>and</strong> wood in the presenceof oxygen.Some farmers also use spores of mushrooms, includingpuffballs <strong>and</strong> truffles, as organic fertilizer. Thespores take in more moisture <strong>and</strong> nutrients from thesoil. Unlike typical fertilizers that farmers must applyevery few weeks, one application of mushroom fungilasts all year <strong>and</strong> costs just pennies per plant.Crops such as corn, tobacco, <strong>and</strong> cotton can depletenutrients (especially nitrogen) in the topsoil ifplanted on the same l<strong>and</strong> several years in a row. One14-5 FOOD PRODUCTION, NUTRITION,AND ENVIRONMENTAL EFFECTSHow Much Has Food Production Increased?Impressive Gains that Are Slowing DownAfter increasing significantly since 1950, global grainproduction has mostly leveled off since 1985, <strong>and</strong> percapita grain production has declined since 1978.After almost tripling between 1950 <strong>and</strong> 1985, worldgrain production has essentially leveled off (Figure14-16, left). And after rising by about 36% between1950 <strong>and</strong> 1978, per capita food production has declined(Figure 14-16, right). The sharpest drops in percapita food production have occurred in Africa since1970, in the former Soviet Union since 1990, <strong>and</strong> inChina since 1998.Good news. We produce more than enough food tomeet the basic nutritional needs of every person on theearth. Bad news: one out of six people in developingcountries are not getting enough to eat because food isnot distributed equally among the world’s people. This286 CHAPTER 14 Food <strong>and</strong> Soil Resources
2,000400Grain production(millions of tons)1,5001,00050001950 19601970 1980 1990 2000 2010YearTotal World Grain ProductionPer capita grain production(kilograms per person)3503002502001501950 19601970 1980 1990 2000 2010YearWorld Grain Production per CapitaFigure 14-16 Total worldwide grain production of wheat, corn, <strong>and</strong> rice (left), <strong>and</strong> per capita grain production(right), 1950–2003. In order, the world’s three largest grain-producing countries are China, the United States,<strong>and</strong> India. (U.S. Department of Agriculture, Worldwatch Institute, UN Food <strong>and</strong> Agriculture Organization, <strong>and</strong>Earth Policy Institute)occurs because of differences in soil, climate, political<strong>and</strong> economic power, <strong>and</strong> average per capita income.Most agricultural experts agree that the root causesof hunger <strong>and</strong> malnutrition are <strong>and</strong> will continue to bepoverty <strong>and</strong> inequality, which prevent poor people fromgrowing or buying enough food regardless of howmuch is available. Other factors are war, corruption,<strong>and</strong> tariffs <strong>and</strong> subsidies that make it hard for poorpeople to see excess food they produce.How Serious Are Undernutrition <strong>and</strong>Malnutrition? Some ProgressSome people cannot grow or buy enough food to meettheir basic energy needs, <strong>and</strong> others do not getenough protein <strong>and</strong> other key nutrients.To maintain good health <strong>and</strong> resist disease, we needfairly large amounts of macronutrients (such as protein,carbohydrates, <strong>and</strong> fats), <strong>and</strong> smaller amounts ofmicronutrients consisting of various vitamins (such asA, C, <strong>and</strong> E) <strong>and</strong> minerals (such as iron, iodine, <strong>and</strong>calcium).People who cannot grow or buy enough food tomeet their basic energy needs suffer from chronic undernutrition.Chronically undernourished childrenare likely to suffer from mental retardation <strong>and</strong>stunted growth. They are also susceptible to infectiousdiseases such as diarrhea <strong>and</strong> measles that rarely killchildren in developed countries.Many of the world’s poor can only afford to liveon a low-protein, high-carbohydrate diet consisting ofgrains such as wheat, rice, or corn. Many suffer frommalnutrition resulting from deficiencies of protein<strong>and</strong> other key nutrients.The two most common nutritional deficiency diseasesare marasmus <strong>and</strong> kwashiorkor. Marasmus (fromthe Greek word marasmos, “to waste away”) occurswhen a diet is low in both calories <strong>and</strong> protein. Mostvictims are either nursing infants of malnourishedmothers or children who do not get enough food afterbeing weaned from breast-feeding. A child sufferingfrom severe marasmus is usually very thin <strong>and</strong> shriveled<strong>and</strong> looks like a very old miniature starving person(Figure 1-12, p. 13). Good news. If the child istreated in time with a balanced diet, most of these effectscan be reversed.Kwashiorkor (meaning “displaced child” in a WestAfrican dialect) is a severe protein deficiency occurringin infants <strong>and</strong> children ages 1–3, usually after thearrival of a new baby deprives them of breast milk.The displaced child’s diet changes to grain or sweetpotatoes, which provide enough calories but notenough protein. Such children typically have a bloatedbelly, reddish-orange hair, <strong>and</strong> discolored <strong>and</strong> puffyskin. Good news. If caught soon enough, most of theharmful effects can be cured with a balanced diet. Otherwise,children who survive their first year or twosuffer from stunted growth <strong>and</strong> mental retardation.Good news. According to the UN Food <strong>and</strong> AgricultureOrganization (FAO), the average daily foodintake in calories per person in the world <strong>and</strong> in developingcountries rose sharply between 1961 <strong>and</strong> 2003,<strong>and</strong> is projected to continue rising through 2030 (Figure14-17). Also, the estimated number of chronicallyundernourished or malnourished people fell from 918million in 1970 to 825 million in 2001, about 95% ofthem in developing countries.Bad news. About one of every six people in developingcountries (including about one of every threechildren below age 5) is chronically undernourished ormalnourished. The FAO estimates that at least 5.5 millionpeople die prematurely from a combination ofpoverty, undernutrition, malnutrition, <strong>and</strong> increasedsusceptibility to normally nonfatal infectious diseaseshttp://biology.brookscole.com/miller14287
Calories per day per person3,7003,5003,3003,1002,9002,7002,5002,3002,1001,90019607619701980Developed countries1990WorldYearDevelopingcountries2000201020202030Figure 14-17 The average daily food intake in calories per personin the world, developing countries, <strong>and</strong> developed countries:1961–2003 <strong>and</strong> projected increases to 2030. The averageadult male needs about 2,500 calories per day for good health.(Data from UN Food <strong>and</strong> Agriculture Organization)(such as measles <strong>and</strong> diarrhea) because of their weakenedcondition. This means that each day an averageof 15,100 people—80% of them children under age 5—die prematurely from these causes related to poverty.Studies by the United Nations Children’s Fund(UNICEF) indicate that one-half to two-thirds of childhooddeaths from nutrition-related causes could beprevented at an average annual cost of $5–10 per childby taking the following measures:■ Immunizing children against childhood diseasessuch as measles■ Encouraging breast-feeding (except for motherswith AIDS)■ Preventing dehydration from diarrhea by givinginfants a mixture of sugar <strong>and</strong> salt in a glass of water■ Preventing blindness by giving children a vitaminA capsule twice a year at a cost of about 75¢ per childor fortifying common foods with vitamin A <strong>and</strong> othermicronutrients at a cost of about 10¢ per child annually■ Providing family planning services to help mothersspace births at least 2 years apart■ Increasing education for women, with emphasis onnutrition, drinking water sterilization, <strong>and</strong> child careSome people in developed countries also sufferfrom lack of access to enough food for good health. Inthe United States, about 11 million people (half ofthem children under age 5) do not have access toenough food on a regular basis for good health.How Serious Are MicronutrientDeficiencies? Important but LimitedProgressOne of every three persons has a deficiency of one ormore vitamins <strong>and</strong> minerals, especially vitamin A,iron, <strong>and</strong> iodine.According to the World Health Organization (WHO),about one out of three people suffer from a deficiencyof one or more vitamins <strong>and</strong> minerals. The most widespreadmicronutrient deficiencies in developing countriesinvolve vitamin A, iron, <strong>and</strong> iodine.According to the WHO, 120–140 million childrenin developing countries are deficient in vitamin A.Globally about 250,000 children under age 6 go blindeach year from a lack of vitamin A <strong>and</strong> up to 80% ofthem die within a year.Scientists recently spliced genes into rice to makeit rich in beta-carotene, the source of vitamin A. Eatingnormal amounts of this vitamin-fortified rice—calledGolden Rice—should provide 20–40% of the daily requirementsof vitamin A. But the beta-carotene in thisrice is not converted to vitamin A in the body of apoorly nourished person.Other nutritional deficiency diseases are causedby lack of minerals. Too little iron—a component of hemoglobinthat transports oxygen in the blood—causesanemia. According to a 1999 survey by the WHO, oneof every three people in the world, mostly women <strong>and</strong>children in tropical developing countries, suffers fromtoo little iron. Iron deficiency causes fatigue, makes infectionmore likely, <strong>and</strong> increases a woman’s chancesof dying in childbirth <strong>and</strong> an infant’s chances of dyingof infection during its first year of life.Elemental iodine is essential for proper functioningof the thyroid gl<strong>and</strong>, which produces a hormone thatcontrols the body’s rate of metabolism. Chronic lack ofiodine, found in seafood <strong>and</strong> crops grown in iodinerichsoils, can cause stunted growth, mental retardation,<strong>and</strong> goiter—an abnormal enlargement of the thyroidgl<strong>and</strong> that can lead to deafness. According to theUnited Nations, about 26 million children suffer braindamage each year from lack of iodine <strong>and</strong> 600 million—mostlyin South <strong>and</strong> Southeast Asia—suffer fromgoiter.How Serious Is Overnutrition? Bad<strong>and</strong> Getting WorseIn developed countries overnutrition is a majorcause of preventable deaths.Overnutrition occurs when food energy intake exceedsenergy use <strong>and</strong> causes excess body fat. Overnourishedpeople are classified as overweight if they are roughly4.5–14 kilograms (10–30 pounds) over a healthy bodyweight <strong>and</strong> obese if they are more than 14 kilograms(30 pounds) over a healthy weight. Too many calories,too little exercise, or both can cause overnutrition.288 CHAPTER 14 Food <strong>and</strong> Soil Resources
People who are underfed <strong>and</strong> underweight <strong>and</strong>those who are overfed <strong>and</strong> overweight face similarhealth problems: lower life expectancy, greater susceptibilityto disease <strong>and</strong> illness, <strong>and</strong> lower productivity <strong>and</strong> lifequality. We live in a world where 1 billion people havehealth problems because they do not get enough to eat<strong>and</strong> 1.7 billion worry about health problems from eatingtoo much. According to a 2004 study by the InternationalObesity Task Force, about 1 of every 4 peoplein the world are overweight <strong>and</strong> 5% are obese.In developed countries, overnutrition is thesecond leading cause of preventable deaths aftersmoking, mostly from heart disease, cancer, stroke,<strong>and</strong> diabetes. About one out of seven adults in developedcountries suffer from overnutrition. Accordingto the Centers for Disease Prevention <strong>and</strong> Control,about two-thirds of Americans adults are overweight<strong>and</strong> almost one-third is obese—the highest overnutritionrate of any developed country. The $40 billionAmericans spend each year trying to lose weight is 1.7times more than the $19 billion per year needed toeliminate undernutrition <strong>and</strong> malnutrition in theworld. More than half of all adults are overweight inRussia, the United Kingdom, <strong>and</strong> Germany comparedto 15% in China.In 2004, the World Health Organization urgedgovernments to discourage food <strong>and</strong> beverage adsthat exploit children; tax less-healthy foods; <strong>and</strong> limithigh-fat <strong>and</strong> high-sugar foods in schools.What Are the <strong>Environmental</strong> Effects ofProducing Food? Agriculture IsNumber OneModern agriculture has a greater harmful environmentalimpact than any other humanactivity, <strong>and</strong> these effects may limit future foodproduction.Modern agriculture has significant harmful effects onair, soil, water, <strong>and</strong> biodiversity, as Figure 14-18 (p. 290)shows. According to many analysts, agriculture has agreater harmful environmental impact than any otherhuman activity!Some analysts believe these harmful environmentaleffects can be overcome <strong>and</strong> will not limit futurefood production. Other analysts disagree. For example,according to Norman Myers, a combination of environmentalfactors may limit future food production.They include soil erosion, salt buildup <strong>and</strong> waterlogging ofsoil on irrigated l<strong>and</strong>s, water deficits <strong>and</strong> droughts, <strong>and</strong> lossof wild species that provide the genetic resources for improvedforms of foods.According to a 2002 study by the UN Departmentfor Economic <strong>and</strong> Social Affairs, close to 30% of theworld’s cropl<strong>and</strong> has been degraded to some degreeby soil erosion, salt buildup, <strong>and</strong> chemical pollution,<strong>and</strong> 17% has been seriously degraded. Such environmentalfactors may limit food production in India <strong>and</strong>China (Case Study, below), the world’s two most populouscountries.Case Study: Can China’s Population Be Fed?A Precarious SituationPopulation growth, economic growth, lack ofresources, <strong>and</strong> the harmful environmental effectsof food production may limit crop production inChina.Since 1970, China has made significant progress infeeding its people <strong>and</strong> slowing its rate of populationgrowth. But there is concern that crop yields may notbe able to keep up with dem<strong>and</strong> because of its growingpopulation <strong>and</strong> economic development. A basicproblem is that with 20% of the world’s people, Chinahas only 7% of the world’s cropl<strong>and</strong> <strong>and</strong> fresh water,4% of its forests, <strong>and</strong> 2% of its oil.Between 1998 <strong>and</strong> 2003, China’s grain productionfell by 18%. This decline in grain production occurredmostly because of a drop in cropl<strong>and</strong> because of a lossof irrigation water, desert expansion, <strong>and</strong> conversionof cropl<strong>and</strong> to nonfarm uses. Another factor was a declinein planting two crops a year because of a loss offarm labor as more Chinese migrated from rural areasto cities in search of jobs. According to projections bythe Worldwatch Institute <strong>and</strong> the U.S. Central IntelligenceAgency, China’s grain production could fallmuch more between 2003 <strong>and</strong> 2030, mostly because ofwater shortages, degraded cropl<strong>and</strong>, diversion of waterfrom cropl<strong>and</strong> to cities, <strong>and</strong> continued conversionof cropl<strong>and</strong> to nonfarm uses.As incomes in China have risen, so has meat consumption.Even if China’s currently booming economyresulted in no increases in meat consumption, theprojected drop in grain production would mean thatby 2030 China would need to import more than theworld’s total grain exports (roughly half of whichcome from the United States).But suppose the increased dem<strong>and</strong> for meat led toa rise in per capita grain consumption equal to onehalfthe current U.S. level. Then China would need toimport more than the entire current grain output of theUnited States.The Earth Policy Institute <strong>and</strong> the U.S. Central IntelligenceAgency warn that if either of these scenariosturns out to be correct, no country or combination ofcountries has the potential to supply even a small fractionof China’s potential food supply deficit. This doesnot take into account huge grain deficits that are projectedin other parts of the world by 2025, especially inAfrica <strong>and</strong> India.To food expert Lester Brown, China is facing an ecologicalmeltdown by exceeding the carrying capacity ofits l<strong>and</strong>. It is “overplowing its l<strong>and</strong>, overgrazing itsrangel<strong>and</strong>s, depleting its soils, exp<strong>and</strong>ing its deserts,http://biology.brookscole.com/miller14289
Biodiversity LossLoss <strong>and</strong> degradation of habitat fromclearing grassl<strong>and</strong>s <strong>and</strong> forests <strong>and</strong>draining wetl<strong>and</strong>sFish kills from pesticide runoffKilling of wild predators to protectlivestockLoss of genetic diversity fromreplacing thous<strong>and</strong>s of wild cropstrains with a few monoculture strainsSoilErosionLoss of fertilitySalinizationWaterloggingDesertificationAir PollutionGreenhouse gas emissions from fossilfuel useOther air pollutants from fossil fuel usePollution from pesticide spraysWater wasteAquifer depletionIncreased runoff <strong>and</strong>flooding from l<strong>and</strong> clearedto grow cropsSediment pollution fromerosionFish kills from pesticiderunoffWaterSurface <strong>and</strong> groundwaterpollution from pesticides<strong>and</strong> fertilizersOverfertilization of lakes<strong>and</strong> slow-moving riversfrom runoff of nitrates <strong>and</strong>phosphates fromfertilizers, livestockwastes, <strong>and</strong> foodprocessing wastesHuman HealthNitrates in drinking waterPesticide residues in drinking water,food, <strong>and</strong> airContamination of drinking <strong>and</strong>swimming water with disease organismsfrom livestock wastesBacterial contamination of meatFigure 14-18 Natural capital degradation: major environmental effects of food production. According to UNstudies, l<strong>and</strong> degradation reduced cumulative food production worldwide by about 13% on cropl<strong>and</strong> <strong>and</strong> 4%on pasturel<strong>and</strong> between 1950 <strong>and</strong> 2000.overcutting its forests, <strong>and</strong> overpumping its aquifers.”See his guest essay on the website for this chapter.Other analysts disagree. According to a 1997study by the International Food Policy Institute, Chinashould be able to feed its population <strong>and</strong> begin exportinggrain again by 2020 if the government investsin exp<strong>and</strong>ing irrigation, using more water-efficientforms of irrigation, <strong>and</strong> increasing agricultural research.Also, recent satellite surveys show that Chinahas about 40% more potential cropl<strong>and</strong> than previouslythought. In addition, the World Bank concludedin 1997 that China’s domestic food production shouldkeep up with its population growth for the next twoor three decades without having to import largeamounts of grain. China’s food production dilemmaillustrates how the problems of population growth,economic development, <strong>and</strong> environmental degradationcan interact.290 CHAPTER 14 Food <strong>and</strong> Soil Resources
14-6 INCREASING CROPPRODUCTIONWhat Is the Gene Revolution? From Crossbreedingto Mixing Genes in a New WayWe can increase crop yields by using crossbreedingto mix the genes of similar types of organisms <strong>and</strong>genetic engineering to mix those of differentorganisms.For centuries, farmers <strong>and</strong> scientists have used crossbreedingthrough artificial selection to develop geneticallyimproved varieties of crop strains (Figure 5-10,p. 97). Such selective breeding has had amazing results.Ancient ears of corn were about the size of yourlittle finger <strong>and</strong> wild tomatoes were once the size of agrape.But traditional crossbreeding is a slow process,typically taking 15 years or more to produce a commerciallyvaluable new variety <strong>and</strong> can combine traitsonly from species that are close to one another genetically.It also provides varieties that are useful for onlyabout 5–10 years before pests <strong>and</strong> diseases reduce theireffectiveness.Scientists are creating a third green revolution—actuallya gene revolution—by using genetic engineering todevelop genetically improved strains of crops <strong>and</strong> livestockanimals. It involves splicing a gene from onespecies <strong>and</strong> transplanting it into the DNA of anotherspecies (Figure 5-11, p. 98). Compared to traditionalcrossbreeding, gene splicing takes about half as long todevelop a new crop, cuts costs, <strong>and</strong> allows the insertionof genes from almost any other organism into crop cells.Ready or not, the world is entering the age of geneticengineering. More than two-thirds of the foodproducts on U.S. supermarket shelves contain ingredientsmade from genetically engineered crops, <strong>and</strong> theproportion is increasing rapidly. Currently, geneticallyengineered crops account for about 5% of the world’scrop area. But by 2020 more cropl<strong>and</strong> may be devotedto genetically engineered crops than to conventionalcrossbred crops.Bioengineers are developing or plan to developnew varieties of crops resistant to heat, cold, herbicides,insect pests, parasites, viral diseases, drought,<strong>and</strong> salty or acidic soil. They also hope to develop cropplants that that can grow faster <strong>and</strong> survive with littleor no irrigation <strong>and</strong> with less fertilizer <strong>and</strong> pesticides.For example, bioengineers have altered citrus trees(that normally take 6 years to produce fruit) to yieldfruit in only one year. They hope to go further <strong>and</strong> useadvanced tissue culture techniques to mass-produce onlyorange juice sacs. This would eliminate the need forcitrus orchards <strong>and</strong> would free large amounts of l<strong>and</strong>for other purposes such as biodiversity protection.A team of research scientists at Washington StateUniversity is experimenting with cell cultures to producea variety of food <strong>and</strong> medical products in fermentationtanks or bioreactors. These cell factorieswould contain mixtures of various plant <strong>and</strong> animalcells suspended in nutrient solutions of salts <strong>and</strong> carbohydrates.If successful <strong>and</strong> affordable, such food factorysystems could produce food independent of localweather in environmentally controlled buildings inlocal areas. This would reduce the environmental impactsof food production <strong>and</strong> greatly reduce longdistanceshipping costs.However, critics note that so far most geneticallymodified crops have been for use in temperate areasrather than on subsistence crops in the tropics wherefood needs are the greatest. Also two-thirds of availabletransgenic crops have been engineered to toleratemore herbicides (<strong>and</strong> thus increase herbicide sales)rather than for pest resistance <strong>and</strong> improved foodquality. This has occurred because seed companies underst<strong>and</strong>ablyconcentrate on developing crops thatwill give them high profits in countries where farmerscan afford the new varieties.How Safe Are Genetically Modified Foods?Savior or Frankenfood?There is controversy over whether the benefitsof genetically engineered food outweigh its unintended<strong>and</strong> potentially harmful effects.Despite the promise, there is considerable controversyover the use of genetically modified food (GMF) <strong>and</strong>other forms of genetic engineering. Such food is seenby its producers <strong>and</strong> investors as a potentially sustainableway to solve world food problems but critics considerit potentially dangerous “Frankenfood”. Figure14-19 (p. 292) summarizes the projected advantages<strong>and</strong> disadvantages of this new technology. Study thisfigure carefully.Critics recognize the potential benefits of geneticallymodified crops. But they warn that we know toolittle about the potential harm to human health <strong>and</strong>ecosystems from widespread use of such crops. Also,genetically modified organisms cannot be recalled ifthey cause unintended harmful genetic <strong>and</strong> ecologicaleffects—as some scientists expect to happen.In 2002 biologist Barry Commoner warned, “Thegenetically engineered crops now being grown representa massive uncontrolled experiment whose outcomeis inherently unpredictable. The results could becatastrophic.” Until we have more information, suchcritics call for more controlled field experiments,more research <strong>and</strong> long-term safety testing to betterunderst<strong>and</strong> the risks, <strong>and</strong> stricter regulation of thistechnology.http://biology.brookscole.com/miller14291
T rade-OffsGenetically Modified Crops <strong>and</strong> FoodsProjectedAdvantagesNeed less fertilizerNeed less waterMore resistantto insects, plantdisease, frost, <strong>and</strong>droughtFaster growthCan grow inslightly salty soilsLess spoilageBetter flavorLess use ofconventionalpesticidesTolerate higherlevels ofherbicide useHigher yieldsProjectedDisadvantagesIrreversible <strong>and</strong>unpredictablegenetic <strong>and</strong>ecological effectsHarmful toxins infood from possibleplant cell mutationsNew allergensin foodLower nutritionIncreasedevolution ofpesticide-resistantinsects <strong>and</strong> plantdiseasesCreation ofherbicide-resistantweedsHarm beneficialinsectsLower geneticdiversityFigure 14-19 Trade-offs: projected advantages <strong>and</strong> disadvantagesof genetically modified crops <strong>and</strong> foods. Pick the single advantage<strong>and</strong> disadvantage that you think are the most important.Most scientists <strong>and</strong> economists who have evaluatedgenetic engineering of crops believe that itspotential benefits outweigh the potential risks. A statementsigned in 2000 by over 2,100 scientists—includingNobel laureates James Watson (codiscoverer ofDNA) <strong>and</strong> Norman Bourlag (founder of the secondgreen revolution)—supported the use of food modifiedby genetic engineering. According to a 2004 reportby the U.N. Food <strong>and</strong> Agriculture Organization,geneticaly modified (GM) crops hold great promisefor farmers in developing countries. But the studypointed out that so far the technology has not been focusedon developing GM crops for the poor. The reportalso called for more research <strong>and</strong> governmentregulation to assess any harmful environmental effectsfrom this technology.A 2004 study by the Ecological Society of Americarecommended more caution in releasing geneticallyengineered organisms into the environment. Also,agroecologists Miguel Altieri <strong>and</strong> Peter Rosset pointout that the idea of using genetic engineering to provideenough food to feed everyone is based on twofaulty assumptions. One is that world hunger iscaused by a global shortage of food. The other is thatgenetic engineering is the only <strong>and</strong> best way to increasefood production. The reality is that poverty <strong>and</strong>inequality not food production are primary causes ofhunger <strong>and</strong> malnutrition. Research also shows thatpolyculture using perennial crops can produce highercrop yields than current green revolution <strong>and</strong> geneticrevolution techniques.xHOW WOULD YOU VOTE? Do the potential advantages ofgenetically engineered foods outweigh their potential disadvantages?Cast your vote online at http://biology.brookscole.com/miller14.Many analysts <strong>and</strong> consumer advocates believegovernments should require m<strong>and</strong>atory labeling ofgenetically modified foods. This would provide consumerswith information to help them make informedchoices about the foods they buy. Such labeling isrequired in Japan, Europe, South Korea, Canada,Australia, <strong>and</strong> New Zeal<strong>and</strong> <strong>and</strong> is favored by 81% ofAmericans polled in 1999.Industry representatives <strong>and</strong> the U.S. Departmentof Agriculture oppose this because they claim thatgenetically modified foods are not substantially differentfrom foods developed by conventional crossbreedingmethods. Also, they fear—probably correctly—that labeling such foods would hurt sales by arousingsuspicion.xHOW WOULD YOU VOTE? Should all genetically engineeredfoods be so labeled? Cast your vote online athttp://biology.brookscole.com/miller14.Can We Continue Exp<strong>and</strong>ing the GreenRevolution? Maybe, Maybe NotLack of resources such as water <strong>and</strong> fertilesoil, <strong>and</strong> environmental factors may limit ourability to continue increasing crop yields.Many analysts believe we can produce all the food weneed in the future by spreading the use of existinghigh-yield green revolution crops <strong>and</strong> genetically engineeredcrops to more of the world.Other analysts disagree. They point to severalfactors that have limited the success of the green <strong>and</strong>gene revolutions to date <strong>and</strong> may continue to do so.One problem is that without huge amounts of fertilizer<strong>and</strong> water, most green revolution crop varietiesproduce yields that are no higher (<strong>and</strong> are sometimeslower) than those from traditional strains. Anotherproblem is that green revolution <strong>and</strong> genetically engineeredcrop strains <strong>and</strong> their high inputs of water,fertilizer, <strong>and</strong> pesticides cost too much for most sub-292 CHAPTER 14 Food <strong>and</strong> Soil Resources
sistence farmers in developing countries. Scientistsalso point out that continuing to increase fertilizer,water, <strong>and</strong> pesticide inputs eventually produces noadditional increase in crop yields. For example, grainyields rose about 2.1% a year between 1950 <strong>and</strong> 1990,but the increase dropped to 1.1% per year between1990 <strong>and</strong> 2000 <strong>and</strong> to 0.5% between 1997 <strong>and</strong> 2002.No one knows whether this downward trend willcontinue.There is also concern that crop yields in someareas may start dropping as soil erodes <strong>and</strong> loses fertility,irrigated soil becomes salty <strong>and</strong> waterlogged,underground <strong>and</strong> surface water supplies become depleted<strong>and</strong> polluted with pesticides <strong>and</strong> nitrates fromfertilizers, <strong>and</strong> populations of rapidly breeding pestsdevelop genetic immunity to widely used pesticides.We do not know how close we are to such environmentallimits.Also, according to Indian economist V<strong>and</strong>anaShiva, overall gains in crop yields from new green <strong>and</strong>gene revolution varieties may be much lower thanclaimed. The yields are based on comparisons betweenthe output per hectare of old <strong>and</strong> new monoculturevarieties rather than between the even higheryields per hectare for polyculture cropping systems <strong>and</strong>the new monoculture varieties that often replace polyculturecrops.There is also concern that the projected increasedloss of biodiversity can limit the genetic raw materialneeded for future green <strong>and</strong> gene revolutions. The UNFood <strong>and</strong> Agriculture Organization estimates thattwo-thirds of all seeds planted in developing countriesare of uniform strains. Such genetic uniformity increasesthe vulnerability of food crops to pests, diseases,<strong>and</strong> harsh weather.Will People Try New Foods? Changing EatingHabits Is DifficultA variety of plants <strong>and</strong> insects could be used assources of food, but most consumers are reluctantto try new foods.Some analysts recommend greatly increased cultivationof less widely known plants to supplement or replacesuch staples as wheat, rice, <strong>and</strong> corn. One ofmany possibilities is the winged bean common in NewGuinea <strong>and</strong> Southeast Asia. This fast-growing bean isa good source of protein <strong>and</strong> has so many edible partsit has been called a supermarket on a stalk. It alsoneeds little fertilizer because of nitrogen-fixing nodulesin its roots.Some edible insects—called microlivestock—arealso important potential sources of protein, vitamins,<strong>and</strong> minerals in many parts of the world. There areabout 1,500 edible insect species. Examples includeblack ant larvae (served in tacos in Mexico), giant waterbugs(crushed into vegetable dip in Thail<strong>and</strong>),Mopani, or emperor moth caterpillars (eaten in SouthAfrica), cockroaches (eaten by Kalahari desertdwellers), lightly toasted butterflies (a favorite food inBali), <strong>and</strong> fried ants (sold on the streets of Bogota,Colombia). Most of these insects are 58–78% protein byweight—three to four times as protein-rich as beef,fish, or eggs. One problem is getting farmers to takethe financial risk of cultivating new types of foodcrops. Another is convincing consumers to try newfoods. Would you try a bug soup?Some plant scientists believe we should rely moreon polycultures of perennial crops (p. 278), which are betteradapted to regional soil <strong>and</strong> climate conditionsthan most annual crops. Using perennials would alsoeliminate the need to till soil <strong>and</strong> replant seeds eachyear, greatly reducing energy use, saving water, <strong>and</strong>reducing soil erosion <strong>and</strong> water pollution from erodedsediment. Not surprisingly, large seed companies thatmake their money selling seeds each year for annualcrops generally oppose this idea.Is Irrigating More L<strong>and</strong> the Answer?A Limited SolutionThe amount of irrigated l<strong>and</strong> per person has beenfalling since 1978 <strong>and</strong> is projected to fall muchmore during the next few decades.About 40% of the world’s food production <strong>and</strong> twothirdsof the world’s rice <strong>and</strong> wheat comes from the20% of the world’s cropl<strong>and</strong> that is irrigated. Goodnews. Between 1950 <strong>and</strong> 2003, the world’s irrigatedarea tripled, with most of the growth occurring from1950 to 1978.Bad news. The amount of irrigated l<strong>and</strong> per personhas been falling since 1978 <strong>and</strong> is projected to fallmuch more between 2004 <strong>and</strong> 2050. One reason is thatsince 1978 the world population has grown faster thanirrigated agriculture. Other factors are depletion of undergroundwater supplies (aquifers), inefficient use ofirrigation water, <strong>and</strong> salt buildup in soil on irrigatedcropl<strong>and</strong>. In addition, the majority of the world’s farmersdo not have enough money to irrigate their crops.Is Cultivating More L<strong>and</strong> the Answer?Another Limited SolutionSignificant expansion of cropl<strong>and</strong> is unlikelyover the next few decades because of poor soils,limited water, high costs, <strong>and</strong> harmful environmentaleffects.Theoretically, the world’s cropl<strong>and</strong> could be more th<strong>and</strong>oubled by clearing tropical forests <strong>and</strong> irrigating aridl<strong>and</strong>. But much of this is marginal l<strong>and</strong> with poor soilfertility, steep slopes, or both. Cultivation of such l<strong>and</strong>is unlikely to be sustainable.http://biology.brookscole.com/miller14293
Much of the world’s potentially cultivable l<strong>and</strong>lies in dry areas, especially in Australia <strong>and</strong> Africa.Large-scale irrigation in these areas would requireexpensive dam projects, use large inputs of fossil fuelto pump water long distances, <strong>and</strong> deplete groundwatersupplies by removing water faster than it is replenished.It would also require expensive efforts toprevent erosion, groundwater contamination, salinization,<strong>and</strong> waterlogging, all of which reduce cropproductivity.Furthermore, these potential increases in cropl<strong>and</strong>would not offset the projected loss of almost one-thirdof today’s cultivated cropl<strong>and</strong> caused by erosion, overgrazing,waterlogging, salinization, <strong>and</strong> urbanization.Such expansion of cropl<strong>and</strong> would also reducewildlife habitats <strong>and</strong> thus the world’s biodiversity.According to the FAO, cultivating all potential cropl<strong>and</strong>in developing countries would reduce the areasof forests, woodl<strong>and</strong>s, <strong>and</strong> permanent pasture by almosthalf. Clearing forests would also release a hugeamount of carbon dioxide into the atmosphere <strong>and</strong> accelerateglobal warming, which is expected to causeshifts in the areas where some crops could be grown.Bottom line: Many analysts believe that significantexpansion of cropl<strong>and</strong> is unlikely over the next few decades.Can We Grow More Food in Urban Areas?Some Untapped PotentialPeople in urban areas could save money by growingmore of their food.According to the United Nations Development Program,urban gardens provide about 15% of the world’sfood supply. Food experts believe that people in urbanareas could live more sustainably <strong>and</strong> save money bygrowing more of their food. Such food could be grownin empty lots, in backyards, on rooftops <strong>and</strong> balconies,<strong>and</strong> by raising fish in tanks <strong>and</strong> sewage lagoons.Growing food in urban areas reduces stresses onsoil <strong>and</strong> biodiversity in nonurban areas. It can alsoprovide food <strong>and</strong> jobs for low-income urban residents.However, it can lead to conflicts over how urban l<strong>and</strong>should be used. And urban soil needs to be checkedfor traces of toxic pollutants such as lead <strong>and</strong> mercury.A study by the UN Center for Human Settlementsestimated that up to half of the total area in many citiesin developing countries is vacant public l<strong>and</strong> thatcould be used to produce food. Is there a vacant lot ora rooftop in your neighborhood that could be used togrow food?How Much Food Is Wasted? Way Too MuchUp to 70% of the food we produce is wasted throughspoilage, inefficient processing <strong>and</strong> preparation, <strong>and</strong>plate waste.We have greatly increased the efficiency of food production.But the efficiency of food consumption is stilllow. According to the FAO, as much as 70% of the foodwe produce is lost through spoilage, inefficient processing<strong>and</strong> preparation, <strong>and</strong> plate waste. Even affluentcountries such as the United States, Canada,Switzerl<strong>and</strong>, Italy, <strong>and</strong> Belgium waste nearly 60% oftheir food. Cutting such losses in half would go a longway in meeting global food needs <strong>and</strong> reducing theenvironmental impact of agriculture. How much of thefood on your plate is wasted?14-7 PRODUCING MORE MEATHow Are Rangel<strong>and</strong>s Used to Produce Meat?Grass <strong>and</strong> Shrubs for LivestockMuch of the rangel<strong>and</strong> that makes up 40% of theworld’s ice-free l<strong>and</strong> is used to raise livestock.Most analysts call for an increase in meat productionbecause we will need more meat to feed the projectedincrease in the world’s population. Also, when incomesrise, meat consumption per person usually increases.Rangel<strong>and</strong>s are grassl<strong>and</strong>s in temperate <strong>and</strong> tropicalclimates that supply forage or vegetation for grazing(grass-eating) <strong>and</strong> browsing (shrub-eating) animals.Almost 4 billion cattle, sheep, <strong>and</strong> goats graze on about42% of the world’s rangel<strong>and</strong>. Livestock also grazein pastures: managed grassl<strong>and</strong>s or enclosed meadowsusually planted with domesticated grasses or otherforage.Most rangel<strong>and</strong> grasses have a deep <strong>and</strong> complexnetwork of roots (Figure 4-27, top right, p. 75) that helpanchor the plants. Blades of rangel<strong>and</strong> grass growfrom the base, not the tip. Thus as long as only the upperhalf is eaten, rangel<strong>and</strong> grass is a renewable resourcethat can be grazed again <strong>and</strong> again.Moderate levels of grazing are healthy for grassl<strong>and</strong>sbecause removal of mature vegetation stimulatesrapid regrowth <strong>and</strong> encourages greater plant diversity.If not overdone, disturbance of the soil surface by thehooves of grazing animals allows more rainfall to reachthe roots of rangel<strong>and</strong> grasses. The key to the health ofrangel<strong>and</strong> is to prevent both overgrazing <strong>and</strong> undergrazingby domesticated livestock <strong>and</strong> wild herbivores.Is Producing More Meat the Answer? MoreProtein at the Expense of the EnvironmentMeat <strong>and</strong> meat products are important sourcesof protein, but meat production has many harmfulenvironmental effects.Meat <strong>and</strong> meat products are good sources of highqualityprotein. Between 1950 <strong>and</strong> 2003, world meatproduction increased more than fivefold, <strong>and</strong> per294 CHAPTER 14 Food <strong>and</strong> Soil Resources
capita meat production more than doubled. It is likelyto more than double again by 2050 as affluence rises inmiddle-income developing countries <strong>and</strong> people beginconsuming more meat.Some analysts expect most future increases inmeat production to come from densely populated feedlots,where animals are fattened for slaughter by feedingon grain grown on cropl<strong>and</strong> or meal producedfrom fish. Feedlots account for about 43% of theworld’s beef production, half of pork production, <strong>and</strong>almost three-fourths of poultry production.In the United States, most production of cattle,pigs, <strong>and</strong> poultry is concentrated in increasingly large,factory-like production facilities in only a few areas.As many as 100,000 cattle may be confined to a singlefeedlot complex <strong>and</strong> 10,000 hogs may be crowded almostshoulder to shoulder in a giant barn.This industrialized approach increases meat productivity.But it has a number of harmful environmentaleffects. Animal wastes from such facilities are typicallystored in enormous open lagoons, which can rupture orleak <strong>and</strong> contaminate groundwater <strong>and</strong> nearby streams<strong>and</strong> rivers. In 1999, for example, torrential rains fromHurricane Floyd caused a number of hog <strong>and</strong> poultrywaste lagoons in southeastern North Carolina to over-flow <strong>and</strong> spill their wastes into local rivers. Living neara feedlot or animal waste lagoon is also a nasal assault.Exp<strong>and</strong>ing feedlot production of meat will increasepressure on the world’s grain supply becausefeedlot livestock consume grain produced on cropl<strong>and</strong>instead of feeding on natural grasses. It will also increasepressure on the world’s fish supply becauseabout one-third of the world’s fish catch is used to feedlivestock. Livestock production also has an enormousenvironmental impact (Connections, below).What Are the Effects of Overgrazing?Eroding Soil <strong>and</strong> Fewer LivestockOvergrazing can lead to soil erosion <strong>and</strong> limitlivestock production.Overgrazing occurs when too many animals grazetoo long <strong>and</strong> exceed the carrying capacity of a grassl<strong>and</strong>area. It lowers the net primary productivity ofgrassl<strong>and</strong> vegetation, reduces grass cover, <strong>and</strong> whencombined with prolonged drought can cause desertification.It also exposes the soil to erosion by water <strong>and</strong>wind (Figure 14-20, left) <strong>and</strong> compacts the soil (whichdiminishes its capacity to hold water). Overgrazingalso enhances invasion of exposed l<strong>and</strong> by woodySome <strong>Environmental</strong> Consequences of Meat ProductionThe meat-baseddiet of affluentpeople in developed<strong>and</strong> developingcountries has aCONNECTIONSnumber of harmfulenvironmental effects. More thanhalf of the world’s cropl<strong>and</strong> (19% inthe United States) is used to producelivestock feed grain (mostly fieldcorn, sorghum, <strong>and</strong> soybeans). Livestock<strong>and</strong> fish raised for food alsoconsume about 37% of the world’sgrain production <strong>and</strong> 70% of grainproduction in the United States.Meat production uses more thanhalf the water withdrawn from theworld’s rivers <strong>and</strong> aquifers eachyear. Most of this water is used toirrigate crops fed to livestock <strong>and</strong> towash away animal wastes.According to Canadian scientistVaclav Smil, producing one calorieof energy in the flesh of a cow, pig,or chicken requires 11–15 calories offeed. The energy needed to producea single hamburger is enough todrive a small car about 32 kilometers(20 miles).About 14% of U.S. topsoil loss isdirectly associated with livestockgrazing. Cattle belch out about 16%of the methane (a greenhouse gasabout 25 times more potent thancarbon dioxide) released into theatmosphere. Also, some of the nitrogenin commercial inorganic fertilizerused to grow livestock feed isconverted to nitrous oxide, a greenhousegas released from the soil intothe atmosphere.Livestock in the United Statesproduce about 20 times more waste(manure) than is produced by thecountry’s human population. A singlecow produces as much waste as16 humans. Only about half of thisnutrient-rich livestock waste is recycledinto the soil. Manure washingoff the l<strong>and</strong> or leaking from lagoonsused to store animal wastes can killfish by depleting dissolved oxygen.Chickens, pigs, <strong>and</strong> cows useabout 70% of the antibiotics consumedin the United States. Accordingto the World Health Organization<strong>and</strong> the FAO, widespread useof antibiotics in the livestock industryis increasing the development ofmicrobes that are genetically resistantto widely used antibiotics. Thismakes it harder to fight infectiousdiseases in both humans <strong>and</strong> livestockanimals. In 2004, McDonaldsbegan requiring its chicken suppliersto stop giving their birds antibioticsto promote growth.Producing meat can also endangerwildlife species. According to a2002 report by the National PublicL<strong>and</strong>s Grazing Campaign, livestockgrazing in the United Stateshas contributed to population declinesof almost a fourth of thecountry’s threatened <strong>and</strong> endangeredspecies.Critical ThinkingAre you willing to eat less meat ornot eat any meat? Explain.http://biology.brookscole.com/miller14295
shrubs such as mesquite <strong>and</strong> prickly pear cactus. Finally,overgrazing can limit livestock production.We do not know the condition of much of theworld’s rangel<strong>and</strong> because of a lack of detailed surveys.However, limited data from surveys in variouscountries by the FAO indicate that overgrazing by livestockhas caused as much as a fifth of the world’srangel<strong>and</strong> to lose productivity, mostly by desertification(Figure 14-9).How Can Rangel<strong>and</strong>s Be Managed MoreSustainably to Produce More Meat?Control <strong>and</strong> RestoreWe can sustain rangel<strong>and</strong> productivity by controllingthe number <strong>and</strong> distribution of livestock <strong>and</strong> byrestoring degraded rangel<strong>and</strong>.The most widely used method for more sustainablemanagement of rangel<strong>and</strong> is to control the number ofgrazing animals <strong>and</strong> the duration of their grazing in agiven area so the carrying capacity of the area is notexceeded. However, determining the carrying capacityof a range site is difficult <strong>and</strong> costly.Livestock tend to aggregate around natural watersources especially thin strips of lush vegetation alongstreams or rivers known as riparian zones (Figure 14-21,left) <strong>and</strong> ponds established to provide water for livestock.As a result, areas around such water sources tendto be overgrazed <strong>and</strong> other areas can be undergrazed.Studies indicate that 65–75% of the wildlife in thewestern United States depends totally on riparianhabitats. According to a 1999 study in the Journal of SoilUSDA, Natural Resources Conservation ServiceFigure 14-20 Rangel<strong>and</strong>: overgrazed (left) <strong>and</strong> lightly grazed (right).<strong>and</strong> Water Conservation, livestock grazing has damagedapproximately 80% of stream <strong>and</strong> riparian ecosystemsin the United States.To help prevent such damage, livestock can bemoved from one grazing area to another <strong>and</strong> riparianareas can be fenced off. Sometimes protected areas canrecover in a few years (Figure 14-21, right). Rancherscan also provide supplemental feed at selected sites <strong>and</strong>locate water holes <strong>and</strong> tanks <strong>and</strong> salt blocks in strategicplaces.Bureau of L<strong>and</strong> ManagementBureau of L<strong>and</strong> ManagementFigure 14-21 Solutions: cattle on a riparian zone of a public rangel<strong>and</strong> along Arizona’s San Pedro River (left)in the mid-1980s just before this section of waterway was protected by banning domestic livestock grazing for15 years, eliminating s<strong>and</strong> <strong>and</strong> gravel operations <strong>and</strong> water pumping rights in nearby areas, <strong>and</strong> limiting accessby off-highway vehicles. The right photo shows the recovery of this riparian area at the same time of yearafter 10 years of protection.296 CHAPTER 14 Food <strong>and</strong> Soil Resources
A more expensive <strong>and</strong> less widely used method ofrangel<strong>and</strong> management is to suppress the growth ofunwanted invader plants by herbicide spraying, mechanicalremoval, or controlled burning. A cheaperway to discourage unwanted vegetation is controlled,short-term trampling by large numbers of livestock.Replanting barren areas with native grass seeds<strong>and</strong> applying fertilizer can increase growth of desirablevegetation <strong>and</strong> reduce soil erosion. But this is an expensiveway to restore severely degraded rangel<strong>and</strong>.Kilograms of grain needed per kilogram of body weightBeef cattlePigsChickenFish (catfishor carp)22.247How Can We Produce Meat More Sustainably?Shifting Our Meat PrioritiesWe can reduce the environmental impacts of meatproduction by relying more on fish <strong>and</strong> chicken <strong>and</strong>less on beef <strong>and</strong> pork.Livestock <strong>and</strong> fish vary widely in the efficiency withwhich they convert grain into animal protein (Figure14-22). A more sustainable form of meat production<strong>and</strong> consumption would involve shifting from lessgrain-efficient forms of animal protein, such as beef<strong>and</strong> pork, to more grain-efficient ones, such as poultry<strong>and</strong> farmed fish (Figure 14-22).Some environmentalists have called for reducinglivestock production (especially cattle) to decrease itsenvironmental effects <strong>and</strong> to feed more people. Thiswould decrease the environmental impact of livestockproduction, but it would not free up much l<strong>and</strong> orgrain to feed more of the world’s hungry people.Cattle <strong>and</strong> sheep that graze on rangel<strong>and</strong> use a resource(grass) that humans cannot eat, <strong>and</strong> most of thisl<strong>and</strong> is not suitable for growing crops. Moreover, becauseof poverty, insufficient economic aid, <strong>and</strong> the natureof global economic <strong>and</strong> food distribution systems,very little if any additional grain grown on l<strong>and</strong> onceused to raise livestock or livestock feed would reachthe world’s hungry people.14-8 CATCHING AND RAISINGMORE FISH AND SHELLFISHWhere Do We Get the Fish <strong>and</strong> Shellfish WeEat? Oceans <strong>and</strong> Fish FarmsAbout 88% of the fish <strong>and</strong> shellfish we eat comes fromthe ocean or is produced by aquaculture in aquaticfeedlots.The world’s third major food-producing system consistsof fisheries: concentrations of particular aquaticspecies suitable for commercial harvesting in a givenocean area or inl<strong>and</strong> body of water.About 55% of the annualcommercial catch of fish <strong>and</strong> shellfish comes fromthe ocean, mostly from plankton-rich coastal waters.Figure 14-22 Efficiency of converting grain into animal protein.Data in kilograms of grain per kilogram of body weight added.(U.S. Department of Agriculture)The rest of the catch comes from using aquacultureto raise marine <strong>and</strong> freshwater fish like livestock animalsin feedlots in ponds <strong>and</strong> underwater cages <strong>and</strong>from inl<strong>and</strong> freshwater fishing from lakes, rivers,reservoirs, <strong>and</strong> ponds. About one-third of the world’smarine fish harvest is used as animal feed, fishmeal,<strong>and</strong> oils.Some commercially important marine species offish <strong>and</strong> shellfish are shown in Figure 14-23 (p. 298).Fish <strong>and</strong> shellfish supply about 7% of the global foodsupply <strong>and</strong> are the primary source of animal protein forabout 1 billion people, mostly in developing countries.How Are Fish <strong>and</strong> Shellfish Harvested?Hunt <strong>and</strong> Gather As Much As You CanHigh-tech global fishing fleets roam the world’soceans to find <strong>and</strong> harvest most of the fish <strong>and</strong>shellfish we eat.The world’s commercial marine fishing industry isdominated by industrial fishing fleets using globalsatellite positioning equipment, sonar, huge nets <strong>and</strong>long fishing lines, spotter planes, <strong>and</strong> large factory shipsthat can process <strong>and</strong> freeze their catches. Figure 14-24(p. 299) shows the major methods used for the commercialharvesting of various marine fish <strong>and</strong> shellfish.Let us look at a few of these methods. Trawler fishingis used to catch fish <strong>and</strong> shellfish—especiallyshrimp, cod, flounder, <strong>and</strong> scallops—that live on ornear the ocean floor. It involves dragging a funnelshapednet held open at the neck along the ocean bottom<strong>and</strong> weighed down with chains or metal plates.This scrapes up almost everything that lies on theocean floor <strong>and</strong> often destroys bottom habitats—somewhat like clear-cutting the ocean floor. Newertrawling nets are large enough to swallow 12 jumbojets <strong>and</strong> even larger ones are on the way! The largemesh of the net allows most small fish to escape butcan capture <strong>and</strong> kill other species such as seals <strong>and</strong>http://biology.brookscole.com/miller14297
FishShellfishDemersal(mostly bottom dwelling)Pelagic(surface dwelling)CrustaceansMollusksHakeSardine Anchovy KrillOysterClamHerringShrimpHaddockMackerelLobsterOctopusCodTunaCrabSquidFigure 14-23 Some major types of commercially harvested marine fish <strong>and</strong> shellfish.endangered <strong>and</strong> threatened sea turtles. Only the largefish are kept. Most of the fish <strong>and</strong> other aquaticspecies—called bycatch—are thrown back into theocean dead or dying.Another method, purse-seine fishing, involvescatching surface-dwelling species such as tuna, mackerel,anchovies, <strong>and</strong> herring, which tend to feed inschools near the surface or in shallow areas. After locatinga school the fishing vessel surrounds it with alarge net called a purse seine. Then they close the netlike a drawstring purse to trap the fish. Nets used tocapture yellowfin tuna in the eastern tropical PacificOcean have killed large numbers of dolphins thatswim on the surface above schools of tuna.Fishing vessels also use longlining. It involvesputting out lines up to 130 kilometers (80 miles) long,hung with thous<strong>and</strong>s of baited hooks. The depth of thelines can be adjusted to catch open-ocean fish speciessuch as swordfish, tuna, <strong>and</strong> sharks or bottom fishessuch as halibut <strong>and</strong> cod. Longlines also hook endangeredsea turtles, sea-feeding albatross birds, <strong>and</strong> pilotwhales <strong>and</strong> dolphins.With drift-net fishing, fish are caught by huge driftingnets that can hang as much as 15 meters (50 feet)below the surface <strong>and</strong> be up to 64 kilometers (40 miles)long. This method can lead to overfishing of the desiredspecies <strong>and</strong> may trap <strong>and</strong> kill large quantities ofunwanted fish <strong>and</strong> marine mammals (such as dolphins,porpoises, <strong>and</strong> seals), marine turtles, <strong>and</strong>seabirds. Since 1992, a UN ban on the use of drift netslonger than 2.5 kilometers (1.6 miles) in internationalwaters has sharply reduced use of this technique. Butlonger nets continue to be used because compliance isvoluntary <strong>and</strong> it is difficult to monitor fishing fleetsover vast ocean areas. Also, the decrease in drift netshas led to increased use of longlines, which often havesimilar effects on marine wildlife.Figure 14-25 shows the effects of these now commonefforts to increase the seafood harvest. After increasingfourfold between 1960 <strong>and</strong> 1982, the annualcommercial fish catch (marine plus freshwater harvestbut excluding aquaculture) has declined <strong>and</strong> leveledoff (Figure 14-25, left). After doubling between 1950<strong>and</strong> 1956, the per capita catch leveled off until 1980<strong>and</strong> since then has been declining (Figure 14-25, right)<strong>and</strong> may continue to decline because of overfishing,pollution, habitat loss, <strong>and</strong> population growth.Connections: How Are Overfishing <strong>and</strong>Habitat Degradation Affecting FishHarvests? Dropping YieldsAbout three-fourths of the world’s commerciallyvaluable marine fish species are overfished or fishedat their biological limit.Fish are renewable resources as long as the annual harvestleaves enough breeding stock to renew the speciesfor the next year. Overfishing is the taking of so manyfish that too little breeding stock is left to maintainnumbers.Prolonged overfishing leads to commercial extinction,when the population of a species declines to thepoint at which it is no longer profitable to hunt forthem. Fishing fleets then move to a new species or a298 CHAPTER 14 Food <strong>and</strong> Soil Resources
Spotter airplaneFish farmingin cageTrawlerfishingPurse-seine fishingtrawl flaptrawl linessonartrawl bagfish schoolLong line fishingDrift-net fishingfloatfish caughtby gillsbuoylines withhooksFigure 14-24 Major commercial fishing methods used to harvest various marine species. These methods havebecome so effective that many fish have become commercially extinct.10025Catch(millions of metric tons)80604020Per capita catch(kilograms per person)201510501950 19601970 1980 1990 2000YearTotal World Fish Catch01950 19601970 1980 1990 2000YearWorld Fish Catch per PersonFigure 14-25 Natural capital degradation: world fish catch (left) <strong>and</strong> world fish catch per person (right),1950–2000. The total catch <strong>and</strong> per capita catches since 1990 may be about 10% lower than shown here becauseof the discovery in 2000 that since 1990 China had apparently been inflating its fish catches. (Data fromUN Food <strong>and</strong> Agriculture Organization <strong>and</strong> Worldwatch Institute)http://biology.brookscole.com/miller14299
new region, hoping that the overfished species willrecover.Overfishing is not new. Historical studies indicatethat some species were overfished beginning centuriesago. However, overfishing has greatly acceleratedwith the expansion of today’s large <strong>and</strong> efficient globalfishing fleets.According to the UN Food <strong>and</strong>Agriculture Organization,about three-fourths of the world’s 200 commerciallyvaluable marine fish species are either overfishedor fished to their estimated maximum sustainableyield. According to the Ocean Conservancy, “we arespending the principal of our marine fish resourcesrather than living off the interest they provide.” Analystswarn that some of these fisheries are so depletedthat even if all fishing stopped immediately it wouldtake up to 20 years for stocks to recover.Studies by the U.S. National Fish <strong>and</strong> WildlifeFoundation show that 14 major commercial fishspecies in U.S. waters such as some groundfishes (Figure14-26) have been severely depleted. Also, degradation,destruction, <strong>and</strong> pollution of wetl<strong>and</strong>s, estuaries,coral reefs, salt marshes, <strong>and</strong> mangroves threaten populationsof fish <strong>and</strong> shellfish.Good news. In 1995, fisheries biologists studiedpopulation data for 128 depleted fish stocks <strong>and</strong> concludedthat 125 of them could recover with carefulmanagement. This involves establishing fishing quotas,restricting use of certain types of fishing gear <strong>and</strong>methods, limiting the number of fishing boats, closingHarvest(thous<strong>and</strong>s of metric tons)800600400200Source: NMFS01960 1970AbundanceHarvest80706050403020101980 1990 2000YearAbundance(kilograms/tow)Figure 14-26 Natural capital degradation: The harvest ofgroundfishes (yellowtail flounder, haddock, <strong>and</strong> cod) in theGeorges Bank off the coast of New Engl<strong>and</strong> in the North Atlantic,once one of the world’s most productive fishing grounds, hasdeclined sharply since 1965. Stocks dropped to such low levelsthat since December 1994 the National Marine Fisheries Serviceshas banned fishing of these species in the Georges Bank.The closure helped. By 1999 populations of the major groundfishesbegan recovering. However, the fishery still remainsclosed because it has been so severely depleted. (Data fromU.S. National Marine Fisheries Service)fisheries during spawning periods, <strong>and</strong> setting asidenetworks of no-take reserves. So far we are not doingmost of these things.Should Governments Continue SubsidizingFishing Fleets? Too Many Boats ChasingToo Few FishGovernment subsidies given to the fishing industryare a major cause of overfishing.Overfishing is a big <strong>and</strong> growing problem because wehave too many commercial fishing boats <strong>and</strong> fleets tryingto hunt <strong>and</strong> gather a dwindling supply of the mostdesirable fish.It costs the global fishing industry about $120billion a year to catch $70 billion worth of fish. Governmentsubsidies such as fuel tax exemptions, pricecontrols, low-interest loans, <strong>and</strong> grants for fishing gearmake up most of the $50 billion annual deficit of theindustry. Without such subsidies, some of the world’sfishing boats <strong>and</strong> fleets would have to go out of business<strong>and</strong> the number of fish caught would approachtheir sustainable yield.Continuing to subsidize excess fishing allows somefishers to keep their jobs <strong>and</strong> boats a little longer whilemaking less <strong>and</strong> less money until the fishery collapses.Then all jobs are gone, <strong>and</strong> fishing communities suffereven more—another example of the tragedy of the commonsin action. Some of the money could be shiftedfrom subsidies to programs to buy out some fishingboats <strong>and</strong> retrain their crews.xHOW WOULD YOU VOTE? Should governments eliminateall fishing subsidies? Cast your vote online at http://biology.brookscole.com/miller14.What Is Aquaculture? Feedlots of the SeaRaising large numbers of fish <strong>and</strong> shellfish in ponds<strong>and</strong> cages is the world’s fastest growing type of foodproduction.Aquaculture involves raising fish <strong>and</strong> shellfish for foodlike crops instead of going out <strong>and</strong> hunting <strong>and</strong> gatheringthem. It is the world’s fastest-growing type of foodproduction <strong>and</strong> accounts for about one-third of the fish<strong>and</strong> shellfish we eat. China, the world leader, producesover two-thirds of the world’s aquaculture output.There are two basic types of aquaculture. Onecalled fish farming involves cultivating fish in a controlledenvironment (often a coastal or inl<strong>and</strong> pond,lake, reservoir, or rice paddy) <strong>and</strong> harvesting themwhen they reach the desired size.The other is fish ranching. It involves holdinganadromous species such as salmon that live part oftheir lives in fresh water <strong>and</strong> part in salt water in captivityfor the first few years of their lives, usually infenced-in areas or floating cages in coastal lagoons <strong>and</strong>300 CHAPTER 14 Food <strong>and</strong> Soil Resources
estuaries. Then the fish are released, <strong>and</strong> adults areharvested when they return to spawn (Figure 13-14,right, p. 269).Figure 14-27 lists the major advantages <strong>and</strong> disadvantagesof aquaculture. Some analysts project thatfreshwater <strong>and</strong> saltwater aquaculture productioncould provide at least half of the world’s seafood by2020. Some also propose increased use of aquacultureto grow single-cell algae such as Spirulina, which is70% protein.But other analysts warn that the harmful environmentaleffects of aquaculture (Figure 14-27, right)could limit future production. Also, some trends inaquaculture could harm ocean fisheries. For example,intensive farming of large carnivorous fish like salmon<strong>and</strong> trout is replacing traditional aquaculture in whichfarmed fish such as carp <strong>and</strong> tilapia eat plants <strong>and</strong>detritus. This increases overfishing of smaller marinespecies used to feed farmed carnivorous species. Ifkept up, this depletion of the seas to feed aquaculturefarms could cause the collapse of both marine fisheries<strong>and</strong> carnivorous aquaculture. Figure 14-28 lists someways to make aquaculture more sustainable <strong>and</strong> to reduceits environmental effects.AdvantagesHighly efficientHigh yield insmall volumeof waterIncreased yieldsthrough crossbreeding<strong>and</strong> geneticengineeringCan reduceoverharvestingof conventionalfisheriesLittle use of fuelProfits not tied toprice of oilHigh profitsT rade-OffsAquacultureDisadvantagesLarge inputs ofl<strong>and</strong>, feed, <strong>and</strong>water neededProduces large<strong>and</strong> concentratedoutputs of wasteDestroysmangrove forestsIncreased grainproduction neededto feed some speciesFish can be killedby pesticide runofffrom nearby cropl<strong>and</strong>Dense populationsvulnerable to diseaseTanks toocontaminated to useafter about 5 yearsFigure 14-27 Trade-offs: advantages <strong>and</strong> disadvantages ofaquaculture. Pick the single advantage <strong>and</strong> disadvantage thatyou think are the most important.SolutionsMore Sustainable Aquaculture• Reduce use of fishmeal as a feed to reducedepletion of other fish• Improve pollution management of aquaculturewastes• Reduce escape of aquaculture species into the wild• Restrict location of fish farms to reduce loss ofmangrove forests <strong>and</strong> other threatened areas• Farm some aquaculture species (such as salmon<strong>and</strong> cobia) in deeply submerged cages to protectthem from wave action <strong>and</strong> predators <strong>and</strong> allowdilution of wastes into the ocean• Set up a system for certifying sustainable forms ofaquacultureFigure 14-28 Solutions: Ways to make aquaculture moresustainable <strong>and</strong> reduce its harmful environmental effects.However, even under the most optimistic projections,increasing both the wild catch <strong>and</strong> aquaculturewill not increase world food supplies significantly. Thereason is that currently fish <strong>and</strong> shellfish supply onlyabout 1% of the energy <strong>and</strong> 6% of the total protein inthe human diet.xHOW WOULD YOU VOTE? Do the advantages of aquacultureoutweigh its disadvantages? Cast your vote online athttp://biology.brookscole.com/miller14.14-9 GOVERNMENT AGRICULTURALPOLICYHow Do Government Agricultural PoliciesAffect Food Production? To Interfere orNot to InterfereGovernments can use price controls to keep foodprices artificially low, give farmers subsidies toencourage food production, or eliminate food pricecontrols <strong>and</strong> subsidies <strong>and</strong> let farmers respond tomarket dem<strong>and</strong>.Agriculture is a financially risky business. Whetherfarmers have a good year or a bad year depends onfactors over which they have little control: weather,crop prices, crop pests <strong>and</strong> diseases, interest rates, <strong>and</strong>the global market. Because of the need for reliable foodsupplies despite fluctuations in these factors, mostgovernments provide various forms of assistance tofarmers <strong>and</strong> consumers.Governments use three main approaches to do this.One is to use price controls to keep food prices artificiallyhttp://biology.brookscole.com/miller14301
low. This makes consumers happy but means farmersmay not be able to make a living.Another is to give farmers subsidies <strong>and</strong> tax breaks tokeep them in business <strong>and</strong> encourage them to increase foodproduction. Globally, government price supports <strong>and</strong>other subsidies for agriculture total more than $300 billionper year (about $100 billion per year in the UnitedStates)—an average of more than half a million dollarsper minute! If government subsidies are too generous<strong>and</strong> the weather is good, farmers may produce morefood than can be sold. The resulting surplus depressesfood prices, which reduces the financial incentive forfarmers in developing countries to increase domesticfood production—those connections again.A third approach is to eliminate most or all pricecontrols <strong>and</strong> subsidies <strong>and</strong> let farmers respond to marketdem<strong>and</strong> without government interference. However,some analysts urge that any phaseout of farm subsidiesshould be coupled with increased aid for thepoor <strong>and</strong> the lower middle class, who would sufferthe most from any increase in food prices. Many environmentalistssay that instead of eliminating all subsidieswe should use them to reward farmers <strong>and</strong>ranchers who protect the soil, conserve water, reforestdegraded l<strong>and</strong>, protect <strong>and</strong> restore wetl<strong>and</strong>s, conservewildlife, <strong>and</strong> practice more sustainable agriculture<strong>and</strong> fishing.xHOW WOULD YOU VOTE? Should governments phase outsubsidies for conventional industrialized agriculture <strong>and</strong>phase in subsidies for more sustainable agriculture? Castyour vote online at http://biology.brookscole.com/miller14.14-10 SUSTAINABLE AGRICULTUREWhat Is More Sustainable Agriculture?Learn From NatureWe can produce food more sustainably byreducing resource throughput <strong>and</strong> workingwith nature.There are three main ways to reduce hunger <strong>and</strong> malnutrition<strong>and</strong> the harmful environmental effects ofagriculture. One is to slow population growth. Another isto reduce poverty so people can grow or buy enoughfood for their survival <strong>and</strong> good health.The third is to develop <strong>and</strong> phase in systems ofmore sustainable or low-input agriculture—alsocalled organic farming or agroecology—over the nextfew decades. Figure 14-29 lists the major componentsof more sustainable agriculture. This method of foodproduction uses technologies based on ecologicalknowledge to increase yields, control pests, <strong>and</strong> buildsoil fertility. It relies more on a variety of perennialcrops (polyculture) rather than monoculture of annualcrops. It recognizes that it is unwise to overuse pesti-MoreHigh-yieldpolycultureOrganic fertilizersBiological pestcontrolIntegrated pestmanagementIrrigation efficiencyPerennial cropsCrop rotationUse of more waterefficientcropsSoil conservationSubsidies for moresustainable farming<strong>and</strong> fishingSolutionsSustainable AgricultureLessSoil erosionSoil salinizationAquifer depletionOvergrazingOverfishingLoss of biodiversityLoss of primecropl<strong>and</strong>Food wasteSubsidies forunsustainablefarming <strong>and</strong>fishingPopulation growthPovertyFigure 14-29 Solutions: components of more sustainable,low-throughput agriculture.cides because this eliminates natural predators thathelp control pest populations <strong>and</strong> causes pest populationsto become genetically resistant to widely usedpesticides. Organic farmers or agroecologists also relymore or totally on manure <strong>and</strong> tilled-in crop residuesto help maintain <strong>and</strong> build soil fertility by increasingits carbon content. This can help reduce runoff <strong>and</strong> improvewater quality.Studies have shown that low-input organic farmingproduces roughly equivalent yields with lowercarbon dioxide emissions, uses about half as much energyper unit of yield than conventional farming, improvessoil fertility, <strong>and</strong> generally is more profitablefor the farmer than high-input farming.In 2002, agricultural scientists Paul Mader <strong>and</strong>David Dubois reported the results of a 21-year studycomparing organic <strong>and</strong> conventional farming. <strong>Their</strong>results <strong>and</strong> those from other studies have shown thatfor most crops low-input organic farming has a numberof advantages over conventional high-input farming.They include use of up to 56% less energy per unitof yield, <strong>and</strong> improved soil health <strong>and</strong> fertility. Organicfarming also provides more habitats for wildplant <strong>and</strong> animal species <strong>and</strong> generally is more profitablefor the farmer than high-input farming.302 CHAPTER 14 Food <strong>and</strong> Soil Resources
Currently, organic farming is used on less than 1%of the world’s cropl<strong>and</strong> (0.2% in the United States) buton 6–10% of the cropl<strong>and</strong> in many European countries.In 2002, global sales of organic foods amounted toabout $23 billion <strong>and</strong> such sales are growing rapidly inthe United States, Canada, <strong>and</strong> much of Europe.Most proponents of more sustainable agricultureare not opposed to high-yield agriculture. Instead, theysee it as vital for protecting the earth’s biodiversity byreducing the need to cultivate new <strong>and</strong> often marginall<strong>and</strong>. They call for using environmentally sustainableforms of both high-yield polyculture (pp. 273 <strong>and</strong> 278)<strong>and</strong> high-yield monoculture for growing crops.How Can We Make the Transitionto More Sustainable Agriculture?Get SeriousMore research, demonstration projects, governmentsubsidies, <strong>and</strong> training can promote a shift to moresustainable agriculture.Analysts suggest four major strategies to help farmersmake the transition to more sustainable agriculture.First, greatly increase research on sustainable agriculture<strong>and</strong> improving human nutrition. Second, set updemonstration projects throughout each country sofarmers can see how more sustainable agricultural systemswork. Third, provide subsidies <strong>and</strong> increased foreignaid to encourage its use. Fourth, establish trainingprograms in sustainable agriculture for farmers <strong>and</strong>government agricultural officials <strong>and</strong> encourage thecreation of college curricula in sustainable agriculture<strong>and</strong> human nutrition.Phasing in more sustainable agriculture involvesapplying the four principles of sustainability (Figure9-15, p. 174) to producing food. The goal is to feedthe world’s people while sustaining the earth’s naturalcapital <strong>and</strong> living off the natural income itprovides. This will not be easy, but it can be done. Figure14-30 lists some ways you can promote more sustainableagriculture.The sector of the economy that seems likely to unravel first isfood. Eroding soils, deteriorating rangel<strong>and</strong>s, collapsingfisheries, falling water tables, <strong>and</strong> rising temperatures areconverging to make it difficult to exp<strong>and</strong> food production fastenough to keep up with the dem<strong>and</strong>.LESTER R. BROWNCRITICAL THINKING1. Summarize the major economic <strong>and</strong> ecological advantages<strong>and</strong> limitations of each of the following proposalsfor increasing world food supplies <strong>and</strong> reducing hungerover the next 30 years: (a) cultivating more l<strong>and</strong> by clearingtropical forests <strong>and</strong> irrigating arid l<strong>and</strong>s, (b) catchingmore fish in the open sea, (c) producing more fish <strong>and</strong>shellfish with aquaculture, <strong>and</strong> (d) increasing the yieldper area of cropl<strong>and</strong>.2. List five ways in which your lifestyle directly or indirectlycontributes to soil erosion.3. What are the three most important actions you wouldtake to reduce hunger (a) in the country where you live<strong>and</strong> (b) in the world?4. Some have suggested that rangel<strong>and</strong>s could be used toraise wild grazing animals for meat instead of conventionallivestock. Others consider it unethical to raise <strong>and</strong>kill wild herbivores for food. What do you think? Explain.5. Should governments phase in agricultural tax breaks<strong>and</strong> subsidies to encourage farmers to switch to moresustainable farming? Explain your answer.6. Explain why you support or oppose greatly increaseduse of (a) genetically modified food, (b) perennial foodcrops, <strong>and</strong> (c) polyculture.7. Suppose you live near a coastal area <strong>and</strong> a companywants to use a fairly large area of coastal marshl<strong>and</strong> foran aquaculture operation. If you were an elected local official,would you support or oppose such a project? Explain.What safeguards or regulations would you imposeon the operation?8. Congratulations! You are in charge of the world. Listthe three most important features of (a) your agriculturalpolicy, (b) your policy to reduce soil erosion, <strong>and</strong> (c) yourpolicy for more sustainable harvesting <strong>and</strong> farming offish <strong>and</strong> shellfish.PROJECTSWhat Can You Do?•Waste less foodSustainable Agriculture• Reduce or eliminate meat consumption• Feed pets balanced grain foods instead of meat• Use organic farming to grow some of your food• Buy organic food• Compost your food wastesFigure 14-30 What can you do? Ways to promote moresustainable agriculture.1. Conduct a survey of soil erosion <strong>and</strong> soil conservationin <strong>and</strong> around your community on cropl<strong>and</strong>, constructionsites, mining sites, grazing l<strong>and</strong>, <strong>and</strong> deforestedl<strong>and</strong>. Use these data to develop a plan for reducing soilerosion in your community.http://biology.brookscole.com/miller14303
2. If possible, visit both a conventional industrializedfarm <strong>and</strong> an organic or low-input farm. Compare (a) soilerosion <strong>and</strong> other forms of l<strong>and</strong> degradation, (b) use <strong>and</strong>costs of energy, (c) use <strong>and</strong> costs of pesticides <strong>and</strong> inorganicfertilizer, (d) use <strong>and</strong> costs of natural pest control<strong>and</strong> organic fertilizer, (e) yields per hectare for the samecrops, <strong>and</strong> (f) overall profit per hectare for the samecrops.3. Try to gather data evaluating the harmful environmentaleffects of nearby agriculture on your local community.What is being done to reduce these effects?4. Use health <strong>and</strong> other local government records to estimatehow many people in your community suffer fromundernutrition or malnutrition. Has this problem increasedor decreased since 1980? What are the basiccauses of this hunger problem, <strong>and</strong> what is being done toalleviate it? Share the results of your study with local officials,<strong>and</strong> present your own plan for improving effortsto reduce hunger in your community.5. Make a list of all the food you eat in one day <strong>and</strong> readall labels or look up the amount of calories, fat, protein,<strong>and</strong> carbohydrates in each food. Then determine howmany calories you took in that day <strong>and</strong> the percentage ofyour diet from fat, protein, <strong>and</strong> carbohydrates. Rate yourdiet as healthy, borderline healthy, or unhealthy. Compareyour results with those of your classmates.6. Use the library or the Internet to learn about the fourtypes of vegetarians <strong>and</strong> the advantages <strong>and</strong> disadvantagesof a vegetarian diet in terms of your health <strong>and</strong> theenvironment.7. Use the library or the Internet to find bibliographic informationabout Aldo Leopold <strong>and</strong> Lester R. Brown, whosequotes appear at the beginning <strong>and</strong> end of this chapter.8. Make a concept map of this chapter’s major ideas, usingthe section heads, subheads, <strong>and</strong> key terms (in boldfacetype). Look on the website for this book for informationabout making concept maps.LEARNING ONLINEThe website for this book contains study aids <strong>and</strong> manyideas for further reading <strong>and</strong> research. They include achapter summary, review questions for the entire chapter,flash cards for key terms <strong>and</strong> concepts, a multiple-choicepractice quiz, interesting Internet sites, references, <strong>and</strong> aguide for accessing thous<strong>and</strong>s of InfoTrac ® College Editionarticles. Log on tohttp://biology.brookscole.com/miller14Then click on the Chapter-by-Chapter area, choose Chapter14, <strong>and</strong> select a learning resource.304 CHAPTER 14 Food <strong>and</strong> Soil Resources
15 WaterResourcesWaterCASE STUDYWater Conflictsin the Middle EastIn the near future, water-short countries in the MiddleEast are likely to engage in conflicts over access to waterresources. Most water in this dry region comesfrom three shared river basins: the Nile, Jordan, <strong>and</strong>Tigris–Euphrates (Figure 15-1).Three countries—Ethiopia, Sudan, <strong>and</strong> Egypt—use most of the water that flows in Africa’s Nile River,with Egypt being last in line along the river.To meet the water needs of its rapidly growingpopulation, Ethiopia plans to divert more water fromthe Nile. So does Sudan. Such upstream diversionswould reduce the amount of water available toEgypt, which cannot exist without irrigationwater from the Nile.Egypt can go to war with Sudan <strong>and</strong>Ethiopia for more water, cut population growth,or improve irrigation efficiency. Other optionsare to import more grain to reduce the need forirrigation water, work out water-sharing agreementswith other countries, or suffer the harshhuman <strong>and</strong> economic consequences of hydrologicalpoverty.The Jordan basin is by far the most watershortregion, with fierce competition for its wateramong Jordan, Syria, Palestine (Gaza <strong>and</strong> theWest Bank), <strong>and</strong> Israel.Syria plans to build dams <strong>and</strong> withdrawmore water from the Jordan River, decreasingthe downstream water supply for Jordan <strong>and</strong> Israel.Israel warns that it may destroy the largestdam that Syria plans to build.Turkey, located at the headwaters of theTigris <strong>and</strong> Euphrates rivers, controls how muchwater flows downstream to Syria <strong>and</strong> Iraq beforeemptying into the Persian Gulf. Turkey isbuilding 24 dams along the upper Tigris <strong>and</strong>Euphrates to generate electricity <strong>and</strong> irrigate alarge area of l<strong>and</strong>.If completed, these dams will reduce theflow of water downstream to Syria <strong>and</strong> Iraq byMEDITERRANEANSEALEBANONWEST BANKGAZAEGYPTup to 35% in normal years <strong>and</strong> much more in dryyears. Syria also plans to build a large dam along theEuphrates to divert water arriving from Turkey. Thiswill leave little water for Iraq <strong>and</strong> could lead to a waterwar between it <strong>and</strong> Syria.Resolving these water distribution problems willrequire a combination of regional cooperation in allocatingwater supplies, slowed population growth, improvedefficiency in water use, higher water prices tohelp improve irrigation efficiency, <strong>and</strong> increased grainimports to reduce water needs. This will not be easy.To many analysts, emerging water shortages inmany parts of the world—along with the related problemsof biodiversity loss <strong>and</strong> climate change—are thethree most serious environmental problems the worldfaces during this century.NileNileSUDANTURKEYRED SEAEuphratesSYRIAISRAELIRAQJORDANETHIOPIATigrisARMENIAKUWAITSAUDIARABIABAHRAINQATARYEMENDJIBOUTISOMALIAPersian GulfUNITED ARABEMIRATESIRANOMANFigure 15-1 The Middle East, whose countries have some of the highestpopulation growth rates in the world. Because of the dry climate, food productiondepends heavily on irrigation. Existing conflicts between countriesin this region over access to water may soon overshadow both long-st<strong>and</strong>ingreligious <strong>and</strong> ethnic clashes <strong>and</strong> take over valuable oil supplies.
Our liquid planet glows like a soft blue sapphire in the hardedgeddarkness of space. There is nothing else like it in thesolar system. It is because of water.JOHN TODDThis chapter discusses the water problems we face <strong>and</strong>ways to use this wonderful but irreplaceable resourcemore sustainably. It addresses the following questions:■■■■■■■■■What are water’s unusual physical properties?How much fresh water is available to us, <strong>and</strong> howmuch of it are we using?What causes freshwater shortages, <strong>and</strong> what can bedone about this problem?What are the advantages <strong>and</strong> disadvantages of usingdams <strong>and</strong> reservoirs to supply more water?What are the advantages <strong>and</strong> disadvantages oftransferring large amounts of water from one placeto another?What are the advantages <strong>and</strong> disadvantages ofwithdrawing groundwater <strong>and</strong> converting saltwater to fresh water?How can we waste less water?What are the causes of flooding, <strong>and</strong> what can bedone to reduce the risk of flooding <strong>and</strong> flooddamage?How can we use the earth’s water more sustainably?15-1 WATER’S IMPORTANCEAND UNIQUE PROPERTIESWhy Is Water So Important? LiquidNatural CapitalWater keeps us alive, moderates climate, sculptsthe l<strong>and</strong>, <strong>and</strong> removes <strong>and</strong> dilutes wastes <strong>and</strong>pollutants.We live on the water planet, with a precious film ofwater—most of it salt water—covering about 71% ofthe earth’s surface. Look in the mirror. What you see isabout 60% water, most of it inside your cells.No species can do without water. You could surviveseveral weeks without food but only a few dayswithout water. It takes huge amounts of water to supplyyou with food, shelter, <strong>and</strong> other needs <strong>and</strong> wants.Water also plays a key role in sculpting the earth’s surface,moderating climate, <strong>and</strong> removing <strong>and</strong> dilutingwastes <strong>and</strong> pollutants.What Are Some Important Propertiesof Water? An Amazing MoleculeWater’s unique <strong>and</strong> important properties arise mostlyfrom attractive forces between its molecules.Water is a remarkable substance with a unique combinationof properties:■ There are strong forces of attraction (called hydrogenbonds, Appendix 3, Figure 4) between molecules of water.These attractive forces are the major factor determiningwater’s distinctive properties.■ Water exists as a liquid over a wide temperature rangebecause of the strong forces of attraction between watermolecules. Without its high boiling point the oceanswould have evaporated a long time ago.■ Liquid water changes temperature slowly because it canstore a large amount of heat without a large change in temperature.This high heat capacity helps protect livingorganisms from temperature fluctuations. It also moderatesthe earth’s climate <strong>and</strong> makes water an excellentcoolant for car engines <strong>and</strong> power plants.■ Evaporating liquid water takes large amounts of energybecause of the strong forces of attraction between its molecules.Water absorbs large amounts of heat as itchanges into water vapor <strong>and</strong> releases this heat as thevapor condenses back to liquid water. This helps distributeheat throughout the world <strong>and</strong> determine theclimates of various areas (Figure 6-9, p. 107 <strong>and</strong>Figure 6-10, p. 107. This property also makes evaporationcooling process—explaining why you feel coolerwhen perspiration evaporates from your skin.■ Liquid water can dissolve a variety of compounds. Thisenables it to carry dissolved nutrients into the tissuesof living organisms, flush waste products out of thosetissues, serve as an all-purpose cleanser, <strong>and</strong> help remove<strong>and</strong> dilute the water-soluble wastes of civilization.This property also means that water-solublewastes can easily pollute water.■ Water filters out wavelengths of the sun’s ultraviolet(UV) radiation that would harm some aquatic organisms.■ Attractive forces between the molecules of liquid watercause its surface to contract <strong>and</strong> to adhere to <strong>and</strong> coat asolid. These strong cohesive forces allow narrowcolumns of water to rise through a plant from its rootsto its leaves (capillary action).■ Unlike most liquids, water exp<strong>and</strong>s when it freezes.This means that ice floats on water because it has alower density (mass per unit of volume) than liquidwater. Otherwise lakes <strong>and</strong> streams in cold climateswould freeze solid <strong>and</strong> lose most of their currentforms of aquatic life. Because water exp<strong>and</strong>s uponfreezing, it can break pipes, crack a car’s engine block(which is why we use antifreeze), break up streets,<strong>and</strong> fracture rocks that end up as soil particles.Without these unique properties of water, you <strong>and</strong>most other forms of life on this planet would not exist.As water endlessly recycles through the biosphere, it306 CHAPTER 15 Water Resources
physically connects us to one another, to other formsof life, <strong>and</strong> to the entire planet.Despite its importance, water is one of our mostpoorly managed resources. We waste it <strong>and</strong> pollute it.We also charge too little for making it available. Thisencourages still greater waste <strong>and</strong> pollution of this resource,for which we have no substitute. As BenjaminFranklin said many decades ago: “It is not until thewell runs dry that we know the worth of water.”15-2 SUPPLY, RENEWAL, AND USEOF WATER RESOURCESHow Much Fresh Water Is Available?Natural Recycling to the RescueOnly about 0.01% of the earth’s water supply isavailable to us as fresh water, but this supply isrecycled.Only a tiny fraction of the planet’s abundant water isavailable to us as fresh water (Figure 15-2). Study thisfigure carefully to see where the world’s water isfound. About 97.4% of the world’s total volume ofwater is found in oceans <strong>and</strong> saline lakes <strong>and</strong> is toosalty for drinking, irrigation, or industry (except as acoolant). Most of the remaining 2.6% that is freshwater is locked up in ice caps or glaciers or in groundwatertoo deep or salty to be used.Thus only about 0.014% of the earth’s total volumeof water is easily available to us as soil moisture,usable groundwater, water vapor, <strong>and</strong> lakes <strong>and</strong>streams. If the world’s water supply were only 100liters (26 gallons), our usable supply of fresh waterwould be only 0.014 liter, or 2.5 teaspoons!Fortunately, the world’s fresh water supply is continuouslycollected, purified, recycled, <strong>and</strong> distributedin the solar-powered hydrologic cycle (Figure 4-28,p. 76). You might want to review this figure to trace thecirculation of the earth’s water as it evaporates fromwater, l<strong>and</strong>, <strong>and</strong> organisms into the atmosphere; condenses<strong>and</strong> falls as precipitation back to the earth’sl<strong>and</strong> <strong>and</strong> water; <strong>and</strong> flows across the earth’s surfacesas runoff into streams, rivers, lakes, wetl<strong>and</strong>s, <strong>and</strong> theseas <strong>and</strong> infiltrates underground.This magnificent water recycling <strong>and</strong> purificationsystem works only as long as we do not overload watersystems with slowly degradable <strong>and</strong> nondegradablewastes or withdraw water from undergroundsupplies faster than it is replenished. Bad news. In partsof the world we are doing both of these things.Differences in average annual precipitation dividethe world’s continents, countries, <strong>and</strong> people into waterhaves <strong>and</strong> have-nots. Some places get lots of rain (thedark green <strong>and</strong> light green areas in Figure 6-6, p. 106)<strong>and</strong> others very little (the yellow areas in Figure 6-6,p. 106). For example, Canada, with only 0.5% of theworld’s population, has 20% of the world’s fresh water,whereas China, with 21% of the world’s people,has only 7% of the supply.What Is Surface Water? Water on TopWater that does not sink into the ground or evaporateinto the air runs off into bodies of water.One of our most precious resources is fresh water thatflows across the earth’s l<strong>and</strong> surface <strong>and</strong> into theworld’s rivers, streams, lakes, wetl<strong>and</strong>s, <strong>and</strong> estuaries.The precipitation that does not infiltrate the ground orreturn to the atmosphere by evaporation (includingtranspiration from plants) is called surface runoff. Theregion from which surface water drains into a river,lake, wetl<strong>and</strong>, or other body of water is called its watershedor drainage basin.The renewable supplies of freshwater we dependon consist of accessible surface runoff <strong>and</strong> freshwaterthat infiltrates into aquifers found fairly near theearth’s surface. About two-thirds of the world’s annualrunoff is lost by seasonal floods <strong>and</strong> is not available forhuman use. The remaining one-third is reliable runoff:the amount of runoff that we can generally count on asa stable source of water from year to year.All waterOceans <strong>and</strong>saline lakes97.4%Fresh water2.6%Fresh waterIce caps<strong>and</strong> glaciers1.984%Groundwater0.592%0.014%Readily accessible fresh waterLakes0.007%Soilmoisture0.005%Biota0.0001%Rivers0.0001%Atmosphericwater vapor0.001%Figure 15-2 Natural capital: the planet’s water budget. Only a tiny fraction by volume of the world’s watersupply is fresh water available for human use.http://biology.brookscole.com/miller14307
What Is Groundwater? Water DownBelowSome precipitation infiltrates the ground <strong>and</strong> isstored in spaces in soil <strong>and</strong> rock.Some precipitation infiltrates the ground <strong>and</strong> percolatesdownward through voids (pores, fractures,crevices, <strong>and</strong> other spaces) in soil <strong>and</strong> rock (Figure 15-3).The water in these spaces is called groundwater—oneof our most important sources of fresh water. Groundwaterfound within 1 kilometer (0.6 miles) of the earth’ssurface contains more than 100 times all the waterfound in the world’s rivers, streams, freshwater lakes,<strong>and</strong> reservoirs combined.Close to the surface in the zone of aeration, thepores of the soil contain a mixture of air <strong>and</strong> somewater. Lower layers of soil where the spaces are completelyfilled with water make up the zone of saturation.We drill shallow wells to tap into groundwater inthis zone. The water table is located at the top of thezone of saturation. It falls in dry weather or when weremove groundwater faster than it is replenished, <strong>and</strong>rises in wet weather.Deeper down are geological layers called aquifers:porous, water-saturated layers of s<strong>and</strong>, gravel, orbedrock through which groundwater flows. They arelike large elongated sponges through which groundwaterseeps. Fairly watertight layers of rock or clay belowan aquifer keep the water from seeping out. Aboutone of every three people on the earth depends on waterpumped out of aquifers for drinking <strong>and</strong> other uses.Most aquifers are replenished naturally by precipitationthat percolates downward through soil <strong>and</strong>rock in what is called natural recharge. But some arerecharged from the side by lateral recharge from nearbystreams. Most aquifers recharge extremely slowly.PrecipitationUnconfined Aquifer Recharge AreaEvaporation <strong>and</strong> transpirationEvaporationConfinedRechargeAreaRunoffFlowingartesian wellInfiltrationWatertableRechargeUnconfinedAquiferInfiltrationStreamWellrequiringa pumpLakeUnconfined aquiferLesspermeable materialsuch as clayConfined aquiferConfining impermeable rock layerFigure 15-3 Natural capital: groundwater system. An unconfined aquifer is an aquifer with a water table. Aconfined aquifer is bounded above <strong>and</strong> below by less permeable beds of rock. Groundwater in this type ofaquifer is confined under pressure. Some aquifers are replenished by precipitation <strong>and</strong> others are not.308 CHAPTER 15 Water Resources
Groundwater normally moves from points of highelevation <strong>and</strong> pressure to points of lower elevation<strong>and</strong> pressure. This movement is quite slow, typicallyonly a meter or so (about 3 feet) per year <strong>and</strong> rarelymore than 0.3 meter (1 foot) per day.There is a hydrological connection between groundwater<strong>and</strong> surface water because eventually mostgroundwater flows into rivers, lakes, estuaries, <strong>and</strong>wetl<strong>and</strong>s. Thus if we disrupt the hydrological cycleby removing groundwater faster than it is replenished,some nearby streams, lakes, <strong>and</strong> wetl<strong>and</strong>s c<strong>and</strong>ry up.Some aquifers get very little, if any, recharge <strong>and</strong>on a human time scale are nonrenewable resources.Typically these nonreplenishable aquifers—also calledfossil aquifers—are found fairly deep underground <strong>and</strong>were formed tens of thous<strong>and</strong>s of years ago. Withdrawalsfrom them amount to water mining that, if keptup, will deplete these ancient deposits.How Much of the World’s Reliable WaterSupply Are We Withdrawing? Taking HalfNow <strong>and</strong> More LaterWe are using more than half of the world’s reliablerunoff of surface water <strong>and</strong> could be using 70–90%by 2025.Withdrawal is the total amount of water we removefrom a river, lake, or aquifer for any purpose. Some ofthis water may be returned to its source. For example,most water withdrawn from a river or lake to help coolpower plants may be returned to its source. However,this input of heated water can disrupt aquatic life, aphenomenon known as thermal pollution.Some of the water withdrawn from a source maybe returned to that source for reuse. Consumptive wateruse occurs when water withdrawn is not available forreuse in the basin from which it was removed—mostlybecause of losses such as evaporation, seepage into theground, transport to another area, or contamination.During the last century, the human populationtripled, global water withdrawal increased sevenfold,<strong>and</strong> per capita withdrawal quadrupled. As a result, wenow withdraw about 34% of the world’s reliablerunoff. We leave another 20% in streams to transportgoods by boats, dilute pollution, <strong>and</strong> sustain fisheries<strong>and</strong> wildlife. Thus we directly or indirectly use about 54%of the world’s reliable runoff of surface water.Because of increased population growth alone,global withdrawal rates of surface water could reachmore than 70% of the reliable surface runoff by 2025—90% if per capita withdrawal of water continues risingat the current rate. This is a global average, with withdrawalrates already exceeding the reliable runoff in agrowing number of areas.How Do We Use the World’s Fresh Water?Watering Crops Is Number OneIrrigation is the biggest user of water (70%)followed by industries (20%), <strong>and</strong> cities <strong>and</strong>residences (10%).Worldwide, we use about 70% of the water we withdraweach year from surface waters <strong>and</strong> aquifers to irrigateone-fifth of the world’s cropl<strong>and</strong>. This producesabout 40% of the world’s food, including two-thirds ofthe rice <strong>and</strong> wheat. About 85% of the water withdrawnfor irrigation is consumed <strong>and</strong> not returned to its waterbasin, mostly because of evaporation <strong>and</strong> seepageinto the ground. Some of this water is also contaminatedwith salts <strong>and</strong> pesticides.Industry uses about 20% of the water withdrawneach year, <strong>and</strong> cities <strong>and</strong> residences use the remaining10%. Uses of withdrawn water vary from one regionor country to another (Figure 15-4)..Just about anything you do uses water. Readinga newspaper, driving a car, eating a hamburger or abowl of rice, wearing cotton clothing, or drinking abeverage out of an aluminum can involve processes orproducts that require large amounts of water (Figure15-5, p. 310).There is also a difference in water priorities betweendeveloped <strong>and</strong> developing nations. Accordingto the United Nations, for example, the daily minimumamount of water needed to support three fourthsof the world’s people is equal to the amount of waterused each day to irrigate the world’s golf courses.Case Study: Freshwater Resources in theUnited States—Unequal DistributionThe United States has plenty of fresh water, butsupplies vary in different areas depending onclimate.The United States has more than enough renewablefresh water. But much of it is in the wrong place at thePower plantcooling38%United StatesAgriculture41%ChinaAgriculture 87%Industry 11% Public 10% Public 6% Industry 7%Figure 15-4 Use of water withdrawn in the United States <strong>and</strong>China. In the United States, about two-thirds of irrigation watercomes from surface sources <strong>and</strong> the rest comes from underground.(Worldwatch Institute <strong>and</strong> World Resources Institute)http://biology.brookscole.com/miller14309
1 automobile1 kilogramcotton1 kilogramaluminum1 kilogramgrain-fed beef1 kilogramrice1 kilogramcorn1 kilogrampaper1 kilogramsteel1,500 liters(400 gallons)880 liters(230 gallons)220 liters(60 gallons)10,500 liters(2,400 gallons)9,000 liters(2,800 gallons)7,000 liters(1,900 gallons)5,000 liters(1,300 gallons)Average annual precipitation (centimeters)Less than 41 81–12241–81More than 122400,000 liters(106,000 gallons)Figure 15-5 Amount of water needed to produce somecommon agricultural <strong>and</strong> manufactured products. (U.S.Geological Survey)wrong time or is contaminated by agricultural <strong>and</strong> industrialpractices. The eastern states usually have ampleprecipitation, whereas many western states havetoo little (Figure 15-6, top).In the East, most water is used for energy production,cooling, <strong>and</strong> manufacturing. The largest use byfar in the West (85%) is for irrigation.In many parts of the eastern United States, themost serious water problems are flooding, occasionalurban shortages, <strong>and</strong> pollution. For example, the 3 millionresidents of Long Isl<strong>and</strong>, New York, get most oftheir water from an increasingly contaminated aquifer.The major water problem in the arid <strong>and</strong> semiaridareas of the western half of the country (Figure 15-6,bottom) is a shortage of runoff, caused by low precipitation(Figure 15-6, top), high evaporation, <strong>and</strong> recurringprolonged drought. Water tables in many areasare dropping rapidly as farmers <strong>and</strong> cities depleteaquifers faster than they are recharged.In 2003, the U.S. Department of the Interiormapped out water hot spots in 17 western states (Figure15-7). In these areas, competition for scarce water tosupport growing urban areas, irrigation, recreation,Wash.OregonIdahoMontanaWyomingN.D.S.D.NevadaNeb.UtahColo.KansasCaliforniaOak.N.M.TexasAcute shortageShortageAdequate supplyMetropolitan regions with populationgreater than 1 millionFigure 15-6 Average annual precipitation <strong>and</strong> major rivers (top)<strong>and</strong> water-deficit regions in the continental United States <strong>and</strong>their proximity to metropolitan areas having or projected tohave populations greater than 1 million (bottom). (U.S. WaterResources Council <strong>and</strong> U.S. Geological Survey)Highly likely conflict potentialSubstantial conflict potentialModerate conflict potentialUnmet rural water needsFigure 15-7 Water hot spot areas in 17 western states thatby 2025 could be faced with intense conflicts <strong>and</strong> “water wars”over competition for scarce water for urban growth, irrigation,recreation, <strong>and</strong> wildlife. Some analysts suggest that this isa map of places not to live over the next 25 years. (U.S.Department of the Interior)310 CHAPTER 15 Water Resources
<strong>and</strong> wildlife could trigger “water wars”—intense political<strong>and</strong> legal conflicts—in the next 20 years.15-3 TOO LITTLE WATERWhat <strong>Causes</strong> Freshwater Shortages? Climate<strong>and</strong> Dem<strong>and</strong>Dry climate, drought, dry soil, <strong>and</strong> too many peopleusing the reliable supply cause water scarcity.According to Swedish hydrologist Malin Falkenmark,there are four causes of water scarcity: dry climate,drought (a prolonged period in which precipitation isat least 70% lower <strong>and</strong> evaporation is higher than normal),desiccation (drying of exposed soil because ofactivities such as deforestation <strong>and</strong> overgrazing bylivestock), <strong>and</strong> water stress (low per capita availabilityof water caused by increasing numbers of people relyingon limited runoff).Figure 15-8 shows the degree of stress on theworld’s major river systems, based on the amount ofwater available compared to the amount used by humans.A country is said to be water stressed when thevolume of reliable runoff per person drops belowabout 1,700 cubic meters (60,000 cubic feet) per year.This usually occurs when water withdrawal is morethan 20% higher than the reliable supply. A countrysuffers from water scarcity when per capita water availabilityfalls below 1,000 cubic meters (35,000 cubic feet)per year.According to the United Nations, about 41% of theworld’s population lives in river basins located in 20countries that suffer from water stress or water scarcity.Look at the red <strong>and</strong> orange areas in Figure 15-8 to seewhere these areas are located. The number of countriessuffering from water stress or water scarcity couldgrow to 40 countries by 2020 <strong>and</strong> 60 countries by 2050.Some areas have lots of water, but the largest riverscarrying most of the runoff are far from agricultural<strong>and</strong> population centers. For example, South Americahas the largest annual water runoff of any continent,but 60% of the runoff flows through the Amazon Riverin remote areas where few people live.In some areas, overall precipitation is plentiful butarrives mostly during short periods or cannot be collected<strong>and</strong> stored because of a lack of storage capacity.For example, only a few hours of rain provide overhalf of India’s rainfall during a four-month monsoonseason.The volumes of some of the world’s lakes <strong>and</strong>rivers have shrunk drastically, mostly because of humanwithdrawals of water for irrigation <strong>and</strong> industry.Siberia’s Aral Sea, once the world’s fourth-largestfreshwater lake, has shrunk in area to less than half itsformer size <strong>and</strong> lost 83% of its volume of water sinceEuropeNorthAmericaAsiaAfricaSouthAmericaStressAustraliaHighNoneFigure 15-8 Natural capital degradation: stress on the world’s major river basins, based on a comparison ofthe amount of water available with the amount used by humans. (Data from World Commission on Water Use inthe 21st Century)http://biology.brookscole.com/miller14311
1960. The area of West Africa’s Lake Chad, once theworld’s sixth largest lake, has shrunk by 92% since1960 because of a combination of water diversion forirrigation <strong>and</strong> periods of prolonged drought. In thedry season, water flowing in the Colorado River <strong>and</strong> anumber of other rivers throughout the world rarelyreaches the ocean.How Many of the World’s People Do NotHave Access to Enough Fresh Water? AquaticInequalityAbout one out of six people do not have regular accessto an adequate <strong>and</strong> affordable supply of cleanwater, <strong>and</strong> this could increase to at least one out offour people by 2050.Good news. During the last century about 816 millionpeople gained access to fresh water that is safe enoughto drink. And in rural areas the percentage of familieswith access to safe drinking water rose from 10% tonearly 75%.Bad news. A 2003 study by the United Nationsfound that about one out of six people do not have regularaccess to an adequate <strong>and</strong> affordable supply ofsafe drinking water <strong>and</strong> this could increase to at leastone out of four people by 2050.Even when a plentiful supply of water exists, mostof the 1.1 billion poor people living on less than $1 aday cannot afford a safe supply of drinking water <strong>and</strong>must live in hydrological poverty. Most are cut off frommunicipal water supplies <strong>and</strong> must collect water fromunsafe sources or buy water—often coming from pollutedrivers—from private vendors at high prices. Inwater-short rural areas in developing countries, manywomen <strong>and</strong> children must walk long distances eachday, carrying heavy jars or cans, to get a meager <strong>and</strong>sometimes contaminated supply of water.How Can We Increase Freshwater Supplies?Withdraw More <strong>and</strong> Waste LessWe can increase water supplies by building dams,bringing in water from elsewhere, withdrawinggroundwater, converting salt water to fresh water,wasting less water, <strong>and</strong> importing food.There are several ways to increase the supply of freshwater in a particular area. One is to build dams <strong>and</strong>reservoirs to store runoff for release as needed. Anotheris to bring in surface water from another area.We can also withdraw groundwater <strong>and</strong> convert saltwater to fresh water (desalination). Other strategiesare to reduce water waste <strong>and</strong> import food to reducewater use in growing producing crops <strong>and</strong> raisinglivestock.In developed countries, people tend to live wherethe climate is favorable <strong>and</strong> bring in water from anotherwatershed. In developing countries, most people(especially the rural poor) must settle where the wateris <strong>and</strong> try to capture the precipitation they need.Who Should Own <strong>and</strong> Manage FreshwaterResources? Government versus PrivateOwnershipThere is controversy over whether water suppliesshould be owned <strong>and</strong> managed by governmentsor by private corporations.Is access to enough clean water to meet one’s basicneeds a basic human right, or is water a commodity tobe sold in the marketplace? Most people would saythat everyone should have a right to clean water. Theproblem is, who will pay for making water available toeveryone?Most water resources are owned by governments<strong>and</strong> managed as publicly owned resources for their citizens.However, an increasing number of governmentsare retaining ownership of these public resources buthiring private companies to manage them. In addition,three large transnational companies—Vivendi, Suez,<strong>and</strong> RWE—based in Europe have a long-range strategyto buy up as much of the world’s water supplies aspossible, especially in Europe <strong>and</strong> North America.Currently, about 85% of Americans get their waterfrom publicly owned utilities. This may change.Within 10 years the three European-based water companiesaim to control 70% of the water supply in theUnited States by buying up American water companies<strong>and</strong> entering into agreements with most cities tomanage their water supplies.The argument is that private companies have themoney <strong>and</strong> expertise to manage these resources better<strong>and</strong> more efficiently than government bureaucracies.Experience with this public–private partnership approachis mixed. Some companies hired to managewater resources have improved efficiency, done a goodjob, <strong>and</strong> in a few cases lowered rates.But in the late 1980s, Prime Minister MargaretThatcher placed Engl<strong>and</strong>’s water management in privateh<strong>and</strong>s. The result was financial mismanagement,skyrocketing water rates, deteriorating water quality,<strong>and</strong> company executives giving themselves generousfinancial compensation packages. In the late 1990s,Prime Minister Tony Blair brought the system undercontrol by imposing much stricter government oversight.The message: Governments hiring private companiesto manage water resources must set st<strong>and</strong>ards<strong>and</strong> maintain strict oversight of such contracts.Some government officials want to go further <strong>and</strong>sell public water resources to private companies. Manypeople oppose full privatization of water resources becausethey believe that water is a public resource tooimportant to be left solely in private h<strong>and</strong>s. Also, once a312 CHAPTER 15 Water Resources
city’s water systems have been taken over by a foreignbasedcorporation, efforts to return the systems to publiccontrol can lead to severe economic penalties underthe rules of the World Trade Organization (WTO).In the Bolivian town of Cochabamba, 60% of thewater was being lost through leaky pipes. With nomoney to fix the pipes, the Bolivian government soldthe town’s water system to a subsidiary of the BechtelCorporation. Within 6 months, the company doubledwater rates. This led to a general strike <strong>and</strong> violentstreet clashes between protesters <strong>and</strong> governmenttroops that led to 10,000 injured people <strong>and</strong> 7 deaths.The Bolivian government ended up tearing up thecontract. But the town’s current government–privatecooperative water management system is in shambles<strong>and</strong> most of the leaks have not been stopped.Some analysts point to two possible problems in afully privatized water system. First, since private companiesmake money by delivering water, they havemore incentive to sell as much water as they can ratherthan to conserve it. Second, because of lack of money topay water bills, the poor will continue to be left out.There are no easy answers for managing the water thateveryone needs.xHOW WOULD YOU VOTE? Should private companies own<strong>and</strong> manage most of the world’s water resources? Cast yourvote online at http://biology.brookscole.com/miller14.15-4 USING DAMS AND RESERVOIRSTO SUPPLY MORE WATERWhat Are the Advantages <strong>and</strong> Disadvantagesof Large Dams <strong>and</strong> Reservoirs? MixedBlessingsLarge dams <strong>and</strong> reservoirs can produce cheapelectricity, reduce downstream flooding, <strong>and</strong>provide year-round water for irrigating cropl<strong>and</strong>,but they also displace people <strong>and</strong> disrupt aquaticsystems.An estimated 800,000 dams of all sizes now restrict theflow of the world’s rivers. Large dams <strong>and</strong> reservoirshave benefits <strong>and</strong> drawbacks (Figure 15-9). <strong>Their</strong> mainpurpose is to capture <strong>and</strong> store runoff <strong>and</strong> release it asneeded to control floods; to generate electricity; <strong>and</strong> tosupply water for irrigation <strong>and</strong> for towns <strong>and</strong> cities.Reservoirs also provide recreational activities such asswimming, fishing, <strong>and</strong> boating.The more than 45,000 large dams (22,000 of them inChina) built on the world’s 227 largest rivers have increasedthe annual reliable runoff available for humanuse by nearly one-third. But a series of dams on a river,especially in arid areas, can reduce downstream flow toa trickle <strong>and</strong> prevent it from reaching the sea as a part ofthe hydrologic cycle. According to the World Commissionon Water in the 21st Century, half of the world’sLarge lossesof water throughevaporationFlooded l<strong>and</strong> destroysforests or cropl<strong>and</strong> <strong>and</strong>displaces peopleMigration <strong>and</strong>spawning of somefish are disruptedDownstream cropl<strong>and</strong> <strong>and</strong>estuaries are deprived ofnutrient-rich siltReservoir is usefulfor recreation<strong>and</strong> fishingCan producecheap electricity(hydropower)Downstreamflooding isreducedProvides water foryear-round irrigationof cropl<strong>and</strong>Figure 15-9 Trade-offs: advantages (green) <strong>and</strong> disadvantages (orange) of large dams <strong>and</strong> reservoirs. The world’s 45,000large dams (higher than 15 meters or 50 feet) capture <strong>and</strong> store about 14% of the world’s runoff, provide water for about 45% ofirrigated cropl<strong>and</strong>, <strong>and</strong> supply more than half the electricity used by 65 countries. The United States has more than 70,000 large<strong>and</strong> small dams, capable of capturing <strong>and</strong> storing half of the country’s entire river flow. Pick the single advantage <strong>and</strong> disadvantagethat you think are the most important.http://biology.brookscole.com/miller14313
major rivers are going dry part of the year because offlow reduction by dams (see the case study below).This engineering approach to river managementhas displaced between 40 <strong>and</strong> 80 million people fromtheir homes <strong>and</strong> has flooded an area of mostly productivel<strong>and</strong> roughly equal to the area of California. In addition,this approach often impairs some of the importantecological <strong>and</strong> economic services rivers provide (Figure13-12, p. 269). In 2003 the World Resources Instituteestimated that dams <strong>and</strong> reservoirs have strongly ormoderately fragmented <strong>and</strong> disturbed 60% of theworld’s major river basins.According to water-resourceexpert Peter H. Gleck, at least a fourth of the world’sfreshwater fish species are threatened or endangered,primarily because dams <strong>and</strong> water withdrawals havedestroyed many free-flowing rivers.Because of evaporation <strong>and</strong> seepage from theirreservoirs, some dams lose more water than they provide.The reservoirs behind dams also eventually fillup with silt, which makes the dams useless for storingwater or producing electricity.xHOW WOULD YOU VOTE? Do the advantages of largedams outweigh their disadvantages? Cast your vote online athttp://biology.brookscole.com/miller14.Case Study: The Colorado River Basin—AnOvertapped ResourceThe Colorado River has so many dams <strong>and</strong>withdrawals that it often does not reachthe ocean.The Colorado River flows 2,300 kilometers(1,400 miles) from the mountains of centralColorado to the Mexican border <strong>and</strong> eventuallyto the Gulf of California (Figure 15-10).During the past 50 years, this once freeflowingriver has been tamed by a giganticplumbing system consisting of 14 major dams<strong>and</strong> reservoirs, hundreds of smaller dams,<strong>and</strong> a network of aqueducts <strong>and</strong> canals thatsupply water to farmers, ranchers, <strong>and</strong> cities.This domesticated river provides electricityfrom hydroelectric plants at majordams, water for more than 25 million peoplein seven states, <strong>and</strong> water used to grow about15% of the nation’s produce <strong>and</strong> livestock.The river also supports a multibillion-dollarrecreation industry of whitewater rafting,boating, fishing, camping, <strong>and</strong> hiking.Figure 15-10 The Colorado River basin. The areadrained by this basin is equal to more than one-twelfthof the l<strong>and</strong> area of the lower 48 states.NEVADALas VegasCALIFORNIABoulder CitySan DiegoDamAqueductor canalUpper BasinLower BasinLosAngeles PalmSpringsThe river supplies water to some of the nation’sdriest <strong>and</strong> hottest cities. Take away this tamed river<strong>and</strong> Las Vegas, Nevada, would be a mostly uninhabiteddesert area; San Diego, California, could notsupport its present population; <strong>and</strong> California’sImperial Valley, which grows a major portion of thenation’s vegetables, would consist mostly of cactus<strong>and</strong> mesquite plants.There are three major problems associated withuse of this river’s water. One is that the Colorado Riverbasin includes some of the driest l<strong>and</strong>s in the UnitedStates <strong>and</strong> Mexico (Figure 15-6). In addition, legalpacts in 1922 <strong>and</strong> 1944 allocated more water for humanuse in the U.S. <strong>and</strong> Mexico than the river can supply—even in years without a drought. The pacts also allocatedno water for environmental purposes.Finally, because of so many withdrawals, since1960 the river has rarely made it to the Gulf ofCalifornia except during a few years with higher thannormal precipitation. This threatens the survival ofspecies that spawn in the river, destroys estuaries thatserve as breeding grounds for numerous aquaticspecies, <strong>and</strong> increases saltwater contamination ofaquifers near the coast.Traditionally, about 80% of the water withdrawnfrom the Colorado has been used to irrigate crops <strong>and</strong>raise cattle. This large-scale use of water for agriculturewas made possible because the government paidAll-AmericanCanalYumaMexicaliGulf ofCaliforniaIDAHOGr<strong>and</strong>CanyonSalt Lake CityUTAHLakePowellARIZONAPhoenixGlenCanyonDamLOWERBASINColorado RiverTucsonWYOMINGGr<strong>and</strong> JunctionUPPERBASINCOLORADOAlbuquerque00MEXICODenverNEW MEXICO100 mi.150 km314 CHAPTER 15 Water Resources
for the dams <strong>and</strong> reservoirs <strong>and</strong> has supplied many ofthe farmers <strong>and</strong> ranchers with water at a low price.This has led to inefficient use of irrigation water, includinggrowing crops such as rice, cotton, <strong>and</strong> alfalfathat need a lot of water in a water-short area.It is estimated that improving overall irrigation efficiencyby 10–15% would provide enough water tosupport projected urban growth in the areas served bythe river until 2020.Other problems are evaporation, leakage, <strong>and</strong> siltationfrom large reservoirs created by some of thedams along the Colorado River. For example, there arehuge losses of river water in the Lake Mead <strong>and</strong> LakePowell dam reservoirs from a combination of evaporation<strong>and</strong> seepage of water into porous rock beds underthe reservoirs.In addition, as the flow of the Colorado Riverslows in large reservoirs behind dams it drops much ofits load of suspended silt. The amount of silt beingdeposited on the bottoms of the Lake Powell <strong>and</strong> LakeMead reservoirs is roughly equivalent to that fromhaving 20,000 dump trucks dump dirt into the reservoirsevery day. Probably sometime during thiscentury these reservoirs will be too full of silt to storewater for generating hydroelectric power or controllingfloods.These problems illustrate the dilemmas that governments<strong>and</strong> people living in semiarid regions withshared river systems face as population <strong>and</strong> economicgrowth place increasing dem<strong>and</strong>s on limited suppliesof surface water. Currently there are no cooperativeagreements for use of 158 of the world’s 263 waterbasins shared by two or more countries.AdvantagesWill generateabout 10% ofChina’s electricityReducesdependence oncoalReduces air pollutionReduces CO 2emissionsReduceschances ofdownstreamflooding for 15 millionpeopleReduces riversilting belowdam by erodedsoilIncreasesirrigation water forcropl<strong>and</strong> below damTrade-OffsChina’s Three Gorges DamDisadvantagesFloods large areas ofcropl<strong>and</strong> <strong>and</strong> forestsDisplaces 1.9 millionpeopleIncreases waterpollution because ofreduced water flowReduces deposits ofnutrient-richsediments belowdamIncreases saltwaterintroduced intodrinking water nearmouth of riverbecause ofdecreased water flowDisrupts spawning<strong>and</strong> migration ofsome fish below damHigh costFigure 15-11 Trade-offs: advantages <strong>and</strong> disadvantages ofthe Three Gorges dam being built across the Yangtze River inChina. Pick the single advantage <strong>and</strong> disadvantage that youthink are the most important.Case Study: China’s Three Gorges Dam—A Controversial ProjectThere is debate over whether the advantagesof the world’s largest dam <strong>and</strong> reservoir willoutweigh its disadvantages.When completed, China’s Three Gorges project on themountainous upper reaches of the Yangtze River willinclude the world’s largest hydroelectric dam <strong>and</strong>reservoir. Two kilometers (1.2 miles) long, the dam issupposed to be completed by 2013 at a cost of at least$25 billion. Figure 15-11 lists major advantages <strong>and</strong>disadvantages of this controversial project.Bad news. About 1.9 million people are being relocatedfrom the area to be flooded to form a gigantic600-kilometer-long (385-mile-long) reservoir behindthe dam—long enough to stretch from San Franciscoto Los Angeles <strong>and</strong> as large as Lake Superior. Manypeople are being uprooted from their ancestral homes<strong>and</strong> relocated on l<strong>and</strong> too barren to grow much food.The reservoir will also flood one of China’s most beautifulareas, 1,350 cities <strong>and</strong> villages, <strong>and</strong> thous<strong>and</strong>s ofarcheological <strong>and</strong> cultural sites.Good news. When completed, the dam will havethe electric output of 18 large coal-burning or nuclearpower plants <strong>and</strong> will help reduce China’s dependenceon coal <strong>and</strong> its emissions of the greenhouse gasCO 2 . It will also help hold back the Yangtze River’sfloodwaters, which have killed more than 500,000 peopleduring the past 100 years—including 4,000 peoplein 1998. In addition, it will enable large cargo-carryingships to travel deep into China’s interior, greatly reducingtransportation costs.Mixed news. Because the dam is built over a seismicfault, geologists worry that the dam might collapse<strong>and</strong> cause a major flood that would kill millionsof people. Engineers claim that the dam can withst<strong>and</strong>the maximum projected earthquake. Others are not soconfident, noting that since 1949 more than 3,200 damsin China have collapsed <strong>and</strong> killed several hundredthous<strong>and</strong> people. About 80 small cracks have alreadybeen discovered in the dam. Critics claim that it wouldhttp://biology.brookscole.com/miller14315
have been cheaper, less disruptive, <strong>and</strong> safer to build aseries of smaller dams.15-5 TRANSFERRING WATERFROM ONE PLACE TO ANOTHERCase Study: The Aral Sea Disaster—A Glaring Example of UnintendedConsequencesDiverting water from the Aral Sea <strong>and</strong> its twofeeder rivers mostly for irrigation has createda major ecological, economic, <strong>and</strong> healthdisaster.Tunnels, aqueducts, <strong>and</strong> underground pipes can transferstream runoff collected by dams <strong>and</strong> reservoirsfrom water-rich areas to water-poor areas. However,they also create environmental problems. Indeed, mostof the world’s dam projects <strong>and</strong> large-scale watertransfers illustrate the important ecological principlethat you cannot do just one thing. There are almost alwaysa number of unintended environmental consequences(Figure 3-4, p. 38).An example is the shrinking of the Aral Sea (Figure15-12). It is a result of a large-scale water transferproject in an area of the former Soviet Union with thedriest climate in central Asia. Since 1960, enormousamounts of irrigation water have been diverted fromthe inl<strong>and</strong> Aral Sea <strong>and</strong> its two feeder rivers to createone of the world’s largest irrigated areas, mostly forraising cotton <strong>and</strong> rice. The irrigation canal, theworld’s longest, stretches over 1,300 kilometers (800miles)—equivalent to one-third the width of the continentalUnited States.This large-scale water diversion project, coupledwith droughts <strong>and</strong> high evaporation rates in this area’shot <strong>and</strong> dry climate, has caused a regional ecological,economic, <strong>and</strong> health disaster. Since 1960 the sea’ssalinity has tripled, its surface area has decreased by58%, <strong>and</strong> it has lost 83% of its water. In effect it has beentransformed from a single large lake (Figure 15-12, left)into three smaller lakes (Figure 15-12, right). Waterwithdrawal for agriculture has reduced the sea’s twosupply rivers to mere trickles.About 85% of the area’s wetl<strong>and</strong>s have been eliminated<strong>and</strong> roughly half the area’s bird <strong>and</strong> mammalspecies have disappeared. In addition, a huge area offormer lake bottom has been converted to a humanmadedesert covered with glistening white salt. Theincreased salt concentration caused the presumed extinctionof 20 of the area’s 24 native fish species. ThisWorldSat International, Inc. All rights reserved.WorldSat International, Inc. All rights reserved.Figure 15-12 Natural capital degradation: the Aral Sea was once the world’s fourth largest freshwater lake.Since 1960 it has been shrinking <strong>and</strong> getting saltier because most of the water from the rivers that replenish ithas been diverted to grow cotton <strong>and</strong> food crops. These satellite photos show the sea in 1976 <strong>and</strong> in 1997. Asthe lake shrinks, it leaves behind a salty desert, economic ruin, increasing health problems, <strong>and</strong> severe ecologicaldisruption.316 CHAPTER 15 Water Resources
has devastated the area’s fishing industry, which onceprovided work for more than 60,000 people. Fishingvillages <strong>and</strong> boats once on the sea’s coastline now areab<strong>and</strong>oned in the middle of a salt desert.Winds pick up the salty dust that encrusts thelake’s now-exposed bed <strong>and</strong> blow it onto fields as faras 300 kilometers (190 miles) away. As the salt spreads,it pollutes water <strong>and</strong> kills wildlife, crops, <strong>and</strong> othervegetation. Aral Sea dust settling on glaciers in theHimalayas is causing them to melt at a faster than normalrate—another example of connections <strong>and</strong> unintendedconsequences.To raise yields, farmers have increased use of herbicides,insecticides, fertilizers, <strong>and</strong> irrigation water onsome crops. Many of the chemicals have percolateddownward <strong>and</strong> accumulated to dangerous levels ingroundwater, from which most of the region’s drinkingwater comes.Shrinkage of the Aral Sea has altered the area’s climate.The once-huge sea acted as a thermal buffer thatmoderated the heat of summer <strong>and</strong> the extreme cold ofwinter. Now there is less rain, summers are hotter <strong>and</strong>drier, winters are colder, <strong>and</strong> the growing season isshorter. The combination of such climate change <strong>and</strong>severe salinization has reduced crop yields by 20–50%on almost a third of the area’s cropl<strong>and</strong>.Finally, there have been increasing health problemsfrom a combination of toxic dust, salt, <strong>and</strong> contaminatedwater for a growing number of the 58 millionpeople living in the Aral Sea’s watershed.Can the Aral Sea be saved, <strong>and</strong> can the area’s seriousecological <strong>and</strong> human health problems be reduced?There is agreement that the sea will neverreturn to its former volume. Efforts have focused primarilyon stopping further shrinkage <strong>and</strong> undoingsome of the ecological <strong>and</strong> health damage caused byits shrinkage.Encouraging news. Since 1999, the United Nations<strong>and</strong> the World Bank have spent about $600 million topurify drinking water <strong>and</strong> upgrade irrigation <strong>and</strong>drainage systems, which improves irrigation efficiency<strong>and</strong> flushes salts from cropl<strong>and</strong>s. In addition,some artificial wetl<strong>and</strong>s <strong>and</strong> lakes have been constructedto help restore aquatic vegetation, wildlife,<strong>and</strong> fisheries.The five countries surrounding the lake <strong>and</strong> itstwo feeder rivers have worked to improve irrigationefficiency <strong>and</strong> to partially replace water-thirsty cropssuch as rice <strong>and</strong> cotton, with other crops that requireless water. As a result, the total annual volume of waterin the Aral Sea basin has stabilized.In 2004 the United Nations Environment Programmewarned that Lake Balkhash in Kazakhstancould meet a fate like that of the Aral Sea if pollution<strong>and</strong> water withdrawals from the river Ili flowing intoit from northwestern China continue increasing.Case Study: The California Water TransferProject—Bringing Water to a DesertThere is controversy over the massive transfer ofwater from water-rich northern California to waterpoorsouthern California.One of the world’s largest water transfer projects is theCalifornia Water Project (Figure 15-13). It uses a maze ofgiant dams, pumps, <strong>and</strong> aqueducts (cement-lined artificialrivers) to transport water from water-rich northernCalifornia to southern California’s heavily populatedarid <strong>and</strong> semiarid agricultural regions <strong>and</strong> cities.For decades, northern <strong>and</strong> southern Californianshave feuded over how the state’s water should be allocatedunder this project. Southern Californians saythey need more water from the north to grow morecrops <strong>and</strong> to support Los Angeles, San Diego, <strong>and</strong> othergrowing urban areas. Agriculture uses three-fourths ofthe water withdrawn in California, much of it used inefficientlyfor growing water-thirsty crops such as alfalfaunder desertlike conditions.Opponents in the north say that sending more watersouth would degrade the Sacramento River,threaten fisheries, <strong>and</strong> reduce the flushing action thathelps clean San Francisco Bay of pollutants. They alsoargue that much of the water sent south is wasted.They point to studies showing that making irrigationjust 10% more efficient would provide enough waterfor domestic <strong>and</strong> industrial uses in southern California.Mono Lake, a salt lake in southern California’sdesert just east of Yosemite National Park, is an ecologicalcausality of water transfers from one water basinto another. Diversion of water from rivers feeding thelake has shrunk the lakes volume by one-third. ThisSacramentoRiverNorth BayAqueductSan FranciscoSouth BayAqueductSan Luis Dam<strong>and</strong> ReservoirCalifornia AqueductCALIFORNIAShasta Lake NEVADAOroville Dam <strong>and</strong>ReservoirFeatherRiverSacramentoSan Joaquin ValleyFresnoSanta BarbaraLos AngelesSan DiegoLake TahoeHoover Dam<strong>and</strong> Reservoir(Lake Mead)Los AngelesAqueductColorado RiverAqueductSalton SeaUTAHColoradoRiverARIZONACentral ArizonaProjectPhoenixTucsonMEXICOFigure 15-13 Solutions: California Water Project <strong>and</strong> theCentral Arizona Project. These projects involve large-scalewater transfers from one watershed to another. Arrows show thegeneral direction of water flow.http://biology.brookscole.com/miller14317
has reduced populations of resident <strong>and</strong> migratinggulls, ducks, <strong>and</strong> wading birds that use the lake forfood <strong>and</strong> shelter <strong>and</strong> led to lawsuits over greatly reducingdiversion of water flowing into the lake. In1994, the California Water Resources Control Board requiredLos Angeles to restrict its water diversions <strong>and</strong>allow water to be restored to the lake.According to a 2002 joint study by a team of scientists<strong>and</strong> engineers, projected global warming is likelyto sharply reduce water availability in California (especiallysouthern California) <strong>and</strong> other water-short statesin the western United States even under the study’sbest-case scenario. The study projects that overall precipitationlevels are likely to remain constant, butwarmer temperatures will cause what would havefallen as snow during the winter to come down as rain.Currently the annual snow pack in California’snorthern Sierra Nevada mountains acts as a naturalreservoir by storing water as snow through the winter<strong>and</strong> then slowly releasing it as water during spring <strong>and</strong>summer when water dem<strong>and</strong> is high. If winter precipitationfalls as rain instead of as snow, it will fill rivers<strong>and</strong> streams at a time of year when the dem<strong>and</strong> for wateris low, <strong>and</strong> will lead to shortages during spring <strong>and</strong>summer when dem<strong>and</strong> is high. Some analysts projectthat sometime during this century many of the peopleliving in arid southern California cities (such as LosAngeles <strong>and</strong> San Diego), <strong>and</strong> farmers in the area, willhave to move elsewhere because of a lack of water.Pumping out more groundwater is not the answerbecause it is already being withdrawn faster than it isreplenished throughout much of California <strong>and</strong> desalinatingocean water is too expensive for irrigation. Tomost analysts, quicker <strong>and</strong> cheaper solutions are to improveirrigation efficiency, stop growing water-thirstycrops in a desert climate, <strong>and</strong> allow farmers to sellcities the legal rights to withdraw certain amounts ofwater from rivers.Case Study: Canada’s James Bay WatershedTransfer Project—Rearranging NatureThe first phase of a gigantic 50-year project toproduce hydroelectric power for Canada <strong>and</strong> theUnited States has been completed, but the secondphase has been postponed.Another major watershed transfer project is Canada’sJames Bay project. It is a $60 billion, 50-year schemeto harness the wild rivers that flow into Quebec’sJames <strong>and</strong> Hudson Bays to produce electric power forCanadian <strong>and</strong> U.S. consumers (Figure 15-14).If completed, this megaproject by Hydro-Quebecinvolves building 600 dams <strong>and</strong> dikes that will reverseor alter the flow of 19 giant rivers covering a watershedthree times the size of New York state. The projectwill flood an area of boreal forest <strong>and</strong> tundra equalin area to Washington state or Germany. It will alsoChicagoC A N A D AHudsonBayJamesBayONTARIOUNITED STATESChisasibiQUEBECdisplace thous<strong>and</strong>s of indigenous Cree <strong>and</strong> Inuit, whofor 5,000 years have lived off James Bay by subsistencehunting, fishing, <strong>and</strong> trapping.After 20 years, the $16 billion first phase of theproject has been completed. It diverted three majorrivers, flooded a huge area of tundra <strong>and</strong> forest, <strong>and</strong>built dams that generate electricity equal to that from26 large coal-burning or nuclear power plants.The second phase was postponed indefinitely in1994 because the first phase produced more powerthan could be sold. Opposition by the Cree, whose ancestralhunting grounds would have been flooded,<strong>and</strong> by Canadian <strong>and</strong> U.S. environmentalists, alongwith New York state’s cancellation of two contracts tobuy electricity, also helped to postpone phase II.15-6 TAPPING GROUNDWATER,CONVERTING SALTWATER TOFRESHWATER, SEEDING CLOUDS,AND TOWING ICEBERGS AND BIGBAGGIESIIIIINew YorkCityNEWFOUNDLANDATLANTICOCEANFigure 15-14 If completed, the James Bay project in northernQuebec will alter or reverse the flow of 19 major rivers <strong>and</strong>flood an area the size of the state of Washington to producehydropower for consumers in Quebec <strong>and</strong> the United States,especially in New York State. Phase I of this 50-year project iscompleted.What Are the Advantages <strong>and</strong>Disadvantages of Withdrawing Groundwater?Avoid Too Many Straws in the GlassMost aquifers are renewable sources unless the wateris removed faster than it is replenished or becomescontaminated.318 CHAPTER 15 Water Resources
Aquifers provide drinking water for about one-fourthof the world’s people. In the United States, waterpumped from aquifers supplies almost all of the drinkingwater in rural areas, one-fifth of that in urban areas,<strong>and</strong> 43% of irrigation water.Relying more on groundwater has advantages<strong>and</strong> disadvantages (Figure 15-15). The good news is thataquifers are widely available <strong>and</strong> are renewablesources of water as long as the water is not withdrawnfaster than it is replaced <strong>and</strong> as long as the aquifers donot become contaminated.The bad news is that water tables are falling inmany areas of the world as the rate of pumping out water(mostly to irrigate crops) exceeds the rate of naturalrecharge from precipitation. The problem of fallingwater tables sneaks up on us because we cannot see ithappening. The first sign is shallow wells going dry,followed by loss of water from deeper wells if the watermining process continues. Covering aquifer rechargeareas with urban development also contributesto aquifer depletion.The world’s three largest grain-producing countries—China,India, <strong>and</strong> the United States—are overpumpingmany of their aquifers. In 2002, China announceda massive project to pump surface waterAdvantagesGood source ofwater for drinking<strong>and</strong> irrigationAvailable yearroundExists almosteverywhereRenewable if notoverpumped orcontaminatedNo evaporationlossesCheaper toextractthan mostsurface watersT rade-OffsWithdrawing GroundwaterDisadvantagesAquifer depletionfrom overpumpingSinking of l<strong>and</strong>(subsidence) whenwater removedPolluted aquifersunusable fordecades or centuriesSaltwater intrusioninto drinking watersupplies near coastalareasReduced water flowsinto streams, lakes,estuaries, <strong>and</strong>wetl<strong>and</strong>sIncreased cost,energy use, <strong>and</strong>contamination fromdeeper wellsFigure 15-15 Trade-offs: advantages <strong>and</strong> disadvantages ofwithdrawing groundwater. Pick the single advantage <strong>and</strong> disadvantagethat you think are the most important.through three huge aqueducts from the Yangtze Riverin China’s water-rich south to the country’s arid north.The water will help grow more food <strong>and</strong> slow aquiferdepletion in the North China Plain. This project is tobegin in 2005 but will not be completed until 2050. <strong>Environmental</strong>istsare concerned about its potentiallyharmful ecological impacts.In the United States, groundwater is being withdrawnat four times its replacement rate. The most seriousoverdrafts are in parts of the huge Ogallala Aquifer,underlying eight states in the arid high plains fromsouthern South Dakota to central Texas (Case Study,p. 320) <strong>and</strong> in parts of the arid Southwest (Figure 15-16,p. 320). Serious groundwater depletion is also takingplace in California’s water-short Central Valley, whichsupplies about half the country’s vegetables <strong>and</strong> fruits.Do you live in any of the blue areas in Figure 15-16 or ina similar area in another country where groundwater isbeing withdrawn faster than it is replenished?Saudi Arabia is as water-poor as it is oil-rich. Itgets about 70% of its drinking water at a high cost fromthe world’s largest desalination complex on its easterncoast. The rest of the country’s water is pumped fromdeep aquifers, most as nonrenewable as the country’soil. Yet this water-short nation wastes much of itsscarcest resource with large numbers of fountains,swimming pools, <strong>and</strong> countless irrigation sprinklersthat suck nonrenewable water from deep underground<strong>and</strong> let precious water evaporate into the hot,dry desert air. Hydrologists estimate that because ofthe rapid depletion of its fossil aquifers, most irrigatedagriculture in Saudi Arabia may disappear within 10to 20 years.According to water resource expert S<strong>and</strong>ra Postel,about 480 million people are being fed with grainproduced with eventually unsustainable water miningfrom aquifers. This example of the tragedy of thecommons is expected to increase as irrigated areas areexp<strong>and</strong>ed to help feed 2.5 billion more people projectedto join the ranks of humanity between 2004<strong>and</strong> 2050.In addition to limiting future food production,overpumping aquifers is increasing the gap betweenthe rich <strong>and</strong> poor in some areas. As water tables drop,farmers must drill deeper wells, buy larger pumps,<strong>and</strong> use more electricity to run the pumps. Poor farmerscannot afford to do this <strong>and</strong> end up losing theirl<strong>and</strong> <strong>and</strong> either working for richer farmers or migratingto cities already crowded with poor people strugglingto survive.Withdrawing lots of water sometimes allows thes<strong>and</strong> <strong>and</strong> rock in aquifers to collapse, causing the l<strong>and</strong>above the aquifer to subside or sink. Once an aquiferbecomes compressed, recharge is impossible. Since1950, some spots above aquifers in California’s heavilyfarmed San Joaquin Valley has sunk or subsided morethan 50 meters (160 feet).http://biology.brookscole.com/miller14319
Figure 15-16 Natural capital degradation: areas of greatestaquifer depletion from groundwater overdraft in the continentalUnited States. Aquifer depletion is also high in Hawaii<strong>and</strong> Puerto Rico (not shown on map). It causes the l<strong>and</strong>above the aquifer to subside or sink in spots in most of theseareas. (U.S. Water Resources Council <strong>and</strong> U.S. GeologicalSurvey)GroundwaterOverdrafts:HighModerateMinor or nonecoastal areas of Florida, California, South Carolina, <strong>and</strong>Texas.Figure 15-18 lists ways to prevent or slow theproblem of groundwater depletion. Study this figurecarefully.Mexico City, built on a lakebed, has one of theworld’s worse subsidence problems because of an increasein groundwater overdrafts from rapid populationgrowth <strong>and</strong> urbanization. In recent years, someparts of the city have sunk as much as 8 meters (26 feet).Excessive withdrawal of groundwater can causethe roof of a cavern or underground conduit to collapsesuddenly <strong>and</strong> create a large crater. Such sinkholescan form suddenly without warning <strong>and</strong> swallowhouses, cars, <strong>and</strong> trees. Subsidence <strong>and</strong> the formationof sinkholes usually compress the rock particles inaquifers <strong>and</strong> thus lead to a permanent loss of theaquifer.Finally, groundwater overdrafts near coastal areascan contaminate groundwater supplies by causing intrusionof salt water into freshwater aquifers used tosupply water for irrigation <strong>and</strong> domestic purposes(Figure 15-17). This is an especially serious problem inCase Study: The Shrinking Ogallala Aquifer—Using Up Natural CapitalPumping water from the world’s largest aquifer hasgreatly increased food production, but overpumpingis a serious problem in some areas.PreventionWaste less waterSubsidize waterconservationSolutionsGroundwater DepletionControlRaise price of waterto discourage wasteMajor irrigationwellFreshgroundwateraquiferInterfaceSaltwaterIntrusionWell contaminatedwith salt waterWatertableInterfaceNormalInterfaceSea levelSaltwaterSeafloorBan new wells inaquifers nearsurface watersBuy <strong>and</strong> retiregroundwaterwithdrawal rightsin critical areasDo not growwater-intensivecrops in dry areasReduce birthratesTax water pumpedfrom wells nearsurface watersSet <strong>and</strong> enforceminimum streamflow levelsFigure 15-17 Natural capital degradation: saltwater intrusionalong a coastal region. When the water table is lowered, thenormal interface (dashed line) between fresh <strong>and</strong> salinegroundwater moves inl<strong>and</strong> (solid line), making groundwatersupplies unusable for irrigation <strong>and</strong> domestic purposes.Figure 15-18 Solutions: ways to prevent or slow groundwaterdepletion. Which two of these solutions do you believe are themost important?320 CHAPTER 15 Water Resources
WYOMINGCOLORADONEW MEXICOSOUTH DAKOTANEBRASKATEXASMiles100During the retreat of the last ice age about 15,000–30,000years ago, vast amounts of water were deposited underground.This created the world’s largest knownaquifer, the Ogallala (Figure 15-19).Pumping large amounts of water from this fossilaquifer has helped transform vast areas of arid highplainsprairie into one of the largest <strong>and</strong> most productiveagricultural regions in the United States. Mostlybecause of irrigated farming, this region produces onefifthof U.S. agricultural output (including 40% of itsfeedlot beef).0KANSASOKLAHOMA1600KilometersSaturated thickness of Ogallala AquiferLess than 61 meters (200 ft.)61–183 meters (200–600 ft.)More than 183 meters (600 ft.)(as much as 370 meters or 1,200 ft. in places)Figure 15-19 Natural capital degradation: the Ogallala isthe world’s largest known aquifer. If the water in this aquifer wereabove ground, it could cover all 50 states with 0.5 meter (1.5 feet)of water. Water withdrawn from this aquifer is used to grow crops,raise cattle, <strong>and</strong> provide cities <strong>and</strong> industries with water. As a result,this aquifer, which is renewed very slowly, is being depleted,especially at its thin southern end in parts of Texas, New Mexico,Oklahoma, <strong>and</strong> Kansas. (Data from U.S. Geological Survey)However, this aquifer is being overpumped <strong>and</strong>gradually depleted in some areas. Although it is gigantic,the Ogallala is essentially a one-time deposit of ancientwater with an extremely slow recharge rate. Insome areas, water is being pumped out 8–10 timesfaster than the slow natural recharge rate.The northernmost states (Wyoming, North Dakota,South Dakota, <strong>and</strong> parts of Colorado) still have amplewater supplies from the aquifer. But in parts of thesouthern states, where the aquifer is thinner, the wateris being depleted rapidly—especially in the Texas HighPlains.Government subsidies designed to increase cropproduction also increase depletion of the Ogallala.These subsidies encourage farmers to grow waterthirstycotton in the lower basin, give crop-disasterpayments, <strong>and</strong> provide tax breaks in the form ofgroundwater depletion allowances (with larger breaksfor heavier groundwater use).Can Deep Aquifers Supply More Water?Solution or Pipe Dream?Scientists are evaluating huge, deep aquifers as asource of water.With global water shortages looming, scientists areevaluating deep aquifers—found at depths of 0.8 kilometer(0.5 mile) or more—as future water sources.Some of these are gigantic nonrenewable aquifers containingdeposits of water as much as a million yearsold.Seismic <strong>and</strong> core-drilling technologies used by theoil industry are being used to locate <strong>and</strong> evaluate thelargest of these deep aquifers, some of which run underneathseveral countries. Preliminary results suggestthat some of these aquifers hold enough water tosupport billions of people for centuries. They also indicatethat the water quality is much higher than that inmost of the world’s rivers <strong>and</strong> lakes.There are two major concerns about tapping thesemostly one-time deposits. One is that we know littleabout the geological <strong>and</strong> ecological impacts of pumpingfrom deep aquifers. The other is that no internationalwater treaties govern the rights to <strong>and</strong> ownershipof water that underlies several countries. Withoutsuch treaties, there could be legal <strong>and</strong> physical conflictsover who has the right to tap into <strong>and</strong> use theseresources.How Useful Is Desalination? A CostlyOptionRemoving salt from seawater will probably not bedone widely because of high costs <strong>and</strong> what to dowith the resulting salt.http://biology.brookscole.com/miller14321
Desalination involves removing dissolved salts fromocean water or from brackish (slightly salty) water inaquifers or lakes. It is another way to increase suppliesof fresh water.One method for desalinating water is distillation—heating salt water until it evaporates, leaves behindsalts in solid form, <strong>and</strong> condenses as fresh water. Anothermethod is reverse osmosis—pumping salt water athigh pressure through a thin membrane with poresthat allow water molecules, but not most dissolvedsalts, to pass through. In effect, high pressure pushesfresh water out of salt water.There are about 13,500 desalination plants in 120countries, mostly the desert nations of the Middle East,North Africa, the Caribbean, <strong>and</strong> the Mediterranean.These plants meet less than 0.3% of the world’s waterneeds.Oil-rich <strong>and</strong> water-short Middle Eastern countriesproduce about 60% of the world’s desalinated water.Saudi Arabia is the largest producer <strong>and</strong> accounts formore than a third of the world’s output, followed bythe United States, which produces about a fifth of theworld’s desalinated water.Water-short Israel plans to get as much half of itswater from desalination by 2008. Some water-shortcoastal cities in the United States, such as Tampa,Florida, have built desalination plants to supplementwater supplies. In California, coastal cities such as LosAngeles, San Diego, <strong>and</strong> Monterey may build suchplants.There are two major problems with the widespreaduse of desalination. One is the high cost becauseit takes a lot of energy to desalinate water. Currently,desalinating water costs two to three times asmuch as the conventional purification of fresh water,although recent advances in reverse osmosis havebrought the energy costs down somewhat.The second problem is that desalination produceslarge quantities of briny wastewater that contains lotsof salt <strong>and</strong> other minerals. Dumping concentratedbrine into a nearby ocean increases the salinity of theocean water, which threatens food resources <strong>and</strong>aquatic life in the vicinity. Dumping it on l<strong>and</strong> couldcontaminate groundwater <strong>and</strong> surface water.Bottom line: Currently, significant desalination ispractical only for water-short wealthy countries <strong>and</strong>cities that can afford its high cost.Scientists are working to develop new membranesfor reverse osmosis that can separate water from saltmore efficiently <strong>and</strong> under less pressure. If successful,this strategy could bring down the cost of desalination.Even so, it probably will not be cheap enough toirrigate conventional crops or meet much of theworld’s dem<strong>and</strong> for fresh water unless scientists canfigure out how to use solar energy or other means todesalinate seawater cheaply <strong>and</strong> how to safely disposeof the salt left behind.Can Cloud Seeding <strong>and</strong> Towing Icebergsor Gigantic Water Bags Improve WaterSupplies? Solutions or Pipe Dreams?Seeding clouds with tiny particles of chemicals toincrease rainfall, or towing icebergs or huge bagsfilled with fresh water to dry coastal areas, probablywill not provide significant amounts of fresh waterin the future.For decades, 10 states, mostly in the water-short westernUnited States, <strong>and</strong> 24 other countries have experimentedwith seeding clouds with dry ice or tiny particlesof chemicals such as silver iodide. The hypothesisis that the particles become nuclei around which raindropsform <strong>and</strong> thus produce more rain or snow overdry regions <strong>and</strong> more snow over mountains.Bad news. First, cloud seeding does not work wellin very dry areas where rain is needed most, becausethere are few clouds to seed. Second, although someproponents in the multimillion-dollar cloud-seedingindustry say the technology works, a 2003 report bythe U.S. National Academy of Sciences says there is nocompelling scientific evidence that it does. Third, it introduceslarge amounts of the cloud-seeding chemicalsinto soil <strong>and</strong> water systems, possibly harming people,wildlife, <strong>and</strong> agricultural productivity.Fourth, seeding has led to legal disputes over theownership of cloud water. For example, during a 1977drought the attorney general of Idaho accused officialsin neighboring Washington state of “cloud rustling”<strong>and</strong> threatened to file suit in federal court.Some analysts have proposed towing huge icebergsfrom Antarctic or Arctic waters to arid coastal areassuch as Saudi Arabia <strong>and</strong> southern California <strong>and</strong>pumping fresh water from the melting bergs ashore.But nobody is sure how to do it, <strong>and</strong> even if they did itmight cost too much, especially for water-short developingcountries.In 2002, a company proposed collecting springrunoff water from several rivers in northern California<strong>and</strong> piping it offshore to gigantic plastic (fiberpoly)bags as long as three football fields. Then tugboatswould carry the floating bags to southern Californiawhere the water would be piped to shore.The California Coastal Commission opposes thisscheme until the environmental impact can be assessed.The costs are unknown but would probably behigh enough that only wealthy areas could afford it.Stay tuned.15-7 REDUCING WATER WASTEWhat Are the Benefits of Reducing WaterWaste? A Win-Win SolutionWe waste about two-thirds of the water we usebut using water more efficiently could reducewastage to about 15%.322 CHAPTER 15 Water Resources
Mohamed El-Ashry of the World Resources Instituteestimates that 65–70% of the water people use throughoutthe world is lost through evaporation, leaks, <strong>and</strong> otherlosses. The United States, the world’s largest user ofwater, does slightly better but still loses about half ofthe water it withdraws. El-Ashry believes it is economically<strong>and</strong> technically feasible to reduce such waterlosses to 15%, thereby meeting most of the world’s waterneeds for the foreseeable future.This win-win solution will also decrease the burdenon wastewater plants <strong>and</strong> reduce the need for expensivedams <strong>and</strong> water transfer projects that destroywildlife habitats <strong>and</strong> displace people. It will also slowdepletion of groundwater aquifers <strong>and</strong> save energy<strong>and</strong> money.According to water resource experts, the maincause of water waste is that we charge too little for water.Such underpricing is mostly the result of governmentsubsidies that provide irrigation water, electricity, <strong>and</strong>diesel fuel for farmers to pump water from rivers <strong>and</strong>aquifers at below-market prices.Subsidies keep the price of water so low that usershave little or no financial incentive to invest in wellknownwater-saving technologies. According to waterresource expert S<strong>and</strong>ra Postel, “By heavily subsidizingwater, governments give out the false message that itis abundant <strong>and</strong> can afford to be wasted—even asrivers are drying up, aquifers are being depleted, fisheriesare collapsing, <strong>and</strong> species are going extinct.”For example, U.S. farmers typically pay only onefifthof the true cost of water provided by federally financeddams <strong>and</strong> other water supply projects. The lowprice for water in arid areas of the western UnitedStates encourages farmers there to grow crops thatneed a lot of water.But farmers, industries, <strong>and</strong> others benefiting fromgovernment water subsidies argue that they promotesettlement <strong>and</strong> agricultural production in arid <strong>and</strong>semiarid areas, stimulate local economies, <strong>and</strong> helplower prices of food, manufactured goods, <strong>and</strong> electricityfor consumers.Most water resource experts believe that in thiscentury’s era of water scarcity in many areas, governmentswill have to make the unpopular decision to raisewater prices. China did this in 2002 because it faced watershortages in most of its major cities, rivers runningdry, <strong>and</strong> falling water tables in key agricultural areas.Higher water prices encourage water conservationbut make it harder for low-income farmers <strong>and</strong>city dwellers to buy enough water to meet their needs.On the other h<strong>and</strong>, when South Africa raised waterprices it established life-line rates that give each householda set amount of water at a low price to meet basicneeds. When users exceed this amount, the price rises.The second major cause of water waste is lack ofgovernment subsidies for improving the efficiency of wateruse. A basic rule of economics is that you get more ofwhat you reward. Subsidies for efficient water usewould sharply reduce water waste.xHOW WOULD YOU VOTE? Should water prices be raisedsharply to help reduce water waste? Cast your vote online athttp://biology.brookscole.com/miller14.Solutions: How Can We Waste Less IrrigationWater? Deliver Water Precisely When <strong>and</strong>Where NeededAbout 60% of the world’s irrigation water is wasted,but several irrigation techniques could reduce thewaste to 5–20%.About 60% of the irrigation water applied throughoutthe world does not reach targeted crops <strong>and</strong> does notcontribute to food production. Most irrigation watercomes from groundwater wells or surface water sources<strong>and</strong> flows by gravity through unlined ditches in cropfields so the water can be absorbed by crops (Figure 15-20, left, p. 324). This flood irrigation method delivers farmore water than the crops need <strong>and</strong> typically loses 40%of the water through evaporation, seepage, <strong>and</strong> runoff.More efficient <strong>and</strong> environmentally sound irrigationtechnologies exist that can greatly reduce waterdem<strong>and</strong>s <strong>and</strong> waste by delivering water more preciselyto crops. One of these technologies is a centerpivotlow-pressure sprinkler (Figure 15-20, right), whichuses pumps to spray water on crops. Typically, it allows80% of the water to reach crops <strong>and</strong> thus cutswater use by one-fourth compared to conventionalgravity flow systems.Another method is low-energy precision application(LEPA) sprinklers, a form of center-pivot irrigation thatputs 90–95% of the water where crops need it byspraying the water closer to the ground <strong>and</strong> in largerdroplets than the center-pivot low-pressure system.LEPA sprinklers use 20–30% less energy than lowpressuresprinklers <strong>and</strong> typically use 37% less waterthan conventional gravity flow systems.Farmers also use surge valves or time-controlledvalves on conventional gravity flow irrigation systems(Figure 15-20, left). These valves send water down irrigationditches in pulses instead of a continuousstream. This can raise irrigation efficiency to 80% <strong>and</strong>cut water use by a fourth.Another method is to use soil moisture detectors towater crops only when they need it. Some farmers inTexas bury a $1 cube of gypsum, the size of a lump ofsugar, at the root zone of crops. Wires embedded in thegypsum run back to a small portable meter that indicatessoil moisture, enabling the farmers to cut their irrigationwater use by 33–66% in many cases.Drip irrigation or microirrigation systems (Figure15-20, center) are the most efficient ways to deliversmall amounts of water precisely to crops. These systemsconsist of a network of perforated plastic tubinginstalled at or below the ground level. Small holes orhttp://biology.brookscole.com/miller14323
Figure 15-20 Major irrigation systems. Because of high initialcosts, center-pivot irrigation <strong>and</strong> drip irrigation are not widelyused. This may change because of the development of newlow-cost drip irrigation systems.Gravity flow(efficiency 60% <strong>and</strong> 80% with surge valves)Water usually comes from anaqueduct system or a nearby river.SolutionsReducing Irrigation Water Waste• Lining canals bring water to irrigation ditches• Leveling fields with lasers• Irrigating at night to reduce evaporation• Using soil <strong>and</strong> satellite sensors <strong>and</strong> computersystems to monitor soil moisture <strong>and</strong> add wateronly when necessary• Polyculture• Organic farming• Growing water-efficient crops using droughtresistant<strong>and</strong> salt-tolerant crop varieties• Irrigating with treated urban waste water• Importing water-intensive crops <strong>and</strong> meatFigure 15-21 Solutions: methods for reducing water waste inirrigation. Which two of these solutions do you believe are themost important?Drip irrigation(efficiency 90–95%)Above- or below-ground pipesor tubes deliver water toindividual plant roots.Center pivot(efficiency 80% with low-pressuresprinkler <strong>and</strong> 90–95% with LEPA sprinkler)Water usually pumped fromunderground <strong>and</strong> sprayed frommobile boom with sprinklers.emitters in the tubing deliver drops of water at a slow<strong>and</strong> steady rate close to the plant roots.Another innovation is DRiWATER ® , called “dripirrigation in a box.” It consists of 1-liter (1.1-quart)packages of gel-encased water that is released slowlyinto the soil after being buried near plant roots. Itwastes almost no water <strong>and</strong> lasts about 3 months.Drip irrigation is very efficient, with 90—95% ofthe water reaching the crops. It is also adaptable becausethe flexible <strong>and</strong> lightweight plastic tubing can befitted to match the patterns of crops in a field <strong>and</strong> leftin place or moved around.Bad news. Drip irrigation is used on just over 1% ofthe world’s irrigated crop fields <strong>and</strong> 4% of those in theUnited States. However, this percentage rises to 90% inCyprus, 66% in Israel, <strong>and</strong> 13% in California. The mainproblem is that the capital cost of conventional drip irrigationsystems is too high for most poor farmers <strong>and</strong>for use on low-value row crops.Also, irrigation water is underpriced because ofgovernment subsidies. Raise water prices enough <strong>and</strong>drip irrigation would quickly be used to irrigate mostof the world’s crops. Good news. The capital cost of anew type of drip irrigation system is one-tenth asmuch per hectare as conventional drip systems.Figure 15-21 lists other ways to reduce waterwaste in irrigating crops. Since 1950, water-short Israelhas used many of these techniques to slash irrigation324 CHAPTER 15 Water Resources
water waste by about 84% while irrigating 44% morel<strong>and</strong>. Israel now treats <strong>and</strong> reuses 30% of its municipalsewage water for crop production <strong>and</strong> plans to increasethis to 80% by 2025. The government also graduallyremoved most government water subsidies toraise the price of irrigation water to one of the highestin the world. Israelis also import most of their wheat<strong>and</strong> meat <strong>and</strong> concentrate on growing fruits, vegetables,<strong>and</strong> flowers that need less water. Researchershave also found that farmers can often sustain grainyields by using one fourth less irrigation water as longas crops receive enough water during their criticalstages of growth.Many of the world’s poor farmers cannot afford touse most of the modern technological methods for increasingirrigation <strong>and</strong> its efficiency. Instead they usesmall-scale <strong>and</strong> low-cost traditional technologies.Some (in Bangladesh, for example) use pedalpoweredtreadle pumps to move water through irrigationditches. Others use buckets or small tanks withholes for drip irrigation.How Can We Waste Less Water in Industry,Homes, <strong>and</strong> Businesses? Copy Nature, RaisePrices, Improve EfficiencyWe can save water by using yard plants that needlittle water, using drip irrigation, raising water prices,fixing leaks, <strong>and</strong> using water-saving toilets <strong>and</strong> otherappliances.Figure 15-22 lists ways to use water more efficiently inindustries, homes, <strong>and</strong> businesses. Many homeowners<strong>and</strong> businesses in water-short areas are copying natureby replacing green lawns with vegetation adapted to adry climate (Figure 15-23). This win-win approach iscalled Xeriscaping (pronounced “ZEER-i-scaping”),<strong>and</strong> reduces water use by 30–85% <strong>and</strong> sharply reducesthe need for labor, fertilizer, <strong>and</strong> fuel. It also reducespolluted runoff, air pollution, <strong>and</strong> yard wastes. Somepeople in dry areas collect rainwater from gutters inlarge plastic barrels on wheels <strong>and</strong> use it to water theirflowers <strong>and</strong> gardens.About one-fifth of all U.S. public water systems donot have water meters <strong>and</strong> charge a single low rate foralmost unlimited use of high-quality water. Manyapartment dwellers have little incentive to conservewater because water use is included in their rent. InBoulder, Colorado, introducing water meters reducedwater use by more than one-third.Because of laws requiring water conservation, thedesert city of Tucson, Arizona, consumes half as muchwater per person as Las Vegas, a desert city with evenless rainfall <strong>and</strong> less emphasis on water conservation(Spotlight, p. 326).In the United States, flushing toilets with waterclean enough to drink is the single largest use ofSolutionsReducing Water Waste• Redesign manufacturing processes• L<strong>and</strong>scape yards with plants that requirelittle water• Use drip irrigation• Fix water leaks• Use water meters <strong>and</strong> charge for all municipalwater use• Raise water prices• Use waterless composting toilets• Require water conservation in water-short cities• Use water-saving toilets, showerheads, <strong>and</strong> frontloadingclothes washers• Collect <strong>and</strong> reuse household water to irrigatelawns <strong>and</strong> nonedible plants• Purify <strong>and</strong> reuse water for houses, apartments,<strong>and</strong> office buildingsFigure 15-22 Solutions: methods of reducing water waste inindustries, homes, <strong>and</strong> businesses. Which two of these solutionsdo you believe are the most important?Figure 15-23 Solutions: Xeriscaping. This technique can reducewater use by as much as 85% by l<strong>and</strong>scaping with rocks<strong>and</strong> plants that need little water <strong>and</strong> are adapted to the growingconditions in arid <strong>and</strong> semiarid areas. The term Xeriscape ® wasfirst used in 1978 in Denver, Colorado, <strong>and</strong> means “water conservationthrough creative l<strong>and</strong>scaping.”http://biology.brookscole.com/miller14325
Running Short of Waterin Las Vegas, NevadaLas Vegas, located in the MojaveDesert, is an artificial aquaticwonderl<strong>and</strong> of large trees, greenSPOTLIGHT lawns <strong>and</strong> golf courses, waterfalls,<strong>and</strong> swimming pools. Accordingto water experts, Las Vegas uses more water per personthan any other city in the world. It is also one of thefastest-growing cities in the United States.Tucson, Arizona, in the Sonoran Desert, is amodel of water conservation. It began a strict waterconservation program in 1976 that includedraising water rates 500% for some residents. As aresult, low-flush toilets, low-flow showerheads,Xeriscaping, <strong>and</strong> use of drip irrigation have becomethe norm.In contrast, Las Vegas, which gets one-third lessrainfall than Tucson, only recently started to encouragewater conservation. It has raised waterrates, but they are still less than half those inTucson <strong>and</strong> have not gone up. Las Vegas is almostwholly dependent on water from the ColoradoRiver stored in Lake Mead. Since 1999, a droughthas reduced its water level to 59% of capacity, <strong>and</strong>it could drop to 42% by 2008.Water experts project that even if these recentwater conservation efforts are successful, Las Vegasmay begin running short of water by 2007.Critical ThinkingIf you were an elected official in charge of Las Vegas,what three actions would you take to improvewater conservation? What might be the politicalimplications of doing these things?domestic water. It accounts for about 38% of domesticwater use, followed by bathing (32%), <strong>and</strong> washingclothes <strong>and</strong> dishes (20%). New models of low-flushtoilets can remove the equivalent of two dozen golfballs in one flush without clogging <strong>and</strong> use fewer than6.1 liters (1.6 gallons) of water—less than half theamount required by EPA st<strong>and</strong>ards.About 50–75% of the water from bathtubs, showers,bathroom sinks, <strong>and</strong> clothes washers in a typicalhouse could be stored <strong>and</strong> reused as gray water for irrigatinglawns <strong>and</strong> nonedible plants. About two-thirdsof the wastewater in Israel is reused this way. All ofSingapore’s sewage is treated at reclamation plants forreuse by industry.Another problem is leakage <strong>and</strong> other losses fromsystems that supply water to homes, businesses, <strong>and</strong>industries. According to UN studies, 15–40% of thewater supplied in urban areas is lost mostly throughleakage of water mains, pipes, pumps, <strong>and</strong> valves, <strong>and</strong>illegal water hook-ups. In some parts of Africa suchlosses can reach 50–70% of the water extracted fromsurface waters <strong>and</strong> aquifers. Even in an advanced industrializedcountry such as the United States suchlosses average 10–30%. However, such losses havebeen reduced to about 3% in Copenhagen <strong>and</strong>Denmark <strong>and</strong> 5% in Fukuoka, Japan.How Can We Reduce the Use of Waterin Removing Industrial <strong>and</strong> HouseholdWastes? Changing the Way We Deal withWastesWe can mimic the way nature deals with wastesinstead of using large amounts of high-quality waterto wash away <strong>and</strong> dilute our industrial <strong>and</strong> animalwastes.Industrialized countries use large amounts of watergood enough to drink to dilute <strong>and</strong> wash or flush awayindustrial, animal, <strong>and</strong> household wastes. Sewagetreatment plants remove valuable plant nutrients <strong>and</strong>dump most of them into rivers, lakes, <strong>and</strong> oceans. Thisoverloads aquatic systems with plant nutrients thatshould be recycled to the soil, as nature does.We also use high-quality water to flush toxic industrialwastes into sewers <strong>and</strong> send them to treatmentplants that do not remove most of the harmfulchemicals. The FAO estimates that if current trendscontinue, within 40 years we will need the world’s entirereliable flow of river water just to dilute <strong>and</strong> transportthe wastes we produce.We can use five principles to redesign the way wemanage sewage <strong>and</strong> industrial wastes while savingenormous amounts of water.■ Use pollution prevention <strong>and</strong> waste reduction tosharply decrease the amount of industrial wastes weproduce.■ Ban discharge of industrial toxic wastes into municipalsewer systems.■ Rely more on waterless composting toilets thatconvert human fecal matter to a small amount of dry<strong>and</strong> odorless soil-like humus material that can beremoved from a composting chamber every yearor so <strong>and</strong> returned to the soil as fertilizer. They work.I used one for almost two decades without anyproblems.■ Return the nutrient-rich sludge produced by conventionalwaste treatment plants to the soil as a fertilizer.Banning the input of toxic industrial chemicalsinto sewage treatment plants will make thisfeasible.■ Shift to new ways to treat sewage that mimic theway nature breaks down <strong>and</strong> recycles the nutrientsin organic waste material. Examples include solarpoweredwaste treatment systems <strong>and</strong> using wetl<strong>and</strong>sto treat sewage, as discussed in Chapter 22.326 CHAPTER 15 Water Resources
15-8 TOO MUCH WATERWhat <strong>Causes</strong> Flooding? Rain <strong>and</strong> PeopleHeavy rainfall, rapid melting of snow, removingvegetation, <strong>and</strong> destroying wetl<strong>and</strong>s cause flooding.Heavy rain <strong>and</strong> rapid snowmelt are the major causesof natural flooding by streams. A flood happens whenwater in a stream overflows its normal channel <strong>and</strong>spills into the adjacent area, called a floodplain (Figure15-24).People settle on floodplains because of their manyadvantages: fertile soil, ample water for irrigation,availability of nearby rivers for transportation <strong>and</strong>recreation, <strong>and</strong> flat l<strong>and</strong> suitable for crops, buildings,highways, <strong>and</strong> railroads.Floods have several benefits. They provide theworld’s most productive farml<strong>and</strong> because the l<strong>and</strong> isregularly covered with nutrient-rich silt left afterfloodwaters recede. They also recharge groundwater<strong>and</strong> help refill wetl<strong>and</strong>s.But each year, floods kill up to 25,000 people <strong>and</strong>cause tens of billions of dollars in property damage.Floods, like droughts, are usually considered naturaldisasters.Since the 1960s several types of human activitieshave contributed to the sharp rise in flood deaths <strong>and</strong>damages. One is removal of water-absorbing vegetation,especially on hillsides (Figure 15-25, p. 328). Another isdraining wetl<strong>and</strong>s that absorb floodwaters <strong>and</strong> reducethe severity of flooding. Living on floodplains also increasesthe threat of damage from flooding. Floodingalso increases when we pave or build <strong>and</strong> replace water-absorbing vegetation, soil, <strong>and</strong> wetl<strong>and</strong>s with highways,parking lots, <strong>and</strong> buildings that cannot absorbrainwater.In developed countries, people deliberately settleon floodplains <strong>and</strong> then expect dams, levees, <strong>and</strong> otherdevices to protect them from floodwaters. However,when heavier-than-normal rains occur, these devicescan be overwhelmed. In many developing countries,the poor have little choice but to try to survive inflood-prone areas (see the Case Study below).Case Study: Living on Floodplainsin Bangladesh—Danger for the PoorBangladesh has increased flooding because ofupstream deforestation of Himalayan mountainslopes <strong>and</strong> the clearing of mangrove forests on itscoastal floodplains.Bangladesh is one of the world’s most densely populatedcountries, with 141 million people (projected toreach 280 million by 2050) packed into an area roughlythe size of Wisconsin. It is also one of the world’s poorestcountries.The people of Bangladesh depend on moderateannual flooding during the summer monsoon seasonto grow rice <strong>and</strong> help maintain soil fertility in the deltabasin. The annual floods deposit eroded Himalayansoil on the country’s crop fields.In the past, great floods occurred every 50 years orso. But since the 1970s they have come about every 4years. Bangladesh’s increased flood problems begin inthe Himalayan watershed, where several factors—rapid population growth, deforestation, overgrazing,ReservoirDamLeveeFloodwallFloodplainFigure 15-24 L<strong>and</strong> in a natural floodplain (left) often is flooded after prolonged rains. When the floodwatersrecede, deposits of silt are left behind, creating a nutrient-rich soil. To reduce the threat of flooding <strong>and</strong> thus toallow people to live in floodplains, rivers have been narrowed <strong>and</strong> straightened (channelized), equipped withprotective levees <strong>and</strong> walls, <strong>and</strong> dammed to create reservoirs that store <strong>and</strong> release water as needed. Thesealterations can give a false sense of security to floodplain dwellers. In the long run, such measures can greatlyincrease flood damage because they can be overwhelmed by prolonged rains (right), as happened along theMississippi River in the midwestern United States during the summer of 1993.http://biology.brookscole.com/miller14327
Oxygenreleased byvegetationDiverseecologicalhabitatTree plantationEvapotranspiration decreasesLeaf litterimprovessoil fertilityForested HillsideTree rootsstabilize soil <strong>and</strong>aid water flowSteadyriver flowEvapotranspirationTrees reduce soilerosion from heavyrain <strong>and</strong> windVegetation releaseswater slowly <strong>and</strong>reduces floodingAgriculturall<strong>and</strong>After DeforestationRoadsdestabilizehillsidesGullies <strong>and</strong>l<strong>and</strong>slidesHeavy rain leachesnutrients from soil<strong>and</strong> erodes topsoilRanchingacceleratessoil erosion bywater <strong>and</strong> windSilt from erosion blocksrivers <strong>and</strong> reservoirs <strong>and</strong>causes flooding downstreamWinds removefragile topsoilAgricultural l<strong>and</strong>is flooded <strong>and</strong>silted upRapid runoffcauses floodingFigure 15-25 Natural capital degradation: hillside before <strong>and</strong> after deforestation. Once a hillside has beendeforested for timber <strong>and</strong> fuelwood, livestock grazing, or unsustainable farming, water from precipitationrushes down the denuded slopes, erodes precious topsoil, <strong>and</strong> floods downstream areas. A 3,000-year-oldChinese proverb says, “To protect your rivers, protect your mountains.”<strong>and</strong> unsustainable farming on steep <strong>and</strong> easily erodiblemountain slopes—have greatly diminished theability of its mountain soils to absorb water.Think of a forest as a complex living sponge forcatching, storing, using, <strong>and</strong> recycling water <strong>and</strong> releasingit in small amounts. Cut down the forests onthe Himalayan mountains <strong>and</strong> what happens? Insteadof being absorbed <strong>and</strong> released slowly, water from themonsoon rains runs off the denuded Himalayan foothills,carrying vital topsoil with it (Figure 15-25, right).This increased runoff of soil, combined with heavier-than-normalmonsoon rains, has increased theseverity of flooding along Himalayan rivers <strong>and</strong>downstream in Bangladesh. A disastrous flood in 1998covered two-thirds of Bangladesh’s l<strong>and</strong> area for 9months, leveled 2 million homes, drowned at least2,000 people, <strong>and</strong> left 30 million people homeless. Italso destroyed more than one-fourth of the country’scrops, which caused thous<strong>and</strong>s of people to die of starvation.In 2002, another flood left 5 million peoplehomeless <strong>and</strong> inundated large areas of rice fields.Living on Bangladesh’s coastal floodplain alsocarries dangers from storm surges <strong>and</strong> cyclones. In1970, as many as 1 million people drowned in onestorm, <strong>and</strong> another surge killed an estimated 139,000people in 1991.In their struggle to survive, the poor in Bangladeshhave cleared many of the country’s coastal mangroveforests for fuelwood, farming, <strong>and</strong> aquaculture pondsfor raising shrimp. This has led to more severe floodingbecause these coastal wetl<strong>and</strong>s help shelter Bangladesh’slow-lying coastal areas from storm surges <strong>and</strong>cyclones. Damages <strong>and</strong> deaths from cyclones in areasof Bangladesh still protected by mangrove forests havebeen much lower than in areas where the forests havebeen cleared.How Can We Reduce Flood Risks?Think about Where You Want to LiveWe can reduce flooding risks by controlling riverwater flows, preserving <strong>and</strong> restoring wetl<strong>and</strong>s,identifying <strong>and</strong> managing flood-prone areas, <strong>and</strong> ifpossible choosing not to live in such areas.We can use several methods to reduce the risk fromflooding. One is to straighten <strong>and</strong> deepen streams, aprocesscalled channelization (Figure 15-24, middle). Channelizationcan reduce upstream flooding but it removesbank vegetation <strong>and</strong> increases stream velocity. This increasedflow of water can promote upstream bank erosion,increase downstream flooding <strong>and</strong> sediment deposition,<strong>and</strong> reduce habitats for aquatic wildlife.Another approach is to build levees or floodwallsalong the sides of streams (Figure 15-24, middle). Leveescontain <strong>and</strong> accelerate stream flow, but this increasesthe water’s capacity for doing damage downstream.They also do not protect against unusually high<strong>and</strong> powerful floodwaters, as occurred in 1993 whentwo-thirds of the levees built along the MississippiRiver in the United States were damaged or destroyed.Building dams can also reduce the threat of floodingby storing water in a reservoir <strong>and</strong> releasing it328 CHAPTER 15 Water Resources
gradually. Another way to reduce flooding is to preserveexisting wetl<strong>and</strong>s <strong>and</strong> restore degraded wetl<strong>and</strong>s totake advantage of the natural flood control providedby floodplains.We can also identify <strong>and</strong> manage flood-prone areas.Actions include prohibiting certain types of buildingsor activities in high-risk flood zones, <strong>and</strong> elevating orfloodproofing buildings that are allowed on floodplains.In addition, we can construct a floodway thatallows floodwater to flow through a community withminimal damage. These prevention, or precautionary,approaches are based on thous<strong>and</strong>s of years of experiencethat can be summed up in one idea: Sooner or laterthe river (or ocean) always wins.On a personal level we can use the precautionaryapproach to think carefully about where we live. Many ofthe poor live in flood-prone areas because they havenowhere else to go. But most people can do some research<strong>and</strong> choose not to live in areas subject to flooding.• Not depleting aquifersSolutionsSustainable Water Use• Preserving ecological healthof aquatic systems• Preserving water quality• Integrated watershed management• Agreements among regions <strong>and</strong> countriessharing surface water resources• Outside party mediation of waterdisputes between nations• Marketing of water rights• Raising water prices• Wasting less water15-9 A MORE SUSTAINABLE WATERFUTUREHow Can We Use Water More Sustainably?A Blue RevolutionWe can use water more sustainably by cutting waste,raising water prices, preserving forests on waterbasins, <strong>and</strong> slowing population growth.Sustainable water use is based on the commonsenseprinciple stated in an old Inca proverb: “The frog doesnot drink up the pond in which it lives.” Figure 15-26lists ways to implement this principle.Historically, our response to water scarcity hasbeen to exp<strong>and</strong> the supply by building more dams,transporting water from one area to another, <strong>and</strong>drilling more wells. These measures will continue tosome degree, but water resource experts project thatthe emphasis will begin shifting from increasing thewater supply to reducing the water dem<strong>and</strong> by usingwater more efficiently <strong>and</strong> stabilizing population.The challenge in developing such a blue revolutionis to implement a mix of strategies. One involves usingtechnology to irrigate crops more efficiently <strong>and</strong> tosave water in industries <strong>and</strong> homes. A second approachuses economic <strong>and</strong> political decisions to removesubsidies that cause water to be underpriced<strong>and</strong> thus wasted while guaranteeing low prices forlow-income consumers, <strong>and</strong> adding subsidies that rewardreduced water waste.A third component is to switch to new waste production<strong>and</strong> treatment systems that accept only nontoxicwastes, use less or no water to treat wastes, returnnutrients in plant <strong>and</strong> animal wastes to the soil,<strong>and</strong> mimic the ways that nature decomposes <strong>and</strong> recyclesorganic wastes.• Decreasing government subsidiesfor supplying water• Increasing government subsidiesfor reducing water waste• Slowing population growthFigure 15-26 Solutions: methods for achieving more sustainableuse of the earth’s water resources.A fourth strategy is to leave enough water inrivers to protect wildlife, ecological processes, <strong>and</strong> thenatural ecological services provided by rivers (Figure13-12, p. 269). We now control the flow rates of mostrivers. As a result, some analysts say that we have anethical <strong>and</strong> ecological responsibility to manage riversfor wildlife <strong>and</strong> restore those we have damaged. Ecologicalrestoration efforts show that when we restore ariver’s flow <strong>and</strong> reconnect it with its floodplain itswildlife <strong>and</strong> ecological health can return. One way todo this is to follow South Africa’s lead in legally establishinga freshwater reserve for all rivers designed tosustain their biodiversity <strong>and</strong> the valuable ecosystemservices they provide for other species <strong>and</strong> society.Each of us can help bring about this blue revolutionby using <strong>and</strong> wasting less water. We can also supportgovernment policies that result in more sustainableuse of the world’s water <strong>and</strong> better ways to treatour industrial <strong>and</strong> household wastes. Figure 15-27(p. 330) lists ways you can reduce your water use <strong>and</strong>waste. Since virtually everything we use requires waterto produce, cutting down on unnecessary consumptionis a key to reducing water use <strong>and</strong> water pollution. Reducingmeat consumption is another way to lower wateruse <strong>and</strong> waste. The typical meat-intensive U.S. diethttp://biology.brookscole.com/miller14329
equires about twice as much water per person as a nutritiousvegetarian diet.As air is a sacred gas, so is water a sacred liquid that links usto all the oceans of the world <strong>and</strong> ties us back in time to thevery birthplace of life.DAVID SUZUKIWhat Can You Do?Water Use <strong>and</strong> Waste• Use water-saving toilets, showerheads, <strong>and</strong>faucet aerators.• Shower instead of taking baths, <strong>and</strong> takeshort showers.• Repair water leaks.• Turn off sink faucets while brushing teeth,shaving, or washing.• Wash only full loads of clothes or use the lowestpossible water-level setting for smaller loads.• Wash a car from a bucket of soapy water, <strong>and</strong>use the hose for rinsing only.• If you use a commercial car wash, try to find onethat recycles its water.• Replace your lawn with native plants that needlittle if any watering.• Water lawns <strong>and</strong> gardens in the early morningor evening.• Use drip irrigation <strong>and</strong> mulch for gardens<strong>and</strong> flowerbeds.• Use recycled (gray) water for watering lawns<strong>and</strong> houseplants <strong>and</strong> for washing cars.Figure 15-27 What can you do? Ways you can reduce youruse <strong>and</strong> waste of water.CRITICAL THINKING1. How do human activities increase the harmful effectsof prolonged drought? How can we reduce these effects?2. Put the following users in order of how much wateryou would allocate to them from the Colorado River (ifthe legal system allowed it): farmers, ranchers, cities,Native Americans, <strong>and</strong> Mexico. Explain your choices.3. What role does population growth play in water supplyproblems?4. Explain why you are for or against (a) gradually phasingout government subsidies of irrigation projects in thewestern United States (or in the country where you live)<strong>and</strong> (b) providing government subsidies to farmers forimproving irrigation efficiency.5. Should we use up slowly renewable underground watersupplies such as the Ogallala aquifer (Figure 15-19,p. 321) or save much of such supplies for future generations?Explain.6. Calculate how many liters <strong>and</strong> gallons of water arewasted in 1 month by a toilet that leaks 2 drops of waterper second (1 liter of water equals about 3,500 drops <strong>and</strong>1 liter equals 0.265 gallon).7. How do human activities contribute to flooding <strong>and</strong>flood damage? How can these effects be reduced?8. Congratulations! You are in charge of managing theworld’s water resources. What are the three most importantthings you would do?PROJECTS1. In your community,a. What are the major sources of the water supply?b. How is water use divided among agricultural,industrial, power plant cooling, <strong>and</strong> public uses?c. Who are the biggest consumers of water?d. What has happened to water prices (adjusted forinflation) during the past 20 years? Are they toolow to encourage water conservation <strong>and</strong> reuse?e. What water supply problems are projected?2. Develop a water conservation plan for your school<strong>and</strong> submit it to school officials.3. Consult with local officials to identify any floodplainareas in your community. Develop a map showing theseareas <strong>and</strong> the types of activities (such as housing, manufacturing,roads, <strong>and</strong> recreational use) found on thesel<strong>and</strong>s. Evaluate management of such floodplains inyour community <strong>and</strong> come up with suggestions forimprovement.4. Use the library or the Internet to find bibliographic informationabout John Todd <strong>and</strong> David Suzuki, whosequotes appear at the beginning <strong>and</strong> end of this chapter.5. Make a concept map of this chapter’s major ideas, usingthe section heads, subheads, <strong>and</strong> key terms (in boldfacetype). See material on the website for this bookabout how to prepare concept maps.LEARNING ONLINEThe website for this book contains study aids <strong>and</strong> manyideas for further reading <strong>and</strong> research. They include achapter summary, review questions for the entire chapter,flash cards for key terms <strong>and</strong> concepts, a multiple-choicepractice quiz, interesting Internet sites, references, <strong>and</strong> aguide for accessing thous<strong>and</strong>s of InfoTrac ® College Editionarticles. Log on tohttp://biology.brookscole.com/miller14Then click on the Chapter-by-Chapter area, choose Chapter15, <strong>and</strong> select a learning resource.330 CHAPTER 15 Water Resources
16 MineralGeology <strong>and</strong> NonrenewableResourcesMineralsCASE STUDYThe General Mining Lawof 1872Some people have gotten rich by using the littleknownU.S. General Mining Law of 1872. It was designedto encourage mineral exploration <strong>and</strong> themining of hardrock minerals (such as gold, silver, copper,zinc, nickel, <strong>and</strong> uranium) on U.S. public l<strong>and</strong>s<strong>and</strong> to help develop the then sparsely populated West.Under this law, a person or corporation can getmining rights for hardrock minerals or assume legalownership for parcels of l<strong>and</strong> on essentially all U.S.public l<strong>and</strong> except parks <strong>and</strong> wilderness by patentingit. They state that they believe the l<strong>and</strong> contains valuablehardrock minerals <strong>and</strong> promise to spend $500 toimprove the l<strong>and</strong> for mineral development. They canalso pay the federal government $6–12 per hectare($2.50–5.00 an acre) to buy the l<strong>and</strong>. Then they can useit for essentially any purpose, mine it, lease it, buildon it, or sell it. People have built golf courses, huntinglodges, hotels, <strong>and</strong> housing subdivisions on publicl<strong>and</strong> that they bought from taxpayers at 1872 prices.So far, public l<strong>and</strong>s containing an estimated $240–385 billion (adjusted for inflation) of publicly ownedmineral resources have been transferred to private interestsat 1872 prices. Domestic <strong>and</strong> foreign miningcompanies operating under this law remove mineralresources worth at least $2–3 billion per year on oncepublicl<strong>and</strong> they bought this way.In addition, the Congressional Budget Office estimatesthat mining companies remove hardrock mineralsworth at least $650 million per year from publicl<strong>and</strong> that has not been transferred to private ownership.About 20% of the mining rights for U.S. publicl<strong>and</strong>s are owned by foreign countries. Hardrock miningcompanies pay no royalties on the minerals theyextract from such l<strong>and</strong>s.In 1992, the 1872 law was modified to requiremining companies to post bonds to cover 100% of theestimated cleanup costs in case they go bankrupt. Inthe past this was not required. As a result, cleaningup l<strong>and</strong> <strong>and</strong> streams (Figure 16-1) damaged by morethan 550,000 ab<strong>and</strong>oned hardrock mines (mostly inthe West), would cost U.S. taxpayers $33–72 billion!Mining companies are lobbying Congress to overturnor greatly weaken the pollution bond requirement.Mining companies defend the 1872 law, pointingout that they must invest large sums (often $100 millionor more) to locate <strong>and</strong> develop an ore site beforethey make any profits from mining hardrock minerals.In addition, their mining operations provide highpayingjobs to miners, supply vital resources for industry,stimulate the national <strong>and</strong> local economies,reduce trade deficits, <strong>and</strong> save American consumersmoney on products produced from minerals.<strong>Environmental</strong>ists call for revising the law to banthe patenting (sale) of public l<strong>and</strong>s but allow 20-yearleases of designated public l<strong>and</strong> for hardrock mining.They would also require mining companies to pay agross royalty of 8–12% on the wholesale value of all mineralsremoved from public l<strong>and</strong>—similar to what oil,natural gas, <strong>and</strong> coal companies pay. <strong>Environmental</strong>istsalso want much stricter requirements for cleanup of anyenvironmental damage caused by mining companies.Canada, Australia, South Africa, <strong>and</strong> other countriesthat are major extractors of hardrock mineralshave laws that require royalty payments <strong>and</strong> full responsibilityfor environmental damage. What is youropinion on this issue?Figure 16-1 This polluted creek in Montana is one example of howgold mining on public or nonpublic l<strong>and</strong> can contaminate water withhighly toxic cyanide or mercury used to extract gold from its ore. Inaddition, air <strong>and</strong> water convert the sulfur in gold ore to sulfuric acid,which releases toxic metals such as cadmium <strong>and</strong> copper intostreams <strong>and</strong> groundwater. Until recently, companies mining forhardrock minerals on public l<strong>and</strong>s were not required to clean upsuch environmental harm.© Bryan Peterson
Civilization exists by geological consent, subject to changewithout notice.WILL DURANTThis chapter discusses the earth’s basic geologicalprocesses <strong>and</strong> the nonrenewable mineral resources weuse. It addresses the following questions:■■■■■What major geologic processes occur within theearth <strong>and</strong> on its surface?What are the hazards from earthquakes <strong>and</strong> volcaniceruptions?What are rocks, <strong>and</strong> how are they recycled by therock cycle?How do we find <strong>and</strong> extract mineral resourcesfrom the earth’s crust?Will there be enough nonrenewable mineralresources for future generations?16-1 GEOLOGIC PROCESSESIs the Earth a Stable or a Dynamic Planet?Change Is the NormThe planet we live on is constantly changingas a result of processes taking place on <strong>and</strong> belowits surface.Geology, the subject of this chapter, is the sciencedevoted to the study of dynamic processes occurringon the earth’s surface <strong>and</strong> in its interior. Geologistsstudy <strong>and</strong> analyze rocks <strong>and</strong> the features <strong>and</strong> processesof the earth’s interior <strong>and</strong> surface. Some of theseprocesses lead to geologic hazards such as earthquakes<strong>and</strong> volcanic eruptions, <strong>and</strong> others produce therenewable soil <strong>and</strong> nonrenewable mineral <strong>and</strong> energyresources that support life <strong>and</strong> economies.You probably think of the ground you st<strong>and</strong> on asstable <strong>and</strong> unmoving. Wrong. It is part of a dynamicplanet whose surface <strong>and</strong> interior are constantlychanging. Fortunately, most of these geologic changestake place very slowly on our short human time scale<strong>and</strong> most occur out of sight within the earth’s interior.Over eons continents have moved to new positions,breaking apart <strong>and</strong> crunching into one another(Figure 5-8, p. 95). Inside the earth, huge cyclical flowsof molten rock break the earth’s surface into a series ofgigantic plates that move very slowly across theplanet’s surface. Go outside <strong>and</strong> you are st<strong>and</strong>ing onone of these moving plates. Hard to believe, isn’t it?Energy from the sun <strong>and</strong> from the earth’s interior,coupled with the erosive power of flowing water, havecreated continents, mountains, valleys, plains, <strong>and</strong>ocean basins in an ongoing process that continues tochange the l<strong>and</strong>scape. And every now <strong>and</strong> then thesolid earth under our feet shakes, rattles, <strong>and</strong> rollsduring an earthquake, or erupts like a punctured boilwhen a volcano forms or awakens after a long geologicalsleep.What Is the Earth’s Structure? Livingon a Layered SphereThe earth’s three major zones are its core, mantle,<strong>and</strong> crust.As the primitive earth cooled over eons, its interiorseparated into three major concentric zones, layerswhich geologists identify as the core, the mantle, <strong>and</strong>the crust (Figure 4-7, p. 60). In other words, beneathyour feet is a crust of soil <strong>and</strong> rock floating on a mantleof partly melted <strong>and</strong> solid rock, which surrounds anintensely hot core. What we know about the earth’s interiorcomes mostly from indirect evidence such asdensity measurements, seismic (earthquake) wavestudies, measurements of interior heat flow, lavaanalyses, <strong>and</strong> research on meteorite composition.The core is the earth’s innermost zone. It is intenselyhot <strong>and</strong> has a solid inner part, surrounded by aliquid core of molten or semisolid material.A thick solid zone called the mantle surrounds thecore. Most of the mantle is solid rock, but under itsrigid outermost part is a zone—the asthenosphere—ofvery hot, partly melted rock that flows slowly <strong>and</strong> canbe deformed like soft plastic.The outermost <strong>and</strong> thinnest zone of the earth iscalled the crust. It consists of the continental crust,which underlies the continents (including the continentalshelves extending into the oceans), <strong>and</strong> theoceanic crust, which underlies the ocean basins <strong>and</strong>covers 71% of the earth’s surface (Figure 16-2).16-2 INTERNAL AND EXTERNALGEOLOGIC PROCESSESWhat Geologic Processes Occur withinthe Earth’s Interior? Welcome to theHot ZoneHuge volumes of heated <strong>and</strong> molten rock movearound within the earth’s interior.We tend to think of the earth’s crust, mantle, <strong>and</strong> coreas fairly static. But geologic processes taking placewithin the earth <strong>and</strong> on its surface, mostly over thous<strong>and</strong>sto millions of years, bring about changes inthese components (Figure 16-3, p. 334).Geologic changes originating from the earth’s interior,called internal processes, generally build up theplanet’s surface. Heat from the earth’s interior providesthe energy for these processes, but gravity alsoplays a role.Residual heat from the earth’s formation is still beinggiven off as the inner core cools <strong>and</strong> the outer core332 CHAPTER 16 Geology <strong>and</strong> Nonrenewable Mineral Resources
AbyssalhillsAbyssalfloorOceanicridgeAbyssalfloorTrench Folded mountain beltVolcanoesCratonOceanic crust(lithosphere)Abyssal plainContinentalriseContinentalslopeContinentalshelfAbyssal plainMantle (lithosphere)Continental crust(lithosphere)Mantle(lithosphere)Mantle (asthenosphere)Figure 16-2 Natural capital: major features of the earth’s crust <strong>and</strong> upper mantle. The lithosphere, composedof the crust <strong>and</strong> outermost mantle, is rigid <strong>and</strong> brittle. The asthenosphere, a zone in the mantle, can be deformedby heat <strong>and</strong> pressure.cools <strong>and</strong> solidifies. Continued decay of radioactiveelements in the crust, especially the continental crust,provides much of this heat flow from within. Heatfrom the core causes much of the mantle to deform<strong>and</strong> flow slowly like heated plastic.Measurements of heat flow within the earth suggestthat two kinds of movement occur in the mantle’sasthenosphere. One is convection cells or currents thatmove large volumes of rock <strong>and</strong> heat in loops withinthe mantle like a giant conveyer belt (Figure 16-3). Internalheat pushes soft rock in the mantle’s asthenosphereupward, then downward as the rock cools. Thispattern resembles convection in the atmosphere (Figure6-9, p. 107) or in a pot of boiling water (Figure 3-11,left, p. 45).The second type of movement involves mantleplumes, in which mantle rock flows slowly upward in acolumn (Figure 16-3), like smoke from a chimney on acold, calm morning. When the moving rock reachesthe top of the plume, it moves out in a radial pattern,as if it were flowing up an umbrella through the h<strong>and</strong>le<strong>and</strong> then spreading out in all directions from thetip of the umbrella to the rim. There is a lot going onbeneath your feet.What Is Plate Tectonics? The EarthIs MovingHuge solid plates—called tectonic plates—moveextremely slowly across the earth’s surface.The flows of energy <strong>and</strong> heated material in the mantleconvection cells cause about 15 huge rigid plates,called tectonic plates, to move extremely slowly acrossthe earth’s surface (Figure 16-3 <strong>and</strong> Figure 16-4,p. 335). These plates are about 100 kilometers (60 miles)thick. They are composed of the continental <strong>and</strong>oceanic crust <strong>and</strong> the rigid, outermost part of the mantle(above the asthenosphere), a combination called thelithosphere.These plates move constantly, supported by theslowly flowing asthenosphere. They are somewhatlike large icebergs floating extremely slowly on thesurface of an ocean or like the world’s largest <strong>and</strong>slowest-moving surfboards. Some plates move about1 centimeter (slightly more than a third of an inch) ayear. Others at a seafloor spreading zone can move asmuch as 18 centimeters (7 inches) a year. You are ridingor surfing on one of these plates throughout yourentire life, but the motion is too slow for you to notice.The theory explaining the movements of theplates <strong>and</strong> the processes that occur at their boundariesis called plate tectonics. The concept, which becamewidely accepted by geologists in the 1960s, was developedfrom an earlier idea called continental drift.Throughout the earth’s history, continents have split<strong>and</strong> joined as plates have very slowly drifted thous<strong>and</strong>sof kilometers back <strong>and</strong> forth across the planet’ssurface (Figure 5-8, p. 95).As these plates collide, break apart, <strong>and</strong> slide byone another over millions of years, they producemountains on l<strong>and</strong> (such as the Himalayas <strong>and</strong> theAppalachian Mountains of the eastern United States),huge ridges <strong>and</strong> trenches on the ocean floor, <strong>and</strong> otherfeatures of the earth’s surface (Figures 16-2 <strong>and</strong> 16-3).These movements <strong>and</strong> geological processes continuetoday. Natural hazards such as volcanoes <strong>and</strong> earthquakesare likely to be found at plate boundaries. Inaddition, plate movements <strong>and</strong> interactions affect thehttp://biology.brookscole.com/miller14333
Collision between twoTectonic platecontinentsOceanic tectonic platePlate movementSubductionzoneSpreadingcenterOceanicOceanic crusttectonic platePlate movementOceanic crustOceantrenchContinentalcrustContinentalcrustMaterial coolsas it reachesthe outer mantleCold densematerial fallsback throughmantleMantleconvectioncellHot materialrisingthroughthe mantleTwo plates movetowards each other.One is subductedback into the mantleon falling convectioncurrent.Hot outercoreInnercoreMantleFigure 16-3 Natural capital: the earth’s crust is made up of a series of rigid plates, called tectonicplates, which move around in response to forces in the mantle.earth’s climate <strong>and</strong> concentrate many of the mineralswe extract <strong>and</strong> use.The theory of plate tectonics also helps explainhow certain patterns of biological evolution occurred.By reconstructing the course of continental drift overmillions of years, scientists can trace how species migratedfrom one area to another when continents thatare now far apart were still joined together. As the continentsseparated, populations became geographically<strong>and</strong> reproductively isolated, <strong>and</strong> speciation occurred.In other words, tectonic plates have played a major butmostly unnoticed role in the drama of life that continuesto unfold on our planetary home.What Types of Boundaries Occurbetween the Earth’s Plates? Moving Apart,Colliding, <strong>and</strong> SlidingThe earth’s tectonic plates move apart, pushtogether, <strong>and</strong> slide past one another.Lithospheric plates have three types of boundaries(Figure 16-5, p. 336). One is a divergent plate boundary,where the plates move apart in opposite directions.A second type is a convergent plate boundary,where the plates are pushed together by internalforces (Figure 16-5, middle). When an oceanic platecollides with a continental plate, the continental plate334 CHAPTER 16 Geology <strong>and</strong> Nonrenewable Mineral Resources
usually rides up over the denser oceanic plate <strong>and</strong>pushes it down into the mantle in a process calledsubduction. The area where this collision <strong>and</strong> subductiontakes place is called a subduction zone. Overtime the subducted plate melts <strong>and</strong> rises back to theearth’s surface as molten rock or magma. A trenchordinarily forms at the boundary between the twoconverging plates. Stresses in the plate undergoingsubduction cause earthquakes at convergent plateboundaries.The third type of boundary is a transform fault,which occurs where plates slide <strong>and</strong> grind past one anotheralong a fracture (fault) in the lithosphere (Figure16-5, bottom). Most transform faults are on theocean floor but a few are found on l<strong>and</strong>. An exampleis the North American Plate <strong>and</strong> the Pacific Plate thatslide <strong>and</strong> rub past each other along California’s SanAndreas Fault. As a result, southern California isslowly moving along this transform fault towardnorthern California. Sometime perhaps 30 millionyears from now the geographical area we now call LosAngeles will probably slowly grind <strong>and</strong> slide by thegeographical area now known as San Francisco. But bythen neither of these areas will exist as we know themtoday. This is fascinating stuff from a geological perspectiveof the earth’s history but is not a problem thatwe need worry about.What Geologic Processes Occuron the Earth’s Surface? Erosion <strong>and</strong>WeatheringWater <strong>and</strong> wind move large amounts of soil <strong>and</strong>broken-down pieces of rock from one place toanother.Geologic changes based directly or indirectly on energyfrom the sun <strong>and</strong> on gravity (rather than on heatin the earth’s interior) are called external processes. Internalprocesses generally build up the earth’s surface.In contrast, external processes tend to wear it down<strong>and</strong> produce a variety of l<strong>and</strong>forms <strong>and</strong> environmentsformed by the buildup of eroded sediment.A major external process is erosion: the process bywhich material is dissolved, loosened, or worn awayfrom one part of the earth’s surface <strong>and</strong> deposited elsewhere.Flowing streams cause most erosion. WindEURASIAN PLATEMid-IndianOceanRidgeCHINASUBPLATEINDIAN-AUSTRALIAN PLATEPHILIPPINEPLATETransformfaultJUAN DEFUCA PLATEPACIFICPLATETransformfaultCOCOSPLATEEast PacificRiseNORTHAMERICANPLATENAZCAPLATECARIBBEANPLATEMid-AtlanticOceanRidgeSOUTHAMERICANPLATEReykjanesRidgeANATOLIAN PLATEARABIANPLATEAFRICANPLATESOMALIANSUBPLATEEURASIANPLATECarlsbergRidgeSoutheast IndianOcean RidgeTransformfaultSouthwest IndianOcean RidgeANTARCTIC PLATEConvergentplate boundariesPlate motionat convergentplate boundariesDivergent ( ) <strong>and</strong>transform fault ( )boundariesPlate motionat divergentplate boundariesFigure 16-4 The earth’s major tectonic plates. These b<strong>and</strong>s correspond to the patterns for the types of lithosphericplate boundaries shown in Figure 16-5. What plate do you live on?http://biology.brookscole.com/miller14335
AsthenosphereOceanic ridge at a divergent plate boundarySubductionzoneTrenchVolcanic isl<strong>and</strong> arcRisingmagmaTrench <strong>and</strong> volcanic isl<strong>and</strong> arc at a convergentplate boundaryFracture zoneTransformfaultLithosphereLithosphereAsthenosphereLithosphereAsthenosphereTransform fault connecting two divergent plate boundariesFigure 16-5 Types of boundaries between the earth’slithospheric plates. All three types occur both in oceans <strong>and</strong> oncontinents.blowing particles of soil from one area to another is anothercause. Human activities, particularly those thatdestroy vegetation that holds soil in place, accelerateerosion, as discussed in Section 14-3 (p. 279).Weathering consists of the physical, chemical, <strong>and</strong>biological processes that break down rocks <strong>and</strong> mineralsinto smaller particles that can be eroded. There arethree types of weathering processes. One is physical ormechanical weathering, in which a large rock mass isbroken into smaller fragments. This is similar to whathappens when you hammer a rock into pieces. Themost important agent of mechanical weathering is frostwedging, in which water collects in pores <strong>and</strong> cracks ofrock, exp<strong>and</strong>s upon freezing, <strong>and</strong> splits off pieces ofthe rock. This is also what causes most of the potholeswe complain about in our roads <strong>and</strong> streets.A second process is chemical weathering, in whichone or more chemical reactions decompose a mass ofrock. Most chemical weathering involves a reaction ofrock material with oxygen, carbon dioxide, <strong>and</strong> moisturein the atmosphere <strong>and</strong> on the ground.A third process is biological weathering, the conversionof rock or minerals into smaller particles throughthe action of living things. For example, lichens produceacids that can chemically weather rocks. Androots growing into <strong>and</strong> rubbing against rock can physicallybreak it into small pieces.16-3 NATURAL GEOLOGICHAZARDS: EARTHQUAKESAND VOLCANIC ERUPTIONSWhat Are Earthquakes? Shake, Rattle,<strong>and</strong> RollEarthquakes occur when a part of the earth’scrust suddenly fractures, shifts to relieve stress,<strong>and</strong> releases energy as shock waves.Stress in the earth’s crust can cause solid rock to deformuntil it suddenly fractures <strong>and</strong> shifts along thefracture, producing a fault (Figure 16-5, bottom). Thefaulting or a later abrupt movement on an existingfault causes an earthquake that has certain features<strong>and</strong> effects (Figure 16-6).Relief of the earth’s internal stress releases energyas shock waves, which move outward from the earthquake’sfocus like ripples in a pool of water. Scientistsmeasure the severity of an earthquake by the magnitudeof its shock waves. The magnitude is a measure ofthe amount of energy released in the earthquake, as indicatedby the amplitude (size) of the vibrations whenthey reach a recording instrument (seismograph).Scientists use the Richter scale, on which eachunit represents an amplitude 10 times greater than thenext smaller unit. Thus a magnitude 5.0 earthquake is10 times greater than a magnitude 4.0, <strong>and</strong> a magnitude6.0 quake is 100 times greater than a magnitude4.0 quake. Seismologists rate earthquakes as insignifi-336 CHAPTER 16 Geology <strong>and</strong> Nonrenewable Mineral Resources
cant (less than 4.0 on the Richter scale), minor (4.0–4.9),damaging (5.0–5.9), destructive (6.0–6.9), major (7.0–7.9),<strong>and</strong> great (over 8.0).Earthquakes often have aftershocks that graduallydecrease in frequency over a period of up to severalmonths, <strong>and</strong> some have foreshocks from seconds toweeks before the main shock.The primary effects of earthquakes include shaking<strong>and</strong> sometimes a permanent vertical or horizontal displacementof the ground. These effects may have seriousconsequences for people <strong>and</strong> for buildings,bridges, freeway overpasses, dams, <strong>and</strong> pipelines. Anearthquake is a very large rock-<strong>and</strong>-roll event.Secondary effects of earthquakes include rockslides,urban fires, <strong>and</strong> flooding caused by subsidence(sinking) of l<strong>and</strong>. Coastal areas can be severely damagedby earthquakes at sea that can generate hugewater waves, called tsunamis (also called tidal waves,although they have nothing to do with tides) thattravel as fast as 950 kilometers (590 miles) per hour.You cannot outrun one of these waves.One way to reduce loss of life <strong>and</strong> property fromearthquakes is to examine historical records <strong>and</strong> makegeologic measurements to locate active fault zones. Wecan also map high-risk areas (Figure 16-7), establishbuilding codes that regulate the placement <strong>and</strong> designof buildings in areas of high risk, <strong>and</strong> increase researchon projecting when <strong>and</strong> where earthquakes will occur.Then people can decide how high the risk might be<strong>and</strong> whether they want to accept the risk <strong>and</strong> live inareas subject to earthquakes.Engineers know how to make homes, large buildings,bridges, <strong>and</strong> freeways more earthquake resistant.But this can be expensive, especially the reinforcementof existing structures.Liquefaction ofrecent sedimentscauses buildingsto sinkL<strong>and</strong>slides mayoccur onhilly groundShockwavesEpicenterFocusTwo adjoining platesmove laterally alongthe fault lineEarth movementscause flooding inlow-lying areasFigure 16-6 Major features <strong>and</strong> effects of an earthquake.CanadaUnited StatesNo damage expectedMinimal damageModerate damageSevere damageFigure 16-7 Expected damage from earthquakes in Canada<strong>and</strong> the contiguous United States. This map is based on earthquakerecords. (U.S. Geological Survey)What Are Volcanoes? Popping an EarthCorkSome volcanoes erupt quietly <strong>and</strong> release flowsof molten rock but others erupt explosively <strong>and</strong>spew large chunks of lava rock, ash, <strong>and</strong> harmfulgases into the atmosphere.An active volcano occurs where magma (molten rock)reaches the earth’s surface through a central vent or along crack (fissure; Figure 16-8, p. 338). Volcanic activitycan release ejecta (debris ranging from large chunksof lava rock to ash that may be glowing hot), liquidlava, <strong>and</strong> gases (such as water vapor, carbon dioxide,<strong>and</strong> sulfur dioxide) into the environment.Volcanic activity is concentrated for the most partin the same areas as seismic activity. Some volcanoeserupt explosively <strong>and</strong> eject large quantities of gases <strong>and</strong>particulate matter (soot <strong>and</strong> mineral ash) high into thetroposphere. Most of the particles of soot <strong>and</strong> ash soonfall back to the earth’s surface. But gases such as sulfurdioxide remain in the atmosphere <strong>and</strong> are converted totiny droplets of sulfuric acid, many of which stay abovethe clouds <strong>and</strong> may not be washed out by rain for up to3 years. These tiny droplets reflect some of the sun’s energy<strong>and</strong> can cool the atmosphere for 1–4 years.http://biology.brookscole.com/miller14337
Figure 16-8 A volcano erupts when molten magma in thepartially molten asthenosphere rises in a plume through thelithosphere to erupt on the surface as lava that can spill over orbe ejected into the atmosphere. Chains of isl<strong>and</strong>s can be createdby eruptions of volcanoes that then become inactive.extinctvolcanoesOther volcanoes erupt morequietly. They involve primarilylava flows, which can cover roads<strong>and</strong> villages <strong>and</strong> ignite brush,trees, <strong>and</strong> homes.We tend to think negatively ofvolcanic activity, but it also providessome benefits. One is outst<strong>and</strong>ingscenery in the form ofmajestic mountains, some lakes(such as Crater Lake in Oregon;see title page photo), <strong>and</strong> otherl<strong>and</strong>forms. Perhaps the most importantbenefit of volcanism is thehighly fertile soils produced bythe weathering of lava.SolidlithosphereWe can reduce the loss of human life <strong>and</strong> sometimesproperty from volcanic eruptions. One way is touse historical records <strong>and</strong> geologic measurements toidentify high-risk areas so that people can try to avoidliving in them. Other methods involve developing effectiveevacuation plans <strong>and</strong> trying to develop measurementsthat warn us when volcanoes are likely toerupt.Scientists are studying phenomena that precedean eruption. Examples include tilting or swelling ofthe cone, changes in magnetic <strong>and</strong> thermal propertiesof the volcano, changes in gas composition, <strong>and</strong> increasedseismic activity.centralventmagmaconduitUpwellingmagmamagmareservoirPartially moltenasthenosphereA mineral is an element or inorganic compoundthat occurs naturally <strong>and</strong> is solid with a regular internalcrystalline structure. Some minerals consist of asingle element, such as gold, silver, diamond (carbon),<strong>and</strong> sulfur. But most of the more than 2,000 identifiedminerals occur as inorganic compounds formed byvarious combinations of elements. Examples are salt,mica, <strong>and</strong> quartz.Rock is a solid combination of one or more mineralsthat is part of the earth’s crust. Some kinds of rock,such as limestone (calcium carbonate, or CaCO 3 ) <strong>and</strong>quartzite (silicon dioxide, or SiO 2 ), contain only onemineral, but most rocks consist of two or more minerals.16-4 MINERALS, ROCKS,AND THE ROCK CYCLEWhat Are Minerals <strong>and</strong> Rocks?Hard StuffThe earth’s crust consists of solid inorganicelements <strong>and</strong> compounds called minerals <strong>and</strong>masses of one or more minerals called rock.The earth’s crust, still forming in various places, iscomposed of minerals <strong>and</strong> rocks. It is the source ofalmost all the nonrenewable resources we use: fossilfuels, metallic minerals, <strong>and</strong> nonmetallic minerals (Figure1-6, p. 9). It is also the source of soil (Figure 4-25,p. 73) <strong>and</strong> of the elements that make up your body <strong>and</strong>the bodies of other living organisms. You are mostlywater mixed with chemically transformed particles ofminerals <strong>and</strong> rock <strong>and</strong> a small amount of air.What Are the Major Rock Types <strong>and</strong> How AreThey Recycled? Really Slow RecyclingThe earth’s crust contains igneous, sedimentary, <strong>and</strong>metamorphic rocks that are recycled by the rock cycle.Based on the way it forms, rock is placed in threebroad classes. One is igneous rock, formed below oron the earth’s surface when molten rock (magma)wells up from the earth’s upper mantle or deep crust,cools, <strong>and</strong> hardens. Examples are granite (formed underground)<strong>and</strong> lava rock (formed aboveground whenmolten lava cools <strong>and</strong> hardens). Although often coveredby sedimentary rocks or soil, igneous rocks formthe bulk of the earth’s crust. They also are the mainsource of many nonfuel mineral resources.A second type is sedimentary rock. It is formedfrom sediment produced when existing rocks areweathered <strong>and</strong> eroded into small pieces, <strong>and</strong> trans-338 CHAPTER 16 Geology <strong>and</strong> Nonrenewable Mineral Resources
ported from their sources by water, wind, or gravity todownstream, downwind, or downhill sites. These sedimentsare deposited in layers that accumulate overtime <strong>and</strong> increase the weight <strong>and</strong> pressure on underlyinglayers. A combination of pressure <strong>and</strong> dissolvedminerals seeping through the layers of sediment crystallize<strong>and</strong> bind sediment particles together to formsedimentary rock.Examples are s<strong>and</strong>stone <strong>and</strong> shale (formed frompressure created by deposited layers of sediment),dolomite <strong>and</strong> limestone (formed from the compactedshells, skeletons, <strong>and</strong> other remains of dead organisms),<strong>and</strong> lignite <strong>and</strong> bituminous coal (derived fromplant remains). Some types of sedimentary rock are theresult of crystals precipitating out of or growing in solutions<strong>and</strong> then being compacted in layers or dryingout to leave crystals behind. An example is rock salt,which we know as table salt or sodium chloride (NaCl).The third type is metamorphic rock, producedwhen a preexisting rock is subjected to high temperatures(which may cause it to melt partially), highpressures, chemically active fluids, or a combination ofthese agents. These forces can change or transform arock by reshaping its internal crystalline structure <strong>and</strong>its physical properties <strong>and</strong> appearance. Examples areanthracite (a form of coal), slate (formed when shale<strong>and</strong> mudstone are heated), <strong>and</strong> marble (producedwhen limestone is exposed to heat <strong>and</strong> pressure).The interaction of physical <strong>and</strong> chemical processesthat changes rocks from one type to another is calledthe rock cycle (Figure 16-9). It recycles the earth’s threetypes of rocks over millions of years <strong>and</strong> is the slowestof the earth’s cyclic processes. It also concentrates theplanet’s nonrenewable mineral resources on which wedepend. Without the incredibly slow rock cycle youwould not exist.ErosionTransportationWeatheringDepositionSedimentary rockS<strong>and</strong>stone, limestoneIgneous rockGranite, pumice,basaltHeat, pressureCoolingHeat, pressure,stressMagma(molten rock)MeltingMetamorphic rockSlate, marble,gneiss, quartziteFigure 16-9 Natural capital: the rock cycle is the slowest of the earth’s cyclic processes. The earth’s materials are recycled overmillions of years by three processes: melting, erosion, <strong>and</strong> metamorphism, which produce igneous, sedimentary, <strong>and</strong> metamorphicrocks. Rock of any of the three classes can be converted to rock of either of the other two classes, or can be recycled within itsown class.http://biology.brookscole.com/miller14339
What Are Nonrenewable MineralResources? Useful Rock ResourcesMineral resources are nonrenewable materialsthat we can extract from the earth’scrust.A nonrenewable mineral resource is a concentrationof naturally occurring material in or on the earth’scrust that can be extracted <strong>and</strong> processed into usefulmaterials at an affordable cost. Over millions to billionsof years the earth’s internal <strong>and</strong> external geologicprocesses have produced numerous nonfuel mineralresources <strong>and</strong> fossil fuel energy resources. Becausethey take so long to produce, they are classified as nonrenewableresources.We know how to find <strong>and</strong> extract more than 100nonrenewable minerals from the earth’s crust. Theyinclude metallic mineral resources (iron, copper, aluminum),nonmetallic mineral resources (salt, clay, s<strong>and</strong>,phosphates, <strong>and</strong> soil), <strong>and</strong> energy resources (coal, oil,natural gas, <strong>and</strong> uranium).Ore is rock containing enough of one or moremetallic minerals to be mined profitably. We convertabout 40 metals extracted from ores into many everydayitems that we either use <strong>and</strong> discard (Figure 3-18,p. 53) or learn to reuse, recycle, or use less wastefully(Figure 3-19, p. 53).The U.S. Geological Survey divides nonrenewablemineral resources into four major categories (Figure16-10):■ Identified resources: deposits of a nonrenewablemineral resource with a known location, quantity, <strong>and</strong>Decreasing cost of extractionUndiscoveredOtherresourcesDecreasing certaintyExistenceIdentifiedReservesKnownFigure 16-10 Natural capital: general classification of mineralresources. (The area shown for each class does not representits relative abundance.) In theory, all mineral resources classifiedas other resources could become reserves because of risingmineral prices or improved mineral location <strong>and</strong> extractiontechnology. In practice, geologists expect only a fraction ofother resources to become reserves.Not economical Economicalquality, or whose existence is based on direct geologicevidence <strong>and</strong> measurements■ Reserves: identified resources from which a usablenonrenewable mineral can be extracted profitably atcurrent prices■ Undiscovered resources: potential supplies of anonrenewable mineral resource assumed to existon the basis of geologic knowledge <strong>and</strong> theory butwith unknown specific locations, quality, <strong>and</strong>amounts■ Other resources: undiscovered resources <strong>and</strong> identifiedresources not classified as reservesMost published estimates of the supply of a givennonrenewable resource refer to reserves. Reserves canincrease when new deposits are found or when higherprices or improved mining technology make it profitableto extract deposits that previously were too expensiveto extract. Theoretically, all other resourcescould eventually be converted to reserves, but this ishighly unlikely.16-5 FINDING, REMOVING, ANDPROCESSING NONRENEWABLEMINERAL RESOURCESHow Are Buried Mineral Deposits Found?Underground Detective WorkPromising underground deposits of minerals arelocated by a variety of physical <strong>and</strong> chemicalmethods.Mining companies use several methods to find promisingmineral deposits. One is using aerial photos<strong>and</strong> satellite images to reveal protruding rock formations(outcrops) associated with certain minerals.Also, planes can be equipped with radiation-measuringequipment to detect deposits of radioactive mineralssuch as uranium ore, <strong>and</strong> a magnetometer to measurechanges in the earth’s magnetic field caused by magneticminerals such as iron ore. Another method uses agravimeter to measure differences in gravity caused bydifferences in density between an ore deposit <strong>and</strong> thesurrounding rock.Underground methods include drilling a deepwell <strong>and</strong> extracting core samples. Scientists can alsoput sensors in existing wells to detect electrical resistanceor radioactivity to pinpoint the location of oil<strong>and</strong> natural gas. Scientists also make seismic surveys onl<strong>and</strong> <strong>and</strong> at sea by detonating explosive charges <strong>and</strong>analyzing the resulting shock waves to get informationabout the makeup of buried rock layers. Yet anothermethod is to perform chemical analysis of water<strong>and</strong> plants to detect deposits of underground mineralsthat have leached into nearby bodies of water or havebeen absorbed by plant tissues.340 CHAPTER 16 Geology <strong>and</strong> Nonrenewable Mineral Resources
How Are Buried Mineral DepositsRemoved? Heavy Digging <strong>and</strong> LiftingShallow deposits of mineral deposits are removedby surface mining, <strong>and</strong> deep deposits are removedby subsurface mining.After suitable mineral deposits are located, several differenttypes of mining techniques are used to removethem, depending on their location <strong>and</strong> type. Shallowdeposits are removed by surface mining, <strong>and</strong> deep depositsare removed by subsurface mining.In surface mining, mechanized equipment stripsaway the overburden of soil <strong>and</strong> rock <strong>and</strong> usually discardsit as waste material called spoils. Surface miningextracts about 90% of the nonfuel mineral <strong>and</strong> rock resources<strong>and</strong> 60% of the coal (by weight) that are usedin the United States.The type of surface mining used depends on theresource being sought <strong>and</strong> on local topography. Thereare several types of surface mining. One is open-pitmining (Figure 16-11a), in which machines dig holes<strong>and</strong> remove ores (such as iron <strong>and</strong> copper), s<strong>and</strong>,gravel, <strong>and</strong> stone (such as limestone <strong>and</strong> marble). Asecond method is dredging (Figure 16-11b), in whichchain buckets <strong>and</strong> draglines scrape up underwatermineral deposits.A third method used where the terrain is fairly flatis area strip mining (Figure 16-11c). A gigantic earthmoverstrips away the overburden, <strong>and</strong> a huge powershovel digs a cut to remove the mineral deposit. Thenthe trench is filled with overburden <strong>and</strong> a new cut ismade parallel to the previous one. The process is repeatedover the entire site. If filling it does not restorethe l<strong>and</strong>, area strip mining leaves a wavy series ofhighly erodible hills of rubble called spoil banks.Contour strip mining (Figure 16-11d) is used onhilly or mountainous terrain. A power shovel cuts a seriesof terraces into the side of a hill. An earthmover removesthe overburden, a power shovel extracts thecoal, <strong>and</strong> the overburden from each new terrace is(a) Open Pit Mine(b) Dredging(c) Area Strip Mining(d) Contour Strip MiningFigure 16-11 Major mining methods used to extract surface deposits of solid mineral<strong>and</strong> energy resources.http://biology.brookscole.com/miller14341
VentilationshaftMainshaftLift cageShaftCoalseams(a) Underground Coal MinePumps(b) Room-<strong>and</strong>-PillarFigure 16-12 Major mining methods used to extract undergrounddeposits of solid mineral <strong>and</strong> energy resources (primarilycoal). (a) Mine shafts <strong>and</strong> tunnels are dug <strong>and</strong> blastedout. (b) In room-<strong>and</strong>-pillar mining, machinery is used to gougeout coal <strong>and</strong> load it onto a shuttle car in one operation, <strong>and</strong>pillars of coal are left to support the mine roof. (c) In longwallcoal mining, movable steel props support the roof <strong>and</strong> cuttingmachines shear off the coal onto a conveyor belt. As the miningproceeds, roof supports are moved forward <strong>and</strong> the roof behindis allowed to fall (often causing the l<strong>and</strong> above to sink orsubside).(c) Longwall Mining of Coaldumped onto the one below. Unless the l<strong>and</strong> is restored,a wall of dirt is left in front of a highly erodiblebank of soil <strong>and</strong> rock called a highwall.Another method is mountaintop removal. It usesexplosives, massive shovels, <strong>and</strong> huge machinerycalled draglines to remove the top of a mountain <strong>and</strong>expose seams of coal underneath. The resulting wasterock <strong>and</strong> dirt is pushed down into the nearest streams<strong>and</strong> valleys below. This form of surface mining—increasinglyused in West Virginia—causes considerableenvironmental damage.Although surface-mined l<strong>and</strong> can be restored (exceptin arid <strong>and</strong> semiarid areas), it is expensive <strong>and</strong> notdone in many countries. In the United States, the SurfaceMining Control <strong>and</strong> Reclamation Act of 1977 requiresmining companies to restore most surface-mined l<strong>and</strong>so it can be used for the same purpose as before it wasmined. The act also levied a tax on mining companiesto restore l<strong>and</strong> that was disturbed by surface miningbefore the law was passed. But reclamation efforts areonly partially successful <strong>and</strong> coal companies continuelobbying elected officials to have the law weakened orto choke off funds for its enforcement.Subsurface mining (Figure 16-12) removes coal <strong>and</strong>various metal ores that are too deep to be extracted bysurface mining. Miners dig a deep vertical shaft, blastsubsurface tunnels <strong>and</strong> chambers to get to the deposit,<strong>and</strong> use machinery to remove the ore or coal <strong>and</strong> transportit to the surface.Subsurface mining disturbs less than one-tenth asmuch l<strong>and</strong> as surface mining <strong>and</strong> usually producesless waste material. But it leaves much of the resourcein the ground <strong>and</strong> is more dangerous <strong>and</strong> expensivethan surface mining. Hazards include cave-ins, explosions,<strong>and</strong> lung diseases (such as black lung) caused byprolonged inhalation of mining dust.342 CHAPTER 16 Geology <strong>and</strong> Nonrenewable Mineral Resources
16-6 ENVIRONMENTAL EFFECTSOF USING MINERAL RESOURCESWhat Are the <strong>Environmental</strong> Impactsof Nonrenewable Mineral Resources?Degradation, Waste, <strong>and</strong> PollutionExtracting, processing, <strong>and</strong> using mineral resourcescan disturb the l<strong>and</strong>, kill miners, erode soils, producelarge amounts of solid waste, <strong>and</strong> pollute the air,water, <strong>and</strong> soil.The mining, processing, <strong>and</strong> use of mineral resourcestakes enormous amounts of energy <strong>and</strong> often causesl<strong>and</strong> disturbance, soil erosion, <strong>and</strong> air <strong>and</strong> water pollution(Figure 16-13).Mining can harm the environment in a number ofways. One is scarring <strong>and</strong> disruption of the l<strong>and</strong> surface.The Department of the Interior estimates that at least500,000 surface-mined sites dot the U.S. l<strong>and</strong>scape,mostly in the West. Cleanup costs are estimated in thetens of billions of dollars.Another problem is collapse of l<strong>and</strong> above undergroundmines. This subsidence can cause houses to tilt,sewer lines to crack, gas mains to break, <strong>and</strong> groundwatersystems to be disrupted.Toxin-laced mining wastes can be blown or depositedelsewhere by wind or water erosion. Anotherproblem is acid mine drainage. It occurs when rainwaterseeping through a mine or mine wastes carries sulfuricacid (H 2 SO 4 , produced when aerobic bacteria act oniron sulfide minerals in spoils) to nearby streams <strong>and</strong>groundwater (Figures 16-1 <strong>and</strong> 16-14, p. 344). This contaminateswater supplies <strong>and</strong> can destroy some formsof aquatic life. According to the U.S. <strong>Environmental</strong>Protection Agency, mining has polluted about 40% ofwestern watersheds.Mining can also result in emission of toxic chemicalsinto the atmosphere. In the United States, the miningindustry produces more toxic emissions than anyother industry—typically accounting for almost half ofsuch emissions. Finally, some forms of wildlife can beexposed to toxic mining wastes stored in holdingponds <strong>and</strong> leaking from such ponds.What Is the Typical Life Cycle of aNonrenewable Metal Resource? GoingAround in CirclesMetal ores are extracted from the earth’s crust,purified, smelted to extract the desired metal, <strong>and</strong>converted to the desired products.Figure 16-15 (p. 345) depicts the typical life cycle of ametal resource. It begins with extracting ore from theearth’s crust.Ore typically has two components. One is the oremineral containing the desired metal <strong>and</strong> the other isSteps<strong>Environmental</strong> EffectsMiningexploration, extractionDisturbed l<strong>and</strong>; mining accidents;health hazards; mine wastedumping; oil spills <strong>and</strong> blowouts;noise; ugliness; heatProcessingtransportation, purification,manufacturingSolid wastes; radioactive material;air, water, <strong>and</strong> soil pollution;noise; safety <strong>and</strong> healthhazards; ugliness; heatUsetransportation or transmissionto individual user,eventual use, <strong>and</strong> discardingNoise; ugliness;thermal water pollution;pollution of air, water, <strong>and</strong> soil;solid <strong>and</strong> radioactive wastes;safety <strong>and</strong> health hazards; heatFigure 16-13 Natural capital degradation: some harmful environmental effects of extracting, processing, <strong>and</strong>using nonrenewable mineral <strong>and</strong> energy resources. The energy used to carry out each step causes additionalpollution <strong>and</strong> environmental degradation.http://biology.brookscole.com/miller14343
SubsurfaceMine OpeningAcid drainage fromreaction of mineralor ore with waterRunoff ofsedimentSpoil banksSurface MinePercolation to groundwaterLeaching may carryacids into soil <strong>and</strong>groundwater suppliesLeaching of toxic metals<strong>and</strong> other compoundsfrom mine spoilFigure 16-14 Natural capital degradation: pollution <strong>and</strong> degradation of a stream <strong>and</strong> groundwater by runoffof acids—called acid mine drainage—<strong>and</strong> by toxic chemicals from surface <strong>and</strong> subsurface mining. These substancescan kill fish <strong>and</strong> other aquatic life. Acid mine drainage has damaged more than 19,000 kilometers(12,000 miles) of streams in the United States, mostly in Appalachia <strong>and</strong> the West.waste material called gangue (pronounced “gang”).Removing the gangue from ores produces piles ofwaste called tailings. Particles of toxic metals blownby the wind or leached from tailings by rainfall cancontaminate surface water <strong>and</strong> groundwater.After gangue has been removed, smelting is usedto separate the metal from the other elements in the oremineral. Without effective pollution control equipment,smelters emit enormous quantities of air pollutants,which damage vegetation <strong>and</strong> soils in the surroundingarea. They also cause water pollution <strong>and</strong> produce liquid<strong>and</strong> solid hazardous wastes that must be disposedof safely.Some companies are using improved technologyto reduce pollution from smelting, thereby loweringproduction costs, saving costly cleanup bills, <strong>and</strong> decreasingliability for damages.Once smelting has produced the pure metal, it isusually melted <strong>and</strong> converted to desired products,which are then used <strong>and</strong> discarded or recycled.Are There <strong>Environmental</strong> Limitsto Resource Extraction <strong>and</strong> Use?A Serious Problem<strong>Environmental</strong> damage caused by extraction,processing, <strong>and</strong> use of mineral resources can limittheir availability.Some environmentalists <strong>and</strong> resource experts do notbelieve that exhaustion of supplies is the greatest dangerfrom continually increasing consumption of nonrenewablemineral resources. Instead, it is more likelyto be the environmental damage caused by their extraction,processing, <strong>and</strong> conversion to products (Figure16-13).The environmental impacts from mining an oreare affected by its percentage of metal content, orgrade. The more accessible <strong>and</strong> higher-grade ores areusually exploited first. As they are depleted, it takesmore money, energy, water, <strong>and</strong> other materials to exploitlower-grade ores. This in turn increases l<strong>and</strong> disruption,mining waste, <strong>and</strong> pollution.For example, gold miners typically remove anamount of ore equal to the weight of 50 automobiles toextract a piece of gold that would fit inside yourclenched fist. Most newlyweds would be surprised toknow that about 5.5 metric tons (6 tons) of miningwaste was created to make their two gold weddingrings. In Australia <strong>and</strong> North America, a mining technologycalled cyanide heap leaching is cheap enough toallow mining companies to level entire mountainscontaining very low-grade gold ore. Cyanide—ahighly toxic chemical—is used to separate about 85%of the world’s gold from waste ore.Currently, most of the harmful environmentalcosts of mining <strong>and</strong> processing minerals are not includedin the prices for processed metals <strong>and</strong> the resultingconsumer products. Instead, these costs arepassed on to society <strong>and</strong> future generations, whichgives mining companies <strong>and</strong> manufacturers little in-344 CHAPTER 16 Geology <strong>and</strong> Nonrenewable Mineral Resources
Separationof ore fromgangueMetal oreSurfaceminingSmeltingRecyclingScattered in environmentMeltingmetalConversionto productDiscardingof productFigure 16-15 Typical life cycle of a metal resource. Each step in this process uses energy<strong>and</strong> produces some pollution <strong>and</strong> waste heat.centive to reduce resource waste <strong>and</strong> pollution. <strong>Environmental</strong>ists<strong>and</strong> some economists call for phasing infull-cost pricing—including the cost of environmentalharm done in the price of goods made from minerals.xHOW WOULD YOU VOTE? Should market prices of goodsmade from minerals include their harmful environmental costs?Cast your vote online at http://biology.brookscole.com/miller14.Aperts disagree about depletion times, theyare often using different assumptions aboutsupply <strong>and</strong> rate of use (Figure 16-16).The shortest depletion time assumesno recycling or reuse <strong>and</strong> no increase in reserves(curve A, Figure 16-16). A longer depletiontime assumes that recycling willstretch existing reserves <strong>and</strong> that bettermining technology, higher prices, <strong>and</strong> newdiscoveries will increase reserves (curve B,Figure 16-16). An even longer depletiontime assumes that new discoveries will furtherexp<strong>and</strong> reserves <strong>and</strong> that recycling,reuse, <strong>and</strong> reduced consumption will extendsupplies (curve C, Figure 16-16). Findinga substitute for a resource leads to a newset of depletion curves for the new resource.We can use geological methods tomake fairly good estimates of the reservesof most resources (Figure 16-10, blue) <strong>and</strong>less accurate measurements of potentialother supplies of mineral resources (Figure16-10, red). Rising prices <strong>and</strong> improvedmining technology can convertsome of the other resources to reserves,but it is difficult to make accurate projectionsof how much this will add to the usablesupply.Mine, use, throw away;no new discoveries;rising prices16-7 SUPPLIES OF MINERALRESOURCESWill We Have Enough Nonrenewable MineralResources? Making Educated GuessesThe future supply of a resource depends on itsavailable <strong>and</strong> affordable supply <strong>and</strong> how rapidlythat supply is used.The future supply of nonrenewable minerals dependson two factors. One is the actual or potential supply ofthe mineral <strong>and</strong> the other is the rate at which we use it.We never completely run out of any mineral.However, a mineral becomes economically depletedwhen it costs more to find, extract, transport, <strong>and</strong>process the remaining deposit than it is worth. At thatpoint, there are five choices: recycle or reuse existing supplies,waste less, use less, find a substitute, or do without.Depletion time is how long it takes to use up a certainproportion—usually 80%—of the reserves of a mineralat a given rate of use (Figure 1-8, p. 11). When ex-ProductionPresentBDepletiontime ACRecycle; increase reservesby improved miningtechnology, higher prices,<strong>and</strong> new discoveriesDepletiontime BTimeRecycle, reuse, reduceconsumption; increasereserves by improvedmining technology,higher prices, <strong>and</strong>new discoveriesDepletiontime CFigure 16-16 Depletion curves for a nonrenewable resource (suchas aluminum or copper) using three sets of assumptions. Dashedvertical lines represent times when 80% depletion occurs.http://biology.brookscole.com/miller14345
We do know that the dem<strong>and</strong> for mineral resourcesis increasing at a rapid rate as more peopleconsume more <strong>and</strong> more stuff. For example, since 1940Americans alone have used up as large a share of theearth’s mineral resources as all previous generationsput together, <strong>and</strong> this resource-use treadmill is speedingup.Will we run out of affordable supplies of a particularmineral resource? No one knows. If we do, can wefind an acceptable substitute? Some think we can. Arethere environmental limits to the use of mineral resources?Many environmentalists think so unless wecan use microorganisms, or other less environmentallyharmful ways, to extract <strong>and</strong> process minerals, or nanotechnologyto construct materials we need from atoms<strong>and</strong> molecules.How Does Economics Affect Supplies ofNonrenewable Minerals? Prices Can Make aDifference If the Market Is Truly FreeA rising price for a scarce mineral resource canincrease supplies <strong>and</strong> encourage more efficient use.Geologic processes determine the quantity <strong>and</strong> locationof a mineral resource in the earth’s crust. But economicsdetermines what part of the known supply isextracted <strong>and</strong> used.According to st<strong>and</strong>ard economic theory, in a competitivefree market a plentiful mineral resource ischeap when its supply exceeds dem<strong>and</strong>. And when aresource becomes scarce its price rises. This can encourageexploration for new deposits, stimulate developmentof better mining technology, <strong>and</strong> make itprofitable to mine lower-grade ores. It can also encouragea search for substitutes <strong>and</strong> promote resourceconservation.But according to some economists, this price effectmay no longer apply very well in most developedcountries. One reason is that industry <strong>and</strong> governmentin such countries often control the supply, dem<strong>and</strong>,<strong>and</strong> prices of minerals to such an extent that a trulycompetitive free market does not exist.Most mineral prices are artificially low becausegovernments subsidize development of their domesticmineral resources to help promote economic growth<strong>and</strong> national security. In the United States, for instance,mining companies get depletion allowances amountingto 5–22% of their gross income (depending on themineral). They can also reduce the taxes they pay bydeducting much of their costs for finding <strong>and</strong> developingmineral deposits. In addition, hardrock miningcompanies operating in the United States can buy publicl<strong>and</strong> at 1872 prices or use public l<strong>and</strong> <strong>and</strong> pay noroyalties to the government on the minerals they extract(see the Case Study that opens this chapter).Between 1982 <strong>and</strong> 2004, U.S. mining companiesreceived more than $6 billion in government subsidies.Critics argue that taxing rather than subsidizing theextraction of nonfuel mineral resources would providegovernments with revenue, create incentives for moreefficient resource use, promote waste reduction <strong>and</strong>pollution prevention, <strong>and</strong> encourage recycling <strong>and</strong>reuse of mineral resources.Mining company representatives say they needsubsidies <strong>and</strong> low taxes to keep the prices of mineralslow for consumers <strong>and</strong> to encourage the companies notto move their mining operations to other countries withno such taxes <strong>and</strong> less stringent mining regulations.Economic problems can also hinder the developmentof new supplies of mineral resources becauseexploring for them takes lots of increasingly scarce investmentcapital <strong>and</strong> is risky financially. Typically, ifgeologists identify 10,000 possible deposits of a givenresource, only 1,000 sites are worth exploring; only 100justify drilling, trenching, or tunneling; <strong>and</strong> only 1 becomesa producing mine or well. If you had lots offinancial capital, would you invest it in developing anonrenewable mineral resource?Should More Mining Be Allowed on PublicL<strong>and</strong>s in the United States?There is controversy over whether to extract moremineral resources from public l<strong>and</strong>s.About one-third of the l<strong>and</strong> in the United States is publicl<strong>and</strong> owned jointly by all U.S. citizens. This l<strong>and</strong>,consisting of national forests, parks, resource l<strong>and</strong>s, <strong>and</strong>wilderness (Figure 11-6, p. 198), is managed by variousgovernment agencies under laws passed by Congress.For decades, resource developers, environmentalists,<strong>and</strong> conservationists have argued over how thisl<strong>and</strong> should be used. Extractors of mineral resourcescomplain that three-fourths of the country’s vast publicl<strong>and</strong>s, with many areas containing rich deposits ofmineral resources, are off limits to mining.In recent decades, they have stepped up efforts tohave Congress open up most of these l<strong>and</strong>s to mineraldevelopment, sell off mineral-rich public l<strong>and</strong>s to privateinterests, or turn their management over to state<strong>and</strong> local governments (which often can be more readilyinfluenced by mining <strong>and</strong> development interests).Since 2002, the Bush administration <strong>and</strong> Congresshave exp<strong>and</strong>ed the extraction of mineral, timber, <strong>and</strong>fossil fuel resources on U.S. public l<strong>and</strong>s.Conservation biologists <strong>and</strong> environmentalistsstrongly oppose such efforts. They argue that thisincreases environmental degradation <strong>and</strong> decreasesbiodiversity.Can We Get Enough Minerals by MiningLower-Grade Ores? Taking It to the LimitNew technologies can increase the mining oflow-grade ores at affordable prices, but harmfulenvironmental effects can limit this.346 CHAPTER 16 Geology <strong>and</strong> Nonrenewable Mineral Resources
Some analysts contend that all we need to do toincrease supplies of a mineral is to extract lowergrades of ore. They point to the development of newearth-moving equipment, improved techniques for removingimpurities from ores, <strong>and</strong> other technologicaladvances in mineral extraction <strong>and</strong> processing.In 1900, the average copper ore mined in theUnited States was about 5% copper by weight. Todayit is 0.5%, <strong>and</strong> copper costs less (adjusted for inflation).New methods of mineral extraction may allow evenlower-grade ores of some metals to be used.But several factors can limit the mining of lowergradeores. One is the increased cost of mining <strong>and</strong> processinglarger volumes of ore. Another is the availabilityof fresh water needed to mine <strong>and</strong> process someminerals—especially in arid <strong>and</strong> semiarid areas. Athirdlimiting factor is the environmental impact of the increasedl<strong>and</strong> disruption, waste material, <strong>and</strong> pollutionproduced during mining <strong>and</strong> processing (Figure 16-13).One way to improve mining technology is to usemicroorganisms for in-place (in situ, pronounced “in-SY-too”) mining. This biological approach removes desiredmetals from ores while leaving the surroundingenvironment undisturbed. It also reduces air pollutionassociated with the smelting of metal ores <strong>and</strong> reduceswater pollution associated with using hazardous chemicalssuch as cyanides <strong>and</strong> mercury to extract gold.Once a commercially viable ore deposit has beenidentified, wells are drilled into it <strong>and</strong> the ore is fractured.Then the ore is inoculated with natural or geneticallyengineered bacteria to extract the desired metal.Next the well is flooded with water, which is pumpedto the surface, where the desired metal is removed.Then the water is recycled.This technique permits economical extractionfrom low-grade ores that are used more as high-gradeores are depleted. Currently, more than 30% of all copperproduced worldwide, worth more than $1 billion ayear, comes from such biomining. If naturally occurringbacteria cannot be found to extract a particular metal,genetic engineering techniques could be used to producesuch bacteria.However, microbiological ore processing is slow.It can take decades to remove the same amount of materialthat conventional methods can remove withinmonths or years. So far, biological mining methods areeconomically feasible only with low-grade ore forwhich conventional techniques are too expensive.Can We Use Nanotechnology to ProduceNew Materials? Evaluating a New TechnologyThat May Change the WorldBuilding new materials from the bottom up byassembling atoms <strong>and</strong> molecules has enormouspotential but could have potentially harmfulunintended effects.Nanotechnology is using science <strong>and</strong> engineering at theatomic <strong>and</strong> molecular level to build materials withspecified properties from the bottom up. It involvesfinding ways to manipulate atoms <strong>and</strong> molecules assmall as 1–100 nanometers—billionths of a meter—wide. For comparison, your unaided eye cannot seethings smaller than 10,000 nanometers across <strong>and</strong> thewidth of a typical human hair is 50,000 nanometers.This atomic <strong>and</strong> molecular approach to manufacturinguses raw materials of abundant atoms such ascarbon, oxygen, <strong>and</strong> hydrogen <strong>and</strong> arranges them tocreate everything from medicines <strong>and</strong> solar cells to automobilebodies, hopefully with little environmentalharm <strong>and</strong> without depleting nonrenewable resources.One example is soccer-ball-shaped forms of carboncalled buckyballs.Nanotechnology scientists entice us with visionsof a molecular economy. They include a supercomputerthe size of a sugar cube that could store all the informationin the U.S. Library of Congress, biocompositematerials smaller than a human cell that would makeyour bones <strong>and</strong> tendons super strong, designer moleculesthat could seek out <strong>and</strong> kill only cancer cells,foam with nanoparticles that could provide superthermalinsulation, <strong>and</strong> windows, kitchens, <strong>and</strong> bathroomsthat never need cleaning. The list could go on.This research is in the early stages <strong>and</strong> tangible resultsare a decade away. But already nanotechnologyhas been used to develop stain-resistant <strong>and</strong> wrinklefreematerials for pants <strong>and</strong> sunscreens that block ultravioletlight.Nobel laureate Horst Stormer says, “Nanotechnologyhas given us the tools ...to play with the ultimatetoy box of nature—atoms <strong>and</strong> molecules. ...The possibilities to create new things appear limitless.”You might want to consider this rapidly emergingfield as a career choice.So what is the catch? What are some possible unintendedharmful consequences of nanotechnology? Oneconcern is that as particles get smaller they becomemore reactive <strong>and</strong> potentially more toxic because theyhave large surface areas relative to their mass. Anotheris that nanosize particles can get through the naturaldefenses of our bodies. They could easily reach thelungs <strong>and</strong> from there migrate to other organs, includingthe central nervous system, <strong>and</strong> to the bloodstream.In 2004, Eva Olberdorster, an environmental toxicologistat Southern Methodist University, found thatfish swimming in water loaded with buckyballs experiencebrain damage within 48 hours. Little is knownabout how buckyballs <strong>and</strong> other nanoparticles behavein the human body. But factories are churning outbuckyballs <strong>and</strong> these <strong>and</strong> other nanoparticles are startingto show up in products from cosmetics to sunscreens<strong>and</strong> in the environment.Many analysts say we need to do two things beforeunleashing widespread use of nanotechnology.http://biology.brookscole.com/miller14347
First, carefully investigate its potential ecological,health, <strong>and</strong> societal risks. Second, develop guidelines<strong>and</strong> regulations for controlling <strong>and</strong> guiding its spreaduntil we have better answers to many of the “What happensnext?” questions about this technology.Can We Get More Minerals from Seawater<strong>and</strong> by Mining the Ocean Floor? Some<strong>Problems</strong>Most minerals in seawater cost too much toextract, <strong>and</strong> mineral resources found on the deepocean floor are not being removed because of highcosts <strong>and</strong> squabbles over who owns them.Ocean mineral resources are found in seawater, sediments<strong>and</strong> deposits on the shallow continental shelf,hydrothermal ore deposits (Figure 16-17), <strong>and</strong> manganese-richnodules on the deep-ocean floor.Most of the chemical elements found in seawateroccur in such low concentrations that recovering themtakes more energy <strong>and</strong> money than they are worth.Only magnesium, bromine, <strong>and</strong> sodium chloride areabundant enough to be extractedprofitably at current prices withexisting technology.Deposits of minerals (mostlysediments) along the continentalshelf <strong>and</strong> near shorelines are significantsources of s<strong>and</strong>, gravel,phosphates, sulfur, tin, copper,iron, tungsten, silver, titanium,platinum, <strong>and</strong> diamonds.Rich hydrothermal depositsof gold, silver, zinc, <strong>and</strong> copperare found as sulfide deposits inthe deep-ocean floor <strong>and</strong> aroundblack smokers (Figure 16-17).Currently, it costs too much to extractthese minerals even thoughsome of these deposits contain large concentrations ofimportant metals.Manganese-rich nodules found on the deep-oceanfloor at various sites may be a future source of manganese<strong>and</strong> other key metals. They might be sucked upfrom the ocean floor by giant vacuum pipes orscooped up by buckets on a continuous cable operatedby a mining ship.So far these nodules <strong>and</strong> resource-rich mineralbeds in international waters have not been developedbecause of high costs <strong>and</strong> squabbles over who ownsthem <strong>and</strong> how any profits from extracting themshould be distributed among the world’s nations.Some environmentalists believe seabed miningprobably would cause less environmental harm thanmining on l<strong>and</strong>. But they are concerned that removingseabed mineral deposits <strong>and</strong> dumping back unwantedmaterial will stir up ocean sediments, destroy seafloororganisms, <strong>and</strong> have potentially harmful effects onpoorly understood ocean food webs <strong>and</strong> marine biodiversity.They call for more research to help evaluatesuch possible effects.Black smokerSulfide depositsWhite smokerMagmaFigure 16-17 Natural capital:hydrothermal ore deposits form whenmineral-rich superheated watershoots out of vents in solidifiedmagma on the ocean floor. After mixingwith cold seawater, black particlesof metal ore precipitate out <strong>and</strong>build up as chimneylike ore depositsaround the vents. A variety of organisms,supported by bacteria that producefood by chemosynthesis, existin the dark ocean around these blacksmokers.WhitecrabWhite clamTubeworms348 CHAPTER 16 Geology <strong>and</strong> Nonrenewable Mineral Resources
Can We Find Substitutes for ScarceNonrenewable Mineral Resources?The Materials RevolutionScientists <strong>and</strong> engineers are developing new types ofmaterials that can serve as substitutes for many metals.Some analysts believe that even if supplies of key mineralsbecome too expensive or scarce, human ingenuitywill find substitutes. They point to the current materialsrevolution in which silicon <strong>and</strong> new materials, particularlyceramics <strong>and</strong> plastics, are being developed <strong>and</strong>used as replacements for metals.Ceramics have many advantages over conventionalmetals. They are harder, stronger, lighter, <strong>and</strong>longer lasting than many metals, <strong>and</strong> they withst<strong>and</strong> intenseheat <strong>and</strong> do not corrode. Within a few decades wemay have high-temperature ceramic superconductorsin which electricity flows without resistance. Such a developmentmay lead to faster computers, more efficientpower transmission, <strong>and</strong> affordable electromagnets forpropelling high-speed magnetic levitation trains.High-strength plastics <strong>and</strong> composite materialsstrengthened by lightweight carbon <strong>and</strong> glass fibersare beginning to transform the automobile <strong>and</strong> aerospaceindustries. They cost less to produce than metalsbecause they take less energy, do not need painting,<strong>and</strong> can be molded into any shape. New plastics <strong>and</strong>gels are also being developed to provide superinsulationwithout taking up much space. And nanotechnologymay result in many new materials.Substitutes can be found for many scarce mineralresources. But finding substitutes for some key materialsmay be difficult or impossible. Examples are helium,phosphorus for phosphate fertilizers, manganesefor making steel, <strong>and</strong> copper for wiring motors <strong>and</strong>generators.In addition, some substitutes are inferior to theminerals they replace. For example, aluminum couldreplace copper in electrical wiring. But producing aluminumtakes much more energy than producing copper,<strong>and</strong> aluminum wiring is a greater fire hazard thancopper wiring.Mineral resources are the building blocks on which modernsociety depends. Knowledge of their physical nature <strong>and</strong>origins, the web they weave between all aspects of humansociety <strong>and</strong> the physical earth, can lay the foundations for asustainable society.ANN DORRCRITICAL THINKING1. Explain why you support or oppose each of the followingproposals concerning extraction of hardrock mineralson public l<strong>and</strong> in the United States: (a) not grantingtitle to public l<strong>and</strong>s in the United States for actual orclaimed hardrock mining, (b) requiring mining companiesto pay a royalty of 8–12% on the gross revenues theyearn from hardrock minerals they extract from publicl<strong>and</strong>s, <strong>and</strong> (c) making hardrock mining companieslegally responsible for restoring the l<strong>and</strong> <strong>and</strong> cleaning upenvironmental damage caused by their activities.2. Describe what would probably happen if (a) plate tectonicsstopped <strong>and</strong> (b) erosion <strong>and</strong> weathering stopped.If you could, would you eliminate either group ofprocesses? Explain.3. Imagine you are an igneous rock. Act as a microscopicreporter <strong>and</strong> send in a written report on whatyou experience as you move through various parts ofthe rock cycle (Figure 16-9, p. 339). Repeat this experience,assuming in turn you are a sedimentary rock <strong>and</strong>then a metamorphic rock.4. In the area where you live, are you more likely to experiencean earthquake or a volcanic eruption? What canyou do to escape or reduce the harm if such a disasterstrikes? What actions can you take when it occurs?5. Congratulations! You are in charge of the world. Whatare the three most important features of your policy fordeveloping <strong>and</strong> sustaining the world’s nonrenewablemineral resources?PROJECTS1. Write a brief scenario describing the series of consequencesto us <strong>and</strong> to other forms of life if the rock cyclestopped functioning.2. What mineral resources are extracted in your area?What mining methods are used, <strong>and</strong> what have beentheir harmful environmental impacts? How has miningthese resources benefited the local economy?3. Use the library or the Internet to find out where earthquakes<strong>and</strong> volcanic eruptions have occurred during thepast 30 years, <strong>and</strong> then stick small flags on a map of theworld or place dots on Figure 16-4 (p. 335) <strong>and</strong> comparetheir locations with the plate boundaries shown in thisfigure.4. Use the library or the Internet to find bibliographic informationabout Will Durant <strong>and</strong> Ann Dorr, whose quotesappear at the beginning <strong>and</strong> end of this chapter.5. Make a concept map of this chapter’s major ideas usingthe section heads, subheads, <strong>and</strong> key terms (in boldface).Look on the website for this book for informationabout making concept maps.LEARNING ONLINEThe website for this book contains study aids <strong>and</strong> manyideas for further reading <strong>and</strong> research. They include achapter summary, review questions for the entire chapter,flash cards for key terms <strong>and</strong> concepts, a multiple-choicepractice quiz, interesting Internet sites, references, <strong>and</strong> aguide for accessing thous<strong>and</strong>s of InfoTrac ® College Editionarticles. Log on tohttp//biology.brookscole.com/miller14Then click on the Chapter-by-Chapter area, choose Chapter16, <strong>and</strong> select a learning resource.http://biology.brookscole.com/miller14349
17 NonrenewableEnergy ResourcesEnergyCASE STUDYBitter Lessons from ChernobylChernobyl is known around the globe as the site ofthe world’s most serious nuclear power plant accident(Figure 17-1). On April 26, 1986, a series of explosionsin one of the reactors in a nuclear powerplant in Ukraine—then part of the Soviet Union—blew the massive roof off a reactor building <strong>and</strong>flung radioactive debris <strong>and</strong> dust high into the atmosphere.A huge radioactive cloud spread overmuch of Belarus, Russia, Ukraine, <strong>and</strong> other parts ofEurope <strong>and</strong> eventually encircled the planet. Cloudsof radioactive material escaped into the atmospherefor 10 days. The surrounding environment <strong>and</strong> peoplewere exposed to radiation levels about 100 timeshigher than those caused by the atomic bomb theUnited States dropped on Hiroshima, Japan, near theend of World War II.According to various UN studies, the disaster wascaused by poor reactor design <strong>and</strong> human error.Around 30 people near the accident site died from radiationexposure <strong>and</strong> nearly 2,000 children developedthyroid cancer. Thous<strong>and</strong>s of others may have also developedvarious cancers <strong>and</strong> died. But because of poorrecordkeeping no one knows the exact death toll, withthe estimated number of premature deaths rangingfrom 8,000 to 15,000. Regardless of numbers, this was amajor human-caused tragedy.More than 100,000 people had to leave theirhomes. Most were not evacuated until at least 10 daysafter the accident. These environmental refugees hadto leave their possessions behind. They also had to saygoodbye to lush green wheat fields <strong>and</strong> blossomingapple trees, l<strong>and</strong> their families had farmed for generations,cows <strong>and</strong> goats that would be shot because thegrass they ate was radioactive, <strong>and</strong> their cats <strong>and</strong> dogspoisoned with radioactivity.In 2003, Ukraine officials downgraded the area ina 27-square kilometer (17-square mile) radius from thereactor to a “zone with high risk” to allow those willingto accept the health risk to return home.The accident exposed more than half a million peopleto dangerous levels of radioactivity <strong>and</strong> has causedseveral thous<strong>and</strong> cases of thyroid cancer. The total costof the accident is at least $140 billion according to theU.S. Department of Energy <strong>and</strong> could eventually reachat least $358 billion according to Ukrainian officials—many times more than the value of all nuclear electricityever generated in the former Soviet Union.Chernobyl taught us that a major nuclear accidentanywhere has effects that reverberate throughout much ofthe world.Figure 17-1 Major events leading tothe Chernobyl nuclear power plantaccident on April 26, 1986, in the formerSoviet Union. The accident happenedbecause engineers turned offmost of the reactor’s automatic safety<strong>and</strong> warning systems to keep themfrom interfering with an unauthorizedsafety experiment. Also, the safetydesign of the reactor was inadequate(there was no secondary containmentshell, as in Western-style reactors),<strong>and</strong> a design flaw led to unstable operationat low power. After the reactorexploded, crews exposed themselvesto lethal levels of radiation to put outfires <strong>and</strong> encase the shattered reactorin a hastily constructed concretetomb. This 19-story tomb is crumbling<strong>and</strong> leaking radioactive materials intothe surrounding area. In 2003, theEuropean Bank of Reconstruction <strong>and</strong>Development provided $85 million tomake emergency repairs to the tomb<strong>and</strong> will provide an additional $750million to build a new protective shieldaround the damaged reactor.2 Almost all control rodswere removed from thecore during experiment.1 Emergency coolingsystem was turnedoff to conduct anexperiment.Radiation shieldsCoolingpondCrane formoving fuel rodsReactor5 Reactor power output was lowered toomuch, making it too difficult to control.Steamgenerator3 Automatic safety devicesthat shut down the reactorwhen water <strong>and</strong> steam levelsfall below normal <strong>and</strong> turbinestops were shut off becauseengineers didn’t want systemsto “spoil” experiment.TurbinesWaterpumps4 Additional water pump to cool reactorwas turned on. But with low power output<strong>and</strong> extra drain on system, water didn’tactually reach reactor.
Typical citizens of advanced industrialized nations eachconsume as much energy in six months as typical citizens indeveloping countries consume during their entire life.MAURICE STRONGThis chapter evaluates fossil fuel <strong>and</strong> nuclear powerenergy resources. It addresses the following questions:■■■■■How should we evaluate energy alternatives?What are the advantages <strong>and</strong> disadvantages ofconventional <strong>and</strong> nonconventional oil?What are the advantages <strong>and</strong> disadvantages ofnatural gas?What are the advantages <strong>and</strong> disadvantages of coal<strong>and</strong> converting coal to gaseous <strong>and</strong> liquid fuels?What are the advantages <strong>and</strong> disadvantages ofconventional nuclear fission, breeder nuclear fission,<strong>and</strong> nuclear fusion?17-1 EVALUATING ENERGYRESOURCESWhat Types of Energy Do We Use?Supplementing Free Solar CapitalAbout 99% of the energy that heats the earth <strong>and</strong> ourhomes comes from the sun, <strong>and</strong> the remaining 1%comes mostly from burning fossil fuels.Some 99% of the energy that heats the earth <strong>and</strong> all ofour buildings comes directly from the sun at no cost tous. Without this essentially inexhaustible solar energy(solar capital), the earth’s average temperature wouldbe 240°C (400°F), <strong>and</strong> life as we know it would notexist.Solar energy comes from the nuclear fusion of hydrogenatoms that make up the sun’s mass. Thus life onearth is made possible by a gigantic nuclear fusion reactorsafely located in space about 150 million kilometers (93 millionmiles) away.This direct input of solar energy also producesseveral other indirect forms of renewable solar energy.Examples are wind, falling <strong>and</strong> flowing water (hydropower),<strong>and</strong> biomass (solar energy converted tochemical energy stored in chemical bonds of organiccompounds in trees <strong>and</strong> other plants).Commercial energy sold in the marketplace makesup the remaining 1% of the energy we use. Most commercialenergy comes from extracting <strong>and</strong> burningnonrenewable mineral resources obtained from the earth’scrust, primarily carbon-containing fossil fuels—oil,natural gas, <strong>and</strong> coal—as shown in Figure 17-2.What Types of Commercial Energy Does theWorld Depend On? The Fossil Fuel EraAbout 78% of the commercial energy used worldwidecomes from nonrenewable fossil fuels.About 84% of the commercial energy consumed in theworld comes from nonrenewable energy resources (78%from fossil fuels <strong>and</strong> 6% from nuclear power; Figure17-3, left, p. 352). The remaining 16% comes fromrenewable energy resources—biomass (10%), hydropower(5%), <strong>and</strong> a combination of geothermal, wind,<strong>and</strong> solar energy (1%).Oil drillingplatformon legsFloating oil drillingplatformGas wellImpervious rockOil <strong>and</strong> Natural GasOil storagePipelineOil wellValvesPumpCoalMined coalUndergroundcoal mineContourstrip miningArea stripminingGeothermal EnergyHot waterstorageGeothermalpower plantDrillingtowerWater is heated<strong>and</strong> brought upas dry steam orwet steamPipelineWaterpenetratesdownthroughtherockNatural gasOilCoal seamHot rockWaterWaterMagmaFigure 17-2 Natural capital: important nonrenewable energy resources that can be removed from theearth’s crust are coal, oil, natural gas, <strong>and</strong> some forms of geothermal energy. Nonrenewable uranium oreis also extracted from the earth’s crust <strong>and</strong> then processed to increase its concentration of uranium-235,which can be used as a fuel in nuclear reactors to produce electricity.http://biology.brookscole.com/miller14351
Nuclear power6%Hydropower, geothermal,solar, wind6%Nuclear power8%Hydropowergeothermal,,solar, wind3%NONRENEWABLE 84%Coal23%Naturalgas22%Oil33%Biomass10%RENEWABLE 16%Coal23%NONRENEWABLE 94%Naturalgas24%Oil39%6%RENEWABLEBiomass3%WorldUnited StatesFigure 17-3 Commercial energy use by source for the world (left) <strong>and</strong> the United States (right) in 2002.Commercial energy amounts to only 1% of the energy used in the world; the other 99% is direct solar energyreceived from the sun <strong>and</strong> is not sold in the marketplace. (U.S. Department of Energy, British Petroleum,Worldwatch Institute, <strong>and</strong> International Energy Agency)Figure 17-4 shows the global consumption of energyby fuel type between 1970 <strong>and</strong> 2003, with projectionsto 2020. Note that oil predominates, followed bynatural gas.Roughly half the world’s people in developingcountries burn wood <strong>and</strong> charcoal to heat theirdwellings <strong>and</strong> cook their food. This biomass energy isrenewable as long as wood supplies are not harvestedfaster than they are replenished. Most of this biomassis collected by users <strong>and</strong> not sold in the marketplace.Energy consumption (quadrillion Btus)25020015010050019701980History1990YearProjections200320102020OilNatural gasCoalNuclearNonhydrorenewableRenewablehydroFigure 17-4 Global energy consumption by fuel type,1970–2003, with projections to 2020. (A Btu is a British thermalunit, a st<strong>and</strong>ard measure of heat for value comparison of variousfuels.) (Data from U.S. Department of Energy, AnnualEnergy Review, 2003 <strong>and</strong> 2004)Thus the actual percentage of renewable biomass energyused in the world is higher than the 10% figureshown in Figure 17-3 (left).Bad news. Many people in developing countriesface a fuelwood shortage that is expected to get worsebecause of unsustainable harvesting of fuelwood.Also, people die prematurely from breathing particlesemitted by burning wood indoors in open fires <strong>and</strong>poorly designed primitive stoves.What Is the Energy Future of the United States?Searching for Fossil Fuel SubstitutesThere is debate over whether U.S. energy policy forthis century should continue its dependence on oil<strong>and</strong> coal or depend more on natural gas, hydrogen,<strong>and</strong> solar cells.The United States is the world’s largest energy user,with the average American consuming as much energyin one day as a person in the poorest countriesconsumes in a year. In 2004, with only 4.6% of the population,the United States used 24% of the world’scommercial energy. In contrast, India, with 16% of theworld’s people, used about 3% of the world’s commercialenergy.About 94% of the commercial energy used in theUnited States comes from nonrenewable energy resources(86% from fossil fuels <strong>and</strong> 8% from nuclearpower; Figure 17-3, right). The remaining 6% comesmostly from renewable biomass <strong>and</strong> hydropower.352 CHAPTER 17 Nonrenewable Energy Resources
Figure 17-5 shows energy consumption by fuel inthe United States from 1970 to 2003, with projections to2020. Note that the main projected trends between2003 <strong>and</strong> 2020 are increased use of oil <strong>and</strong> natural gas<strong>and</strong> a leveling off of coal use.An important environmental, economic, <strong>and</strong> politicalissue is what energy resources the United Statesmight be using by 2050 <strong>and</strong> 2100. Figure 17-6 showsshifts in use of various commercial sources of energyin the United States since 1800 <strong>and</strong> one scenario projectingchanges to a solar–hydrogen energy age by2100. According to the U.S. Department of Energy <strong>and</strong>the <strong>Environmental</strong> Protection Agency, burning fossilfuels causes more than 80% of U.S. air pollution <strong>and</strong>80% of U.S. carbon dioxide emissions. For many energyexperts the need to use cleaner <strong>and</strong> less climatedisrupting(noncarbon) energy resources—not thedepletion of fossil fuels—is the driving force behindthe projected transition to a solar–hydrogen energyage in the United States <strong>and</strong> in other parts of the worldbefore the end of this century.Whether the shift shown in Figure 17-6, or someother scenario, occurs depends primarily on energy resourcesthe U.S. government decides to promote by useof subsidies <strong>and</strong> tax breaks. If we want energy alternativessuch as solar energy <strong>and</strong> hydrogen to becomemain dishes instead of side orders on our energymenu, they must be nurtured by subsidies <strong>and</strong> taxbreaks.A political problem is that the fossil fuel <strong>and</strong>nuclear power industries that have been receivinggovernment subsidies for over 50 years underst<strong>and</strong>ablydo not want to give them up. And they use theirconsiderable political power to keep them, eventhough they are mature industries that do not needsuch nurturing.Thus the energy path of the United States (or anycountry) is primarily a political decision made by governmentofficials with pressure from officials of energycompanies <strong>and</strong> from citizens. As a citizen, you canEnergy consumption (quadrillion Btus)60504030201019701980History1990YearProjectionsOilNatural gasCoalNuclearNonhydrorenewableRenewable hydro200320102020Figure 17-5 Energy consumption by fuel in the United States,1970–2003, with projections to 2020. (U.S. Department of Energy,Annual Energy Review, 2003 <strong>and</strong> 2004)Contribution to total energyconsumption (percent)1008060402001800Wood1875Coalplay an important role in helping decide the energyfuture for yourself <strong>and</strong> future generations. Indeed, it isone of the most important political acts you can undertake.This explains why you should have an underst<strong>and</strong>ingof the advantages <strong>and</strong> disadvantages of ourmajor energy options, as discussed in this chapter <strong>and</strong>the one that follows.How Can We Decide Which EnergyResources to Use? Evaluating AlternativeResourcesWe need to answer several questions in decidingwhich energy resources to promote.Energy policies must be developed with the future inmind because experience shows that it usually takes atleast 50 years <strong>and</strong> huge investments to phase in newenergy alternatives to the point where they provide10–20% of total energy use. Making projections such asthose in Figure 17-6 <strong>and</strong> converting them into energypolicy involves answering the following questions foreach alternative:■ How much of the energy resource is likely to beavailable in the near future (the next 15–25 years) <strong>and</strong>the long term (the next 25–50 years)?■ What is the net energy yield for the resource?■ How much will it cost to develop, phase in, <strong>and</strong>use the resource?■ What government research <strong>and</strong> development subsidies<strong>and</strong> tax breaks will be used to help develop theresource?■ How will dependence on the resource affectnational <strong>and</strong> global economic <strong>and</strong> military security?■ How vulnerable is the resource to terrorism?OilNuclearNatural gas?HydrogenSolar1950 2025 2100YearFigure 17-6 Shifts in the use of commercial energy resourcesin the United States since 1800, with projected changes to2100. Shifts from wood to coal <strong>and</strong> then from coal to oil <strong>and</strong>natural gas have each taken about 50 years. The projectedshift to 2100 is only one of many possible scenarios that dependon a variety of assumptions. (U.S. Department ofEnergy)http://biology.brookscole.com/miller14353
■ How will extracting, transporting, <strong>and</strong> using theresource affect the environment, human health, <strong>and</strong>the earth’s climate? Should these harmful costs be includedin the market price of the resource through acombination of taxes <strong>and</strong> phasing out environmentallyharmful subsidies (full-cost pricing)?What Is Net Energy? The Only EnergyThat Really CountsNet energy is the amount of high-quality usableenergy available from a resource after subtractingthe energy needed to make it available for use.It takes energy to get energy. For example, before oil isuseful to us it must be found, pumped from beneaththe ground or ocean floor, transferred to a refinery <strong>and</strong>converted to useful fuels (such as gasoline, diesel fuel,<strong>and</strong> heating oil), transported to users, <strong>and</strong> burned infurnaces <strong>and</strong> cars. Each step uses high-quality energy.The second law of thermodynamics tells us that someof it will always be wasted <strong>and</strong> degraded to lowerqualityenergy.The usable amount of high-quality energy availablefrom a given quantity of a resource is its net energy. Itis the total amount of energy available from the resourceminus the energy needed to find, extract, process,<strong>and</strong> get it to consumers. It is calculated byestimating the total energy available from the resourceover its lifetime minus the amount of energy used (thefirst law of thermodynamics), automatically wasted (thesecond law of thermodynamics), <strong>and</strong> unnecessarilywasted in finding, processing, concentrating, <strong>and</strong> transportingthe useful energy to users.Net energy is like your net spendable income—your wages minus taxes <strong>and</strong> job-related expenses. Forexample, suppose that for every 10 units of energy inoil in the ground we have to use <strong>and</strong> waste 8 units ofenergy to find, extract, process, <strong>and</strong> transport the oil tousers. Then we have only 2 units of useful energy availablefrom every 10 units of energy in the oil.We can express net energy as the ratio of usefulenergy produced to the useful energy used to produceit. In the example just given, the net energy ratio wouldbe 10/8, or 1.25. The higher the ratio, the greater thenet energy. When the ratio is less than 1, there is a netenergy loss.Figure 17-7 shows estimated net energy ratios forvarious types of space heating, high-temperature heatfor industrial processes, <strong>and</strong> transportation. In termsof net energy, how do the energy resources used toheat your home <strong>and</strong> propel your car (if you have one)stack up compared to other alternatives?Space HeatingPassive solarNatural gasOilActive solarCoal gasificationElectric resistance heating (coal-fired plant)Electric resistance heating(natural-gas-fired plant)Electric resistance heating (nuclear plant)1.91.50.40.40.35.84.94.5High-Temperature Industrial HeatSurface-mined coalUnderground-mined coalNatural gasOilCoal gasificationDirect solar (highly concentrated by mirrors,heliostats, or other devices)1.50.94.94.728.225.8TransportationNatural gasGasoline (refined crude oil)Biofuel (ethyl alcohol)Coal liquefactionOil shale1.91.41.24.94.1Figure 17-7 Net energy ratios for various energy systems over their estimated lifetimes. The higher the net energyratio, the greater the net energy available. (U.S. Department of Energy <strong>and</strong> Colorado Energy Research Institute,Net Energy Analysis, 1976; <strong>and</strong> Howard T. Odum <strong>and</strong> Elisabeth C. Odum, Energy Basis for Man <strong>and</strong>Nature, 3rd ed., New York: McGraw-Hill, 1981)354 CHAPTER 17 Nonrenewable Energy Resources
Currently, oil has a high net energy ratio becausemuch of it comes from large, accessible, <strong>and</strong> cheap-toextractdeposits such as those in the Middle East. Whenthose are depleted, the net energy ratio of oil will decline<strong>and</strong> prices will rise.Conventional nuclear energy has a low net energyratio because of the large amounts of energy needed tomake it available. We have to extract <strong>and</strong> processuranium ore, convert it into nuclear fuel, build <strong>and</strong> operatenuclear power plants, dismantle the highly radioactiveplants after their 15–60 years of useful life,<strong>and</strong> store the resulting highly radioactive wastessafely for 10,000–240,000 years depending on the typesof radioisotopes they contain. Each of these steps inwhat is called the nuclear fuel cycle uses energy <strong>and</strong>costs money. Some analysts estimate that ultimatelythe conventional nuclear fuel cycle will lead to a netenergy loss; we will have to put more energy into itthan we will ever get out of it.17-2 OILWhat Is Crude Oil, <strong>and</strong> How Is It Extracted<strong>and</strong> Processed? Gooey Stuff to Which We AreAddictedCrude oil is a thick liquid containing hydrocarbonsthat we extract from underground deposits <strong>and</strong>separate into products such as gasoline, heating oil,<strong>and</strong> asphalt.Petroleum, or crude oil (oil as it comes out of theground), is a thick <strong>and</strong> gooey liquid consisting of hundredsof combustible hydrocarbons along with smallamounts of sulfur, oxygen, <strong>and</strong> nitrogen impurities.We have oil today because of a series of three lucky geologicalevents taking place over millions of years. Thefirst event occurred when sediments buried dead organicmaterial raining down onto seafloors faster thanit could decay. The next event took place eons laterwhen the seafloor sediments ended up with the rightdepth for pressure <strong>and</strong> heat to slowly “cook” or convertthe buried organic material into oil. The third geologicalbreak came about because the oil was able tocollect in porous limestone or s<strong>and</strong>stone rock coveredby an impermeable cap of shale or silt to keep it fromescaping (Figure 17-2) <strong>and</strong> thus making it <strong>and</strong> otherfossil fuels part of the carbon cycle (Figure 4-29, p. 78).Any change in this fortunate chain of eventswould have meant no oil, which provides about athird of the energy we use today to heat our homes<strong>and</strong> other buildings <strong>and</strong> to run our motor vehicles. Oil<strong>and</strong> its chemical cousin natural gas also provide uswith food grown with the help of hydrocarbon-basedfertilizers <strong>and</strong> pesticides. This type of oil is also knownas conventional oil or light oil.Today’s global oil industry is a marvel of technology<strong>and</strong> management skills. Satellites help findpromising oil deposits. Sophisticated computers <strong>and</strong>software programs analyze seismic data to create 3-Dimages of the earth’s interior. High-tech equipmentcan drill oil <strong>and</strong> natural gas wells to a depth of almost6 kilometers (4 miles). Drilling platforms on the highseas are engineering marvels that can withst<strong>and</strong> majorhurricanes. The incredibly complex process of managing<strong>and</strong> coordinating the discovery, production,marketing, <strong>and</strong> distribution of oil throughout theworld to billions of users is an amazing process.Deposits of crude oil <strong>and</strong> natural gas often aretrapped together under a dome deep within the earth’scrust on l<strong>and</strong> or under the seafloor (Figure 17-2). Thecrude oil is dispersed in pores <strong>and</strong> cracks in undergroundrock formations, somewhat like water saturatinga sponge. To extract the oil, a well is drilled into thedeposit. Then oil drawn by gravity out of the rock pores<strong>and</strong> into the bottom of the well is pumped to the surface.On average, producers get only about 35–50% ofthe oil out of an oil deposit—although some believethat improved drilling technology may increase the recoveryrate to 75%. The remaining heavy crude oil is toodifficult or expensive to recover. As oil prices rise, it canbecome economical to remove about 10–25% of this remainingheavy oil by flushing the well with steam <strong>and</strong>water. But this lowers the net energy yield for the recoveredoil.Drilling for oil causes only moderate damage tothe earth’s l<strong>and</strong> because the wells occupy fairly littlel<strong>and</strong> area. But drilling for oil <strong>and</strong> transporting itaround the world results in oil spills on l<strong>and</strong> <strong>and</strong> inaquatic systems. In addition, harmful environmentaleffects are associated with the extraction, processing,<strong>and</strong> use of any nonrenewable resource from the earth’scrust (Figure 16-13, p. 343).According to oil producers, improved extractiontechnologies can increase oil production without seriousdamage to environmentally sensitive areas. Onemethod allows oil <strong>and</strong> natural gas producers to drilldeeper in most locations. In addition, oil producerscan now use one drilling rig (derrick) on a pad to drillseveral gas or oil pockets at the same time. Anothernew technology allows oil or gas extraction from distancesas far away as 8 kilometers (5 miles) by drillingat angles (slant drilling).After it is extracted, crude oil is transported to a refineryby pipeline, truck, or ship (oil tanker). There it isheated <strong>and</strong> distilled in gigantic columns to separate itinto components with different boiling points (Figure17-8, p. 356)—another technological marvel basedon complex chemistry <strong>and</strong> chemical engineering.However, refining oil decreases its net energy yield. Inthe United States, for example, petroleum refining accountsfor about 8% of all U.S. energy consumption.http://biology.brookscole.com/miller14355
FurnaceHeatedcrude oilGasesGasolineAviation fuelHeating oilDiesel oilNaphthaGrease<strong>and</strong> waxAsphaltHSRFOODSThe 11 countries that make up the Organization ofPetroleum Exporting Countries (OPEC) have 78% ofthe world’s estimated crude oil reserves. This explainswhy OPEC is expected to have long-term control overthe supplies <strong>and</strong> prices of the world’s conventional oil.Today OPEC’s members are Algeria, Indonesia, Iran,Iraq, Kuwait, Libya, Nigeria, Qatar, Saudi Arabia,United Arab Emirates, <strong>and</strong> Venezuela.Saudi Arabia, with 25%, has by far the largest proportionof the world’s proven crude oil reserves, followedby Canada (15%)—because its huge supply ofoil s<strong>and</strong> was recently classified as a conventionalsource of oil. Other countries with large proven reservesare Iraq (11%), the United Arab Emirates (9.3%),Kuwait (9.2%), <strong>and</strong> Iran (8.6%).Most analysts say it is only a matter of time beforethe Middle Eastern share of global oil production increasesfrom its current 30% to at least 50%. This is whythe world’s other nations have such vital economic<strong>and</strong> military security interests in helping preserve politicalstability in the often-volatile Middle East.Here is the problem in a nutshell. Oil is the mostwidely used energy resource in the world <strong>and</strong> in theUnited States. Some call the people in developed countriesoilaholics, <strong>and</strong> the world’s largest suppliers tothem are Canada, Saudi Arabia, <strong>and</strong> several otherPersian Gulf Middle Eastern countries. To some theworld economy is built largely on how long SaudiaArabia’s House of Saud rulers can continue. There isalso concern that terrorist assaults on a few key partsof the country’s oil system could put the Saudis out ofthe oil business for up to 2 years <strong>and</strong> create global economicchaos.Figure 17-8 Refining crude oil. Based on their boiling points,components are removed at various levels in a giant distillationcolumn. The most volatile components with the lowest boilingpoints are removed at the top of the column.Some products of oil distillation, called petrochemicals,are used as raw materials in manufacturingpesticides, plastics, synthetic fibers, paints, medicines,<strong>and</strong> many other products. Look at your clothes <strong>and</strong>other items around you <strong>and</strong> try to figure out howmany of these things were made from chemicals producedby distilling oil.Who Has the World’s Oil Supplies?OPEC RulesEleven OPEC countries—most of them in the MiddleEast—have 78% of the world’s proven oil reserves<strong>and</strong> most of the world’s unproven reserves.The oil industry is the world’s largest business. Thuscontrol of current <strong>and</strong> future oil reserves is the singlegreatest source of global economic <strong>and</strong> political power.Case Study: How Much Oil Does the UnitedStates Have? Rapidly Dwindling SuppliesThe United States—the world’s largest oil user—hasonly 2.9% of the world’s proven oil reserves <strong>and</strong> onlya small percentage of its unproven reserves.Figure 17-9 shows the locations of the major knowndeposits of fossil fuels in the United States <strong>and</strong> Canada<strong>and</strong> ocean areas where more crude oil <strong>and</strong> natural gasmight be found. About one-fourth of U.S. domestic oilproduction comes from offshore drilling (mostly offthe coasts of Texas <strong>and</strong> Louisiana, Figure 17-10) <strong>and</strong>17% from Alaska’s North Slope.The United States has only 2.9% of the world’s oilreserves. But it uses about 26% of the crude oil extractedworldwide each year (over two-thirds of thatfor transportation), mostly because oil is an abundant,convenient, <strong>and</strong> cheap fuel (Figure 17-11, p. 358). Despitean upsurge in exploration <strong>and</strong> test drilling, U.S.oil extraction has declined since 1985, <strong>and</strong> most geologistsdo not expect a significant increase in domesticsupplies (Figure 17-12, p. 358). And the United Statesproduces most of its dwindling supply of oil at a high356 CHAPTER 17 Nonrenewable Energy Resources
ArcticOceanCoalPrince WilliamSoundGulf ofAlaskaALASKATrans Alaskaoil pipelineValdezPrudhoe BayArctic NationalWildlife RefugeBeaufortSeaGasOilHigh potentialareasCANADACANADAPacificOceanUNITEDUNITEDSTATESGr<strong>and</strong>BanksSTATESAtlanticOceanMEXICOMEXICOFigure 17-9 Natural capital: locations of the major known deposits of oil, natural gas, <strong>and</strong> coal in NorthAmerica <strong>and</strong> offshore areas where more crude oil <strong>and</strong> natural gas might be found. Geologists do not expectto find very much new oil <strong>and</strong> natural gas in North America. (Council on <strong>Environmental</strong> Quality <strong>and</strong>U.S. Geological Survey)LOUISIANA ALABAMAMISSISSIPPIGEORGIATEXASFLORIDAGULF OF MEXICOActive drilling sitesFigure 17-10 Offshore drilling for oil accounts for about one-fourth ofU.S. oil production. About nine of every ten barrels of this oil comesfrom the Gulf of Mexico, where there are 4,000 oil drilling platforms<strong>and</strong> 53,000 kilometers (33,000 miles) of underwater pipeline. (U.S.Geological Survey)http://biology.brookscole.com/miller14357
Oil price per barrel ($)7060504030201001950Oil(1997 dollars)196019701980Year199020002010tions). Reasons for this high dependence on importedoil are declining domestic oil reserves, higher productioncosts for domestic oil than for most oil imports,<strong>and</strong> increased oil use. According to the Department ofEnergy (DOE), the United States could be importing64–70% of the oil it uses by 2020 (Figure 17-12).In 1970, a bushel of wheat could be traded for abarrel of oil. Now it takes 9 bushels of wheat to buy abarrel of oil. In 2003, grain exports paid for only 11% ofthe U.S. oil import bill of $99 billion.Some analysts contend that depending on oil importsis not necessarily bad. They argue that using uplimited <strong>and</strong> declining domestic oil supplies is a drain-America-first policy that will increase future dependenceon foreign oil supplies. What do you think?Figure 17-11 Inflation-adjusted price of oil, 1950–2003. Whenadjusted for inflation, oil costs about the same as it did in 1975.Although low oil prices have stimulated economic growth, theyhave discouraged improvements in energy efficiency <strong>and</strong> useof renewable energy resources. (U.S. Department of Energy<strong>and</strong> Department of Commerce)Oil (million barrels per day)30252015OilHistoryConsumptionProjectionsNetimports10Domestic5supply01970 1980 1990 2000 2010 2020YearFigure 17-12 U.S. petroleum supply, consumption, <strong>and</strong> imports,1970–2003, with projections to 2020. During 2003, theUnited States imported most of its oil from four nations in the followingorder of importance: the non-OPEC nations of Canada<strong>and</strong> Mexico <strong>and</strong> the OPEC nations of Venezuela <strong>and</strong> Saudi Arabia.In the not-too-distant future, the Department of Energy projectsthat the U.S. will have to depend more on the Middle Eastfor oil, because it contains by far most of the world’s discovered<strong>and</strong> undiscovered oil. (U.S. Department of Energy, AnnualEnergy Review, 2003 <strong>and</strong> 2004)cost of $7.50–$10 per barrel compared to about $2.50 inSaudi Arabia.Bottom line: If you think of U.S. oil reserves as asix-pack of oil, four of the cans are empty. Geologistsestimate that if the country opens up virtually all of itspublic l<strong>and</strong>s <strong>and</strong> coastal regions to oil exploration, itmay find at best about half a can of new oil at a higheconomic <strong>and</strong> environmental cost.In 2003, the United States imported about 55% ofthe oil it used (up from 36% in 1973 when OPEC imposedan oil embargo against the U.S. <strong>and</strong> other na-How Long Will Conventional Oil SuppliesLast? The End of the Oil Era May Be in SightKnown <strong>and</strong> projected global oil reserves shouldlast for 42–93 years <strong>and</strong> U.S. reserves for10–48 years depending on how rapidly weuse oil.Production of the world’s estimated oil reserves is expectedto peak between a little before 2010 <strong>and</strong> 2030,<strong>and</strong> production of estimated U.S. reserves peaked in1975.We are not yet running out of oil. But once oilproduction peaks, we will begin sliding down thebell-shaped oil production curve of a nonrenewableresource (Figure 1-8, p. 11) from 50% depletion toward80% depletion, when it costs too much to extract whatis left. At some point during this slide, we will shiftfrom an abundant supply of cheap oil (Figure 17-11) toa dwindling supply of increasingly expensive oil.According to geologists, known <strong>and</strong> projectedglobal reserves of oil are expected to be 80% depletedwithin 42–93 years <strong>and</strong> U.S. reserves in 10–48 years dependingon how rapidly we use oil. If these estimatesare correct, oil should be reaching its sunset yearssometime this century. Appendix 5 (p. A12) summarizesmilestones in the Age of Oil.Can We Meet the World’s GrowingDem<strong>and</strong> for Oil? Rapid ExponentialGrowth Is a Hungry BeastJust to keep using conventional oil at the currentrate, we must discover global oil reservesequivalent to a new Saudi Arabian supply every10 years.Even if much more oil is somehow found, we are ignoringthe consequences of the high (1–5% per year)exponential growth in oil consumption in the world,especially in developing countries (Figure 17-13). It ishard to get a grip on the incredible amount of oil we358 CHAPTER 17 Nonrenewable Energy Resources
Oil (million barrels per day)12010080604020OilTotalHistoryDevelopedDevelopingYearProjections01970 1980 1990 2000 20102020Figure 17-13 Oil consumption globally <strong>and</strong> in developed<strong>and</strong> developing regions, 1970–2003, with projections to 2020.In order, the world’s three largest consumers of oil are theUnited States, China, <strong>and</strong> Japan—all with limited domestic oilsupplies. China imports about a third of its oil <strong>and</strong> could be importing50% by 2010. (U.S. Department of Energy, Annual EnergyReview, 2003 <strong>and</strong> 2004)consume. Maybe this will help. Stretched end to end, thenumber of barrels of oil the world used in 2004 would wraparound the earth’s equator 636 times, <strong>and</strong> projected oil usein 2020 would circle the equator 913 times!Suppose we continue to use oil at the current ratewith no increase in oil consumption—a highly unlikelyassumption. Even under this conservative nogrowthestimate:■ Saudi Arabia, with the world’s largest crude oil reserves,could supply world oil needs for about 10 years.■ The estimated reserves under Alaska’s NorthSlope—the largest ever found in North America—would meet current world dem<strong>and</strong> for only 6 monthsor U.S. dem<strong>and</strong> for 3 years.■ The estimated reserves in Alaska’s Arctic NationalWildlife Refuge would meet the world’s current oildem<strong>and</strong> for only 1–5 months or U.S. oil dem<strong>and</strong> for7–24 months (see the Case Study, at right).Thus for the world just to keep using conventionaloil at the current rate, we must discover reserves equivalentto a new Saudi Arabian supply every 10 years.According to most geologists, this is highly unlikely.And many developing countries such as China<strong>and</strong> India are rapidly exp<strong>and</strong>ing their use of oil. By2005 China could be using as much oil as the UnitedStates <strong>and</strong> the two countries would be competing toimport dwindling supplies of increasingly expensiveoil. Indeed, if everyone in the world consumed asmuch oil as the average American, the world’s provenoil reserves would be gone in a decade. Exponentialgrowth is an incredibly powerful force.Case Study: Should Oil <strong>and</strong> Gas DevelopmentBe Allowed in the Arctic National WildlifeRefuge? To Drill or Not to DrillThere is controversy between oil companies <strong>and</strong>environmentalists over whether to drill for oil <strong>and</strong>natural gas in Alaska’s Arctic National WildlifeRefuge.The Arctic National Wildlife Refuge (ANWR) onAlaska’s North Slope (Figure 17-9) contains more thanone-fifth of all l<strong>and</strong> in the U.S. National WildlifeRefuge System. The refuge’s coastal plain is the onlystretch of Alaska’s arctic coastline not open to oil <strong>and</strong>gas development.This tundra biome is home to a diverse communityof species, including polar bears, arctic foxes,musk oxen, <strong>and</strong> peregrine falcons. During the briefarctic summer it serves as a nesting ground for millionsof tundra swans, snow geese <strong>and</strong> other migratorybirds, <strong>and</strong> as a calving ground for a herd of about130,000 caribou. Partly because of its harsh climate,this is an extremely fragile ecosystem.Since 1980, U.S. oil companies have been lobbyingCongress for permission to carry out exploratorydrilling in the coastal plain because they believe itmight contain oil <strong>and</strong> natural gas deposits. Alaska’selected representatives in Congress strongly supportsuch drilling because the state uses revenue from oilproduction to finance most of its budget <strong>and</strong> to provideannual dividends to citizens. <strong>Environmental</strong>ists<strong>and</strong> conservationist strongly oppose drilling in thisarea. These polarized positions are summarized inFigure 17-14 (p. 360). Study this figure carefully.According to drilling opponents, the potential ecologicalrisks are not worth the estimated one-in-fivechance of finding enough oil to meet all of the country’sneeds for only 7–24 months. They point out that improvingmotor vehicle fuel efficiency is a much faster,cheaper, cleaner, <strong>and</strong> more secure way to increase futureoil supplies. For example, improving fuel efficiencyby just 0.4 kilometer per liter (1 mile per gallon)for new cars, SUVs, <strong>and</strong> light trucks in the UnitedStates would save more oil than is ever likely to be producedfrom the ANWR. In addition, it would becheaper for the United States to join with Canada inbuilding a pipeline to import some of its potentiallyabundant oil produced from its oil s<strong>and</strong>s.In their efforts to either use or protect ANWR, bothsides have probably exaggerated their positions. Butthis issue is symbolic of the fundamental clash betweenpeople with different environmental world views.xHOW WOULD YOU VOTE? Do you support opening upAlaska’s Arctic National Wildlife Refuge to oil development?Cast your vote online at http://biology.brookscole.com/miller14.http://biology.brookscole.com/miller14359
AdvantagesTrade-OffsDrilling for Oil <strong>and</strong> Natural Gasin Alaska’s ArcticNational Wildlife RefugeDisadvantagesWhat Are the Major Advantages <strong>and</strong>Disadvantages of Conventional Oil?A Difficult ChoiceConventional oil is versatile fuel <strong>and</strong> reserves canlast for at least 50 years, but burning it produces airpollution <strong>and</strong> releases the greenhouse gas carbondioxide.Figure 17-15 lists the advantages <strong>and</strong> disadvantages ofusing conventional crude oil as an energy resource. Aserious problem is that burning oil or any carbon-containingfossil fuel releases CO 2 into the atmosphere<strong>and</strong> thus can help promote climate change throughglobal warming. Currently, burning oil mostly as gasoline<strong>and</strong> diesel fuel for transportation accounts forabout 43% of global CO 2 emissions. Figure 17-16 comparesthe relative amounts of CO 2 emitted per unit ofenergy by the major fossil fuels <strong>and</strong> nuclear power.In 1999 Mike Bowling, CEO of ARCO Oil, said,“We are embarked on the beginning of the last days ofthe Age of Oil.” He went on to discuss the need for theworld to shift from a carbon-based to a hydrogen-basedenergy economy during this century (Figure 17-6).Could increase U.S.oil <strong>and</strong> natural gassuppliesCould reduce oilimports slightlyWould bring jobs<strong>and</strong> oil revenue toAlaskaOnly 19% chance offinding oil equal towhat U.S. consumesin 7–24 monthsToo little potential oilto significantlyreduce oil importsCosts too high <strong>and</strong>potential oil supplytoo little to lowerenergy pricesHow Useful Are Heavy Oils from Oil S<strong>and</strong><strong>and</strong> Oil Shale? Can Heavier Substitutes Savethe Day?Heavy oils from oil s<strong>and</strong> <strong>and</strong> oil shale couldsupplement conventional oil, but there areenvironmental problems.Oil s<strong>and</strong>, or tar s<strong>and</strong>, is a mixture of clay, s<strong>and</strong>, water,<strong>and</strong> a combustible organic material called bitumen—aMay lower oilprices slightlyOil companies havedeveloped Alaskanoil fields withoutsignificantenvironmentalharmNew drillingtechniques willleave littleenvironmentalimpactStudies showconsiderable oilspills <strong>and</strong> otherenvironmentaldamage fromAlaskan oil fieldsPotentialdegradation ofrefuge not worth theriskUnnecessary ifimproved slantdrilling allows oil tobe drilled fromoutside the refugeFigure 17-14 Trade-offs: advantages <strong>and</strong> disadvantages ofdrilling for oil <strong>and</strong> natural gas in Alaska’s Arctic National WildlifeRefuge (ANWR). Pick the single advantage <strong>and</strong> disadvantagethat you think are the most important.AdvantagesAmple supply for42–93 yearsLow cost (withhuge subsidies)High netenergy yieldEasilytransportedwithin <strong>and</strong>betweencountriesLow l<strong>and</strong> useTechnology iswell developedEfficient distributionsystemT rade-OffsConventional OilDisadvantagesNeed to findsubstitute within50 yearsArtificially lowprice encourageswaste <strong>and</strong>discouragessearch foralternativesAir pollutionwhen burnedReleases CO 2when burnedModerate waterpollutionFigure 17-15 Trade-offs: advantages <strong>and</strong> disadvantages ofusing conventional crude oil as an energy resource. Pick thesingle advantage <strong>and</strong> disadvantage that you think are the mostimportant.360 CHAPTER 17 Nonrenewable Energy Resources
Coal-firedelectricitySynthetic oil <strong>and</strong>gas producedfrom coalCoalOil s<strong>and</strong>OilNatural gasNuclear power17%58%100%92%86%150%Figure 17-16 CO 2 emissions per unit of energy producedby various fuels, expressed as percentages of emissionsproduced by burning coal directly. (Data from U.S.Department of Energy)286%thick <strong>and</strong> sticky heavy oil with a high sulfur content<strong>and</strong> that smells like asphalt. It was created when conventionaloil escaping from its birthplace was degradedinto tar by bacteria <strong>and</strong> groundwater.Oil s<strong>and</strong>s nearest the surface are dug up in whatlooks like a war zone by gigantic electric shovels <strong>and</strong>loaded into house-sized trucks that carry them to upgradingplants. There they are mixed with hot water<strong>and</strong> steam to extract the bitumen, which is heated inhuge cookers to convert it into a low-sulfur syntheticcrude oil suitable of refining. Heating the cookers requiresvast amounts of natural gas that reduces the netenergy yield for the oil. Two tons of oil s<strong>and</strong> are stripmined for each barrel of oil <strong>and</strong> 3 barrels of water areneeded to extract each barrel of bitumen.Bitumen in deeper deposits of oil s<strong>and</strong> can be removedby underground processing. This involves usingone well to inject steam into the underground oils<strong>and</strong>s to loosen the bitumen <strong>and</strong> another well to suckthe bitumen out. This leaves the l<strong>and</strong> largely undisturbed<strong>and</strong> eliminates the need for giant tailings pondsto store water, s<strong>and</strong>, <strong>and</strong> clay left over from surfacemining.Northeastern Alberta in Canada has about threefourthsof the world’s oil s<strong>and</strong> reserves, about a tenthof them close enough to the surface to be recovered bysurface or underground mining. Improved technologymay allow extraction of twice that amount.Currently these deposits supply about a fifth ofCanada’s oil needs <strong>and</strong> this proportion is expected toincrease. Because of the dramatic reductions in development<strong>and</strong> production costs, in 2003 the oil industrybegan counting Canada’s oil s<strong>and</strong>s as reserves of conventionaloil. This means that Canada has 15% of theworld’s oil reserves, second only to Saudi Arabia.U.S. Department of EnergyIf a pipeline is built to transfer some of this crudesynthetic crude oil from western Canada to the northwesternUnited States, Canada could greatly reducefuture U.S. dependence on oil imports from the MiddleEast <strong>and</strong> add to its income. Other fairly large depositsof oil s<strong>and</strong>s are in Utah, Venezuela, Colombia,<strong>and</strong> Russia.Bad news. Extracting <strong>and</strong> producing oil s<strong>and</strong>s has asevere impact on the l<strong>and</strong> <strong>and</strong> produces more waterpollution, much more air pollution (especially sulfurdioxide), <strong>and</strong> more CO 2 per unit of energy than conventionalcrude oil. Also, costs are skyrocketing becauseit takes so many highly skilled workers to build<strong>and</strong> operate an oil s<strong>and</strong>s site.Another potential source of oil are deposits of oilshale, which are neither oil nor shale rock. Instead, oilshales are fine-grained sedimentary rocks (Figure 17-17,left) containing a solid combustible mixture of hydrocarbonscalled kerogen. It can be distilled from crushedoil shale rock by heating it in a large container to yieldshale oil (Figure 17-17, right). Before the thick shale oilcan be sent by pipeline to a refinery, it must be heatedto increase its flow rate <strong>and</strong> processed to remove sulfur,nitrogen, <strong>and</strong> other impurities.Estimated potential global supplies of shale oil areabout 240 times larger than estimated global suppliesof conventional oil. But most deposits are of such a lowgrade that with current oil prices <strong>and</strong> technology ittakes more energy <strong>and</strong> money to mine <strong>and</strong> convertkerogen to crude oil than the resulting fuel is worth.Producing <strong>and</strong> using shale oil also has a much higherenvironmental impact than conventional oil.Figure 17-18 (p. 362) lists the advantages <strong>and</strong> disadvantagesof using heavy oil from oil s<strong>and</strong> <strong>and</strong> oilshale as energy resources. Overall, do you believe theadvantages outweigh the disadvantages?Figure 17-17 Natural capital: oil shale rock (left) <strong>and</strong> the shaleoil (right) extracted from it. Big U.S. oil shale projects have beencanceled because of excessive cost.http://biology.brookscole.com/miller14361
AdvantagesModerate cost(oil s<strong>and</strong>)Large potentialsupplies, especiallyoil s<strong>and</strong>s in CanadaEasily transportedwithin <strong>and</strong>betweencountriesEfficientdistributionsystem in placeTechnology is welldevelopedTrade-OffsHeavy Oils from Oil Shale<strong>and</strong> Oil S<strong>and</strong>DisadvantagesHigh cost (oil shale)Low net energyyieldLarge amount ofwater needed forprocessingSevere l<strong>and</strong>disruption fromsurface miningWater pollutionfrom miningresiduesAir pollutionwhen burnedCO 2 emissionswhen burnedFigure 17-18 Trade-offs: advantages <strong>and</strong> disadvantages ofusing heavy oils from oil shale <strong>and</strong> oil s<strong>and</strong> as energy resources.Pick the single advantage <strong>and</strong> disadvantage that youthink are the most important.However, unless a natural gas pipeline has beenbuilt deposits of natural gas found above oil deposits(Figure 17-2) cannot be used. Indeed, the natural gasfound above oil reservoirs in deep sea <strong>and</strong> remote l<strong>and</strong>areas is often viewed as an unwanted byproduct <strong>and</strong> isburned off. This wastes a valuable energy resource <strong>and</strong>releases carbon dioxide into the atmosphere.Unconventional natural gas is found in other undergroundsources. One is methane hydrate, in which smallbubbles of natural gas are trapped in ice crystals deepunder the arctic permafrost <strong>and</strong> beneath deep-oceansediments. Globally the amount of energy in methanehydrates is about twice that in the earth’s oil, naturalgas, <strong>and</strong> coal resources combined.So far it costs too much to get natural gas frommethane hydrates <strong>and</strong> unconventional sources ofnatural gas, but the extraction technology is beingdeveloped rapidly, especially by Japan that has largedeposits off its coast <strong>and</strong> few deposits of conventionaloil <strong>and</strong> natural gas. One problem is that whenmethane hydrate is brought to the surface it warms up<strong>and</strong> releases methane (a greenhouse gas) into theatmosphere.When a natural gas field is tapped, propane <strong>and</strong>butane gases are liquefied <strong>and</strong> removed as liquefiedpetroleum gas (LPG). LPG is stored in pressurizedtanks for use mostly in rural areas not served by naturalgas pipelines. The rest of the gas (mostlymethane) is dried to remove water vapor. Then it iscleansed of poisonous hydrogen sulfide <strong>and</strong> other impurities<strong>and</strong> pumped into pressurized pipelines fordistribution.At a very low temperature natural gas can be convertedto liquefied natural gas (LNG). This highlyflammable liquid can then be shipped to other countriesin refrigerated tanker ships.17-3 NATURAL GASWhat Is Natural Gas? Mostly MethaneNatural gas, consisting mostly of methane, is oftenfound above reservoirs of crude oil.In its underground gaseous state, natural gas is a mixtureof 50–90% by volume of methane (CH 4 ), the simplesthydrocarbon. It also contains smaller amounts ofheavier gaseous hydrocarbons such as ethane (C 2 H 6 ),propane (C 3 H 8 ), <strong>and</strong> butane (C 4 H 10 ), <strong>and</strong> smallamounts of highly toxic hydrogen sulfide (H 2 S).Conventional natural gas lies above most reservoirsof crude oil (Figure 17-2). Like oil, natural gas wasformed from fossil deposits of phytoplankton <strong>and</strong> animalsburied on the seafloor for millions of years <strong>and</strong>subjected to high temperatures <strong>and</strong> pressures.How Is Natural Gas Used? A Versatile FuelNatural gas can be burned to heat space <strong>and</strong> water,generate electricity, <strong>and</strong> propel vehicles.Natural gas is a versatile fuel that can be burned toheat water <strong>and</strong> buildings <strong>and</strong> to generate electricity. Itcan also be used as a fuel for cars <strong>and</strong> trucks with fairlyinexpensive engine modifications. Natural gas is especiallyuseful for running fleets of taxis <strong>and</strong> delivery<strong>and</strong> work vehicles operating from garages <strong>and</strong> maintenancefacilities that can be used to supply them withthis fuel.Increasingly, natural gas is used to run mediumsizedturbines that produce electricity. These cleanburningturbines have a much higher energy efficiency(50–60%) than coal-burning power plants (24–35%).They are cheaper to build per kilowatt-hour, requireless time to install, <strong>and</strong> are easier <strong>and</strong> cheaper to maintainthan large-scale coal <strong>and</strong> nuclear power plants.362 CHAPTER 17 Nonrenewable Energy Resources
Burning natural gas emits CO 2 but at a lower rate perunit of energy than other fossil fuels (Figure 17-16). Forthese reasons, natural gas use is expected to growworldwide (Figure 17-4) <strong>and</strong> in the United States (Figures17-5 <strong>and</strong> 17-6).T rade-OffsConventional Natural GasAdvantagesDisadvantagesWho Has the World’s Natural Gas Supplies<strong>and</strong> How Long Will the Supplies Last? MoreAbundant than OilRussia <strong>and</strong> Iran have almost half of the world’sreserves of conventional natural gas, <strong>and</strong> globalreserves should last 62–125 years.Russia has about 31% of the world’s proven naturalgas reserves, followed by Iran (15%) <strong>and</strong> Qatar (9%).About 36% of the world’s natural gas reserves are inMiddle Eastern countries. The United States has only3% of the world’s proven reserves. Geologists expectto find more natural gas, especially in unexplored developingcountries.The long-term global outlook for natural gas suppliesis better than for conventional oil. At the currentconsumption rate, geologists estimate that known reserves<strong>and</strong> undiscovered potential reserves of conventionalnatural gas should last the world for 62–125years <strong>and</strong> the United States for 55–80 years, dependingon how rapidly it is used.They project that conventional <strong>and</strong> unconventionalsupplies of natural gas (the latter available at higherprices) should last at least 200 years at the current consumptionrate <strong>and</strong> 80 years if consumption rates rise2% per year.Figure 17-19 lists the advantages <strong>and</strong> disadvantagesof natural gas as an energy resource. Energy expertsproject greatly increased global use of natural gasduring this century because of its fairly abundant supply,<strong>and</strong> lower pollution <strong>and</strong> CO 2 rates per unit ofenergy compared to other fossil fuels (Figure 17-16).Because of its advantages over oil, coal, <strong>and</strong> nuclearenergy, some analysts see natural gas as the bestfuel to help make the transition to improved energy efficiency<strong>and</strong> greater use of solar energy <strong>and</strong> hydrogenover the next 50 years.What Is the Future of Natural Gas in theUnited States? Declining Supplies <strong>and</strong> RisingImportsNatural gas production in the United States is expectedto continue declining, resulting in increaseddependence on imports from Canada, Russia, <strong>and</strong> theMiddle East.In 2002, natural gas was burned to provide 53% of theheat in U.S. homes <strong>and</strong> 16% of the country’s electricity.By 2020, the U.S. Department of Energy projects thatnatural gas will be burned to produce about one-thirdAmple supplies(125 years)High net energyyieldLow cost (withhuge subsidies)Less air pollutionthan otherfossil fuelsLower CO 2emissions thanother fossil fuelsModerate environmentalimpactEasily transportedby pipelineLow l<strong>and</strong> useGood fuel forfuel cells <strong>and</strong>gas turbinesAnode (-)CatalystCathode (+) (+)NonrenewableresourceReleases CO 2when burnedMethane(a greenhousegas) can leakfrom pipelinesDifficult to transferfrom one countryto anotherShipped acrossocean as highlyexplosive LNGSometimesburned off <strong>and</strong>wasted at wellsbecause of lowpriceRequires pipelinesFigure 17-19 Trade-offs: advantages <strong>and</strong> disadvantages ofusing conventional natural gas as an energy resource. Pick thesingle advantage <strong>and</strong> disadvantage that you think are the mostimportant.of the country’s electricity, if the natural gas pipelinedistribution system is greatly exp<strong>and</strong>ed.Bad news. U.S. production of natural gas has beendeclining for a long time, <strong>and</strong> most geologists do notbelieve this situation will be reversed. More naturalgas could be imported from Canada, but this will requirebuilding a major pipeline between the two countries.Also, production in Canada is expected to peakbetween 2020 <strong>and</strong> 2030. Then the United States <strong>and</strong> therest of the world would have to rely increasingly onRussia <strong>and</strong> the Middle East for supplies of natural gas.More liquefied natural gas could be imported byship. But this requires cooling the gas to a very lowtemperature to liquefy it, shipping it in special tankers,<strong>and</strong> building special LNG receiving terminals. This isquite expensive <strong>and</strong> reduces the net energy yield fornatural gas. Also, LNG is highly flammable <strong>and</strong> couldlead to large-scale fires at receiving terminals.http://biology.brookscole.com/miller14363
17-4 COALWhat Is Coal, <strong>and</strong> How Is It Extracted?A Mostly Carbon FuelCoal, which can be extracted by surface <strong>and</strong>underground mining, consists mostly of carbonplus small amounts of sulfur <strong>and</strong> trace amounts ofmercury <strong>and</strong> radioactive material.Coal is a solid fossil fuel formed in several stages asburied remains of l<strong>and</strong> plants that lived 300–400 millionyears ago were subjected to intense heat <strong>and</strong> pressureover many millions of years (Figure 17-20). Coal ismostly carbon <strong>and</strong> contains small amounts of sulfur,released into the atmosphere as SO 2 when coal isburned. Burning coal also releases trace amounts oftoxic mercury <strong>and</strong> radioactive materials.Anthracite (which is about 98% carbon) is themost desirable type of coal because of its high heatcontent <strong>and</strong> low sulfur content. However, because ittakes much longer to form, it is less common <strong>and</strong>therefore more expensive than other types of coal.Some coal is extracted underground by minersworking in tunnels <strong>and</strong> shafts (Figure 16-12, p. 342).This is one of the world’s most dangerous occupationsbecause of accidents <strong>and</strong> black lung disease caused byprolonged inhalation of coal dust particles. Area stripmining (Figure 16-11c, p. 341) is used to extract coalfound close to the earth’s surface on flat terrain, <strong>and</strong>contour strip mining (Figure 16-11d) is used on hilly ormountainous terrain. In some cases, entire mountaintopsare removed <strong>and</strong> dumped into the valleys belowto expose seams of coal. The scarred l<strong>and</strong> from thesurface mining of coal is not restored in most countries<strong>and</strong> only partially restored in parts of the UnitedStates.Fly over parts of West Virginia <strong>and</strong> you will seesome mountains looking as if their tops had beensliced off with a machete <strong>and</strong> others so deeply minedthat they look like ugly miniatureGr<strong>and</strong> Canyons. Enormousslurry ponds containing miningwaste are s<strong>and</strong>wiched betweenthe remains of these mountains.Mountaintop mining has pollutedsome 760 kilometers (470Peat(not a coal)miles) of West Virginia’s streams <strong>and</strong> displaced thous<strong>and</strong>sof families.After coal is removed, trains usually transport it toa processing plant, where it is broken up, crushed, <strong>and</strong>washed to remove impurities. After the coal is dried itis shipped (again usually by train) to users, mostlypower plants <strong>and</strong> industrial plants.How Is Coal Used, <strong>and</strong> How Long WillSupplies Last?Coal is burned mostly to produce electricity <strong>and</strong> steel,<strong>and</strong> reserves in the United States, Russia, <strong>and</strong> Chinacould last hundreds to thous<strong>and</strong>s of years.Coal is burned to generate 62% of the world’s electricity(52% in the United States) <strong>and</strong> make three-fourthsof its steel. Coal is by far the world’s most abundantfossil fuel, with deposits containing ten times more energythan oil <strong>and</strong> natural gas resources combined. Accordingto the U.S. Geological Survey, identified <strong>and</strong>unidentified supplies of coal could last the world for214–1,125 years, depending on the rate of usage.The United States has one-fourth of the world’sproven coal reserves. Russia has 16% <strong>and</strong> China 12%. In2002, just over half of global coal consumption was splitalmost evenly between China <strong>and</strong> the United States.China has enough proven coal reserves to last 300years at its current rate of consumption. According tothe U.S. Geological Survey, identified U.S. coal reservesshould also last about 300 years at the currentconsumption rate, <strong>and</strong> unidentified U.S. coal resourcescould extend those supplies for perhaps another 100years, at a higher cost. However, if U.S. coal use shouldincrease by 4% a year—as the coal industry projects—the country’s proven coal reserves would last only 64years.Figure 17-21 lists the advantages <strong>and</strong> disadvantagesof using coal as an energy resource. Bottom line.Increasing moisture contentLignite(brown coal)Increasing heat <strong>and</strong> carbon contentBituminous Coal(soft coal)Anthracite(hard coal)HeatHeatHeatFigure 17-20 Natural capital:stages in coal formation over millionsof years. Peat is a soil material madeof moist, partially decomposed organicmatter. Lignite <strong>and</strong> bituminouscoal are sedimentary rocks, whereasanthracite is a metamorphic rock(Figure 16-9, p. 339).Partially decayedplant matter in swamps<strong>and</strong> bogs; low heatcontentPressureLow heat content;low sulfur content;limited supplies inmost areasPressurePressureExtensively usedas a fuel becauseof its high heat content<strong>and</strong> large supplies;normally has ahigh sulfur contentHighly desirable fuelbecause of its highheat content <strong>and</strong>low sulfur content;supplies are limitedin most areas364 CHAPTER 17 Nonrenewable Energy Resources
Trade-OffsCoalxHOW WOULD YOU VOTE? Should coal use be phased outover the next 20 years? Cast your vote online at http://biology.brookscole.com/miller14.AdvantagesAmple supplies(225–900 years)High net energyyieldLow cost (withhuge subsidies)DisadvantagesVery highenvironmentalimpactSevere l<strong>and</strong>disturbance, airpollution, <strong>and</strong>water pollutionHigh l<strong>and</strong> use(including mining)What Are the Advantages <strong>and</strong> Disadvantagesof Converting Solid Coal into Gaseous <strong>and</strong>Liquid Fuels? Better for the Air, Worse forthe ClimateCoal can be converted to gaseous <strong>and</strong> liquid fuelsthat burn cleaner than coal, but costs are high, <strong>and</strong>producing <strong>and</strong> burning them add more carbondioxide to the atmosphere than burning coal.Solid coal can be converted into synthetic natural gas(SNG) by coal gasification or into a liquid fuel such asmethanol or synthetic gasoline by coal liquefaction.Figure 17-22 lists the advantages <strong>and</strong> disadvantages ofusing these synfuels.Mining <strong>and</strong>combustiontechnologywell-developedSevere threat tohuman healthHigh CO 2emissionswhen burnedAdvantagesT rade-OffsSynthetic FuelsDisadvantagesAir pollution canbe reduced withimprovedtechnology (butadds to cost)Releasesradioactiveparticles <strong>and</strong> toxicmercury into airLarge potentialsupplyLow to moderatenet energy yieldHigher cost thancoalFigure 17-21 Trade-offs: advantages <strong>and</strong> disadvantages ofusing coal as an energy resource. Pick the single advantage<strong>and</strong> disadvantage that you think are the most important.Vehicle fuelRequires mining50% more coalCoal is the world’s most abundant fossil fuel, but mining<strong>and</strong> burning it has a severe environmental impacton air, water, <strong>and</strong> l<strong>and</strong> <strong>and</strong> accounts for over a third ofthe world’s annual CO 2 emissions. Each year in theUnited States alone, air pollutants—such as sulfurdioxide, particulates, <strong>and</strong> toxic metals such as mercury,arsenic, <strong>and</strong> lead—released when coal is burnedkill thous<strong>and</strong>s of people prematurely (estimates rangefrom 65,000 to 200,000), cause at least 50,000 cases ofrespiratory disease, <strong>and</strong> result in several billion dollarsof property damage. Many people are unaware thatburning coal is also responsible for about one-fourth ofatmospheric mercury pollution in the United States<strong>and</strong> releases far more radioactive particles into the airthan normally operating nuclear power plants.In China, millions of people burning coal in unventedstoves for heat <strong>and</strong> cooking are exposed to dangerouslevels of particulate matter <strong>and</strong> toxic metalssuch as mercury <strong>and</strong> arsenic.Moderate cost(with largegovernmentsubsidies)Lower airpollution whenburned than coalHighenvironmentalimpactIncreased surfacemining of coalHigh water useHigher CO 2emissions thancoalFigure 17-22 Trade-offs: advantages <strong>and</strong> disadvantages ofusing synthetic natural gas (SNG) <strong>and</strong> liquid synfuels producedfrom coal. Pick the single advantage <strong>and</strong> disadvantage that youthink are the most important.http://biology.brookscole.com/miller14365
Without huge government subsidies, most analystsexpect these synthetic fuels to play only a minorrole as energy resources in the next 20–50 years. Comparedwith burning conventional coals, they requiremining 50% more coal <strong>and</strong> their production <strong>and</strong> burningadd 50% more carbon dioxide to the atmosphere.Also, they cost more to produce.However, the U.S. Department of Energy <strong>and</strong> aconsortium of major oil companies are working onways to reduce CO 2 emissions during the coal gasificationprocess. They hope to develop metal-ceramicmembranes that trap carbon dioxide gas. The CO 2could then be compressed <strong>and</strong> piped off to undergroundrepositories or other permanent storage sites.If this works, burning gasified coal could be a cheaper<strong>and</strong> cleaner way to produce electricity than burningcoal, oil, or natural gas. Stay tuned.17-5 NUCLEAR ENERGYHow Does a Nuclear Fission Reactor Work?Splitting Nuclei to Produce ElectricityIn a conventional nuclear reactor, isotopes of uranium<strong>and</strong> plutonium undergo controlled nuclear fission <strong>and</strong>the resulting heat is used to produce steam that spinsturbines to generate electricity.To evaluate the advantages <strong>and</strong> disadvantages of nuclearpower, we must know how a conventional nuclearpower plant <strong>and</strong> its accompanying nuclear fuelcycle work. In a nuclear fission chain reaction, neutronssplit the nuclei of atoms such as uranium-235<strong>and</strong> plutonium-239 <strong>and</strong> release energy mostly as hightemperatureheat as a result of the chain reaction (Figure3-15, p. 50). In the reactor of a nuclear power plant,the rate of fission is controlled <strong>and</strong> the heat generatedis used to produce high-pressure steam, which spinsturbines that generate electricity.Light-water reactors (LWRs) like the one in the diagramin Figure 17-23 produce about 85% of the world’snuclear-generated electricity (100% in the UnitedStates). The core of an LWR contains 35,000– 70,000long, thin fuel rods, each packed with fuel pellets.Each pellet is about one-third the size of a cigarette<strong>and</strong> contains the energy equivalent of 0.9 metric ton (1ton) of coal or four barrels of crude oil.The uranium oxide fuel in each pellet consists ofabout 97% nonfissionable uranium-238 <strong>and</strong> 3% fissionableuranium-235. To create a suitable fuel, the concentrationof uranium-235 in the ore is increased (enriched)from 0.7% (its natural concentration in uranium ore) to3% by removing some of the uranium-238.Control rods made of neutron-absorbing materials,such as boron or cadmium, are moved in <strong>and</strong> out ofthe spaces between the fuel assemblies in the core toabsorb neutrons. This regulates the rate of fission <strong>and</strong>amount of power the reactor produces.A material called a moderator slows down the neutronsemitted by the fission process to keep the chainreaction going. The moderator can be liquid water(used in 75% of the world’s reactors, called pressurizedwater reactors, Figure 17-23), solid graphite (used in20% of all reactors, mostly in France, the former SovietUnion, <strong>and</strong> Great Britain), or heavy water (deuteriumoxide or D 2 O, used in 5% of all reactors). Graphitemoderatedreactors (used in the ill-fated Chernobylplant; Figure 17-1) can also produce fissionable plutonium-239for nuclear weapons.A coolant, usually water, circulates through the reactor’score to remove heat to keep fuel rods <strong>and</strong> othermaterials from melting <strong>and</strong> to produce steam for generatingelectricity. In Great Britain, gaseous carbondioxide is blown into the core to keep the fuel assembliescool. The greatest danger in water-cooled reactorsis a loss of coolant that would allow the fuel to quicklyoverheat, melt down, <strong>and</strong> possibly release radioactivematerials to the environment. An LWR reactor has anemergency core-cooling system as a backup to helpprevent such meltdowns.As a further safety backup, a containment vesselwith very thick <strong>and</strong> strong walls surrounds the reactorcore. It is designed to keep radioactive materials fromescaping into the environment in case of an internalexplosion or core meltdown within the reactor <strong>and</strong>to protect the core from external threats such as a planecrash. Containment vessels typically consist of a 1.2-meter (4-foot) steel-reinforced concrete wall with asteel liner.Water-filled pools or dry casks with thick steel wallsare used for on-site storage of highly radioactive spentfuel rods removed when reactors are refueled. Mostspent fuel rods are stored in 6-meter- (20-foot-) deeppools of boron-treated water to shield against radiation<strong>and</strong> to keep the fuel from heating up, catching fire,<strong>and</strong> releasing radioactive materials into the environment.The long-term goal is to transport spent fuelrods <strong>and</strong> other long-lived radioactive wastes to an undergroundfacility where they must be stored safelyfor 10,000–240,000 years until their radioactivity fallsto safe levels.The overlapping <strong>and</strong> multiple safety features of amodern nuclear reactor greatly reduce the chance of aserious nuclear accident. But these safety features makenuclear power plants very expensive to build <strong>and</strong>maintain.What Is the Nuclear Fuel Cycle? Lookingat the Whole PictureThe nuclear fuel cycle includes the mining ofuranium, processing it to make a satisfactory366 CHAPTER 17 Nonrenewable Energy Resources
Small amounts ofradioactive gasesUranium fuel input(reactor core)Containment shellEmergency corecooling systemWaste heatElectrical powerControlrodsHeatexchangerHot coolantSteamTurbineGeneratorHot water outputUseful energy25 to 30%CoolantPumpModeratorCoolantpassagePressurevesselShieldingWaterPumpCondenserCool water inputPumpPumpWasteheatWasteWater source heat(river, lake, ocean)Periodic removal<strong>and</strong> storage ofradioactive wastes<strong>and</strong> spent fuel assembliesPeriodic removal<strong>and</strong> storage ofradioactive liquid wastesFigure 17-23 Light-water–moderated <strong>and</strong> –cooled nuclear power plant with a pressurized water reactor. Someplants use huge cooling towers to transfer some of the waste heat to the atmosphere.fuel, using it in a reactor, safely storing the resultinghighly radioactive wastes for thous<strong>and</strong>s of years, <strong>and</strong>dealing with the highly radioactive reactor after itsuseful life.Nuclear power plants, each with one or more reactors,are only one part of the nuclear fuel cycle (Figure 17-24,p. 368). Unlike other energy resources, nuclear energyproduces high-level radioactive wastes that give off largeamounts of harmful ionizing radiation for a short time<strong>and</strong> small amounts for a long time. Such wastes, consistingmainly of spent fuel rods from commercial nuclearpower plants <strong>and</strong> assorted wastes from the productionof nuclear weapons, must be stored safely forthous<strong>and</strong>s of years.After approximately 15–60 years of operation, anuclear reactor becomes dangerously contaminatedwith radioactive materials, <strong>and</strong> many of its parts becomebrittle or corroded <strong>and</strong> worn out. Unless theplant’s life can be extended by expensive renovation, itmust be decommissioned or retired.Once a nuclear reactor comes to the end of its usefullife it cannot be shut down <strong>and</strong> ab<strong>and</strong>oned like acoal-burning plant. It contains large quantities of intenselyradioactive materials that must be kept out ofthe environment for many thous<strong>and</strong>s of years.In the closed nuclear fuel cycle (Figure 17-24, dottedlines), the fissionable isotopes uranium-235 <strong>and</strong> plutonium-239are removed from spent fuel assemblies forreuse as nuclear fuel. <strong>Their</strong> removal means that the remainingradioactive wastes must be stored safely forabout 10,000 years. Currently, these isotopes are rarelyremoved from spent fuel rods <strong>and</strong> other nuclearwastes because of high costs <strong>and</strong> the potential use ofthe removed isotopes in nuclear weapons.http://biology.brookscole.com/miller14367
Fuel assembliesDecommissioningof reactorReactorEnrichment UF 6Conversion ofU 3 O 8 to UF 6Fuel fabrication(conversion of enrichedUF to UO 6 2 <strong>and</strong> fabricationof fuel assemblies)Uranium-235 as UF 6Plutonium-239 as PuO 2Spent fuelreprocessingTemporary storageof spent fuel assembliesunderwater or in dry casksLow level radiationwith long half-lifeGeologic disposalof moderate<strong>and</strong>high-levelradioactive wastesFigure 17-24 The nuclear fuel cycle.Open fuel cycle todayProspective “closed” end fuel cycleIn the open nuclear fuel cycle (solid lines, Figure17-24) the isotopes are not removed by reprocessingthe nuclear wastes <strong>and</strong> are eventually buried inan underground disposal facility. These wastes mustbe stored safely for about 240,000 years—severaltimes longer than the latest version of our species hasbeen around.In evaluating the safety, economic feasibility, <strong>and</strong> overallenvironmental impact of nuclear power, energy experts<strong>and</strong> economists caution us to look at this entire cycle, notjust the nuclear plant itself.How Did We Get into Nuclear Power<strong>and</strong> How Successful Has It Been? A FadedDreamAfter more than 50 years of development <strong>and</strong> enormousgovernment subsidies, nuclear power has notlived up to its promise.U.S. utility companies began developing nuclear powerplants in the late 1950s for three reasons. First, theAtomic Energy Commission (which had the conflictingroles of promoting <strong>and</strong> regulating nuclear power)promised utility executives that nuclear power wouldproduce electricity at a much lower cost than coal<strong>and</strong> other alternatives. Indeed, President Dwight D.Eisenhower declared in a 1953 speech that nuclearpower would be “too cheap to meter.”Second, the government (taxpayers) paid aboutone-fourth of the cost of building the first group of commercialreactors <strong>and</strong> guaranteed there would be no costoverruns. Third, after insurance companies refusedto insure nuclear power, Congress passed the Price–Anderson Act to protect the U.S. nuclear industry <strong>and</strong>utilities from significant liability in case of accidents. *In the 1950s, researchers projected that by the year2000 at least 1,800 nuclear power plants would supply21% of the world’s commercial energy (25% in theUnited States) <strong>and</strong> most of the world’s electricity.*This act limits the nuclear industry’s liability for any accident to$9.5 billion. According to the U.S. Nuclear Regulatory Commission,a worst-case accident would cause more than $300 billionin damages.368 CHAPTER 17 Nonrenewable Energy Resources
After more than 50 years of development, enormousgovernment subsidies, <strong>and</strong> an investment of $2trillion worldwide, these goals have not been met. Instead,by 2002, 441 commercial nuclear reactors in 30countries were producing only 6% of the world’s commercialenergy <strong>and</strong> 19% of its electricity.Since 1989, electricity production from nuclearpower has increased only slightly <strong>and</strong> is now theworld’s slowest-growing energy source. According tothe U.S. Department of Energy, the percentage of theworld’s electricity produced by nuclear power will fallto 12% by 2025 because the retirement of aging existingreactors is expected to exceed construction of new ones.No new nuclear power plants have been orderedin the United States since 1978, <strong>and</strong> all 120 plants orderedsince 1973 have been canceled. In 2004, therewere 103 licensed <strong>and</strong> operating commercial nuclearpower reactors in 31 states—most in the eastern half ofthe country (Figure 17-25). Is there a nuclear reactor inyour vicinity? These reactors generate about 21% of thecountry’s electricity <strong>and</strong> 8% of its total energy. This percentageis expected to decline over the next two to threedecades as existing plants wear out <strong>and</strong> are retired.According to energy analysts <strong>and</strong> economists,there are several major reasons for the failure of nuclearpower to grow as projected. They include multibilliondollarconstruction cost overruns, higher operatingcosts <strong>and</strong> more malfunctions than expected, <strong>and</strong> poormanagement. Two other major setbacks have beenpublic concerns about safety <strong>and</strong> stricter governmentsafety regulations, especially after the accidents in 1979at the Three Mile Isl<strong>and</strong> nuclear plant in Pennsylvania<strong>and</strong> in 1986 at Chernobyl (p. 350).Another problem is investor concerns about theeconomic feasibility of nuclear power that take intoaccount the entire nuclear fuel cycle. At Three MileIsl<strong>and</strong>, investors lost over a billion dollars in one hourfrom damaged equipment <strong>and</strong> repair, even though the1Wash. 11Ore.1Nev.Calif.212IdahoUtah3 Ariz.Mont.Wyo.1Colo.N.M.N.H.MaineVt.N.D.1Minn.11 11 Mass.11 21 1Wis. 1N.Y. 1S.D.21 R.I.21Mich.1 222Conn.2 1 1 1 Pa. 1 1Iowa 22 1 21222 1 1 N.J.Neb. 12 2 1 Ohio2Ind.2Del.12Ill.12W.Va. Md.Va.2Kan. 1 1Mo.Ky.121N.C.Tenn.2 32 2Okla. 21 1Ark.S.C.32Ga.Miss. Ala.221La.2Texas1 1 1Alaska2Fla.22HawaiiReactors1 Operational Yucca Mountain high-level1 Decommissioned nuclear waste storage siteFigure 17-25 Locations of the United States’ 103 operating commercial nuclear power plant reactors, 14 decommissionedreactors (with highly radioactive used fuel stored on site), <strong>and</strong> the recently approved site inNevada for storage of highly radioactive used fuel from operating <strong>and</strong> decommissioned nuclear reactors.Numbers refer to the number of reactors at each nuclear power plant site. There are at least 30 other sites(mostly in the West) containing high-level nuclear wastes produced mostly by making nuclear weapons that willalso ship wastes to Nevada’s Yucca Mountain underground storage site. (Data from U.S. Nuclear RegulatoryCommission <strong>and</strong> U.S. Department of Energy)http://biology.brookscole.com/miller14369
eactor core did not melt down <strong>and</strong> no human liveswere lost. Also, concern has risen about the vulnerabilityof nuclear power plants to terrorist attacks after theevents of September 11, 2001, in the United States.Experts are especially concerned about the vulnerabilityof poorly protected <strong>and</strong> intensely radioactive spentfuel rods stored in pools or casks outside of reactorbuildings.What Are the Advantages <strong>and</strong> Disadvantagesof the Conventional Nuclear Fuel Cycle?Better than Coal but Much More Costly <strong>and</strong>Vulnerable to Terrorist AttackAdvantagesLarge fuelsupplyLowenvironmentalimpact (withoutaccidents)Emits 1/6 as muchCO 2 as coalModerate l<strong>and</strong>disruption <strong>and</strong>water pollution(withoutaccidents)Moderatel<strong>and</strong> useLow risk ofaccidentsbecause ofmultiplesafety systems(except in 35poorly designed<strong>and</strong> run reactorsin former SovietUnion <strong>and</strong>eastern Europe)Trade-OffsConventional Nuclear Fuel CycleDisadvantagesHigh cost even withlarge subsidiesLow net energy yieldHigh environmentalimpact (with majoraccidents)Catastrophicaccidents canhappen (Chernobyl)No widelyacceptable solutionfor long-term storageof radioactivewastes <strong>and</strong>decommissioningworn-out plantsSubject to terroristattacksSpreads knowledge<strong>and</strong> technology forbuilding nuclearweaponsFigure 17-26 Trade-offs: advantages <strong>and</strong> disadvantages ofusing the conventional nuclear fuel cycle (Figure 17-24) to produceelectricity. Pick the single advantage <strong>and</strong> disadvantagethat you think are the most important.The nuclear fuel cycle has a fairly low environmentalimpact <strong>and</strong> a very low risk of an accident, but costsare high, radioactive wastes must be stored safely forthous<strong>and</strong>s of years, <strong>and</strong> facilities are vulnerable toterrorist attack.Figure 17-26 lists the major advantages <strong>and</strong> disadvantagesof the conventional nuclear fuel cycle. Usingnuclear power to produce electricity has some importantadvantages over coal-burning power plants (Figure17-27).Some proponents of nuclear power in the UnitedStates claim it will help reduce dependence on importedoil. But other analysts point out that nuclearpower has little effect on U.S. oil use because burningoil typically produces only 2–3% of the electricity inthe United States. The major use for oil is to producegasoline <strong>and</strong> diesel fuel for transportation, whichwould not be affected by increasing the use of nuclearpower to produce electricity.Proponents say we should increase the use of nuclearpower because its use does not release the greenhousegas carbon dioxide into the atmosphere. It istrue that nuclear power plants do not release carbondioxide. However, the nuclear fuel cycle does releasethis gas into the atmosphere, although emissions areless per unit of energy than burning fossil fuels (Figure17-16).Because of multiple built-in safety features, the riskof exposure to radioactivity from nuclear power plantsin the United States <strong>and</strong> most other developed countriesis extremely low. However, a partial or completemeltdown or explosion is possible, as the Chernobyl<strong>and</strong> Three Mile Isl<strong>and</strong> accidents have taught us.The U.S. Nuclear Regulatory Commission (NRC)estimates there is a 15–45% chance of a complete coremeltdown at a U.S. reactor during the next 20 years.The NRC also found that 39 U.S. reactors have an 80%chance of failure in the containment shell from a meltdownor an explosion of gases inside containmentstructures.Throughout the world, nuclear scientists <strong>and</strong> governmentofficials urge the shutdown of 35 poorly designed<strong>and</strong> poorly operated nuclear reactors in somerepublics of the former Soviet Union <strong>and</strong> in easternEurope. This is unlikely without economic aid fromdeveloped countries.In the United States, there is widespread publicdistrust of the ability of the NRC <strong>and</strong> the Departmentof Energy (DOE) to enforce nuclear safety in commercial(NRC) <strong>and</strong> military (DOE) nuclear facilities. In1996, George Galatis, a respected senior nuclear engineer,said, “I believe in nuclear power but after seeingthe NRC in action I’m convinced a serious accident isnot just likely, but inevitable. ... They’re asleep at thewheel.”Concerns about the safety of some U.S. nuclearpower plants grew in 2002 when inspectors found thatleaking boric acid had eaten a softball-size holethrough nearly the entire reactor lid at a nuclear plantnear Toledo, Ohio. The only thing preventing a ruptureof the high-pressure reactor vessel <strong>and</strong> a possible370 CHAPTER 17 Nonrenewable Energy Resources
CoalAmple supplyHigh net energyyieldVery high airpollutionHigh CO 2emissionsHigh l<strong>and</strong>disruption fromsurface miningHigh l<strong>and</strong> useLow cost (withhuge subsidies)T rade-OffsCoal vs. NuclearNuclearAmple supplyof uraniumLow net energyyieldLow air pollution(mostly from fuelreprocessing)Low CO 2 emissions(mostly from fuelreprocessing)Much lower l<strong>and</strong>disruption fromsurface miningModerate l<strong>and</strong> useHigh cost (withhuge subsidies)Figure 17-27 Trade-offs: comparison of the risks of using nuclearpower (based on the nuclear fuel cycle) <strong>and</strong> coal-burningplants to produce electricity. If you had to choose, would yourather live next door to a coal-fired power plant or a nuclearpower plant?meltdown was a 1-centimeter (0.44-inch) thick stainlesssteel liner.How Vulnerable Are U.S. Nuclear PowerPlants to Terrorist Attack? A SeriousConcernThere is great concern about the vulnerability of U.S.nuclear power plants <strong>and</strong> the nuclear wastes theystore to terrorist attack.The 2001 destruction of New York City’s World TradeCenter towers raised fears that a similar attack couldbreak open a reactor’s containment shell <strong>and</strong> set off areactor meltdown that could create a major radioactivedisaster.Nuclear officials say such concerns are overblown<strong>and</strong> that U.S. nuclear plants could survive such an attackbecause of the thickness <strong>and</strong> strength of the containmentwalls. But a 2002 study by the NuclearControl Institute found that the plants were not designedto withst<strong>and</strong> the crash of a large jet traveling atthe impact speed of the two hijacked airliners that hitthe World Trade Center.This is not surprising because in 1982 the U.S.Nuclear Regulatory Commission ruled that ownersof nuclear power plants did not have to design theplants to survive threats such as suicidal airlinercrashes. According to the NRC, requiring such constructionwould make nuclear electricity too expensiveto be competitive.An even greater concern is insufficient security atU.S. nuclear power plants against ground-level attacksby terrorists. During a series of ground-based securityexercises by the NRC between 1991 <strong>and</strong> 2001, mock attackerswere able to simulate the destruction ofenough equipment to cause a meltdown of nearly halfof U.S. nuclear plants. And according to a 2002 studyby the nonprofit Project on Government Oversight(POGO), these tests did not realistically represent aterrorist attack scenario. This study also found thatthat many security guards at nuclear power plantshave low morale <strong>and</strong> are overworked, underpaid, undertrained,<strong>and</strong> not equipped with sufficient firepowerto repel a serious ground attack by terrorists.The NRC contends that the security weaknesses revealedby earlier mock tests have been corrected. Butmany analysts are unconvinced <strong>and</strong> note that since September2001 the NRC has stopped staging such tests.According to critics, the problem is that the NRCis reluctant to require utilities to significantly upgradeplant security because this would increase the costs ofnuclear power <strong>and</strong> make it less competitive in themarketplace.How Safe Is High-Level Radioactive WasteStored at U.S. Nuclear Power Plants?Vulnerable to TerroristsSpent fuel rods stored underwater in pools or in drycasks outside of the containment shells at nuclearplants are vulnerable to attack by terrorists.Most high-level radioactive wastes are spent fuel rods.A spent-fuel storage pool typically holds five to tentimes more long-lived radioactivity than the radioactivecore inside a plant’s reactor.Suppose that water drains out of a spent-fuel poolor a dry storage cask ruptures because of unlikely butpossible events such as earthquake, airplane impact,or terrorist act. Then, according to NRC studies, thehighly radioactive <strong>and</strong> thermally hot fuel would be exposedto air <strong>and</strong> steam. This would cause the zirconiumouter cover of the fuel assemblies to catch fire<strong>and</strong> burn fiercely.The NRC acknowledges that such a fire could notbe extinguished <strong>and</strong> would burn for days. This wouldrelease significant amounts of radioactive materialsinto the atmosphere, contaminate large areas for manydecades, <strong>and</strong> create economic <strong>and</strong> psychological havoc.Unlike the reactor core with its thick concrete protectivedome, spent-fuel pools have little protectivecover. The pools have backup cooling systems to helphttp://biology.brookscole.com/miller14371
prevent a fire, but these could malfunction or bedestroyed by a terrorist attack or a deliberate crash bya small airplane. For example, studies in 2002 by theInstitute for Resource <strong>and</strong> Security Studies <strong>and</strong> theFederation of American Scientists estimated that releaseof all radioactive material in the spent-fuel rodsin the storage pool at the Millstone Unit 3 reactor inConnecticut because of an accident or terrorist attackwould put five times more radioactive material intothe atmosphere than the 1986 Chernobyl accident.And an area larger than New York state would be uninhabitablefor at least 30 years because of radioactivecontamination.According to these studies, about 161 million people—57%of the U.S. population—live within 121 kilometers(75 miles) of an aboveground spent-fuel site.There are 127 such sites in 44 states, mostly in the easternhalf of the country (Figure 17-25).U.S. nuclear power officials consider such eventsto be highly unlikely worst-case scenarios <strong>and</strong> questionsome of the estimates. They also contend that nuclearpower facilities are safe from attack. Critics arenot convinced <strong>and</strong> call for constructing much more securestructures to protect spent-fuel storage sites. Theyaccuse the NRC of failure to require this because itwould impose additional costs on utility companies,raise the cost of nuclear power, <strong>and</strong> make it a less attractiveenergy alternative.What Do We Do with Low-Level RadioactiveWaste? Dump It in the Ocean, Bury It inSpecial L<strong>and</strong>fills, or Mix It with OrdinaryTrashThe nuclear fuel cycle <strong>and</strong> other nuclear facilityprocesses produce low-level radioactive wastes thatmust be stored safely for 100–500 years before theydecay to safe levels.Each part of the nuclear fuel cycle (Figure 17-24) produceslow-level <strong>and</strong> high-level solid, liquid, <strong>and</strong>gaseous radioactive wastes with various half-lives(Table 3-1, p. 49). Wastes classified as low-level radioactivewastes give off small amounts of ionizing radiation<strong>and</strong> must be stored safely for 100–500 years before decayingto safe levels. Such wastes include tools, buildingmaterials, clothing, glassware, <strong>and</strong> other items thathave been contaminated by radioactivity.From the 1940s to 1970, most low-level radioactivewaste produced in the United States <strong>and</strong> most othercountries was put into steel drums <strong>and</strong> dumped intothe ocean; the United Kingdom <strong>and</strong> Pakistan still disposeof them this way.Today, low-level waste materials from commercialnuclear power plants, hospitals, universities, industries,<strong>and</strong> other producers in the United States are putin steel drums <strong>and</strong> shipped to the two regional l<strong>and</strong>fillsrun by federal <strong>and</strong> state governments. Attempts tobuild new regional dumps for low-level radioactivewaste using improved technology have met with fiercepublic opposition.To lower costs, nuclear industry <strong>and</strong> utility officialshave been lobbying Congress <strong>and</strong> the NRC todeclare such waste safe enough to be mixed with ordinarytrash <strong>and</strong> deposited in conventional l<strong>and</strong>fills.What Should We Do with High-LevelRadioactive Waste? A Dangerous <strong>and</strong> Long-Lasting Unintended ConsequenceThere is disagreement among scientists over methodsfor the long-term storage of high-level radioactivewaste.After more than 50 years of research, scientists still donot agree on whether there is a safe method for storinghigh-level radioactive waste. Some believe the longtermsafe storage or disposal of high-level radioactivewastes is technically possible. Others disagree, pointingout that it is impossible to demonstrate that anymethod will work for 10,000–240,000 years.Here are some of the proposed methods <strong>and</strong> theirpossible drawbacks.Bury it deep underground. This favored strategy isunder study by all countries producing nuclear waste.In 2001, the U.S. National Academy of Sciences concludedthat the geologic repository option is the onlyscientifically credible long-term solution for safely isolatingsuch wastes. However, according to an earlier1990 report by the U.S. National Academy of Sciences,“Use of geological information to pretend to be able tomake very accurate predictions of long-term site behavioris scientifically unsound.”Shoot it into space or into the sun. Costs would bevery high, <strong>and</strong> a launch accident—like the explosion ofthe space shuttle Challenger—could disperse high-levelradioactive wastes over large areas of the earth’s surface.This strategy has been ab<strong>and</strong>oned for now.Bury it under the Antarctic ice sheet or the Greenl<strong>and</strong>ice cap. The long-term stability of the ice sheets is notknown. They could be destabilized by heat from thewastes, <strong>and</strong> retrieving the wastes would be difficult orimpossible if the method failed. This strategy is prohibitedby international law.Dump it into descending subduction zones in the deepocean (Figure 16-5, middle, p. 336). But wastes eventuallymight be spewed out somewhere else by volcanicactivity, <strong>and</strong> containers might leak <strong>and</strong> contaminatethe ocean before being carried downward. Also, retrievalwould be impossible if the method did notwork. This strategy is prohibited by international law.Bury it in thick deposits of mud on the deep-ocean floorin areas that tests show have been geologically stable for 65million years. The waste containers eventually would372 CHAPTER 17 Nonrenewable Energy Resources
corrode <strong>and</strong> release their radioactive contents. This approachis prohibited by international law.Change it into harmless, or less harmful, isotopes. Currentlyno way exists to do this. Scientists are investigatingthe use of a linear accelerator to speed up thenormal rates of radioactive decay. But even if this orother methods are developed, costs would probably bevery high, <strong>and</strong> the resulting toxic materials <strong>and</strong> lowlevel(but very long-lived) radioactive wastes wouldstill need to be disposed of safely.Case Study: The Yucca Mountain StorageSite for High-Level Radioactive Wastes—Controversy over Desert BurialScientists disagree over the decision to storehigh-level nuclear wastes at an underground storagesite in Nevada.In 1985, the U.S. Department of Energy (DOE) announcedplans to build a repository for undergroundstorage of high-level radioactive wastes from commercialnuclear reactors <strong>and</strong> some nuclear weapons facilities.The site is to be built on federal l<strong>and</strong> in the YuccaMountain desert region, 160 kilometers (100 miles)northwest of Las Vegas, Nevada (Figure 17-25).The proposed facility (Figure 17-28) is expected tocost at least $58 billion to build (financed partly by atax on nuclear power). It is scheduled to open by 2010<strong>and</strong> begin taking in high-level radioactive waste nowstored at 127 sites in 44 states. But officials concedethat it is not likely to open until 2015. After the site isfilled with waste it is supposed to be monitored for 300years <strong>and</strong> then sealedThe wastes are to be buried in tunnels deep belowthe surface of the almost 1,500-meter- (5,000-foot-)high mountain <strong>and</strong> well above the current water table.They will be inside containers made of a special metalalloy designed to withst<strong>and</strong> the high temperatures ofthe radioactive waste <strong>and</strong> covered with a shield to protectthe metal from corrosion by dripping water.Currently, the area gets only 15 centimeters (6inches) of rainfall per year <strong>and</strong> most of this evaporatesin the desert heat before it can seep underground. Butno one knows whether the climate of this area will getwetter over the next 10,000 to 240,000 years.A number of scientists <strong>and</strong> energy analysts haveserious concerns about the safety of this site. For one,they are concerned that rock fractures <strong>and</strong> tiny cracksmay allow water to leak into the site <strong>and</strong> eventuallycorrode casks holding radioactive waste. DOE computermodels said that water would not flow into thesite, but a scientist found evidence that at one time waterhad flowed deep into the mountain through tinycracks in a matter of decades. In 1998, Jerry Szymanski,formerly the DOE’s top geologist at Yucca Mountain<strong>and</strong> now an outspoken opponent of the site, said that ifwater flooded the site it could cause an explosion solarge that “Chernobyl would be small potatoes.”Storage ContainersFuel rodGround LevelUnloaded from trainPersonnel elevator2,500 ft.(760 m)deepPrimary canisterOverpack containersealedAir shaftNuclear waste shaftUndergroundLowered down shaftBuried <strong>and</strong> cappedFigure 17-28 Solutions: general design for deep underground permanent storage of high-level radioactivewastes from commercial nuclear power plants in the United States. (U.S. Department of Energy)http://biology.brookscole.com/miller14373
In 2004, physicist Paul Craig resigned from a federalpanel of experts evaluating the Yucca Mountainproject so he could speak more freely about the project.He said that the metal canisters used to store thewaste <strong>and</strong> their protective drip shields are badly designed<strong>and</strong> that they “would corrode <strong>and</strong> that wouldeventually lead to leakage of nuclear waste.”In addition, geologists point out a nearby activevolcano <strong>and</strong> 32 active earthquake fault lines runningthrough the site—an unusually high number. Otherscientists claim that data show that the site should besafe from water, earthquakes, <strong>and</strong> volcanic eruptions.Despite such concerns, in January 2002 the U.S.energy secretary found that the site is scientificallysound <strong>and</strong> recommended to President Bush <strong>and</strong> Congressthat highly radioactive waste from the nation’snuclear power plants <strong>and</strong> some nuclear weapons sitesbe deposited under Yucca Mountain. The secretarycited this as an important way to help protect wastesnow stored at nuclear plants from possible terroristattack.This decision raised a storm of protest fromNevada’s elected officials <strong>and</strong> citizens (80% of themopposed to the site) <strong>and</strong> others concerned about safety.The governor of Nevada charged that the DOE loweredits scientific st<strong>and</strong>ards for evaluating the site’sgeologic integrity. Opponents charge that politics, notsound geology, played a major role in the decision.Opponents also contend that the Yucca Mountainwaste site should not be opened because it can decreasenational security. One reason is that it would require atleast 19,000 shipments of wastes over much of thecountry (Figure 17-29)—an average of a shipment eachday for the estimated 38 years before the site is filled.These wastes would be put into specially designedcasks <strong>and</strong> shipped in trucks <strong>and</strong> rail cars. Critics contendthat it is much more difficult to protect such alarge number of shipments from terrorist attack thanto provide more secure ways to store such wastes atnuclear power plant sites.Also shipping nuclear wastes to the Yucca Mountainsite would not decrease the possibilities ofsabotage of wastes stored at the country’s nuclear plantsites in pools <strong>and</strong> casks (unless their security is significantlyupgraded) because the plants will be producingnew wastes about as fast as the old wastes are shippedout. By 2036 to 2041, when the Yucca Mountain sitemay be filled, there will be about as much nuclearwaste stored at nuclear plant sites as there is today.The DOE <strong>and</strong> proponents of nuclear power saythe risks of an accident or sabotage of waste shipmentsare negligible. They point out that the shipments arepacked in thick metal casks <strong>and</strong> protected by armedguards in urban areas. Opponents believe the risks areunderestimated, especially after the events of September11, 2001. They also call for armed guards through-Nuclear power plantsYucca MountainRailroadsHighwaysFigure 17-29 Likely truck <strong>and</strong> rail routes for transporting high-level nuclear waste from 127 U.S. nuclear powerplants <strong>and</strong> other radioactive waste storage sites in 44 states to the underground Yucca Mountain nuclear wastestorage facility in Nevada. The average shipment would travel about 2,400 kilometers (1,500 miles), includingpassage through about 400 kilometers (250 miles) of suburban areas <strong>and</strong> 80 kilometers (50 miles) of urban areas.The DOE plans to build a rail line within Nevada to transport the waste cannisters to the depository site.(U.S. Department of Energy)374 CHAPTER 17 Nonrenewable Energy Resources
out the entire rail or truck trip instead of only in urbanareas.For example, a terrorist hidden along a busy highwayor railway or atop an urban building could use ashoulder-mounted missile launcher to fire one or moreantitank missiles that could penetrate the thick wallsof a shipping cask on a truck or train car (Figure 17-29)<strong>and</strong> release radioactive materials.There is disagreement over the possible effects ofsuch an event. Some analysts say it would spread radioactiveparticles over no more than a 1.6-kilometer(1-mile) radius <strong>and</strong> that the area <strong>and</strong> the people affectedcould be decontaminated by being hosed down.Other analysts say the affected area could be five tothirty times that estimate. And if such an event occurredin an urban area, the spreading radioactivitycould cause 300–18,000 fatal cancers, <strong>and</strong> result in atleast $10 billion in damages. According to a 2002 DOEstudy, in a worst-case scenario such an urban attackcould release enough radioactivity to expose 96,000people <strong>and</strong> cause 48 fatal cancers.In 2002, the U.S. National Academy of Sciences, incollaboration with Harvard <strong>and</strong> University of Tokyoscientists, urged the U.S. government to slow down<strong>and</strong> rethink the nuclear waste storage process. Theycontend that storing spent-fuel rods in dry-storagecasks in well-protected buildings at nuclear plant sitesis an adequate solution for at least 100 years in termsof safety <strong>and</strong> national security. This would buy time tocarry out more research on this complex problem <strong>and</strong>to evaluate other sites <strong>and</strong> storage methods that mightbe more acceptable scientifically <strong>and</strong> politically.Despite these suggestions <strong>and</strong> many objectionsfrom scientists <strong>and</strong> citizens, during the summer of2002 Congress approved Yucca Mountain as the officialsite for storing the country’s commercial nuclearwastes. Opponents want the law repealed. Meanwhile,Nevada is still fighting the project in the courts. Thisstory illustrates how science, politics, <strong>and</strong> economicscan interact as people attempt to solve a difficult <strong>and</strong>controversial problem.xHOW WOULD YOU VOTE? Should highly radioactivespent fuel be stored in well-protected buildings at nuclearpower plant sites instead of shipping them to a single site forunderground burial? Cast your vote online at http://biology.brookscole.com/miller14.What Can We Do with Worn-out NuclearPlants? A Costly DilemmaWhen a nuclear reactor reaches the end of its usefullife we have to keep its highly radioactive materialsfrom reaching the environment for thous<strong>and</strong>s of years.When a nuclear plant comes to the end of its usefullife, it must be decommissioned. Scientists have proposedthree ways to do this.One is to dismantle the plant <strong>and</strong> store its largevolume of highly radioactive materials in a high-levelnuclear waste storage facility (Figure 17-28), whosesafety is questioned by a number of scientists.A second approach is to put up a physical barrieraround the plant <strong>and</strong> set up full-time security for30–100 years before the plant is dismantled. This allowstime for some of the radioactive material to decayto levels that make dismantlement safer. A third optionis to enclose the entire plant in a tomb that must last<strong>and</strong> be monitored for several thous<strong>and</strong> years.Regardless of the method chosen, decommissioningadds to the total costs of nuclear power as an energyoption. So far, only a few plants have been torndown. But doing this cost two to ten times as much asit did to build them. The total estimated costs for decommissioningthe 103 reactors now in operation inthe United States range from $200 billion to $1 trillion.This further decreases the net energy yield of nuclearpower <strong>and</strong> adds to its already high cost.At least 228 large commercial reactors worldwide(20 in the United States) are scheduled for retirement by2012. However, the Nuclear Regulatory Commissionhas approved extending the life of at least 40 reactors to60 years. Opponents contend that this could increasethe risk of nuclear accidents in aging reactors. In 2003,congressional auditors reported that the owners of almosthalf the nuclear power reactors in the UnitedStates are not setting aside enough money to decommissionthem when they are retired, which will saddletaxpayers with the bill.What Are “Dirty” Radioactive Bombs?A Serious ThreatTerrorists could wrap conventional explosives aroundsmall amounts of various radioactive materials thatare fairly easy to get, detonate such bombs, <strong>and</strong>contaminate an area with radioactivity for decades.Since the terrorist attacks in the United States on September11, 2001, there has been growing concern aboutthreats from explosions of so-called dirty bombs. Such abomb consists of an explosive such as dynamite mixedwith or wrapped around some form of radioactive material—anamount that could fit in a coffee cup.Radioactive materials can be stolen from thous<strong>and</strong>sof poorly guarded <strong>and</strong> difficult-to-protectsources or bought on the black market. Sources mightbe hospitals that use radioisotopes (such as cobalt-60)to treat cancer, diagnose diseases, <strong>and</strong> sterilize sometypes of medical equipment. Another source could beuniversity research labs. Some industries also useradioisotopes to detect leaks in underground pipes, irradiatefood, examine mail <strong>and</strong> other materials, <strong>and</strong>detect flaws in pipe welds <strong>and</strong> boilers. Radioactivematerials such as americium-241 are also found insmoke detectors.http://biology.brookscole.com/miller14375
Detonating a dirty bomb at street level or on arooftop does not cause a nuclear blast. But such an explosion<strong>and</strong> subsequent cancers in a densely populatedcity could kill a dozen to 1,000 people, spread radioactivematerial over several to hundreds of blocks,<strong>and</strong> contaminate buildings <strong>and</strong> soil in the affected areafor up to 10 times the half-life of the isotope used.Cleaning up such an area would cost billions of dollars.In addition, detonating a dirty bomb would causeintense psychological terror <strong>and</strong> panic throughoutmuch of a country. As a result, terrorists would succeedin their primary objective.Since 1986, the NRC has recorded 1,700 incidentsin the United States in which radioactive materialsused by industrial, medical, or research facilities havebeen stolen or lost. And since 1991, the InternationalAtomic Energy Agency (IAEA) has detected 671 incidentsof illicit trafficking in dirty-bomb materials.Can We Afford Nuclear Power? BurningMoneyEven with massive government subsidies, thenuclear power fuel cycle is an expensive way toproduce electricity compared to a number ofother energy alternatives.Experience has shown that the nuclear power fuelcycle is an expensive way to produce electricity, evenwhen huge government subsidies partially shieldit from free-market competition with other energysources.In the United States, costs rose dramatically in the1970s <strong>and</strong> 1980s because of unanticipated safety problems<strong>and</strong> stricter regulations after the Three MileIsl<strong>and</strong> <strong>and</strong> Chernobyl accidents. In 1995, the WorldBank said that nuclear power is too costly <strong>and</strong> risky.Forbes business magazine has called the failure of theU.S. nuclear power program “the largest managerialdisaster in U.S. business history, involving $1 trillionin wasted investment <strong>and</strong> $10 billion in direct losses tostockholders.” And the Economist says, “Not one [nuclearpower plant], anywhere in the world, makescommercial sense.”In recent years, the operating costs of many U.S.nuclear power plants have dropped, mostly because ofless downtime. But environmentalists <strong>and</strong> economistspoint out that the true cost of nuclear power must bebased on the entire nuclear power fuel cycle, notmerely the operating cost of individual plants. Accordingto them, when these costs are included the overallcost of nuclear power is very high (even with hugegovernment subsidies) compared to many other energyalternatives.Partly to address cost concerns, the U.S. nuclearindustry hopes to persuade Congress <strong>and</strong> utility companiesto build hundreds of smaller second-generationplants using st<strong>and</strong>ardized designs, which they claimare safer <strong>and</strong> can be built more quickly (in 3–6 years).These advanced light-water reactors (ALWRs) havebuilt-in passive safety features designed to make explosionsor the release of radioactive emissions almostimpossible. However, according to Nucleonics Week, animportant nuclear industry publication, “Experts areflatly unconvinced that safety has been achieved—oreven substantially increased—by the new designs.” Inaddition, these new designs do not eliminate the threats<strong>and</strong> the expense <strong>and</strong> hazards of long-term radioactivewaste storage <strong>and</strong> power plant decommissioning.Each new plant will cost up to $2 billion. Nuclearpower proponents want Congress to provide the industrywith up to $350 million in taxpayer subsidiesbetween 2004 <strong>and</strong> 2009 for new advanced reactor startupcosts.Is Breeder Nuclear Fission a FeasibleAlternative? A Failed TechnologyBecause of very high costs <strong>and</strong> bad safety experienceswith several nuclear breeder reactors, this technologyhas essentially been ab<strong>and</strong>oned.Some nuclear power proponents urge the development<strong>and</strong> widespread use of breeder nuclear fission reactors,which generate more nuclear fuel than they consumeby converting nonfissionable uranium-238 intofissionable plutonium-239. Because breeders woulduse more than 99% of the uranium in ore deposits, theworld’s known uranium reserves would last at least1,000 years, <strong>and</strong> perhaps several thous<strong>and</strong> years.However, if the safety system of a breeder reactorfails, the reactor could lose some of its liquid sodiumcoolant, which ignites when exposed to air <strong>and</strong> reactsexplosively if it comes into contact with water. Thiscould cause a runaway fission chain reaction <strong>and</strong> perhapsa nuclear explosion powerful enough to blastopen the containment building <strong>and</strong> release a cloud ofhighly radioactive gases <strong>and</strong> particulate matter. Leaksof flammable liquid sodium can also cause fires, whichhave happened with all experimental breeder reactorsbuilt so far.In addition, existing experimental breeder reactorsproduce plutonium so slowly that it would take100–200 years for them to produce enough to fuel asignificant number of other breeder reactors. In 1994,the United States ended government-supported researchfor breeder technology after providing about$9 billion in research <strong>and</strong> development funding.In December 1986, France opened a commercialsizebreeder reactor. It was so expensive to build <strong>and</strong>operate that after spending $13 billion, the governmentspent another $2.75 billion to shut it down per-376 CHAPTER 17 Nonrenewable Energy Resources
manently in 1998. Because of this experience, othercountries have ab<strong>and</strong>oned their plans to build full-sizecommercial breeder reactors.Is Nuclear Fusion a Feasible Alternative?A Costly 50-Year Dream Still at the LaboratoryStageNuclear fusion has a number of advantages, butafter more than five decades of research <strong>and</strong> billionsof dollars in government research <strong>and</strong> developmentsubsidies, this technology is still at the laboratorystage.For decades, scientists have hoped that controlled nuclearfusion will provide an almost limitless source ofhigh-temperature heat <strong>and</strong> electricity to supply mostof the world’s commercial energy. Research has focusedon the D–T nuclear fusion reaction, in whichtwo isotopes of hydrogen—deuterium (D) <strong>and</strong> tritium(T)—fuse at about 100 million °C (180 million °F; Figure3-16, p. 50).According to a 2001 Department of Energy taskforce, fusion energy has a number of important advantages.They include no emissions of conventional airpollutants or carbon dioxide, an almost infinite fuelsupply (water), <strong>and</strong> wastes that are much less radioactiveso they would need to be stored for only about100 years.There would be no risk of meltdown or release oflarge amounts of radioactive materials from a terroristattack <strong>and</strong> little risk from additional proliferation ofnuclear weapons because bomb-grade materials (suchas enriched uranium-235 <strong>and</strong> plutonium-239) are notrequired for fusion energy.Fusion power might also be used to destroy toxicwastes, supply electricity for ordinary use, <strong>and</strong> decomposewater <strong>and</strong> produce the hydrogen gas needed torun a hydrogen economy by the end of this century.This sounds great. So what is holding up fusionenergy? After more than 50 years of research <strong>and</strong>expenditures of more than $25 billion of mostly governmentfunds in the United States, controlled nuclearfusion is still in the laboratory stage. None of the approachestested so far have produced more energythan they use.If researchers can eventually get more energy outof nuclear fusion than they put in, the next step wouldbe to build a small fusion reactor <strong>and</strong> then scale it upto commercial size. This is an extremely difficult engineeringproblem. Also, the estimated cost of building<strong>and</strong> operating a commercial fusion reactor (even withhuge government subsidies) is several times that of acomparable conventional fission reactor.Proponents contend that with greatly increasedfederal funding, a commercial nuclear fusion powerplant might be built by 2030 or perhaps by 2020 withemphasis on developing a new technique calledmuon-catalyzed fusion. However, many experts donot expect nuclear fusion to be a significant energysource until 2100, if then.What Should Be the Future of NuclearPower in the United States? Phase Outor Keep Options OpenThere is disagreement over whether the UnitedStates should phase out nuclear power or keepthis option open in case other alternatives do notpan out.Since 1948, nuclear energy (fission <strong>and</strong> fusion) has receivedabout 58% of all federal energy research <strong>and</strong>development funds in the United States—compared to22% for fossil fuels, 11% for renewable energy, <strong>and</strong> 8%for energy efficiency <strong>and</strong> conservation. Because theresults of such a huge investment of taxpayer dollarsin nuclear power have been disappointing, some analystscall for phasing out all or most government subsides<strong>and</strong> tax breaks for nuclear power <strong>and</strong> using themoney to subsidize <strong>and</strong> accelerate the development ofother, more promising energy technologies.To these analysts, nuclear power is a complex, expensive,inflexible, <strong>and</strong> centralized way to produceelectricity that is too vulnerable to terrorist attack.They believe it is a technology whose time has passedin a world where electricity will increasingly be providedby small, decentralized, easily exp<strong>and</strong>ablepower plants such as natural gas turbines, farmsof wind turbines on l<strong>and</strong> <strong>and</strong> at sea, arrays of solarcells, <strong>and</strong> hydrogen-powered fuel cells. Accordingto investors <strong>and</strong> World Bank economic analysts, conventionalnuclear power simply cannot compete intoday’s increasingly open, decentralized, <strong>and</strong> unregulatedenergy market unless it is artificially shieldedfrom free-market competition by huge governmentsubsidies.Proponents of nuclear power argue that governmentsshould continue funding research <strong>and</strong> development<strong>and</strong> pilot plant testing of smaller <strong>and</strong> potentiallysafer <strong>and</strong> cheaper reactor designs along with breederfission <strong>and</strong> nuclear fusion. They say we need to keepnuclear options available for use in the future if variousrenewable energy options fail to keep up withelectricity dem<strong>and</strong>s <strong>and</strong> reduce CO 2 emissions to acceptablelevels. Germany does not buy these arguments<strong>and</strong> has plans to phase out nuclear power overthe next two decades.xHOW WOULD YOU VOTE? Should nuclear power be phasedout in the country where you live over the next 20 to 30 years?Cast your vote online at http://biology.brookscole.com/miller14.http://biology.brookscole.com/miller14377
Civilization as we know it will not survive unless we can finda way to live without fossil fuels.DAVID GOLDSTEINCRITICAL THINKING1. Just to continue using oil at the current rate (not theprojected higher exponential rate), we must discover <strong>and</strong>add to global oil reserves the equivalent of a new SaudiArabian supply (the world’s largest) every 10 years. Doyou believe this is possible? If not, what effects might thishave on your life <strong>and</strong> on the life of a child or gr<strong>and</strong>childyou might have?2. List five actions you can take to reduce your dependenceon oil <strong>and</strong> gasoline derived from it. Which do youactually plan to do?3. Explain why you are for or against continuing to increaseoil imports in the United States or in the countrywhere you live. If you favor reducing dependence on oilimports, list the three best ways to do this.4. Explain why you agree or disagree with the followingproposals by various energy analysts to help solve U.S.energy problems: (a) find <strong>and</strong> develop more domesticsupplies of oil, (b) place a heavy federal tax on gasoline<strong>and</strong> imported oil to help reduce the waste of oil resources,(c) increase dependence on nuclear power, <strong>and</strong>(d) phase out all nuclear power plants by 2025.5. What do you believe should be done with high-levelradioactive wastes? Explain.6. Would you favor having high-level nuclear wastetransported by truck or train through the area where youlive to a centralized underground storage site? Explain.What are the options?7. Explain why you agree or disagree with each of thefollowing proposals made by the U.S. nuclear power industry:(a) provide at least $100 billion in governmentsubsidies to build a large number of better-designednuclear fission power plants to reduce dependence onimported oil <strong>and</strong> slow global warming, (b) prevent thepublic from participating in hearings on licensing newnuclear power plants <strong>and</strong> on safety issues at the nation’snuclear reactors, (c) restore government subsidies to developa breeder nuclear fission reactor program, <strong>and</strong>(d) greatly increase federal subsidies for developing nuclearfusion.8. Should the United States <strong>and</strong> other developed countriesprovide economic <strong>and</strong> technical aid for closing 35poorly designed <strong>and</strong> poorly operated nuclear reactors insome republics of the former Soviet Union <strong>and</strong> in easternEurope? Explain.9. Congratulations! You are in charge of the world. Listthe three most important features of your policy to developnonrenewable energy resources during the next50 years.PROJECTS1. How is the electricity in your community produced?How has the inflation-adjusted cost of that electricitychanged since 1970?2. Write a two-page scenario of what your life might belike without oil. Compare <strong>and</strong> discuss the scenarios developedby members of your class.3. Use the library or the Internet to find informationabout the accident that took place at the Three Mile Isl<strong>and</strong>(TMI) nuclear power plant near Harrisburg, Pennsylvania,in 1979. According to the nuclear power industry,the TMI accident showed that its safety systems workbecause the accident caused no known deaths. Other analystsargue that the accident was a wake-up call aboutthe potential dangers of nuclear power plants that led totighter <strong>and</strong> better safety regulations. Use the informationyou find to determine which of these positions you support,<strong>and</strong> defend your choice.4. Use the library or the Internet to find bibliographic informationabout Maurice Strong <strong>and</strong> David Goldstein,whose quotes appear at the beginning <strong>and</strong> end of thischapter.5. Make a concept map of this chapter’s major ideas, usingthe section heads, subheads, <strong>and</strong> key terms (in boldface).Look on the website for this book for informationabout making concept maps.LEARNING ONLINEThe website for this book contains study aids <strong>and</strong> manyideas for further reading <strong>and</strong> research. They include achapter summary, review questions for the entire chapter,flash cards for key terms <strong>and</strong> concepts, a multiple-choicepractice quiz, interesting Internet sites, references, <strong>and</strong> aguide for accessing thous<strong>and</strong>s of InfoTrac ® College Editionarticles. Log on tohttp://biology.brookscole.com/miller14Then click on the Chapter-by-Chapter area, choose Chapter17, <strong>and</strong> select a learning resource.378 CHAPTER 17 Nonrenewable Energy Resources
18 <strong>and</strong>Energy EfficiencyRenewable EnergyEnergyCASE STUDYThe Coming Energy-Efficiency<strong>and</strong> Renewable-EnergyRevolutionEnergy analyst Amory Lovins built a large, solarheated, superinsulated, partially earth-sheltered home<strong>and</strong> office in Snowmass, Colorado (Figure 18-1), withseverely cold winter temperatures.This structure also houses the research center forthe Rocky Mountain Institute (cofounded in 1982 byAmory <strong>and</strong> Hunter Lovins), an office used by 45 people.This office–home gets 99% of its space <strong>and</strong> waterheating <strong>and</strong> 95% of its daytime lighting from the sun,<strong>and</strong> uses one-tenth the usual amount of electricity fora structure of its size.With today’s superinsulating windows a housecan have many windows without much heat loss incold weather or heat gain in hot weather. Thinner insulationnow being developed will allow roofs <strong>and</strong>walls to be insulated far better than in today’s bestsuperinsulated houses.A small but growing number of people in developed<strong>and</strong> developing countries get their electricityfrom solar cells that convert sunlight directly into electricity.They can be attached like shingles to a roof,used as roofing, or applied to window glass as a coating.Solar-cell prices are high but falling.According to many scientists <strong>and</strong> executives ofoil <strong>and</strong> automobile companies, we are in the beginningstages of a hydrogen revolution to be phased induring this century as the Age of Oil (Appendix 5)begins winding down (Figure 17-6, p. 353). Becausethere is little hydrogen gas (H 2 )around, we have touse another energy resource to produce it fromwater or various organic compounds such asmethane. We could do this by passing electricityproduced by renewable energy from wind turbines,hydroelectric power plants, solar cells, biomass, <strong>and</strong>geothermal energy from the earth’s interior throughwater to make H 2 gas. Energy-efficient fuel cellscould use the hydrogen to produce electricity to runcars <strong>and</strong> appliances, heat water, <strong>and</strong> heat <strong>and</strong> coolbuildings.Burning hydrogen in a fuel cell by combining itwith oxygen produces water vapor <strong>and</strong> no carbondioxide. Thus shifting to hydrogen as our primarysource of energy would eliminate most air pollution<strong>and</strong> also greatly slow global warming—as long as thehydrogen is produced from water <strong>and</strong> not carboncontainingfossil fuels <strong>and</strong> the nuclear fuel cycle thatemit the greenhouse gas CO 2 into the atmosphere.Robert Millman/Rocky Mountain InstituteFigure 18-1 The RockyMountain Institute inColorado. This facility is ahome <strong>and</strong> a center for thestudy of energy efficiency<strong>and</strong> sustainable use of energy<strong>and</strong> other resources.It is also an example of energy-efficientpassive solardesign.
If the United States wants to save a lot of oil <strong>and</strong> money <strong>and</strong>increase national security, there are two simple ways to do it:Stop driving Petropigs <strong>and</strong> stop living in energy sieves.AMORY B. LOVINSThis chapter evaluates the use of energy efficiency<strong>and</strong> renewable energy as energy alternatives. It addressesthe following questions:■■■■■■■■■How can we improve energy efficiency <strong>and</strong> whatare the advantages of doing so?What are the advantages <strong>and</strong> disadvantages ofusing solar energy to heat buildings <strong>and</strong> water <strong>and</strong>produce electricity?What are the advantages <strong>and</strong> disadvantages ofusing flowing water to produce electricity?What are the advantages <strong>and</strong> disadvantages ofusing wind to produce electricity?What are the advantages <strong>and</strong> disadvantages ofburning plant material (biomass) to heat buildings<strong>and</strong> water, produce electricity, <strong>and</strong> propel vehicles(biofuels)?What are the advantages <strong>and</strong> disadvantages of extractingheat from the earth’s interior (geothermalenergy) <strong>and</strong> using it to heat buildings <strong>and</strong> water<strong>and</strong> to produce electricity?What are the advantages <strong>and</strong> disadvantages ofproducing hydrogen gas <strong>and</strong> burning it to produceelectricity, heat buildings <strong>and</strong> water, <strong>and</strong> propelvehicles?What are the advantages <strong>and</strong> disadvantages ofusing smaller, decentralized micropower sourcesto heat buildings <strong>and</strong> water, produce electricity,<strong>and</strong> propel vehicles?How can we make a transition to a more sustainableenergy future?18-1 THE IMPORTANCE OFIMPROVING ENERGY EFFICIENCYWhat Is Energy Efficiency <strong>and</strong> How MuchEnergy Do We Waste? Saving Money by NotWasting EnergyUsing less energy to do useful work reduces theenvironmental impact of energy use <strong>and</strong> savesmoney.Energy efficiency is a measure of the useful energyproduced by an energy conversion device comparedto the energy that ends up being converted to lowquality,essentially useless heat. For example, the lightproduced by a light bulb is useful energy, while theheat it produces is wasted energy.If you replace an inc<strong>and</strong>escent bulb that is only 5%efficient with a compact fluorescent bulb that is 20%efficient, you get the same amount of light using onefourthas much energy. This reduces pollution <strong>and</strong>carbon dioxide emissions <strong>and</strong> saves money on yourelectric bill—a win-win solution for you <strong>and</strong> the earth.Figure 18-2 lists major economic <strong>and</strong> environmentaladvantages of reducing energy waste.Some critics like to paint proponents of conservingenergy as calling for personal sacrifice, giving up cars,freezing in winter, wearing sweaters, <strong>and</strong> burning upin the summer. This is an incorrect <strong>and</strong> misleadingview of energy conservation, which is implementedmainly by using existing technologies <strong>and</strong> developingnew ones that waste less energy.You may be surprised to learn that about 84% ofall commercial energy used in the United States iswasted (Figure 18-3). About 41% of the energy used iswasted automatically because of the degradation ofenergy quality imposed by the second law of thermodynamics.But about 43% of the energy used in theUnited States is wasted unnecessarily, mostly by usingfuel-wasting motor vehicles, furnaces, <strong>and</strong> other devices<strong>and</strong> living <strong>and</strong> working in leaky, poorly insulated,poorly designed buildings. See the Guest Essayon this topic by Amory Lovins on the website for thischapter. The U.S. Department of Energy (DOE) estimatesthat the United States unnecessarily wastes asmuch energy as two-thirds of the world’s populationconsumes.SolutionsReducing Energy WasteProlongs fossil fuel suppliesReduces oil importsVery high net energyLow costReduces pollution <strong>and</strong>environmental degradationBuys time to phase in renewableenergyLess need for military protection ofMiddle East oil resourcesImproves local economy byreducing flow of money out to payfor energyCreates local jobsFigure 18-2 Solutions: advantages of reducing energy waste.Global improvements in energy efficiency could save the worldabout $1 trillion per year—an average of $114 million per hour!380 CHAPTER 18 Energy Efficiency <strong>and</strong> Renewable Energy
Energy Inputs System Outputs86%8%3%3%Nonrenewable fossil fuelsNonrenewable nuclearHydropower, geothermal,wind, solarBiomassU.S.economy<strong>and</strong>lifestyles9%7%41%43%Useful energyPetrochemicalsUnavoidable energywasteUnnecessary energywasteIndex of energy use per capita <strong>and</strong>per dollar of GDP (Index:1970=1)1.41.21.00.80.60.40.2HistoryYearProjectionsEnergy useper capitaEnergy useper dollarof GDP01970 1980 1990 2000 2010Figure 18-4 Good news. Energy use per person neededto produce a dollar of the U.S. gross domestic product,1970–2003 with projections to 2025 (Index: 1970 1).However, energy use per capita is rising. (U. S. Departmentof Energy)2025Figure 18-3 Flow of commercial energy through the U.S. economy.Note that only 16% of all commercial energy used in theUnited States ends up performing useful tasks or being convertedto petrochemicals; the rest is unavoidably wasted becauseof the second law of thermodynamics (41%) or is wastedunnecessarily (43%).H 2 OH 2 O 2KOHWe can save energy <strong>and</strong> money by buying moreenergy-efficient cars, lighting, heating systems, waterheaters, air conditioners, <strong>and</strong> appliances. Some energy-efficientmodels may cost more initially, but in thelong run they usually save money by having a lowerlife cycle cost: initial cost plus lifetime operating costs.Good news. In the United States, the amount of energyused per person to produce a dollar of gross domesticproduct declined sharply between 1970 <strong>and</strong>2003 <strong>and</strong> is projected to continue dropping through2025.(Figure 18-4). Such improvements in energy efficiencyhave cut U.S. energy bills by $275 billion a year.Bad news. Unnecessary energy waste still costs theUnited States about $300 billion per year—an averageof $570,000 per minute.The energy conversion devices we use vary in theirenergy efficiencies (Figure 18-5). Four widely used deviceswaste large amounts of energy. One is the inc<strong>and</strong>escentlight bulb, which wastes 95% of its energy inputof electricity. In other words, it is a heat bulb. The secondis a nuclear power plant producing electricity forspace heating or water heating. Such a plant wastesabout 86% of the energy in its nuclear fuel <strong>and</strong> probably92% when we include the energy needed to dealwith its radioactive wastes for thous<strong>and</strong>s of years <strong>and</strong>to retire the plant. Third is a motor vehicle with anFuel cell45–65%Fluorescent light22%Steam turbine45%Internal combustionengine(gasoline) 20–25%Human body20–25%Inc<strong>and</strong>escent light5%Figure 18-5 Energy efficiency of some common energy conversiondevices.internal combustion engine, which wastes 75–80% of theenergy in its fuel.The fourth is a coal-burning power plant, in whichtwo-thirds of the energy released by burning coalends up as waste heat in the environment. Energy expertscall for us to replace these four energy-wastinghttp://biology.brookscole.com/miller14381
technologies or greatly improve their energy efficiencyover the next few decades.What Is Net Energy Efficiency? HonestEnergy AccountingNet energy efficiency is a measure of how muchuseful energy we get from an energy resourceafter subtracting the energy used <strong>and</strong> wastedin making the energy available.Recall that the only energy that really counts is netenergy (p. 354). The net energy efficiency of a systemused to heat your house, for example, is determined bythe efficiency of each step in the energy conversion forthe entire system.Figure 18-6 shows the net energy efficiency forheating two well-insulated homes. One is heated withelectricity produced at a nuclear power plant, transportedby wire to the home, <strong>and</strong> converted to heat (electricresistance heating). The other is heated passively:direct solar energy enters through high-efficiency windowsfacing the sun <strong>and</strong> strikes heat-absorbing materialsthat store the heat for slow release.This analysis shows that converting the high-qualityenergy in nuclear fuel to high-quality heat at severalthous<strong>and</strong> degrees in the power plant, converting thisheat to high-quality electricity, transmitting the electricityto users, <strong>and</strong> using the electricity to provide lowqualityheat for warming a house to only about 20°C(68°F) is very wasteful of high-quality energy. Althoughthe last step of using the incoming electricity toproduce heat is 100% efficient, the numerous stepsneeded to get the electricity to the house waste enormousamounts of energy. Burning coal or any fossil fuelat a power plant to supply electricity <strong>and</strong> transmitting itlong distances to heat water or space is also inefficient.This example illustrates two general principles forsaving energy. First, keep the number of steps in an energyconversion process as low as possible. Each time we convertenergy from one form to another or transmit it,some useful energy is almost always lost. Second,strive to have the highest possible energy efficiency for eachstep in an energy conversion process.18-2 WAYS TO IMPROVE ENERGYEFFICIENCYHow Can We Save Energy in Industry?Cogenerate, Buy New Motors, <strong>and</strong> UseEfficient LightingIndustries can save energy <strong>and</strong> money by producingboth heat <strong>and</strong> electricity from an energy source<strong>and</strong> by using energy-efficient electric motors <strong>and</strong>lighting.Some industries save energy <strong>and</strong> money by using cogeneration,or combined heat <strong>and</strong> power (CHP) systems.In such a system two useful forms of energy (such assteam <strong>and</strong> electricity) are produced from the same fuelUraniummining(95%)Uranium processing<strong>and</strong> transportation(57%)Powerplant(31%)Transmissionof electricity(85%)Resistanceheating(100%)Uranium100%95%54%17% 14% 14%WasteheatWasteheatWasteheatWasteheatElectricity from Nuclear Power PlantSunlight100%Passive SolarWindowtransmission(90%)Wasteheat90%Figure 18-6 Comparison of net energy efficiency for two types ofspace heating. The cumulative net efficiency is obtained by multiplyingthe percentage shown inside the circle before each step bythe energy efficiency for that step (shown in parentheses). So100 0.95 95%; 95 0.57 54%; <strong>and</strong> so on. Because of thesecond law of thermodynamics, in most cases the greater thenumber of steps in an energy conversion process, the lower its netenergy efficiency. About 86% of the energy used to provide spaceheating by electricity produced at a nuclear power plant iswasted. If the additional energy needed to deal with nuclearwastes <strong>and</strong> to retire highly radioactive nuclear plants after theiruseful life is included, then the net energy yield for a nuclear plantis only about 8% (or 92% waste). By contrast, with passive solarheating, only about 10% of incoming solar energy is wasted.382 CHAPTER 18 Energy Efficiency <strong>and</strong> Renewable Energy
source. These systems have an energy efficiency of80–90% (compared to about 30–40% for coal-fired boilers<strong>and</strong> nuclear power plants) <strong>and</strong> emit two-thirds lessCO 2 per unit of energy produced than conventionalcoal-fired boilers do.Cogeneration has been widely used in westernEurope for years. Its use in the United States (where itnow produces 9% of the country’s electricity) <strong>and</strong>China is growing.Another way to save energy <strong>and</strong> money in industryis to replace energy-wasting electric motors, which consumeabout one-fourth of the electricity produced inthe United States. Most of these motors are inefficientbecause they run only at full speed with their outputthrottled to match the task—somewhat like driving acar fast with your foot on the brake pedal. Each year aheavily used electric motor consumes 10 times its purchasecost in electricity—equivalent to using $200,000worth of gasoline each year to fuel a $20,000 car! Thecosts of replacing such motors with new adjustablespeeddrive motors would be paid back in about 1 year<strong>and</strong> save an amount of energy equal to that generatedby 150 large (1,000-megawatt) power plants.A third way to save energy is to switch from lowefficiencyinc<strong>and</strong>escent lighting to higher-efficiency fluorescentlighting.Average fuel economy(miles per gallon, or mpg)30252015101970 1975 1980 1985 1990 1995 2000 2005Model yearCarsBothPickups, vans, <strong>and</strong>sport utility vehiclesFigure 18-7 Average fuel economy of new vehicles sold in theUnited States, 1975–2004. The largest <strong>and</strong> most inefficient vehicles,like the Hummer, are not covered by fuel economy regulations.(U.S. <strong>Environmental</strong> Protection Agency <strong>and</strong> NationalHighway Traffic Safety Administration)Dollars per gallon (in 1993 dollars)2.22.01.81.61.41.21.00.819201930194019501960Year19701980199020002010Figure 18-8 Real price of gasoline (in 1993 dollars) in theUnited States, 1920–2004. The 225 million motor vehicles in theUnited States use about 40% of the world’s gasoline. Gasolineis one of the cheapest items American consumers buy <strong>and</strong>costs less per liter than bottled water. (U.S. Department ofEnergy)How Can We Save Energy in Transportation?Replace Gas Guzzlers with Gas SippersThe best way to save energy in transportationis to increase the fuel efficiency of motor vehicles.Good news. Between 1973 <strong>and</strong> 1985, the average fuel efficiencyrose sharply for new cars sold in the UnitedStates <strong>and</strong> to a lesser degree for pickup trucks, minivans,<strong>and</strong> sport utility vehicles (SUVs) (Figure 18-7).This occurred primarily because of government-m<strong>and</strong>atedCorporate Average Fuel Economy (CAFE) st<strong>and</strong>ards.Bad news. Between 1985 <strong>and</strong> 2004, the averagefuel efficiency for new passenger cars sold in theUnited States leveled off or declined slightly.Fuel-efficient cars are available, but account forless than 1% of all car sales. One reason is that the inflation-adjustedprice of gasoline today in the UnitedStates is low (Figure 18-8 <strong>and</strong> Connections, p. 384). Asecond reason is that two-thirds of U.S. consumers preferSUVs, pickup trucks, minivans, <strong>and</strong> other large, inefficientvehicles. A third reason is the failure of electedofficials to raise CAFE st<strong>and</strong>ards since 1985 because ofopposition from automakers <strong>and</strong> oil companies.Suppose that Congress required the average motorvehicle in the United States to get 17 kilometers perliter (kpl) [40 miles per gallon (mpg)] within 10 years.According to energy analysts, this would cut gasolineconsumption in half, save more than three times theamount of oil in the nation’s current proven oil reserves,<strong>and</strong> also save more than enough oil to eliminateall current oil imports to the United States from theMiddle East. In 2003, China announced plans to imposemuch stricter fuel-efficiency st<strong>and</strong>ards than theUnited States. The goals are (1) to enourage car companiesto develop hybrid, fuel cell, <strong>and</strong> other fuel-savingvehicles, (2) reduce the country’s dependence on oilimports, <strong>and</strong> (3) reduce carbon dioxide emissions.http://biology.brookscole.com/miller14383
The Real Cost of Gasoline in the United StatesEconomists <strong>and</strong>environmentalistspoint out thatgasoline costs U.S.CONNECTIONS consumers muchmore than it appears.This is because the real costof gasoline is not paid directly atthe pump.According to a 1998 study bythe International Center forTechnology Assessment, thehidden costs of gasoline to U.S.consumers is about $1.30–3.70 perliter ($5–14 per gallon), dependingon how the costs are estimated.These hidden costs include thefollowing:■ Government subsidies <strong>and</strong> taxbreaks for oil companies <strong>and</strong> roadbuilders.■Pollution cleanup.■ Military protection of oil suppliesin the Middle East (at least $30billion a year not including the IraqWar).■ <strong>Environmental</strong>, health, <strong>and</strong> socialcosts such as increased medical bills<strong>and</strong> insurance premiums, timewasted in traffic jams, noise pollution,increased mortality from air<strong>and</strong> water pollution, urban sprawl,<strong>and</strong> harmful effects on wildlifespecies <strong>and</strong> habitats.Economists point out that ifthese harmful costs were includedas taxes in the market price of gasoline,we would have much more energy-efficient<strong>and</strong> less pollutingcars. However, gasoline <strong>and</strong> carcompanies benefit financially bybeing able to pass these hiddencosts on to consumers <strong>and</strong> futuregenerations.This is basically an education<strong>and</strong> political problem. Most consumersare unaware that they arepaying these harmful costs <strong>and</strong> donot connect them with gasoline use.Also, politicians running on a platformof raising gasoline prices inthe United States 3–11-fold wouldbe committing political suicide.Critical ThinkingSome economists have suggestedthat U.S. consumers might be willingto pay much more for gasoline if(1) they understood they are alreadypaying these hidden costs indirectly<strong>and</strong> (2) the tax revenuesfrom gasoline sales were used to reducetaxes on wages, income, <strong>and</strong>wealth <strong>and</strong> provide a safety net forlow- <strong>and</strong> middle-class consumers.Would you support or oppose sucha proposal? Explain.xHOW WOULD YOU VOTE? Should the government greatlyincrease fuel efficiency st<strong>and</strong>ards for all vehicles in the UnitedStates or the country where you live? Cast your vote online athttp://biology.brookscole.com/miller14.Are Hybrid-Electric Vehicles the Answer?A New OptionFuel-efficient hybrid-electric vehicles are poweredby a battery <strong>and</strong> a small internal combustion enginethat recharges the battery.There is rapidly growing interest in developing superefficientcars that could eventually get 34–128 kpl(80–300 mpg). This concept was pioneered <strong>and</strong> developedin detail in the 1980s by physicist Amory Lovins.See his Guest Essay on the website for this chapter.One type of energy-efficient car uses a hybrid-electricinternal combustion engine. It runs on gasoline,diesel fuel, or natural gas <strong>and</strong> uses a small battery(recharged by the internal combustion engine) to providethe energy needed for acceleration <strong>and</strong> hill climbing(Figure 18-9).Toyota introduced its first hybrid vehicle in 1997<strong>and</strong> Honda <strong>and</strong> Nissan have been selling several modelsof hybrid vehicles in the United States since 2000.Carmakers plan to introduce at least 20 hybrid models,including cars, trucks, SUVs, <strong>and</strong> vans, in the next 4–5years. In 2004 Toyota (Lexus) <strong>and</strong> Ford (its Escapemodel) began selling hybrid SUVs with the fuel efficiencyof a compact car.Toyota has a strong lead in developing such vehiclesbut in 2003 General Motors announced it wouldhave the manufacturing capability to build as many as1 million hybrid cars, trucks, <strong>and</strong> SUVs by 2006. Salesof hybrid motor vehicles are projected to grow rapidly<strong>and</strong> probably dominate motor vehicle sales between2010 <strong>and</strong> 2030.Some people buy trucks or SUVs because they believethey are safer than midsize automobiles. Butsafety studies reveal that SUVs <strong>and</strong> pickups are moredangerous to people in them <strong>and</strong> to those in vehiclesthey may run into than most midsize <strong>and</strong> large automobiles.And they are no safer than some models ofcompact cars. The main reason is that SUVs <strong>and</strong> trucksare taller <strong>and</strong> heavier than most other vehicles. Thismakes them more likely to roll over <strong>and</strong> harder to controlin emergency stops.Are Fuel-Cell Cars the Answer? Possible Starof the FutureAutomakers are developing fuel-efficient carspowered by fuel cells running on hydrogen <strong>and</strong>producing little pollution.384 CHAPTER 18 Energy Efficiency <strong>and</strong> Renewable Energy
ABCombustion engine:Small, efficient internalcombustion enginepowers vehicle withlow emissions.Fuel tank:Liquid fuel such asgasoline, diesel, orethanol runssmall combustionengine.BDEFuelElectricityCCDEElectric motor:Traction drive providesadditional power,recovers braking energyto recharge battery.Battery bank:High-density batteriespower electric motorfor increased power.Regulator:Controls flow ofpower between electricmotor <strong>and</strong> battery bank.FFATransmission:Efficient 5-speedautomatictransmission.Figure 18-9 Solutions: general features of a car powered by a hybridgas–electric engine. A small internal combustion engine recharges thebatteries, thus reducing the need for heavy banks of batteries <strong>and</strong> solvingthe problem of the limited range of conventional electric cars. The bodiesof future models will probably be made of lightweight composite plasticsthat offer more protection in crashes, do not need to be painted, do notrust, can be recycled, <strong>and</strong> have fewer parts than conventional car bodies.(Concept information from DaimlerChrysler, Ford, Honda, <strong>and</strong> Toyota)Another type of superefficient car is an electric vehiclethat uses a fuel cell—a device that combineshydrogen gas (H 2 ) <strong>and</strong> oxygen gas (O 2 ) fuel to produceelectricity <strong>and</strong> water vapor (2 H 2 O 2 2H 2 O)(Figure 18-10).Fuel cells are at least twice as efficient as internalcombustion engines, have no moving parts, require littlemaintenance, <strong>and</strong> produce little or no pollution dependingon how their hydrogen fuel is produced.Most major automobile companies have developedprototype fuel-cell cars. They hope to have a variety ofaffordable fuel-cell vehicles on the market by 2020(with a few models available by 2010) <strong>and</strong> greatly increasetheir use by 2050. Until then hybrids will probablyhave an advantage because they are available now<strong>and</strong> get their fuel from regular filling stations insteadof having to depend on building a new network of hydrogenfilling stations.In 2001, Bill Ford, gr<strong>and</strong>son of Henry Ford <strong>and</strong>chairman of the Ford Motor Company, said, “I believeAnode (-)CatalystCathode (+)1 Cell splits H 2 into protons<strong>and</strong> electrons. Protons flowacross catalyst membrane.2 React with oxygen (O 2 ).3 Produce electricalenergy (flow ofelectrons) topower car.4 Emits water(H 2 O) vapor.4Anode (-)21H 2CatalystHydrogen gasCathode (+)3O 2ABFuel cell stack:Hydrogen <strong>and</strong> oxygencombine chemically toproduce electricity.Fuel tank:Hydrogen gas or liquidor solid metal hydridestored on board or madefrom gasoline or methanol.CDETurbo compressor:Sends pressurized airto fuel cell.Traction inverter:Module converts DCelectricity from fuel cell toAC for use in electric motor.Electric motor / transaxle:Converts electrical energyto mechanical energy toturn wheels.H 2 OBDCFigure 18-10 Solutions: general features of an electric carpowered by a fuel cell running on hydrogen gas. The hydrogencan be produced from natural gas, gasified coal, or methanol,or by using renewable energy sources such as wind turbines orsolar cells to produce electricity needed to decompose waterinto hydrogen <strong>and</strong> oxygen gas. Prototype models are on theroad now <strong>and</strong> manufacturers hope to have some models ofsuch cars on the market within a decade. (Concept informationfrom DaimlerChrysler, Ford, Ballard, Toyota, <strong>and</strong> Honda)FuelElectricityAEhttp://biology.brookscole.com/miller14385
Fuel-cell stackConverts hydrogenfuel into electricityAir systemmanagementBody attachmentsMechanical locks that securethe body to the chassisUniversal docking connectionConnects the chassis with thedrive-by-wire system in the bodyRear crush zoneAbsorbs crash energyDrive-by-wiresystem controlsCabin heating unitSide mounted radiatorsRelease heat generated by the fuel cell,vehicle electronics, <strong>and</strong> wheel motorsFront crush zoneAbsorbs crash energyHydrogenfuel tanksElectric wheel motorsProvide four-wheel drive;have built-in brakesFigure 18-11 Prototype Hy-Wire car of the future developed by General Motors. It combines a hydrogen fuelcell with drive-by-wire technology. It consists of a skateboard-like chassis <strong>and</strong> a variety of snap-on bodies. Thecompany claims the car could be on the road within a decade but some analysts believe that it will be2020–2030 before a variety of such cars from various manufacturers will be mass produced. (Basic informationfrom General Motors)fuel cells will finally end the 100-year reign of the internalcombustion engine.”In 2002, General Motors developed a prototype ofthe hydrogen-fuel car of the future (Figure 18-11). ThisHy-Wire (for hydrogen-by-wire) car h<strong>and</strong>les like ahigh-speed sports car, zips along with no engine noise,<strong>and</strong> emits only wisps of warm water vapor <strong>and</strong> heat—no smelly exhaust, no smog, no greenhouse gases.The heart of this car is a thin flat aluminum chassisthat looks like a skateboard. It houses a stack of fuelcells, hydrogen fuel tanks, electronic controls, <strong>and</strong>wheels with built-in electric motors <strong>and</strong> brakes. Such acar should have a fuel efficiency equivalent of morethan 43 kpl (100 mpg).The car’s fiberglass body plugs into the chassismuch like a laptop computer connects to a dockingstation. The chassis can come in compact, medium,<strong>and</strong> large sizes for different models.The car would be refueled by a network of hydrogengas stations or perhaps by a fuel-cell system inyour garage or workplace that produces hydrogenfrom natural gas <strong>and</strong> also provides electricity, heating,<strong>and</strong> air conditioning for your home or workplace.At first these cars will be expensive, but pricesshould come down from increased mass production.General Motors says that because these hydrogenpoweredfuel-cell vehicles have so few componentsthey will eventually be cheaper (<strong>and</strong> safer) than vehicleswith internal combustion engines.General Motors hopes to be selling such carswithin a decade. Many analysts believe it will bearound 2020–2030 before a large number of affordablefuel cell cars will be available but this depends on howrapidly new innovations in this emerging technologycan be developed. Stay tuned.How Can We Design Buildings to SaveEnergy? Work with NatureWe can save energy in buildings by getting heatfrom the sun, superinsulating them, <strong>and</strong> using plantcoveredecoroofs.386 CHAPTER 18 Energy Efficiency <strong>and</strong> Renewable Energy
Atlanta’s 13-story Georgia Power Company buildinguses 60% less energy than conventional office buildingsof the same size. The largest surface of the buildingfaces south to capture solar energy. Each floorextends out over the one below it, which blocks out thehigher summer sun to reduce air conditioning costsbut allows warming by the lower winter sun. Energyefficientlights focus on desks rather than illuminatingentire rooms. In contrast the conventional Sears Towerbuilding in Chicago consumes more energy in a daythan does a city of 150,000 people.Green architecture is beginning to catch on in Europe,the United States, <strong>and</strong> Japan. In the Netherl<strong>and</strong>s,the ING Bank built an energy-efficient headquartersthat cost no more than a conventional building butuses 92% less energy. This saves the bank $2.9 million ayear.Since 2001 the U.S. Green Building Council hascertified 89 office or apartment buildings, condos,manufacturing plants, convention centers, schools, libraries,<strong>and</strong> college buildings (such as the environmentalstudies building at the University of Californiaat Santa Barbara) as meeting strict environmental designst<strong>and</strong>ards. More than 1,000 other buildings haveapplied for the council’s sought-after seal of approval.In 2000 the 4,000-member Green Building Council’sLeadership in Energy <strong>and</strong> <strong>Environmental</strong> Designprogram (LEED) established building st<strong>and</strong>ards <strong>and</strong> asilver, gold, <strong>and</strong> platinum scoring system that is used byan increasing number of architects, developers, <strong>and</strong>elected officials across the United States. In 2004, thetwo buildings with the most platinum points were theNational Resources Defense Council’s three-story officebuilding in Santa Monica, California, <strong>and</strong> the AudubonSociety’s office building in Los Angeles, California. Themayors of New York City <strong>and</strong> Chicago have vowed toR-60 or higher insulationSmall or no north-facingwindows or superwindowsR-30 toR-43 insulationHouse nearly airtightAir-to-airheat exchangerR-30 toR-43 insulationInsulated glass,triple-paned orsuperwindows(passive solar gain)R-30 to R-43insulationFigure 18-12 Solutions: major features of a superinsulatedhouse. Such a house is so heavily insulated <strong>and</strong> so airtight thatheat from direct sunlight, appliances, <strong>and</strong> human bodies canwarm it with little or no need for a backup heating system. Anair-to-air heat exchanger prevents buildup of indoor air pollution.make their cities the greenest in the United States. Haveyou considered a career in green architecture?Another energy-efficient design is a superinsulatedhouse (Figure 18-12). Such houses typically cost 5%more to build than conventional houses of the samesize. But this extra cost is paid back by energy savingswithin about 5 years <strong>and</strong> can save a homeowner$50,000–100,000 over a 40-year period. Superinsulatedhouses in Sweden use 90% less energy for heating <strong>and</strong>cooling that the typical American home.Since the mid-1980s there has been growing interestin building superinsulated houses called strawbalehouses (Figure 18-13). The walls are made by stackingAlison GannettAlison GannettFigure 18-13 Solutions: energy-efficient, environmentally healthy, <strong>and</strong> affordable Victorianstylestrawbale house designed <strong>and</strong> built by Alison Gannett in Crested Butte, Colorado. Theleft photo was taken during construction, <strong>and</strong> the right photo shows the completed house.Depending on the thickness of the bales, plastered strawbale walls have an insulating valueof R-35 to R-60, compared to R-12 to R-19 in a conventional house.(The R-value is a measureof resistance to heat flow.) Such houses are also great sound insulators.http://biology.brookscole.com/miller14387
compacted bales of low-cost straw <strong>and</strong> then coveringthe bales on the outside <strong>and</strong> inside with plaster oradobe. The main problem is getting banks <strong>and</strong> othermoneylenders to recognize the potential of this <strong>and</strong>other unconventional types of housing <strong>and</strong> to providehomeowners with construction loans. (See theGuest Essay about strawbale <strong>and</strong> solar energy housesby Nancy Wicks on the website for this chapter.)Ecoroofs or green roofs covered with plants havebeen used in Germany, in other parts of Europe, <strong>and</strong> inIcel<strong>and</strong> for decades. With proper design, these plantcoveredroof gardens provide good insulation, absorbstorm water <strong>and</strong> release it slowly, outlast conventionalroofs, <strong>and</strong> make a building or home more energy efficient.Designing <strong>and</strong> installing such systems could bean interesting career.How Can We Save Energy in ExistingBuildings? Stop Leaks <strong>and</strong> Use Energy-Efficient DevicesWe can save energy in existing buildings byinsulating them, plugging leaks, <strong>and</strong> using energyefficientheating <strong>and</strong> cooling systems, appliances,<strong>and</strong> lighting.Here are some ways to save energy in existingbuildings.■ Insulate <strong>and</strong> plug leaks. About one-third of heated airin U.S. homes <strong>and</strong> buildings escapes through closedwindows <strong>and</strong> holes <strong>and</strong> cracks (Figure 18-14)—roughly equal to the energy in all the oil flowingthrough the Alaska pipeline every year. During hotweather these windows <strong>and</strong> cracks also let heat in, increasingthe use of air conditioning. Although not verysexy, adding insulation <strong>and</strong> plugging leaks in a houseare two of the quickest, cheapest, <strong>and</strong> best ways tosave energy <strong>and</strong> money.■ Use energy-efficient windows. Replacing all windowsin the United States with low-E (low-emissivity) windowswould cut expensive heat losses from houses bytwo-thirds <strong>and</strong> reduce CO 2 emissions. Widely availablesuperinsulating windows insulate as well as 8–12sheets of glass. Although they cost 10–15% more th<strong>and</strong>ouble-glazed windows, this cost is paid back rapidlyby the energy they save. Even better windows willreach the market soon.■ Stop other heating <strong>and</strong> cooling losses. Leaky heating<strong>and</strong> cooling ducts in attics <strong>and</strong> unheated basementsallow 20–30% of a home’s heating <strong>and</strong> cooling energyto escape <strong>and</strong> draw unwanted moisture <strong>and</strong> heat intothe home. Careful sealing can reduce this loss. Somedesigns for new homes keep the ducts inside thehome’s thermal envelope so that escaping hot or coolair feeds back into the living space.■ Heat houses more efficiently (Figure 18-15). In order,the most energy-efficient ways to heat a space are:superinsulation, a geothermal heat pump, passivesolar heating, a conventional heat pump (in warmclimates only), small cogenerating microturbines, <strong>and</strong>a high-efficiency (85–98%) natural gas furnace. Themost wasteful <strong>and</strong> expensive way is to use electricresistance heating with the electricity produced by acoal-fired or nuclear power plant (Figure 18-6). InGermany <strong>and</strong> the United States there is increasing useVANSCAN ® Continuous Mobile Thermogram by Daedalus Enterprises, Inc.Figure 18-14 An infrared photo (thermogram) showing heat loss (red, white, <strong>and</strong> orange) around the windows,doors, roofs, <strong>and</strong> foundations of houses <strong>and</strong> stores in Plymouth, Michigan. Many homes <strong>and</strong> buildings in theUnited States <strong>and</strong> in most other countries are so full of leaks that their heat loss in cold weather <strong>and</strong> heat gainin hot weather are equivalent to having a large window-sized hole in the wall of the house.388 CHAPTER 18 Energy Efficiency <strong>and</strong> Renewable Energy
Net Energy EfficiencySuperinsulated house (100% of heat R-43)98%Geothermal heat pumps (100% of heat <strong>and</strong> cooling)96%Passive solar (100% of heat)Passive solar (50% of heat) plus highefficiencynatural gas furnace (50% of heat)Natural gas with high-efficiency furnaceElectric resistance heating (electricityfrom hydroelectric power plant)90%87%84%82%Natural gas with typical furnacePasssive solar (50% of heat) plus highefficiencywood stove (50% of heat)65%70%Oil furnaceElectric heat pump (electricityfrom coal-fired power plant)50%53%High-efficiency wood stoveActive solarElectric heat pump (electricityfrom nuclear plant)39%35%30%Typical wood stoveElectric resistance heating (electricityfrom coal-fired power plant)Electric resistance heating (electricityfrom nuclear plant)14%26%25%Figure 18-15 Solutions: ways to heat an enclosed space such as a house, ranked by net energy efficiency.(Data from Howard T. Odum)SummersunHeat to house(radiators orforced air duct)WintersunSuperwindowSuperwindowHeavyinsulationHotwatertankPumpSuperwindowStone floor <strong>and</strong> wallfor heat storageHeatexchangerPASSIVEACTIVEFigure 18-16 Solutions: passive <strong>and</strong> active solar heating for a home.http://biology.brookscole.com/miller14389
of cogeneration units or microturbines about the size ofarefrigerator. They run on natural gas or liquefied petroleumgas (LPG) to produce heat <strong>and</strong> electricity forbusinesses, small apartment buildings, neighborhoodgroups of four or five energy-efficient houses, <strong>and</strong>small government facilities such as police stations. In6–8 years, they pay for themselves in saved fuel <strong>and</strong>electricity.■ Heat water more efficiently. One way to do thisis to use a tankless instant water heater (about the sizeof a small suitcase) fired by natural gas or LPG butnot by electricity. These devices, widely used in manyparts of Europe, heat water instantly as it flowsthrough a small burner chamber, provide hot wateronly when it is needed, <strong>and</strong> cost 30–50% less to heatwater than traditional heaters.* They cost 2–4 timesmore than conventional water heaters, but savemoney because they last 3–4 times longer <strong>and</strong> costless to operate than conventional tank heaters.A well-insulated, conventional natural gas orLPG water heater is also fairly efficient. But all conventionalnatural gas <strong>and</strong> electric resistance heaterswaste energy by keeping a large tank of water hot allday <strong>and</strong> night <strong>and</strong> can run out after a long shower ortwo—like running your car all night until you drive it.■ Use energy-efficient appliances.** Since 1978 theDepartment of Energy (DOE) has set federal energyefficiencyst<strong>and</strong>ards for more than 20 appliances usedin the United States, <strong>and</strong> similar programs exist in43 other countries. A 2001 study by the NationalAcademy of Sciences found that between 1978 <strong>and</strong>2000, the $7 billion spent by the DOE on this programsaved consumers more than $30 billion in energy costs<strong>and</strong> provided environmental benefits valued conservativelyat $60–80 billion.If all households in the United States used themost efficient frost-free refrigerator now available,18 large (1,000-megawatt) power plants could close.Microwave ovens can cut electricity use for cookingby 25–50% (but not if used for defrosting food).Clothes dryers with moisture sensors cut energy useby 15%, <strong>and</strong> front-loading washers use 50% less energythan top-loading models but cost about the same.■ Use energy-efficient lighting. Americans spend abouta quarter of their electricity budget on lighting. But*They work very well. I used them in a passive solar office <strong>and</strong>living space for 15 years. Models are available for $500–1,000from companies such as Rinnai, Bosch, Takagi, <strong>and</strong> Envirotech.For information visit http://foreverhotwater.com.**Each year the American Council for an Energy-EfficientEconomy (ACEEE) publishes a list of the most energy-efficientmajor appliances mass-produced for the U.S. market. A copycan be obtained from the council at 1001 Connecticut AvenueNW, Suite 801, Washington, DC 20036, or on its website athttp://www.aceee.org/consumerguide/index.htm.many do not realize that they could cut these costs30–60% by replacing energy-wasting inc<strong>and</strong>escentbulbs <strong>and</strong> halogen torchiere bulbs (which because oftheir high heat output have caused fires <strong>and</strong> increasedair conditioning costs) with much more efficientfluorescent bulbs. They cost $5–10 but last6–10 times longer than an inc<strong>and</strong>escent <strong>and</strong> pay forthemselves in a year or two. Three-way <strong>and</strong> dimmableversions are now available (see http://www.tcpi.com). Replacing 25 inc<strong>and</strong>escent bulbs in a house orbuilding with energy-efficient fluorescent bulbs typicallysaves about $1,125. What a great investmentpayoff.Students in Brown University’s environmentalstudies program showed that the school could savemore than $40,000 per year just by replacing the inc<strong>and</strong>escentlight bulbs in exit signs with compactfluorescent bulbs. What is your school doing to saveelectricity <strong>and</strong> money in lighting?However, these <strong>and</strong> other fluorescent bulbscontain toxic mercury than when discarded cancontaminate l<strong>and</strong>fills <strong>and</strong> groundwater or get into theatmosphere if incinerated. A Florida company collectsused bulbs <strong>and</strong> extracts the toxic mercury for reuse.Within the next two decades, both inc<strong>and</strong>escent<strong>and</strong> fluorescent bulbs may be replaced by even moreefficient white-light LEDs (light-emitting diodes) <strong>and</strong>organic LEDs (OLEDs). Westinghouse is selling a 20-watt LED bulb with a light output equal to a 100-wattinc<strong>and</strong>escent bulb. It costs $40, but saves money becauseit lasts 80 times longer than inc<strong>and</strong>escents (seehttp://westinghouselighting.com).■ Cut off electrical devices when not using them. Cuttingoff lights, computers, TVs, <strong>and</strong> other applianceswhen they are not needed <strong>and</strong> cutting off their instant-onfeature can make a big difference in energyuse <strong>and</strong> bills. At 9 P.M. one weekday evening, majorTV stations in Bangkok, Thail<strong>and</strong>, cooperated withthe government in showing a dial that gave the city’scurrent use of electricity. Viewers were asked to turnoff unnecessary lights <strong>and</strong> appliances. They thenwatched the dial register a 735-megawatt drop inelectricity use—a decrease equal to the output of twomedium-sized coal-burning power plants. This visualexperience showed individuals that reducing theirunnecessary electricity use could cut their bills <strong>and</strong>close down power plants.■ Set strict energy-efficiency st<strong>and</strong>ards for new buildings.Building codes could require new houses use 60–80%less energy than conventional houses of the same size,as has been done in Davis, California. Because oftough national energy-efficiency st<strong>and</strong>ards, the averagehome in Sweden consumes about one-third asmuch energy as the average American home of thesame size.390 CHAPTER 18 Energy Efficiency <strong>and</strong> Renewable Energy
Why Are We Still Wasting So Much Energy?We Get What We RewardLow-priced oil <strong>and</strong> gasoline <strong>and</strong> lack of governmenttax breaks for saving energy promote energywaste.With such an impressive array of benefits (Figure 18-2),why is there so little emphasis on improving energyefficiency? One reason is a glut of low-cost oil <strong>and</strong> gasoline.As long as energy is artificially cheap because itsmarket price does not include its harmful costs (Connections,p. 384), people are more likely to waste it <strong>and</strong>not make investments in improving energy efficiency.Another reason is a lack of sufficient governmenttax breaks <strong>and</strong> other economic incentives for consumers<strong>and</strong> businesses to invest in improving energyefficiency.Would you like to earn about 20% a year on yourmoney, tax-free <strong>and</strong> risk-free? Invest it in improvingthe energy efficiency of your home <strong>and</strong> in energy-efficientlights <strong>and</strong> appliances. You get your investmentback in a few years <strong>and</strong> then make about 20% a year byhaving lower heating, cooling, <strong>and</strong> electricity bills.This is a win-win deal for you <strong>and</strong> the earth.xHOW WOULD YOU VOTE? Should the United States orthe country where you live greatly increase its emphasis onimproving energy efficiency? Cast your vote online athttp://biology.brookscole.com/miller14.18-3 USING RENEWABLE ENERGYTO PROVIDE HEAT AND ELECTRICITYWhat Are the Main Types of RenewableEnergy? Solar CapitalSix types of renewable energy are solar, flowing water,wind, biomass, geothermal, <strong>and</strong> hydrogen.One of the four keys to sustainability (bottom half ofback cover) based on learning from nature is to relymostly on renewable solar energy. We can get renewablesolar energy directly from the sun or indirectly frommoving water, wind, <strong>and</strong> biomass. Two other forms ofrenewable energy are geothermal energy from theearth’s interior <strong>and</strong> using renewable energy to producehydrogen fuel from water. Like fossil fuels <strong>and</strong>nuclear power, each of these renewable energy alternativeshas advantages <strong>and</strong> disadvantages, as discussedin the remainder of this chapter.If renewable energy is so great, why does it provideonly 16% of the world’s energy <strong>and</strong> 6% of theenergy in the United States? One reason is that renewableenergy resources have received <strong>and</strong> continue toreceive much lower government tax breaks, subsidies,<strong>and</strong> research <strong>and</strong> development (R & D) funding thanfossil fuels <strong>and</strong> nuclear power have received fordecades. The other reason is that the prices we pay forfossil fuels <strong>and</strong> nuclear power do not include theirharm to the environment <strong>and</strong> to human health.In other words, the economic dice have beenloaded against solar, wind, <strong>and</strong> other forms of renewableenergy. If the economic playing field was mademore even, energy analysts say that many of theseforms of renewable energy would take over—anotherexample of the you-get-what-you-reward economic principlein action.Here are four encouraging developments favoringincreased use of renewable energy. First, in 2001 theEuropean Union (EU) adopted nonbinding agreementsfor its member countries to get 12% of their totalenergy <strong>and</strong> 22% of their electricity from renewable energyby 2010.Second, California gets about 12% of its electricityfrom renewable resources (7% of it from wind turbines)<strong>and</strong> wants to get 20% from such resources by2010. Third, a 2001 joint study by the American Councilfor an Energy-Efficient Economy, the Tellus Institute,<strong>and</strong> the Union of Concerned Scientists showedhow renewable energy could provide 20% of U.S.energy by 2020 if given sufficient government R & Dsubsidies <strong>and</strong> tax breaks. Fourth, according to theWorldwatch Institute, all U.S. electricity could be providedby farms of wind turbines operating in just threestates—Kansas, North Dakota, <strong>and</strong> South Dakota—orwith solar energy on a 260-square-kilometer (100-square-mile) plot in the Nevada or southern Californiadesert.How Can We Use Direct Solar Energyto Heat Houses <strong>and</strong> Water? Face the Sun<strong>and</strong> Store Its HeatWe can heat buildings by orienting them towardthe sun (passive solar heating) or by pumpinga liquid such as water through rooftop collectors(active solar heating).Buildings <strong>and</strong> water can be heated by direct solarenergy using two methods: passive <strong>and</strong> active (Figure18-16). A passive solar heating system absorbs <strong>and</strong>stores heat from the sun directly within a structure (Figure18-1, Figure 18-16, left, <strong>and</strong> Figure 18-17, p. 392).See the Guest Essay by Nancy Wicks on this topic onthe website for this chapter.Using passive solar energy is not new. For thous<strong>and</strong>sof years, many people have intuitively followedthe first principle of sustainability (bottom half of backcover). They have oriented their dwellings to take advantageof heat from the sun <strong>and</strong> used adobe <strong>and</strong> thickstone walls to collect <strong>and</strong> store heat during the day<strong>and</strong> gradually release it at night.In today’s passively heated buildings, energyefficientwindows <strong>and</strong> attached greenhouses face thehttp://biology.brookscole.com/miller14391
Direct GainCeiling <strong>and</strong> north wallheavily insulatedHot airSummersunGreenhouse, Sunspace, orAttached SolariumSummer cooling ventWarmairSuperinsulatedwindowsWintersunWarm airInsulatedwindowsCool airCool airEarth tubesEarth ShelteredEarthReinforced concrete,carefully waterproofedwalls <strong>and</strong> roofFlagstone floorfor heat storageTriple-paned orsuperwindowsFigure 18-17 Solutions: three examples of passive solardesign for houses.AdvantagesEnergy is freeNet energy ismoderate(active) to high(passive)Quick installationNo CO 2emissionsVery low air <strong>and</strong>water pollutionVery low l<strong>and</strong>disturbance(built into roof orwindow)T rade-OffsPassive or Active Solar HeatingModerate cost (passive)DisadvantagesNeed access to sun60% of timeBlockage of sunaccess by otherstructuresNeed heat storagesystemHigh cost (active)Active system needsmaintenance <strong>and</strong>repairActive collectorsunattractiveFigure 18-18 Trade-offs: advantages <strong>and</strong> disadvantages ofheating a house with passive or active solar energy. Pick thesingle advantage <strong>and</strong> the single disadvantage that you thinkare the most important.sun to collect solar energy by direct gain. Walls <strong>and</strong>floors of concrete, adobe, brick, stone, salt-treated timber,<strong>and</strong> water in metal or plastic containers storemuch of the collected solar energy as heat <strong>and</strong> releaseit slowly throughout the day <strong>and</strong> night. A smallbackup heating system such as a vented natural gas orpropane heater may be used but is not necessary inmany climates.On a life cycle cost basis, good passive solar <strong>and</strong>superinsulated design is the cheapest way to heat ahome or small building in regions with access to amplesunlight. Such a system usually adds 5–10% to theconstruction cost, but the life cycle cost of operatingsuch a house is 30–40% lower. The typical paybacktime for passive solar features is 3–7 years.An active solar heating system absorbs energyfrom the sun by pumping a heat-absorbing fluid (suchas water or antifreeze solution) through special collectorsusually mounted on a roof or on special racks toface the sun (Figure 18-16, right). A typical active collectorhas a flat black surface, a coil through which theheat-absorbing medium such as water is pumped, <strong>and</strong>a cover consisting of two or three layers of glass.Some of the collected heat can be used directly.The rest can be stored in a large insulated containerfilled with gravel, water, clay, or a heat-absorbingchemical for release as needed. Often these insulatedheat storage containers are located under a house.Active solar collectors can also supply hot water<strong>and</strong> are widely used in areas of the world with sunnyclimates. More than 1 million homes in Florida <strong>and</strong>California heat all or some of their water with one ormore active solar collectors.Figure 18-18 lists the major advantages <strong>and</strong> disadvantagesof using passive or active solar energy forheating buildings. Passive solar energy is great for newhomes in sunny areas but cannot be used to heat existinghomes <strong>and</strong> buildings not oriented to receive sunlightor where trees or other buildings block access tosunlight. Active solar collectors are good for heatingwater in sunny areas. But most analysts do not expectwidespread use of active solar collectors for heatinghouses because of their high costs, maintenance requirements,<strong>and</strong> unappealing appearance.392 CHAPTER 18 Energy Efficiency <strong>and</strong> Renewable Energy
How Can We Cool Houses Naturally? Insulate<strong>and</strong> Work with NatureWe can cool houses by superinsulating them,taking advantage of breezes, shading them,having light-colored roofs, <strong>and</strong> using geothermalcooling.Here are some ways to have a cooler house. Use superinsulation<strong>and</strong> superinsulating windows, openwindows to take advantage of breezes, <strong>and</strong> use fans tokeep air moving. Block the high summer sun with deciduoustrees <strong>and</strong> window overhangs, (Figure 18-17,top left), or awnings.Use a light-colored roof to reflect up to 80% of thesun’s heat, compared to only 8% for a roof coloreddark gray. Suspend reflective insulating foil in an atticto block heat from radiating down into the house.Another option is to place plastic earth tubes undergroundwhere the earth is cool year-round. In this geothermalcooling system, a tiny fan can pipe cool <strong>and</strong> partiallydehumidified air into an energy-efficient house(Figure 18-17, top left).* In warm climates you can alsouse high-efficiency heat pumps for air conditioning.Toronto, Canada’s largest city, cools downtownbuildings by pumping cold water from the depths ofLake Ontario <strong>and</strong> passing it through building air conditioningsystems. This reduces the use of coal for producingelectricity, cuts greenhouse gas emissions, <strong>and</strong>slashes summer use of electricity for air conditioningby 90%.How Can We Use Solar Energy to GenerateHigh-Temperature Heat <strong>and</strong> Electricity?Desert PowerLarge arrays of solar collectors in sunny desertscan produce high-temperature heat to spin turbines<strong>and</strong> produce electricity, but costs are high.Several solar thermal systems can collect <strong>and</strong> transformradiant energy from the sun into high-temperaturethermal energy (heat), which can be used directly orconverted to electricity. These systems are used mostlyin desert areas with ample sunlight.One method uses a central receiver system, called apower tower. Huge arrays of computer-controlled mirrorscalled heliostats track the sun <strong>and</strong> focus sunlighton a central heat collection tower (top drawing in Figure18-19).Australia is building a different type of powertower in its sunny outback. It will consist of a concretethermal chimney twice the height of the world’s tallestbuilding surrounded by a gigantic sloped solar greenhousewith a diameter of 5 kilometers (3 miles). As the*They work. I used them in a passively heated <strong>and</strong> cooled office<strong>and</strong> home for 15 years. People allergic to pollen <strong>and</strong> moldsshould add an air purification system, but this is also necessarywith a conventional cooling system.hot air collected by the huge greenhouse flows up intothe tower it will spin 32 giant turbines <strong>and</strong> produceenough electricity to serve 200,000 homes. Some of theheat collected during the day will be stored in tubesfilled with water. The heat released from this waterafter dark should keep the power plant workingthroughout the night. This project is a miniature versionof how the earth makes wind from solar energy.Another approach is a solar thermal plant in whichsunlight is collected <strong>and</strong> focused on arrays of oilfilledpipes running through the middle of a largearea of curved solar collectors (bottom drawing inFigure 18-19). This concentrated sunlight can generatetemperatures high enough for producing steam torun turbines <strong>and</strong> generate electricity. At night or oncloudy days, high-efficiency combined-cycle naturalgas turbines can supply backup electricity as needed.On an individual scale, inexpensive solar cookerscan focus <strong>and</strong> concentrate sunlight <strong>and</strong> cook food, especiallyin rural villages in sunny developing countries.They can be made by fitting an insulated box bigenough to hold three or four pots with a transparent,removable top. Solar cookers reduce deforestation forfuelwood <strong>and</strong> the time <strong>and</strong> labor needed to collect firewood.They also reduce indoor air pollution fromsmoky fires.Figure 18-19 lists the advantages <strong>and</strong> disadvantagesof concentrating solar energy to produce hightemperatureheat or electricity. Most analysts do not expectwidespread use of such technologies over the nextfew decades because of high costs, limited suitable sites,T rade-OffsSolar Energy for High-TemperatureHeat <strong>and</strong> ElectricityAdvantagesModerate netenergyModerateenvironmentalimpactNo CO 2 emissionsFast construction(1–2 years)Costs reducedwith natural gasturbine backupDisadvantagesLow efficiencyHigh costsNeeds backup orstorage systemNeed access tosun most ofthe timeHigh l<strong>and</strong> useMay disturbdesert areasFigure 18-19 Trade-offs: advantages <strong>and</strong> disadvantages ofusing solar energy to generate high-temperature heat <strong>and</strong> electricity.Pick the single advantage <strong>and</strong> the single disadvantagethat you think are the most important.http://biology.brookscole.com/miller14393
<strong>and</strong> availability of cheaper ways to produce electricitysuch as combined-cycle natural gas <strong>and</strong> wind turbines.How Can We Produce Electricity withSolar Cells? Use Your Roof or Windowsas a Power PlantSolar cells that convert sunlight to electricity can beincorporated into roofing materials or windows, <strong>and</strong>the high costs of doing this are expected to fall.Solar energy can be converted directly into electricalenergy by photovoltaic (PV) cells, commonly calledsolar cells (Figure 18-20). A typical solar cell is a transparentwafer containing a semiconductor materialwith a thickness ranging from less than that of a humanhair to a sheet of paper. Sunlight energizes <strong>and</strong>causes electrons in the semiconductor to flow, creatingan electrical current. These devices have no movingparts, require little maintenance, produce no pollutionduring operation, <strong>and</strong> last as long as a conventionalfossil fuel or nuclear power plant.The semiconductor material used in solar cells canbe made into lightweight paper-thin rigid or flexiblesheets <strong>and</strong> incorporated into traditional-looking roofingmaterials (blue in Figure 18-20). Glass walls <strong>and</strong>windows of buildings can also have built-in solar cells.In 2004, energy giant British Petroleum (BP) beganbuilding the world’s largest factory to produce windows<strong>and</strong> cladding <strong>and</strong> roofing materials that will incorporateBP’s power-producing solar cells.Easily exp<strong>and</strong>able banks of solar cells can be usedto provide electricity in developing countries for1.7 billion people in rural villages without electricity.Such banks of cells can also produce electricity at asmall power plant (bottom drawing in Figure 18-21),using combined-cycle natural gas turbines to providebackup power when the sun isnot shining. Another possibilityis to use arraysof solar cells to convertwater to hydrogen gasthat can be distributedSingle Solar CellBoron-enriched SunlightsiliconJunctionCellPhosphorusenrichedsiliconDC electricityto energy users by pipeline, as natural gas is. Withfinancing from the World Bank, India (the world’snumber-one market for solar cells) is installing solarcellsystems in 38,000 villages, <strong>and</strong> Zimbabwe is bringingsolar electricity to 2,500 villages. By 2004, morethan 1 million homes in the world, most of them in villagesin developing countries (<strong>and</strong> about 200,000 in theUnited States), were getting some or all of their electricityfrom solar cells mostly because they were longdistances from a power grid.Figure 18-21 lists the advantages <strong>and</strong> disadvantagesof solar cells. Current costs of producing electricityfrom solar cells are high but are expected to dropbecause of savings from mass production <strong>and</strong> new designs.Solar cells can also be incorporated into carbonbasedpolymers similar to Teflon that can be applied tosurfaces in thin layers. The first generation of such organicsolar cells that can convert 20–35% of the sun’s energyinto electricity could enter the marketplace withina few years. These solar cells could be printed on asheet of paper, stuck onto your house or car windows,painted on your house, or even incorporated into yourclothing—making you a walking tiny power plant.Some envision incorporating tiny rods of semiconductorswith a thickness of several nanometers (a tinyfraction of the thickness of a hair on your head) inplastic materials. Such nano solar cells can be manufacturedin extremely high volumes at a very low cost.Stay tuned.Currently solar cells supply only about 0.05% ofthe world’s electricity. But with increased government<strong>and</strong> private R & D <strong>and</strong> greater government tax breaks<strong>and</strong> other subsidies they could provide over a quarterof the world’s electricity by 2040. If such projections arecorrect, the production, sale, <strong>and</strong> installation of solarcells could become one of the world’s largest <strong>and</strong> fastestSolar-Cell RoofFigure 18-20 Solutions:photovoltaic (PV) (solar)cells can provide electricityfor a house or buildingusing new solar-cell roofshingles or PV panel roofsystems that look like ablue metal roof. Arrays ofsuch cells can also produceelectricity for a villageor at a small powerplant.Roof OptionsSolar Cells Panels ofSolar Cells394 CHAPTER 18 Energy Efficiency <strong>and</strong> Renewable Energy
AdvantagesFairly high netenergyWork on cloudydaysQuick installationEasily exp<strong>and</strong>edor movedNo CO 2emissionsLowenvironmentalimpactLast 20–40 yearsLow l<strong>and</strong> use (ifon roof or builtinto walls orwindows)Reducesdependence onfossil fuelsTrade-OffsSolar CellsDisadvantagesNeed access tosunLow efficiencyNeed electricitystorage system orbackupHigh l<strong>and</strong> use(solar-cell powerplants) coulddisrupt desertareasHigh costs(but should becompetitive in 5–15years)DC current mustbe converted to ACFigure 18-21 Trade-offs: advantages <strong>and</strong> disadvantages ofusing solar cells to produce electricity. Pick the single advantage<strong>and</strong> the single disadvantage that you think are the mostimportant.growing businesses. This is another exciting field toconsider as a career choice.18-4 PRODUCING ELECTRICITYFROM THE WATER CYCLEHow Can We Produce Electricity fromFlowing Water? Renewable HydropowerWater flowing in rivers <strong>and</strong> streams can be trappedin reservoirs behind dams <strong>and</strong> released as neededto spin turbines <strong>and</strong> produce electricity.Solar energy evaporates water <strong>and</strong> deposits it as water<strong>and</strong> snow in other areas as part of the water cycle (Figure4-28, p. 76). Water flowing from high elevations tolower elevations in rivers <strong>and</strong> streams can be controlledby dams <strong>and</strong> reservoirs <strong>and</strong> used to produceelectricity. This indirect form of renewable solar energyis called hydropower (Figure 15-9, p. 313).Three methods are used to produce such electricity.One is large-scale hydropower, in which a high dam isbuilt across a large river to create a reservoir. Some ofthe water stored in the reservoir is allowed to flowthrough huge pipes at controlled rates, spinning turbines<strong>and</strong> producing electricity.Another method is small-scale hydropower. A lowdam with no reservoir or only a small one is builtacross a small stream, <strong>and</strong> the stream’s flow of water isused to spin turbines <strong>and</strong> produce electricity. Submergingsmall high-efficiency turbines in a streamwithout impeding stream navigation or fish movementscan also produce electricity. A smaller turbinecalled a micro-hydrogenerator can be used to provideaffordable electricity for a single home.A third method is pumped-storage hydropower.Pumps use surplus electricity from a conventionalpower plant to pump water from a lake or a reservoirto another reservoir at a higher elevation. When moreelectricity is needed, water in the upper reservoir is released,flows through turbines, <strong>and</strong> generates electricityon its return to the lower reservoir.In 2002, hydropower supplied 20% of the world’selectricity, 99% in Norway, 75% in New Zeal<strong>and</strong>, 25%in China, <strong>and</strong> 7% in the United States (but about 50%on the West Coast).Figure 18-22 (p. 396) lists the advantages <strong>and</strong> disadvantagesof using large-scale hydropower plants toproduce electricity.xHOW WOULD YOU VOTE? Do the advantages of usinglarge-scale hydropower plants to produce electricity outweighthe disadvantages? Cast your vote online at http://biology.brookscole.com/miller14.According to the United Nations, only about 13%of the world’s technically exploitable potential for hydropowerhas been developed. Much of this untappedpotential is in China (p. 315), India, South America,Central Africa, <strong>and</strong> parts of the former Soviet Union.Because of increasing concern about the harmfulenvironmental <strong>and</strong> social consequences of large dams,there has been growing pressure on the World Bank<strong>and</strong> other development agencies to stop funding newlarge-scale hydropower projects. Also, according to a2000 study by the World Commission on Dams, hydropowerin tropical countries is a major emitter ofgreenhouse gases. This occurs because reservoirs thatpower the dams can trap rotting vegetation, which canemit greenhouse gases such as carbon dioxide <strong>and</strong>methane.Small-scale hydropower projects eliminate mostof the harmful environmental effects of large-scaleprojects. But their electrical output can vary with seasonalchanges in stream flow.We can also produce electricity from water flowsby tapping into the energy from tides <strong>and</strong> waves.Most analysts expect these sources to make little contributionto world electricity production because of highcosts <strong>and</strong> lack of enough areas with the right conditions.http://biology.brookscole.com/miller14395
AdvantagesModerate to highnet energyHigh efficiency(80%)Large untappedpotentialLow-cost electricityLong life spanNo CO 2emissionsduring operationin temperate areasMay provide floodcontrol below damProvides waterfor year-roundirrigation ofcropl<strong>and</strong>Reservoir isuseful for fishing<strong>and</strong> recreationT rade-OffsLarge-Scale HydropowerDisadvantagesHigh constructioncostsHigh environmentalimpact from floodingl<strong>and</strong> to form areservoirHigh CO 2 emissionsfrom biomass decayin shallow tropicalreservoirsFloods natural areasbehind damConverts l<strong>and</strong> habitatto lake habitatDanger of collapseUproots peopleDecreases fishharvest below damDecreases flow ofnatural fertilizer (silt)to l<strong>and</strong> below damthe wind turbines sold in the global marketplace.Denmark has banned coal <strong>and</strong> gets 90% of its electricityfrom wind. Nine of the world’s 10 leading windturbine manufacuring companies are in three countries—Denmark,Germany, <strong>and</strong> Spain—mostly becauseof strong <strong>and</strong> consistent government subsidies<strong>and</strong> tax breaks.Wind power is also being developed rapidly in India(the world’s number-two market for wind energy)<strong>and</strong> to a lesser degree in China. By 2030, India coulduse wind to generate a fourth of its electricity.Much of the world’s potential wind power remainsuntapped. According to the 2003 Wind Force 12report, wind parks on only one-tenth of the earth’sl<strong>and</strong> could produce twice the world’s projected dem<strong>and</strong>for electricity by 2020.ElectricalgeneratorPower cableGearboxFigure 18-22 Trade-offs: advantages <strong>and</strong> disadvantages ofusing large dams <strong>and</strong> reservoirs to produce electricity. Pick thesingle advantage <strong>and</strong> the single disadvantage that you thinkare the most important.Wind turbine18-5 PRODUCING ELECTRICITYFROM WINDWhat Is the Global Status of WindPower?A Star Is BornSince 1995 the use of wind turbines to produceelectricity has increased almost sevenfold.The greater heating of the earth at the equator than atthe poles <strong>and</strong> the earth’s rotation (Figure 6-8, p. 107)set up flows of air called wind. This indirect form of solarenergy can be captured by wind turbines (Figure18-23) <strong>and</strong> converted into electricity.Since 1990, wind power has been by far the world’sfastest growing source of energy, with its use increasingalmost sevenfold between 1995 <strong>and</strong> 2004.Europe is leading the world into the age of windenergy <strong>and</strong> out of the age of coal <strong>and</strong> other fossil fuels.About three-fourths of the world’s wind power is producedin Europe in inl<strong>and</strong> <strong>and</strong> offshore wind farms.And European companies manufacture about 80% ofWind farmFigure 18-23 Solutions: wind turbines can be used to produceelectricity individually or in clusters, called wind farms orwind parks. Since 1990, wind power has been the world’sfastest growing source of energy. Our energy future may beblowing in the wind.396 CHAPTER 18 Energy Efficiency <strong>and</strong> Renewable Energy
The DOE calls the Great Plains states of Oklahoma,South Dakota, North Dakota, Kansas, Nebraska, <strong>and</strong>Texas the “Saudi Arabia of wind” <strong>and</strong> points out thatthey have enough wind resources to more than meetall the nation’s electricity needs. According to theAmerican Wind Energy Association, with increased<strong>and</strong> consistent government subsidies <strong>and</strong> tax breaks,wind power could produce almost a fourth of U.S. electricityby 2025.Agrowing number of U.S. farmers <strong>and</strong> ranchersmake more money by leasing their l<strong>and</strong> for windpower production than by growing crops or raisingcattle. This explains why many of them are joining environmentalists<strong>and</strong> wind industry executives in urgingpolitical leaders to increase government research<strong>and</strong> development <strong>and</strong> tax breaks for wind power.Figure 18-24 lists the advantages <strong>and</strong> disadvantagesof using wind to produce electricity. Accordingto energy analysts, wind power has more advantages<strong>and</strong> fewer serious disadvantages than any other energyresource. Between the 1980s <strong>and</strong> 2004, the cost ofwind-generated electricity dropped ninefold from36¢ to about 4¢ per kilowatt-hour at favorable windsites. This is about the same price as using coal,natural gas, <strong>and</strong> hydropower (at highly favorablesites) to produce electricity <strong>and</strong> three times cheaperthan nuclear power. Wind power is like an underdogracehorse that is beginning to break out of apack of other, more pampered (subsidized) energyracehorses.If wind turbines are mass-produced like automobiles,the cost for a kilowatt of wind-generated energycould drop to 1–2 cents, making it by far the cheapestway to produce electricity. Many governments <strong>and</strong>corporations are recognizing that there is money inwind. Do the math. The average price of electricity inthe United States in 2003 was 7.2¢ per kilowatt-hour. Ifwind companies can produce a kilowatt of electricityat about 4¢ now, <strong>and</strong> in the not-too-distant future, for1.5–2¢, the potential profits are huge. This explainswhy General Electric, one of the world’s largest multinationalcompanies, recently decided to get into windpower.Some critics allege that wind turbines suck largenumbers of birds into their wind stream. However, aslong as wind farms are not located along bird migrationroutes most birds learn to fly around them. Windpower developers now make sophisticated studies ofbird migration paths to help them locate onshore <strong>and</strong>offshore wind parks <strong>and</strong> are designing new turbines toreduce this problem.Also, studies have shown that much larger numbersof birds die when they are sucked into jet engines,killed by domesticated <strong>and</strong> feral cats, <strong>and</strong> crash intoskyscrapers, plate glass windows, communicationstowers, <strong>and</strong> car windows.AdvantagesModerate to highnet energyHigh efficiencyModerate capitalcostLow electricitycost (<strong>and</strong> falling)Very low environmentalimpactNo CO 2 emissionsQuick constructionEasily exp<strong>and</strong>edCan be located atseaL<strong>and</strong> below turbinescan be used to growcrops or graze livestockT rade-OffsWind PowerDisadvantagesSteady windsneededBackup systemsneeded whenwinds are lowHigh l<strong>and</strong> usefor wind farmVisual pollutionNoise when locatednear populatedareasMay interfere inflights of migratorybirds <strong>and</strong> killbirds of preyFigure 18-24 Trade-offs: advantages <strong>and</strong> disadvantagesof using wind to produce electricity. Wind power expertsproject that by 2025 wind power could supply more than 10%of the world’s electricity <strong>and</strong> 10–25% of the electricity usedin the United States. Pick the single advantage <strong>and</strong> the singledisadvantage that you think are the most important.Even larger numbers of birds, fish, <strong>and</strong> otherforms of wildlife are killed by oil spills, air pollution,water pollution, <strong>and</strong> release of toxic wastes from useof fossil fuels such as coal <strong>and</strong> oil. The key questionsare, Which types of energy resources lead to the lowestloss of wildlife? <strong>and</strong> How can we minimize loss ofwildlife from use of any energy resource?xHOW WOULD YOU VOTE? Should we greatly increaseour dependence on wind power? Cast your vote online athttp://biology.brookscole.com/miller14.18-6 PRODUCING ENERGYFROM BIOMASSHow Is Biomass Used to ProvideEnergy? Burning Carbon CompoundsPlant materials <strong>and</strong> animal wastes can be burnedto provide heat or electricity or converted intogaseous or liquid biofuels.http://biology.brookscole.com/miller14397
Biomass consists of plant materials <strong>and</strong> animal wastesthat can be burned directly as a solid fuel or convertedinto gaseous or liquid biofuels (Figure 18-25). Mostbiomass is burned directly for heating, cooking, <strong>and</strong> industrialprocesses or indirectly to drive turbines <strong>and</strong>produce electricity. Burning wood <strong>and</strong> manure forheating <strong>and</strong> cooking supplies about 10% of the world’senergy <strong>and</strong> about 30% of the energy used in developingcountries (90% in the poorest countries such asBangladesh, Ethiopia, Burundi, <strong>and</strong> Bhutan).In 2002, about 350 biomass power plants suppliedabout 3% of the commercial energy <strong>and</strong> 2% of the electricityused in the United States. The U.S. governmenthas a goal of increasing the use of biomass energy to9% of the country’s total commercial energy by 2010.One way to produce biomass fuel is to plant, harvest,<strong>and</strong> burn large numbers of fast-growing trees (especiallycottonwoods, poplars, sycamores, willows,<strong>and</strong> leucaenas), shrubs, perennial grasses (such asswitchgrass), <strong>and</strong> water hyacinths in biomass plantations.In agricultural areas, crop residues (from sugarcane,rice, cotton, <strong>and</strong> coconuts) <strong>and</strong> animal manure can becollected <strong>and</strong> burned or converted into biofuels. Insome developing countries the poor gather animal manureor dung by h<strong>and</strong>, dry it, <strong>and</strong> burn it for heat <strong>and</strong>cooking. On the surface, this appears to be a free <strong>and</strong>logical use of wasted biomass.But some ecologists argue that it makes moresense to use animal manure as a fertilizer <strong>and</strong> cropresidues to feed livestock, retard soil erosion, <strong>and</strong> fertilizethe soil. Not allowing these animal <strong>and</strong> cropwastes to return to the soil as natural fertilizer can reducefood production <strong>and</strong> food supplies in poor countries.Also burning dried dung in open fires wastesabout 90% of its heat content.Figure 18-26 lists the general advantages <strong>and</strong> disadvantagesof burning solid biomass as a fuel. Oneproblem is that burning biomass produces CO 2 . However,if the rate of use of biomass does not exceed therate at which it is replenished by new plant growth(which takes up CO 2 ), there is no net increase in CO 2emissions. But repeated cycles of growing <strong>and</strong> harvestingbiomass plantations can deplete the soil of keynutrients.How Can Gaseous Fuels Be Produced fromBiomass? Bacteria <strong>and</strong> Chemistry to theRescueSome forms of biomass can be converted intogaseous <strong>and</strong> liquid biofuels.Bacteria <strong>and</strong> various chemical processes can convertsome forms of biomass into gaseous biofuels (Figure18-25). One of them is biogas—a mixture of 60%methane <strong>and</strong> 40% CO 2 .In rural China, anaerobic bacteria in more than500,000 biogas digesters on farms <strong>and</strong> in homes convertSolid Biomass FuelsWood logs <strong>and</strong> pelletsCharcoalAgricultural waste(stalks <strong>and</strong> other plant debris)Timbering wastes(branches, treetops, <strong>and</strong> wood chips)Animal wastes (dung)Aquatic plants (kelp <strong>and</strong> water hyacinths)Urban wastes (paper, cardboard,<strong>and</strong> other combustible materials)Direct burningGaseous BiofuelsSynthetic natural gas(biogas)Wood gasConversion to gaseous<strong>and</strong> liquid biofuelsFigure 18-25 Principal types of biomass fuel.Liquid BiofuelsEthanolMethanolGasoholplant <strong>and</strong> animal wastes into methane gas that is usedfor heating <strong>and</strong> cooking. After the biogas has been removed,the almost odorless solid residue is used asfertilizer on food crops or, if it is contaminated, ontrees. When they work, biogas digesters are very efficient<strong>and</strong> burning natural gas produced from dungproduces much more heat than burning the dung itself.But they are slow <strong>and</strong> unpredictable, a problemthat could be corrected by developing more reliablemodels. They also add CO 2 to the atmosphere.In some places in the United States, bacteria convertlivestock wastes from cattle, hogs, <strong>and</strong> chickensto biogas. One way to do this is to put the wastes in along, lined, insulated pit. A flexible liner stretchingacross the digester pit inflates like a balloon as itcollects the biogas, which can then be burned to heatthe digester or nearby farm buildings or to produceelectricity.398 CHAPTER 18 Energy Efficiency <strong>and</strong> Renewable Energy
AdvantagesLarge potentialsupply in someareasModerate costsNo net CO 2increase ifharvested <strong>and</strong>burnedsustainablyPlantation canbe located onsemiarid l<strong>and</strong>not needed forcropsPlantation canhelp restoredegraded l<strong>and</strong>sCan make use ofagricultural, timber,<strong>and</strong> urban wastesT rade-OffsSolid BiomassDisadvantagesNonrenewable ifharvestedunsustainablyModerate to highenvironmentalimpactCO 2 emissions ifharvested <strong>and</strong>burnedunsustainablyLow photosyntheticefficiencySoil erosion, waterpollution, <strong>and</strong> lossof wildlife habitatPlantations couldcompete withcropl<strong>and</strong>Often burned ininefficient <strong>and</strong>polluting open fires<strong>and</strong> stoveswhen oil becomes too scarce or expensive. Ethanol canbe made from sugar <strong>and</strong> grain crops (sugarcane, sugarbeets, sorghum, sunflowers, <strong>and</strong> corn) by fermentation<strong>and</strong> distillation. Gasoline mixed with 10–23% pureethanol makes gasohol, which can be burned in conventionalgasoline engines.Figure 18-27 lists the advantages <strong>and</strong> disadvantagesof using ethanol as a vehicle fuel compared togasoline. Ethanol could be produced from surplusgrain crops. But industrialized agriculture uses moreenergy in the form of petroleum-based vehicle fuel,fertilizers, <strong>and</strong> pesticides than the energy obtained byburning ethanol produced by such crops. Thus, there isa net energy loss from growing grain crops, convertingthe grain to ethanol, distilling the ethanol, <strong>and</strong> distributing<strong>and</strong> burning it as a motor vehicle fuel. The U.S.government gives large subsidies to corn growers toproduce ethanol as part of the national energy policy.Critics see this as a politically motivated giveaway <strong>and</strong>waste of money that could be used to support morepromising renewable energy alternatives.xHOW WOULD YOU VOTE? Do the advantages of usingliquid ethanol as a fuel outweigh the disadvantages?Cast your vote online at http://biology.brookscole.com/miller14.T rade-OffsFigure 18-26 Trade-offs: general advantages <strong>and</strong> disadvantagesof burning solid biomass as a fuel. Pick the singleadvantage <strong>and</strong> single disadvantage that you think are the mostimportant.AdvantagesEthanol FuelDisadvantagesBacteria in large digesters can also convert municipalgarbage <strong>and</strong> sewage to methane gas. Wells drilledinto about 300 large l<strong>and</strong>fills in the United States recovermethane produced by the decomposition of organicwastes <strong>and</strong> burn it to produce enough electricityto meet the needs of a million homes. BMW’s automobilefactory near Spartanburg, S.C. gets more than afourth of its electricity <strong>and</strong> a tenth of its heat by burningmethane gas piped in from a nearby l<strong>and</strong>fillowned by Waste Management.High octaneSome reduction inCO 2 emissionsReduced COemissionsCan be sold asgasoholLarge fuel tankneededLower driving rangeNet energy lossMuch higher costCorn supply limitedMay compete withgrowing food oncropl<strong>and</strong>Higher NO emissionsWhat Are the Advantages <strong>and</strong> Disadvantagesof Using Liquid Ethanol <strong>and</strong> MethanolProduced from Biomass as a Fuel? MixedSignalsSome believe we can rely much more onethanol <strong>and</strong> methanol as a fuel, but othersdisagree.Some analysts believe that liquid ethanol producedfrom biomass could replace gasoline <strong>and</strong> diesel fuelPotentiallyrenewableCorrosiveHard to start in coldweatherFigure 18-27 Trade-offs: general advantages <strong>and</strong> disadvantagesof using ethanol as a vehicle fuel compared to gasoline.Pick the single advantage <strong>and</strong> single disadvantage that youthink are the most important.http://biology.brookscole.com/miller14399
Some analysts believe that liquid methanol producedfrom biomass could replace gasoline <strong>and</strong> dieselfuel when oil becomes too scarce or expensive.Methanol is made mostly from natural gas but can alsobe produced at a higher cost from coal <strong>and</strong> biomasssuch as wood, wood wastes, agricultural wastes,sewage sludge, <strong>and</strong> garbage.Figure 18-28 lists the advantages <strong>and</strong> disadvantagesof using methanol as a vehicle fuel comparedto gasoline. According to a 1997 analysis by DavidPimentel <strong>and</strong> two other researchers, “Large-scale biofuelproduction is not an alternative to the current useof oil <strong>and</strong> is not even an advisable option to cover asignificant fraction of it.”However, chemist George A. Olah believes thatestablishing a methanol economy is preferable to thehighly publicized hydrogen economy. He points outthat methanol can be produced chemically fromcarbon dioxide in the atmosphere, which could alsohelp slow projected global warming. In addition,methanol can be converted to other hydrocarbon compoundsthat can be used to produce a variety of usefulchemicals like those made from petroleum <strong>and</strong> naturalgas.xHOW WOULD YOU VOTE? Do the advantages of usingliquid methanol as a fuel outweigh the disadvantages?Cast your vote online at http://biology.brookscole.com/miller14.AdvantagesHigh octaneSome reduction inCO 2 emissionsLower total airpollution (30–40%)Can be made fromnatural gas, agriculturalwastes,sewage sludge,<strong>and</strong> garbageCan be used toproduce H 2 forfuel cellsT rade-OffsMethanol FuelDisadvantagesLarge fuel tankneededHalf the drivingrangeCorrodes metal,rubber, plasticHigh CO 2 emissionsif made from coalExpensive toproduceHard to start in coldweatherFigure 18-28 Trade-offs: general advantages <strong>and</strong> disadvantagesof using methanol as a vehicle fuel compared to gasoline.Pick the single advantage <strong>and</strong> the single disadvantage that youthink are the most important.18-7 GEOTHERMAL ENERGYWhat Is Geothermal Energy? Tappingthe Earth’s Internal HeatWe can use geothermal energy stored in the earth’smantle to heat <strong>and</strong> cool buildings <strong>and</strong> to produceelectricity.Geothermal energy consists of heat stored in soil, undergroundrocks, <strong>and</strong> fluids in the earth’s mantle.Examples are volcanic rock, geysers, <strong>and</strong> hot springs.Scientists have developed several ways to tap into thisstored energy to heat <strong>and</strong> cool buildings <strong>and</strong> to produceelectricity.Throughout most of the world (except tundra areaswith permafrost) the temperature of the earth at a depthof about 3 meters (10 feet) is 10–16°C(50–60°F). Geothermalheat pumps can tap into this difference between underground<strong>and</strong> surface temperatures in most places <strong>and</strong>use a system of pipes <strong>and</strong> ducts to heat or cool a building.These devices use the earth as a heat source in winter<strong>and</strong> as a heat sink during summer. They are a very efficient<strong>and</strong> cost-effective way to heat or cool a space.Arelated way to heat or cool a building is geothermalexchange or geoexchange. It involves using buriedpipes filled with a fluid to move heat in or out of theground depending on the season <strong>and</strong> the heating orcooling requirements. In the winter, for example, heatis removed from fluid in pipes buried in the ground<strong>and</strong> blown through house ducts. In the summer thisprocess is reversed. According to the U.S. <strong>Environmental</strong>Protection Agency, geothermal exchange is themost energy-efficient, cost-effective, <strong>and</strong> environmentallyclean way to heat or cool a building.We have also learned to tap into deeper <strong>and</strong> moreconcentrated underground reservoirs of geothermalenergy. One type of reservoir contains dry steam withwater vapor but no water droplets. Another consists ofwet steam, a mixture of water vapor <strong>and</strong> waterdroplets. The third is hot water trapped in fractured orporous rock at various places in the earth’s crust.If such geothermal reservoirs are close to the surface,wells can be drilled to extract the dry steam, wetsteam, or hot water (Figure 17-2, p. 351), which can beused to heat homes <strong>and</strong> buildings or to spin turbines<strong>and</strong> produce electricity.There are three other nearly nondepletable sourcesof geothermal energy. One is molten rock (magma). Anotheris hot dry-rock zones, where molten rock that haspenetrated the earth’s crust heats subsurface rock tohigh temperatures. A third source is low- to moderatetemperaturewarm-rock reservoir deposits. Heat fromsuch deposits could be used to preheat water <strong>and</strong> runheat pumps for space heating <strong>and</strong> air conditioning.Hot dry-rock zones can be found almost anywhereabout 8–10 kilometers (5–6 miles) below the earth’s400 CHAPTER 18 Energy Efficiency <strong>and</strong> Renewable Energy
surface. Researchers in several countries are exploringwhether these zones can provide affordable geothermalenergy.Currently, about 22 countries (most of them in thedeveloping world) are extracting energy from geothermalsites to produce about 1% of the world’s electricity.Geothermal energy is used to heat about 85% ofIcel<strong>and</strong>’s buildings, produce electricity, <strong>and</strong> provideheat to grow most of its fruits <strong>and</strong> vegetables in greenhousesheated by geothermal energy. The world’slargest operating geothermal system, called The Geysers,extracts energy from a dry steam reservoir northof San Francisco, California. It provides electricity forabout 1.7 million homes. In 1999, Santa Monica, California,became the first city in the world to get all itselectricity from geothermal energy.Figure 18-29 lists the advantages <strong>and</strong> disadvantagesof using geothermal energy. It generally has amuch lower environmental impact than fossil fuel energyresources.But geothermal energy has two main problems.One is that the cost of tapping large-scale reservoirs ofgeothermal energy is too high for all but the most concentrated<strong>and</strong> accessible sources. New technologiesmay bring these costs down.The other is that some dry- or wet-steam geothermalreservoirs can be depleted if heat is removed fasterthan natural processes renew it. Thus geothermal resourcescan be nonrenewable on a human time scale,but the potential supply is so vast that it is usually classifiedas a renewable energy resource. Recirculating allof the hot water back into the underground reservoircan also slow heat depletion from such reservoirs.18-8 HYDROGENCan Hydrogen Replace Oil? Good-byeOil, Smog, <strong>and</strong> CO 2 Emissions, HelloHydrogenSome energy analysts view hydrogen gas asthe best fuel to replace oil during the last halfof this century.When oil is gone or what is left costs too much to use,how will we fuel vehicles, industry, <strong>and</strong> buildings?Many scientists <strong>and</strong> executives of major oil companies<strong>and</strong> automobile companies say the fuel of the future ishydrogen gas (H 2 )—envisioned in 1874 by sciencefiction writer Jules Verne in his book The MysteriousIsl<strong>and</strong>.Figure 18-30 (p. 402) lists the advantages <strong>and</strong> disadvantagesof using hydrogen as an energy resource.Electricity (electrolysis) or high temperatures (thermolysis)can be used to split water molecules into gaseoushydrogen <strong>and</strong> oxygen (2 H 2 O 2 H 2 O 2 ). AndAdvantagesVery high efficiencyModerate netenergy ataccessible sitesLower CO 2emissions thanfossil fuelsLow cost atfavorable sitesLow l<strong>and</strong> useLow l<strong>and</strong> disturbanceModerateenvironmental impactT rade-OffsGeothermal EnergyDisadvantagesScarcity ofsuitable sitesDepleted if usedtoo rapidlyCO 2 emissionsModerate to highlocal air pollutionNoise <strong>and</strong> odor(H 2 S)Cost too highexcept at the mostconcentrated <strong>and</strong>accessible sourcesFigure 18-29 Trade-offs: advantages <strong>and</strong> disadvantages ofusing geothermal energy for space heating <strong>and</strong> to produceelectricity or high-temperature heat for industrial processes.Pick the single advantage <strong>and</strong> the single disadvantage that youthink are the most important.when the hydrogen gas is used as a fuel it combineswith oxygen gas in the air <strong>and</strong> produces nonpollutingwater vapor (2 H 2 O 29 2H 2 O).*Proponents envision using hydrogen in energyefficient<strong>and</strong> nonpolluting fuel cells to provide electricityfor running buses, cars (Figures 18-10 <strong>and</strong> 18-11),houses, <strong>and</strong> other buildings. Widespread use of hydrogencould provide most of the energy needed to run aneconomy (Figure 18-31, p. 403). Proponents believethat such systems can be available by 2020–2030 <strong>and</strong>then be phased in during this century.So what is the catch? There are three problems inturning the vision of widespread use of hydrogen as afuel into reality. First, hydrogen is chemically lockedup in water <strong>and</strong> organic compounds such as methane<strong>and</strong> gasoline. Second, it takes energy <strong>and</strong> money toproduce hydrogen from water <strong>and</strong> organic compounds.In other words, hydrogen is not a source of energy.It is a fuel produced by using energy—lots of it. Third,fuel cells are the best way to use hydrogen to produceelectricity, but current versions are expensive.*Water vapor is a potent greenhouse gas. However, becausethere is already so much of it in the atmosphere, human additionsof this gas are insignificant.http://biology.brookscole.com/miller14401
AdvantagesCan be producedfrom plentifulwaterLowenvironmentalimpactRenewable ifproduced fromrenewable energyresourcesNo CO 2 emissions ifproduced fromwaterGood substitutefor oilCompetitive priceif environmental<strong>and</strong> social costsare included in costcomparisonsEasier to store thanelectricitySafer thangasoline <strong>and</strong>natural gasNontoxicHigh efficiency(45–65%) in fuel cellsTrade-OffsHydrogenAnode (-)CatalystCathode (+)DisadvantagesNot found in natureEnergy is neededto produce fuelNegative net energyCO 2 emissions ifproduced fromcarbon-containingcompoundsNonrenewable ifgenerated byfossil fuelsor nuclear powerHigh costs (but mayeventually comedown)Will take 25 to 50years to phase inShort drivingrange for currentfuel cell carsNo fuel distributionsystem in placeExcessive H 2 leaksmay deplete ozoneFigure 18-30 Trade-offs: advantages <strong>and</strong> disadvantages ofusing hydrogen as a fuel for vehicles <strong>and</strong> for providing heat <strong>and</strong>electricity. Pick the single advantage <strong>and</strong> the single disadvantagethat you think are the most important.We could use electricity from coal-burning <strong>and</strong>conventional nuclear power plants to electrolyze water.But doing this is expensive <strong>and</strong> subjects us to theharmful environmental effects associated with usingthese fuels (Figure 17-21, p. 365, <strong>and</strong> Figure 17-26,p. 370). We can also use a reforming process thatinvolves using high temperatures <strong>and</strong> chemical processesto separate hydrogen from carbon atoms inorganic compounds found in conventional fuels suchas natural gas, methanol, ethanol, or gasoline. A problemis that getting hydrogen from organic compoundssuch as methane (CH 4 ) produces carbon dioxide(CH 4 2 H 2 O 4 H 2 CO 2 ). And according to a2002 study by physicist Marin Hoffer <strong>and</strong> a team ofother scientists, these reforming processes add moreCO 2 to the atmosphere per unit of heat generated th<strong>and</strong>oes burning these carbon-containing fuels directly.Thus using this approach could accelerate projectedglobal warming unless we can develop affordableways to store (sequester) the CO 2 underground or inthe deep ocean. We can also gasify coal or biomass toproduce hydrogen, but this is more expensive than usingnatural gas <strong>and</strong> also releases CO 2 .Most proponents of hydrogen believe that if weare to get its very low pollution <strong>and</strong> low CO 2 emissionbenefits, the energy used to produce H 2 by decomposingwater must come from low-polluting, renewablesources that emit little or no CO 2 . The most likelysources are electricity generated by wind farms, hydropower,geothermal energy, solar cells (when theirprices come down), or biological processes in bacteria<strong>and</strong> algae (Spotlight, p. 404).In 1999, DaimlerChrysler, Royal Dutch Shell,Norsk Hydro, <strong>and</strong> Icel<strong>and</strong>ic New Energy announcedgovernment-approved plans to turn the tiny countryof Icel<strong>and</strong> into the world’s first “hydrogen economy”by 2040—the brainchild of chemist Bragi Árnason,known as “Professor Hydrogen.” The country’s abundantrenewable geothermal energy, hydropower, <strong>and</strong>offshore winds will be used to produce hydrogenfrom seawater <strong>and</strong> the H 2 will be used to run itsbuses, passenger cars, fishing vessels, <strong>and</strong> factories.Icel<strong>and</strong>’s first hydrogen service station opened in2003.Once hydrogen is produced we must have a wayto store it for use as needed. Here are some of the waysthat scientists <strong>and</strong> engineers are investigating for hydrogenstorage.Store it in compressed gas tanks either above orbelow the ground or aboard motor vehicles. In2002, General Motors developed a lightweight highpressurehydrogen storage tank that can be used oncars <strong>and</strong> can store enough hydrogen to provide a rangeof nearly 480 kilometers (300 miles) before refueling.Store it as more dense liquid hydrogen. But the liquidhydrogen must be stored in tanks kept at very lowtemperatures. This is costly, takes almost a third of thehydrogen’s original fuel energy, <strong>and</strong> requires a largeamount of insulation.Store it in solid metal hydride compounds. Certainmetals can absorb <strong>and</strong> chemically bond hydrogen intheir latticework of atoms. Heating such metal hydridecompounds releases the hydrogen gas asneeded. DaimlerChrysler has found a way to store hydrogenas sodium borohydride in a nontoxic <strong>and</strong> nonflammablesolution that can be pumped in <strong>and</strong> out ofthe vehicle safely <strong>and</strong> cleanly <strong>and</strong> without leaks of hydrogengas.Absorb hydrogen gas on activated charcoal or graphitenanofibers. Like hydrides, this is a safe <strong>and</strong> efficientway to store hydrogen, but an input of energy isneeded to release the hydrogen. Trap <strong>and</strong> store hydrogen402 CHAPTER 18 Energy Efficiency <strong>and</strong> Renewable Energy
Primary EnergySourcesHydrogenProduction TransportStorage UtilizationPhotoconversionSunlightElectric utilityWindElectricityGenerationElectrolysisCommercial/ResidentialBiomassFossil fuelsReformingVehicles <strong>and</strong>pipelineGas <strong>and</strong>solidsTransportationIndustrialFigure 18-31 Solutions: hydrogen energy system used to run a sustainable hydrogen economy. (Data fromU.S. Department of Energy <strong>and</strong> the Worldwatch Institute)gas in a framework of water molecules called clathratehydrates or in tiny glass microspheres. Stay tuned forfurther developments from this research.Hydrogen is highly flammable <strong>and</strong> burns with aninvisible flame. But it may be safer than gasoline fortwo reasons. First, when this light gas is released itquickly disperses into the atmosphere instead of posinga fire hazard by puddling on the ground like gasoline.Second, metal hydrides, charcoal powders, graphite,nanofibers, <strong>and</strong> glass microspheres containing hydrogenwill not explode or burn if a vehicle’s tank is rupturedin an accident.Will Widespread Use of Hydrogen DecreaseProtective Ozone in the Stratosphere?Probably Not With with Careful Use ofHydrogenApreliminary study suggests that widespread useof hydrogen could decrease the concentration ofprotective ozone in the stratosphere over Antarcticafor a few months each year.In 2003, researchers Tracey Tromp <strong>and</strong> John Eiler at theCalifornia Institute of Technology published a paperthat sent shivers down the back of hydrogen proponents.On the basis of computer models, they projectedthat if hydrogen eventually replaces all fossil fuels, hydrogengas leaking from such a global system could riseinto the stratosphere, be oxidized to form water vapor,increase depletion of the ozone layer over Antarcticaduring part of the year, <strong>and</strong> allow more harmful ultravioletradiation to reach the earth’s surface.Most press reports failed to note that the authors<strong>and</strong> other scientists gave several reasons why thisproblem may not be as serious as this preliminarystudy suggests. First, the authors’ model is basedon still poorly understood atmospheric chemicalinteractions involved in the hydrogen fuel cycle. Thisincludes the possibility that excess hydrogen in thetroposphere would be absorbed by soils or removedby reactions with other chemicals in the atmospherebefore most of it can reach the stratosphere.Second, the assumptions about leakage of hydrogenmay be much too high because of improved technology<strong>and</strong> vigilance to reduce such leaks. Third, globalefforts are in place to drastically reduce ozone depletionin the stratosphere by 2050, mostly from chlorine<strong>and</strong> bromine compounds we have been puttinginto the atmosphere (more on this in Chapter 21).Since widespread use of hydrogen is not expected untilafter 2050, this potential threat would be greatlydiminished.What Are Some Possible Potholes in theHydrogen Highway? Getting DivertedBecause large-scale use of hydrogen is probably25–50 years away, we should not let its potentialdivert us from the immediate priorities of sharplyreducing greenhouse gas emissions by increasingfuel efficiency <strong>and</strong> encouraging the use of renewableenergy to help us produce hydrogen <strong>and</strong> phase outfossil fuels.Some analysts urge the United States to spend about$100 billion over the next two decades to spur thedevelopment of a renewable-energy hydrogen revolutionthat would be phased in during this century. Themedia hype about hydrogen can divert us from thefact that it will probably not be in widespread use for25–50 years.http://biology.brookscole.com/miller14403
Producing Hydrogen from Green Algae FoundIn a few decadeswe may be able touse large-scalecultures of greenSPOTLIGHT algae to producehydrogen gas.This simple plant grows almosteverywhere <strong>and</strong> is commonly foundin pond scum.When living in air <strong>and</strong> sunlight,green algae carry out photosynthesislike other plants <strong>and</strong> producecarbohydrates <strong>and</strong> oxygen gas.However, in 2000, Tasios Melis, aresearcher at the University ofCalifornia at Berkeley, found a wayto modify the photosynthesisprocess to make these algae producebubbles of hydrogen ratherthan oxygen.First, he grew cultures of hundredsof billions of the algae in thenormal way with plenty of sunlight,nutrients, <strong>and</strong> water. Then he cut offtheir supply of two key nutrients:sulfur <strong>and</strong> oxygen. Within 20 hours,the plant cells underwent a metabolicchange <strong>and</strong> switched from anoxygen-producing to a hydrogenproducingmetabolism, allowingthe researcher to collect hydrogengas bubbling from the culture.Melis believes he can increasethe efficiency of this hydrogen---producing process 10-fold. If so,sometime in the future a biologicalhydrogen plant might cycle a mixtureof algae <strong>and</strong> water through a systemof clear tubes exposed to sunlightto produce hydrogen. Thegene responsible for producingthe hydrogen might even be transferredto other plants to producehydrogen.Critical ThinkingWhat might be some ecologicalproblems related to the widespreaduse of this method for producinghydrogen?While we are working to develop a renewableenergyhydrogen revolution, energy analysts call forus to focus on two more immediate <strong>and</strong> important priorities.One is to begin sharply reducing our dependenceon carbon-containing fossil fuels—especially oil<strong>and</strong> coal, which emit large quantities of carbon dioxide.The other is the related challenge of sharplyreducing our emissions of carbon dioxide <strong>and</strong> othergreenhouse gases to help slow global warming <strong>and</strong> climatechange. Analysts suggest that we do this by■ Greatly improving fuel-efficiency st<strong>and</strong>ards formotor vehicles through a combination of m<strong>and</strong>atorygovernment st<strong>and</strong>ards <strong>and</strong> much higher taxes ongasoline <strong>and</strong> diesel fuels, coupled with a correspondingreduction in income <strong>and</strong> payroll taxes. This couldbe done within 10 years. Some energy analysts accusecar companies of misleading the public by saying thatwe do not need to increase government (CAFE) fuelefficiencyst<strong>and</strong>ards because we can depend onhydrogen.■ Providing large tax breaks for people <strong>and</strong> businessesusing fuel-efficient cars, buildings, heatingsystems, <strong>and</strong> household appliances <strong>and</strong> keeping suchbreaks in place for at least 25 years■ Investing much more in public transit running onless polluting natural gas as an alternative to the car<strong>and</strong> using at least half of the money collected by gasolinetaxes to promote this change■ Greatly increasing research <strong>and</strong> development subsidiesfor development <strong>and</strong> phasing in of renewableenergytechnologies, such as wind power, solar cells,biomass, <strong>and</strong> geothermal energy, <strong>and</strong> providing suchsubsidies for at least 25 years. Such non-carbon energytechnologies will be needed to produce hydrogen.■ Providing very large tax breaks for people <strong>and</strong>businesses using renewable-energy technologies <strong>and</strong>keeping such breaks in place for at least 25 years.It will take large amounts of fossil fuel energy <strong>and</strong>money to phase in the use of hydrogen during the lasttwo-thirds of this century. If we do not conserve fossilfuels their prices might rise to the point where wecould not afford to use them to help us make the transitionto a renewable-energy hydrogen economy by theend of this century. Also, failing to reduce the threat ofclimate change is likely to divert huge amounts ofmoney from hydrogen to help us deal with the harmfuleffects of climate change.xHOW WOULD YOU VOTE? Do the advantages of burninghydrogen as a source of energy outweigh the disadvantages?Cast your vote online at http://biology.brookscole.com/miller14.18-9 ENTERING THE AGEOF DECENTRALIZED MICROPOWERWhat Is Micropower? Think Small<strong>and</strong> DispersedEnergy analysts expect dispersed, small-scaleenergy-generating units to replace centralized,large-scale power plants over the next fewdecades.According to Chuck Linderman, director of energy supplypolicy for the Edison Electric Institute, the era of bigcentral power plant systems is coming to a close. He <strong>and</strong>other energy analysts believe the chief feature of electricityproduction over the next few decades will be404 CHAPTER 18 Energy Efficiency <strong>and</strong> Renewable Energy
Bioenergy power plantsWind farmSmall solar-cellpower plantsRooftop solarcellarraysFuel cellsSolar-cellrooftopsystemsTransmission<strong>and</strong> distributionsystemCommercialResidentialSmall windturbineIndustrialMicroturbinesFigure 18-32 Solutions: decentralized power system in which electricity is produced by a large number ofdispersed, small-scale micropower systems. Some would produce power on site <strong>and</strong> others would feed thepower they produce into a conventional electrical distribution system. Over the next few decades, many energy<strong>and</strong> financial analysts expect a shift to this type of power system.decentralization to dispersed, small-scale micropowersystems that generate 1–10,000 kilowatts (Figure 18-32).This shift from centralized macropower to dispersed micropoweris analogous to the computer industry’s shiftfrom large centralized mainframes to increasinglysmaller, widely dispersed PCs, laptops, <strong>and</strong> h<strong>and</strong>heldcomputers.Figure 18-33 (p. 406) lists some of the advantagesof decentralized micropower systems over traditionalmacropower systems. The potential for financial gainby companies <strong>and</strong> investors in micropower systems ishuge, with a $10 trillion market projected by 2018. Decentralizedmicropower systems could also work wellfor 1.7 billion people in isolated villages in developingcountries.18-10 A SUSTAINABLE ENERGYSTRATEGYWhat Roles Will Economics <strong>and</strong> PoliticsPlay in Our Energy Future? RewardsPay OffGovernments can use a combination of subsidies,tax breaks, <strong>and</strong> taxes to promote or discourage useof various energy alternatives.To most analysts the key to making a shift to more sustainableenergy resources <strong>and</strong> societies is economics<strong>and</strong> politics. Governments can use two basic economic<strong>and</strong> political strategies to help stimulate or discourageuse of a particular energy resource.http://biology.brookscole.com/miller14405
Small modular unitsFast factory productionFast installation(hours to days)Can add or removemodules as neededHigh energy efficiency(60–80%)Low or no CO 2emissionsLow air pollutionemissionsReliableEasy to repairMuch less vulnerableto power outagesIncrease nationalsecurity by dispersalof targetsUseful anywhereEspecially usefulin rural areas indeveloping countrieswith no powerCan use locallyavailable renewableenergy resourcesAnode (-)CatalystCathode (+)analysts say this reward system is the reverse of what itshould be.A second option is to keep energy prices artificiallyhigh to discourage use of a resource. Governments canraise the price of an energy resource by withdrawingexisting tax breaks <strong>and</strong> other subsidies, enacting restrictiveregulations, or adding taxes on its use. Thisincreases government revenues, encourages improvementsin energy efficiency, reduces dependence on importedenergy, <strong>and</strong> decreases use of an energy resourcethat has a limited future supply.Many economists favor increasing taxes on fossil fuelsas a way to reduce air <strong>and</strong> water pollution, slow greenhousegas emissions, <strong>and</strong> encourage improvements inenergy efficiency <strong>and</strong> greater use of renewable energy.For example in Germany <strong>and</strong> Great Britain, where gasolinecosts more than $1.30 per liter ($5 per gallon), overalloil <strong>and</strong> gasoline consumption has fallen since the1970s. Some economists believe the public might acceptthese higher taxes if income <strong>and</strong> payroll taxes were loweredas gasoline or other fossil fuel taxes were raised.And energy assistance would be provided for the poor<strong>and</strong> lower middle class who would bear the brunt oftaxes on gasoline <strong>and</strong> other energy-intensive goods.xHOW WOULD YOU VOTE? Should the government increasetaxes on fossil fuels <strong>and</strong> offset this by reducing income <strong>and</strong>payroll taxes <strong>and</strong> providing an energy safety net for the poor<strong>and</strong> lower middle class? Cast your vote online at http://biology.brookscole.com/miller14.Easily financed(costs included inmortgage <strong>and</strong>commercial loan)Figure 18-33 Solutions: advantages of micropower systems.One approach is to keep energy prices artificially lowto encourage use of selected energy resources. This is donemostly by providing research <strong>and</strong> development subsidies<strong>and</strong> tax breaks, <strong>and</strong> by enacting regulations thathelp stimulate the development <strong>and</strong> use of energy resourcesreceiving such support. For decades, this approachhas been used to help the fossil fuel <strong>and</strong> nuclearpower industries in the United States (Figure 18-34)<strong>and</strong> in most other developed countries. This approachhas created an uneven economic playing field thatencourages energy waste <strong>and</strong> rapid depletion of nonrenewableenergy resources <strong>and</strong> discourages the developmentof other energy alternatives <strong>and</strong> improvementsin energy efficiency. For example, in the United Statespeople who buy the biggest SUVs for business cars geta tax deduction of up to $100,000. People buying an energy-efficienthybrid car got a $1,500 tax deduction in2004, but this is being reduced to $500 by 2006. EnergyHow Can We Develop a More SustainableEnergy Future? Stop the Waste, Use the Sun,<strong>and</strong> Cut PollutionA more sustainable energy policy would improveenergy efficiency, rely more on renewable energy,<strong>and</strong> reduce the harmful environmental effects ofusing fossil fuels <strong>and</strong> nuclear energy.Figure 18-35 lists strategies for making the transitionto a more sustainable energy future over the next fewdecades. Energy analysts also call for the United Statesto modernize its aging electrical grid system. Energyanalysts describe the United States as a first-worldnation with a third-world electrical grid system. Thissystem is highly vulnerable to disruption from unforeseenpower outages, sabotage by terrorists, <strong>and</strong> attacksby cyber-terrorists on the computer programs that runit. They call for the country to waste no time in transformingit into a smart, flexible, responsive, <strong>and</strong> digitallycontrolled network.Energy analysts estimate that implementing policiessuch as those shown in Figure 18-35 over the nextseveral decades could save money, create a net gain injobs, reduce greenhouse gas emissions, <strong>and</strong> sharply reduceair <strong>and</strong> water pollution. According to proponents,these policies would also increase national secu-406 CHAPTER 18 Energy Efficiency <strong>and</strong> Renewable Energy
Nuclear energy(fission <strong>and</strong> fusion)$73 billionFossil fuels$32 billionRenewable energy$19 billionEnergy efficiency(conservation)$15 billionFigure 18-34 U.S. energy policy priorities. U.S. Department of Energy research <strong>and</strong> development fundingfor various sources of energy, 1948–2003. If other government subsidies <strong>and</strong> tax breaks are included, thefigures for nuclear power <strong>and</strong> fossil fuels are much higher, <strong>and</strong> fossil fuels receive approximately 60% ofthese benefits, nuclear energy 30%, <strong>and</strong> renewable energy <strong>and</strong> energy conservation only 10%. (U.S.Department of Energy)rity in two ways: first by reducing dependence on importedoil, <strong>and</strong> second by decreasing dependence onlarge <strong>and</strong> centralized nuclear power <strong>and</strong> coal plantsthat are vulnerable to terrorist attacks.We have the technology, creativity, <strong>and</strong> wealth tomake the transition to a more sustainable energy future.But making this transition depends primarily onpolitics, <strong>and</strong> thus on pressure individuals <strong>and</strong> groupscan put on elected officials <strong>and</strong> officials of energyresource companies by voting with their ballots <strong>and</strong>pocketbooks (by refusing to buy some products <strong>and</strong>letting company executives know why). Figure 18-36(p. 408) lists some ways you can contribute to makingthis transition by reducing the amount of energy youuse <strong>and</strong> waste.A transition to renewable energy is inevitable, not becausefossil fuel supplies will run out—large reserves of oil, coal, <strong>and</strong>gas remain in the world—but because the costs <strong>and</strong> risks ofusing these supplies will continue to increase relative torenewable energy.MOHAMED EL-ASHRYImprove Energy EfficiencyIncrease fuel-efficiencyst<strong>and</strong>ards for vehicles,buildings, <strong>and</strong> appliancesM<strong>and</strong>ate governmentpurchases of efficientvehicles <strong>and</strong> other devicesProvide large tax credits forbuying efficient cars,houses, <strong>and</strong> appliancesOffer large tax credits forinvestments in energyefficiencyReward utilities for reducingdem<strong>and</strong> for electricityEncourage independentpower producersGreatly increase energyefficiency research <strong>and</strong>developmentMore Renewable EnergyIncrease renewable energy to20% by 2020 <strong>and</strong> 50% by 2050Provide large subsidies <strong>and</strong> taxcredits for renewable energyUse full-cost accounting <strong>and</strong>life cycle cost for comparing allenergy alternativesEncourage government purchaseof renewable energy devicesGreatly increase renewableenergy research <strong>and</strong>developmentReduce Pollution <strong>and</strong>Health RiskCut coal use 50% by 2020Phase out coal subsidiesLevy taxes on coal <strong>and</strong> oil usePhase out nuclear power or putit on hold until 2020Phase out nuclear powersubsidiesFigure 18-35 Solutions: suggestions of various energy analysts to help make the transition to a more sustainable<strong>and</strong> less risky energy future.http://biology.brookscole.com/miller14407
What Can You Do?Energy Use <strong>and</strong> Waste• Drive a car that gets at least 15 kilometers per liter(35 miles per gallon) <strong>and</strong> join a carpool.• Use mass transit, walking, <strong>and</strong> bicycling.• Superinsulate your house <strong>and</strong> plug all air leaks.•Turn off lights, TV sets, computers, <strong>and</strong> otherelectronic equipment when they are not in use.•Wash laundry in warm or cold water.• Use passive solar heating.• For cooling, open windows <strong>and</strong> use ceiling fansor whole-house attic or window fans.•Turn thermostats down in winter <strong>and</strong> up in summer.• Buy the most energy-efficient homes, lights, cars,<strong>and</strong> appliances available.•Turn down the thermostat on water heaters to43–49°C (110–120°F) <strong>and</strong> insulate hot waterheaters <strong>and</strong> pipes.Figure 18-36 What can you do? Ways to reduce your use <strong>and</strong>waste of energy.CRITICAL THINKING1. A home builder installs electric baseboard heat <strong>and</strong>claims, “It is the cheapest <strong>and</strong> cleanest way to go.” Applyyour underst<strong>and</strong>ing of the second law of thermodynamics<strong>and</strong> net energy efficiency chain (Figure 18-6) to evaluatethis claim.2. Someone tells you we can save energy by recycling it.How would you respond?3. Should gas-guzzling motor vehicles be taxed heavily?Explain.4. Congratulations! You have won $250,000 to build ahouse of your choice anywhere you want. With thegoal of maximizing energy efficiency, what type ofhouse would you build? Where would you locate it?What types of materials would you use? What types ofmaterials would you not use? How would you heat <strong>and</strong>cool the house? How would you heat water? What type oflighting, stove, refrigerator, washer, <strong>and</strong> dryer would youuse? Which of these appliances could you do without?5. Should government subsidies <strong>and</strong> tax breaks for allenergy alternatives be eliminated so all energy choicescan compete in the marketplace on an even economicfooting? Explain.6. Should government tax breaks <strong>and</strong> other subsidies forfossil fuels <strong>and</strong> nuclear power be phased out <strong>and</strong> replacedwith subsidies <strong>and</strong> tax breaks for improvingenergy efficiency <strong>and</strong> renewable energy alternatives?Explain.7. Explain why you agree or disagree with each of theproposals suggested in Figure 18-35 (p, 407) as ways topromote a more sustainable energy future.8. List the parts of your daily life that depend on theelectrical grid system.9. Congratulations! You are in charge of the U.S.Department of Energy (or the energy agency in thecountry where you live). What proportions of yourresearch <strong>and</strong> development budget would you devoteto fossil fuel, nuclear power, renewable energy, <strong>and</strong>improving energy efficiency? How would you distributeyour funds among the various types of renewableenergy?10. Congratulations! You are in charge of the world. Listthe five most important features of your energy policy.PROJECTS1. Make a study of energy use in your school <strong>and</strong> use thefindings to develop an energy-efficiency improvementprogram. Present your plan to school officials.2. Learn how easy it is to produce hydrogen gas fromwater using a battery, some wire for two electrodes, <strong>and</strong> adish of water. Hook a wire to each of the poles of the battery,immerse the electrodes in the water, <strong>and</strong> observebubbles of hydrogen gas being produced at the negativeelectrode <strong>and</strong> bubbles of oxygen at the positive electrode.Carefully add a small amount of battery acid to the water<strong>and</strong> notice that this increases the rate of hydrogenproduction.3. Use the library or the Internet to compare the energypolicies of the United States, Germany, <strong>and</strong> China.4. Use the library or the Internet to find bibliographic informationabout Amory B. Lovins <strong>and</strong> Mohamed El-Ashry,whose quotes appear at the beginning <strong>and</strong> end of thischapter.5. Make a concept map of this chapter’s major ideas, usingthe section heads, subheads, <strong>and</strong> key terms (in boldface).Look on the website for this book for informationabout making concept maps.LEARNING ONLINEThe website for this book contains study aids <strong>and</strong> manyideas for further reading <strong>and</strong> research. They include achapter summary, review questions for the entire chapter,flash cards for key terms <strong>and</strong> concepts, a multiple-choicepractice quiz, interesting Internet sites, references, <strong>and</strong> aguide for accessing thous<strong>and</strong>s of InfoTrac ® College Editionarticles. Log on tohttp://biology.brookscole.com/miller14Then click on the Chapter-by-Chapter area, choose Chapter18, <strong>and</strong> select a learning resource.408 CHAPTER 18 Energy Efficiency <strong>and</strong> Renewable Energy
19 <strong>and</strong>Risk, Toxicology,Human HealthCASE STUDYThe Big KillerWhat is roughly the diameter of a 30-caliber bullet,can be bought almost anywhere, is highly addictive,<strong>and</strong> kills about 13,700 people every day, or one every6 seconds? It is a cigarette. Cigarette smoking is theworld’s most preventable major cause of suffering <strong>and</strong> prematuredeath among adults.According to the World Health Organization(WHO), tobacco helped kill about 80 million peoplebetween 1950 <strong>and</strong> 2004. This is 2.6 times more than the30 million people killed in battle in all wars during the20th century!The WHO estimates that each year tobacco contributesto the premature deaths of at least 5 millionpeople (about half from developed countries <strong>and</strong> halffrom developing countries) from 34 illnesses includingheart disease, lung cancer, other cancers, bronchitis,emphysema, <strong>and</strong> stroke. By 2030 the annual death tollfrom smoking-related diseases is projected to reach10 million (Figure 1-15, p. 17)—an average of about27,400 preventable deaths per day or 1 death every3 seconds. About 70% of these deaths are expected tooccur in developing countries.According to a 2002 study by the Centers forDisease Control <strong>and</strong> Prevention, smoking kills about442,000 Americans per year prematurely, an averageof 1,211 deaths per day (Figure 19-1). This death toll isroughly equivalent to three fully loaded 400-passengerjumbo jets crashing every day with no survivors!Cause of DeathTobacco use 442,000Excess weightAccidentsAlcohol useInfectiousdiseasesPollutants/toxinsSuicidesHomicides85,00075,000 (14,200 from AIDS)55,00030,60020,622Illegal drug use 17,000Deaths101,500 (43,450 auto)400,000Yet, this ongoing major human tragedy rarely makesthe news.The overwhelming consensus in the scientificcommunity is that the nicotine inhaled in tobaccosmoke is highly addictive. Only 1 in 10 people who tryto quit smoking succeed, about the same relapse rateas for recovering alcoholics <strong>and</strong> those addicted toheroin or crack cocaine. A British government studyshowed that adolescents who smoke more than onecigarette have an 85% chance of becoming smokers.People can also be exposed to secondh<strong>and</strong> smokefrom others, called passive smoking.According to a 2002 study by the Centers forDisease Control <strong>and</strong> Prevention, smoking in the UnitedStates costs about $158 billion a year for medical bills,increased insurance costs, disability, lost earnings <strong>and</strong>productivity because of illness, <strong>and</strong> property damagefrom smoking-caused fires. This is an average of about$7 per pack of cigarettes sold in the United States.Many health experts urge that a $3–5 federal taxbe added to the price of a pack of cigarettes in theUnited States. Such a tax would mean that the usersof cigarettes (<strong>and</strong> other tobacco products), not the restof society, would pay a much greater share of thehealth, economic, <strong>and</strong> social costs associated withtheir smoking.Other suggestions for reducing the death toll <strong>and</strong>health effects of smoking in the United States (<strong>and</strong> inother countries) include banning all cigarette advertising,prohibiting the sale of cigarettes <strong>and</strong> other tobaccoproducts to anyone under 21 (with strict penalties forviolators), <strong>and</strong> banning cigarette vending machines.Analysts also call for classifying <strong>and</strong> regulatingthe use of nicotine as an addictive <strong>and</strong> dangerousdrug, eliminating all federal subsidies <strong>and</strong>tax breaks to tobacco farmers <strong>and</strong> tobacco companies,<strong>and</strong> using cigarette tax income to financean aggressive antitobacco advertising<strong>and</strong> education program.So far, the U.S. Congress has not enactedsuch reforms. Critics say this is mostly becausetobacco companies donated tens of millions ofdollars to c<strong>and</strong>idates running for Congress <strong>and</strong>the presidency.Figure 19-1 Annual deaths in the United States from tobaccouse <strong>and</strong> eight other causes in 2003. Smoking is by far thenation’s leading cause of preventable death. (U.S. NationalCenter for Health Statistics <strong>and</strong> Centers for Disease Control<strong>and</strong> Prevention <strong>and</strong> U.S. Surgeon General)
The dose makes the poison.PARACELSUS, 1540This chapter addresses the following questions:■■■■■What types of hazards do people face?What is toxicology, <strong>and</strong> how do scientists measuretoxicity?What chemical hazards do people face, <strong>and</strong> howcan they be measured?What types of disease (biological hazards) threatenpeople in developing countries <strong>and</strong> developedcountries?How can risks be estimated, managed, <strong>and</strong>reduced?19-1 RISK, PROBABILITY,AND HAZARDSWhat Is Risk? The Chances We TakeRisk is a measure of the likelihood that you willsuffer harm from a hazard.Risk is the possibility of suffering harm from a hazardthat can cause injury, disease, death, economic loss, orenvironmental damage. Risk assessment is the scientificprocess of estimating how much harm a particularhazard can cause to human health. Risk managementinvolves deciding whether or how to reduce a particularrisk to a certain level <strong>and</strong> at what cost.Risk is usually expressed in terms of probability: amathematical statement about how likely one is tosuffer harm from a hazard. Scientists often state probabilityin terms such as “The lifetime probability ofdeveloping lung cancer from smoking a pack of cigarettesa day is 1 in 250.” This means that 1 of every250 people who smoke a pack of cigarettes a day willdevelop lung cancer over a typical lifetime (usuallyconsidered 70 years).It is important to distinguish between possibility<strong>and</strong> probability. When we say that it is possible that asmoker can get lung cancer we are saying that thisevent could happen. Probability gives us an estimate ofthe likelihood of such an event. Figure 19-2 summarizeshow risks are assessed <strong>and</strong> managed.What Are the Major Types of Hazards?They Are All Around Us, But How RiskyAre They?We can suffer harm from cultural hazards,chemical hazards, physical hazards, <strong>and</strong> biologicalhazards, but determining the risks involved isdifficult.We can suffer harm from four major types of hazards:Risk AssessmentHazard identificationWhat is the hazard?Probability of riskHow likely is theevent?Consequences of riskWhat is the likelydamage?Risk ManagementComparative risk analysisHow does it comparewith other risks?Risk reductionHow much shouldit be reduced?Risk reduction strategyHow will the riskbe reduced?Financial commitmentHow much moneyshould be spent?Figure 19-2 Risk assessment <strong>and</strong> risk management.■ Cultural hazards such as unsafe working conditions,smoking, poor diet, drugs, drinking, driving, criminalassault, unsafe sex, <strong>and</strong> poverty■ Physical hazards such as ionizing radiation, fire,tornado (Figure 6-3, p. 103), hurricane (Figure 6-4,p. 104), flood (Figure 15-24, p. 327), volcanic eruption(Figure 16-8, p. 338), <strong>and</strong> earthquake (Figure 16-6,p. 337)■ Chemical hazards from harmful chemicals in the air,water, soil, <strong>and</strong> food■ Biological hazards from pathogens (bacteria, viruses,<strong>and</strong> parasites), pollen <strong>and</strong> other allergens, <strong>and</strong> animalssuch as bees <strong>and</strong> poisonous snakes19-2 TOXICOLOGY: ASSESSINGCHEMICAL HAZARDSWhat Determines Whether a ChemicalIs Harmful? How Much, How Often,<strong>and</strong> GenesThe harm caused by exposure to a chemicaldepends on the amount of exposure (dose),frequency of exposure, who is exposed, how wellthe body’s detoxification systems work, <strong>and</strong> one’sgenetic makeup.Toxicity measures how harmful a substance is in causinginjury, illness, or death to a living organism. Thisdepends on several factors. One is dose, the amount ofa substance a person has ingested, inhaled, or absorbedthrough the skin. Other factors are frequency ofexposure, who is exposed (adult or child, for example),<strong>and</strong> how well the body’s detoxification systems (suchas the liver, lungs, <strong>and</strong> kidneys) work.410 CHAPTER 19 Risk, Toxicology, <strong>and</strong> Human Health
Number of individuals affectedVerysensitiveMajority ofpopulationVeryinsensitive0 20 40 60 80Dose (hypothetical units)Figure 19-3 Typical variations in sensitivity to a toxic chemicalwithin a population, mostly because of differences in geneticmakeup. Some individuals in a population are very sensitive tosmall doses of a toxin (left), <strong>and</strong> others are very insensitive(right). Most people fall between these two extremes (middle).Toxicity also depends on genetic makeup that determinesan individual’s sensitivity to a particular toxin(Figure 19-3). This genetic variation in individual responsesto exposure to various toxins raises a difficultethical, political, <strong>and</strong> economic question. When regulatinglevels of a toxic substance in the environment,should the allowed level be set to protect the most sensitiveindividuals (at great cost) or the average person?What is your view on this issue? Why?Five major factors can affect the harm caused by asubstance. One is its solubility. Water-soluble toxins(which are often inorganic compounds) can movethroughout the environment <strong>and</strong> get into water supplies<strong>and</strong> the aqueous solutions that surround the cellsin our bodies.Oil- or fat-soluble toxins (which are usually organiccompounds) can penetrate the membranes surroundingan organism’s cells because the membranes allowsimilar oil-soluble chemicals to pass through them.Thus, oil- or fat-soluble toxins can accumulate in bodytissues <strong>and</strong> cells.A second factor is a substance’s persistence. Manychemicals, such as the pesticide DDT (banned in manycountries but still used in some), are often used becauseof their persistence or resistance to breakdown.They do their job for a long time. But this persistencealso means they can have long-lasting harmful effectson the health of wildlife <strong>and</strong> people.A third factor for some substances is bioaccumulation,in which some molecules are absorbed <strong>and</strong>stored in specific organs or tissues at higher than normallevels. This means that a chemical found at a fairlylow concentration in the environment can build up toa harmful level in certain organs <strong>and</strong> tissues.Arelated factor is biomagnification, in which levelsof some potential toxins in the environment aremagnified as they pass through food chains <strong>and</strong> webs.Organisms at low trophic levels might ingest onlysmall amounts of a toxin, but each animal on the nextlevel up that eats many of those organisms will take inlarger amounts of that toxin. As the toxin movesthrough higher trophic levels, organisms at each levelconsume increasingly greater amounts of the toxin. Figure19-4 provides an illustration of this effect. Examplesof chemicals that can be biomagnified include longlived,fat-soluble organic compounds such as DDT,DDT in fish-eatingbirds (ospreys)25 ppmDDT in largefish (needle fish)2 ppmDDT in smallfish (minnows)0.5 ppmDDT inzooplankton0.04 ppmDDT in water0.000003 ppm,or 3 pptFigure 19-4 Bioaccumulation <strong>and</strong> biomagnification.DDT is a fat-soluble chemical that can accumulatein the fatty tissues of animals. In a foodchain or web, the accumulated DDT can be biologicallymagnified in the bodies of animals ateach higher trophic level. This diagram showsthat the concentration of DDT in the fatty tissuesof organisms was biomagnified about 10 milliontimes in this food chain in an estuary near LongIsl<strong>and</strong> Sound in New York. If each phytoplanktonorganism takes up from the water <strong>and</strong> retains oneunit of DDT, a small fish eating thous<strong>and</strong>s of zooplankton(which feed on the phytoplankton) willstore thous<strong>and</strong>s of units of DDT in its fatty tissue.Then each large fish that eats 10 of the smallerfish will ingest <strong>and</strong> store tens of thous<strong>and</strong>s ofunits, <strong>and</strong> each bird (or human) that eats severallarge fish will ingest hundreds of thous<strong>and</strong>s ofunits. Black dots represent DDT, <strong>and</strong> arrowsshow small losses of DDT through respiration <strong>and</strong>excretion.http://biology.brookscole.com/miller14411
PCBs (oily chemicals used in electrical transformers),<strong>and</strong> some radioactive isotopes (such as strontium-90).A fifth factor is chemical interactions that c<strong>and</strong>ecrease or multiply the harmful effects of a toxin.An antagonistic interaction can reduce harmful effects.For example, vitamins E <strong>and</strong> A apparently interact toreduce the body’s response to some cancer-causingchemicals.A synergistic interaction multiplies harmful effects.For instance, workers exposed to tiny fibers of asbestosincrease their chances of getting lung cancer 20-fold.But asbestos workers who also smoke have a 400-foldincrease in lung cancer rates. In such cases, one plusone can be a lot greater than two.The effects of exposure to a chemical can be acuteor chronic. The type <strong>and</strong> amount of health damage resultingfrom exposure to a chemical or other agent arecalled the response. An acute effect is an immediate orrapid harmful reaction to an exposure—ranging fromdizziness to death. A chronic effect is a permanent orlong-lasting consequence (kidney or liver damage, forexample) from exposure to a single dose or to repeatedsublethal doses of a harmful substance.What Are Some Basic Principles of Toxicology?The Dose Makes the Poison—Or Does It?Any substance can be harmful if ingested in a largeenough quantity, but the critical question is, what isthe lowest level of exposure that causes harm?A basic concept of toxicology is that any synthetic or naturalchemical can be harmful if ingested in a large enoughquantity. In other words, every chemical is harmful atsome level of exposure. For example, drinking 100 cupsof strong coffee one after another would expose mostpeople to a lethal dosage of caffeine. Similarly, downing100 tablets of aspirin or 1 liter (1.1 quarts) of purealcohol (ethanol) would kill most people.The critical question is, how much exposure to a particulartoxic chemical causes a harmful response? This is themeaning of the chapter-opening quote by the Germanscientist Paracelsus about the dose making the poison.A basic problem is that people vary in terms of thedose of a toxin they can tolerate without significantharm, because of differences in their genetic makeup(Figure 19-3). Because of this variation in how individualsrespond to exposure to a toxic chemical, a better wayto state Paracelsus’ principle of toxicology is: The dosemakes the poison, but differently for different individuals.Your body has three major mechanisms for reducingthe harmful effects of some chemicals. First, it canbreak down (usually by enzymes found in the liver),dilute, or excrete—for example, in your breath, sweat,<strong>and</strong> urine—small amounts of most toxins to keep themfrom reaching harmful levels. However, accumulationsof high levels of toxins can overload the ability ofyour liver <strong>and</strong> kidneys to degrade <strong>and</strong> excrete suchsubstances.Second, your cells have enzymes that can sometimesrepair damage to DNA <strong>and</strong> protein molecules.Third, cells in some parts of your body (such as yourskin <strong>and</strong> the linings of your gastrointestinal tract,lungs, <strong>and</strong> blood vessels) can reproduce fast enough toreplace damaged cells. However, such high rates ofcell reproduction can be altered by exposure to ionizingradiation <strong>and</strong> certain chemicals so that cell growthaccelerates <strong>and</strong> creates a nonmalignant or malignant(cancerous) tumor.Should We Be Concerned about TraceLevels of Toxic Chemicals? It Dependson the Chemical.Trace amounts of chemicals in the environmentor your body may or may not be harmful.Should we be concerned about trace amounts of variouschemicals in air, water, food, <strong>and</strong> our bodies? Thehonest answer is that we do not know in most casesbecause of a lack of data <strong>and</strong> the difficulty of determiningthe effects of exposures to low levels of chemicals.Some scientists think that trace levels of mostchemicals are not harmful. They point to the dramaticincrease in average life expectancy in the United Statessince 1950. They say we should concentrate limited researchfunds on much greater health risks such assmoking, obesity, <strong>and</strong> infectious diseases (especiallythose that affect people in developing countries).Other scientists are not so sure <strong>and</strong> believe thatmuch more research is needed to help us evaluate thepossible long-term harm caused by exposure to lowlevels of thous<strong>and</strong>s of new synthetic chemicals that wehave put into the environment during the past fewdecades.Chemists are able to detect increasingly smallamounts of potentially toxic chemicals in air, water, <strong>and</strong>food. This is good news, but it can give the false impressionthat dangers from toxic chemicals are increasingwhen in some cases all we are doing is uncovering levelsof chemicals that have been around for a long time.Some people also have the mistaken idea that naturalchemicals are safe <strong>and</strong> synthetic chemicals areharmful. In fact, many synthetic chemicals are quitesafe if used as intended, <strong>and</strong> many natural chemicalsare deadly.The average person, for instance, is far more likelyto be killed by aflatoxin, a carcinogen produced bymolds in peanut butter <strong>and</strong> corn, than to be killed bylightning or by a shark. However, the chance of dyingof cancer from eating several spoonfuls of peanut buttera day is quite small.412 CHAPTER 19 Risk, Toxicology, <strong>and</strong> Human Health
How Can We Estimate the Toxicity of aChemical? Kill Half of the Animals in a TestPopulationChemicals vary widely in their toxicity to humans<strong>and</strong> other animals.A poison or toxin is a chemical that adversely affectsthe health of a living human or animal by causing injury,illness, or death. One method for determining therelative toxicity of various chemicals is to measure itseffects on test animals. A widely used method for estimatingthe toxicity of a chemical is to determine itslethal dose (LD). This is often done by measuring achemical’s median lethal dose or LD50: the amountreceived in one dose that kills 50% of the animals (usuallyrats <strong>and</strong> mice) in a test population within a 14-dayperiod (Figure 19-5).Chemicals vary widely in their toxicity (Table 19-1,p. 414). Some poisons can cause serious harm or death aftera single acute exposure at very low dosages. Otherscause such harm only at dosages so huge that it is nearlyimpossible to get enough into the body. Most chemicalsfall between these two extremes. In 2004, the U.S. <strong>Environmental</strong>Protection Agency listed arsenic, lead, mercury,vinyl chloride (used to make polyvinylchloride orPVC plastics), <strong>and</strong> polychlorinated biphyenyls (PCBs) inorder as the five top toxic substances in terms of human<strong>and</strong> environmental health in the list of 276 substances itregulates under the Comprehensive <strong>Environmental</strong>Percentage of population killed by a given dose1007550250 2LD504 6 8 10 12 14 16Dose (hypothetical units)Figure 19-5 Hypothetical dose-response curve showingdetermination of the LD50, the dosage of a specific chemicalthat kills 50% of the animals in a test group. This is one methodthat toxicologists use to determine <strong>and</strong> compare the toxicities ofdifferent chemicals.Response, Compensation, <strong>and</strong> Liability Act, commonlyknown as the Superfund Act.How Do Scientists Use Case Reports <strong>and</strong>Epidemiological Studies to Estimate Toxicity?Reports from the Front Lines <strong>and</strong> ControlledExperimentsWe can estimate toxicity by using case reports aboutthe harmful effects of chemicals on human health<strong>and</strong> by comparing the health of a group of peopleexposed to a chemical with that of a similar groupnot exposed to the chemical.Scientists use various methods to get information aboutthe harmful effects of chemicals on human health. Oneis case reports, usually made by physicians. They provideinformation about people suffering some adversehealth effect or death after exposure to a chemical. Suchinformation often involves accidental poisonings, drugoverdoses, homicides, or suicide attempts.Most case reports are not reliable sources for estimatingtoxicity because the actual dosage <strong>and</strong> theexposed person’s health status are often not known.But such reports can provide clues about environmentalhazards <strong>and</strong> suggest the need for laboratoryinvestigations.Another source of information is epidemiologicalstudies. They involve comparing the health of people exposedto a particular chemical (the experimental group)with the health of another group of statistically similarpeople not exposed to the agent (the control group). Thegoal is to determine whether the statistical associationbetween exposure to a toxic chemical <strong>and</strong> a health problemis strong, moderate, weak, or undetectable.Three factors can limit the usefulness of epidemiologicalstudies. One problem is that in many casestoo few people have been exposed to high enoughlevels of a toxic agent to detect statistically significantdifferences. Another limitation is that conclusivelylinking an observed effect with exposure to a particularchemical is difficult because people are exposed tomany different toxic agents throughout their lives.Another limitation is that we cannot use epidemiologicalstudies to evaluate hazards from new technologiesor chemicals to which people have not beenexposed.How Do Scientists Use LaboratoryExperiments to Estimate Toxicity?Controversial Animal TestingExposing a population of live laboratory animals(especially mice <strong>and</strong> rats) to known amounts of achemical is the most widely used method fordetermining its toxicity.http://biology.brookscole.com/miller14413
Table 9-1 Toxicity Ratings <strong>and</strong> Average Lethal Doses for HumansLD50 (milligrams perToxicity Rating kilogram of body weight)* Average Lethal Dose † ExamplesSupertoxic Less than 0.01 Less than 1 drop Nerve gases, botulism toxin, mushroom toxins,dioxin (TCDD)Extremely toxic Less than 5 Less than 7 drops Potassium cyanide, heroin, atropine, parathion,nicotineVery toxic 5–50 7 drops to 1 teaspoon Mercury salts, morphine, codeineToxic 50–500 1 teaspoon to 1 ounce Lead salts, DDT, sodium hydroxide, sodiumfluoride, sulfuric acid, caffeine, carbontetrachlorideModerately toxic 500–5,000 1 ounce to 1 pint Methyl (wood) alcohol, ether, phenobarbital,amphetamines (speed), kerosene, aspirinSlightly toxic 5,000–15,000 1 pint to 1 quart Ethyl alcohol, Lysol, soapsEssentially nontoxic 15,000 or greater More than 1 quart Water, glycerin, table sugar*Dosage that kills 50% of individuals exposed†Amounts of substances in liquid form at room temperature that are lethal when given to a 70.4-kilogram (155-pound) humanThe most widely used method for determining toxicityis to expose a population of live laboratory animals(especially mice <strong>and</strong> rats) to measured dosesof a specific substance under controlled conditions.Animal tests take 2–5 years <strong>and</strong> cost $200,000 to$2 million per substance tested. Such tests also kill orharm <strong>and</strong> can be painful to the test animals. The goalis to develop data on the response of the test animalsto various doses of a chemical (called a dose-responsecurve). But estimating the effects of low doses isdifficult.Animal welfare groups want to limit or ban use oftest animals or ensure that experimental animals aretreated in the most humane manner possible. Morehumane methods for carrying out toxicity tests areavailable. They include computer simulations <strong>and</strong> usingtissue cultures of cells <strong>and</strong> bacteria, chicken eggmembranes, <strong>and</strong> measurements of changes in the electricalproperties of individual animal cells.These alternatives can greatly decrease the use ofanimals for testing toxicity. But many scientists contendthat some animal testing is needed because thealternative methods cannot adequately mimic thecomplex biochemical interactions of a live animal.Acute toxicity tests are run to develop a doseresponsecurve, which shows the effects of variousdosages of a toxic agent on a group of test organisms(Figure 19-6). Such tests are controlled experiments inwhich the effects of the chemical on a test group arecompared with the responses of a control group of organismsnot exposed to the chemical. Care is takenthat organisms in both groups are as identical as possiblein age, health status, <strong>and</strong> genetic makeup, <strong>and</strong> thatall are exposed to the same environmental conditions.Fairly high dosages are used to reduce the numberof test animals needed, obtain results quickly, <strong>and</strong>lower costs. Otherwise, tests would have to be run onmillions of laboratory animals for many years, <strong>and</strong>manufacturers could not afford to test most chemicals.For the same reasons, scientists usually use mathematicalmodels to extrapolate the results of high-doseexposures to low-dose levels. Then they extrapolatethe low-dose results on the test organisms to humansto estimate LD50 values for acute toxicity (Table 19-1).According to the nonthreshold dose-response model(Figure 19-6, left), any dosage of a toxic chemical orionizing radiation causes harm that increases with theEffectNonlineardose-responseLinear doseresponseDoseNo thresholdEffectThresholdlevelDoseThresholdFigure 19-6 Two types of dose-response curves. The linear<strong>and</strong> nonlinear curves in the left graph apply if even the smallestdosage of a chemical or ionizing radiation has a harmful effectthat increases with the dosage. The curve on the right applies ifa harmful effect occurs only when the dosage exceeds a certainthreshold level. Which model is better for a specific harmfulagent is uncertain because of the difficulty in estimating theresponse to very low dosages.414 CHAPTER 19 Risk, Toxicology, <strong>and</strong> Human Health
dosage. With the threshold dose-response model (Figure19-6, right), a threshold dosage must be reachedbefore any detectable harmful effects occur, presumablybecause the body can repair the damage causedby low dosages of some substances. Establishingwhich of these models applies at low dosages isextremely difficult <strong>and</strong> controversial. To be on the safeside, scientists usually use the nonthreshold doseresponsemodel.Some scientists challenge the validity of extrapolatingdata from test animals to humans because humanphysiology <strong>and</strong> metabolism often differ fromthose of the test animals. Other scientists say that suchtests <strong>and</strong> models work fairly well (especially for revealingcancer risks) when the correct experimentalanimal is chosen or when a chemical is toxic or harmfulto several different test animal species.The problem of estimating toxicities is difficult.One problem is that in real life each of us is exposed toa variety of chemicals, some of which can interact inways to decrease or enhance their individual effectsover short <strong>and</strong> long times. Thus we could furthermodify Paracelsus’ original idea as follows: The doseof a usually unknown mixture of chemicals makes the poison,but differently for different individuals.There are more problems. Toxicologists have greatdifficulty in estimating the toxicity of a single substance.Adding the problem of evaluating mixtures ofpotentially toxic substances, separating out whichones are the culprits, <strong>and</strong> determining how they caninteract with one another is overwhelming from a scientific<strong>and</strong> economic st<strong>and</strong>point. For example, juststudying the interactions of all possible combinationsof three of the 500 most widely used industrial chemicalswould take 20.7 million experiments—a physical<strong>and</strong> financial impossibility.The effects of a particular chemical can also dependupon when exposure occurs. For example, childrencan be much more susceptible to toxic substancesthan an adult for several reasons. On a per weight basischildren breathe more air, drink more water, <strong>and</strong>eat more food than do adults. They are also exposed totoxins in dust or soil when they frequently put theirfingers, toys, or other objects in their mouths. In addition,immune systems <strong>and</strong> processes for degrading orexcreting toxins <strong>and</strong> repairing damage are usually lesswell developed in children than in adults.In 2003, the U.S. <strong>Environmental</strong> Protection Agencyproposed that in determining risk, regulators shouldassume that the risk of children getting cancer from exposureto chemicals that can cause cancer is 10 timesthe exposure risk of adults. Some health scientists contendthat these guidelines are too weak <strong>and</strong> to be onthe safe side regulators should assume that the risk ofharm from toxins for children should be 100 times thatof adults.In 2003, the U.S. government initiated a NationalChildren’s Study that will follow the health <strong>and</strong> exposurelevels to key toxins for 100,00 children from birthto age 18. As you can see, toxicologists have importantbut difficult jobs.Can a Little Bit of Arsenic or Radiation BeGood for You? Controversy over HormesisThere is controversy over the hypothesis that verysmall doses of radiation <strong>and</strong> some toxins may havebeneficial health effects.There is a hypothesis that radiation <strong>and</strong> some toxicsubstances that can harm or kill us at high doses mayhave beneficial health effects at very low doses. Thisphenomenon is called hormesis. A possible explanationfor this effect is that very small doses of some substancesmay stimulate cellular repair or other beneficialresponses.Edward Calabrese, a highly respected toxicologistat the University of Massachusetts, Amherst, has madea thorough examination of the literature on this subject.He has concluded that the idea has merit <strong>and</strong>needs more research to test its validity <strong>and</strong> discoverthe possible mechanisms involved.Poor Paracelsus. If this idea turns out to have validityfor some substances, we must further modify hisoriginal hypothesis as follows: The dose of the mixtureof chemicals usually makes the poison—differently fordifferent individuals—but in some cases a tiny bit of apoison may be good for you. The various possible revisionsof the original hypothesis proposed by Paracelsusare a good example of how scientific hypotheses aremodified to account for new data.Scientists are waiting for more evidence to come inbefore accepting the hormesis hypothesis. Stay tunedfor more developments about this fascinating idea.How Good Are Estimates of Toxicity? TakingUncertainty into AccountBecause all methods of estimating toxicity haveserious limitations, allowed exposure levels areusually set well below the estimated harmfullevels.As we have seen, all methods for estimating toxicitylevels <strong>and</strong> risks have serious limitations. But they areall we have. To take this uncertainty into account <strong>and</strong>minimize harm, scientists <strong>and</strong> regulators typically setallowed exposure levels to toxic substances <strong>and</strong> ionizingradiation at 1/100 or even 1/1,000 of the estimatedharmful levels.Despite their many limitations, carefully conducted<strong>and</strong> evaluated toxicity studies are importantsources of information for underst<strong>and</strong>ing doseresponseeffects <strong>and</strong> estimating <strong>and</strong> setting exposurehttp://biology.brookscole.com/miller14415
st<strong>and</strong>ards. But citizens, lawmakers, <strong>and</strong> regulatory officialsmust recognize the huge uncertainties involvedin all such studies.19-3 CHEMICAL HAZARDSWhat Are Toxic <strong>and</strong> Hazardous Chemicals?Causing Death <strong>and</strong> HarmToxic chemicals can kill, <strong>and</strong> hazardous chemicalscan cause various types of harm.A toxic chemical is a chemical, which through itschemical action on life processes, can cause temporaryor permanent harm or death to humans or animals. Itstoxicity is often measured in terms of its mediumlethal dose (Figure 19-5). A hazardous chemical canharm humans or other animals because it is flammableor explosive or because it can irritate or damage theskin or lungs, interfere with oxygen uptake, or induceallergic reactions.There are three major types of potentially toxicagents. One consists of mutagens, chemicals or ionizingradiation that cause or increase the frequency ofr<strong>and</strong>om mutations, or changes, in the DNA moleculesfound in cells. An example is nitrous acid (HNO 2 )formed by digestion of nitrite preservatives in foods.Most mutations are harmless. One reason is that organismshave biochemical repair mechanisms that cancorrect mistakes or changes in the DNA code.But harmful mutations occurring in reproductivecells can be passed on to offspring <strong>and</strong> to future generations.It is generally accepted that there is no safethreshold for exposure to harmful mutagens.A second type consists of teratogens, chemicalsthat cause harm or birth defects to a fetus or embryo.Ethyl alcohol is an example of a teratogen. Drinkingduring pregnancy can lead to offspring with a lowbirth weight <strong>and</strong> a number of physical, developmental,<strong>and</strong> mental problems. Thalidomide is also a potentteratogen.The third group is carcinogens, chemicals or ionizingradiation that cause or promote cancer—thegrowth of a malignant (cancerous) tumor, in whichcertain cells multiply uncontrollably. An example isbenzene, a widely used chemical solvent. Many canceroustumors spread by metastasis when malignantcells break off from tumors <strong>and</strong> travel in body fluids toother parts of the body. There they start new tumors,making treatment much more difficult. Typically,10–40 years may elapse between the initial exposure toa carcinogen <strong>and</strong> the appearance of detectable symptoms.Partly because of this time lag, many healthyteenagers <strong>and</strong> young adults have trouble believingtheir smoking, drinking, eating, <strong>and</strong> other lifestylehabits today could lead to some form of cancer beforethey reach age 50.What Effects Can Some Chemicals Have onImmune, Nervous, <strong>and</strong> Endocrine Systems?Possible Harm from Small DosesLong-term exposure to some chemicals at lowdoses may disrupt the body’s immune, nervous, <strong>and</strong>endocrine systems.Since the 1970s a growing body of research on wildlife<strong>and</strong> laboratory animals, along with some epidemiologicalstudies of humans, indicates that long-termexposure to low doses of some chemicals in the environmentcan disrupt the body’s immune, nervous, <strong>and</strong>endocrine systems.The immune system consists of specialized cells<strong>and</strong> tissues that protect the body against disease <strong>and</strong>harmful substances by forming antibodies that makeinvading agents harmless. Ionizing radiation <strong>and</strong>some chemicals can weaken the human immune system<strong>and</strong> leave the body vulnerable to attacks by allergens,infectious bacteria, viruses, <strong>and</strong> protozoans.Examples are arsenic <strong>and</strong> dioxins.Some natural <strong>and</strong> synthetic chemicals in the environment,called neurotoxins, can harm the human nervoussystem (brain, spinal cord, <strong>and</strong> peripheral nerves).For example, many poisons <strong>and</strong> the venom of poisonoussnakes are neurotoxins, which inhibit, damage, ordestroy nerve cells (neurons) that transmit electrochemicalmessages throughout the body. Effects caninclude behavioral changes, paralysis, <strong>and</strong> death.Other examples of neurotoxins are PCBs, mercury, <strong>and</strong>certain pesticides.The endocrine system is a complex network of gl<strong>and</strong>sthat release very small amounts of hormones in thebloodstream of humans <strong>and</strong> other vertebrate animals.Low levels of these chemical messengers turn on <strong>and</strong> offbodily systems that control sexual reproduction,growth, development, learning ability, <strong>and</strong> behavior.Each type of hormone has a specific molecularshape that allows it to attach only to certain cell receptors(Figure 19-7, left). Once bonded together, thehormone <strong>and</strong> its receptor molecule can signal cellmechanisms to execute the chemical message carriedby the hormone.Case Study: Are Hormonally Active Agentsa Human Health Threat? Serious Concernbut Inconclusive EvidenceExposure to low levels of certain syntheticchemicals may disrupt the effects of natural hormonesin animals, but more research is needed to determinethe effects of these chemicals on humans.There is concern that human exposure to low levels ofcertain synthetic chemicals can mimic <strong>and</strong> disrupt theeffects of natural hormones. Over the last 25 years, expertsfrom a number of disciplines have been piecingtogether field studies on wildlife, studies on labora-416 CHAPTER 19 Risk, Toxicology, <strong>and</strong> Human Health
HormoneEstrogenlike chemicalAnti<strong>and</strong>rogen chemicalReceptorCellNormal Hormone Process Hormone Mimic Hormone BlockerFigure 19-7 Hormones are molecules that act as messengers in the endocrine system to regulate various bodilyprocesses, including reproduction, growth, <strong>and</strong> development. Each type of hormone has a unique molecularshape that allows it to attach to specially shaped receptors on the surface of, or inside, cells <strong>and</strong> to transmit itschemical message (left). Molecules of certain pesticides <strong>and</strong> other synthetic chemicals have shapes similar tothose of natural hormones <strong>and</strong> can affect the endocrine system in people <strong>and</strong> various other animals. Thesemolecules are called hormonally active agents (HAAs). Some HAAs, sometimes called hormone mimics, disruptthe endocrine system by attaching to estrogen receptor molecules (center) <strong>and</strong> giving too-strong, tooweak,or mistimed signals. Other HAAs, sometimes called hormone blockers, prevent natural hormones suchas <strong>and</strong>rogens from attaching to their receptors (right) so that no signal is given. Some pollutants, called thyroiddisrupters, may disrupt hormones released by thyroid gl<strong>and</strong>s <strong>and</strong> cause growth <strong>and</strong> weight disorders <strong>and</strong>brain <strong>and</strong> behavioral disorders. Because of the difficulty in determining the harmful effects of long-term exposureto low levels of HAAs, there is uncertainty over their effects on human health.tory animals, <strong>and</strong> epidemiological studies of humanpopulations. This analysis suggests that a variety ofhuman-made chemicals can act as hormone or endocrinedisrupters, known as hormonally active agents (HAAs).Examples of hormone disrupters are DDT, PCBs, <strong>and</strong>certain herbicides.Some, called hormone mimics, are chemicals similarto estrogens (female sex hormones). They can disruptthe endocrine system by attaching to estrogen receptormolecules (Figure 19-7, center). Others, called hormoneblockers, disrupt the endocrine system by preventingnatural hormones such as <strong>and</strong>rogens (male sex hormones)from attaching to their receptors (Figure 19-7,right). Estrogen mimics <strong>and</strong> hormone blockers aresometimes called gender benders because of their possibleeffects on sexual development <strong>and</strong> reproduction.There is also growing concern about still anothergroup of HAAs—pollutants that can act as thyroid disrupters<strong>and</strong> cause growth, weight, brain, <strong>and</strong> behavioraldisorders.Is long-term exposure to low levels of HAAs athreat to human health? A 1999 study of the possibleeffects of hormonally active agents on humans by aU.S. National Academy of Sciences panel of scientistscame to three major conclusions. First, “adverse reproductive<strong>and</strong> developmental effects have been observedin human populations, wildlife, <strong>and</strong> laboratory animalsas a consequence of exposure to HAAs.” Second,“there have been only a few studies of the effects ofHAAs in humans, but the results of laboratory <strong>and</strong>wildlife studies suggest that HAAs have the potentialto affect human immune functions.” Third, greatly increasedresearch is needed to come to a more definitiveconclusion about whether low levels of most HAAs inthe environment pose a threat to human health.Bottom line: We do not know whether exposure totrace amounts of various hormonally active chemicalsintroduced into the environment have harmful effectson humans <strong>and</strong> other animals. Some scientists saythere is no definitive evidence for harm from HAAs tohumans <strong>and</strong> dismiss it as a minor threat. But otherssay there is enough preliminary evidence to warrantgreatly increased research on their possible effects.This will take decades.Some scientists say we need to wait for the resultsof more research before banning or severely restrictingHAAs. Other scientists believe that as a precaution, weshould sharply reduce the use of potential hormonedisrupters.Why Do We Know So Little about the HarmfulEffects of Chemicals? Establishing Guilt IsDifficultUnder existing laws most chemicals are consideredinnocent until shown to be guilty, <strong>and</strong> estimatingtheir toxicity to establish guilt is difficult, uncertain,<strong>and</strong> expensive.According to risk assessment expert Joseph V.Rodricks, “Toxicologists know a great deal about a fewhttp://biology.brookscole.com/miller14417
chemicals, a little about many, <strong>and</strong> next to nothingabout most.” The U.S. National Academy of Sciencesestimates that only about 10% of at least 80,000 chemicalsin commercial use have been thoroughly screenedfor toxicity, <strong>and</strong> only 2% have been adequately testedto determine whether they are carcinogens, teratogens,or mutagens. Hardly any of the chemicals in commercialuse have been screened for possible damage to thehuman nervous, endocrine, <strong>and</strong> immune systems.Currently, federal <strong>and</strong> state governments do notregulate about 99.5% of the commercially used chemicalsin the United States. There are several reasons forthis lack of regulation. One is that under existing U.S.laws, most chemicals are considered innocent untilshown to be guilty. Some analysts think this is the oppositeof the way it should be. They ask why chemicalsshould have the same legal rights as people.A second reason is that there are not enoughfunds, personnel, facilities, <strong>and</strong> test animals availableto provide such information for more than a smallfraction of the many individual chemicals we encounterin our daily lives. A third limitation is that it isdifficult <strong>and</strong> expensive to analyze the combined effectsof multiple exposures to various chemicals <strong>and</strong> thepossible interactions of such chemicals.xHOW WOULD YOU VOTE? Should chemicals be regulatedbased on their effects on the nervous, immune, <strong>and</strong> endocrinesystems? Cast your vote online at http://biology.brookscole.com/miller14.Is Pollution Prevention the Answer?Taking PrecautionsPreliminary but not conclusive evidence that achemical causes significant harm should spurpreventive action, some say.So where does this leave us? We do not know a lotabout the potentially toxic chemicals around us <strong>and</strong> insideof us, <strong>and</strong> estimating their effects is very difficult,time consuming, <strong>and</strong> expensive. Is there a way out ofthis dilemma?Some scientists <strong>and</strong> health officials, especiallythose in European Union countries, are pushing formuch greater emphasis on pollution prevention. Theysay we should not release into the environment chemicalsthat we know or suspect can cause significantharm. This means looking for harmless or less harmfulsubstitutes for toxic <strong>and</strong> hazardous chemicals or recyclingthem within production processes so they do notreach the environment.This prevention strategy greatly reduces the expendituresof huge amounts of money on statistically uncertain<strong>and</strong> controversial toxicity studies <strong>and</strong> exposurest<strong>and</strong>ards. It also lowers the risk from exposure to potentiallyhazardous chemicals <strong>and</strong> products <strong>and</strong> theirpossiblebutpoorlyunderstoodmultipleinteractions.This approach is based on the precautionary principle:When there is plausible but incomplete scientificevidence (frontier science evidence) of significant harmto humans or the environment from a proposed or existingchemical or technology, we should take action toprevent or reduce the risk instead of waiting for moreconclusive (sound or consensus science) evidence. Thisprinciple is based on familiar axioms: “Look beforeyou leap.” “Better safe than sorry.” “An ounce of preventionis worth a pound of cure.”Under this approach, those proposing to introducea new chemical or technology would bear the burdenof establishing its safety. This means two major changesin the way we evaluate risks. First, new chemicals <strong>and</strong>technologies would be assumed harmful until scientificstudies can show otherwise. Second, existing chemicals<strong>and</strong> technologies that appear to have a strongchance of causing significant harm would be removedfrom the market until their safety can be established.Some movement is being made in this direction,especially in the European Union. In 2000, negotiatorsagreed to a global treaty that would ban or phase outuse of 12 of the most notorious persistent organic pollutants(POPs), also called the dirty dozen. The list includedDDT <strong>and</strong> eight other persistent pesticides,PCBs, <strong>and</strong> dioxins <strong>and</strong> furans. New chemicals wouldbe added to the list when the harm they cause is seenas outweighing their usefulness. This treaty went intoeffect in 2004.Manufacturers <strong>and</strong> businesses agree that somechemicals are too dangerous for widespread use <strong>and</strong>that some technologies such as coal-burning plantscarry high health risks. But they contend that widespreadapplication of the precautionary principlewould make it too expensive <strong>and</strong> almost impossible tointroduce any new chemical or technology. Strict applicationof the precautionary principle would stiflechemical <strong>and</strong> technological innovation <strong>and</strong> risk taking.We can never have a risk-free society. For example, ifwe had strictly applied the precautionary principlewould we have automobiles, antibiotics, or plastics?On the other h<strong>and</strong>, proponents of increased relianceon the precautionary principle say that it willencourage innovation in developing less harmful alternativechemicals <strong>and</strong> technologies <strong>and</strong> in findingways to prevent as much pollution as possible insteadof relying mostly on pollution control. It is true that wecannot have a risk-free society. But proponents believewe should make greater use of the precautionary principleeffort to reduce many of the risks we face. As youcan see, there are no easy answers for knowing whento apply the precautionary principle.xHOW WOULD YOU VOTE? Should we assume that newchemicals that can end up in the environment are guilty ofcausing harm until proven innocent? Cast your vote online athttp://biology.brookscole.com/miller14.418 CHAPTER 19 Risk, Toxicology, <strong>and</strong> Human Health
19-4 BIOLOGICAL HAZARDS:DISEASE IN DEVELOPED ANDDEVELOPING COUNTRIESWhat Are Nontransmissible <strong>and</strong> TransmissibleDiseases? To Spread or Not to SpreadDiseases not caused by living organisms do notspread from one person to another, <strong>and</strong> thosecaused by living organisms such as bacteria <strong>and</strong>viruses can spread from person to person.A nontransmissible disease is caused by somethingother than a living organism <strong>and</strong> does not spread fromone person to another. Such diseases tend to developslowly <strong>and</strong> have multiple causes. Examples are cardiovascular(heart <strong>and</strong> blood vessel) disorders, most cancers,diabetes, asthma, emphysema, <strong>and</strong> malnutrition.A transmissible disease is caused by a living organism<strong>and</strong> can spread from one person to another. Infectiousagents or pathogens (such as a bacterium, virus,protozoa, or parasite; Figure 19-8) cause such diseases.These agents are spread by air, water, food, <strong>and</strong> bodyfluids, <strong>and</strong> by some insects (such as mosquitoes; Figure19-9, p. 420) <strong>and</strong> other nonhuman carriers. All suchpathways are called vectors.Typically, a bacterium is a one-celled microorganismthat can replicate (clone) itself by simple cell division.A virus is a microscopic, noncellular infectiousagent. Its DNA or RNA contains instructions for makingmore viruses, but it has no apparatus to do this. Toreplicate, a virus must invade a host cell <strong>and</strong> take overthe cell’s DNA to create a factory for producing moreviruses (Figure 19-10, p. 421). A parasite is an organismthat feeds off another organism (p. 154). Protozoans are adiverse assortment of microscopic or near-microscopicorganisms that live as single cells or in simple colonies.Examples are Giardia lamblia that causes giardiasis, agastrointestinal disease transmitted by water, <strong>and</strong> severalspecies of Plasmodium that transmit malaria.According to the World Health Organization,about 30% of all deaths per year are caused by nontransmissiblecardiovascular disease, 26% by transmissibleinfectious disease (Figure 19-11, p. 421), <strong>and</strong> 12%by nontransmissible cancers.As a country industrializes, it usually makes anepidemiological transition in which deaths from the infectiousdiseases of childhood decrease <strong>and</strong> those fromthe chronic diseases of adulthood (heart disease <strong>and</strong>stroke, cancer, <strong>and</strong> respiratory conditions) increase.Good news. Since 1900, <strong>and</strong> especially since 1950,the incidence of infectious diseases <strong>and</strong> the death ratesfrom such diseases have been greatly reduced. Thishas been done mostly by a combination of betterhealth care, using antibiotics to treat infectious diseasecaused by bacteria, <strong>and</strong> developing vaccines to preventthe spread of some infectious viral diseases.Bad news. Many disease-carrying bacteria have developedgenetic immunity to widely used antibiotics(Case Study, below). Also, many disease-transmittingspecies of insects such as mosquitoes have become immuneto widely used pesticides that once helped controltheir populations.Case Study: Are We Losing Ground in OurStruggle against Infectious Bacteria? GrowingGerm Resistance to AntibioticsRapidly producing infectious bacteria can undergonatural selection <strong>and</strong> become genetically resistantto widely used antibiotics.We may be falling behind in our efforts to preventinfectious bacterial diseases because of the astoundingreproductive rate of bacteria, which can produce16,777,216 offspring in 24 hours. <strong>Their</strong> high reproductiverate allows them to become genetically resistant toan increasing number of antibiotics through naturalselection. They can also transfer such resistance tononresistant bacteria.Other factors play a role in the potentially seriousrise in the incidence of some infectious bacterial diseases—suchas tuberculosis (Case Study, p. 421)—oncecontrolled by antibiotics. One is that harmful bacteriaare spread around the globe by human travel <strong>and</strong> thetrade of goods. Another is that overuse of pesticidesVirusesHepatitis BHIV(AIDS)SmallpoxBacteriaVibrio cholerae(cholera)Myobacteriumtuberculosis(tuberculosis)ProtozoaEbolaOn this scale, a human hair would be 6 meters (20 feet) wideTreponema pallidum (syphilis)Plasmodium(malaria)1 micrometer 6 micrometers10 micrometersFigure 19-8 Examples of pathogens or agents that can cause transmissible diseases. A micrometer is onemillionthof a meter.http://biology.brookscole.com/miller14419
Dengue FeverPainful <strong>and</strong> sometimes fatal.Carried by four related viruses <strong>and</strong>strikes during rainy season.2.5 million people at risk;50 million new cases a year.MalariaEndemic in more than 100 countries.Caused by four protozoa species.270–500 million new cases <strong>and</strong>1 million deaths per year.Yellow FeverDreaded far more than 400 years.Viral disease that causes symptoms frommild to severe illness <strong>and</strong> death.200,000 new cases <strong>and</strong>30,000 deaths a year.Figure 19-9 A few species of mosquito act as vectors to transmit pathogens for a number of infectious diseases,including the three whose normal ranges are mapped here. Female mosquitoes feed on blood <strong>and</strong> malemosquitoes on plant juices. Thus, only the female mosquito bites people <strong>and</strong> animals to feed on their blood,<strong>and</strong> in the process transmits pathogens from one victim to later victims. Throughout human history, diseasetransmission by female mosquitoes has probably killed more people than any other single factor. However,most mosquito species do not transmit infectious diseases <strong>and</strong> mosquitoes play important ecological roles.<strong>Their</strong> eggs are a major food source for fish, various insects, <strong>and</strong> frogs <strong>and</strong> other amphibians. Adult mosquitoesare an important source of food for bats, spiders, <strong>and</strong> many insect <strong>and</strong> bird species. Mosquitoes locate us bythe CO 2 we give off, the odor of lactic acid secreted by our skin, <strong>and</strong> our body heat, which is why heat-absorbingdark clothes attract mosquitoes more than light-colored clothes do. Once a female mosquito finds us shepierces our skin, injects an anticoagulant mixed with saliva that keeps our blood flowing <strong>and</strong> also causes anitchy bump to rise, <strong>and</strong> drinks her fill of our blood. (World Health Organization <strong>and</strong> the U.S. Centers for DiseaseControl <strong>and</strong> Prevention)increases populations of pesticide-resistant insects <strong>and</strong>other carriers of bacterial diseases.An additional factor is overuse of antibiotics. Accordingto a 2000 study by Richard Wenzel <strong>and</strong>Michael Edward, at least half of all antibiotics used totreat humans are prescribed unnecessarily. In manycountries antibiotics are available without prescriptions,which also promotes unnecessary use.According to a 2001 study by the Union ofConcerned Scientists, nearly 75% of all antibioticsmanufactured in the United States are used mostly infeed additives to boost livestock production. Recent420 CHAPTER 19 Risk, Toxicology, <strong>and</strong> Human Health
A typical virus consists of a shell of proteinssurrounding genetic materialVirusCell membraneThe viral geneticmaterial uses thehost cell's DNA toreplicate again<strong>and</strong> again.New virusesThe virus attaches to thehost cell. The entire virusmay enter or it may injectits genetic material,or genome.Host cellNucleusGenetic materialSurface proteinsEach new copy ofthe virus directs thecell to make it aprotein shellchains now refuse to buy meat from livestock treatedwith antibiotics.The result of these factors acting together is thatevery major disease-causing bacterium now hasstrains that resist at least one of the roughly 160 antibioticswe use to treat bacterial infections. Consequently,the United States <strong>and</strong> other countries are seeing an increasein the number of patients who contract infectiousbacterial disease while they are in a hospital orother medical facility. According to a 2002 study by theJoint Commission for the Accreditation of HealthcareOrganizations, each year nearly 2 million Americansleave hospitals with mostly preventable infectionsthey acquired there, <strong>and</strong> at least 90,000 of them diedprematurely because of such infections.Biologist Paul Ewald suggests that we should stoptrying to obliterate lethal microbes <strong>and</strong> instead focuson how to weaken their effects by forcing them to mutatein certain ways. Maybe we can get the forces ofevolution on our side by causing viruses to becomeless virulent as they spread among the population.Case Study: The Global TuberculosisEpidemic—A Growing ThreatTuberculosis (TB) kills about 1.7 million peoplea year <strong>and</strong> could kill 28 million people by 2020.Since 1990, one of the world’s most underreportedstories has been the rapid spread of tuberculosis(TB). According to the World Health Organization,this highly infectious bacterial disease infects aboutDisease(type of agent)Deaths per yearThe new viruses emerge fromthe host cell capable of infectingother cells. This process oftendestroys the first cell.Figure 19-10 How a virus reproduces. (American MedicalAssociation)Pneumonia <strong>and</strong> flu(bacteria <strong>and</strong> viruses)HIV/AIDS(virus)Diarrheal diseases(bacteria <strong>and</strong> viruses)Tuberculosis(bacteria)Malaria(protozoa)Hepatitis B(virus)3.2 million3.0 million1.9 million1.7 million1 million1 millionstudies show that resistant strains of infectious diseasesthat develop in livestock animals can spread tohumans through contact with infected animals or water<strong>and</strong> through food webs. Good news. Because of publicpressure, efforts are being made to phase out theuse of antibiotics to boost livestock. Some fast foodMeasles(virus)800,000Figure 19-11 Each year the world’s seven deadliest infectiousdiseases kill about 12.6 million people—most of them poorpeople in developing countries. This amounts to about34,500 mostly preventable deaths every day. (World HealthOrganization)http://biology.brookscole.com/miller14421
Deaths per100,000 people
For example, the West Nile virus has spreadthroughout most of the lower 48 states but the chancesof being infected <strong>and</strong> killed by it is low (about 1 in2,500). In 2003, the flu killed more Americans in twodays than the West Nile virus killed during the entireyear.You can greatly reduce your chances of getting infectiousdiseases such as flu, the common cold, <strong>and</strong>SARS that spread from person to person by practicinggood old-fashioned hygiene. Wash your h<strong>and</strong>s thoroughly<strong>and</strong> often, <strong>and</strong> avoid touching your mouth,nose, <strong>and</strong> eyes.It is much harder to fight viral infections than infectionscaused by bacteria <strong>and</strong> protozoa. One problemis that most drugs that can kill a virus also harmthe cells of its host. Treating viral infections such ascolds, flu, <strong>and</strong> most mild coughs <strong>and</strong> sore throats withantibiotics is useless <strong>and</strong> increases genetic resistance indisease-causing bacteria.The best weapons against viruses are vaccines thatstimulate the body’s immune system to produce antibodiesto ward off viral infections. Immunization withvaccines has helped reduce the spread of viral diseasessuch as smallpox, polio, rabies, influenza, measles, <strong>and</strong>hepatitis B. But vaccines are not available for many viraldiseases.Case Study: How Serious Is the GlobalThreat from HIV <strong>and</strong> AIDS? A RapidlyGrowing Health ThreatThe spread of acquired immune deficiencysyndrome (AIDS), caused by HIV, is one of theworld’s most serious <strong>and</strong> rapidly growing healththreats.Sex can be hazardous to your health. Worldwide, almost400 million people are infected with a sexuallytransmitted disease (STD) each year. According to theU.S. Centers for Disease Control, almost one of everyfour Americans is walking around with an STD <strong>and</strong> atleast one in every three sexually active persons in theUnited States will contract an STD by age 24. STDs arerampant in high schools <strong>and</strong> colleges, where manystudents think, “It cannot happen to me.” Polls indicatethat 50–66% of sexually active students do not usecondoms <strong>and</strong> more than 40% have two or more sexpartners. Some STDs can cause infertility in men <strong>and</strong>women. Others can cause genital warts <strong>and</strong> genitalcancers or, in the case of HIV, eventually death.The global spread of acquired immune deficiencysyndrome (AIDS), caused by HIV, a serious <strong>and</strong> rapidlygrowing health threat. The virus itself is not deadly,but it kills immune cells <strong>and</strong> leaves the body defenselessagainst infectious bacteria <strong>and</strong> other viruses. Accordingto the WHO, by the beginning of 2004 some38 million people worldwide (96% of them in developingcountries, especially African countries south of theSahara Desert) were infected with HIV. Every dayabout 14,000 more people—most of them between theages of 15 <strong>and</strong> 24—get infected with HIV. According toU.S. Secretary of State Colin Powell, “AIDS is ...nowmore destructive than any army, any conflict, <strong>and</strong> anyweapon of mass destruction.”The news is going to get worse. Infection rates areincreasing rapidly in five countries—Nigeria, Ethiopia,Russia, Indonesia, Vietnam, India, <strong>and</strong> China—that togetherhave 40% of the world’s population.Within 7–10 years, at least half of those with HIVdevelop AIDS. This long incubation period means thatinfected people often spread the virus for several yearswithout knowing they are infected. So far, there is novaccine to prevent HIV <strong>and</strong> no cure for AIDS. Once you getAIDS, you will eventually die, although drugs may helpsome infected people live longer. However, only a tinyfraction of those suffering from AIDS can afford to usethese costly drugs.Between 1980 <strong>and</strong> 2004, more than 20 million people(460,000 in the United States) died of AIDS-relateddiseases. An estimated 280,000 of the roughly 900,000Americans infected with HIV do not know it <strong>and</strong> thereare about 42,000 new infections a year. In the UnitedStates, free or low-cost confidential testing for HIV exposureis available at many public health offices <strong>and</strong> atmany doctors’ offices. However, it takes a few weeksto 6 months or more before enough antibodies form inresponse to an HIV infection for any test to show thatthe virus is present. In addition, the conventional testsrequire several hours of lab time, often at another location,so that results may not be available for 1 to 2weeks. In 2003, the CDC began purchasing <strong>and</strong> pilottesting nationwide a new device called OraQuick. Itcan use a small amount of blood from a finger prick totest for HIV within 20 minutes. The accuracy rate is99.6%, roughly the same as more conventional bloodtests.AIDS has caused the life expectancy of 700 millionpeople living in sub-Saharan Africa to drop from 62to 47 years. The premature deaths of teachers, healthcare workers, <strong>and</strong> other young, productive adults insuch countries leads to diminished education <strong>and</strong>health care, decreased food production <strong>and</strong> economicdevelopment, <strong>and</strong> disintegrating families. Such deathsdrastically alter a country’s age structure diagram (Figure19-13, p. 424). AIDS has left 15 million orphans—roughly equal to every child under age 5 in America.Between 2004 <strong>and</strong> 2020, the WHO estimates 60million more deaths from AIDS <strong>and</strong> a death toll reachingas high as 5 million a year by 2020.According to the WHO, a global strategy to slowthe spread of AIDS should have five major priorities.First, shrink the number of people capable of infectingothers by quickly reducing the number of newinfections below the number of deaths. Second, concentrateon the groups in a society that are mosthttp://biology.brookscole.com/miller14423
Age100+95–9990–9485–8980–8475–7970–7465–6960–6455–5950–5445–4940–4435–3930–3425–2920–2415–1910–145–90–4Males120 100 80 60 40 20 0 20 40 60 80 100 120Population (thous<strong>and</strong>s)With AIDSWithout AIDSFemalesFigure 19-13 How AIDS can affect the age structure of apopulation. This figure shows the projected age structure ofBotswana’s population in 2020 with <strong>and</strong> without AIDS. (U.S.Census Bureau)likely to spread the disease, such as truck drivers, sexworkers, <strong>and</strong> soldiers. Third, provide free HIV testing<strong>and</strong> pressure people to get tested.Fourth, use a mass advertising <strong>and</strong> educationprogram for adults <strong>and</strong> schoolchildren to help preventthe disease with emphasis on abstinence <strong>and</strong> condomuse. Fifth, provide free or low-cost drugs to slow theprogress of the disease.Senegal acted early to check the spread of thevirus <strong>and</strong> has kept the proportion of its young adultsinfected with HIV below 1%. Within a decade,Botswana cut its HIV infection rates in half with goodleadership from its government, health-care facilitiesthat are better than average, <strong>and</strong> vast wealth from diamonds.It provided free testing for HIV <strong>and</strong> pressuredpeople to get tested. Those with HIV or AIDS wereprovided with free or low-cost drugs to slow the disease’sprogress.xHOW WOULD YOU VOTE? Should developed <strong>and</strong> developingnations mount a global campaign to reduce the spreadof AIDS <strong>and</strong> to help countries affected by this disease? Castyour vote online at http://biology.brookscole.com/miller14.Case Study: Malaria: A Deadly ParasiticDisease That Is Making a ComebackMalaria kills about 1 million people a year <strong>and</strong> hasprobably killed more people than all of the wars everfought.About one of every five people in the world—most ofthem living in poor African countries—is at risk ofmalaria (Figure 19-9, middle). Worldwide, an estimated300–500 million people are infected with theprotozoan parasites that cause malaria, <strong>and</strong> there are270–500 million new cases each year. Malaria is not justa concern for the people living in the areas where it occurs(Figure 19-9, middle), but also for anyone travelingto these areas—including many unsuspectingtourists—because there is no vaccine for this disease.Malaria is caused by a parasite that is spread bythe bites of certain mosquito species. It infects <strong>and</strong> destroysred blood cells, causing fever, chills, drenchingsweats, anemia, severe abdominal pain <strong>and</strong> headaches,vomiting, extreme weakness, <strong>and</strong> greater susceptibilityto other diseases. The disease kills about 1 million peopleeach year (about 900,000 of them children underage 5)—an average of 2,700 deaths per day. Many childrenwho survive severe malaria have brain damage orimpaired learning ability.Malaria is caused by four species of protozoanparasites in the genus Plasmodium. Most cases of thedisease are transmitted when an uninfected femalemosquito from any one of about 60 Anopheles mosquitospecies bites an infected person, ingests blood that containsthe parasite, <strong>and</strong> later bites an uninfected person(Figure 19-14). When this happens, Plasmodium parasitesmove out of the mosquito <strong>and</strong> into the human’sbloodstream, multiply in the liver, <strong>and</strong> enter bloodcells to continue multiplying. Malaria can also be transmittedby blood transfusions or by sharing needles.The malaria cycle repeats itself until immunity develops,treatment is given, or the victim dies. Over thecourse of human history, malarial protozoa probably havekilled more people than all the wars ever fought.The mosquitoes that transmit malaria breed inshallow pools <strong>and</strong> puddles—often in tire ruts <strong>and</strong> hoofprints—near human dwellings <strong>and</strong> apparently areattracted to smelly feet. During the 1950s <strong>and</strong> 1960s,the spread of malaria was sharply curtailed by drainingswampl<strong>and</strong>s <strong>and</strong> marshes, spraying breedingareas with insecticides, <strong>and</strong> using drugs to kill the parasitesin the bloodstream. Since 1970, malaria has comeroaring back. Most species of the malaria-carryingAnopheles mosquito have become genetically resistantto widely used insecticides. Worse, the Plasmodiumparasites have become genetically resistant to commonantimalarial drugs.Researchers are working to develop new antimalarialdrugs (such as artemisinins derived from theChinese herbal remedy qinghaosu), vaccines, <strong>and</strong> biologicalcontrols for Anopheles mosquitoes. But such approachesreceive too little funding <strong>and</strong> have provedmore difficult than originally thought.In 2002, scientists announced they had broken thegenetic codes for both the mosquito <strong>and</strong> the parasiteresponsible for most malaria cases. Eventually this importantinformation could uncover genetic vulnerabil-424 CHAPTER 19 Risk, Toxicology, <strong>and</strong> Human Health
eggs4. Parasite invadesblood cells, causingmalaria <strong>and</strong> makinginfected persona new reservoirAnopheles mosquito (vector)in aquatic breeding arealarvapupa1. Femalemosquito bitesinfected human,ingesting bloodthat containsPlasmodiumgametocytes3. Mosquito injects Plasmodiumsporozoites into human hostadult2. Plasmodiumdevelops inmosquitoFigure 19-14 The life cycle of malaria. Plasmodium circulatesfrom mosquito to human <strong>and</strong> back to mosquito.ities in these organisms. This could allow scientists toalter the genetic makeup of mosquitoes so they cannotcarry <strong>and</strong> transmit the parasite to humans. It couldalso lead to more effective drugs, vaccines, insecticides,<strong>and</strong> insect repellents to counter the disease.Meanwhile, health experts say prevention is thebest approach to slowing the spread of malaria. Methodsinclude increasing water flow in irrigation systemsto prevent mosquito larvae from developing (an expensivesolution that uses much more water than requiredfor irrigation) <strong>and</strong> fixing leaking water pipes.Aproblem is that poor villagers in malarial regionscannot afford screens on their homes <strong>and</strong> mosquitonets for their beds. The WHO calls for countriesto do away with all taxes <strong>and</strong> tariffs on insecticidetreatedbed nets, <strong>and</strong> to give such bed nets to the poor.Other approaches include cultivating fish that feedon mosquito larvae (biological control), clearing vegetationaround houses, planting trees that soak up waterin low-lying marsh areas where mosquitoes thrive (amethod that can degrade or destroy ecologically importantwetl<strong>and</strong>s), <strong>and</strong> using zinc <strong>and</strong> vitamin A supplementsto boost resistance to malaria in children.Spraying the inside of homes with low concentrationsof DDT about twice a year greatly reduces thenumber of malaria cases. But under an internationaltreaty enacted in 2002, DDT <strong>and</strong> five of its chlorinatedhydrocarboncousins are being phased out in developingcountries. However, the treaty allows 25 countriesto continue using DDT for malaria control until otheralternatives are available.Health officials in developing countries call formuch greater funding for research on finding ways toprevent <strong>and</strong> treat malaria. Each year more than $70 billionis spent on research on disease. If you look at thenumber of people dying each year from malaria, a fairshare of the global research funding for malaria wouldbe about $1.75 billion a year. The actual figure spentannually for malaria research is about $85 million ayear.Solutions: How Can We Reduce the Incidenceof Infectious Diseases? More Money <strong>and</strong>AssistanceWe can sharply reduce the incidence of infectiousdiseases if the world is willing to provide thenecessary funds <strong>and</strong> assistance.Bad news. First, death rates from infectious diseases indeveloping countries are unacceptably high.Second, only about 10% of global medical research <strong>and</strong>development money is spent on infectious diseases indeveloping countries, even though more peopleworldwide suffer <strong>and</strong> die from these diseases thanfrom all other diseases combined. Third, major drugcompanies have greatly decreased research on developingantibiotics <strong>and</strong> vaccines because they are difficult<strong>and</strong> costly to develop. They also produce lowerprofits because patients take them for only a short timecompared to medicines for treating chronic diseasessuch as diabetes <strong>and</strong> hypertension that must be takenevery day for years.Fourth, about one-third of the world’s people,mostly in developing countries, lack adequate accessto clean drinking water <strong>and</strong> sanitation facilities.Fifth, the WHO estimates that children under 5make up only 10% of the world’s population but accountfor 40% of global illness. Eleven million childrena year die before their fifth birthday from causes thatare mostly preventable <strong>and</strong> treatable.Good news. According to the WHO, the globaldeath rate from infectious diseases dropped by abouttwo-thirds between 1970 <strong>and</strong> 2000 <strong>and</strong> is projected tocontinue dropping. Also, between 1971 <strong>and</strong> 2000, thepercentage of children in developing countries immunizedwith vaccines to prevent tetanus, measles, diphtheria,typhoid fever, <strong>and</strong> polio increased from 10% to84%—saving about 10 million lives a year.Figure 19-15 (p. 426) lists measures that healthscientists <strong>and</strong> public health officials suggest to help preventor reduce the incidence of infectious diseases thataffect humanity (especially in developing countries).http://biology.brookscole.com/miller14425
SolutionsIncrease research on tropicaldiseases <strong>and</strong> vaccinesReduce povertyDecrease malnutritionInfectious DiseasesImprove drinking water qualityReduce unnecessary use ofantibioticsEducate people to take all of anantibiotic prescriptionReduce antibiotic use to promotelivestock growthCareful h<strong>and</strong> washing by allmedical personnelImmunize children against majorviral diseasesOral rehydration for diarrheavictimsGlobal campaign to reduceHIV/AIDSFigure 19-15 Solutions: ways to prevent or reduce the incidenceof infectious diseases, especially in developingcountries. Which two of these solutions do you believe are themost important?An important breakthrough has been the developmentof simple oral rehydration therapy to help prevent deathfrom dehydration for victims of diarrheal diseases,which cause about one-fourth of all deaths of childrenunder age 5. It involves administering a simple solutionof boiled water, salt, <strong>and</strong> sugar or rice, at a cost ofonly a few cents per person. It has been the major factorin reducing the annual number of deaths from diarrheafrom 4.6 million in 1980 to 1.9 million in 2002.Few investments have saved so many lives at such alow cost.In 2001, the WHO began promoting a do-it-yourselftechnique that uses sunlight to disinfect water. Theprocess is simple: fill a transparent plastic bottle withcontaminated water <strong>and</strong> lay it horizontally on a flatblack surface (which absorbs more heat <strong>and</strong> kills morepathogens than a lighter surface can) in the sunlight.After several hours, the heat <strong>and</strong> ultraviolet rays of thesun kill most illness-causing microorganisms in pollutedwater. This simple method is especially useful intropical countries where there is intense sunlight.How Serious Is the Threat of Bioterrorism?A Growing ConcernBioterrorism that involves releasing infectiousorganisms into the air, water supply, or food supplyis a serious <strong>and</strong> growing threat.One of the threats in our increasingly interconnectedglobal society is bioterrorism. It involves the deliberaterelease of disease-causing bacteria or viruses into theair, water supply, or food supply of concentrated urbanpopulations.According to antiterrorism experts, bioterrorism isa much easier, cheaper, <strong>and</strong> more effective way to causeillness, death, <strong>and</strong> mass terror <strong>and</strong> chaos than crashingplanes into buildings or setting off dirty nuclearweapons. The materials <strong>and</strong> tools to make biologicalweapons are inexpensive <strong>and</strong> easy to get. A state-of-theart laboratory for making biological warfare agents requiresabout $10,000 of off-the shelf equipment such asa beer fermenter, a protein-based culture of the diseaseto be produced, protective plastic clothing, <strong>and</strong> a gasmask. The lab could be housed in a space about the sizeof a small bathroom. Now that the sequencing of thegenome of the flu virus is nearly complete, bioterroistscan develop more lethal flu viruses <strong>and</strong> easily transmitthem through the air in tiny droplets.Since the end of World War II, the United States<strong>and</strong> the former Soviet Union both have spent billionsof dollars developing, producing, <strong>and</strong> stockpilinglarge quantities of biological weapons of mass destruction.Figure 19-16 provides information about some ofthe common bacterial <strong>and</strong> viral agents these countrieshave studied <strong>and</strong> developed.Both countries have used recombinant DNA techniquesto produce more dangerous versions of theseorganisms that act faster, are more virulent, <strong>and</strong> are resistantto antibiotics used to treat them. They have alsocreated new <strong>and</strong> even more dangerous infectious organismswith properties that are classified as top secret.Both countries have promised to destroy their biologicalweapons. But because of the secrecy of theseprograms there is no way to know how many weaponsremain.Thous<strong>and</strong>s of former Soviet scientists with knowledgeabout how to develop these weapons are living inpoverty. There is fear that countries interested in developingbiological weapons will hire some of them. In1995, the U.S. Central Intelligence Agency (CIA) identified16 nations suspected of having programs to develop<strong>and</strong> stockpile biological warfare agents. In addition,thous<strong>and</strong>s of molecular biologists <strong>and</strong> graduate-schoolstudents around the world have enough knowledgeabout recombinant DNA <strong>and</strong> cloning technology to design<strong>and</strong> mass produce biological warfare agents.Once made, the bacteria or viruses can be carried ina small vial or aerosol container not detectable by conventionalsecurity equipment. They could be released426 CHAPTER 19 Risk, Toxicology, <strong>and</strong> Human Health
AgentContagiousSymptomsMortality(if untreated)Existenceof vaccineTreatmentSmallpox(virus)YesFever, aches, headache, redspots on face <strong>and</strong> torso30%YesVaccination within 4 days afterexposure, IV hydrationHemorrhagicfever (viruses)YesVary but include fever,bleeding, shock, <strong>and</strong> comaVariesNoEbola has no cure, antiviralriboflavin <strong>and</strong> some antibioticsmay helpInhalationanthrax(bacterium)NoFever, chest pain, difficultybreathing, respiratory failure90–100%YesEarly treatment with Cipro <strong>and</strong>other antibioticsBotulism(bacterium)NoBlurred vision, progressiveparalysis, death within 24 hoursif not treated60–100%YesEquine antitoxin given early.Intensive care, respiratorPneumonicplague(bacterium)YesHigh fever, chills, headache,coughing blood, difficultybreathing, respiratory failure90–100%NoAntibioticsTularemia(bacterium)NoFever, sore throat, weakness,respiratory stress, pneumonia30–60%Yes(in testing)AntibioticsSmallpox Botulism Plague TularemiaFigure 19-16 Characteristics of common agents that might be used by terrorists as biological weapons.in a crowded subway car, into a public water supply,or into the unprotected, ground-level air intakes foundin most office buildings. A terrorist organization withvolunteers willing to die for their cause could infect volunteerswith a normally fatal disease organism that iseasily transmitted from one human to another. Afterwaiting until they are contagious, the volunteers couldbe sent on airplane trips throughout the world. Millionscould die <strong>and</strong> the social <strong>and</strong> economic fabric of affectedsocieties would unravel.According to a 2003 worst-case scenario publishedin the Proceedings of the National Academy of Sciences, ifterrorists release 1 kilogram (2.2 pounds) of anthraxspores in a city of 10 million people, at least 123,000people would die, even if everyone took the appropriateantibiotics within 48 hours after exposure.A more likely version of this scenario is that the attackmight go unnoticed until a few victims turned upsick at hospitals. Then waves of very sick peoplewould overwhelm hospitals, most of which lackenough stocks of antibiotics, vaccines, equipment, <strong>and</strong>staffing to h<strong>and</strong>le such a big surge in emergency patients.Casualties among medical workers would compoundthe crisis <strong>and</strong> chaos would reign.I know you are thinking: Whoa, enough already.This stuff is depressing <strong>and</strong> scary. But it is a reality intoday’s world. Let us look at some more hopeful newsabout bioterrorism.Early detection of biological agents is a key to treatingexposed victims <strong>and</strong> preventing the spread of diseasesto others. Some scientists are trapping commoninsects such as bees, beetles, moths, <strong>and</strong> crickets to seewhether they can be used as environmental monitors ofchemical <strong>and</strong> biological agents. Others are trying to developinexpensive <strong>and</strong> easy-to-use DNA detectors toquickly <strong>and</strong> accurately diagnose any infectious diseasesuch as smallpox. For example, MIT biologist ToddRider has developed a biological sensor to detect withinminutes dangerous biological agents such as anthrax.He made the sensor out of mouse immune cells by insertinga gene for antibodies for a particular biologicalagent (such as anthrax) along with a gene that causes ajellyfish to glow. When a biological agent activates theantibody, the immune cells of the mouse light up.Also, treatments are available for the most commonbiological agents (Figure 19-16)—unless theyhave been genetically modified to make such treatmentsfail. And outbreaks can be kept under control ifhttp://biology.brookscole.com/miller14427
hospitals stock large supplies of antibiotics <strong>and</strong> vaccinesfor treatment of common diseases, provide emergency<strong>and</strong> hospital workers with detection systems<strong>and</strong> protective gear, <strong>and</strong> alert doctors to the symptomsof the most common biological warfare agents.Comparative Risk AnalysisMost Serious Ecological<strong>and</strong> Health <strong>Problems</strong>19-5 RISK ANALYSISHow Can We Estimate Risks? Evaluate,Compare, DecideScientists have developed ways to evaluate <strong>and</strong>compare risks, decide how much risk is acceptable,<strong>and</strong> find affordable ways to reduce them.Risk analysis involves identifying hazards <strong>and</strong> evaluatingtheir associated risks (risk assessment, Figure 19-2,left), ranking risks (comparative risk analysis), determiningoptions <strong>and</strong> making decisions about reducing oreliminating risks (risk management, Figure 19-2, right),<strong>and</strong> informing decision makers <strong>and</strong> the public aboutrisks (risk communication).Statistical probabilities based on past experience,animal testing <strong>and</strong> other tests, <strong>and</strong> epidemiologicalstudies are used to estimate risks from older technologies<strong>and</strong> chemicals. To evaluate new technologies <strong>and</strong>products, risk evaluators use more uncertain statisticalprobabilities, based on models rather than actual experience<strong>and</strong> testing.Figure 19-17 lists the results of a comparative riskanalysis, summarizing the greatest ecological <strong>and</strong> healthrisks identified by a panel of scientists acting as advisersto the U.S. <strong>Environmental</strong> Protection Agency (EPA).The greatest risks many people face today arerarely dramatic enough to make the daily news. Interms of the number of premature deaths per year (Figure19-18) <strong>and</strong> reduced life span, the greatest risk by faris poverty (Figure 19-19 (p. 430) <strong>and</strong> Figure 1-15, p. 17).Its high death toll is a result of malnutrition, increasedsusceptibility to normally nonfatal infectious diseases,<strong>and</strong> often fatal infectious diseases from lack of accessto a safe water supply.Thus the sharp reduction or elimination of povertywould do far more to improve longevity <strong>and</strong> human healththan any other measure. It would also greatly improvehuman rights, provide more people with income tostimulate economic development, <strong>and</strong> reduce environmentaldegradation <strong>and</strong> the threat of terrorism.Sharply reducing poverty is a win-win situation forpeople, economies, <strong>and</strong> the environment.After the health risks associated with poverty <strong>and</strong>gender, the greatest risks of premature death are mostlythe result of unhealthful choices that people makeabout their lifestyles—what I referred to early in thischapter as cultural hazards (Figures 19-18 <strong>and</strong> 19-19).By far the best ways to reduce one’s risk of prematuredeath <strong>and</strong> serious health problem are to avoidHigh-Risk Health <strong>Problems</strong>• Indoor air pollution• Outdoor air pollution• Worker exposure to industrialor farm chemicals• Pollutants in drinking water• Pesticide residues on food• Toxic chemicals in consumer productsHigh-Risk Ecological <strong>Problems</strong>• Global climate change• Stratospheric ozone depletion• Wildlife habitat alteration <strong>and</strong> destruction• Species extinction <strong>and</strong> loss of biodiversityMedium-Risk Ecological <strong>Problems</strong>• Acid deposition• Pesticides• Airborne toxic chemicals• Toxic chemicals, nutrients, <strong>and</strong>sediment in surface watersLow-Risk Ecological <strong>Problems</strong>• Oil spills• Groundwater pollution• Radioactive isotopes• Acid runoff to surface waters• Thermal pollutionFigure 19-17 Comparative risk analysis of the most seriousecological <strong>and</strong> health problems according to scientists actingas advisers to the U.S. <strong>Environmental</strong> Protection Agency.Risks under each category are not listed in rank order.(Science Advisory Board, Reducing Risks, Washington, D.C.:<strong>Environmental</strong> Protection Agency, 1990)smoking <strong>and</strong> exposure to smoke, lose excess weight, reduceconsumption of foods containing cholesterol <strong>and</strong>saturated fats, eat a variety of fruits <strong>and</strong> vegetables, exerciseregularly, avoid alcohol or drink no more thantwo drinks a day, avoid excess sunlight (which agesskin <strong>and</strong> may cause skin cancer), <strong>and</strong> have only safe sex.How Can We Estimate Risks of UsingIncreasingly Complex Technology in OurLives? A Difficult TaskEstimating risks from using certain technologies isdifficult because of the unpredictability of humanbehavior, human error, <strong>and</strong> sabotage.The more complex a technological system <strong>and</strong> themore people needed to design <strong>and</strong> run it, the more difficultit is to estimate the risks. The overall reliability of428 CHAPTER 19 Risk, Toxicology, <strong>and</strong> Human Health
Cause of DeathAnnual DeathsPoverty/malnutrition/disease cycleTobacco5 million (34)11 million (75)Pneumonia <strong>and</strong> fluAir pollutionHIV/AIDSDiarrheaTB3.2 million (22)3 million (21)3 million (21)1.9 million (13)1.7 million (12)Figure 19-18 Number of deaths per year in the world fromvarious causes. Numbers in parentheses give these deathsin terms of the number of fully loaded 400-passenger jumbojets crashing every day of the year with no survivors. Becauseof sensational media coverage, most people have a distortedview of the largest annual causes of death. (World HealthOrganization <strong>and</strong> U.S. Center for Disease Control <strong>and</strong>Prevention)Automobile accidentsWork-relatedinjury <strong>and</strong> diseaseMalariaHepatitis BMeasles1.2 million (8)1.1 million (8)1 million (7)1 million (7)800,000 (5)a technological system (expressed as a percentage) orthe probability expressed as a percentage that a devicewill complete a task without failing is the product oftwo factors:System reliability (%) Technology Humanreliability reliabilityWith careful design, quality control, maintenance,<strong>and</strong> monitoring, a highly complex system such as anuclear power plant or space shuttle can achieve ahigh degree of technology reliability. But human reliabilityusually is much lower than technology reliability<strong>and</strong> is almost impossible to predict: To err ishuman.Suppose the technology reliability of a nuclearpower plant is 95% (0.95) <strong>and</strong> human reliability is 75%(0.75). Then the overall system reliability is 71% (0.95 0.75 100 0.71 71%). Even if we could make thetechnology 100% reliable (1.0), the overall system reliabilitywould still be only 75% (1.0 0.75 100 75%).The crucial dependence of even the most carefully designedsystems on unpredictable human reliabilityhelps explain essentially “impossible” tragedies suchas the Chernobyl nuclear power plant accident <strong>and</strong> theChallenger <strong>and</strong> Columbia space shuttle accidents.One way to make a system more foolproof or failsafeis to move more of the potentially fallibleelements from the human side to the technical side.However, chance events such as a lightning bolt canknock out an automatic control system, <strong>and</strong> no machineor computer program can completely replacehuman judgment. Also, the parts in any automatedcontrol system are manufactured, assembled, tested,certified, <strong>and</strong> maintained by fallible human beings. Inaddition, computer software programs used to monitor<strong>and</strong> control complex systems can also containhuman error or can be deliberately modified by computerviruses to malfunction.How Useful Is Risk Analysis? A VeryDifficult TaskThe results of risk analysis are usually veryuncertain.Here are some of the key questions involved in evaluatingthe reliability of risk analysis:■ How reliable are risk assessment data <strong>and</strong> models?Sections 19-2 <strong>and</strong> 19-3)■ Who profits from a risk analysis that allows certainlevels of harmful chemicals into the environment, <strong>and</strong>who suffers?■ Should estimates emphasize short-term risks, orshould more weight be put on long-term risks? Whoshould make this decision?■ Who should do a particular risk analysis, <strong>and</strong> whoshould review the results? A government agency? Independentscientists? The public?■ Should cumulative effects of various risks beconsidered, or should risks be considered separately,as is usually done? Suppose a pesticide is found tohave an annual risk of killing 1 out of 1 millionthrough cancer, the current EPA limit. Cumulatively,however, effects from 40 such pesticides might kill 40,or 400 of every million people because of synergisticeffects.■ How widespread is each risk? About how manypeople are likely to be affected?■ Should risk levels be higher for workers (as is almostalways the case) than for the general public?What say should workers <strong>and</strong> their families have inthis decision?http://biology.brookscole.com/miller14429
HazardPovertyBorn maleSmokingOverweight (35%)UnmarriedOverweight (15%)Shortens average life spanin the United States by2 years5 years7–10 years7.5 years6–10 years6 yearsFigure 19-19 Comparison of risks peopleface, expressed in terms of shorteraverage life span. After poverty <strong>and</strong>gender, the greatest risks people faceare mostly from the lifestyle choices theymake. These are only generalized relativeestimates. Individual response tosome of these risks can vary with factorssuch as genetic variation, family medicalhistory, emotional makeup, stress, <strong>and</strong>social ties <strong>and</strong> support. (Data fromBernard L. Cohen)Spouse smokingDrivingAir pollutionAlcoholDrug abuseFluAIDSAir pollutionDrowningPesticidesFireNatural radiation1 year7 months5 months5 months4 months4 months3 months2 months1 month1 month1 month8 daysHowever, critics point out that results of riskanalysis are very uncertain. For example, a recentstudy documented the significant uncertainties involvedin even simple risk analysis. Eleven Europeangovernments established 11 different teams of theirbest scientists <strong>and</strong> engineers (including those from privatecompanies) to assess the hazards <strong>and</strong> risks from asmall plant storing only one hazardous chemical (ammonia).The 11 teams, consisting of world-class expertsanalyzing this very simple system, disagreedwith one another on fundamental points <strong>and</strong> varied intheir assessments of the hazards by a factor of 25,000.Such inherent uncertainty explains why regulators settinghuman exposure levels for toxic substances usuallydivide the best results by 100 to 1,000 to providethe public with a margin of safety.Medical X raysOral contraceptivesToxic wasteFlyingHurricanes, tornadoesLiving lifetime nearnuclear plant5 days5 days4 days1 day1 day10 hours■ How much risk is acceptable, <strong>and</strong> to whom is itacceptable? According to the National Academy ofSciences, exposure to toxic chemicals is responsible for2–4% of the 521,000 cancer deaths in the United States;this amounts to 10,400–20,800 premature cancerdeaths per year. Is this acceptable <strong>and</strong> to whom?Proponents point to the numerous advantages ofrisk analysis. It is a useful way to organize <strong>and</strong> analyzeavailable scientific information, identify significanthazards, <strong>and</strong> focus on areas that need more research. Itcan also help regulators to decide how money for reducingrisks should be allocated <strong>and</strong> to stimulate peopleto make more informed decisions about health <strong>and</strong>environmental goals <strong>and</strong> priorities.How Should Risks Be Managed? A Complex<strong>and</strong> Controversial ProcessRisk management involves trying to answer anumber of difficult <strong>and</strong> controversial questionsabout whether <strong>and</strong> how to reduce a particular societalrisk to a certain level <strong>and</strong> at what cost.Risk management includes the administrative, political,<strong>and</strong> economic actions taken to decide whether <strong>and</strong>how to reduce a particular societal risk to a certainlevel <strong>and</strong> at what cost.Risk management involves answering the followingquestions:■ How reliable is the risk analysis for each risk?■ Which risks to human health should be given thehighest priority?■ How much risk is acceptable <strong>and</strong> to whom?■ How much is a life worth, <strong>and</strong> how much moneyshould we spend per life saved? Most governmentrisk analyses set the value of a life at about $3.7 millionfor all people <strong>and</strong> about $1.4 million for peopleover 70. How much do you believe your life is worth?■ How much will it cost to reduce each risk to anacceptable level?430 CHAPTER 19 Risk, Toxicology, <strong>and</strong> Human Health
■ How should limited funds be spent to provide thegreatest benefit?■ How will the risk management plan be monitored,enforced, <strong>and</strong> communicated to the public?Each step in this process involves making valuejudgments <strong>and</strong> weighing trade-offs to find some reasonablecompromise among often conflicting political,economic, health, <strong>and</strong> environmental interests.How Well Do We Perceive Risks? Most of UsFlunkMost individuals are poor at evaluating the relativerisks they face, mostly because of misleadinginformation <strong>and</strong> irrational fears.Most of us are not good at assessing the relative risksfrom the hazards that can affect us. Also, many peopledeny or shrug off the high-risk chances of death (orinjury) from voluntary activities they enjoy, such asmotorcycling (1 death in 50 participants), smoking (1 in300 participants by age 65 for a pack-a-day smoker),hang gliding (1 in 1,250), <strong>and</strong> driving (1 in 3,300 withouta seatbelt <strong>and</strong> 1 in 6,070 with a seatbelt). Indeed, themost dangerous thing most people in many countriesdo each day is drive or ride in a car.Yet some of these same people may be terrifiedabout the possibility of being killed by a gun (1 in28,000 in the United States), flu (1 in 130,000), nuclearpower plant accident (1 in 200,000), West Nile virus (1 in1 million), lightning (1 in 3 million), commercial airplanecrash (1 in 9 million), snakebite (1 in 36 million), or sharkattack (1 in 281 million).What Factors Distort Our Perceptions ofRisk? Irrational Fears <strong>and</strong> Perceptions CanTake OverSeveral factors can give people a distorted sense of risk.Here are four factors that can cause people to see atechnology or a product as being riskier than expertsjudge it to be. First is the degree of control we have. Mostof us have a greater fear of things over which we do nothave personal control. For example, some individualsfeel safer driving their own car for long distancesthrough heavy traffic than traveling the same distanceon a plane. But look at the math. The risk of dying in acar accident while using your seatbelt is 1 in 6,070whereas the risk of dying in a commercial airliner crashis 1 in 9 million. Can you think of another example?Second is fear of the unknown. Most people havegreater fear of a new, unknown product or technologythan they do of an older <strong>and</strong> more familiar one. Examplesinclude a greater fear of genetically modified foodthan of food produced by traditional plant breedingtechniques, <strong>and</strong> a greater fear of nuclear power plantsthan of more familiar coal-fired power plants. Can youthink of another example?Third is whether or not we voluntarily take therisk. For example, we might perceive that the risk fromdriving, which is largely voluntary, is less than thatfrom a nuclear power plant, which is mostly imposedon us whether we like it or not. Can you come up withanother example?Fourth is whether a risk is catastrophic, not chronic.We usually have a much greater fear of a wellpublicizeddeath toll from a single catastrophic accidentrather than the same or an even larger death toll spreadout over a longer time. Examples include a severe nuclearpower plant accident, an industrial explosion, oran accidental plane crash, as opposed to coal-burningpower plants, automobiles, <strong>and</strong> smoking. Can youthink of another example?There is also concern over the unfair distribution ofrisks from the use of a technology or certain chemicals.Citizens are outraged when government officials decideto put a hazardous waste l<strong>and</strong>fill or incinerator inor near their neighborhood. Even when the decision isbased on careful risk analysis, it is usually seen as politics,not science. Residents will not be satisfied by estimatesthat the lifetime risks of cancer death from thefacility are not greater than, say, 1 in 100,000. Instead,they point out that living near the facility means thatthey will have a much higher risk of dying from cancerthan would people living farther away.How Can You Become Better at RiskAnalysis? Analyze, Compare, <strong>and</strong> EvaluateYour LifestyleTo become better at risk analysis you can carefullyevaluate the barrage of bad news, compare risks,<strong>and</strong> concentrate on reducing risks over which wehave some control.You can do three things to become better at estimatingrisks. First, carefully evaluate what the media presents.Recognize that the media often give an exaggeratedview of risks to capture our interest <strong>and</strong> thus sellnewspapers or gain TV viewers.Second, compare risks. Do you risk getting cancerby eating a charcoal-broiled steak once or twice aweek? Yes, because in theory anything can harm you.The question is whether this danger is great enoughfor you to worry about. In evaluating a risk the questionis not, “Is it safe?” but rather, “How risky is it comparedto other risks?”Third, concentrate on the most serious risks toyour life <strong>and</strong> health over which you have some controlover <strong>and</strong> stop worrying about smaller risks <strong>and</strong> thoseover which you have little or no control. When youworry about something, the most important questionto ask is, “Do I have any control over this?”http://biology.brookscole.com/miller14431
For example, the top four killers of Americans(<strong>and</strong> people in many countries) are heart attacks,strokes, cancer, <strong>and</strong> accidents (many of them involvingmotor vehicles). You have control over major ways toreduce these risks because you decide whether tosmoke, what to eat, how much exercise you get, howmuch alcohol you consume, your exposure to the sun’sultraviolet rays, how safely you drive, <strong>and</strong> whether ornot you practice safe sex. Concentrate on evaluatingthese important choices, <strong>and</strong> you will have a muchgreater chance of living a healthy, longer, happier, <strong>and</strong>less fearful life.The burden of proof imposed on individuals, companies, <strong>and</strong>institutions should be to show that pollution preventionoptions have been thoroughly examined, evaluated, <strong>and</strong> usedbefore lesser options are chosen.JOEL HIRSCHORNCRITICAL THINKING1. Explain why you agree or disagree with the proposalsfor reducing the death toll <strong>and</strong> other harmful effects ofsmoking listed on p. 409. Do you believe that there shouldbe a ban on smoking indoors in all public places? Explain.2. Do you believe the precautionary approach should beused to deal with the potential harm from hormonallyactive agents (HAAs) while more definitive research iscarried out over the next two decades? Explain. Whatharmful effects could using this approach have on theeconomy <strong>and</strong> on your lifestyle?3. Should we have zero pollution levels for all toxic <strong>and</strong>hazardous chemicals? Explain. What are the alternatives?4. Evaluate the following statements:a. We should not get worked up about exposure totoxic chemicals because almost any chemical in alarge enough dosage can cause some harm.b. We should not worry so much about exposure totoxic chemicals because through genetic adaptationwe can develop immunity to such chemicals.c. We should not worry so much about exposure totoxic chemicals because we can use genetic engineeringto reduce or eliminate such problems.5. Should pollution levels be set to protect the mostsensitive people in a population (Figure 19-3, left, p. 411)or the average person (Figure 19-3, middle)? Explain.6. Should laboratory-bred animals be used in laboratoryexperiments in toxicology? Explain. What are thealternatives?7. What are the five major risks you face from (a) yourlifestyle, (b) where you live, <strong>and</strong> (c) what you do for a living?Which of these risks are voluntary <strong>and</strong> which are involuntary?List the five most important things you c<strong>and</strong>o to reduce these risks. Which of these things do you actuallyplan to do?8. Congratulations! You are in charge of a globalrisk–benefit analysis board to evaluate whether certainchemicals or technologies should be approved for widespreaduse. Explain why you would approve or disapproveeach of the following: (a) drugs to slow the agingprocess, (b) drugs that would cause people to have unconditionallove for everyone <strong>and</strong> thus have the potentialto do away with hate, violence, <strong>and</strong> war, (c) geneticengineering advances that would allow parents to havegenes inserted into lab-produced fetuses to produce designerbabies with their desired checklist of enhancedgenetic traits, (d) allowing people to have a geneticclone that they can use for spare parts to help themlive longer, <strong>and</strong> (e) putting everyone in the worldunder constant electronic surveillance to help preventbioterrorism.9. Congratulations! You are in charge of the world. Listthe three most important features of your program to reducethe risk from exposure to (a) toxic <strong>and</strong> hazardouschemicals, (b) infectious disease organisms, <strong>and</strong>(c) viruses.PROJECTS1. Use the library or the Internet to find recent articlesthat support or refute the hormesis hypothesis.2. Use the library or the Internet to find recent articlesdescribing the increasing genetic resistance in diseasecausingbacteria to commonly used antibiotics. Evaluatethe evidence <strong>and</strong> claims in these articles.3. Pick a specific viral disease <strong>and</strong> use the library orInternet to find out (a) how it spreads, (b) its effects,(c) strategies for controlling its spread, <strong>and</strong> (d) possibletreatments.4. Use the library or the Internet to find bibliographicinformation about Paracelsus <strong>and</strong> Joel Hirschorn,whose quotes appear at the beginning <strong>and</strong> end of thischapter.5. Make a concept map of this chapter’s major ideas, usingthe section heads, subheads, <strong>and</strong> key terms (in boldface).Look on the website for this book for informationabout making concept maps.LEARNING ONLINEThe website for this book contains study aids <strong>and</strong> manyideas for further reading <strong>and</strong> research. They include achapter summary, review questions for the entire chapter,flash cards for key terms <strong>and</strong> concepts, a multiple-choicepractice quiz, interesting Internet sites, references, <strong>and</strong> aguide for accessing thous<strong>and</strong>s of InfoTrac ® College Editionarticles. Log on tohttp://biology.brookscole.com/miller14Then click on the Chapter-by-Chapter area, choose Chapter19, <strong>and</strong> select a learning resource.432 CHAPTER 19 Risk, Toxicology, <strong>and</strong> Human Health
20 AirPollutionAirPopulationPollutionControlControlCASE STUDYWhen Is a LichenLike a Canary?Nineteenth-century coal miners took canaries withthem into the mines—not for their songs but for themoment when they stopped singing. Then the minersknew it was time to get out of the mine because the aircontained methane, which could ignite <strong>and</strong> explode.Today we use sophisticated equipment to monitorair quality, but living things such as lichens (Figure20-1) can also warn us of bad air. Lichens, whichare not plants, consist of a fungus <strong>and</strong> an alga livingtogether, usually in a mutually beneficial (mutualistic)partnership.You have probably seen lichens growing as crustsor leafy growths on rocks (Figure 20-1, right), walls,tombstones, <strong>and</strong> tree trunks or as beards hangingdown from twigs <strong>and</strong> branches (Figure 20-1, left).These hardy pioneer species are good biologicalindicators of air pollution because they are alwaysabsorbing air as a source of nourishment. A highlypolluted area around an industrial plant may haveno lichens or only gray-green crusty lichen. An areawith moderate air pollution may have orange crustylichens on walls. Walls <strong>and</strong> trees in areas with fairlyclean air may have leafy lichens.Some lichen species are sensitive to specific airpollutingchemicals. Old man’s beard (Usnea trichodea)<strong>and</strong> yellow Evernia lichens, for example, sicken or diein the presence of too much sulfur dioxide.Because lichens are widespread, long lived, <strong>and</strong>anchored in place, they can also help track pollutionto its source. The scientist who discovered sulfur dioxidepollution on Isle Royale in Lake Superior, whereno car or smokestack had ever intruded, used Evernialichens to point the finger northward to coal-burningfacilities at Thunder Bay, Canada.In 1986, the Chernobyl nuclear power plant inUkraine (Figure 17-1, p. 350) exploded <strong>and</strong> spewed radioactiveparticles into the atmosphere. Some of theseparticles fell to the ground over northern Sc<strong>and</strong>inavia<strong>and</strong> were absorbed by lichens that carpet much ofLapl<strong>and</strong>. The area’s Saami people depend on reindeermeat for food, <strong>and</strong> the reindeer feed on lichens. AfterChernobyl, more than 70,000 reindeer had to be killed<strong>and</strong> the meat discarded because it was too radioactiveto eat. Scientists helped the Saami identify where tofind the remaining uncontaminated reindeer by analyzinglichens to pinpoint the most contaminated areas.We all must breathe air from a global atmosphericcommons in which air currents <strong>and</strong> winds can transportsome pollutants long distances. Lichens can alertus to the danger, but as with all forms of pollution, thebest solution is prevention.Kenneth W. Fink/Ardea, LondonFigure 20-1 Red <strong>and</strong> yellow crustose lichens growing on slate rock inthe foothills of the Sierra Nevada near Merced, California (right), <strong>and</strong>Usnea trichodea lichen growing on a branch of a larch tree in GiffordPinchot National Park, Washington (left). The vulnerability of variouslichen species to specific air pollutants can help researchers detectlevels of these pollutants <strong>and</strong> track down their sources.
I thought I saw a blue jay this morning. But the smog was sobad that it turned out to be a cardinal holding its breath.MICHAEL J. COHENThis chapter discusses the pollutants found in outdoor<strong>and</strong> indoor air <strong>and</strong> how they can be reduced. Itaddresses the following questions:■■■■■■What layers are found in the atmosphere?What are the major outdoor air pollutants, <strong>and</strong>where do they come from?What are two types of smog?What is acid deposition, <strong>and</strong> how can it bereduced?What are the harmful effects of air pollutants?How can we prevent <strong>and</strong> control air pollution?Altitude (kilometers)120110100908070605040Atmospheric pressure (millibars)0 200 400 600 800 1,00075TemperaturePressureThermosphere 65Mesopause55Heating via ozoneMesosphereStratopauseStratosphere453525Altitude (miles)20-1 STRUCTURE AND SCIENCEOF THE ATMOSPHEREWhat Are Key Characteristics of theAtmosphere? Several Layers with DifferentPropertiesThe atmosphere consists of several layerswith different temperatures, pressures, <strong>and</strong>composition.We live at the bottom of a thin layer of gases surroundingthe earth, called the atmosphere. It is divided intoseveral spherical sublayers (Figure 20-2), each characterizedby abrupt changes in temperature as a result ofdifferences in the absorption of incoming solar energy.Density <strong>and</strong> atmospheric pressure also varythroughout the atmosphere. Gravitational forces pullthe gas molecules in the atmosphere toward the earth’ssurface. This means that the air we breathe at sea levelhas a higher density (more molecules per liter) than theair we inhale on top of the world’s highest mountain.Atmospheric pressure is a measure of the massper unit area of air. It is caused by the bombardment ofa surface by the molecules in air. The pressure of theatmosphere increases as the density of air increasesbecause a volume of air with a high density has moregas molecules than a volume with a lower density.Thus, atmospheric pressure decreases with altitude. Thisexplains why the pressure exerted on each square centimeterof your body by the bombardment of hordesof gas molecules is greater at sea level than at the topof a tall mountain.What Is the Troposphere? Weather BreederThe atmosphere’s innermost layer is made upmostly of nitrogen <strong>and</strong> oxygen, with smalleramounts of water vapor <strong>and</strong> carbon dioxide.3020100(Sealevel)TropopauseOzone “layer”Heating from the earthTroposphere–80 –40 0 40 80 120Temperature (˚C)About 75–80% of the earth’s air mass is found in thetroposphere, the atmospheric layer closest to the earth’ssurface. This layer extends only about 17 kilometers(11 miles) above sea level at the equator <strong>and</strong> about8 kilometers (5 miles) over the poles. If the earth werethe size of an apple, this lower layer containing the airwe breathe would be no thicker than the apple’s skin.Take a deep breath. About 99% of the volume ofthe air you just inhaled from the troposphere consistsof two gases: nitrogen (78%) <strong>and</strong> oxygen (21%). The remainderconsists of water vapor (varying from 0.01%at the frigid poles to 4% in the humid tropics), slightlyless than 1% argon (Ar), 0.038% carbon dioxide (CO 2 ),<strong>and</strong> trace amounts of several other gases.The troposphere is also the layer of the atmosphereinvolved in the chemical cycling of the earth’svital nutrients. In addition, this thin <strong>and</strong> turbulent155Pressure =1,000millibars atground levelFigure 20-2 Natural capital: the earth’s atmosphere consistsof several layers. The average temperature of the atmospherevaries with altitude (red line). The average temperature of the atmosphereat the earth’s surface is determined by a combinationof two factors. One is natural heating by incoming sunlight <strong>and</strong>certain greenhouse gases that release absorbed energy asheat into the lower troposphere (the natural greenhouse effect;Figure 6-14, p. 110). The other is natural cooling by surfaceevaporation of water <strong>and</strong> convection processes that transferheat to higher altitudes <strong>and</strong> latitudes (Figure 6-10, p. 107). MostUV radiation from the sun is absorbed by ozone (O 3 ), found primarilyin the stratosphere in the ozone layer 17–26 kilometers(10–16 miles) above sea level.434 CHAPTER 20 Air Pollution
layer of rising <strong>and</strong> falling air currents <strong>and</strong> winds islargely responsible for the planet’s short-term weather<strong>and</strong> long-term climate.To biologist <strong>and</strong> environmental scientist DavidSuzuki, “Air is a matrix or universal glue that joins alllife together. . . . Every breath is an affirmation of ourconnection with other living things, a renewal of ourlink with our ancestors, <strong>and</strong> a contribution to generationsyet to come.”What Is the Stratosphere? Earth’sGlobal SunscreenOzone in the atmosphere’s second layer filters outmost of the sun’s UV radiation that is harmful to us<strong>and</strong> most other species.The atmosphere’s second layer is the stratosphere,which extends from about 17 to 48 kilometers (11–30miles) above the earth’s surface (Figure 20-2). Althoughthe stratosphere contains less matter than thetroposphere, its composition is similar, with two notableexceptions: its volume of water vapor is about1/1,000 as much <strong>and</strong> its concentration of ozone (O 3 ) ismuch higher (Figure 20-3).Stratospheric ozone is produced when some of theoxygen molecules there interact with ultraviolet (UV)radiation emitted by the sun (3 O 2 UV 2 O 3 ).This “global sunscreen” of ozone in the stratospherekeeps about 95% of the sun’s harmful UV radiationfrom reaching the earth’s surface.Altitude (kilometers)403530252015Stratospheric ozoneStratosphere105Troposphere5Photochemical ozone000 5 10 15 20Ozone concentration (ppm)Figure 20-3 Natural capital: average distribution <strong>and</strong> concentrationsof ozone in the troposphere <strong>and</strong> stratosphere. Beneficialozone that forms in the stratosphere protects life on earthby filtering out most of the incoming harmful UV radiation emittedby the sun. Harmful or photochemical ozone forms in thetroposphere when various air pollutants undergo chemical reactionsunder the influence of sunlight. Ozone in this atmospherenear the earth’s surface damages plants, lung tissues,<strong>and</strong> some materials such as rubber.25201510Altitude (miles)This UV filter of “good” ozone in the lower stratosphereallows us <strong>and</strong> other forms of life to exist onl<strong>and</strong> <strong>and</strong> helps protect us from sunburn, skin <strong>and</strong> eyecancer, cataracts, <strong>and</strong> damage to our immune systems.It also prevents much of the oxygen in the tropospherefrom being converted to photochemical ozone, a harmfulair pollutant.Much evidence indicates that some human activitiesare decreasing the amount of beneficial or “good”ozone in the stratosphere <strong>and</strong> increasing the amount ofharmful or “bad” ozone in the troposphere—especiallyin some urban areas.20-2 OUTDOOR AIR POLLUTIONWhat Are the Major Types <strong>and</strong> Sourcesof Air Pollution? Burning Fossil FuelsIs the Major CulpritOutdoor air pollutants come mostly from naturalsources <strong>and</strong> burning fossil fuels in motor vehicles<strong>and</strong> power <strong>and</strong> industrial plants.Air pollution is the presence of chemicals in the atmospherein concentrations high enough to affect climate<strong>and</strong> harm organisms <strong>and</strong> materials. The effects ofairborne pollutants range from annoying to lethal.Table 20-1 (p. 436) lists the major classes of pollutantscommonly found in outdoor (ambient) air. Themajority comes from natural sources. They includedust particles blowing off the earth’s surface (Figure6-1, p. 102), volatile organic chemicals released bysome plants, the decay of plants, forest fires, volcaniceruptions, <strong>and</strong> sea spray. Most natural sources of airpollution are spread out <strong>and</strong>, except for those fromvolcanic eruptions <strong>and</strong> some forest fires, rarely reachharmful levels.Air pollution is not new (Spotlight, p. 437).Throughout human history, beginning with the discoveryof fire, we have added various types of pollutantsto the troposphere. Our inputs increased whenwe began extracting <strong>and</strong> burning coal, first for heat<strong>and</strong> later for generating electricity <strong>and</strong> producing materialssuch as steel.Burning oil, gasoline, <strong>and</strong> natural gas also addspollutants to the atmosphere. Pollutants from our activitiescan reach harmful levels in the troposphere,especially in urban areas where people, cars, <strong>and</strong> industrialactivities are concentrated.Most outdoor pollutants in today’s urban areas enterthe atmosphere from the burning of fossil fuels inpower plants <strong>and</strong> factories (stationary sources) <strong>and</strong> inmotor vehicles (mobile sources). Scientists classifyoutdoor air pollutants into two categories. Primarypollutants are those emitted directly into the tropospherein a potentially harmful form. Examples are soothttp://biology.brookscole.com/miller14435
Table 20-1 Major Classes of Air PollutantsClassExamplesCarbon oxides Carbon monoxide (CO) <strong>and</strong> carbon dioxide (CO 2 )Sulfur oxides Sulfur dioxide (SO 2 ) <strong>and</strong> sulfur trioxide (SO 3 )Nitrogen oxides Nitric oxide (NO), nitrogen dioxide (NO 2 ), nitrous oxide (N 2 O)(NO <strong>and</strong> NO 2 often are lumped together <strong>and</strong> labeled NO x )Volatile organic compounds (VOCs)Methane (CH 4 ), propane (C 3 H 8 ), chlorofluorocarbons (CFCs)Suspended particulate matter (SPM)Solid particles (dust, soot, asbestos, lead, nitrate, <strong>and</strong> sulfate salts),liquid droplets (sulfuric acid, PCBs, dioxins, <strong>and</strong> pesticides)Photochemical oxidantsOzone (O 3 ), peroxyacyl nitrates (PANs), hydrogen peroxide(H 2 O 2 ), aldehydesRadioactive substances Radon-222, iodine-131, strontium-90, plutonium-239 (Table 3-1, p. 49)Hazardous air pollutants (HAPs), which cause health Carbon tetrachloride (CCl 4 ), methyl chloride (CH 3 Cl), chloroformeffects such as cancer, birth defects, <strong>and</strong> nervous(CHCl 3 ), benzene (C 6 H 6 ), ethylene dibromide (C 2 H 2 Br 2 ), formaldehydesystem problems (CH 2 O 2 )<strong>and</strong> carbon monoxide. While in the troposphere, someof these primary pollutants may react with one anotheror with the basic components of air to form new pollutants,called secondary pollutants (Figure 20-4).With their concentration of cars <strong>and</strong> factories,cities normally have higher outdoor air pollution levelsthan rural areas. However, prevailing winds canspread long-lived primary <strong>and</strong> secondary air pollutantsfrom urban <strong>and</strong> industrial areas to the countryside<strong>and</strong> to other urban areas.Indoor air pollutants come from infiltration of pollutedoutside air <strong>and</strong> various chemicals used or pro-Primary PollutantsCOCO 2Secondary PollutantsSourcesNaturalSO 2 NO NO 2Most hydrocarbonsSO 3Most suspended particlesHNO 3 H 3 SO 4H 2 O 2 O 3 PANs– 2–Most NO 3 <strong>and</strong> SO 4 saltsStationaryMobileFigure 20-4 Natural capital degradation: sources <strong>and</strong> types of air pollutants. Human inputs of air pollutantsmay come from mobile sources (such as cars) <strong>and</strong> stationary sources (such as industrial <strong>and</strong> power plants).Some primary air pollutants may react with one another or with other chemicals in the air to form secondary airpollutants.436 CHAPTER 20 Air Pollution
Air Pollution in the Past: The Bad Old DaysModern civilizationdid not inventair pollution. Itprobably beganSPOTLIGHT when humans discoveredfire <strong>and</strong>used it to burn wood in poorly ventilatedcaves for warmth <strong>and</strong> cooking<strong>and</strong> inhaled unhealthy smoke<strong>and</strong> soot.During the Middle Ages, ahaze of wood smoke hung overdensely packed urban areas. Theindustrial revolution brought evenworse air pollution as coal wasburned to power factories <strong>and</strong> heathomes.By the 1850s, London had becomewell known for its “peasoup” fog, a mixture of coal smoke<strong>and</strong> fog that blanketed the city. In1880, a prolonged coal fog killedan estimated 2,200 people. Anotherin 1911 killed more than 1,100Londoners. The authors of a reporton this disaster coined the wordsmog for the deadly mixture ofsmoke <strong>and</strong> fog that envelopedthe city.In 1952, an even worse yellowfog lasted for 5 days <strong>and</strong> killedan estimated 4,000–12,000 Londoners,prompting Parliament to passthe Clean Air Act of 1956. Additionalair pollution disasters in1956, 1957, <strong>and</strong> 1962 killed 2,500more people. Because of strongair pollution laws, London’s airtoday is much cleaner, <strong>and</strong> “peasoup” fogs are a thing of the past.Now the major threat is from airpollutants emitted by motorvehicles.The industrial revolution, poweredby coal-burning factories <strong>and</strong>homes, brought air pollution to theUnited States. Large industrial citiessuch as Pittsburgh, Pennsylvania,<strong>and</strong> St. Louis, Missouri, wereknown for their smoky air. By the1940s, the air over some cities wasso polluted that people had to usetheir automobile headlights duringthe day.The first documented air pollutiondisaster in the United Statesoccurred on October 29, 1948, at thesmall industrial town of Donora inPennsylvania’s Monongahela RiverValley south of Pittsburgh. Pollutantsfrom the area’s coal-burningindustries became trapped in adense fog that stagnated over thevalley for 5 days. About 6,000 ofthe town’s 14,000 inhabitants becamesick, <strong>and</strong> 22 of them died.This killer fog resulted from a combinationof mountainous terrainsurrounding the valley <strong>and</strong>weather conditions that trapped<strong>and</strong> concentrated deadly pollutantsemitted by the community’s steelmill, zinc smelter, <strong>and</strong> sulfuric acidplant.In 1963, high concentrations ofair pollutants accumulated in the airover New York City, killing about300 people <strong>and</strong> injuring thous<strong>and</strong>s.Other episodes in New York, LosAngeles, <strong>and</strong> other large cities in the1960s led to much stronger air pollutioncontrol programs in the1970s.In 1952, Oregon became the firststate to pass a law controlling airpollution. Congress passed the originalversion of the Clean Air Act in1963. But it did not have much effectuntil a stronger version was enactedin 1970 <strong>and</strong> the <strong>Environmental</strong>Protection Agency was created<strong>and</strong> empowered to set <strong>and</strong> enforcenational air pollution st<strong>and</strong>ards.Even stricter emission st<strong>and</strong>ardswere imposed by amendments tothe Clean Air Act in 1977 <strong>and</strong> 1990.Mostly as a result of these laws <strong>and</strong>actions by states <strong>and</strong> local areas,there has been a dramatic improvementin air quality throughout theUnited States.Critical ThinkingExplain why you agree or disagreewith the statement that airpollution in the United Statesshould not be a major concernbecause of the significant progressin reducing outdoor air pollutionsince 1970.duced inside buildings, as discussed in Section 20-5.Experts in risk analysis rate indoor <strong>and</strong> outdoor airpollution as high-risk human health problems.According to the World Health Organization(WHO), one of every six people on the earth or morethan 1.1 billion people live in urban areas where outdoorair is unhealthy to breathe. Most of them live indensely populated cities in developing countrieswhere air pollution control laws do not exist or arepoorly enforced. In other words, poverty can meanpoor air for the poor.In the United States <strong>and</strong> most other developedcountries, government-m<strong>and</strong>ated st<strong>and</strong>ards set maximumallowable atmospheric concentrations, or criteria,for six criteria or conventional air pollutants commonlyfound in outdoor air (Table 20-2, p. 438). Most scientistswould also add volatile organic compounds (VOCs,Table 20-1) to this list because of their role in the formationof photochemical smog that plagues many cities.Most air pollutants are gases. But some are aerosols,which consist of tiny particles of solids or droplets ofliquids suspended in the air. Good news. Regulatingthese six criteria pollutants has helped sharply reducetheir levels in most developed countries.Should Carbon Dioxide Be Classifiedas an Air Pollutant? Most ScientistsSay YesCarbon dioxide can be classified as an air pollutantbecause it can warm the atmosphere <strong>and</strong> contributeto global climate change.Most scientists would add CO 2 to the gang of six criteriaair pollutants (Table 20-2) despite the fact that thehttp://biology.brookscole.com/miller14437
Table 20-2 Major Outdoor Air Pollutants*CARBON MONOXIDE (CO)Description: Colorless, odorlessgas that is poisonous toair-breathing animals; forms duringthe incomplete combustionof carbon-containing fuels(2 C O 2 2 CO).Major human sources: Cigarettesmoking (p. 409), incompleteburning of fossil fuels.About 77% (95% in cities)comes from motor vehicle exhaust.Health effects: Reacts withhemoglobin in red blood cells<strong>and</strong> reduces the ability of bloodto bring oxygen to body cells<strong>and</strong> tissues. This impairs perception<strong>and</strong> thinking; slows reflexes;causes headaches,drowsiness, dizziness, <strong>and</strong>nausea; can trigger heart attacks<strong>and</strong> angina; damages thedevelopment of fetuses <strong>and</strong>young children; <strong>and</strong> aggravateschronic bronchitis, emphysema,<strong>and</strong> anemia. At highlevels it causes collapse, coma,irreversible brain cell damage,<strong>and</strong> death.NITROGEN DIOXIDE (NO 2 )Description: Reddish-brownirritating gas that givesphotochemical smog its brownishcolor; in the atmospherecan be converted to nitric acid(HNO 3 ), a major component ofacid deposition.Major human sources: Fossilfuel burning in motor vehicles(49%) <strong>and</strong> power <strong>and</strong> industrialplants (49%).Health effects: Lung irritation<strong>and</strong> damage; aggravatesasthma <strong>and</strong> chronic bronchitis;increases susceptibility to respiratoryinfections such as theflu <strong>and</strong> common colds (especiallyin young children <strong>and</strong>older adults).<strong>Environmental</strong> effects:Reduces visibility; acid depositionof HNO 3 can damagetrees, soils, <strong>and</strong> aquatic life inlakes.Property damage: HNO 3 cancorrode metals <strong>and</strong> eat awaystone on buildings, statues,<strong>and</strong> monuments; NO 2 c<strong>and</strong>amage fabrics.SULFUR DIOXIDE (SO 2 )Description: Colorless, irritating;forms mostly from the combustionof sulfur-containingfossil fuels such as coal <strong>and</strong> oil(S O 2 SO 2 ); in the atmospherecan be converted tosulfuric acid (H 2 SO 4 ), a majorcomponent of acid deposition.Major human sources: Coalburning in power plants (88%)<strong>and</strong> industrial processes(10%).Health effects: Breathing problemsfor healthy people; restrictionof airways in people withasthma; chronic exposure cancause a permanent conditionsimilar to bronchitis. Accordingto the WHO, at least 625 millionpeople are exposed to unsafelevels of sulfur dioxide from fossilfuel burning.<strong>Environmental</strong> effects: Reducesvisibility; acid depositionof H 2 SO 4 can damagetrees, soils, <strong>and</strong> aquatic life inlakes.Property damage: SO 2 <strong>and</strong>H 2 SO 4 can corrode metals <strong>and</strong>*Data from U.S. <strong>Environmental</strong> Protection Agency.eat away stone on buildings,statues, <strong>and</strong> monuments; SO 2can damage paint, paper, <strong>and</strong>leather.SUSPENDED PARTICULATEMATTER (SPM)Description: Variety of particles<strong>and</strong> droplets (aerosols)small <strong>and</strong> light enough to remainsuspended in atmospherefor short periods (largeparticles) to long periods(small particles; Figure 20-6,p. 441); cause smoke, dust,<strong>and</strong> haze.Major human sources: Burningcoal in power <strong>and</strong> industrialplants (40%), burning diesel<strong>and</strong> other fuels in vehicles(17%), agriculture (plowing,burning off fields), unpavedroads, construction.Health effects: Nose <strong>and</strong> throatirritation, lung damage, <strong>and</strong>bronchitis; aggravates bronchitis<strong>and</strong> asthma; shortens life;toxic particulates (such as lead,cadmium, PCBs, <strong>and</strong> dioxins)can cause mutations, reproductiveproblems, cancer.<strong>Environmental</strong> effects: Reducesvisibility; acid depositionof H 2 SO 4 droplets c<strong>and</strong>amage trees, soils, <strong>and</strong>aquatic life in lakes.Property damage: Corrodesmetal; soils <strong>and</strong> discolorsbuildings, clothes, fabrics, <strong>and</strong>paints.OZONE (O 3 )Description: Highly reactive,irritating gas with an unpleasantodor that formsin the troposphere as amajor component of photochemicalsmog (Figures 20-3<strong>and</strong> 20-5).Major human sources:Chemical reaction with volatileorganic compounds (VOCs,emitted mostly by cars <strong>and</strong> industries)<strong>and</strong> nitrogen oxidesto form photochemical smog(Figure 20-5).Health effects: Breathingproblems; coughing; eye,nose, <strong>and</strong> throat irritation; aggravateschronic diseasessuch as asthma, bronchitis,emphysema, <strong>and</strong> heart disease;reduces resistance tocolds <strong>and</strong> pneumonia; mayspeed up lung tissue aging.<strong>Environmental</strong> effects:Ozone can damage plants<strong>and</strong> trees; smog can reducevisibility.Property damage: Damagesrubber, fabrics, <strong>and</strong> paints.LEADDescription: Solid toxic metal<strong>and</strong> its compounds, emittedinto the atmosphere as particulatematter.Major human sources: Paint(old houses), smelters (metalrefineries), lead manufacture,storage batteries, leaded gasoline(being phased out in developedcountries).Health effects: Accumulatesin the body; brain <strong>and</strong> othernervous system damage <strong>and</strong>mental retardation (especiallyin children); digestive <strong>and</strong>other health problems; somelead-containing chemicalscause cancer in test animals.<strong>Environmental</strong> effects: Canharm wildlife.EPA, under pressure from most U.S. oil <strong>and</strong> coal companies,says it is not.These scientists give three reasons for classifyingCO 2 as an air pollutant. First, in high enough concentrationsany chemical in the air can become a pollutant.Second, we have been increasing the concentration ofCO 2 in the troposphere by burning fossil fuels <strong>and</strong>clearing CO 2 -absorbing trees faster than they are growingback in many areas. Third, the troposphere iswarming <strong>and</strong> there is considerable evidence that theadditional CO 2 (a greenhouse gas) added to the troposphereby human activities plays a role in this change.So who cares if it gets a little warmer? Warmer winterswould be nice. The problem is that enhancement ofthe earth’s natural greenhouse effect (Figure 6-14,p. 110)—called global warming—can change where <strong>and</strong>how much precipitation falls, affect where we can growfood, <strong>and</strong> flood some areas of the world because of risingsea levels. Thus because higher atmospheric levelsof CO 2 can harm some people, economies, <strong>and</strong> ecosys-438 CHAPTER 20 Air Pollution
tems, most scientists say that it meets the criteria for beingclassified as an air pollutant.In 2003, 12 states sued the U.S. <strong>Environmental</strong>Protection Agency (EPA) for failure to regulate emissionsof carbon dioxide as allowed under the Clean AirAct. The EPA contends that the Clean Air Act does notgive the agency the power to control gases that cancause global warming. Meanwhile, some states arepassing laws that regulate carbon dioxide emissions.xHOW WOULD YOU VOTE? Should carbon dioxide beclassified as an air pollutant? Cast your vote online athttp://biology.brookscole.com/miller14.20-3 PHOTOCHEMICALAND INDUSTRIAL SMOGWhat Is Photochemical Smog? Brown-AirSmogPhotochemical smog is a mixture of air pollutantsformed by the reaction of nitrogen oxides <strong>and</strong> volatileorganic hydrocarbons under the influence of sunlight.A photochemical reaction is any chemical reaction activatedby light. Air pollution known as photochemicalsmog is formed when a mix of nitrogen oxides (NO<strong>and</strong> NO 2 , both called NO x ) <strong>and</strong> volatile organic hydrocarboncompounds from natural <strong>and</strong> human sourceschemically react under the influence of UV radiationfrom the sun to produce a mixture of more than 100primary <strong>and</strong> secondary pollutants (Figure 20-5,p. 440). In greatly simplified terms,VOCs NO x heat sunlightground level ozone (O 3 ) other photochemicaloxidants aldehydes other secondary airpollutantsThe formation of photochemical smog involves acomplex series of chemical reactions. It begins insideautomobile engines <strong>and</strong> in the boilers of coal-burningpower <strong>and</strong> industrial plants. At the high temperaturesfound there, nitrogen <strong>and</strong> oxygen in air react to producecolorless nitric oxide (N 2 O 2 2 NO). Inthe atmosphere, some of the NO is converted to nitrogendioxide (NO 2 ), a yellowish-brown gas with achoking odor (Table 20-2). NO 2 is the cause of thebrownish haze that hangs over many cities during theafternoons of sunny days, explaining why photochemicalsmog sometimes is called brown-air smog.When exposed to ultraviolet radiation from thesun, some of the NO 2 engages in a complex series ofreactions with hydrocarbons (mostly released by vegetation,motor vehicles, <strong>and</strong> other human activities) thatproduce photochemical smog—a mixture of ozone,nitric acid, aldehydes, peroxyacyl nitrates (PANs), <strong>and</strong>other secondary pollutants.Collectively, NO 2 , O 3 , <strong>and</strong> PANs are called photochemicaloxidants because they can react with <strong>and</strong> oxidizecertain compounds in the atmosphere or insideyour lungs that normally are not oxidized. Mere tracesof these oxidants (especially ozone, Table 20-2) <strong>and</strong>aldehydes in photochemical smog can irritate the respiratorytract <strong>and</strong> damage crops <strong>and</strong> trees.Hotter days lead to higher levels of ozone <strong>and</strong>other components of smog. As traffic increases on asunny day, smog builds up to peak levels by early afternoon,irritating people’s eyes <strong>and</strong> respiratory tracts.All modern cities have some photochemical smog,but it is much more common in cities with sunny,warm, dry climates <strong>and</strong> lots of motor vehicles. Examplesare Los Angeles, Denver, <strong>and</strong> Salt Lake City in theUnited States; Sydney, Australia; Mexico City; SãoPaulo, Brazil; <strong>and</strong> Buenos Aires, Argentina.What might happen if 400 million Chinese drivegasoline-fueled cars by 2050 as projected? According toa 1999 article in Geophysical Research Letters, the resultingphotochemical smog could cover the entire westernPacific in ozone, extending to the United States.How Can Trees Contribute to PhotochemicalSmog? Hydrocarbon EmittersSome hydrocarbon-emitting tree species cancontribute to the formation of photochemical smog.Trees have many environmental benefits. They emitoxygen, absorb CO 2 , provide shade (which reduces energyneeded for air conditioning), <strong>and</strong> help absorb <strong>and</strong>remove various pollutants from the air.When Ronald Reagan was running for presidentin 1980 he was ridiculed when he implied that we didnot need tougher air pollution laws because trees <strong>and</strong>plants caused 80% of all air pollution. This was certainlyan exaggeration.But recently scientists have found that somespecies of trees <strong>and</strong> plants (such as some oak species,sweet gums, poplars, <strong>and</strong> kudzu) in <strong>and</strong> around urbanareas play a larger role in smog formation than wasonce thought. They do so by emitting volatile organiccompounds (VOCs, especially hydrocarbons such asisoprene) that are ingredients in the development ofphotochemical smog.Unless forests of such trees are close to urban areas,most of their VOC emissions occur in nonurbanareas <strong>and</strong> disperse into the atmosphere. Thus they donot make a significant contribution to the formation ofphotochemical smog except in forested areas near urbanareas with large sources of NO x <strong>and</strong> plenty of sunlight.This is in contrast to cars, which along with refineries<strong>and</strong> other sources emit most of their VOCs,NO x , <strong>and</strong> other pollutants into urban air.http://biology.brookscole.com/miller14439
SolarradiationUltraviolet radiationNONitric oxideH 2 OWaterNO 2Nitrogen dioxideOAtomicoxygenO 2Molecular oxygenHydrocarbonsHNO 3Nitric acidPANsPeroxyacyl nitratesAldehydes(e.g., formaldehyde)O 3OzonePhotochemical smogFigure 20-5 Natural capital degradation: simplified scheme of the formation of photochemical smog. Theseverity of smog generally is associated with atmospheric concentrations of ozone at ground level.Because of trees’ ecological <strong>and</strong> aesthetic benefits,environmentalists support their widespread plantingin urban areas. But they say the emphasis should be ontree species that emit low levels of VOCs.How Does Industrial Smog Form, <strong>and</strong> HowBig a Problem Is It? Gray-Air Smog Is aDanger in Some Developing CountriesIndustrial smog is a mixture of sulfur dioxide,droplets of sulfuric acid, <strong>and</strong> a variety of suspendedsolid particles emitted by burning coal <strong>and</strong> oil.Fifty years ago, cities such as London, Engl<strong>and</strong>, <strong>and</strong>Chicago <strong>and</strong> Pittsburgh in the United States burnedlarge amounts of coal <strong>and</strong> heavy oil (which containsulfur impurities) in power plants <strong>and</strong> factories <strong>and</strong>for heating homes <strong>and</strong> cooking food. During winter,people in such cities were exposed to industrial smogconsisting mostly of sulfur dioxide, aerosols containingsuspended droplets of sulfuric acid formed fromsulfur dioxide, <strong>and</strong> a variety of suspended solid particles(Figure 20-6).The chemistry of industrial smog is fairly simple.When burned, the carbon in coal <strong>and</strong> oil is convertedto carbon dioxide (C O 2 CO 2 ) <strong>and</strong> carbonmonoxide (2 C O 2 2 CO). Some of the unburnedcarbon also ends up in the atmosphere as suspendedparticulate matter (soot), another ingredient ofindustrial smog.The sulfur compounds in coal <strong>and</strong> oil also reactwith oxygen to produce sulfur dioxide (SO 2 ), a colorless,suffocating gas. Sulfur dioxide also is emitted intothe troposphere when metal sulfide ores are roasted orsmelted to convert a metal ore (such as lead sulfide,PbS) to a free metal (such as Pb).In the troposphere, some of the sulfur dioxide reactswith oxygen to form sulfur trioxide (SO 3 ), whichthen reacts with water vapor in the air to produce tiny440 CHAPTER 20 Air Pollution
UltrafineParticlesSea salt nucleiFineParticlesCarbon blackPaint pigmentsTobacco smokeCombustion nucleiOil smokeMetallurgical dust <strong>and</strong> fumesPhotochemical smogFly ashCement dustMilled flourCoal dustInsecticide dustsLargeParticlesPollens0.001 0.01 2.5 10.0 100.0Average particle diameter (micrometers or microns)Figure 20-6 Suspended particulate matter consists of particlesof solid matter <strong>and</strong> droplets of liquid that are small <strong>and</strong> lightenough to remain suspended in the atmosphere for some period(the larger the particle, the sooner it usually falls to earth).Suspended particles are found in a wide variety of types <strong>and</strong>sizes, ranging in diameter from 0.001 micrometer to 100 micrometers(a micrometer, or micron, is one-millionth of a meter,or about 0.00004 inch). Since 1987, the EPA has focused onfine particles smaller than 10 microns (known as PM-10). In1997, the agency began focusing on reducing emissions ofultrafine particles with diameters less than 2.5 microns (knownas PM-2.5) because these particles are small enough to reachthe lower part of human lungs <strong>and</strong> contribute to respiratorydiseases.suspended droplets of sulfuric acid (H 2 SO 4 ). Some ofthese droplets react with ammonia in the atmosphere toform solid particles of ammonium sulfate [(NH 4 ) 2 SO 4 ].The tiny suspended particles of such salts <strong>and</strong> carbon(soot) give the resulting industrial smog a gray color,explaining why it is sometimes called gray-air smog.Today urban industrial smog is rarely a problemin most developed countries. This has happened becausecoal <strong>and</strong> heavy oil are burned only in large boilerswith reasonably good pollution control or with tallsmokestacks that transfer the pollutants to downwindrural areas.However, industrial smog is a problem in industrializedurban areas of China, India, Ukraine, <strong>and</strong>some eastern European countries (especially the“black triangle” region of Slovakia, Pol<strong>and</strong>, Hungary,<strong>and</strong> the Czech Republic), where large quantities of coalare burned with inadequate pollution controls.In addition to providing electricity <strong>and</strong> runningindustries, coal is burned for heating homes <strong>and</strong> cookingby millions of poor families. As a result, China hassome of the world’s most polluted indoor <strong>and</strong> outdoorair. This explains why many residents of Beijing developserious respiratory problems <strong>and</strong> some die prematurelyfrom the coal-generated air pollution. Afteronly a few days in this region visitors often suffer fromcoughs <strong>and</strong> bronchial irritation.Some Chinese cities have so many smokestacks<strong>and</strong> home chimneys belching coal smoke that residentssee the sun for only a few weeks a year. This is similarto conditions in many U.S. cities a hundred years ago<strong>and</strong> earlier in many European cities (Spotlight, p. 437).What Factors Influence the Formationof Photochemical <strong>and</strong> Industrial Smog?Rain, Wind, Buildings, Mountains, <strong>and</strong>TemperatureOutdoor air pollution can be reduced by precipitation,sea spray, <strong>and</strong> winds <strong>and</strong> increased by urban buildings,mountains, <strong>and</strong> high temperatures.The frequency <strong>and</strong> severity of smog in an area dependon local climate <strong>and</strong> topography, population density,the amount of industry, <strong>and</strong> the fuels used in industry,heating, <strong>and</strong> transportation.Three natural factors help reduce outdoor air pollution.One is rain <strong>and</strong> snow, which help cleanse the airof pollutants. This helps explain why cities with dryclimates are more prone to photochemical smog thancities with wet climates. A second factor is salty seaspray from the oceans, which can wash out particulates<strong>and</strong> other water-soluble pollutants from air that flowsfrom l<strong>and</strong> onto the oceans.A third factor is winds, which can help sweep pollutantsaway, dilute them by mixing them with cleanerair, <strong>and</strong> bring in fresh air. However, these pollutantsare blown somewhere else or are deposited from thesky onto surface waters, soil, <strong>and</strong> buildings. There isno away.Four other factors can increase outdoor air pollution.One is urban buildings, which can slow wind speed<strong>and</strong> reduce dilution <strong>and</strong> removal of pollutants. Anotheris hills <strong>and</strong> mountains. They can reduce the flow ofair in valleys below them, allowing pollutant levels tobuild up at ground level. In addition, high temperaturesfound in most urban areas promote the chemical reactionsleading to photochemical smog formation.A fourth factor is called the grasshopper effect basedon atmospheric distillation, which transfers volatile airpollutants from tropical <strong>and</strong> temperate areas to theearth’s poles. It occurs when volatile compoundshttp://biology.brookscole.com/miller14441
evaporate from warm terrestrial areas at low latitudes<strong>and</strong> rise high into the atmosphere. Then they are depositedin the oceans or carried to higher latitudes ator near the earth’s poles by atmospheric currents <strong>and</strong>oceanic currents of water.This explains why for decades pilots have reporteddense layers of reddish-brown haze over theArctic. It also explains why polar bears, whales,sharks, <strong>and</strong> other top carnivores <strong>and</strong> native peoples inthe Arctic have high levels of DDT <strong>and</strong> other longlivedpesticides, toxic metals (such as lead <strong>and</strong> mercury),<strong>and</strong> polychlorinated biphenyls (PCBs) in theirbodies even though there are no concentrations of industrialfacilities <strong>and</strong> cars in these remote areas.How Can Temperature Inversions IncreaseOutdoor Air Pollution? Trapping Pollutantsnear the GroundA layer of warm air sitting on top of a layer of coolair near the ground can prevent outdoor pollutantsfrom rising <strong>and</strong> dispersing.During daylight, the sun warms the air near theearth’s surface. Normally, this warm air <strong>and</strong> most ofthe pollutants it contains rise to mix with the cooler airabove it. This mixing of warm <strong>and</strong> cold air creates turbulence,which disperses the pollutants.Under certain atmospheric conditions, however, alayer of warm air can lie atop a layer of cooler air nearerthe ground, a situation known as a temperature inversion.Because the cooler air is denser than the warmerair above it, the air near the surface does not rise <strong>and</strong>mix with the air above it. Pollutants can concentrate inthis stagnant layer of cool air near the ground.Areas with two types of topography <strong>and</strong> weatherconditions are especially susceptible to prolonged temperatureinversions (Figure 20-7). One such area is atown or city located in a valley surrounded by mountainsthat experiences cloudy <strong>and</strong> cold weather duringpart of the year (Figure 20-7, top). In such cases, thesurrounding mountains along with the clouds blockmuch of the winter sun that causes air to heat <strong>and</strong> rise,<strong>and</strong> the mountains block air from being blown away.As long as these stagnant conditions persist, concentrationsof pollutants in the valley below will build upto harmful <strong>and</strong> even lethal concentrations. This is whathappened during the 1948 air pollution disaster inthe valley town of Donora, Pennsylvania (Spotlight,p. 437).The second type of area typically is a city with severalmillion people <strong>and</strong> motor vehicles in an area witha sunny climate, light winds, mountains on threesides, <strong>and</strong> the ocean on the other. Here, the conditionsare ideal for photochemical smog worsened by frequentthermal inversions (Figure 20-7, bottom).This describes California’s heavily populated LosAngeles basin, which has prolonged subsidence temperatureinversions at least half of the year, mostlyduring the warm summer <strong>and</strong> fall. When a thermal inversionpersists throughout the day, the surroundingmountains prevent the polluted surface air from beingblown away by sea breezes.Case Study: South Asia’s Massive BrownCloud—Choking in China <strong>and</strong> IndiaA huge dark brown cloud of industrial smog, causedby coal burning in countries such as China <strong>and</strong> India,stretches over much of southeastern Asia.A 2002 study by the UN Environment Programmewarned of the harmful effects of a huge blanket ofmostly industrial smog—called the Asian Brown Cloud.Satellite images show a dark brown cloud, 3 kilometers(2 miles) thick, stretching nearly continuouslyacross much of India, Bangladesh, <strong>and</strong> the industrialheart of China <strong>and</strong> parts of the open sea in this area.This cloud is caused by huge emissions of ash,smoke, dust, <strong>and</strong> acidic compounds produced by peopleburning coal in industries <strong>and</strong> homes <strong>and</strong> clearing<strong>and</strong> burning forests for planting crops, along with dustblowing off deserts in western Asia. As the cloud travels,it picks up many toxic pollutants.In a way, the rapid industrialization of parts ofsoutheastern Asia, especially China <strong>and</strong> India, is repeatingon a much larger scale the smoky, unhealthycoal-burning past of the industrial revolution inEurope <strong>and</strong> the United States during the 19th <strong>and</strong>early 20th centuries (Spotlight, p. 437).Here are some of the possible harmful effects ofthe Asian pollution. One is that the cloud reduces theamount of solar energy hitting the earth’s surface underneathit by 2% to as much as 15% in some areas.This may be reducing India’s winter rice harvests by3–10%. And acids in the haze falling to the surface c<strong>and</strong>amage crops, trees, <strong>and</strong> life in lakes.The cloud may also be an important contributor toillnesses <strong>and</strong> premature deaths from respiratory diseasesfor people who live under it. In Beijing, China,atmospheric concentrations of airborne particulatesare routinely five times higher than those in the LosAngeles basin. Not one of India’s 22 cities with morethan 1 million people meets WHO air pollution st<strong>and</strong>ards.Instead of blue skies, many of the inhabitantsliving under the Asian brown cloud see gray skiesmuch of the year.Another problem is that the aerosols of fine particles<strong>and</strong> droplets in this huge cloud appear to becausing changes in regional climate, warming someareas, cooling other areas, <strong>and</strong> shifting patterns ofrainfall including India’s vital winter monsoon sea-442 CHAPTER 20 Air Pollution
Warmer airInversion layerIncreasing altitudeCool layerMountainMountainValleyDecreasing temperatureDescending warm air massInversion layerIncreasing altitudeSea breezeMountainrangeDecreasing temperatureFigure 20-7 Two sets of topography <strong>and</strong> weather conditions that lead to prolonged temperature inversions, inwhich a warm air layer sits atop a cooler air layer. Air pollutants can build to harmful levels during an inversion.Top, a temperature inversion can occur during cold, cloudy weather in a valley surrounded by mountains (top).Frequent <strong>and</strong> prolonged temperature inversions can also occur in an area with a sunny climate, light winds,mountains on three sides, <strong>and</strong> the ocean on the other. A layer of descending warm air from a high-pressuresystem prevents ocean-cooled air near the ground from ascending enough to disperse <strong>and</strong> dilute pollutants.Because of their topography, Los Angeles <strong>and</strong> Mexico City have frequent temperature inversions, many ofthem prolonged during the summer.son. It may even play a role in the intensity <strong>and</strong> frequencyof the El Niño–Southern Oscillation (ENSO)climate cycle (Figure 6-12, p. 108) <strong>and</strong> may thus affectNorth <strong>and</strong> South America <strong>and</strong> other parts of theworld (Figure 6-13, p. 109).The history of air pollution control in Europe <strong>and</strong>the United States shows that atmospheric hazes can becleared up fairly quickly. This is done by setting st<strong>and</strong>ardsfor coal-burning industries <strong>and</strong> utilities, shiftingfrom coal to cleaner-burning natural gas in industries<strong>and</strong> dwellings in urban areas, relying more on renewableenergy resources such as wind <strong>and</strong> hydropowerto produce electricity, <strong>and</strong> requiring catalytic converterson cars. China is beginning to do this <strong>and</strong> hopes torestore clear blue skies to Beijing by the 2008Olympics. India’s capital city of Delhi has also madeprogress in reducing air pollution under orders fromIndia’s Supreme Court.http://biology.brookscole.com/miller14443
20-4 REGIONAL OUTDOORAIR POLLUTION FROM ACIDDEPOSITIONWhat Is Acid Deposition, <strong>and</strong> Where Does ItOccur? Acids Falling on Your HeadSulfur dioxide, nitrogen oxides, <strong>and</strong> particulatescan react in the atmosphere to produce acidicchemicals that can travel long distances beforereturning to the earth’s surface.Most coal-burning power plants, ore smelters, <strong>and</strong>other industrial plants in developed countries use tallsmokestacks to emit sulfur dioxide, suspended particles,<strong>and</strong> nitrogen oxides high into the tropospherewhere wind can mix, dilute, <strong>and</strong> disperse them.These tall smokestacks reduce local air pollution,but they can increase regional air pollution downwind.This occurs because the primary pollutants, sulfurdioxide <strong>and</strong> nitrogen oxides, emitted into the atmosphereabove the inversion layer are transported asmuch as 1,000 kilometers (600 miles) by prevailingwinds. During their trip, they form secondary pollutantssuch as nitric acid vapor, droplets of sulfuric acid,<strong>and</strong> particles of acid-forming sulfate <strong>and</strong> nitrate salts.These acidic substances remain in the atmospherefor 2–14 days, depending mostly on prevailing winds,precipitation, <strong>and</strong> other weather patterns. During thisperiod they descend to the earth’s surface in two forms.One is wet deposition as acidic rain, snow, fog, <strong>and</strong> cloudvapor with a pH less than 5.6 (Figure 3-6, p. 41). Theother is dry deposition as acidic particles. The resultingmixture is called acid deposition (Figure 20-8), sometimestermed acid rain. Most dry deposition occurswithin about 2–3 days fairly near the emission sources,whereas most wet deposition takes place within 4–14days in more distant downwind areas.Acid deposition is a regional air pollution problemin most parts of the world that are downwindfrom coal-burning facilities <strong>and</strong> from urban areas withlarge numbers of cars. Such areas include the easternUnited States (Figure 20-9) <strong>and</strong> other parts of theworld (Figure 20-10, p. 446). Look at the maps to see ifyou live in a major acid deposition area.In the United States, coal-burning power <strong>and</strong> industrialplants in the Ohio Valley emit the largestquantities of sulfur dioxide <strong>and</strong> other pollutants thatcan cause acid deposition. Mostly as a result of theseemissions along with those by other industries <strong>and</strong>motor vehicles in urban areas, typical precipitation inthe eastern United States has a pH of 4.4–4.8 (Figure20-9). This is about 10 or more times the acidity ofnatural precipitation, which has a pH of 5.6. Somemountaintop forests in the eastern United States <strong>and</strong>east of Los Angeles, California, are bathed in fog <strong>and</strong>dews as acidic as lemon juice, with a pH of 2.3—about1,000 times the acidity of normal precipitation.In some areas, soils contain basic compounds suchas calcium carbonate (CaCO 3 )orlimestone that can reactwith <strong>and</strong> neutralize, or buffer, some inputs of acids.WindTransformation tosulfuric acid (H 2 SO 4 )<strong>and</strong> nitric acid (HNO 3 )Nitric oxide (NO)Sulfur dioxide(SO 2 ) <strong>and</strong> NOWindborne ammonia gas<strong>and</strong> particles of cultivated soilpartially neutralize acids <strong>and</strong>form dry sulfate <strong>and</strong> nitrate saltsDry acid deposition(sulfur dioxide gas<strong>and</strong> particles ofsulfate <strong>and</strong> nitrate salts)Wet acid depostion(droplets of H 2 SO 4 <strong>and</strong>HNO 3 dissolved in rain<strong>and</strong> snow)OceanAcid fogFarmLakes in deepsoil high in limestoneare bufferedLakes in shallow soillow in limestonebecome acidicFigure 20-8 Natural capital degradation: acid deposition, which consists of rain, snow, dust, or gas with a pHlower than 5.6, is commonly called acid rain. Soils <strong>and</strong> lakes vary in their ability to buffer or remove excess acidity.444 CHAPTER 20 Air Pollution
4.75.45.14.75.25.35.35.55.95.54.75.35.2 5.05.45.94.5 4.6 4.75.35.35.5 5.4 5.2 5.24.64.75.45.84.9 4.8 4.65.45.65.35.0 4.84.4 4.5 4.55.35.34.55.75.74.94.44.54.65.75.15.35.44.74.8 4.4 4.5 4.55.8 5.85.35.15.45.54.9 4.74.44.54.75.5 4.94.44.54.4 4.54.4 4.45.54.85.64.85.64.44.75.44.65.3 4.74.7 4.6 4.55.85.1 4.74.66.05.64.6 4.5 4.85.66.2 5.35.4 5.24.84.54.65.55.54.74.65.65.1 5.15.44.64.64.65.7 5.25.85.0 4.85.14.74.64.74.65.65.14.94.84.64.54.65.65.45.55.24.84.6 4.8 4.8 4.9 4.86.75.1 5.1 4.95.14.7 4.85.44.8 4.95.24.7 4.7 4.85.04.85.2 5.14.84.85.2 5.45.45.25.2 4.94.84.84.74.8 4.95.84.84.85.14.84.54.85.04.5Major coal-burning power <strong>and</strong> industrial plants5.04.9≥5.35.2–5.35.1–5.25.0–5.14.9–5.04.8–4.94.7–4.84.6–4.74.5–4.64.4–4.54.3–4.4
Potential problem areasbecause of sensitive soilsPotential problem areas because of air pollution:emissions leading to acid depositionCurrent problem areas(including lakes <strong>and</strong> rivers)Figure 20-10 Natural capital degradation: regions where acid deposition is now a problem (red) <strong>and</strong> regionswith the potential to develop this problem (yellow <strong>and</strong> green). Such regions have large inputs of air pollution(mostly from power plants, industrial plants, <strong>and</strong> ore smelters) or are sensitive areas with soils <strong>and</strong> bedrock thatcannot neutralize (buffer) inputs of acidic compounds (green areas <strong>and</strong> most red areas). (World ResourcesInstitute <strong>and</strong> U.S. <strong>Environmental</strong> Protection Agency)are especially susceptible because they dissolve evenin weak acid solutions. Large amounts of money arespent each year to clean <strong>and</strong> repair monuments <strong>and</strong>buildings that have been attacked by acid deposition.Acid deposition also decreases atmospheric visibility,mostly because of the sulfate particles it contains.For most aquatic systems, acid deposition hasharmful effects when the pH falls below 6 <strong>and</strong> especiallybelow 4.5, which kills most fish. Another effect isthe release into lakes of aluminum ions (Al 3 ) attachedto minerals in nearby soil. These ions asphyxiate manykinds of fish by stimulating excessive mucus formation,which clogs their gills.Lakes vary in their sensitivity to inputs of acids.Those on s<strong>and</strong> or igneous rocks, such as granite, generallyhave little buffering capacity to neutralize acids<strong>and</strong> thus are more susceptible to acidification. Much ofthe damage to aquatic life in such sensitive areas is aresult of acid shock. This is caused by the sudden runoffof large amounts of highly acidic water <strong>and</strong> aluminumions into lakes <strong>and</strong> streams when snow melts in thespring or after unusually heavy rains.Because of excess acidity, several thous<strong>and</strong> lakes inNorway <strong>and</strong> Sweden contain no fish, <strong>and</strong> many morelakes there have lost most of their acid-neutralizing capacity.In Canada, at least 1,200 acidified lakes containfew if any fish, <strong>and</strong> some fish populations in manythous<strong>and</strong>s of other lakes are declining because of increasedacidity. In the United States, several hundredlakes (most in the Northeast) are threatened with excessacidity.Acid deposition is not always the main culprit.Some lakes are acidic because they are surrounded bynaturally acidic soils.What Are the Effects of Acid Depositionon Plants <strong>and</strong> Soils? Depleting Nutrients<strong>and</strong> Damaging <strong>and</strong> Weakening PlantsAcid deposition can deplete some soil nutrients,release toxic ions into the soil, <strong>and</strong> weaken plantsso they become more susceptible to other stresses.Acid deposition (often along with other air pollutantssuch as ozone) can harm forests <strong>and</strong> crops, especially446 CHAPTER 20 Air Pollution
when the soil pH falls below 5.1. Effects of acid depositionon trees <strong>and</strong> other plants are caused partly bychemical interactions in forest <strong>and</strong> cropl<strong>and</strong> soils (Figure20-11).At first, sustained acid precipitation adds nitrogen<strong>and</strong> sulfur to the soils, which stimulates plant growth.But continued acid inputs can cause several problems.One is that the acids leach essential plant nutrients<strong>and</strong> calcium <strong>and</strong> magnesium salts (which can reduceacidity) from soils. This reduces plant productivity<strong>and</strong> the ability of the soils to buffer or neutralize acidicinputs.Another problem is that calcium deficiencies inplants produced in such nutrient-depleted soils can bepassed on to herbivores. For example, birds eatingcalcium-deficient plant material could have less calciumfor egg production, mammals could haveweaker bones, <strong>and</strong> insects could have weaker exoskeletons—anotherexample of connections <strong>and</strong> unintendedconsequences.In addition, some air pollutants can harm sometypes of trees through synergistic effects. For example,studies show that no visible injury occurs to whitepine seedlings when they are exposed individually tolow concentrations of sulfur dioxide <strong>and</strong> ozone. However,if the seedlings are exposed to the same concentrationsof both pollutants simultaneously, visibledamage occurs, apparently because the two pollutantsinteracted synergistically.Acid inputs can also dissolve insoluble soil compounds<strong>and</strong> release ions of metals such as aluminum,lead, cadmium, <strong>and</strong> mercury. When absorbed fromsoil, these ions are highly toxic to plants <strong>and</strong> animals.In addition, acid deposition can promote growth ofEmissionsAciddepositionSO 2H 2 O 2PANsNO xO 3OthersDirect damage toleaves <strong>and</strong> barkReducedphotosynthesis<strong>and</strong> growthIncreasedsusceptibility todrought, extremecold, insects,mosses, <strong>and</strong>disease organismsSoil acidificationTree deathLeachingof soilnutrientsAcidsReleaseof toxicmetal ionsRootdamageReduced nutrient<strong>and</strong> water uptakeLakeGroundwaterFigure 20-11 Natural capital degradation: air pollutants are one of several interacting stresses that can damage,weaken, or kill trees <strong>and</strong> pollute surface <strong>and</strong> groundwater.http://biology.brookscole.com/miller14447
acid-loving mosses that can kill trees. These mosseshold enough water to drown tree roots <strong>and</strong> can killmycorrhizae fungi that help the roots absorb nutrients(Figure 8-10c, p. 155).A major problem is that acid deposition weakenstrees <strong>and</strong> other plants so they become more susceptibleto other types of damage such as severe cold, diseases,insect attacks, drought, <strong>and</strong> harmful mosses.Thus acid deposition rarely kills trees directly but canweaken them <strong>and</strong> make them more susceptible toother stresses.Mountaintop forests are the terrestrial areas hardesthit by acid deposition. These areas tend to havethin soils without much buffering capacity, <strong>and</strong> treeson mountaintops (especially conifers such as redspruce <strong>and</strong> balsam fir that keep their leaves yearround)are bathed almost continuously in very acidicfog <strong>and</strong> clouds.Note that most of the world’s forests <strong>and</strong> lakes are notbeing destroyed or seriously harmed by acid deposition. It is aregional problem that can harm forests <strong>and</strong> lakesdownwind from coal-burning facilities <strong>and</strong> from largecar-dominated cities without adequate pollution controls.Do you live in an area affected by acid deposition?How Serious Is Acid Deposition in theUnited States? Some Hopeful SignsMuch progress has been made inunderst<strong>and</strong>ing <strong>and</strong> reducing acid depositionin the United States, but there is a long wayto go.Between 1980 <strong>and</strong> 1990, the federal government sponsoreda massive study called the National AcidPrecipitation Assessment Program (NAPAP). Its goalswere to coordinate government acid deposition research<strong>and</strong> assess the costs, benefits, <strong>and</strong> effectivenessof the country’s acid deposition legislation <strong>and</strong> controlprograms.Good news. Acid deposition has not led to a declinein overall tree growth in the vast majority of forests inthe United States <strong>and</strong> Canada. Also, the 1990 amendmentsto the Clean Air Act have lead to significant reductionsin SO 2 <strong>and</strong> NO x emissions from coal-firedpower <strong>and</strong> industrial plants, <strong>and</strong> further reductionsare projected.Bad news. Acid deposition has accelerated theleaching of plant nutrients—such as ions of calcium<strong>and</strong> magnesium—from soils in some areas <strong>and</strong> thiscould eventually decrease tree growth. Acid depositionhas also increased concentrations of toxic forms ofaluminum in some soil <strong>and</strong> in lakes <strong>and</strong> streams.According to a 2001 study by Gene Likens <strong>and</strong>nine other acid deposition researchers, an additional80% reduction in SO 2 emissions from coal-burningpower <strong>and</strong> industrial plants in the midwestern UnitedStates (red dots in Figure 20-9) will be needed fornortheastern lakes, forests, <strong>and</strong> streams to recoverfrom past <strong>and</strong> projected effects of acid deposition.Bottom line. The 1990 amendments to the Clean AirAct have helped reduce some of the harmful impactsof acid deposition in the United States but there is stilla long way to go.What Can Be Done to Reduce AcidDeposition? Plenty, But There Is PoliticalOppositionA number of prevention <strong>and</strong> control methods canreduce acid deposition, but implementing thesesolutions is politically difficult.Figure 20-12 summarizes ways to reduce acid deposition.According to most scientists studying the problem,the best solutions are prevention approaches thatPreventionReduce airpollutionby improvingenergyefficiencyReduce coal useIncrease naturalgas useIncrease use ofrenewable energyresourcesBurn low-sulfurcoalRemove SO 2particulates<strong>and</strong> NO x fromsmokestack gasesRemove NO x frommotor vehicularexhaustTax emissionsof SO 2SolutionsAcid DepositionCleanupAdd lime toneutralizeacidified lakesAdd phosphatefertilizer toneutralizeacidified lakesFigure 20-12 Solutions: methods for reducing acid deposition<strong>and</strong> its damage.448 CHAPTER 20 Air Pollution
educe or eliminate emissions of SO 2 , NO x , <strong>and</strong> particulates,as discussed in Section 20-7.To help reduce SO 2 emissions <strong>and</strong> thus acid deposition,some coal-burning power plants in the UnitedStates have increased their use of low-sulfur lignitecoal (Figure 17-20, p. 364). However, because lowsulfurlignite coal has a low heating value, more coalmust be burned to generate the same amount of electricity.This increases air pollution by emitting moreCO 2 , toxic mercury, <strong>and</strong> radioactive particles into thetroposphere—connections again.Controlling acid deposition is a political hotpotato. One problem is that the people <strong>and</strong> ecosystemsit affects often are quite distant from those who causethe problem. Also, countries with large supplies ofcoal (such as China, India, Russia, <strong>and</strong> the UnitedStates) have a strong incentive to use it as a major energyresource. And owners of coal-burning powerplants say the costs of adding pollution control equipment,using low-sulfur coal, or removing sulfur fromcoal are too high <strong>and</strong> would increase the cost of electricityfor consumers.<strong>Environmental</strong>ists respond that affordable <strong>and</strong>much cleaner ways are available to produce electricity—includingwind turbines <strong>and</strong> burning natural gasin turbines. They also point out that the largely hiddenhealth <strong>and</strong> environmental costs of burning coal areroughly twice its market cost. They urge inclusion ofthese costs in the price of producing electricity fromcoal. Then consumers would have more realisticknowledge about the harmful effects of burning coal.Large amounts of limestone or lime can be used toneutralize acidified lakes or surrounding soil—the primarycleanup approach now being used. But there areseveral problems with liming. One is that it is an expensive<strong>and</strong> temporary remedy that usually must berepeated annually. Also, it can kill some types ofplankton <strong>and</strong> aquatic plants <strong>and</strong> can harm wetl<strong>and</strong>plants that need acidic water. Finally, it is difficult toknow how much lime to put where (in the water or atselected places on the ground).In 2002, researchers in Engl<strong>and</strong> found that addinga small amount of phosphate fertilizer can neutralizeexcess acidity in a lake. The effectiveness of this approachis being evaluated.20-5 INDOOR AIR POLLUTIONHow Serious Is Indoor Air Pollution?Being Indoors Can Be Hazardous to YourHealthIndoor air pollution usually is a much greater threatto human health than outdoor air pollution.If you are reading this book indoors, you may be inhalingmore air pollutants with each breath than if youwere outside. Figure 20-13 (p. 450) shows some typicalsources of indoor air pollution. Which are you exposedto?EPA studies have revealed some alarming factsabout indoor air pollution in the United States. First,levels of 11 common pollutants generally are two tofive times higher inside homes <strong>and</strong> commercial buildingsthan outdoors <strong>and</strong> as much as 100 times higherin some cases. Second, pollution levels inside cars intraffic-clogged urban areas can be up to 18 timeshigher than outside. Third, the health risks from exposureto such chemicals are magnified because peopletypically spend 70–98% of their time indoors or insidevehicles.As a result of these studies, in 1990 the EPA placedindoor air pollution at the top of the list of 18 sources ofcancer risk—causing as many as 6,000 premature cancerdeaths per year. At greatest risk are smokers, infants<strong>and</strong> children under age 5, the old, the sick, pregnantwomen, people with respiratory or heart problems,<strong>and</strong> factory workers.Danish <strong>and</strong> U.S. EPA studies have linked variousair pollutants found in buildings to dizziness, headaches,coughing, sneezing, shortness of breath, nausea,burning eyes, chronic fatigue, irritability, skin dryness<strong>and</strong> irritation, <strong>and</strong> flu-like symptoms, known as thesick-building syndrome. New buildings are more commonly“sick” than old ones because of reduced air exchange(to save energy) <strong>and</strong> chemicals released fromnew carpeting <strong>and</strong> furniture. EPA studies indicate thatalmost one in five of the 4 million commercial buildingsin the United States are considered “sick” (includingEPA headquarters).According to the EPA <strong>and</strong> public health officials,the four most dangerous indoor air pollutants indeveloped countries are cigarette smoke, formaldehyde,radioactive radon-222 gas, <strong>and</strong> very small fine <strong>and</strong> ultrafineparticles. Good news. Between 1985 <strong>and</strong> 2004, thenumber of U.S. cities banning indoor smoking in facilitiesused by the public increased from 202 to almost1,700.In developing countries, the indoor burning ofwood, charcoal, dung, crop residues, <strong>and</strong> coal in openfires or in unvented or poorly vented stoves for cooking<strong>and</strong> heating exposes inhabitants to high levels ofparticulate air pollution. According to the World Bank,as many as 2.8 million people (most of them women<strong>and</strong> children) in developing countries die prematurelyeach year from breathing elevated levels of such indoorsmoke. Thus indoor air pollution for the poor is by farthe world’s most serious air pollution problem—a glaringexample of the relationship between poverty <strong>and</strong> environmentalquality.http://biology.brookscole.com/miller14449
ChloroformSource: Chlorine-treatedwater in hot showersPossible threat: CancerPara-dichlorobenzeneSource: Air fresheners,mothball crystalsThreat: CancerTetrachloroethyleneSource: Dry-cleaning fluidfumes on clothesThreat: Nerve disorders,damage to liver <strong>and</strong> kidneys,possible cancer1, 1, 1-TrichloroethaneSource: Aerosol spraysThreat: Dizziness, irregularbreathingFormaldehydeSource: Furniture stuffing,paneling, particleboard, foaminsulationThreat: Irritation of eyes, throat,skin, <strong>and</strong> lungs; nausea; dizzinessNitrogen OxidesSource: Unvented gas stoves <strong>and</strong>kerosene heaters, woodstovesThreat: Irritated lungs, children’scolds, headachesAsbestosSource: Pipe insulation,vinyl ceiling <strong>and</strong> floor tilesThreat: Lung disease, lungcancerCarbon MonoxideSource: Faulty furnaces,unvented gas stoves <strong>and</strong> keroseneheaters, woodstovesThreat: Headaches, drowsiness,irregular heartbeat, deathTobacco SmokeSource: CigarettesThreat: Lung cancer, respiratoryailments, heart diseasesMethylene ChlorideSource: Paint strippers<strong>and</strong> thinnersThreat: Nerve disorders,diabetesBenzo-α-pyreneSource: Tobacco smoke,woodstovesThreat: Lung cancerStyreneSource: Carpets, plastic productsThreat: Kidney <strong>and</strong> liver damageRadon-222Source: Radioactive soil <strong>and</strong>rock surrounding foundation,water supplyThreat: Lung cancerFigure 20-13 Some important indoor air pollutants. (Data from U.S. <strong>Environmental</strong> Protection Agency)Are You Exposed to Formaldehyde?A Serious ProblemFormaldehyde, found in a variety of commonmaterials <strong>and</strong> household products, can cause anumber of health problems.The chemical that causes most people in developedcountries difficulty is formaldehyde, a colorless, extremelyirritating gas widely used to manufacture commonhousehold materials.According to the EPA<strong>and</strong> theAmerican Lung Association, 20–40 million Americanssuffer from chronic breathing problems, dizziness, rash,headaches, sore throat, sinus <strong>and</strong> eye irritation, wheezing,<strong>and</strong> nausea caused by daily exposure to low levelsof formaldehyde emitted from common household materials.Are you one of these people?There are many sources of formaldehyde. They includebuilding materials (such as plywood, particleboard,paneling, <strong>and</strong> high-gloss wood used in floors<strong>and</strong> cabinets), furniture, drapes, upholstery, adhesivesin carpeting <strong>and</strong> wallpaper, urethane-formaldehyde insulation,fingernail hardener, <strong>and</strong> wrinkle-free coatingon permanent-press clothing (Figure 20-13). The EPAestimates that as many as 1 of every 5,000 people wholive in manufactured homes for more than 10 years willdevelop cancer from formaldehyde exposure.Case Study: Are You Being Exposed toRadioactive Radon Gas? Test the Air in YourHouseRadon-222, a radioactive gas found in some soil <strong>and</strong>rocks, can seep into some houses <strong>and</strong> increase the riskof lung cancer.Radon-222—a naturally occurring radioactive gas thatyou cannot see, taste, or smell—is produced by the radioactivedecay of uranium-238. Most soil <strong>and</strong> rock containsmall amounts of uranium-238. But this isotope ismuch more concentrated in underground deposits ofminerals such as uranium, phosphate, granite, <strong>and</strong> shale.When radon gas from such deposits seeps upwardthrough the soil <strong>and</strong> is released outdoors, it dispersesquickly in the atmosphere <strong>and</strong> decays to harmless levels.However, in buildings above such deposits radongas can enter through cracks in foundations <strong>and</strong> walls,openings around sump pumps <strong>and</strong> drains, <strong>and</strong> hollowconcrete blocks (Figure 20-14). It tends to be pulledinto a house because of the slightly lower atmospheric450 CHAPTER 20 Air Pollution
FurnaceSlabSoilClothesdryerRadon-222 gasOutlet vents for furnaces <strong>and</strong> dryersOpeningsaroundpipesOpenwindowWood stoveSlab jointsCracks in floorUranium-238Cracks in wallSumppumpFigure 20-14 Sources <strong>and</strong> paths of entry for indoor radon-222 gas. (Data from U.S.<strong>Environmental</strong> Protection Agency)Because radon hot spots can occuralmost anywhere, we do not know whichbuildings have unsafe levels of radonwithout conducting tests. In 1988, theEPA <strong>and</strong> the U.S. Surgeon General’s Officerecommended that everyone living ina detached house, a townhouse, a mobilehome, or on the first three floors of anapartment building test for radon.Ideally, radon levels should be monitoredcontinuously in the main living areas(not basements or crawl spaces) for2 months to a year. By 2003, only about6% of U.S. households had conductedradon tests (most lasting only 2–7 days<strong>and</strong> costing $20–100 per home). In 2003,the EPA again urged Americans to testtheir home for indoor radon gas. Haveyou tested your home for radon?For information about radon testingvisit the EPA website at http://www.epa.gov/iaq/radon or call the radon hotlineat 800-SOS-RADON. According to theEPA, radon control could add $350–500to the cost of a new home, <strong>and</strong> correctinga radon problem in an existing housecould run $800–2,500. Remedies includesealing cracks in the foundation <strong>and</strong>walls, increasing ventilation by crackinga window or installing vents, <strong>and</strong> using afan to create cross ventilation.pressure inside most homes. Once inside it can buildup to high levels, especially in unventilated lower levelsof homes <strong>and</strong> buildings.Radon-222 gas quickly decays into solid particlesof other radioactive elements such as polonium-210that if inhaled expose lung tissue to a large amount ofionizing radiation from alpha particles. According tothe National Academy of Sciences <strong>and</strong> the EPA, prolongedexposure for a lifetime of 70 years to low levelsof radon or radon acting together with smoking is responsiblefor 7,000–30,000 (with a best estimate of14,000) of the approximately 140,000 lung cancerdeaths each year in the United States. This makesradon the second leading cause of lung cancer aftersmoking. Most of the deaths are among smokers orformer smokers. Each year nonsmokers account forabout 2,100–2,900 deaths from lung cancer.Scientists made two assumptions in estimatingrisks from radon. One is that there is no safe thresholddose for radon exposure. The other is that the incidenceof lung cancer in uranium miners exposed tohigh levels of radon in mines can be extrapolated to estimatelung cancer deaths for people in homes exposedto much lower levels of radon. Some scientists questionthe validity of these assumptions.20-6 EFFECTS OF AIR POLLUTIONON LIVING ORGANISMS ANDMATERIALSHow Does Your Respiratory System HelpProtect You from Air Pollution? YourAir Pollution Security SystemYour respiratory system has several waysto help protect you from air pollution, butsome air pollutants can overcome thesedefenses.Your respiratory system (Figure 20-15, p. 452) has anumber of mechanisms that help protect you frommuch air pollution. Hairs in your nose filter out largeparticles. Sticky mucus in the lining of your upper respiratorytract captures smaller (but not the smallest)particles <strong>and</strong> dissolves some gaseous pollutants. Sneezing<strong>and</strong> coughing expel contaminated air <strong>and</strong> mucuswhen pollutants irritate your respiratory system.In addition, hundreds of thous<strong>and</strong>s of tiny mucus-coatedhairlike structures called cilia line yourupper respiratory tract. They continually wave backhttp://biology.brookscole.com/miller14451
Nasal cavityEpithelial cellCiliaOral cavityMucusPharynx (throat)Trachea (windpipe)BronchusRight lungBronchiolesAlveolar sac(sectioned)BronchioleAlveolar ductAlveoliFigure 20-15 Major components of the human respiratory system.<strong>and</strong> forth <strong>and</strong> transport mucus <strong>and</strong> the pollutants theytrap to your throat (where they are swallowed orexpelled).But prolonged or acute exposure to air pollutantsincluding tobacco smoke can overload or break downthese natural defenses. This can cause or contribute tovarious respiratory diseases. One that can start early inlife is asthma, typically an allergic reaction causing musclespasms in the bronchial walls <strong>and</strong> acute shortness ofbreath. According to a 2004 report by Harvard MedicalSchool’s Center for Health <strong>and</strong> the Global Environment,asthma among U.S. preschool children (ages 3 to 5)grew 160% between 1980 <strong>and</strong> 1994.Years of smoking <strong>and</strong> breathing air pollutants canlead to other respiratory disorders including lung cancer<strong>and</strong> chronic bronchitis, which involves persistent inflammation<strong>and</strong> damage to the cells lining the bronchi<strong>and</strong> bronchioles. The results are mucus buildup, loud,painful coughing, <strong>and</strong> shortness of breath. Damagedeeper in the lung can cause emphysema, which is irreversibledamage to air sacs or alveoli leading to loss oflung elasticity <strong>and</strong> acute shortness of breath (Figure20-16).People with respiratory diseases are especiallyvulnerable to air pollution, as are older adults, infants,pregnant women, <strong>and</strong> people with heart disease.Figure 20-16 Normal humanlungs (left) <strong>and</strong> the lungs of a personwho died of emphysema(right). Prolonged smoking <strong>and</strong> exposureto air pollutants can causeemphysema in anyone, but about2% of emphysema cases resultfrom a defective gene that reducesthe elasticity of the air sacsin the lungs. Anyone with thishereditary condition, for whichtesting is available, should notsmoke <strong>and</strong> should not live or workin a highly polluted area.O. Auerbach/Visuals Unlimited452 CHAPTER 20 Air Pollution
How Many People Die Prematurely fromAir Pollution? A Major KillerEach year air pollution prematurely kills about3 million people, mostly from indoor air pollutionin developing countries.Table 20-2 lists some of the harmful health effects ofprolonged or chronic exposure to six major air pollutants.According to the World Health Organization,worldwide at least 3 million people (most of them inAsia) die prematurely each year from the effects of airpollution—an average of 8,200 deaths per day. About2.8 million of these deaths (93%) are from indoor airpollution, mostly from burning wood or coal insidedwellings in developing countries. This explains whythe World Health Organization <strong>and</strong> the World Bank considerindoor air pollution one of the world’s most serious environmentalproblems.In the United States, the EPA estimates that annualdeaths related to indoor <strong>and</strong> outdoor air pollutionrange from 150,000 to 350,000 people—equivalent toone to two fully loaded 400-passenger jumbo jetscrashing each day with no survivors. Millions more becomeill <strong>and</strong> lose work time. Most of these deaths arerelated to inhalation of fine <strong>and</strong> ultrafine particulatesin indoor air.According to recent studies by the EPA, each yearmore than 125,000 Americans get cancer from breathingsoot-laden diesel fumes from buses, trucks, tractors,bulldozers <strong>and</strong> other construction equipment,<strong>and</strong> portable generators. The EPA says that in one yeara large diesel-powered bulldozer produces as much airpollution as 26 cars.The EPA has proposed emission st<strong>and</strong>ards fordiesel-powered vehicles that become effective in 2007with full compliance by 2012. The EPA estimates thatthese st<strong>and</strong>ards should reduce diesel-fuel emissionsby more than 90% <strong>and</strong> prevent as many as 12,000 prematuredeaths. Manufacturers of diesel-powered engines<strong>and</strong> vehicles dispute the EPA findings <strong>and</strong> hopeto relax or delay the st<strong>and</strong>ards. <strong>Environmental</strong>ists contendthat the st<strong>and</strong>ards will encourage the use of hybriddiesel-electric buses or better buses <strong>and</strong> otherlarge vehicles powered by natural gas.20-7 PREVENTING AND REDUCINGAIR POLLUTIONHow Have Laws Helped Reduce Air Pollutionin the United States? Clean Air Acts to theRescueClean Air Acts in the United States have greatlyreduced outdoor air pollution from six majorpollutants.The U.S. Congress passed Clean Air Acts in 1970,1977, <strong>and</strong> 1990. With these laws the federal governmentestablished air pollution regulations for key pollutantsthat are enforced by each state <strong>and</strong> by majorcities.Congress directed the EPA to establish nationalambient air quality st<strong>and</strong>ards (NAAQS) for six outdoorcriteria pollutants (Table 20-2). The EPA regulatesthese chemicals by using criteria developed from riskassessment methods to set maximum permissible levelsin outdoor air.One limit, called a primary st<strong>and</strong>ard, is set to protecthuman health, <strong>and</strong> another, called a secondary st<strong>and</strong>ard,is intended to prevent environmental <strong>and</strong> propertydamage. Each st<strong>and</strong>ard specifies the maximum allowablelevel, averaged over a specific period, for a certainpollutant in outdoor (ambient) air. The EPA has alsoestablished national emission st<strong>and</strong>ards for more than188 hazardous air pollutants (HAPs) that may cause serioushealth <strong>and</strong> ecological effects. These chemicals includeneurotoxins, carcinogens, mutagens, teratogens, endocrinesystem disrupters, <strong>and</strong> other toxic compounds(Section 19-3, p. 416). Most of these chemicals are chlorinatedhydrocarbons, volatile organic compounds, orcompounds of toxic metals.Measurements of HAPs in outdoor air are made inabout 50 locations in the United States. One of the bestsources of information about these chemicals in yourlocal area is the annual Toxic Release Inventory (TRI) collected<strong>and</strong> released to the public as part of communityright to know laws enacted by Congress in 1986. ThisTRI law requires 23,000 refineries, power plants, hardrock mines, chemical manufacturers, <strong>and</strong> factories toreport their releases above certain minimum amounts<strong>and</strong> their waste management methods for 667 toxicchemicals.Great news. According to a 2003 EPA report, combinedemissions of the six criteria air pollutantsdecreased by 48% between 1970 <strong>and</strong> 2002 even withsignificant increases in gross domestic product, vehiclemiles traveled, energy consumption, <strong>and</strong> population.Also, between 1983 <strong>and</strong> 2002, emissions of each ofthe six major outdoor air pollutants decreased—by93% for lead, 41% for carbon monoxide, 40% for volatileorganic compounds (VOCs), 34% for suspendedparticulate matter with a diameter less than 10 microns(PM-10), 33% for sulfur dioxide, <strong>and</strong> 15% forNO x . During this same period the ground-level atmosphericconcentration for ozone averaged over 8 hoursdecreased by 14%. Between 1983 <strong>and</strong> 2002, the averageatmospheric concentration of very fine suspended particulatematter with a diameter less than 2.5 microns(PM-2.5) decreased by 8%. And nationwide emissionsof toxic chemicals into the air dropped by about 21%between 1990 <strong>and</strong> 1999.However, releases of two HAPs—mercury <strong>and</strong>dioxins which are toxic at very low levels—have increasedin recent years. According to the EPA, about100 million Americans live in areas where the estimatedhttp://biology.brookscole.com/miller14453
cancer from HAPs—mostly formaldehyde, acetaldehyde,benzene, <strong>and</strong> 1,3 butadiene—is 10 in 1 million orten times the normally accepted st<strong>and</strong>ard of 1 deathper 1 million persons.After dropping in the 1980s, smog levels did notdrop between 1993 <strong>and</strong> 2003 mostly because reducingsmog requires much bigger cuts in emissions of nitrogenoxides from power <strong>and</strong> industrial plants <strong>and</strong> motorvehicles. Also, according to the EPA, in 2003 morethan 170 million people lived in 474 of the nation’s2,700 counties in 31 states where air is unhealthy tobreathe during part of the year because of high levelsof air pollutants—primarily ozone <strong>and</strong> fine particles.However, for most urban areas such conditions existfor only a few days a year.How Can U.S. Air PollutionLaws Be Improved? We Can DoBetter<strong>Environmental</strong>ists applaud the successof U.S. air pollution control laws but havesuggested several ways to make them moreeffective.The reduction of outdoor air pollution in the UnitedStates since 1970 has been a remarkable success story.This occurred because of two factors. First, U.S. citizensinsisted that laws be passed <strong>and</strong> enforced to improveair quality. Second, the country was affluentenough to afford such controls <strong>and</strong> improvements.But more can be done. <strong>Environmental</strong>ists point toseveral deficiencies in the Clean Air Act. One is continuingto rely mostly on pollution cleanup rather than prevention.An example of the power of prevention is that inthe United States, the air pollutant with the largestdrop (98% between 1970 <strong>and</strong> 2002) in its atmosphericlevel was lead, which was largely banned in gasoline.This is viewed as one of the greatest pollution successstories in the country’s history.Second is the failure of Congress to increase fuelefficiencyst<strong>and</strong>ards for cars, sport utility vehicles (SUVs),<strong>and</strong> light trucks. According to environmental scientists,increased fuel efficiency would reduce air pollutionfrom motor vehicles more quickly <strong>and</strong> effectively thanany other method, reduce CO 2 emissions, save energy,<strong>and</strong> save consumers enormous amounts of money.Third, there has also been inadequate regulation ofemissions from inefficient two-cycle gasoline engines.These engines are used in lawn mowers, leaf blowers,chain saws, jet skis, outboard motors, <strong>and</strong> snowmobiles.According to the California Air Resources Board,a 1-hour ride on a typical jet ski creates more air pollutionthan the average U.S. car does in a year, <strong>and</strong> operatinga 100-horsepower boat engine for 7 hours emitsmore air pollutants than a new car driven 160,000 kilometers(100,000 miles).In 2001, the EPA announced plans to reduce emissionsfrom most of these sources by 2007. But manufacturerspush for extending these deadlines.Fourth, there is little or no regulation of air pollutionfrom oceangoing ships in American ports. According tothe Earth Justice Legal Defense Fund, a single shipemits more air pollution than 2,000 diesel trucks.Fifth, the Clean Air Acts have failed to do much aboutreducing emissions of carbon dioxide <strong>and</strong> other greenhousegases. Also, the laws have failed to deal seriously with indoorair pollution even though it is by far the most seriousair pollution problem in terms of poorer health,premature death, <strong>and</strong> economic losses from lost worktime <strong>and</strong> increased health costs.Sixth, finally, there is a need for better enforcementof the Clean Air Acts. According to a 2002 governmentstudy, doing this would save about 6,000 lives <strong>and</strong> prevent140,000 asthma attacks each year in the UnitedStates.Executives of companies affected by implementingsuch policies claim that correcting these deficienciesin the country’s Clean Air Act would cost toomuch, harm economic growth, <strong>and</strong> cost jobs. Proponentscontend that history has shown that mostindustry cost estimates of implementing various airpollution control st<strong>and</strong>ards in the United States weremany times the actual cost. In addition, implementingsuch st<strong>and</strong>ards has helped increase economic growth<strong>and</strong> create jobs by stimulating companies to developnew technologies for reducing air pollution emissions.Many of these technologies are sold in the internationalmarketplace.xHOW WOULD YOU VOTE? Should the U.S. Clean Air Actbe strengthened? Cast your vote online at http://biology.brookscole.com/miller14.Case Study: Should We Use the Marketplaceto Reduce Pollution? Emissions TradingAllowing producers of air pollutants to buy<strong>and</strong> sell government air pollution allotmentsin the marketplace can help reduce emissions.To help reduce SO 2 emissions, the Clean Air Act of 1990allows an emissions trading policy, which enables the 110most polluting power plants in 21 states (primarily inthe Midwest <strong>and</strong> East, red dots in Figure 20-9) to buy<strong>and</strong> sell SO 2 pollution rights.This process begins with each of the coal-burningplants measuring the sulfur dioxide emitted from theirsmokestacks. Each year, a coal-burning power plant isgiven a certain number of pollution credits, or rights toemit a certain amount of SO 2 . A utility that emits lessSO 2 than its limit has a surplus of pollution credits. Itcan use these credits to avoid reductions in SO 2 emissionsat another of its plants, keep them for future454 CHAPTER 20 Air Pollution
plant expansions, or sell them to other utilities, privatecitizens, or environmental groups.Proponents argue that this system allows the marketplaceto determine the cheapest, most efficient wayto get the job done instead of having the governmentdictate how to control air pollution. Some environmentalistssee this cap-<strong>and</strong>-trade market approach as animprovement over the regulatory comm<strong>and</strong>-<strong>and</strong>-controlapproach, as long as it achieves a net reduction in SO 2pollution. This would be accomplished by limiting thetotal number of credits <strong>and</strong> gradually lowering theemissions cap or annual number of credits, as has beendone since 2000.One of the neat things about the SO 2 emissionsmarket is that anyone can participate. <strong>Environmental</strong>groups can buy up such rights to pollute <strong>and</strong> not usethem. You could personally reduce air pollution bybuying a certificate allowing you to add 0.9 metric ton(1 ton) of SO 2 to the atmosphere <strong>and</strong> hanging it on thewall. You can purchase these certificates <strong>and</strong> give themaway as birthday or holiday gifts. See http://www.epa.gov/airmarkets/ for a list of brokers <strong>and</strong> other sellersof SO 2 permits.Some environmentalists criticize the cap-<strong>and</strong>tradeprogram. They contend that it allows utilitieswith older, dirtier power plants to buy their way out<strong>and</strong> keep on emitting unacceptable levels of SO 2 . Thiscould lead (as it has) to continuing high levels of airpollution in certain areas or “hot spots.”This approach also creates incentives to cheatbecause air quality regulation is based largely on selfreportingof emissions. To help keep the system honest,the environmentalists call for unannounced spot monitoringby the government <strong>and</strong> high fines for cheaters.In addition, the success of any emissions tradingapproach depends on how low the initial cap is set <strong>and</strong>then on how much it is reduced annually to promotecontinuing innovation in air pollution prevention <strong>and</strong>control. Without these elements, these critics say thatemissions trading programs mostly move air pollutantsfrom one area to another without achieving anoverall reduction in air quality.Good news. Between 1980 <strong>and</strong> 2002, the emissionstrading system helped reduce SO 2 emissions fromelectric power plants in the United States by 40%. Andthe cost of doing this was less than one-tenth the costprojected by industry because this market-based systemmotivated companies to reduce emissions in moreefficient ways.The EPA has also created an emissions tradingprogram for smog-forming nitrogen oxides (NO x ) in anumber of states in the East <strong>and</strong> Midwest. Emissionstrading may also be implemented for particulate emissions<strong>and</strong> volatile organic compounds (VOCs) <strong>and</strong> forthe combined emissions of SO 2 , NO x , <strong>and</strong> mercuryfrom coal-burning power plants.This combined emissions trading scheme, proposedby the Bush administration in 2001 under itsClear Skies initiative, is strongly supported by the electricpower industry. The initiative aims for a 70% reductionin emissions of mercury, sulfur dioxide, <strong>and</strong>nitrogen oxides by 2018. But critics call this the DirtySkies plan, largely crafted by the country’s biggest airpolluters. According to Frank O’Donnell, executive directorof the Clean Air Trust, the Clear Skies plan was“drawn up by <strong>and</strong> for the big polluters.” Critics claimthat the plan will set caps too low, allow emissions oftoxic mercury to triple by 2013, cause a 50% increase inSO 2 emissions, <strong>and</strong> require no controls for reducingemissions of the greenhouse gas CO 2 .<strong>Environmental</strong>ists <strong>and</strong> health scientists are particularlyopposed to using a cap-<strong>and</strong>-trade program tocontrol emissions of mercury by coal-burning powerplants <strong>and</strong> industries because it is highly toxic, fallsout of the atmosphere fairly near such facilities, <strong>and</strong>does not breakdown in the environment. Coal-burningplants choosing to buy permits instead of sharply reducingtheir mercury emissions would create hot spotswith unacceptably high levels of mercury.Bad news. In 2002, the EPA reported results fromevaluation of the country’s oldest <strong>and</strong> largest emissionstrading program, in effect since 1993 in southernCalifornia. The EPA study found that this cap-<strong>and</strong>trademodel “produced far less emissions reductionsthan were either projected for the program or couldhave been expected from” the comm<strong>and</strong>-<strong>and</strong>-controlsystem it replaced. The study also found accountingabuses, including emissions caps set 60% higher thancurrent emissions levels. Cap-<strong>and</strong>-trade programsneed to be carefully monitored.xHOW WOULD YOU VOTE? Should emissions trading beused to help control emissions of all major air pollutants? Castyour vote online at http://biology.brookscole.com/miller14.How Can We Reduce Outdoor Air Pollutionfrom Coal-Burning Facilities? PreventionIs BestThere are a number of ways to prevent <strong>and</strong> controlair pollution from coal-burning facilities.Figure 20-17 (p. 456) summarizes ways to reduce emissionsof sulfur oxides, nitrogen oxides, <strong>and</strong> particulatematter from stationary sources such as electric powerplants <strong>and</strong> industrial plants that burn coal.Good news. Between 1980 <strong>and</strong> 2002, emissions ofSO 2 from U.S. electric power plants decreased by 40%,emissions of NO x emissions by 30%, <strong>and</strong> soot emissionsby 75%. Emphasis has been on output approachesthat add equipment to remove some of the particulate,NO x , <strong>and</strong> SO 2 pollutants after they are produced (Figure20-18, p. 457). Pollution can also be reduced at thehttp://biology.brookscole.com/miller14455
PreventionSolutionsStationary Source Air PollutionBurn low-sulfur coalRemove sulfurfrom coalConvert coal to aliquid or gaseousfuelShift to lesspolluting fuelsDispersion orCleanupDisperse emissionsabove thermalinversion layer withtall smokestacksRemove pollutantsafter combustionTax each unit ofpollution producedFigure 20-17 Solutions: methods for reducing emissionsof sulfur oxides, nitrogen oxides, <strong>and</strong> particulate matter fromstationary sources such as coal-burning electric power plants<strong>and</strong> industrial plants.input stage by using cleaner coal technologies. One isfluidized-bed combustion, which reduces pollutant emissions<strong>and</strong> burns coal more efficiently by blowing astream of hot air into a boiler to burn a mixture of powderedcoal <strong>and</strong> crushed limestone. Another is coal gasification,which has a mixture of advantages <strong>and</strong> disadvantages(Figure 17-22, p. 365). <strong>Environmental</strong>istsargue for much greater emphasis on prevention approachesto decrease the levels of these pollutantsreaching the troposphere.Case Study: What Should We Do aboutAir Pollution from Older Coal-BurningFacilities? A Burning ControversyThere is controversy over whether older coalburningplants in the United States shouldhave to meet the same air pollution st<strong>and</strong>ardsas new plants.For several decades, environmental scientists, environmentalists,<strong>and</strong> the attorneys general of a number ofstates have been fighting to require about 20,000 oldercoal-burning power plants <strong>and</strong> industrial plants (reddots in Figure 20-9) <strong>and</strong> oil refineries in the UnitedStates to meet the air pollution st<strong>and</strong>ards required fornew facilities under the Clean Air Act. Such plantswere not required to do this because they were alreadyin existence when the law was passed in 1970.A 1977 rule in the Clean Air Act—called theNew Source Review—requires these older facilities toupgrade pollution control equipment when theyexp<strong>and</strong> or modernize their facilities. But for almostthree decades their owners have been getting aroundthe rules by exp<strong>and</strong>ing the plants <strong>and</strong> calling itmaintenance.In addition they have lobbied elected officials tohave this rule overturned. In 2002, their efforts paid offwhen the Bush administration announced that it waseasing the New Source Review restrictions <strong>and</strong> thusmaking it easier for older facilities to exp<strong>and</strong> <strong>and</strong> modernizewithout having to add expensive pollution controlequipment.Opponents say the revised rule would gut theonly provision in the Clean Air Act that could be usedto force such facilities to reduce air pollution emissions.They believe it is naive to think that refineries<strong>and</strong> coal-burning power <strong>and</strong> industrial plants aregoing to spend billions of dollars installing modernpollution control equipment when they have notdone so in almost three decades <strong>and</strong> now do not haveto (unless they can somehow persuade Congress tohave taxpayers foot the bill). A 2004 study by AbtAssociates (a consulting firm that the EPA has used toevaluate air pollution policies) found that strengtheningthe pollution st<strong>and</strong>ards for these aging coal-firedplants would prevent 22,000 premature deaths peryear.In 2003, the attorneys general of nine northeasternstates challenged this change in the New SourceReview in federal court. <strong>Their</strong> lawsuit alleges that theEPA is exceeding its power in overturning the rule. In2003, the National Academy of Public Administration,an independent advisory body set up by Congress in1984, opposed easing the New Source Review rules.Instead, the group advised Congress to give the dirtiestU.S. coal-fired power <strong>and</strong> industrial plants a 10-year deadline to either install the latest air pollutioncontrol equipment or shut down to protect humanhealth. The group said that when Congress establishedthe new source rules in 1977 it did not intend for dirtyplants to run indefinitely.xHOW WOULD YOU VOTE? Should older coal-burning power<strong>and</strong> industrial plants have to meet the same air pollution st<strong>and</strong>ardsas new plants? Cast your vote online at http://biology.brookscole.com/miller14.How Can We Reduce Outdoor AirPollution from Motor Vehicles? EmphasizePreventionThere are a number of ways to prevent <strong>and</strong>control air pollution from motor vehicles.456 CHAPTER 20 Air Pollution
Cleaned gasElectrodesCleaned gasDirty gasDust dischargeDirty gasa. Electrostatic Precipitator b. Baghouse FilterBagsFigure 20-18 Solutions: fourcommonly used output or controlmethods for removing particulates(a, b, c, d), <strong>and</strong> SO 2 (d) from theexhaust gases of electric power<strong>and</strong> industrial plants. Of these,only baghouse filters remove manyof the more hazardous fine particles.All these methods producehazardous materials that must bedisposed of safely, <strong>and</strong> except forcyclone separators, all of them areexpensive. Modern wet scrubbersremove 98% of the SO 2 <strong>and</strong> 98%of the particulate matter in smokestackemissions, but they are expensiveto install <strong>and</strong> maintain.Cleaned gasCleaned gasDust dischargeDirty gasDirty gasCleanwaterWetgasDirty waterDust dischargec. Cyclone Separator d. Wet ScrubberFigure 20-19 (p. 458) lists ways to reduce emissionsfrom motor vehicles, the primary culprits in producingphotochemical smog. One way to make significant reductionsis to get older, high-polluting vehicles off theroad. According to EPA estimates, 10% of the vehicleson the road in the United States emit 50–70% of vehicularair pollutants. But people who cannot afford tobuy a newer car often own old cars. One suggestion isto pay people to take their old cars off the road, whichwould result in huge savings in health <strong>and</strong> air pollutioncontrol costs.In 2003, a team of research engineers workingwith grants from the National Science Foundation <strong>and</strong>an oil company found a way for oil refineries, powerplants, <strong>and</strong> vehicles to use a class of chemicals calledzeolites to do a better job than other alternatives in removingsulfur impurities from diesel fuel, jet fuel, <strong>and</strong>gasoline. This adsorption process, which is carried out atroom temperature <strong>and</strong> pressure, should be cheaper,easier, <strong>and</strong> more effective than using expensive catalyticconverters that operate at high temperatures <strong>and</strong>pressures to remove sulfur. Stay tuned to see if thistechnology works as projected <strong>and</strong> is implemented.Good news. Over the next 10–20 years air pollutionfrom motor vehicles should decrease from increaseduse of partial zero-emission vehicles (PZEVs) that emit almostno air pollutants because of improved engine<strong>and</strong> emission systems, hybrid-electric vehicles (Figure18-9, p. 385), <strong>and</strong> vehicles powered by fuel cellsrunning on hydrogen (Figure 18-10, p. 385).Bad news. The growing number of motor vehiclesin urban areas of many developing countries is contributingto the already poor air quality there. Many ofthese vehicles are 10 or more years old, have no pollutioncontrol devices, <strong>and</strong> continue to burn leadedgasoline.http://biology.brookscole.com/miller14457
PreventionMass transitBicycles <strong>and</strong>walkingLess pollutingenginesLess polluting fuelsImprove fuel efficiencyGet older, pollutingcars off the roadGive buyers large taxwrite-offs for buyinglow-polluting, energyefficientvehiclesSolutionsMotor Vehicle Air PollutionRestrict driving in polluted areasCleanupEmission controldevicesCar exhaustinspections twicea yearStricter emissionst<strong>and</strong>ardsFigure 20-19 Solutions: methods for reducing emissions frommotor vehicles.What Should We Do about UltrafineParticles? Another ControversyThere is controversy over reducing emissionsof ultrafine particles that pose a serious threat tohuman health.Research indicates that invisible particles—especiallyfine particles with diameters less than 10 microns(PM-10) <strong>and</strong> ultrafine particles with diameters less than2.5 microns (PM-2.5)—pose a significant health hazard.Such particles come from a variety of sources (Figure20-6).They are not effectively captured by most air pollutioncontrol equipment <strong>and</strong> are small enough to penetratethe respiratory system’s natural defenses againstair pollution. They can also bring with them dropletsor other particles of toxic or cancer-causing pollutantsthat become attached to their surfaces.Once they are lodged deep within the lungs, thesefine particles can cause chronic irritation that can triggerasthma attacks, aggravate other lung diseases, <strong>and</strong>cause lung cancer. These lung problems interfere withthe blood’s uptake of oxygen <strong>and</strong> release of CO 2 ,which strains the heart <strong>and</strong> increases the risk of deathfrom heart disease. According to several recent studiesof air pollution in U.S. cities, fine <strong>and</strong> ultrafine particlesprematurely kill 65,000–200,000 Americans eachyear.Exposure to particulate air pollution is much worsein most developing countries, where urban air qualityhas generally deteriorated. The World Bank estimatesthat reducing particulate levels globally to WHO guidelineswould prevent 300,000–700,000 premature deathsper year!In 1997, the EPA announced stricter emission st<strong>and</strong>ardsfor ultrafine particles in the United States. TheEPA estimates the cost of implementing the st<strong>and</strong>ardsat $7 billion per year, with the resulting health <strong>and</strong>other benefits estimated at $120 billion per year.According to industry officials, the new st<strong>and</strong>ardis based on flimsy scientific evidence <strong>and</strong> its implementationwill cost $200 billion per year. EPA officialssay that their review of the scientific evidence—one ofthe most exhaustive reviews ever undertaken by theagency—supports the need for the new st<strong>and</strong>ard forultrafine particles. Furthermore, a 2000 study by theHealth Effects Institute of 90 large American cities supportedthe link between fine <strong>and</strong> ultrafine particles<strong>and</strong> higher rates of death <strong>and</strong> disease. Industries affectedby these new st<strong>and</strong>ards are lobbying Congressto have them weakened or overturned or to extenddeadlines for their implementation.xHOW WOULD YOU VOTE? Do you support establishinga stricter st<strong>and</strong>ard for emissions of ultrafine particles? Castyour vote online at http://biology.brookscole.com/miller14.How Can We Reduce Indoor Air Pollution?Emphasize PreventionLittle effort has been spent on reducing indoor airpollution even though it is a much greater threat tohuman health than outdoor air pollution.Reducing indoor air pollution does not require settingindoor air quality st<strong>and</strong>ards <strong>and</strong> monitoring the morethan 100 million homes <strong>and</strong> buildings in the UnitedStates (or the buildings in any country). Instead, airpollution experts suggest several ways to prevent orreduce indoor air pollution (Figure 20-20). Anotherpossibility for cleaner indoor air in some high-risebuildings is rooftop greenhouses through which buildingair can be circulated.In developing countries, indoor air pollution fromopen fires <strong>and</strong> leaky <strong>and</strong> inefficient stoves that burnwood, charcoal, or coal could be reduced if governmentsgave people inexpensive clay or metal stoves,which burn biofuels more efficiently while ventingtheir exhaust to the outside, or stoves that use solar energyto cook food (solar cookers) in sunny areas. Doingthis would also reduce deforestation by using less fuelwood<strong>and</strong> charcoal.458 CHAPTER 20 Air Pollution
PreventionCover ceiling tiles<strong>and</strong> lining of ACducts to preventrelease of mineralfibersBan smoking orlimit it to wellventilatedareasSet stricterformaldehydeemissionsst<strong>and</strong>ards forcarpet, furniture,<strong>and</strong> buildingmaterialsPrevent radoninfiltrationUse officemachines in wellventilatedareasUse less pollutingsubstitutes forharmful cleaningagents, paints, <strong>and</strong>other productsSolutionsIndoor Air PollutionCleanup orDilutionUse adjustablefresh air vents forwork spacesIncrease intake ofoutside airChange air morefrequentlyCirculate a building’sair throughrooftop greenhousesUse exhaust hoodsfor stoves <strong>and</strong>appliances burningnatural gasInstall efficientchimneys forwood-burningstovesthe next step is to shift to preventing air pollution. Withthis approach, the question is not What can we do aboutthe air pollutants we produce? but How can we avoid producingsuch pollutants in the first place?Figure 20-21 shows ways to prevent outdoor <strong>and</strong>indoor air pollution over the next 30–40 years. Like theshift to controlling outdoor air pollution between 1970<strong>and</strong> 2000, this new shift to preventing outdoor <strong>and</strong> indoorair pollution will not take place without political pressureon elected officials by individual citizens <strong>and</strong>groups. Figure 20-22 (p. 460) lists some ways that youcan reduce your exposure to indoor air pollution.Turning the corner on air pollution requires moving beyondpatchwork, end-of-pipe approaches to confront pollution at itssources. This will mean reorienting energy, transportation, <strong>and</strong>industrial structures toward prevention.HILARY F. FRENCHOutdoorImprove energyefficiency toreduce fossil fueluseSolutionsAir PollutionIndoorReduce povertyFigure 20-20 Solutions: ways to prevent <strong>and</strong> reduce indoorair pollution.What Is the Next Step? IndividualsMatterWe need to focus on preventing air pollution,with emphasis on sharply reducing indoor airpollution in developing countries.It is encouraging that since 1970 most of the world’sdeveloped countries have enacted laws <strong>and</strong> regulationsthat have significantly reduced outdoor air pollution.But without individuals <strong>and</strong> organized groupsputting strong political pressure on elected officials inthe 1970s <strong>and</strong> 1980s these laws <strong>and</strong> regulations wouldnot have been enacted, funded, <strong>and</strong> implemented. Inturn, these legal requirements spurred companies, scientists,<strong>and</strong> engineers to come up with better ways tocontrol outdoor pollution.The current laws are a useful output approach tocontrolling pollution. To environmentalists, however,Rely more onlower-pollutingnatural gasRely more onrenewableenergy(especially solarcells, wind, <strong>and</strong>solar-producedhydrogen)Transfertechnologies forlatest energyefficiency,renewable energy,<strong>and</strong> pollutionprevention todevelopingcountriesDistribute cheap<strong>and</strong> efficientcookstoves topoor families indevelopingcountriesReduce or banindoor smokingDevelop simple<strong>and</strong> cheap testsfor indoorpollutants suchas particulates,radon, <strong>and</strong>formaldehydeFigure 20-21 Solutions: ways to prevent outdoor <strong>and</strong> indoorair pollution over the next 30–40 years.http://biology.brookscole.com/miller14459
What Can You Do?Indoor Air Pollution•Test for radon <strong>and</strong> formaldehyde inside your home <strong>and</strong>take corrective measures as needed.• Do not buy furniture <strong>and</strong> other products containingformaldehyde.• Remove your shoes before entering your house to reduceinputs of dust, lead, <strong>and</strong> pesticides.•Test your house or workplace for asbestos fiber levels<strong>and</strong> for any crumbling asbestos materials if it was builtbefore 1980.• Don't live in a pre-1980 house without having its indoor airtested for asbestos <strong>and</strong> lead.• Do not store gasoline, solvents, or other volatilehazardous chemicals inside a home or attached garage.• If you smoke, do it outside or in a closed room vented tothe outside.• Make sure that wood-burning stoves, fireplaces, <strong>and</strong>kerosene- <strong>and</strong> gas-burning heaters are properly installed,vented, <strong>and</strong> maintained.• Install carbon monoxide detectors in all sleeping areas.Figure 20-22 What can you do? Ways to reduce your exposureto air pollution.CRITICAL THINKING1. Explain why you agree or disagree with the followingstatement: “Because we have not proved absolutely thatanyone has died or suffered serious disease from nitrogenoxides, current federal emission st<strong>and</strong>ards for thispollutant should be relaxed.”2. Identify climate <strong>and</strong> topographic factors in your localcommunity that (a) intensify air pollution <strong>and</strong> (b) helpreduce air pollution.3. Should all tall smokestacks be banned? Explain.4. Explain how sulfur in coal can increase the acidity ofrainwater.5. Do you agree or disagree with the possible weaknessesof the U.S. Clean Air Act listed on p. 454? Defendeach of your choices.6. Explain why you agree or disagree with each of theproposals listed in Figure 20-21 (p. 459) for shifting theemphasis to preventing air pollution over the next severaldecades. Which two of these proposals do you believeare the most important?7. Congratulations! You are in charge of reducing airpollution in the country where you live. List the threemost important features of your policy for (a) outdoor airpollution <strong>and</strong> (b) indoor air pollution.PROJECTS1. Evaluate your exposure to some or all of the indoor airpollutants in Figure 20-13 (p. 450) in your school, workplace,<strong>and</strong> home. Come up with a plan for reducing yourexposure to these pollutants.2. Have buildings at your school been tested for radon?If so, what were the results? What has been done aboutareas with unacceptable levels? If this testing has notbeen done, talk with school officials about having itdone.3. Use the library or the Internet to find bibliographic informationabout Michael J. Cohen <strong>and</strong> Hilary F. French,whose quotes appear at the beginning <strong>and</strong> end of thischapter.4. Make a concept map of this chapter’s major ideas, usingthe section heads, subheads, <strong>and</strong> key terms (in boldface).Look on the website for this book for informationabout making concept maps.LEARNING ONLINEThe website for this book contains study aids <strong>and</strong> manyideas for further reading <strong>and</strong> research. They include achapter summary, review questions for the entire chapter,flash cards for key terms <strong>and</strong> concepts, a multiple-choicepractice quiz, interesting Internet sites, references, <strong>and</strong> aguide for accessing thous<strong>and</strong>s of InfoTrac ® College Editionarticles. Log on tohttp://biology.brookscole.com/miller14Then click on the Chapter-by-Chapter area, choose Chapter20, <strong>and</strong> select a learning resource.460 CHAPTER 20 Air Pollution
21 <strong>and</strong>Climate ChangeOzone LossClimateControlCASE STUDYA.D. 2060: Green Timeson Planet EarthMary Wilkins sat in the living room of the solarpowered<strong>and</strong> earth-sheltered house (Figure 21-1) sheshared with her daughter Jane <strong>and</strong> her family. It wasJuly 4, 2060: Independence Day. She heard the hum ofsolar-powered pumps trickling water to rows of organicallygrown vegetables <strong>and</strong> glanced at the fish inthe aquaculture <strong>and</strong> waste treatment tank in thegreenhouse that provided much of her home’s heat.Mary began putting the finishing touches on hergr<strong>and</strong>children’s costumes for this afternoon’s pageantin Rachel Carson Park. It would honor earth heroeswho began the Age of Ecology in the 20th century <strong>and</strong>those who continued this tradition in the 21st century.She was delighted that her 12-year-old gr<strong>and</strong>sonJeffrey had been chosen to play Aldo Leopold (Figure2-9, p. 30), who in the late 1940s began urging peopleto work with the earth. Her pride swelled whenher 10-year-old gr<strong>and</strong>daughter Lynn was chosen toplay Rachel Carson (Figure 2-A, p. 27), who in the1960s warned people about threats from their increasingexposure to pesticides <strong>and</strong> other potentially harmfulchemicals. Her neighbor’s son Manuel had beenchosen to play biologist Edward O. Wilson, who in thelast third of the 20th century explained the need topreserve the earth’s biodiversity.The transition to more sustainable societies <strong>and</strong>economies began around 2010 when people <strong>and</strong> governmentsbegan to mimic the way the earth has sustaineditself for billions of years (Figure 9-15,p. 174). By 2060 the loss of global biodiversityhad been cut in half. Most air pollution begangradually disappearing when energy fromthe sun, wind, <strong>and</strong> hydrogen began replacingthat from oil <strong>and</strong> coal. Most food was nowproduced by more sustainable agriculture.Preventing pollution <strong>and</strong> reducing resourcewaste had become important moneysavingpriorities for businesses <strong>and</strong> households basedon the four Rsofresource consumption: reduce, reuse,recycle, <strong>and</strong> refuse. Walking <strong>and</strong> bicycling had increasedin a growing number of cities <strong>and</strong> towns designed forpeople instead of cars.World population had stabilized at 8 billion in2028 <strong>and</strong> then had begun a slow decline. Significantatmospheric warming had occurred by 2050. But therate of additional warming began decreasing by 2050as hydrogen produced by using electricity producedby wind farms, solar cells, <strong>and</strong> geothermal energywas being phased in to replace carbon-containingfossil fuels. International treaties enacted in the 1990sbanned the chemicals that had begun depleting ozonein the stratosphere during the last quarter of the 20thcentury. By 2050, ozone levels in the stratosphere hadreturned to 1980 levels.Two hours later Mary, her daughter Jane, <strong>and</strong> herson-in-law Gene watched with pride as 40 childrenhonored the leaders of the Age of Ecology. At the end,Lynn stepped forward <strong>and</strong> said, “Today we have honoredmany earth heroes, but the real heroes are thepeople in this audience <strong>and</strong> around the world whohave worked to help sustain the earth’s life-supportsystems for us <strong>and</strong> other species. We thank you forgiving us such a wonderful gift <strong>and</strong> promise to leavethe earth even better for our children <strong>and</strong> gr<strong>and</strong>children<strong>and</strong> all living creatures.”This hopeful scenario describes the more sustainabletype of world we could have by 2060 if enough ofus work to help implement such a vision. This is anexciting challenge. Jump in.Figure 21-1 An earth-sheltered house in the UnitedStates. Solar cells on the roof provide most of thehouse’s electricity. About 13,000 families across theUnited States have built such houses. Mary Wilkins’sfictional house in 2060 could be similar to this one.
We are embarked on the most colossal ecological experimentof all time—doubling the concentration in the atmosphereof an entire planet of one of the most important gases in theearth’s atmosphere—<strong>and</strong> we really have little idea of whatmight happen.PAUL A. COLINVAUXThis chapter discusses how our activities are changingthe world’s climate <strong>and</strong> depleting ozone in the stratosphere,<strong>and</strong> what we can do about these threats. It addressesthe following questions:■■■■■■■How have the earth’s temperature <strong>and</strong> climatechanged in the past?How might the earth’s temperature change in thefuture?What factors can affect changes in the earth’saverage temperature?What are some possible beneficial <strong>and</strong> harmfuleffects of a warmer earth?What can we do to slow or adapt to projected increasesin the earth’s temperature?How have human activities depleted ozone in thestratosphere, <strong>and</strong> why should we care?What can we do to slow <strong>and</strong> eventually reverseozone depletion in the stratosphere caused byhuman activities?21-1 PAST CLIMATE CHANGEHow Have the Earth’s Temperature <strong>and</strong>Climate Changed in the Past? Climate ChangeIs Not NewTemperature <strong>and</strong> climate have been changingthroughout the earth’s history.The earth’s climate—determined mostly by its averagetemperature <strong>and</strong> average precipitation—is not fixed.Therefore, climate change is neither new nor unusual.Over the past 4.7 billion years it has shifted due to volcanicemissions, changes in solar input, continentsmoving as a result of shifting tectonic plates, strikes bylarge meteorites, <strong>and</strong> other factors.At some times (over hundreds to millions of years),the troposphere’s average temperature has changedgradually <strong>and</strong> at other times fairly quickly (over a fewdecades to 100 years) as shown in the Figure 21-2graphs. Over the past 900,000 years, the average temperatureof the troposphere has undergone prolongedperiods of global cooling <strong>and</strong> global warming (Figure 21-2,top left). These alternating cycles of freezing <strong>and</strong> thawingare known as glacial <strong>and</strong> interglacial (between iceages) periods.During each cold period, thick glacial ice coveredmuch of the earth’s surface for about 100,000 years.Most of it melted during a warmer interglacial periodlasting 10,000–12,500 years that followed each glacialperiod.For roughly 12,000 years, we have had the goodfortune to live in an interglacial period with a fairlystable climate <strong>and</strong> a moderate average global surfacetemperature (Figure 21-2, top right <strong>and</strong> bottom left).However, even during this generally stable period, regionalclimates have changed significantly. For example,about 7,000 years ago, most of the current Saharadesert received almost 20 times more annual rainfallthan it does today.How Do Scientists Study Climate Change?Drill Holes <strong>and</strong> Make MeasurementsGeologic records <strong>and</strong> atmospheric measurementsprovide a wealth of information about past atmospherictemperatures <strong>and</strong> climate.Scientific clues about the earth’s past temperatures<strong>and</strong> climate are found deep within its glaciers <strong>and</strong> icecaps, such as those in Greenl<strong>and</strong> <strong>and</strong> Antarctica. Scientistsdrill into these museums of atmospheric history<strong>and</strong> extract long cores of ice (Figure 21-3). In 2004, datafrom cores drilled in antarctic ice indicated that thecurrent interglacial period could last for another15,000 years before a new ice age occurs—unless ouractivities seriously alter the earth’s climate.Scientists analyze air bubbles trapped in differentsegments of these ice cores to uncover informationabout past tropospheric composition, temperaturetrends such as those in Figure 21-2, greenhouse gasconcentrations, solar activity, snowfall, <strong>and</strong> forest firefrequency (from trapped layers of soot particles).Scientists also study past climates by drilling coresinto the bottoms of lakes, ponds, <strong>and</strong> swamps. Thenthey analyze different zones of the sediment for pollen,fossils, <strong>and</strong> other clues about what types of plantslived in the past <strong>and</strong> trends in plant life over time. Forthose who like detective work, finding out about theearth’s climate history is a fascinating activity.Scientists also make direct measurements to getcurrent information about tropospheric temperature,composition, <strong>and</strong> trends. They measure temperaturesusing thermometers on l<strong>and</strong> <strong>and</strong> at sea <strong>and</strong> on weatherballoons at various altitudes. Direct temperature recordsgo back to 1861. Scientists have also been usinginfrared sensors on satellites to get temperature informationabout the troposphere.Finally, scientists collect air samples at different locations<strong>and</strong> altitudes <strong>and</strong> analyze them to detectchanges in the chemical composition of the troposphere.For example, since 1958 environmental chemistCharles Keeling has analyzed CO 2 levels in the troposphereat the Mauna Loa observatory in Hawaii.Once they have accumulated a certain amount ofdata, scientists get together to try to reach a consensus.In 1988, the United Nations <strong>and</strong> the World Meteorolog-462 CHAPTER 21 Climate Change <strong>and</strong> Ozone Loss
Average surface temperature (°C)Average temperature over past 900,000 years17161514131211109900 800700 600 500 400 300 200 100 PresentThous<strong>and</strong>s of years agoTemperature change (°C)210−1−2−3−4−5Temperature change over past 22,000 yearsAgriculture establishedEnd oflast iceage20,000 10,000Average temperature over past10,000 years = 15°C (59°F)2,000 1,000 200 100 NowYears agoTemperature change (°C)Temperature change over past 1,000 years1.00.50.0−0.5−1.01000 1100 1200 1300 1400 1500 1600 1700 1800 1900 2000 2101YearAverage surface temperature (°C)15.014.814.614.414.214.013.813.61860 1880Average temperature over past 130 years1900 1920 1940 1960 1980 2000 2020YearFigure 21-2 Estimated changes in the average global temperature of the atmosphere near the earth’ssurface over different periods of time. Past temperature changes are estimated by analysis of radioisotopes inrocks <strong>and</strong> fossils, plankton <strong>and</strong> radioisotopes in ocean sediments, ice cores from ancient glaciers, temperaturemeasurements at different depths in boreholes drilled deep into the earth’s surface, pollen from lake bottoms<strong>and</strong> bogs, tree rings, historical records, <strong>and</strong> temperature measurements (since 1861). (Data from GoddardInstitute for Space Studies, Intergovernmental Panel on Climate Change, National Academy of Sciences,National Aeronautics <strong>and</strong> Space Agency, National Center for Atmospheric Research, <strong>and</strong> National Oceanic<strong>and</strong> Atmospheric Administration)ical Organization established the IntergovernmentalPanel on Climate Change (IPCC) to document pastclimate change <strong>and</strong> project future climate change. TheIPCC is a network of over 2,000 leading climate expertsfrom 70 nations.Panels of scientists from the U.S. National Academyof Sciences <strong>and</strong> the American Geophysical Union(AGU) have also evaluated possible future climatechanges. In addition, the U.S. Congress created theU.S. Global Change Research Program (USGCRP ) in1990 to project future climate changes <strong>and</strong> the potentialimpacts.Recall that science can never give us absolute certaintyor proof. Instead, it establishes levels of certaintyor probability that a scientific model or theory istrue. The IPCC expresses its conclusions <strong>and</strong> projectionsin probabilities using several levels of certainty:virtually certain (more than 99% probability), very likely(90–99% probability), <strong>and</strong> likely (66–90% probability).Throughout this chapter I use these categories to describeIPCC conclusions <strong>and</strong> projections about atmospherictemperature changes <strong>and</strong> their possible affectson climate.Figure 21-3 Ice cores such as this one extracted by drillingdeep holes in ancient glaciers at various sites in antarctica <strong>and</strong>Greenl<strong>and</strong> can be analyzed to obtain information about past climates.http://biology.brookscole.com/miller14463
21-2 THE EARTH’S NATURALGREENHOUSE EFFECTWhat Role Does the Natural GreenhouseEffect Play in the Earth’s Temperature <strong>and</strong>Climate? A Giver of LifeCertain gases in the atmosphere absorb heat <strong>and</strong>warm the lower atmosphere.In addition to incoming sunlight, a natural processcalled the greenhouse effect (Figure 6-14, p. 110) warmsthe earth’s lower troposphere <strong>and</strong> surface. Some of theenergy from the sun warms the earth’s surface, causingit to radiate infrared energy back toward space.Clouds, water vapor, carbon dioxide, <strong>and</strong> other gasesin the lower troposphere are heated when they absorbsome of this outgoing infrared energy. These clouds<strong>and</strong> gases (called greenhouse gases) then radiate heat aslonger-wavelength infrared radiation in all directions.Some of the released energy is radiated into space <strong>and</strong>some warms the troposphere <strong>and</strong> the earth’s surface.Swedish chemist Svante Arrhenius first recognizedthis natural tropospheric heating effect in 1896.Since then numerous laboratory experiments <strong>and</strong>measurements of atmospheric temperatures at differentaltitudes have confirmed this relationship. As a result,it is one of the most widely accepted theories inthe atmospheric sciences.A natural cooling process also takes place at theearth’s surface. Large quantities of heat are absorbed bythe evaporation of liquid surface water, <strong>and</strong> the watervapor molecules rise, condense to form droplets inclouds, <strong>and</strong> release their stored heat higher in the troposphere(Figure 6-9, p. 107). Because of the impact of thisnatural heating <strong>and</strong> cooling, the earth’s average surfacetemperature is about 15°C (59°F).What Are the Major Greenhouse Gases?Two Important MoleculesThe two major greenhouse gases are water vapor<strong>and</strong> carbon dioxide.Table 21-1 shows the major sources, average time inthe troposphere, <strong>and</strong> relative warming potential ofvarious greenhouse gases in the troposphere. The twogreenhouse gases with the largest concentrations arewater vapor, controlled by the hydrologic cycle, <strong>and</strong> carbondioxide (CO 2 ), controlled by the carbon cycle. Carbondioxide is the greenhouse gas we have added tothe troposphere.The coal, oil, <strong>and</strong> natural gas that support theworld’s economy all contain carbon that plants <strong>and</strong>sunshine converted to organic compounds hundredsof millions of years ago. Under high pressures <strong>and</strong>temperatures these buried organic compounds wereconverted to fossil fuels. Extracting <strong>and</strong> burning thesestorehouses of carbon releases carbon dioxide into theatmosphere.According to the measurements of CO 2 concentrationsin glacial ice, estimated changes in troposphericCO 2 levels correlate fairly closely with estimated variationsin the average global temperature near theTable 21-1 Major Greenhouse Gases from Human ActivitiesAverageRelativeTime in theWarming PotentialGreenhouse Gas Human Sources Troposphere (compared to CO 2 )Carbon dioxide (CO 2 ) Fossil fuel burning, especially coal (70–75%), 100–120 years 1deforestation, <strong>and</strong> plant burningMethane (CH 4 ) Rice paddies, guts of cattle <strong>and</strong> termites, l<strong>and</strong>fills, 12–18 years 23coal production, coal seams, <strong>and</strong> natural gas leaksfrom oil <strong>and</strong> gas production <strong>and</strong> pipelinesNitrous oxide (N 2 O) Fossil fuel burning, fertilizers, livestock wastes, 114–120 years 296<strong>and</strong> nylon productionChlorofluorocarbons Air conditioners, refrigerators, plastic foams 11–20 years (65–110 years 900–8,300(CFCs)*in the stratosphere)Hydrochloro- Air conditioners, refrigerators, plastic foams 9–390 470–2,000fluorocarbons (HCFCs)Hydrofluorocarbons Air conditioners, refrigerators, plastic foams 15–390 130–12,700(HFCs)Halons Fire extinguishers 65 5,500Carbon tetrachloride Cleaning solvent 42 1,400*CFC use is being phased out, but they remain in the troposphere for 1–2 decades.464 CHAPTER 21 Climate Change <strong>and</strong> Ozone Loss
380410Concentration of carbon dioxidein the atmosphere (ppm)360340320300280260240220200180Carbon dioxideTemperaturechange End oflast ice age160 120 80 40 0Thous<strong>and</strong>s of years before present+2.50–2.5–5.0–7.5–10.0Variation of temperature (˚C)from current levelFigure 21-4 Atmospheric carbon dioxide levels <strong>and</strong> globaltemperature. Estimated long-term variations in average globaltemperature of the atmosphere near the earth’s surface aregraphed along with average tropospheric CO 2 levels over thepast 160,000 years. The rough correlation between CO 2 levelsin the troposphere <strong>and</strong> temperature shown in these estimatesbased on ice core data suggests a connection between thesetwo variables, although no definitive causal link has been established.In 1999, the world’s deepest ice core sample revealed asimilar correlation between air temperatures <strong>and</strong> the greenhousegases CO 2 <strong>and</strong> CH 4 going back 460,000 years. (Datafrom Intergovernmental Panel on Climate Change <strong>and</strong> NationalCenter for Atmospheric Research)Parts per millionParts per billion36031026018002.41.81.20.618003203101900 2000 2100YearCarbon dioxide (CO 2 )1900 2000 2100YearMethane (CH 4 )earth’s surface during the past 160,000 years (Figure21-4). Trace the curves in this figure.Parts per million30029021-3 CLIMATE CHANGE ANDHUMAN ACTIVITIESHow Have Human Activities AffectedTropospheric Concentrations ofGreenhouse Gases? Messing with theCarbon CycleHumans have increased concentrations ofgreenhouse gases in the troposphere by burningfossil fuels, clearing <strong>and</strong> burning forests <strong>and</strong>grassl<strong>and</strong>s, raising large numbers of livestocksuch as cattle, planting rice, <strong>and</strong> using inorganicfertilizers.Figure 21-5 shows that since 1861, the concentrationsof the greenhouse gases CO 2 , CH 4 , <strong>and</strong> N 2 O in thetroposphere have risen sharply, especially since 1950.Current CO 2 levels in the troposphere (Figure 21-5,top) appear to be higher than they have been in at least26018001900 2000 2100YearNitrous oxide (N 2 O)Figure 21-5 Increases in average concentrations of thegreenhouse gases carbon dioxide, methane, <strong>and</strong> nitrous oxidein the troposphere between 1861 <strong>and</strong> 2003. The fluctuations inthe CO 2 curve represent seasonal changes in photosyntheticactivity that cause small differences between summer <strong>and</strong> winterconcentrations of CO 2 . (Data from Intergovernmental Panelon Climate Change, National Center for Atmospheric Research,<strong>and</strong> World Resources Institute)160,000 years (Figure 21-4, blue curve). According tothe IPCC, three human activities have emitted largeamounts of greenhouse gases into the troposphere at afaster rate than natural processes can remove them.One has been the sharp rise in the use of fossil fuels,which release large amounts of CO 2 <strong>and</strong> CH 4 intohttp://biology.brookscole.com/miller14465
the troposphere. Electricity generated by coal is responsiblefor about 42% of this input, transportation24%, industrial processes 20%, <strong>and</strong> residential <strong>and</strong>commercial uses 14%. Exhale, start a car, turn up thethermostat, turn on a light, burn leaves or a fireplacelog, or do just about anything, <strong>and</strong> you add carbondioxide to the troposphere. Burning a gallon of gasoline(which weighs about 2.7 kilograms, or 6 pounds)produces about 9 kilograms (20 pounds) of CO 2 .A second process is deforestation <strong>and</strong> clearing <strong>and</strong>burning of grassl<strong>and</strong>s to raise crops <strong>and</strong> build cities,which release CO 2 <strong>and</strong> N 2 O. Third is the raising of anincreasing number of cattle <strong>and</strong> other livestock that releasemethane as a result of their digestive processes.A fourth process is cultivation of rice in paddies <strong>and</strong>use of inorganic fertilizers that release N 2 O into thetroposphere.What Role Does the United StatesPlay in Greenhouse Gas Emissions?Number OneThe United States emits more greenhouse gasesas a nation <strong>and</strong> on a per person basis than anyother country.The United States is by far the world’s largest emitterof CO 2 . Although the United Staates has only 4.6% ofthe world’s population it produces an estimated 24%of the annual global emissions. The U.S. is followed bythe European Union (12%), China (11%), Russia (7%),Japan (5%), <strong>and</strong> India (5%). However, the combinedCO 2 emissions of the Asian countries of China, India,Japan, <strong>and</strong> South Korea are over twice the emissions ofEuropean Union countries <strong>and</strong> are approaching thoseof the United States.According to the IPCC, emissions of CO 2 from U.S.coal-burning power <strong>and</strong> industrial plants are verylikely to exceed the combined CO 2 emissions of 146 nationswhere three-fourths of the world’s people live.CO 2 emissions from U.S. motor vehicles are roughlyequivalent to those produced by everything that powersthe Japanese economy.The U.S. also emits large quantities of CH 4 . Mostcomes from l<strong>and</strong>fills (35% of all U.S. CH 4 emissions),domesticated livestock <strong>and</strong> their manure (26%), naturalgas <strong>and</strong> oil systems (20%), <strong>and</strong> coal mining (10%).In addition, the United States has the world’shighest per capita CO 2 emissions, followed byAustralia, Canada, <strong>and</strong> the Netherl<strong>and</strong>s. During a 70-year lifetime, each U.S. citizen typically emits about454 metric tons (500 tons) of CO 2 into the troposphere.Is the Troposphere Warming?Very LikelyThere is considerable evidence that the earth’stroposphere is warming.Here are five of many IPCC findings that support thescientific consensus that it is very likely (90–99% probability)that the troposphere is getting warmer. First, the20th century was the hottest century in the past 1,000years (Figure 21-2, bottom left). Second, since 1861 theaverage global temperature of the troposphere nearthe earth’s surface has risen 0.6°C (1.1°F) over the entireglobe <strong>and</strong> about 0.8°C (1.4°F) over the continents.Most of this increase has taken place since 1980.Third, the 16 warmest years on record have occurredsince 1980 <strong>and</strong> the 10 warmest years since 1990.The hottest year was 1998, followed in order by 2002,2001, <strong>and</strong> 2003. Based on climate records going back to1500, the summer of 2003 was the hottest Europe experiencedin 500 years. More than 19,000 deaths were attributedto the heat. Fourth, glaciers <strong>and</strong> floating seaice in some parts of the world are melting <strong>and</strong> shrinking(Case Study, below). Fifth, during the last centurythe world’s average sea level rose by 0.1–0.2 meter (4–8inches), partly from runoff from melting ice <strong>and</strong> partlybecause of the volume of ocean water exp<strong>and</strong>s whenits temperature increases.Afew scientists have been skeptical of atmosphericwarming. They pointed to a 1990 study showing thatsince 1979 temperature measurements near the earth’ssurface have been rising while satellite <strong>and</strong> other measurementsshowed no appreciable warming of the mid<strong>and</strong> upper troposphere. However, in 2002 <strong>and</strong> 2004 researchersanalyzed these data <strong>and</strong> found much thesame warming in these areas as thermometers show atte earth’s surface.The terms global warming <strong>and</strong> global climatechange are often used interchangeably but they are notthe same. Global warming refers to temperature increasesin the troposphere, which in turn can cause climatechange. Global climate change is a broader termthat refers to changes in any aspects of the earth’s climate,including temperature, precipitation, <strong>and</strong> stormintensity. It can involve global warming or cooling, butour focus will be on global warming. Global warmingshould not be confused with the problem of ozone depletion(Table 21-2), as discussed in Section 21-9.Case Study: Warning Signals fromthe Earth’s Ice <strong>and</strong> Snow: MeltdownsAre Under WaySome of the world’s floating ice <strong>and</strong> l<strong>and</strong>-basedglaciers are slowly melting, reflecting less incomingsunlight back into space, <strong>and</strong> helping warm thetroposphere further.The average temperature of the troposphere isstrongly affected by the vast amounts of frozen waterfound as ice <strong>and</strong> snow near the earth’s poles <strong>and</strong> inmost of the world’s mountain glaciers. In the Arctic region,this water is locked up in ice caps that coverGreenl<strong>and</strong> <strong>and</strong> floating sea ice in the Arctic Ocean. The466 CHAPTER 21 Climate Change <strong>and</strong> Ozone Loss
Table 21-2 Major Characteristics of Global Warming <strong>and</strong> Ozone DepletionCharacteristic Global Warming Ozone DepletionRegion of atmosphere involved Troposphere. Stratosphere.Major substances involved CO 2 , CH 4 , N 2 O (greenhouse gases). O 3 , O 2 , chlorofluorocarbons (CFCs).Interaction with radiation Molecules of greenhouse gases absorb About 95% of incoming ultraviolet (UV)infared (IR) radiation from the earth’s sur- radiation from the sun is absorbed by O 3face, vibrate, <strong>and</strong> release longer-wavelength molecules in the stratosphere <strong>and</strong> does notIR radiation (heat) into the lower troposphere. reach the earth’s surface.This natural greenhouse effect helps warmthe lower troposphere.Nature of problem There is a high (90–99%) probability that CFCs <strong>and</strong> other ozone-depleting chemicalsincreasing concentrations of greenhouse released into the troposphere by humangases in the troposphere from burningactivities have made their way to the stratofossilfuels,deforestation, <strong>and</strong> agriculture sphere, where they decrease O 3 concentraareenhancingthe natural greenhouse effect tion. This can allow more harmful UV radia<strong>and</strong>raisingthe earth’s average surfacetion to reach the earth’s surface.temperature (Figure 21-2, bottom right, <strong>and</strong>Figure 21-11, p. 471).Possible consequences Changes in climate, agricultural productivity, Increased incidence of skin cancer, eyewater supplies, <strong>and</strong> sea level.cataracts, <strong>and</strong> immune system suppression<strong>and</strong> damage to crops <strong>and</strong> phytoplankton.Possible responses Decrease fossil fuel use <strong>and</strong> deforestation; Eliminate or find acceptable substitutes forprepare for climate change.CFCs <strong>and</strong> other ozone-depleting chemicals.South Pole is covered by Antarctica, which containsabout 70% of the earth’s ice.As the atmosphere warms, it causes more convectionthat transfers surplus heat from equatorial topolar areas (Figure 6-10, p. 107). Thus, temperature increasestend to be greater in polar regions. This explainswhy scientists regard the ice- <strong>and</strong> snow-coveredareas at or near the earth’s poles <strong>and</strong> as early warningsentinels of changes in the average temperature ofearth’s troposphere. Measurements from the ArcticSea, Greenl<strong>and</strong>, <strong>and</strong> the northwestern shores of Alaska(Figure 17-9, p. 357) show that floating sea ice aroundthe North Pole (Arctic) <strong>and</strong> Greenl<strong>and</strong> is melting <strong>and</strong>thinning faster than it is being formed. For example,less ice covered the Arctic Ocean at the end of 2003than in any year since 1979 when satellites began keepingtrack of such ice (Figure 21-6).Why should we care if there is less ice in the Arctic?The answers lies in the albedo or reflectivity of differentparts of the earth’s surface (Figure 21-7, p. 467).Light-colored surfaces of ice <strong>and</strong> snow help cool theearth by reflecting 80–90% of incoming sunlight backData collected by Defense Satellite Program (DMSP) Special SensorMicrowave Imager (SSMI), Image: NASAFigure 21-6 Satellite data showing Arctic sea ice in 1979 (left) <strong>and</strong> in 2003 (right). according to NASA, the icecover shrunk by 9% during this period. [Defense Meteorological Satellite Program (DMSP) Special SensorMicrowave Imager (SSMI)]http://biology.brookscole.com/miller14467
City 10–15%Grass 15–25%Bare s<strong>and</strong> 30–60%Oceans 5%Clouds 50–55%Snow 80–90%Forest 5%Figure 21-7 The albedo, or reflectivity of incoming solar energy,of different parts of the earth’s surface varies greatly.(Data from NOAA)Height above or belowpresent sea level (meters)into space. Much less sunlight is reflected by darkersurfaces such as forests, grass, cities, <strong>and</strong> oceans. Thusthe world’s coldest regions are part of the earth’s airconditioningsystem.A rise in the earth’s temperature can cause gradualmelting of some of the earth’s ice caps, floating ice,<strong>and</strong> mountain glaciers to melt. This would exposedarker <strong>and</strong> less reflective surfaces of water <strong>and</strong> l<strong>and</strong><strong>and</strong> result in a warmer troposphere. As more ice melts,the troposphere can become warmer, which meltsmore ice <strong>and</strong> increases the tropospheric temperatureeven moreIt is not known whether this shrinkage <strong>and</strong> thinningof floating sea ice is the result of natural polarclimate fluctuations, global warming caused by human-causedincreases in greenhouse gases, or a combinationof both factors—the last being the most likelyexplanation, according to many climate scientists. Regardlessof the cause, such changes can affect theearth’s temperatures <strong>and</strong> climate.Because it is floating, large-scale melting of ArcticOcean ice will not raise global sea levels—just as an icecube in a glass of water does not raise the water levelwhen it melts. However, according to researchers at theUniversity of California at Santa Cruz, as much as halfof the Arctic sea ice could disappear by 2050. If thishappens, it would shift the course of the storm-guidingjet stream northward. The researchers estimate thiswould reduce wintertime rain <strong>and</strong> snowfall by nearly athird over an area stretching from southern BritishColumbia to Mexico. The resulting drop in the SierraNevada snow pack would sharply reduce the spring<strong>and</strong> summer water supply for states such as California.Many scientists believe that the biggest long-termclimate danger comes from Greenl<strong>and</strong>. They are especiallyconcerned about partial or eventually completemelting of the l<strong>and</strong>-based glaciers or ice sheets thatcover Greenl<strong>and</strong>.If this occurred, as it did in a previous interglacialwarm period 110,000–130,000 years ago (Figure 21-8),average sea levels would rise by 7 meters (23 feet). In2002, glaciologist Konrad Steffen reported that icecovering about a third of Greenl<strong>and</strong>’s total area ismelting at a much faster rate than at any time sincerecords have been kept. Researchers have calculatedthat a 3°C (5°F) rise in the earth’s average atmospherictemperature—within the range projected during thiscentury—would be enough eventually to melt the entireGreenl<strong>and</strong> ice sheet. They estimate this wouldtake about 1,000 years but partial melting could acceleratean increase in average sea level during this century.This is an area that scientists will be watchingclosely.Would you like a preview of some of the effects ofrapid atmospheric warming over the next 25–30 years?Visit Alaska, where average winter temperatures haveincreased by 4°C (8°F)—since 1960 <strong>and</strong> year-roundtemperatures have risen by 3°C (5°F). Most of this increaseoccurred since 1976. The hottest year in Alaskanhistory was 2002, <strong>and</strong> the winter of 2003 was the secondwarmest on record.These warmer temperatures are melting glaciers<strong>and</strong> snow in parts of Alaska. Some of the permafrostunder arctic tundra soils is warming <strong>and</strong> melting. Thisreleases large amounts of CO 2 <strong>and</strong> CH 4 into the troposphere,which can accelerate tropospheric warming.The melting permafrost has caused buildings, roads,telephone <strong>and</strong> utility lines, <strong>and</strong> parts of the Trans-Alaska pipeline (Figure 17-9, p. 357) to sink, shift, <strong>and</strong>in some cases break up. In some parts of Alaska trees0−130Today’s sea level0−426250,000 200,000 150,000 100,000 50,000 0Years before present PresentHeight above or belowpresent sea level (feet)Figure 21-8 Changes in average sea level over the past 250,000years based on data from cores removed from the ocean. The coming<strong>and</strong> going of glacial periods (ice ages) largely determine therise <strong>and</strong> fall of sea level. As glaciers melted <strong>and</strong> retreated since thepeak of the last glacial period about 18,000 years ago, the earth’saverage sea level has risen about 125 meters (410 feet). (Adaptedfrom Tom Garrison, Oceanography: An Invitation to Marine Science,3/E, © 1998. Brooks/Cole.)468 CHAPTER 21 Climate Change <strong>and</strong> Ozone Loss
are dying because the permafrost underneath them ismelting. According to University of Alaska scientists,Alaskan forests are also threatened by greatly increasedpopulations of the spruce-bark beetle (whichcan kill spruce trees) because of a lack of cold spellsthat help keep them under control.However, there are economic benefits from awarmer Alaska. They include a longer growing season,ice-free ports, more people moving to the state, <strong>and</strong>more tourists visiting <strong>and</strong> spending money year-round.During the last 25 years glaciers have also beenmelting <strong>and</strong> shrinking at accelerating rates on manyof the world’s mountaintops. Only 27 of the 150 glaciersfound during the middle of the last century inMontana’s Glacier National Park remain. Tanzania’sMount Kilimanjaro—Africa’s tallest peak—may be icefreewithin 15 years. Other evidence indicates that 80%of South American glaciers could disappear within15 years.The disappearance of mountain glaciers means aloss of frozen water reservoirs that partially thaw outduring warm months <strong>and</strong> release water for use byfarms <strong>and</strong> city-dwellers in the valleys below. This isbad news for countries like Peru, Ecuador, <strong>and</strong> Bolivia,which rely on annual water release by mountain glaciersfor irrigation <strong>and</strong> household use.These modelers develop a three-dimensional representationof how energy, air masses, <strong>and</strong> moistureflow through the atmosphere, based on the laws ofphysics <strong>and</strong> the major factors affecting the earth’s temperature<strong>and</strong> climate shown in Figure 21-9.Computer simulations begin by covering theearth’s surface with a grid of several hundred hugesquares (Figure 21-10, p. 471). Each square provides thebase for a stacked of gigantic imaginary cells, each severalhundred kilometers on a side <strong>and</strong> about 3 kilometers(2 miles) high. These layers of cells extend downinto the ocean <strong>and</strong> up into the atmosphere. Data onvariables such as solar energy, sunlight, air pressure,temperature, water vapor, <strong>and</strong> winds or currents thataffect climate in each cell are fed into the model. Then acomplex set of mathematical equations simulates flowsof matter <strong>and</strong> energy among the cells <strong>and</strong> the entire climatemodel is fed into a supercomputer. New climatedata can be added to the model to improve its accuracy.Such models provide scenarios of what is verylikely or likely to happen based on various assumptions<strong>and</strong> data fed into the model. How well the results correspondto the real world depends on the assumptionsof the model (based on current knowledge about thesystems making up the earth, oceans, <strong>and</strong> atmosphere)<strong>and</strong> the accuracy of the data used.21-4 PROJECTING FUTURECHANGES IN THE EARTH’STEMPERATUREHow Do Scientists Model Changes in theEarth’s Temperature <strong>and</strong> Climate? ComputerModels as Crystal BallsScientists have developed complex mathematicalmodels of the earth’s climate systems, <strong>and</strong> they usethem to project future changes in the earth’s averagetemperature.To project the effects of increases in greenhouse gaseson average global temperature, scientists developmodels of how interactions among solar energy <strong>and</strong>the earth’s l<strong>and</strong>, oceans, ice, <strong>and</strong> greenhouse gases determinethe average temperature of the troposphere.Figure 21-9 ( p. 470) gives a greatly simplified summaryof some of these interactions. Trace the flows <strong>and</strong> connectionsin this figure.Scientists use this information to develop globalclimate models (also know as coupled global circulationmodels) that are applied to the atmosphere to projectthe effects of increases in greenhouse gases on averageglobal temperature. Currently 14 research laboratoriesare operating, evaluating, <strong>and</strong> improving coupledgeneral circulation models.What Is the Scientific Consensus aboutFuture Changes in the Earth’s Temperature?Hotter Times AheadMost climate scientists agree that human activitieshave influenced recent temperature increases <strong>and</strong>will lead to further significant temperature increasesduring this century.In 1990, 1995, <strong>and</strong> 2001, the IPCC published reportsthat evaluate how global temperatures changed in thepast (Figure 21-2) <strong>and</strong> are likely to change during thiscentury. The IPCC reached its conclusions on the basisof scientific principles governing climate, data frompast events, human emissions of CO 2 <strong>and</strong> other greenhousegases, current temperature measurements, <strong>and</strong>global climate models.Here are three major findings of the 2001 report.■ Despite many uncertainties, the latest climatemodels match the records of global temperaturechanges since 1850 very closely.■ ”There is new <strong>and</strong> stronger evidence that most ofthe warming observed over the last 50 years is attributableto human activities.”■ It is very likely (90–99% probability) that theearth’s mean surface temperature will increase by1.4–5.8°C (2.5–10.4°F) between 2000 <strong>and</strong> 2100 (Figure21-11, p. 471).http://biology.brookscole.com/miller14469
SunTroposphereAerosolsGreenhousegasesWarmingfromdecreaseCoolingfromincreaseCO 2 removalby plants <strong>and</strong>soil organismsCO 2 emissions froml<strong>and</strong> clearing,fires, <strong>and</strong> decayHeat <strong>and</strong>CO 2 removalHeat <strong>and</strong>CO 2 emissionsIce <strong>and</strong> snow coverShallow oceanNatural <strong>and</strong> human emissionsL<strong>and</strong> <strong>and</strong> soil biotoaLong-termstorageDeep oceanFigure 21-9 Natural capital: simplified model of some of the major processes that interact to determine theaverage temperature <strong>and</strong> greenhouse gas content of the troposphere <strong>and</strong> thus the earth’s climate.A 2001 report by the National Academy of Sciences<strong>and</strong> a 2002 Bush administration report, preparedby various U.S. government agencies for the UnitedNations, reached similar conclusions. In 2004, theAmerican Geophysical Union released a positionstatement that said, “Scientific evidence strongly indicatesthat humans have played a role in the rapidwarming of the past half century.” And it is “virtuallycertain” that increasing greenhouse gases will warmthe planet.IPCC <strong>and</strong> other climate scientists holding the consensusview agree that current climate models need tobe improved. This is why the very likely projectedrange of average atmospheric temperature during thiscentury is quite broad (Figure 21-11). Scientists arehard at work trying to develop better models <strong>and</strong> narrowdown such uncertainties.A few climate scientists disagree with the consensusview about future temperature changes in theearth’s atmosphere. They say we know too little abouthow the earth’s climate works to make reliable projectionsabout such changes. They also point out thatsome of the projected climate changes can be beneficialto some regions. And they believe we can use our inge-470 CHAPTER 21 Climate Change <strong>and</strong> Ozone Loss
CellCloudsL<strong>and</strong>OceanAccording to the IPCC, it is very likely that this willbe the fastest temperature change of the past 1,000years. Such rapid temperature change can affect theavailability of water resources by altering rates ofevaporation <strong>and</strong> precipitation. It can also change windpatterns <strong>and</strong> weather, dry some areas, add moisture toothers, alter some ocean currents, shift areas wherecrops can be grown, increase average sea levels <strong>and</strong>flood some coastal wetl<strong>and</strong>s <strong>and</strong> cities <strong>and</strong> low-lyingisl<strong>and</strong>s, <strong>and</strong> alter the structure <strong>and</strong> location of some ofthe world’s biomes. These are major changes in theearth’s atmospheric conditions. An increase in theearth’s average temperature within a few decades or acentury gives us little time to deal with its effects.In 2002, the U.S. National Academy of Sciences issueda study, which raised the possibility that the temperatureof the troposphere could rise drastically inonly a decade or two. The report cited abrupt <strong>and</strong>long-lasting changes in tropospheric temperatures thathave occurred during the last 100,000 years.The report lays out a nightmarish worst-case scenarioin which ecosystems suddenly collapse, lowlyingcities are flooded, forests are consumed in vastfires, grassl<strong>and</strong>s die out <strong>and</strong> turn into dust bowls,wildlife disappears, <strong>and</strong> tropical waterborne <strong>and</strong> insect-transmittedinfectious diseases spread rapidly beyondtheir current ranges.Figure 21-10 Global circulation model (GCM) of climate dividesthe earth’s atmosphere into large numbers of giganticboxes or cells stacked many layers high. The laws of physics<strong>and</strong> our underst<strong>and</strong>ing of global air circulation patterns <strong>and</strong>other factors that can affect climate are used to describe numericallywhat happens to major variables affecting climate ineach cell <strong>and</strong> how they change from one cell to another.nuity to offset most of the undesirable effects of climatechange.xHOW WOULD YOU VOTE? Do you believe that we will experiencesignificant global warming during this century? Castyour vote online at http://biology.brookscole.com/miller14.Why Should We Be Concerned about aWarmer Earth? The Speed of ChangeIs What CountsA rapid increase in the temperature of the tropospherewould give humans <strong>and</strong> other species littletime to deal with its effects.Climate scientists warn that the concern is not just atemperature change but how rapidly it occurs, regardlessof cause. Past temperature changes often tookplace over thous<strong>and</strong>s to a hundred thous<strong>and</strong> years(Figure 21-2, top left). The problem we face is a fairlysharp projected increase in the temperature of the troposphereduring this century (Figure 21-11).Change in temperature (°C)6.05.55.04.54.03.53.02.52.01.51.00.501850 1875 1900 1925 1950 1975 2000 2025 2050 2075 2100YearFigure 21-11 Comparison of measured changes in theaverage temperature of the atmosphere at the earth’s surfacebetween 1860 <strong>and</strong> 2003 <strong>and</strong> the projected range of temperatureincrease during the rest of this century. (Data fromU.S. National Academy of Sciences, National Center forAtmospheric Research, <strong>and</strong> Intergovernmental Panel onClimate Change)http://biology.brookscole.com/miller14471
These possibilities were affirmed by a 2003 analysiscarried out by Peter Schwartz <strong>and</strong> Doug R<strong>and</strong>allfor the Department of Defense. They also projectedwidespread rioting <strong>and</strong> regional conflict in some countriesfaced with dwindling food, water, <strong>and</strong> energysupplies. The authors concluded that global warmingmust “be viewed as a serious threat to global stability<strong>and</strong> should be elevated beyond a scientific debate to aU.S. national security concern.”21-5 FACTORS AFFECTING THEEARTH’S TEMPERATUREScientists have identified a number of natural <strong>and</strong> human-influencedfactors that might amplify (positivefeedback) or dampen (negative feedback) projectedchanges in the average temperature of the troposphere.The fairly wide range of projected future temperaturechanges shown in Figure 21-11 results fromincluding what is known about these factors in climatemodels. Let us examine some possible wildcards that could help or make matters worse or betterduring this century.Can the Oceans Store More CO 2 <strong>and</strong> Heat?We Do Not KnowThere is uncertainty about how much CO 2<strong>and</strong> heat the oceans can remove from thetroposphere <strong>and</strong> how long they might remainin the oceans.The oceans help moderate the earth’s average surfacetemperature by removing about 29% of the excess CO 2we pump into the atmosphere as part of the global car-bon cycle. They also absorb heat from the atmosphere<strong>and</strong> slowly transfer some of it to the deep ocean, whereit is removed from the climate system for long but unknownperiods of time (Figure 21-9).Oocean currents on the surface <strong>and</strong> deep down areconnected <strong>and</strong> act like a gigantic conveyor belt to storeCO 2 <strong>and</strong> heat in the deep sea <strong>and</strong> to transfer hot <strong>and</strong>cold water from the tropics to the poles (Figure 21-12<strong>and</strong> Figure 6-6, p. 106).Scientists do not know how rapidly heat absorbedby the ocean from the troposphere can be transferredto the deep ocean by such currents <strong>and</strong> other mixingprocesses. They also do not know whether, over thenext few decades, the oceans will release some of theirstored heat <strong>and</strong> dissolved CO 2 into the troposphere,thereby amplifying its global warming.Evidence suggests that large changes in the speedof the ocean currents in this conveyor belt, <strong>and</strong> itsstopping <strong>and</strong> starting, contributed to wild swings innorthern hemisphere temperatures during past iceages. Scientists are trying to learn more about howthese currents operate to evaluate the likelihood of theloop slowing down or stalling during this century <strong>and</strong>the effects this might have on regional <strong>and</strong> global atmospherictemperatures.In 2003 a group of physical oceanographers, includingSydney Levitus of the National Oceanic <strong>and</strong>Atmospheric Administration (NOAA) <strong>and</strong> Ruth Curryof the Woods Hole Oceanographic Institute, announcedthe results of a compilation of millions of observations<strong>and</strong> measurements of the Atlantic Ocean from pole topole. <strong>Their</strong> analysis indicated that tropical oceans arenow much saltier <strong>and</strong> oceans closer to the poles are lesssalty than they were 40 years ago. In other words, duringthis period fresh water has been lost from the lowlatitudes <strong>and</strong> added at high latitudes.Figure 21-12 Natural capital: a connected loop of shallow<strong>and</strong> deep ocean currents stores CO 2 in thedeep sea <strong>and</strong> transmits warm <strong>and</strong> cool water tovarious parts of the earth. It occurs whenocean water in the North Atlantic near Icel<strong>and</strong>is dense enough (because of itssalt content <strong>and</strong> cold temperature) tosink to the ocean bottom, flow southward,<strong>and</strong> then eastward to well upin the warmer Pacific. Then a shallowerreturn current aided by windsbrings warmer <strong>and</strong> less salty—<strong>and</strong>thus less dense—water to the Atlantic,which can then cool <strong>and</strong> sinkto begin the cycle again. A warmerplanet would be a rainier one, which,coupled with melting glaciers, would increasethe amount of fresh water flowing intothe North Atlantic. This could slow or even jamthe loop by diluting the salt water <strong>and</strong> making it morebuoyant (less dense) <strong>and</strong> less prone to sinking.Greenl<strong>and</strong>Cold WaterAntarcticaWarm Water472 CHAPTER 21 Climate Change <strong>and</strong> Ozone Loss
They suggest that this indicates that global warmingmay be playing a key role in accelerating the globalwater cycle. If this hypothesis is correct, global warmingmay affect global precipitation patterns <strong>and</strong> alterthe distribution, severity, <strong>and</strong> frequency of droughts,floods, <strong>and</strong> storms. Such an accelerated hydrologic cyclecould also intensify global warming by increasingthe rate of evaporation of water—a potent greenhousegas—into the troposphere.It could also slow down the conveyor belt (Figure21-12) that helps draw warm Gulf Stream watersnorthward in the Atlantic, pumping heat into northernregions <strong>and</strong> moderating wintertime air temperatures,especially in western Europe.The large loop of shallow <strong>and</strong> deep ocean currentsshown in Figure 21-12 helps keep much of the northernhemisphere (especially Europe) fairly warm bypulling warm tropical water north, pushing cold watersouth, <strong>and</strong> releasing much of the heat stored in the waterinto the troposphere.If this loop of currents should slow sharply or shutdown, northern Europe <strong>and</strong> the northeast coast ofNorth America would experience severe regional cooling.In other words, global warming can lead to significantglobal cooling in some parts of the world, with the climateof western Europe possibly resembling that ofSiberia. Disruption or significant slowing of the loopwould also disrupt other parts of the world withfloods, droughts, severe storms, <strong>and</strong> searing heat.How Might Changes in Cloud CoverAffect the Troposphere’s Temperature?Another UncertaintyWarmer temperatures create more clouds that couldwarm or cool the troposphere, but we do not knowwhich effect might dominate.One of the largest unknowns in global climate modelsis the effect of changes in the global distribution ofclouds or the temperature of the troposphere. Warmertemperatures increase evaporation of surface water<strong>and</strong> create more clouds. These additional clouds canhave a warming effect (positive feedback), by absorbing<strong>and</strong> releasing heat into the troposphere, or a cooling effect(negative feedback) by reflecting more sunlightback into space.The net result of these two opposing effects dependson several factors. One is how much water vaporwill enter the troposphere as the earth’s surfacewarms. In 2004, measurements by researchers AndrewDessler <strong>and</strong> Ken Minschwaner verified that water vaporis increasing in the troposphere as the earthwarms. However, they found that increases in watervapor in the upper troposphere were not as high asmany global circulation climate models have assumed.The effects of clouds on atmospheric temperaturesalso depend on whether it is day or night. Other factorsinclude the type (thin or thick), coverage (continuousor discontinuous), <strong>and</strong> altitude of the cloud, <strong>and</strong>the size <strong>and</strong> number of water droplets or ice crystalsformed in clouds.For example, an increase in thick <strong>and</strong> continuousclouds at low altitudes can decrease surface warmingby reflecting <strong>and</strong> blocking more sunlight. However, anincrease in thin <strong>and</strong> discontinuous cirrus clouds athigh altitudes can warm the lower troposphere <strong>and</strong> increasesurface warming. What climate scientists knowabout the effects of clouds has been included in the latestclimate models., but much uncertainty remains.In 1999, researchers at the University of Coloradoreported that the wispy condensation trails (contrails)left behind by jet planes might have a greater impacton the temperature of the troposphere than scientistshad thought. Using infrared satellite images, theyfound that jet contrails exp<strong>and</strong> <strong>and</strong> turn into large cirrusclouds that tend to release heat into the upper troposphere.If these preliminary results are confirmed,emissions from jet planes could be responsible for asmuch as half of the tropospheric warming in the northernhemisphere.How Might Outdoor Air Pollution Affectthe Troposphere’s Temperature? A TemporaryEffectAerosol pollutants <strong>and</strong> soot produced by humanactivities can warm or cool the troposphere, butsuch effects will decrease with any decline in suchoutdoor air pollution.Aerosols (microscopic droplets <strong>and</strong> solid particles) ofvarious air pollutants are released or formed in the troposphereby volcanic eruptions <strong>and</strong> human activities,<strong>and</strong> they can increase cloud cover.Some of the resulting clouds have a high albedo<strong>and</strong> reflect more incoming sunlight back into spaceduring the day. This could help counteract the heatingeffects of increased greenhouse gases.Nights are warmer becaue the presence of cloudsprevents some of the heat stored in the earth’s l<strong>and</strong> <strong>and</strong>water during the day from being radiated into space.These pollutants may explain why most of the recentwarming in the northern hemisphere occurs at night.But these interactions are complex. Aerosol pollutantsin the lower troposphere can either warm or coolthe air, depending on factors such as their size <strong>and</strong> thereflectivity of the underlying surface.Most tropospheric aerosols, such as sulfate particlesproduced by fossil fuel combustion, tend to coolthe troposphere <strong>and</strong> thus can temporarily slow globalwarming. However, a recent study by Mark Jacobsonof Stanford University indicated that tiny particles ofsoot or black carbon aerosols—produced mainly from incompletecombustion in coal burning, diesel engines,<strong>and</strong> open fires—may be responsible for 15–30% ofhttp://biology.brookscole.com/miller14473
global warming during the past 50 years. If so, sootwould be the second biggest human contribution toglobal warming, after the greenhouse gas CO 2 .One possible effect of increased aerosols in the troposphereis global or solar dimming. In 2004, scientistsreported that measurements showed a drop in theamount of sunshine reaching the earth’s surface by asmuch as 10% between 1960 <strong>and</strong> 1990, with a 37% dropin Hong Kong. Satellite measurements showed that adecrease in the amount of energy from the sun—solarradiation—could not account for this effect. Scientistshypothesize that pollution can dim sunlight in twoways. One is that soot particles in the atmosphere reflectsome of the sunlight back into space. Anotherpossibility is that the airborne particles cause morewater droplets to condense out of the air, leading tothicker <strong>and</strong> darker clouds, which can reduce incomingsunlight. However, preliminary measurementsshowed that the amount of sunlight reaching theearth’s surface increased slightly between 2001 <strong>and</strong>2003. Scientists are trying to sort out the complexities<strong>and</strong> causes of these phenomena.Climate scientists do not expect aerosol pollutantsto counteract or enhance projected global warmingvery much in the next 50 years for two reasons. One isthat aerosols <strong>and</strong> soot fall back to the earth or arewashed out of the lower atmosphere within weeks ormonths, whereas CO 2 <strong>and</strong> other greenhouse gases remainin the troposphere for decades to several hundredyears. The other is that aerosol inputs into thetroposphere are being reduced—especially in developedcountries.Can Increased CO 2 Levels Stimulate Photosynthesis<strong>and</strong> Remove More CO 2 from the Air?A Temporary <strong>and</strong> Limited EffectIncreased CO 2 in the troposphere could increaseplant photosynthesis, but several factors can limit oroffset this effect.Some studies suggest that more CO 2 in the tropospherecould increase the rate of plant photosynthesisin areas with adequate water <strong>and</strong> soil nutrients. Thiswould remove more CO 2 from the troposphere <strong>and</strong>help slow atmospheric warming.However, recent studies indicate that this CO 2 removalwould be temporary for two reasons. One isthat it would slow as the plants reach maturity <strong>and</strong>take up less CO 2 from the troposphere. The other isthat carbon stored by the plants as organic compoundswould be returned to the troposphere as CO 2 when theplants die <strong>and</strong> decompose or burn.A 2004 study by a team of U.S. <strong>and</strong> Brazilian scientistsshowed that undisturbed old-growth Amazonrainforests are experiencing rapid changes in speciescomposition apparently because of rising atmosphericlevels of carbon dioxide. Higher CO 2 levels are fertilizingmany species of trees <strong>and</strong> fast growing larger treesare out competing smaller younger trees. This ischanging the mix of tree <strong>and</strong> wildlife species or biodiversitymakeup of theses rainforests. Initially, this canincrease the uptake of CO 2 from the atmosphere. Butas these larger trees mature <strong>and</strong> die out sooner the reductionin denser wood <strong>and</strong> foliage could eventuallylead to a drop in the amount of carbon dioxide theserainforests remove from the atmosphere. In addition,plant-eating insects that breed more rapidly <strong>and</strong> yearroundin warmer temperatures could offset much ofthe increased plant growth.How Might a Warmer TroposphereAffect Methane Emissions? AcceleratedWarmingWarmer air can release methane gas stored in bogs,wetl<strong>and</strong>s, <strong>and</strong> tundra soils, causing a feedback loopthat makes the air warmer.Global warming could be accelerated by an increasedrelease of methane (a potent greenhouse gas) from twomajor sources. One is bogs <strong>and</strong> other wetl<strong>and</strong>s <strong>and</strong> theother is ice-like compounds called methane hydratestrapped beneath the arctic permafrost. Significantamounts of methane would be released into the troposphereif the permafrost in tundra <strong>and</strong> boreal forestsoils partially or completely melts, as is occurring inparts of Canada, Alaska, China, <strong>and</strong> Mongolia. The resultingtropospheric warming could lead to moremethane release <strong>and</strong> still more warming.21-6 POSSIBLE EFFECTSOF A WARMER WORLDWhat Are Some Possible Effects of a WarmerTroposphere? Winners <strong>and</strong> LosersAwarmer troposphere would have beneficial <strong>and</strong>harmful effects, but poor nations in the tropics willsuffer the most.A warmer troposphere could have a number of beneficial<strong>and</strong> harmful effects, listed in Figures 21-13 <strong>and</strong>21-14, for humans, other species, <strong>and</strong> ecosystems, dependingmostly on their locations <strong>and</strong> on how rapidlythe temperature changes. Study these figures carefully.However, betting on living in an area with favorableclimate change in the future is like playing a game ofRussian roulette. Global climate models are improving,but so far we cannot make reliable projectionsabout how the climates of particular regions are likelyto change.474 CHAPTER 21 Climate Change <strong>and</strong> Ozone Loss
Agriculture• Shifts in food-growingareas• Changes in crop yields• Increased irrigationdem<strong>and</strong>s• Increased pests, cropdiseases, <strong>and</strong> weedsin warmer areasWater Resources• Changes in water supply• Decreased water quality• Increased drought• Increased flooding• Snowpack reduction• Melting of mountaintopglaciersForests• Changes in forest composition<strong>and</strong> locations• Disappearance of some forests,especially ones at high elevations• Increased fires from drying• Loss of wildlife habitat <strong>and</strong> speciesBiodiversity• Extinction of someplant <strong>and</strong> animal species• Loss of habitats• Disruption of aquatic lifeNASASea Level <strong>and</strong> Coastal Areas• Rising sea levels• Flooding of low-lying isl<strong>and</strong>s <strong>and</strong>coastal cities• Flooding of coastal estuaries, wetl<strong>and</strong>s,<strong>and</strong> coral reefs• Beach erosion• Disruption of coastal fisheries• Contamination of coastal aquiferswith salt waterWeather Extremes•Prolonged heat waves<strong>and</strong> droughts• Increased flooding frommore frequent, intense,<strong>and</strong> heavy rainfall insome areasHuman Population• Increased deaths fromheat <strong>and</strong> disruption offood supplies• More environmentalrefugees• Increased migrationHuman Health• Decreased deaths from cold weather• Increased deaths from heat <strong>and</strong> disease• Disruption of food <strong>and</strong> water supplies• Spread of tropical diseases totemperate areas• Increased respiratory disease <strong>and</strong>pollen allergies• Increased water pollution fromcoastal flooding• Increased formation ofphotochemical smogFigure 21-13 Winners <strong>and</strong> losers. Projected effects of a warmer atmosphere for the world. Most of these effectscould be harmful or beneficial depending on where one lives. Current models of the earth’s climate cannotmake reliable projections about where such effects might take place at a regional level <strong>and</strong> how long theymight last. (Data from Intergovernmental Panel on Climate Change, U.S. Global Climate Change ResearchProgram, U.S. National Academy of Sciences)According to the IPCC, the largest burden of theharmful effects of moderate global warming will fallon people <strong>and</strong> economies in poorer tropical <strong>and</strong> subtropicalnations without the economic <strong>and</strong> technologicalresources needed to adapt to its harmful impacts.In 2003, scientists at the World Health Organizationestimated that each year about 150,000 people—mostly children in developing countries in Asia <strong>and</strong>Africa—die prematurely from side effects of globalwarming ranging from increases in malaria to malnutrition.They estimated that this death toll could doubleby 2020. Some researchers estimate that by the end ofthis century the annual death toll from global warming• Less severe winters• More precipitation in some dry areas• Less precipitation in some wet areas• Increased food production in some areas• Exp<strong>and</strong>ed population <strong>and</strong> range for some plant<strong>and</strong> animal species adapted to higher temperaturesFigure 21-14 Winners: Possible beneficial effects of a warmeratmosphere for some countries <strong>and</strong> people.http://biology.brookscole.com/miller14475
could reach 6 million (Figure 1-15, p. 17) or more. Someanalysts say these estimates are exaggerated. But evenwith a lower toll this is a serious <strong>and</strong> largely preventablehuman tragedy.BeechHow Might a Warmer Troposphere AffectOrganisms <strong>and</strong> Ecosystems? Change isupon Them.A warmer troposphere will change thedistribution <strong>and</strong> population sizes of wild species,shift locations of some of the world’s ecosystems,<strong>and</strong> threaten some protected reserves <strong>and</strong> coralreefs.According to the IPCC, projected change in the temperatureof the troposphere during this century willhave a significant effect on the “distributions, populationsizes, population density, <strong>and</strong> behavior ofwildlife.” A warmer climate could exp<strong>and</strong> ranges <strong>and</strong>populations of some plant <strong>and</strong> animal species that canadapt to warmer climates. This should lead to increasedtree <strong>and</strong> plant growth in parts of the northernUnited States, Canada, Russia, central Asia, <strong>and</strong> northernEurope. In parts of Sc<strong>and</strong>inavia, for example, birchtrees are taking over traditional reindeer lichen pastures.And the reindeer are having to compete forlichen with elk <strong>and</strong> red deer moving north.There is also bad news from the IPCC. A warmertroposphere would threaten plant <strong>and</strong> animal speciesthat could not migrate rapidly enough to new areas(Figure 21-15), species with specialized niches,<strong>and</strong> those with a narrow tolerance for temperaturechange. And shifts in regional climate would threatenmany parks, wildlife reserves, wilderness areas, wetl<strong>and</strong>s,<strong>and</strong> coral reefs—thwarting some current effortsto stem the loss of biodiversity. Also, species likelyto do better in a warmer world include certain rapidlymultiplying weeds, insect pests, <strong>and</strong> disease-carryingorganisms such as mosquitoes <strong>and</strong> water-bornebacteria.The IPCC says it is very likely that tree deaths willincrease from more disease <strong>and</strong> higher pest populationsthat would thrive in areas with a warmer climate.It is also very likely that wildfires in forest <strong>and</strong> grassl<strong>and</strong>areas with drier climates will increase, destroyingwildlife habitats <strong>and</strong>, as a result, releasing largeamounts of CO 2 into the troposphere.A 2004 report by the UN Environment Programmeestimated that at least 1 million species (especiallyplant, mammal, butterfly, <strong>and</strong> bird species) could facepremature extinction by 2050 unless greenhouse gasemissions are drastically reduced. According to theIPCC, ecosystems most likely to be disrupted <strong>and</strong> losespecies are coral reefs, polar seas, coastal wetl<strong>and</strong>s,arctic <strong>and</strong> alpine tundra, <strong>and</strong> high-elevation mountaintops.FuturerangeOverlapPresentrangeFigure 21-15 Possible effects of global warming on thegeographic range of beech trees based on ecologicalevidence <strong>and</strong> computer models. According to one projection,if CO 2 emissions doubled between 1990 <strong>and</strong> 2050, beechtrees (now common throughout the eastern United States)would survive only in a greatly reduced range in northernMaine <strong>and</strong> southeastern Canada. This is only one of anumber tree species whose geographic ranges could bechanged drastically by increased atmospheric warming. Forexample, native sugar maples are likely to disappear in thenortheastern United States. On the other h<strong>and</strong>, ranges of sometree species adapted to a warm climate would spread. (Datafrom Margaret B. Davis <strong>and</strong> Catherine Zabinski, University ofMinnesota)How Might a Warmer Troposphere AffectAgriculture? Winners <strong>and</strong> LosersFood production may increase in some areas <strong>and</strong>decrease in others.In a warmer world, agricultural productivity may increasein some areas <strong>and</strong> decrease in others. For example,some analysts project that warmer temperatures<strong>and</strong> increased precipitation at northern latitudes maylead to a northward shift of some agricultural productionfrom the midwestern United States to Canada. Butoverall food production could decrease because soilsin these areas of Canada are generally less fertile thanthose in the midwestern United States.Adecrease in high-elevation snow packs could leadto a sharp decline in agricultural productivity in someheavily irrigated areas. For example, water experts projectincreasing water shortages in areas such as central<strong>and</strong> southern California that receive most of their waterin summer months from snow melting on the SierraNevada as well as snowmelt in the Rockies that feedsthe Colorado River (Figure 15-10, p. 314). Warmer win-476 CHAPTER 21 Climate Change <strong>and</strong> Ozone Loss
ter temperatures in the Sierra Nevada <strong>and</strong> the Rockieswould cause most precipitation to fall as rain ratherthan snow. This would increase flooding during thewinter months <strong>and</strong> sharply reduce the summer supplyof water for central <strong>and</strong> southern California.Even larger effects would occur if snow mass in theHimalayas decreased. Such a change could reduce wateravailable in summer for irrigation from the Yellow,Indus, <strong>and</strong> Ganges Rivers. Irrigation water from theserivers is vital. It is currently used to produce theworld’s two largest wheat harvests in China <strong>and</strong> inIndia. Also, reduced water flow in the summer fromthe Yangtze River in China would harm the world’slargest rice harvest.Crop <strong>and</strong> fish production in some areas could be reducedby rising sea levels that would flood river deltas,which are home to some of the world’s most productiveagricultural l<strong>and</strong>s <strong>and</strong> coastal aquaculture ponds.What Are Some Possible Effects of RisingSea Levels? Seek Higher GroundRising sea levels could flood low-lying coastalwetl<strong>and</strong>s <strong>and</strong> isl<strong>and</strong>s, coral reefs, <strong>and</strong> parts ofsome of the world’s coastal cities.Another problem with a warmer world is a rise inglobal sea level caused by runoff from melting snow<strong>and</strong> ice <strong>and</strong> by the fact that water exp<strong>and</strong>s slightlywhen heated. In their 2001 IPCC report, climate scientistsprojected that global sea levels are very likely to riseduring this century (Figure 21-16).The high projected rise in sea level of about 88centimeters (35 inches) would have a number of harmfuleffects. They include the following:■ Threatening half of the world’s coastal estuaries,wetl<strong>and</strong>s (one-third of those in the United States, especiallyin southern Louisiana <strong>and</strong> southern Florida),<strong>and</strong> coral reefs■ Disrupting many of the world’s coastal fisheries■ Flooding low-lying barrier isl<strong>and</strong>s <strong>and</strong> causinggently sloping coastlines (especially along the U.S.East Coast) to erode <strong>and</strong> retreat inl<strong>and</strong> by about1.3 kilometers (0.8 mile)■ Flooding agricultural lowl<strong>and</strong>s <strong>and</strong> deltas in partsof Bangladesh, India, <strong>and</strong> China, where much of theworld’s rice is grown■ Contaminating freshwater coastal aquifers withsalt water■ Submerging some low-lying isl<strong>and</strong>s in the PacificOcean (the Marshall Isl<strong>and</strong>s) <strong>and</strong> the Indian Ocean(the Maldives, a chain of 1,200 small isl<strong>and</strong>s)One comedian jokes that he plans to buy l<strong>and</strong> in Kansasbecause it will probably become valuable beachfrontMean Sea-Level Rises (centimeters)1009080706050403020High ProjectionShanghai, New Orleans,<strong>and</strong> other low-lying citieslargely underwaterMedium ProjectionMore than a third of U.S.wetl<strong>and</strong>s underwater10Low Projection02010 2020 2030 2040 2050 2060 2070 2080 2090 2100YearFigure 21-16 It is very likely that global sea levels will risefrom 9–88 centimeters (4–35 inches) during this century. If thisoccurs, flooding <strong>and</strong> coastal erosion would be especially severein heavily populated coastal areas of the tropics <strong>and</strong> warmtemperate regions. (Data from Intergovernmental Panel onClimate Change, 2000)property. Another boasts that she is not worried becauseshe lives in a houseboat—the “Noah strategy.”On a more serious note, a Netherl<strong>and</strong>s architecturalfirm has designed a prototype for an energy-efficient,floating home for use in areas subject to flooding.21-7 DEALING WITH THE THREATOF GLOBAL WARMINGWhat Are Our Options? The GreatClimate DebateThere is disagreement over what we should doabout the threat of global warming.As we have seen, nearly all climate scientists agree thatthe earth’s temperature is very likely to increase duringthis century <strong>and</strong> that human activities play a partin this change. Despite this scientific consensus, thereis debate among scientists over the causes of thesechanges (natural or human), how rapidly they mightoccur, the effects on humans <strong>and</strong> ecosystems, <strong>and</strong> howwe should respond to this potentially serious longtermglobal threat.Economists <strong>and</strong> policymakers also disagree overhow we should respond to the threat of climate change.They disagree on whether■ the economic costs of reducing greenhouse gasemissions are higher than the economic benefits.http://biology.brookscole.com/miller14477
■ developed countries, developing countries, or bothshould take responsibility for reducing greenhousegas emissions,■ actions to reduce greenhouse gas emissions shouldbe voluntary or required as a result of national laws<strong>and</strong> an international treaty.As a result of these scientific, economic, <strong>and</strong> politicaldisagreements, there are three schools of thoughtconcerning what we should do about projected globalwarming. One is to do more research before acting. Withthis wait-<strong>and</strong>-see-strategy, many scientists <strong>and</strong> economistscall for more research <strong>and</strong> a better underst<strong>and</strong>ingof the earth’s climate system before making far-reaching<strong>and</strong> controversial economic <strong>and</strong> political decisionssuch as phasing out fossil fuels. This is the current positionof the U.S. government.A second <strong>and</strong> rapidly growing group of scientists,economists, business leaders, <strong>and</strong> political leaders especiallyin the European Union believe that we shouldact now to reduce the risks from climate change broughtabout by global warming. They argue that the potentialfor harmful economic, ecological, <strong>and</strong> social consequencesis so great that action should not be delayed.They believe that current evidence indicates thatglobal warming is occurring <strong>and</strong> that if we delay bywaiting for even more conclusive evidence, it will betoo late to slow down the degree <strong>and</strong> rate of suchwarming. In other words, global warming is a goodc<strong>and</strong>idate for applying the precautionary principle.In 1997, more than 2,500 scientists from a variety ofdisciplines signed a Scientists’ Statement on GlobalClimate Disruption <strong>and</strong> concluded, “We endorse those[IPCC] reports <strong>and</strong> observe that the further accumulationof greenhouse gases commits the earth irreversiblyto further global climatic change <strong>and</strong> consequent ecological,economic, <strong>and</strong> social disruption. The risks associatedwith such changes justify preventive actionthrough reductions in emissions of greenhouse gases.”Also in 1997, 2,700 economists led by eight Nobel laureatesdeclared, “As economists, we believe that globalclimate change carries with it significant environmental,economic, social, <strong>and</strong> geopolitical risks <strong>and</strong> thatpreventive steps are justified.”A third strategy is to act now as part of a no-regretsstrategy. Scientists <strong>and</strong> economists supporting this approachsay we should take the key actions needed toslow global warming—even if the threat does not materialize—becausesuch actions lead to other importantenvironmental, health, <strong>and</strong> economic benefits.For example, a reduction in the combustion of fossilfuels, especially coal, will lead to sharp reductions inair pollution that lowers food <strong>and</strong> timber productivity,decreases biodiversity, <strong>and</strong> prematurely kills largenumbers of people. Reducing oil use would also decreasedependence on imported oil, which threatenseconomic <strong>and</strong> military security. And improving energyefficiency has numerous economic <strong>and</strong> environmentaladvantages (Figure 18-2, p. 380).xHOW WOULD YOU VOTE? Should we act now to helpslow global warming? Cast your vote online at http://biology.brookscole.com/miller14.What Can We Do to Reduce the Threat?Conserve Energy, Use Renewable Energy,<strong>and</strong> Intercept Greenhouse Gas EmissionsWe can improve energy efficiency, rely more oncarbon-free renewable energy resources, <strong>and</strong> findways to keep much of the CO 2 we produce outof the troposphere.Figure 21-17 presents a variety of prevention <strong>and</strong>cleanup solutions that climate analysts have suggestedfor slowing the rate <strong>and</strong> degree of global warming.The solutions come down to three major strategies: improveenergy efficiency to reduce fossil fuel use, shift fromcarbon-based fossil fuels to a mix of carbon-free renewableenergy resources, <strong>and</strong> sequester or store as much CO 2 aspossible in soil, in vegetation, underground, <strong>and</strong> in the deepocean. The effectiveness of these three strategies wouldbe enhanced by reducing population to decrease thenumber of fossil fuel consumers <strong>and</strong> CO 2 emitters <strong>and</strong>by reducing poverty to decrease the need of the poor toclear more l<strong>and</strong> for crops <strong>and</strong> wood.Scientists are also developing new power plantdesigns that would eliminate smokestack emissions ofCO 2 <strong>and</strong> other pollutants. One approach is to developmodified forms of coal gasification to increase the energyefficiency of coal-fired power plants from 35% to70%. There is also research on using metal-ceramicmembranes in coal gasification plants to trap CO 2 for sequestering.However, if such plants can be developed,they are likely to be quite costly <strong>and</strong> it would take manydecades for them to replace existing power plants.xHOW WOULD YOU VOTE? Should we phase out the use offossil fuels over the next fifty years? Cast your vote online athttp://biology.brookscole.com/miller14.Can We Remove <strong>and</strong> Store (Sequester)Enough CO 2 to Slow Global Warming?Are Output Approaches the Answer?We can prevent some of the CO 2 we produce fromcirculating in the troposphere, but the costs may behigh <strong>and</strong> the effectiveness of various approaches isunknown.Figure 21-18 (p. 480) shows several potential techniquesto remove CO 2 from the troposphere or from478 CHAPTER 21 Climate Change <strong>and</strong> Ozone Loss
PreventionCut fossil fueluse (especiallycoal)Shift from coalto natural gasImprove energyefficiencyShift torenewableenergy resourcesTransfer energyefficiency <strong>and</strong>renewable energytechnologiesto developingcountriesReducedeforestationUse moresustainableagricultureLimit urbansprawlReduce povertySlow populationgrowthSolutionsGlobal WarmingCleanupRemove CO 2from smokestack<strong>and</strong> vehicleemissionsStore (sequester)CO 2 by plantingtreesSequesterCO 2 deepundergroundSequester CO 2in soil by usingno-till cultivation<strong>and</strong> taking cropl<strong>and</strong> out ofproductionSequester CO 2in the deep oceanRepair leaky naturalgas pipelines <strong>and</strong>facilitiesUse feeds thatreduce CH 4emissions bybelching cowsFigure 21-17 Solutions: methods for slowing atmosphericwarming during this century.smokestacks <strong>and</strong> store (sequester) it in other parts ofthe environment.One possible way to remove CO 2 from the atmosphereis to plant trees that store (sequester) it in biomass.But studies indicate that this is a temporaryapproach because trees release their stored CO 2 backinto the atmosphere when they die <strong>and</strong> decompose or ifthey are burned (for example, by forest fires or to clearl<strong>and</strong> for crops).A second approach is soil sequestration in whichplants such as switchgrass are used to remove CO 2from the air <strong>and</strong> store it in the soil. But warmer temperaturescan increase decomposition in soils <strong>and</strong> returnsome of the stored CO 2 to the atmosphere.A third strategy is to reduce the release of carbondioxide <strong>and</strong> nitrous oxide from soil. Ways to do this includeconservation cultivation (Figure 14-13, p. 284) <strong>and</strong>retiring depleted crop fields, leaving them untouchedas conservation reserves.A fourth approach is to remove CO 2 from smokestacks<strong>and</strong> pump it deep underground into unminablecoal seams <strong>and</strong> ab<strong>and</strong>oned oil fields or inject it into thedeep ocean, as shown in Figure 21-18.There are several problems with this strategy.One is that current methods can remove only about30% of the CO 2 from smokestack emissions <strong>and</strong>would double or triple the cost of producing electricityby burning coal. The U.S. Department of Energyestimates that the cost of sequestering carbon dioxidein various underground <strong>and</strong> deep ocean repositorieswill have to be reduced at least 10-fold to make thisapproach economically feasible. In addition, injectinglarge quantities of CO 2 into the ocean could upset theglobal carbon cycle, seawater acidity, <strong>and</strong> some formsof deep-sea life in unpredictable ways.Some scientists have suggested that we add iron tothe oceans (especially in Antarctic waters) to stimulatethe growth of marine algae, which could remove moreCO 2 through photosynthesis. But the algae would returnit to the atmosphere a short time later when theydied unless the carbon is somehow deposited in thedeep ocean. Furthermore, we do not know the potentialeffects of applying large amounts of iron to theocean’s ecosystems.How Can Governments Reduce the Threatof Global Warming? Use Sticks <strong>and</strong> CarrotsGovernments can tax greenhouse gas emissions<strong>and</strong> energy use, increase subsidies <strong>and</strong> tax breaksfor saving energy <strong>and</strong> using renewable energy,<strong>and</strong> decrease subsidies <strong>and</strong> tax breaks for fossilfuels.Governments could use three major methods to promotethe solutions to slowing global warming listed inFigure 21-17. One is to phase in output-based carbontaxes on each unit of CO 2 emitted by fossil fuels (especiallycoal <strong>and</strong> gasoline) or input-based energy taxes oneach unit of fossil fuel (especially coal <strong>and</strong> gasoline)that is burned. Decreasing taxes on income, labor, <strong>and</strong>profits to offset increases in consumption taxes oncarbon emissions or fossil fuel use could help makesuch a strategy more politically acceptable.A second strategy is to level the economic playingfield by greatly increasing government subsidies forenergy-efficiency <strong>and</strong> carbon-free renewable-energytechnologies, carbon sequestration, <strong>and</strong> more sustainableagriculture, <strong>and</strong> by phasing out subsidies <strong>and</strong> taxbreaks for using fossil fuels.The third strategy is technology transfer. Governmentsof developed countries could fund the transferof energy-efficiency, carbon-free renewable-energy,http://biology.brookscole.com/miller14479
Figure 21-18 Solutions:methods for removingcarbon dioxide from theatmosphere or fromsmokestacks <strong>and</strong> storing(sequestering) it in plants,soil, deep undergroundreservoirs, <strong>and</strong> the deepocean.Oil rigTanker deliversCO 2 from plantto rigCoal powerplantTree plantationCO 2 is pumpeddown from rig fordeep ocean disposalAb<strong>and</strong>onedoil fieldSwitchgrassCrop fieldCO 2 is pumped down to reservoirthrough ab<strong>and</strong>oned oil fieldSpent oil reservoir isused for CO 2 depositcarbon-sequestration,<strong>and</strong> more sustainableagriculture technologiesto developingcountries. Increasingthe current tax on eachinternational currencytransaction by a quarterof a penny could financethis technology transfer, which would then generatewealth for developing countries.= CO 2 pumping= CO 2 depositHow Can We Use the Marketplaceto Reduce or Prevent Greenhouse GasEmissions? Emissions TradingEstablishing a global emissions trading programcould help reduce greenhouse gas emissions.An economic approach to slow global warming is toagree to global <strong>and</strong> national limits on greenhouse gasemissions <strong>and</strong> encourage industries <strong>and</strong> countries tomeet these limits by selling <strong>and</strong> trading greenhouse gasemission permits in the marketplace. This approachstimulates companies to develop new technologies toreduce greenhouse gas emissions <strong>and</strong> increase profits.In the United States, this market approach has beenused to reduce SO 2 emissions ahead of target goals at afraction of the projected cost (p. 453).In a greenhouse gas emissions trading program,industries <strong>and</strong> countries could earn greenhouse gasemission credits by improving energy efficiency,switching from coal to natural gas, <strong>and</strong> adopting certainfarming, ranching, <strong>and</strong> soil-building <strong>and</strong> conservationpractices. Credits could also be earned byswitching from coal <strong>and</strong> other fossil fuels to forms ofcarbon-free renewable energy such as solar, wind, hydrogen,<strong>and</strong> geothermal. For example, a coal-burningpower plant in Illinois could earn emission credits bybuilding a wind farm in Oregon.In addition, credits could be earned by sequesteringCO 2 from the atmosphere by reforestation or by injectingit into the deep ocean or secure undergroundreservoirs (Figure 21-18). For example, a coal-burningpower plant in Ohio might earn credits by financing aCO 2 -removing reforestation project in Costa Rica.Companies or countries that manage to producefewer emissions than their permits allowed could sellsome of their credits to other participants. As a result,participants that devise innovative ways to reducegreenhouse gas production are rewarded by increasedprofit. And participants that produce excess amountsof greenhouse gas face increased costs because they arefined or have to buy extra permits from participantswho have earned credits by reducing their emissions.Some analysts believe this market-based approachis more politically <strong>and</strong> economically feasible than relyingprimarily on government regulation to impose480 CHAPTER 21 Climate Change <strong>and</strong> Ozone Loss
taxes on carbon emissions or fuel used. Other analystspoint to some problems with emissions trading. One isthat carbon fuels are burned in so many homes, vehicles,factories, <strong>and</strong> crop fields that it would be difficultto monitor compliance. For that reason, many analyststhink that emissions trading programs should be usedin conjunction with other approaches, such as taxes onfossil fuel use, significant government subsidies for energyefficiency <strong>and</strong> renewable energy, <strong>and</strong> removal ofsubsidies for fossil fuels.Another problem is that it is politically difficult forthe world’s countries to agree on what should count ascredits or how any such credits should be dividedamong nations.Can We Afford to Reduce the Threatof Global Warming? Not Acting WillProbably Cost MoreIt will very likely cost us less to help slow <strong>and</strong>adapt to global warming now than to deal with itsharmful effects later.According to a 2001 study by the UN EnvironmentProgramme, projected global warming will cost theworld economy more than $300 billion annually by 2050($30 billion per year in the United States) unless nationsmake strong efforts to curb greenhouse gas emissions.According to a number of economic studies, implementingthe strategies listed in Figure 21-16 wouldboost the global <strong>and</strong> U.S. economy, provide muchneededjobs (especially in developing countries withlarge numbers of unemployed <strong>and</strong> underemployedpeople), <strong>and</strong> cost much less than trying to deal withthe harmful effects of these problems.However, according to some widely publicizedeconomic models developed by economist WilliamNordhaus <strong>and</strong> others, the projected costs of reducingCO 2 emissions will greatly exceed the projected benefits.Other economists criticize these models as beingunrealistic <strong>and</strong> too gloomy for two reasons. First, theydo not include the huge cost savings from implementingmany of the strategies listed in Figure 21-17 suchas improving energy efficiency. Second, they underestimatethe ability of the marketplace to act rapidlywhen money is to be made from reducing greenhousegas emissions.21-8 WHAT IS BEING DONE TOREDUCE GREENHOUSE GAS EMISSIONS?What Is the Kyoto Protocol? A ControversialInternational AgreementGetting countries to agree on reducing theirgreenhouse gas emissions is difficult.In December 1997, more than 2,200 delegates from 161nations met in Kyoto, Japan, to negotiate a treaty tohelp slow global warming. The resulting Kyoto Protocolwould require 39 developed countries to cut emissionsof CO 2 , CH 4 , <strong>and</strong> N 2 O to an average of about 5.2% below1990 levels by 2012. The initial steps of the protocolwere directed at these 39 countries because they areresponsible for a majority of the world’s CO 2 emissions(58% in 1999) <strong>and</strong> thus should take the lead inreducing their emissions.The protocol would not require poorer developingcountries to make cuts in their greenhouse gas emissionsuntil a later version of the treaty. It would also allowgreenhouse gas emissions trading among participatingcountries. By mid-2004, the Kyoto Protocol hadbeen ratified by more than 120 countries.Some climate analysts praise the Kyoto agreementas a small but important step in attempting to slowprojected global warming. But according to computermodels, the 5.2% reduction goal of the Kyoto Protocolwould shave only about 0.06°C (0.1°F) off the 0.7–1.7°C(1–3°F) temperature rise projected by 2060.In 2001, President George W. Bush withdrew U.S.participation from the Kyoto Protocol because he arguedthat it was too expensive <strong>and</strong> did not requireemissions reductions by developing countries such asChina <strong>and</strong> India that have large <strong>and</strong> increasing emissionsof greenhouse gases. This decision set off strongprotests by many scientists, citizens, <strong>and</strong> leadersthroughout most of the world who pointed out thatstrong leadership is needed by the United Statesbecause it has the highest total <strong>and</strong> per capita CO 2emissions of any country. According to most climateanalysts, the Kyoto Protocol will accomplish littlewithout the full participation of the United States,Russia, China, <strong>and</strong> India. However, Scott Barnett, anexpert on environmental treaties, believes that theKyoto Protocol is a badly thought out agreement thatwill not work.xHOW WOULD YOU VOTE? Should the United States participatein the Kyoto Protocol? Cast your vote online at http://biology.brookscole.com/miller14.How Can We Move Beyond the Kyoto ProtocolStalemate? Forging a New StrategyCountries could work together to develop anew international approach to slowing globalwarming.In 2004, Richard B. Stewart <strong>and</strong> Jonathan B. Wienerproposed that countries work together to develop anew strategy for slowing global warming.They urge the development of a new climatetreaty by the United States; China, India, Russia, <strong>and</strong>other major emitters among developing countries,http://biology.brookscole.com/miller14481
<strong>and</strong> Australia <strong>and</strong> any other developed countries notparticipating in the Kyoto Protocol. The treaty wouldinclude participation by developing countries, developan effective emissions trading program thatincludes developing countries omitted from such tradingby the Kyoto Protocol, set achievable targets for reducingemissions for each 10 of the next 40 years, <strong>and</strong>evaluate global <strong>and</strong> national strategies for adapting tothe harmful ecological <strong>and</strong> economic effects of globalwarming.Scott Bennett suggests starting again with a newapproach that sets technological goals <strong>and</strong> st<strong>and</strong>ards,not targets <strong>and</strong> timetables. This or other alternativenew approaches would allow the United States to providemuch-needed leadership on this important globalissue instead of being seen as a spoiler. Such a paralleltreaty could be used as a basis for overhauling theKyoto Protocol. Or countries participating in the protocolcould agree to join the new parallel treaty.What Are Some Countries, Businesses,States, <strong>and</strong> Cities Doing to Help DelayGlobal Warming? Good NewsMany countries, companies, cities, states, <strong>and</strong>provinces are reducing their greenhouse gas emissions,improving energy efficiency, <strong>and</strong> increasingtheir use of carbon-free renewable energy.Many countries are reducing their greenhouse gasemissions. For example, by 2000 Great Britain hadreduced its CO 2 emissions to its 1990 level, well aheadof its Kyoto target goal. It did this mostly by relyingmore on natural gas than on coal, improving energyefficiency in industry <strong>and</strong> homes, <strong>and</strong> reducing gasolineuse by raising its tax on gasoline. Between 2000<strong>and</strong> 2050, Great Britain aims to cut its CO 2 emissionsby 60%, mostly by improving energy efficiency <strong>and</strong> byrelying on renewable resources for 20% of its energyby 2030. To help accomplish this goal, the governmenthas greatly increased research <strong>and</strong> developmentspending for renewable energy <strong>and</strong> tax breaks for renewableenergy.According to a 2001 study by the Natural ResourcesDefense Council, China reduced its CO 2 emissionsby 17% between 1997 <strong>and</strong> 2000, a period duringwhich CO 2 emissions in the United States rose by 14%.The government did this by phasing out coal subsidies,shutting down inefficient coal-fired electricplants, speeding up its 20-year commitment to increaseenergy efficiency, <strong>and</strong> restructuring its economyto increase use of renewable energy resources.Agrowing number of major global companies,such as Alcoa, DuPont, IBM, Toyota, BP Amoco, <strong>and</strong>Shell, have established targets to reduce their greenhousegas emissions by 10–65% from 1990 levels by2010. For example, BP Amoco has already met goalsthat exceed those in the Kyoto Protocol at no net costto the company.Since 1990, governments in more than 500 citiesaround the world (including 110 in the United States)have established programs to reduce their greenhousegas emissions. What is your community doing?What Are Some Individuals <strong>and</strong> SchoolsDoing to Help Delay Global Warming?Change from the Bottom UpSome individuals <strong>and</strong> schools are reducingtheir greenhouse gas emissions, wasting lessenergy, <strong>and</strong> relying more on carbon-free renewableenergy.Each of us leaves a climate change legacy because atleast half the greenhouse gases emitted by our dailyactivities will still be in the troposphere a century fromnow. Good news. About 400,000 U.S. households arebuying carbon-free electricity from their utility companies.Figure 21-19 lists some things you can do to cutyour CO 2 emissions. How many of these things areyou doing?Some universities <strong>and</strong> colleges around the UnitedStates (<strong>and</strong> in some other countries) are taking steps toreduce CO 2 emissions. For example, students <strong>and</strong> facultyat Oberlin College in Ohio have asked their boardof trustees to reduce its CO 2 emissions to zero by 2020by buying renewable energy or producing its own.Twenty-five Pennsylvania colleges have joined to purchasewind power <strong>and</strong> other forms of carbon-free renewableenergy. What is your school doing to helpslow global warming?How Can We Prepare for Global Warming?Get Ready for ChangeAgrowing number of countries <strong>and</strong> cities arelooking for ways to cope with the harmful effectsof climate change.According to the latest global climate models, theworld needs to cut current emissions of greenhousegases (not just CO 2 ) by at least 50% by 2018 to stabilizeconcentrations of such gases in the air at their presentlevels. Such a large reduction in emissions is extremelyunlikely for political <strong>and</strong> economic reasons because itwould require rapid, widespread changes in industrialprocesses, energy sources, transportation options, <strong>and</strong>individual lifestyles.As a result, a growing number of climate analysts<strong>and</strong> economists suggest that we should also begin preparingfor the possible effects of long-term atmosphericwarming <strong>and</strong> climate change. Figure 21-20 shows someways to implement this adaptation strategy.482 CHAPTER 21 Climate Change <strong>and</strong> Ozone Loss
What Can You Do?Reducing CO 2 Emissions• Drive a fuel-efficient car, walk, bike, carpool, <strong>and</strong>use mass transit• Use energy-efficient windows• Use energy-efficient appliances <strong>and</strong> lights• Heavily insulate your house <strong>and</strong> seal all drafts• Reduce garbage by recycling <strong>and</strong> reuse• Insulate hot water heater• Use compact fluorescent bulbs• Plant trees to shade your house during summer• Set water heater no higher than 49°C (120°F)• Wash laundry in warm or cold water• Use low-flow shower headFigure 21-19 What can you do? Ways to reduce your annualemissions of CO 2 .Why Are Global Warming <strong>and</strong> ClimateChange Such Difficult <strong>Problems</strong> to Deal with?A Complex, Long-Term, <strong>and</strong> ControversialChallengeGlobal warming <strong>and</strong> climate change are hardto deal with because they have many causes (somepoorly understood); their effects are long-term <strong>and</strong>uneven; <strong>and</strong> there is controversy over how theyshould be addressedSeveral characteristics of global warming <strong>and</strong> climatechange pose difficult <strong>and</strong> often controversial scientific,economic, political, <strong>and</strong> ethical questions about how toaddress these threats.First, these problems have many complex <strong>and</strong> stillpoorly understood causes <strong>and</strong> effects. Second, they arelong-term problems. Elected officials who have to maketough decisions about dealing with these issues will belong gone when the beneficial or harmful effects oftheir actions occur. The long-term effects of climatechange also raise an important ethical question. Howmuch are we willing to change or sacrifice now for benefitsthat may not be realized in our lifetimes but couldgreatly benefit our children, gr<strong>and</strong>children, <strong>and</strong> theplants <strong>and</strong> animals that we share the planet with?Third the harmful <strong>and</strong> beneficial effects of climatechange are uneven. There will be winners <strong>and</strong> losers.Develop crops thatneed less waterWaste less waterConnect wildlifereserves with corridorsMove people awayfrom low-lyingcoastal areasMove hazardous material storagetanks away from coastStockpile 1- to 5-yearsupply of key foodsProhibit new constructionon low-lying coastal areasor build houses on stiltsExp<strong>and</strong> existingwildlife reservestoward polesFigure 21-20 Solutions:ways to prepare for thepossible long-term effectsof global warming.http://biology.brookscole.com/miller14483
Winning nations are less likely to bring about controversialchanges or spend large sums of money to slowdown something that will benefit them. The catch: Wedo not know which countries <strong>and</strong> parts of countrieswill be winners <strong>and</strong> losers until it is too late to avoidharmful effects.Fourth, reducing greenhouse gas emissions will takeunprecedented international respoinse to a global problemthat is of uncertain magnitude. And this must be doneusing political <strong>and</strong> economic systems not designed todeal with long-term threats.Because of these characteristics, you can see whyso many analysts believe that responding to this threatis one of the most important <strong>and</strong> challenging dilemmaswe face.21-9 OZONE DEPLETIONIN THE STRATOSPHEREWhat Is the Threat from Ozone Depletion?A Clear DangerLess ozone in the stratosphere will allow moreharmful UV radiation to reach the earth’s surface.A layer of ozone in the lower stratosphere (Figure 20-2,p. 434, <strong>and</strong> Figure 20-3, p. 435) keeps about 95% of thesun’s harmful ultraviolet (UV) radiation from reachingthe earth’s surface. Measuring instruments on balloons,aircraft, <strong>and</strong> satellites show considerable seasonaldepletion (thinning) of ozone concentrations inthe stratosphere above Antarctica <strong>and</strong> the Arctic. Similarmeasurements reveal a lower overall loss of stratosphericozone everywhere except over the tropics.Based on these measurements <strong>and</strong> on mathematical<strong>and</strong> chemical models, the overwhelming consensusof researchers in this field is that ozone depletion (thinning)in the stratosphere is a serious threat to humans,other animals, <strong>and</strong> some of the sunlight-driven primaryproducers (mostly plants) that support the earth’s food.What <strong>Causes</strong> Ozone Depletion? FromDream Chemicals to Nightmare ChemicalsWidespread use of a number of useful <strong>and</strong> longlivedchemicals has reduced ozone levels in thestratosphere.Thomas Midgley, Jr., a General Motors chemist, discoveredthe first chlorofluorocarbon (CFC) in 1930, <strong>and</strong>chemists developed similar compounds to create afamily of highly useful CFCs. The two most widelyused are CFC-11 (trichlorofluoromethane, CCl 3 F) <strong>and</strong>CFC-12 (dichlorodifluoromethane, CCl 2 F 2 ), known bytheir trade name, Freons.These chemically stable (nonreactive), odorless,nonflammable, nontoxic, <strong>and</strong> noncorrosive compoundsseemed to be dream chemicals. Inexpensive tomanufacture, they became popular as coolants in airconditioners <strong>and</strong> refrigerators (replacing toxic sulfurdioxide <strong>and</strong> ammonia), propellants in aerosol spraycans, cleaners for electronic parts such as computerchips, fumigants for granaries <strong>and</strong> ship cargo holds,<strong>and</strong> bubbles in plastic foam used for insulation <strong>and</strong>packaging. Between 1960 <strong>and</strong> the early 1990s, CFCproduction rose sharply.But it turned out that CFCs were too good tobe true. In 1974, calculations by chemists SherwoodRowl<strong>and</strong> <strong>and</strong> Mario Molina at the University ofCalifornia-Irvine indicated that CFCs were loweringthe average concentration of ozone in the stratosphere.They shocked both the scientific community <strong>and</strong> the$28-billion-per-year CFC industry by calling for an immediateban of CFCs in spray cans (for which substituteswere available).Rowl<strong>and</strong> <strong>and</strong> Molina’s research led them to fourmajor conclusions. First, CFCs remain in the tropospherebecause they are insoluble in water <strong>and</strong> chemicallyunreactive. Second, over 11–20 years these heavier-than-airchemicals are lifted into the stratospheremostly through convection, r<strong>and</strong>om drift, <strong>and</strong> the turbulentmixing of air in the troposphere.Third, once they reach the stratosphere, the CFCmolecules break down under the influence of highenergyUV radiation. This releases highly reactivechlorine atoms (Cl), as well as atoms of fluorine (F),bromine (Br) <strong>and</strong> Iodine (I), which accelerate thebreakdown of ozone (O 3 ) into O 2 <strong>and</strong> O in a cyclicchain of chemical reactions, one of which is shown inFigure 21-21. This causes ozone in various parts of thestratosphere to be destroyed faster than it is formed.Finally, each CFC molecule can last in the stratospherefor 65–385 years, depending on its type. Duringthat time, each chlorine atom released from these moleculescan convert hundreds of molecules of O 3 to O 2 .Overall, according to Rowl<strong>and</strong> <strong>and</strong> Molina’s calculations<strong>and</strong> later models <strong>and</strong> atmospheric measurementsof CFCs in the stratosphere, these dream moleculeshad turned into global ozone destroyers.The CFC industry (led by DuPont), a powerful,well-funded adversary with a lot of profits <strong>and</strong> jobs atstake, attacked Rowl<strong>and</strong> <strong>and</strong> Molina’s calculations<strong>and</strong> conclusions. The researchers held their ground,exp<strong>and</strong>ed their research, <strong>and</strong> explained the meaningof their calculations to other scientists, elected officials,<strong>and</strong> the media. After 14 years of delaying tactics,DuPont officials acknowledged in 1988 that CFCswere depleting the ozone layer <strong>and</strong> agreed to stop producingthem once they found substitutes.In 1995, Rowl<strong>and</strong> <strong>and</strong> Molina received the NobelPrize in chemistry for their work. In awarding theprize, the Royal Swedish Academy of Sciences saidthat they contributed to “our salvation from a globalenvironmental problem that could have catastrophicconsequences.”484 CHAPTER 21 Climate Change <strong>and</strong> Ozone Loss
Ultraviolet light hits a chlorofluorocarbon(CFC) molecule, such as CFCl 3 , breakingoff a chlorine atom <strong>and</strong> leaving CFCl 2 .Cl ClCClFClSunUV radiationOnce free, the chlorine atom is offto attack another ozone molecule<strong>and</strong> begin the cycle again.ClOOFigure 21-21 Natural capitaldegradation: simplified summaryof how chlorofluorocarbons (CFCs)<strong>and</strong> other chlorine-containing compoundscan destroy ozone in thestratosphere faster than it is formed.Note that chlorine atoms are continuouslyregenerated as they react withozone. Thus they act as catalysts,chemicals that speed up chemicalreactions without being used up bythe reaction. Bromine atoms releasedfrom bromine-containing compoundsthat reach the stratosphere also destroyozone by a similar mechanism.The chlorine atom attacksan ozone (O 3 ) molecule, pullingan oxygen atom off it<strong>and</strong> leaving an oxygen Omolecule (O 2 ).O OSummary of ReactionsCCl 3 F + UV Cl + CCl 2 FCl + O 3 ClO + O 2 RepeatedCl + O Cl + O 2 many timesClA free oxygen atom pullsthe oxygen atom offthe chlorine monoxidemolecule to form O 2.ClThe chlorine atom <strong>and</strong>the oxygen atom join toform a chlorine monoxidemolecule (ClO).What Other Chemicals Deplete StratosphericOzone? More CulpritsA number of chemicals can end up in the stratosphere<strong>and</strong> deplete ozone there for up to several hundredyears.CFCs are not the only ozone-depleting compounds(ODCs). Others are halons <strong>and</strong> hydrobromoflurocarbons(HBFCs) (used in fire extinguishers), methyl bromide(a widely used fumigant), hydrogen chloride (emittedinto the stratosphere by space shuttles), <strong>and</strong> cleaningsolvents such as carbon tetrachloride, methyl chloroform,n-propyl bromide, <strong>and</strong> hexachlorobutadiene.The oceans <strong>and</strong> occasional volcanic eruptions alsorelease chlorine compounds into the troposphere. Butmost of these do not make it to the stratosphere becausethey dissolve easily in water <strong>and</strong> wash out of thetroposphere in rain. Bromine compounds may be lesslikely to wash out of the troposphere, but further studyis needed to confirm this possibility. Measurements<strong>and</strong> models indicate that 75–85% of the observedozone losses in the stratosphere since 1976 are the resultof ozone-depleting chemicals released into the atmosphereby human activities beginning in the 1950s.What Happens to Ozone Levels over theEarth’s Poles Each Year? It Drops EachWinter <strong>and</strong> Spring.During four months of each year up to halfof the ozone in the stratosphere over Antarcticais depleted.OOOClIn 1984, researchers analyzingsatellite data discoveredOthat 40–50% of the ozone inOthe upper stratosphere overAntarctica disappeared duringthe Antarctic late winter<strong>and</strong> spring (August–November),especially since 1976 (Figure 21-22).Figure 21-23 (p. 486) shows the seasonal variationof ozone with altitude over Antarctica during2003. The observed loss of ozone above Antarctica oftenis called an ozone hole. A more accurate term isozone thinning because the ozone depletion varies withaltitude <strong>and</strong> location.The total area of the stratosphere above Antarcticathat suffers from ozone thinning during the peak seasonvaries from year to year <strong>and</strong> in some recent yearshas covered an area greater than that of North AmericaIn 2003, the area of thinning was the second largestsize ever.Measurements indicate that CFCs <strong>and</strong> other ODCsare the primary culprits. Each winter, steady windsblow in a circular pattern over the earth’s poles. Thiscreates a polar vortex: a huge swirling mass of very coldair that is isolated from the rest of the atmosphere untilthe sun returns a few months later.Total ozone (Dobson units)400350300250200150October monthly means1001955 1960 1965 1970 1975 1980 1985 1990 1995 2000 2005YearFigure 21-22 Mean total level of ozone for October over theHalley Bay measuring station in Antarctica, 1956–2003. (Datafrom British Antarctic Survey <strong>and</strong> World MeteorologicalOrganization)http://biology.brookscole.com/miller14485
3530August 6, 2003October 11, 2003When water droplets in clouds enter this circlingstream of extremely frigid air, they form tiny ice crystals.The surfaces of these ice crystals collect CFCs<strong>and</strong> other ozone depleting chemicals in the stratosphere,setting up conditions for the formation of ClO,the molecule most responsible for the seasonal loss ofozone over the Antarctic.When partial sunlight returns in October, the lightstimulates ClO molecules which reduce ozone (Figure21-21). Within weeks, this cyclic reaction typicallydestroys 40–50% of the ozone above Antarctica (100%in some places).As summer approaches <strong>and</strong> temperatures warm,the polar vortex begins to break up <strong>and</strong> mix again withthe rest of the atmosphere. Then new ozone forms overAntarctica until the next dark winter.When the vortex breaks up, huge masses ofozone-depleted air above Antarctica flow northward<strong>and</strong> linger for a few weeks over parts of Australia,New Zeal<strong>and</strong>, South America, <strong>and</strong> South Africa. Thisraises biologically damaging UV-B levels in these areasby 3–10%, <strong>and</strong> in some years as much as 20%.In 1988, scientists discovered that similar but usuallyless severe ozone thinning occurs in the stratosphereover the Arctic during the arctic spring <strong>and</strong>early summer (February–May), with a seasonal ozoneloss of 11–38% (compared to a typical 50% loss aboveAntarctica). When this mass of air above the Arcticbreaks up each spring, large masses of ozone-depletedair flow south to linger over parts of Europe, NorthAmerica, <strong>and</strong> Asia. In 2002, models indicated that theArctic is unlikely to develop the large-scale ozone thinningfound over the Antarctic. Unfortunately, however,according to a 1998 model developed by scientistsat NASA’s Goddard Institute for Space Studies,ozone depletion over the Antarctic <strong>and</strong> Arctic will beat its worst between 2010 <strong>and</strong> 2019.Altitude (kilometers)252015105Why Should We Be Worried about OzoneDepletion? Life in the Ultraviolet ZoneIncreased UV radiation reaching the earth’ssurface from ozone depletion in the stratosphere isharmful to human health, crops, forests, animals,<strong>and</strong> materials.Why should we care about ozone loss? Figure 21-24lists some of the expected effects of decreased levels of05 10 15Ozone partial pressure (millipascals)Figure 21-23 Seasonal variation of ozone level with altitudeover Antarctica during 2003. Note the severe depletion ofozone during October (during the Antarctic spring, red line)<strong>and</strong> its return to more normal levels in August (during theAntarctic winter, green line). (Data from National Oceanic <strong>and</strong>Atmospheric Administration)Natural Capital DegradationHuman Health• Worse sunburn• More eye cataracts• More skin cancersEffects of Ozone Depletion• Immune system suppressionFood <strong>and</strong> Forests• Reduced yields for some crops• Reduced seafood supplies from reduced phytoplankton• Decreased forest productivity for UV-sensitivetree speciesWildlife• Increased eye cataracts in some species• Decreased population of aquatic species sensitiveto UV radiation• Reduced population of surface phytoplankton• Disrupted aquatic food webs from reducedphytoplanktonAir Pollution <strong>and</strong> Materials• Increased acid deposition• Increased photochemical smog• Degradation of outdoor paints <strong>and</strong> plasticsGlobal Warming• Accelerated warming because of decreased oceanuptake of CO 2 from atmosphere by phytoplankton<strong>and</strong> CFCs acting as greenhouse gasesFigure 21-24 Natural capital degradation: Expected effectsof decreased levels of ozone in the stratosphere.486 CHAPTER 21 Climate Change <strong>and</strong> Ozone Loss
ozone in the stratosphere. From a human st<strong>and</strong>pointthe answer is that with less ozone in the stratosphere,more biologically damaging UV-A <strong>and</strong> UV-B radiationwill reach the earth’s surface. This will give humansworse sunburns, more eye cataracts (a clouding of theeye’s lens that reduces vision <strong>and</strong> can cause blindnessif not corrected), <strong>and</strong> more skin cancers (Figure 21-25<strong>and</strong> Connections, at right).Humans can make cultural adaptations to increasedUV radiation by staying out of the sun, protectingtheir skin with clothing, <strong>and</strong> applying sunscreens.However, plants <strong>and</strong> animals that help support us <strong>and</strong>other forms of life cannot make such changes exceptthrough biological evolution, a process that can take along time.Connections: What Cancer Are You MostLikely to Get? Look in the MirrorExposure to UV radiation is a major cause of skincancers.Research indicates that years of exposure to UV-B ionizingradiation in sunlight is the primary cause of squamouscell (Figure 21-25, left) <strong>and</strong> basal cell (Figure 21-25,center) skin cancers. Together these two types make up95% of all skin cancers. Typically there is a 15- to 40-year lag between excessive exposure to UV-B <strong>and</strong> developmentof these cancers.Caucasian children <strong>and</strong> adolescents who experienceonly one severe sunburn double their chances ofgetting these two types of cancers. Some 90–95% ofThis long-wavelength(low-energy) form of UVradiation causes aging ofthe skin, tanning, <strong>and</strong>sometimes sunburn. Itpenetrates deeply <strong>and</strong>may contribute to skincancer.UltravioletAUltravioletBThis shorter-wavelength (high-energy) formof UV radiation causes sunburn, prematureaging, <strong>and</strong> wrinkling. It is largely responsiblefor basal <strong>and</strong> squamous cell carcinomas<strong>and</strong> plays a role in malignant melanoma.Thin layer ofdead cellsHairSquamouscellsBasallayerMelanocytecellsBasalcellEpidermisSweatgl<strong>and</strong>DermisBloodvesselsSquamous Cell CarcinomaArising from cellsin the upper layerof the epidermis,this cancer is alsocaused by exposureto sunlight or tanninglamps. It is usuallycurable if treated early. It grows faster thanbasal cell carcinoma <strong>and</strong> can metastasize.Basal Cell CarcinomaThe most commonskin malignancyusually is causedby excessiveexposure to sunlightor tanning lamps.It develops slowly,rarely metastasizes <strong>and</strong> is nearly 100%curable if diagnosed early <strong>and</strong> treated properly.MelanomaThis deadliest ofskin cancersinvolves melanocytecells, which producepigment. It c<strong>and</strong>evelop from a moleor on blemishedskin, grows quickly, <strong>and</strong> can spread to otherparts of the body (metastasize).Figure 21-25 Structure of the human skin <strong>and</strong> the relationships between ultraviolet (UV-A <strong>and</strong> UV-B) radiation<strong>and</strong> the three types of skin cancer. (The Skin Cancer Foundation)http://biology.brookscole.com/miller14487
What Can You Do?Reducing Exposure to UV-Radiation• Stay out of the sun, especially between 10 A.M. <strong>and</strong> 3 P.M.• Do not use tanning parlors or sunlamps.• When in the sun, wear protective clothing <strong>and</strong> sun–glasses that protect against UV-A <strong>and</strong> UV-B radiation.• Be aware that overcast skies do not protect you.• Do not expose yourself to the sun if you are takingantibiotics or birth control pills.• Use a sunscreen with a protection factor of 15 or 25 ifyou have light skin.• Examine your skin <strong>and</strong> scalp at least once a month formoles or warts that change in size, shape, or color orsores that keep oozing, bleeding, <strong>and</strong> crusting over. Ifyou observe any of these signs, consult a doctorimmediately.Figure 21-26 What can you do? Ways to reduce your exposureto harmful UV radiation.these types of skin cancer can be cured if detectedearly enough, although their removal may leave disfiguringscars. These cancers kill 1–2% of their victims,which amounts to about 2,300 deaths in the UnitedStates each year.A third type of skin cancer, malignant melanoma(Figure 21-25, right), occurs in pigmented areas such asmoles anywhere on the body. Within a few months,this type of cancer can spread to other organs.It kills about one-fourth of its victims (most underage 40) within 5 years, despite surgery, chemotherapy,<strong>and</strong> radiation treatments. Each year it kills about100,000 people (including more than 7,400 Americans),mostly Caucasians. It can be cured if detected earlyenough, but recent studies show that some melanomasurvivors have a recurrence more than 15 years later.A 2003 study found that women who used tanningparlors once a month or more increased their chance ofdeveloping malignant melanoma by 55%. And a 2004study at Dartmouth College found that people usingtanning beds were 2.5 times more likely to developbasal cell carcinoma <strong>and</strong> 1.5 times more susceptible tosquamous cell carcinoma.Recent evidence suggests that about 90% of sunlight’smelanoma-causing effect may come from exposureto UV-A (which is not blocked by window glass)<strong>and</strong> 10% from UV-B. Tanning booth lights <strong>and</strong> sunlampsemit mostly UV-A. Some sunscreens provide littleor no protection from UV-A unless they containchemicals such as zinc oxide or avobenzene (alsocalled Parasol 1789). Read the fine print on the tube tosee if such chemicals are present.Evidence indicates that people (especially Caucasians)who experience three or more blistering sunburnsbefore age 20 are five times more likely to developmalignant melanoma than those who havenever had severe sunburns. About 10% of those whoget malignant melanoma have an inherited gene thatmakes them especially susceptible to the disease. Figure21-26 lists ways for you to protect yourself fromharmful UV radiation.21-10 PROTECTING THE OZONELAYERHow Can We Protect the Ozone Layer? Say NoTo reduce ozone depletion we must stop producingozone-depleting chemicals.The consensus of researchers in this field is thatwe should immediately stop producing all ozonedepletingchemicals. However, even with immediate<strong>and</strong> consistent action, models indicate it will takeabout 50 years for the ozone layer to return to 1980 levels<strong>and</strong> about 100 years for recovery to pre-1950 levels.Good news. Substitutes are available for most uses ofCFCs, <strong>and</strong> others are being developed (IndividualsMatter, at right).In 1987, representatives of 36 nations meeting inMontreal, Canada, developed a treaty, commonlyknown as the Montreal Protocol. Its goal was to cutemissions of CFCs (but not other ozone depleters) intothe atmosphere by about 35% between 1989 <strong>and</strong> 2000.After hearing more bad news about seasonal ozonethinning above Antarctica in 1989, representatives of 93countries met in London in 1990 <strong>and</strong> in Copenhagen,Denmark (1992), <strong>and</strong> adopted the Copenhagen Protocol,an amendment which accelerated the phasing out ofkey ozone-depleting chemicals.These l<strong>and</strong>mark international agreements, nowsigned by 177 countries, are important examples ofglobal cooperation in response to a serious global environmentalproblem. Without them, ozone depletionwould be a much more serious threat, as shown in Figure21-27. If nations continue to follow these treaties,ozone levels should return to 1980 levels by 2050 <strong>and</strong>1950 levels by 2100.However, according to a 1998 study by the WorldMeteorological Organization, ozone depletion in thestratosphere has been cooling the troposphere <strong>and</strong> hashelped offset or disguise as much as 30% of the globalwarming from our emissions of greenhouse gases.Thus restoring the ozone layer could lead to an increasein global warming. But the alternative is worse.<strong>Environmental</strong> choices such as these are not easy.488 CHAPTER 21 Climate Change <strong>and</strong> Ozone Loss
Abundance (parts per trillion)INDIVIDUALSMATTER15,00012,0009,0006,0003,000Ray Turner<strong>and</strong> His RefrigeratorRay Turner, an aerospace managerat Hughes Aircraft in California,made an important low-techozone-saving discovery by usinghis head—<strong>and</strong> his refrigerator.His concern for the environment led him to lookfor a cheap <strong>and</strong> simple substitute for the CFCsused as cleaning agents to remove films of oxidationfrom the electronic circuit boards manufacturedat his plant.He started by looking in his refrigerator. He decidedto put drops of various substances on a corrodedpenny to see whether any of them removedthe film of oxidation. Then he used his solderinggun to see whether solder would stick to the surfaceof the penny, indicating the film had beencleaned off.First, he tried vinegar. No luck. Then he triedsome ground-up lemon peel, also a failure. Next hetried a drop of lemon juice <strong>and</strong> watched as the soldertook hold. The rest, as they say, is history.Today, Hughes Aircraft uses inexpensive citrusbasedsolvents that are CFC-free to clean circuitboards. This new cleaning technique has reducedcircuit board defects by about 75% at Hughes. AndTurner got a hefty bonus. Now other companies,such as AT&T, clean computer boards <strong>and</strong> chipsusing acidic chemicals extracted from cantaloupes,peaches, <strong>and</strong> plums. Maybe you can find a solutionto an environmental problem in your refrigerator,grocery store, drugstore, or backyard.The ozone protocols set an important precedentfor global cooperation <strong>and</strong> action to avert potentialglobal disaster by using prevention to solve a serious environmentalproblem. Nations <strong>and</strong> companies agreedNo protocol1987MontrealProtocol01950 1975 2000 2025Year1992CopenhagenProtocol2050 2075Figure 21-27 Solutions: projected concentrations of ozonedepletingchemicals (ODCs) in the stratosphere under threescenarios: no action, the 1987 Montreal Protocol, <strong>and</strong> the1992 Copenhagen Protocol. (Data from World MeteorologicalOrganization)2100to work together to solve this problem for three reasons.First, there was convincing <strong>and</strong> dramatic scientificevidence of a serious problem. Second, CFCs wereproduced by a small number of international companies.Third, the certainty that CFC sales would declineover a period of years unleashed the economic <strong>and</strong> creativeresources of the private sector to find even moreprofitable substitute chemicals.The atmosphere is the key symbol of global interdependence.If we can’t solve some of our problems in the face of threatsto this global commons, then I can’t be very optimistic aboutthe future of the world.MARGARET MEADCRITICAL THINKING1. In preparation for the 1992 UN Conference on theHuman Environment in Rio de Janeiro, President GeorgeH. W. Bush’s top economic adviser gave an address inWilliamsburg, Virginia, to representatives of governmentsfrom a number of countries. He told his audiencenot to worry about global warming because the averagetemperature increases scientists are projecting weremuch less than the temperature increase he experiencedin coming from Washington, D.C., to Williamsburg,Virginia. What is the fundamental flaw in this reasoning?2. What changes might occur in (a) the global hydrologiccycle (Figure 4-28, p. 76) <strong>and</strong> (b) the global carbon cycle(Figure 4-29, p. 78) if the troposphere experiences significantwarming? Explain.3. What will be the likely effect of clearing forests <strong>and</strong>converting them to grassl<strong>and</strong>s <strong>and</strong> crops on (a) theearth’s reflectivity (albedo) <strong>and</strong> (b) the earth’s averagesurface temperature? Explain.4. One way to help slow the rate of CO 2 emissions is toreduce the clearing of forests—especially in developingcountries where intense deforestation is taking place.Should the United States <strong>and</strong> other developed countriespay poorer countries to stop cutting their forests? Explain.5. Of the three schools of thought on what should bedone about possible global warming (p. 478), which doyou favor? Explain.6. Of the proposals in Figure 21-17 (p. 479) for reducingemissions of greenhouse gas emissions into the troposphere,with which do you disagree? Why?7. Of the proposals in Figure 21-20 (p. 483) for preparingfor the effects of global warming, with which do you disagree?Why?8. What consumption patterns <strong>and</strong> other features ofyour lifestyle directly add greenhouse gases to the atmosphere?Which, if any, of these things would you be willingto give up to slow global warming <strong>and</strong> reduce otherforms of air pollution?http://biology.brookscole.com/miller14489
9. Congratulations! You are in charge of the world. Listyour three most important actions for dealing with theproblems of (a) global warming <strong>and</strong> (b) depletion ofozone in the stratosphere.PROJECTS1. As a class, conduct a poll of students at your school todetermine (a) whether they underst<strong>and</strong> the differencebetween global warming of the troposphere <strong>and</strong> ozonedepletion in the stratosphere (Table 21-2, p. 467) <strong>and</strong>(b) whether they believe global warming from an enhancedgreenhouse effect is a very serious problem, amoderately serious problem, or of little concern. Tally theresults to see whether there are differences related toeach poll participant’s year in school, political leaning(liberal, conservative, independent), <strong>and</strong> sex.2. As a class, conduct a poll of students at your school todetermine whether they believe stratospheric ozone depletionis a very serious problem, a moderately seriousproblem, or of little concern. Tally the results to seewhether there are differences related to each poll participant’syear in school, political leaning (liberal, conservative,independent), <strong>and</strong> sex.3. Use the library or the Internet to determine how thecurrent government policy on global warming in thecountry where you live compares with the policy suggestionsmade by various analysts <strong>and</strong> listed in Figures 21-17(p. 479) <strong>and</strong> 21-20 (p. 483).4. Write a 1- to 2-page scenario of what your life could belike by 2060 if nations, companies, <strong>and</strong> individuals donot take steps to reduce projected global warming causedat least partly by human activities. Contrast your scenariowith the positive scenario at the opening of thischapter. Compare <strong>and</strong> critique scenarios written by othermembers of your class.5. If you drive a car, calculate how much CO 2 it emitsper day by taking the number of miles you drive, multiplyingit by 20, <strong>and</strong> dividing the result by the number ofmiles per gallon your car gets. If you use the metric system,multiply the kilometers driven by the number ofliters of gasoline it takes to drive your car 100 kilometers<strong>and</strong> divide the result by 42 to get your daily CO 2 emissionsin kilograms. In either case, add another 20% to includethe CO 2 emitted in manufacturing the gasolineyou used. Compare your results with other members ofyour class.6. Use the library or the Internet to find bibliographic informationabout Paul A. Colinvaux <strong>and</strong> Margaret Mead,whose quotes appear at the beginning <strong>and</strong> end of thischapter.7. Make a concept map of this chapter’s major ideas, usingthe section heads, subheads, <strong>and</strong> key terms (in boldface).Look on the website for this book for informationabout making concept maps.LEARNING ONLINEThe website for this book contains study aids <strong>and</strong> manyideas for further reading <strong>and</strong> research. They include achapter summary, review questions for the entire chapter,flash cards for key terms <strong>and</strong> concepts, a multiple-choicepractice quiz, interesting Internet sites, references, <strong>and</strong> aguide for accessing thous<strong>and</strong>s of InfoTrac ® College Editionarticles. Log on tohttp://biology.brookscole.com/miller14Then click on the Chapter-by-Chapter area, choose Chapter21, <strong>and</strong> select a learning resource.490 CHAPTER 21 Climate Change <strong>and</strong> Ozone Loss
22 WaterPollutionWaterPollutionControlCASE STUDYLearning Nature’s Waysto Purify SewageSome communities <strong>and</strong> individuals are seeking betterways to purify sewage by working with nature. EcologistJohn Todd designs, builds, <strong>and</strong> operates innovativeecological wastewater treatment systems calledliving machines (Figure 22-1).This ecological purification process begins whensewage flows into a passive solar greenhouse or outdoorsites containing rows of large open tanks populatedby an increasingly complex series of organisms.In the first set of tanks, algae <strong>and</strong> microorganisms decomposeorganic wastes, with sunlight speeding upthe process. Water hyacinths, cattails, bulrushes, <strong>and</strong>other aquatic plants growing in the tanks take up theresulting nutrients.After flowing though several of these natural purificationtanks, the water passes through an artificialmarsh of s<strong>and</strong>, gravel, <strong>and</strong> bulrush plants to filter outalgae <strong>and</strong> remaining organic wastes. Some of theplants also absorb (sequester) toxic metals such aslead <strong>and</strong> mercury <strong>and</strong> secrete natural antibiotic compoundsthat kill pathogens.Next the water flows into aquarium tanks. Snails<strong>and</strong> zooplankton in these tanks consume microorganisms<strong>and</strong> are in turn consumed by crayfish, tilapia,<strong>and</strong> other fish that can be eaten or sold as bait. After10 days, the clear water flows into a second artificialmarsh for final filtering <strong>and</strong> cleansing.The water can be made pure enough to drink byexposing it to ultraviolet light or by passing it throughan ozone generator, usually immersed out of sight inan attractive pond or wetl<strong>and</strong> habitat. Selling the ornamentalplants, trees, <strong>and</strong> baitfish produced as byproductsof such living machines helps reduce costs.Operating costs are about the same as for a conventionalsewage treatment plant.Some communities <strong>and</strong> industries are workingwith nature by using natural <strong>and</strong> artificial wetl<strong>and</strong>sto purify wastewater, as discussed later in thischapter.Ocean Arks InternationalWater pollution is related to air pollution, l<strong>and</strong>usepractices, climate change, energy use, solid <strong>and</strong>hazardous waste, <strong>and</strong> the number of people, farms,<strong>and</strong> industries producing sewage <strong>and</strong> other wastes.These connections explain the need to solve waterpollution problems by integrating them with policiesfor the problems just listed. Otherwise, environmentalistswarn we will continue to shift environmentalproblems from one part of the environment toanother.Figure 22-1 Solution: Ecological wastewater purification by aliving machine. At the Providence, Rhode Isl<strong>and</strong>, Solar SewageTreatment Plant, biologist John Todd demonstrates how ecologicalwaste engineering in a greenhouse can be used to purifywastewater in an ecological process he invented. Todd <strong>and</strong> othersare conducting research to perfect solar-aquatic sewagetreatment systems based on working with nature.
Today everybody is downwind or downstream from somebodyelse.WILLIAM RUCKELSHAUSThis chapter addresses the following questions:■■■■■■What pollutes water, where do the pollutants comefrom, <strong>and</strong> what effects do they have?What are the major water pollution problems ofstreams <strong>and</strong> lakes?What causes groundwater pollution, <strong>and</strong> how canit be prevented?What are the major water pollution problems ofoceans?How can we prevent <strong>and</strong> reduce surface waterpollution?How safe is drinking water, <strong>and</strong> how can it bemade safer?22-1 TYPES, EFFECTS, AND SOURCESOF WATER POLLUTIONWhat Are the Major Types <strong>and</strong> Effects ofWater Pollutants? Unseen ThreatsInfectious bacteria, inorganic <strong>and</strong> organic chemicals,<strong>and</strong> excess heat pollute water.Water pollution is any chemical, biological, or physicalchange in water quality that has a harmful effect onliving organisms or that makes water unsuitable fordesired uses. Table 22-1 lists the major classes of waterpollutants along with their major human sources <strong>and</strong>harmful effects. Study this table carefully. Note that excessiveheat is considered a water pollutant.Table 22-2 lists some common diseases that can betransmitted to humans through drinking water contaminatedwith infectious agents. The World HealthOrganization (WHO) estimates that 3.4 million peopleTable 22-1Major Categories of Water PollutantsINFECTIOUS AGENTSExamples: Bacteria, viruses,protozoa, <strong>and</strong> parasiticwormsMajor Human Sources:Human <strong>and</strong> animal wastesHarmful Effects: DiseaseOXYGEN-DEMANDINGWASTESExamples: Organicwaste such as animalmanure <strong>and</strong> plant debris thatcan be decomposed byaerobic (oxygen-requiring)bacteriaMajor Human Sources:Sewage, animal feedlots, papermills, <strong>and</strong> food processingfacilitiesHarmful Effects: Large populationsof bacteria decomposingthese wastes can degradewater quality by depleting waterof dissolved oxygen. Thiscauses fish <strong>and</strong> other forms ofoxygen-consuming aquatic lifeto die.INORGANIC CHEMICALSExamples: Water-soluble(1) acids, (2) compounds oftoxic metals such as lead (Pb),arsenic (As), <strong>and</strong> selenium(Se), <strong>and</strong> (3) salts such assodium chloride (NaCl) inocean water <strong>and</strong> fluorides (F – )found in some soilsMajor Human Sources:Surface runoff, industrialeffluents, <strong>and</strong> householdcleansersHarmful Effects: Can(1) make fresh water unusablefor drinking or irrigation,(2) cause skin cancers <strong>and</strong>crippling spinal <strong>and</strong> neckdamage (F – ), (3) damage thenervous system, liver, <strong>and</strong> kidneys(Pb <strong>and</strong> As), (4) harm fish<strong>and</strong> other aquatic life, (5) lowercrop yields, <strong>and</strong> (6) acceleratecorrosion of metals exposed tosuch water.ORGANIC CHEMICALSExamples: Oil, gasoline, plastics,pesticides, cleaning solvents,detergentsMajor Human Sources: Industrialeffluents, householdcleansers, surface runoff fromfarms <strong>and</strong> yardsHarmful Effects: Can(1) threaten human health bycausing nervous systemdamage (some pesticides),reproductive disorders (somesolvents), <strong>and</strong> some cancers(gasoline, oil, <strong>and</strong> some solvents)<strong>and</strong> (2) harm fish <strong>and</strong>wildlife.PLANT NUTRIENTSExamples: Water-solublecompounds containing nitrate(NO 3– ), phosphate (PO 43–),<strong>and</strong> ammonium (NH 4+ )ionsMajor Human Sources:Sewage, manure, <strong>and</strong> runoffof agricultural <strong>and</strong> urbanfertilizersHarmful Effects: Can causeexcessive growth of algae <strong>and</strong>other aquatic plants, whichdie, decay, deplete water ofdissolved oxygen, <strong>and</strong> kill fish.Drinking water with excessivelevels of nitrates lowers theoxygen-carrying capacity ofthe blood <strong>and</strong> can kill unbornchildren <strong>and</strong> infants (“bluebabysyndrome”).SEDIMENTExamples: Soil, siltMajor Human Sources: L<strong>and</strong>erosionHarmful Effects: Can(1) cloud water <strong>and</strong> reducephotosynthesis, (2) disruptaquatic food webs, (3) carrypesticides, bacteria, <strong>and</strong> otherharmful substances, (4) settleout <strong>and</strong> destroy feeding <strong>and</strong>spawning grounds of fish, <strong>and</strong>(5) clog <strong>and</strong> fill lakes, artificialreservoirs, stream channels,<strong>and</strong> harbors.RADIOACTIVE MATERIALSExamples: Radioactiveisotopes of iodine, radon,uranium, cesium, <strong>and</strong>thoriumMajor Human Sources:Nuclear <strong>and</strong> coal-burningpower plants, mining <strong>and</strong>processing of uranium <strong>and</strong>other ores, nuclear weaponsproduction, natural sourcesHarmful Effects: Geneticmutations, miscarriages,birth defects, <strong>and</strong> certaincancersHEAT (THERMALPOLLUTION)Examples: Excessive heatMajor Human Sources:Water cooling of electricpower plants <strong>and</strong> some typesof industrial plants. Almosthalf of all water withdrawn inthe United States each year isfor cooling electric powerplants.Harmful Effects: Lowersdissolved oxygen levels <strong>and</strong>makes aquatic organismsmore vulnerable to disease,parasites, <strong>and</strong> toxic chemicals.When a power plantfirst opens or shuts downfor repair, fish <strong>and</strong> otherorganisms adapted to aparticular temperature rangecan be killed by the abruptchange in water temperature—knownas thermalshock.492 CHAPTER 22 Water Pollution
Table 22-2 Common Diseases Transmitted to Humans Through Contaminated Drinking WaterType of Organism Disease EffectsBacteria Typhoid fever Diarrhea, severe vomiting, enlarged spleen, inflamed intestine; often fatal if untreatedCholeraDiarrhea, severe vomiting, dehydration; often fatal if untreatedBacterial dysentery Diarrhea; rarely fatal except in infants without proper treatmentEnteritisSevere stomach pain, nausea, vomiting; rarely fatalViruses Infectious hepatitis Fever, severe headache, loss of appetite, abdominal pain, jaundice, enlarged liver;rarely fatal but may cause permanent liver damageParasitic protozoa Amoebic dysentery Severe diarrhea, headache, abdominal pain, chills, fever; if not treated can cause liverabscess, bowel perforation, <strong>and</strong> deathGiardiasisDiarrhea, abdominal cramps, flatulence, belching, fatigueParasitic worms Schistosomiasis Abdominal pain, skin rash, anemia, chronic fatigue, <strong>and</strong> chronic general ill healthdie prematurely each year from waterborne diseases.This means that during your lunch hour about 400 peopledied from such diseases. Each year, diarrhea alonekills about 1.9 million people—about 90% of them childrenunder 5 in developing countries. The number ofchildren killed by largely preventable diarrhea in thepast 10 years is greater than the number of peoplekilled in all armed conflicts since World War II.In the United States, an estimated 1.5 millionpeople a year become ill from infectious agents foundin water <strong>and</strong> food. For example, in 1993 a protozoanparasite called Cryptosporidium contaminated the publicdrinking water supply in Milwaukee, Wisconsin.About 370,000 people developed severe diarrhea <strong>and</strong>at least 100 people with weakened immune systemsdied.colonies per 100 milliliters. By contrast, raw sewagemay contain several million coliform bacterial coloniesin 100 milliliters of water.When dangerous levels of fecal coliform bacteriaare detected scientists try to determine whether thesource is from humans, various types of livestock, orwild animals such as birds or raccoons. A new field ofscience called bacterial source tracking (BST) uses molecularbiology techniques to determine subtle differencesin strains of E. coli based on their animal host.How Do We Measure Water Quality? Biology<strong>and</strong> Chemistry in ActionScientists monitor water quality by using bacterialcounts, chemical analysis, <strong>and</strong> indicator organisms.Scientists use a number of biological <strong>and</strong> chemicalmethods to measure water quality. One involves measuringthe number of colonies of fecal coliform bacteria(such as various strains of Escherichia coli) present in awater sample (Figure 22-2). Various strains of thesebacteria live in the colon or intestines of humans <strong>and</strong>other animals <strong>and</strong> thus are present in their fecalwastes. Although most strains of coliform bacteria donot cause disease, their presence indicates that waterhas been exposed to human or animal wastes that arelikely to contain disease-causing agents.To be considered safe for drinking, water shouldcontain no colonies of coliform bacteria in a sample of100 milliliters (about 1/2 cup). To be considered safefor swimming, it should have no more than 200Figure 22-2 Fecal coliform bacteria test is used to indicate thelikely presence of disease-causing bacteria in water. It is carriedout by passing a water sample through a filter, placing thefilter disk on a growth medium that supports coliform bacteria(such as E. coli) for 24 hours, <strong>and</strong> then counting the number ofcolonies of coliform bacteria (shown as clumps in the figure).http://biology.brookscole.com/miller14493
WaterQualityGoodSlightlypollutedModeratelypollutedHeavilypollutedGravelypollutedDO (ppm) at 20°CBelow 4.5Below 44.5–6.76.7–8Figure 22-3 Water quality <strong>and</strong> dissolved oxygen (DO) contentin parts per million (ppm) at 20°C (68°F). Only a few fishspecies can survive in water with less than 4 ppm of dissolvedoxygen at this temperature.8–9The level of dissolved oxygen is related to theamount of oxygen-dem<strong>and</strong>ing wastes, so called becausethey are broken down by oxygen-requiringbacteria, <strong>and</strong> plant nutrients in a sample of water (Figure22-3). Scientists also measure the biological oxygendem<strong>and</strong> (BOD), the amount of dissolved oxygen consumedby aquatic decomposers.They also use chemical analysis to determine thepresence <strong>and</strong> concentrations of inorganic <strong>and</strong> organicchemicals that pollute water. They measure sedimentcontent by evaporating the water in a sample <strong>and</strong>weighing the resulting sediment. Suspended sedimentclouds water. Scientists use an instrument called a colorimeterto measure the turbidity or clarity (transparency)of a water sample.Scientists can also monitor water pollution by usingliving organisms as indicator species. For example,they remove aquatic plants such as cattails <strong>and</strong>analyze them to determine pollution in areas contaminatedwith fuels, solvents, <strong>and</strong> other organic chemicals.Bottom-dwelling species such as mussels thatfeed by filtering water through their bodies can also beanalyzed to determine water quality.Genetic engineers are working to develop bacteria<strong>and</strong> yeasts (single-celled fungi) that fluoresce or glowin the presence of specific pollutants such as toxicheavy metals in the ocean, toxins in the air from chemicalweapons, <strong>and</strong> carcinogens in food. This developmentof biomonitors or biosensors is a rapidly growingfield that might interest you as a career choice.What Are Point <strong>and</strong> Nonpoint Sourcesof Water Pollution? Concentrated <strong>and</strong> DiffuseSourcesWater pollution can come from single sources or avariety of dispersed sources.Point sources discharge pollutants at specific locationsthrough drain pipes, ditches, or sewer lines into bodiesof surface water (Figure 22-4). Examples includefactories, sewage treatment plants (which removesome but not all pollutants), underground mines, <strong>and</strong>oil tankers.NONPOINT SOURCESRural homesUrban streetsCropl<strong>and</strong>Animal feedlotSuburb<strong>and</strong>evelopmentPOINTSOURCESFactoryWastewatertreatmentplantFigure 22-4 Natural capital degradation:point <strong>and</strong> nonpoint sources of water pollution.It is much easier to identify <strong>and</strong> controlpoint sources than more dispersednonpoint sources.494 CHAPTER 22 Water Pollution
Because point sources are at specific places, theyare easy to identify, monitor, <strong>and</strong> regulate. Most developedcountries control point-source discharges ofmany harmful chemicals into aquatic systems. Butthere is little control of such discharges in most developingcountries.Nonpoint sources are scattered <strong>and</strong> diffuse <strong>and</strong>cannot be traced to any single site of discharge (Figure22-4). Examples include acid deposition <strong>and</strong> runoffof chemicals into surface water from cropl<strong>and</strong>s, livestockfeedlots, logged forests, urban streets, lawns, golfcourses, <strong>and</strong> parking lots. There has been little progressin controlling water pollution from nonpoint sourcesbecause of the difficulty <strong>and</strong> expense of identifying<strong>and</strong> controlling discharges from so many diffusesources.What Are the Major Sources of WaterPollution? Supplying Food <strong>and</strong> GoodsThe leading sources of water pollution areagriculture, industries, <strong>and</strong> mining.Agricultural activities are by far the leading cause ofwater pollution. Sediment eroded from agriculturall<strong>and</strong>s <strong>and</strong> overgrazed rangel<strong>and</strong> is the largest source.Other major agricultural pollutants include fertilizers<strong>and</strong> pesticides, bacteria from livestock <strong>and</strong> food processingwastes, <strong>and</strong> excess salt from soils of irrigatedcropl<strong>and</strong>.Industrial facilities are another large source of waterpollution. Mining is a third source. Surface miningdisturbs the earth’s surface, creating a major source oferoded sediments <strong>and</strong> runoff of toxic chemicals. Acidiccompounds draining from active <strong>and</strong> ab<strong>and</strong>oned subsurface<strong>and</strong> surface mines into streams can kill fish<strong>and</strong> other aquatic life (Figure 16-14, p. 344).Is the Water Safe to Drink? For Mostbut Not AllOne of every five people in the world lack accessto safe drinking water.Good news. About 95% of the people in developedcountries <strong>and</strong> 74% of those in developing countrieshave access to clean drinking water.Bad news. According to the WHO, about 1.4 billionpeople in developing countries do not have access toclean drinking water. As a result, each day about 9,300people die prematurely from infectious diseasesspread by contaminated water or the lack of water foradequate hygiene.The United Nations estimates it would cost about$23 billion a year over 8–10 years to bring low-cost safewater <strong>and</strong> sanitation to the people in the world whodo not have it. If developed countries paid half of thatcost, it would amount to an average of $19 a year foreach person in such countries.Connections: How Might Projected ClimateChange Affect Water Quality? MorePollutionIn a warmer world, too much rain <strong>and</strong> too little raincan increase water pollution.Global warming projections include changes in precipitation:some areas will get much more precipitation<strong>and</strong> other areas will get less. A moisture-laden atmospheregenerates more intense downpours, which canflush more harmful chemicals, plant nutrients, <strong>and</strong> microorganismsinto waterways. Massive flooding canspread disease-carrying pathogens by contaminatingwater treatment facilities <strong>and</strong> wells. It can also causelagoons that store animal wastes, as well sewer linesthat carry both sewage <strong>and</strong> storm runoff, to overflow<strong>and</strong> release raw sewage into rivers <strong>and</strong> streams.Prolonged drought can reduce river flows that dilutewastes. It can also spread infectious diseases morerapidly among people who lack enough water to stayclean. Warmer water temperatures can threatenaquatic life by reducing dissolved oxygen levels, <strong>and</strong>can increase the growth rates of populations of harmfulbacteria.22-2 POLLUTION OF FRESHWATERSTREAMSWhat Are the Water Pollution <strong>Problems</strong>of Streams? Pollution Overload <strong>and</strong>Low FlowFlowing streams can recover from a moderate levelof degradable water pollutants if their flows are notreduced.Rivers <strong>and</strong> other flowing streams can recover rapidlyfrom moderate levels of degradable, oxygen-dem<strong>and</strong>ingwastes <strong>and</strong> excess heat through a combination ofdilution <strong>and</strong> biodegradation of such wastes by bacteria.But this natural recovery process does not workwhen streams are overloaded with pollutants or whendrought, damming, or water diversion for agriculture<strong>and</strong> industry reduce their flows. Also, these natural dilution<strong>and</strong> biodegradation processes do not eliminateslowly degradable <strong>and</strong> nondegradable pollutants.In a flowing stream, the breakdown of degradablewastes by bacteria depletes dissolved oxygen <strong>and</strong> createsan oxygen sag curve (Figure 22-5, p. 496). This reducesor eliminates populations of organisms withhigh oxygen requirements until the stream is cleansedof wastes.http://biology.brookscole.com/miller14495
Types oforganismsDissolvedoxygen(ppm)Normal clean water organisms(Trout, perch, bass,mayfly, stonefly)Trash fish(carp, gar,leeches)Fish absent,fungi, sludgeworms,bacteria(anaerobic)Trash fish(carp, gar,leeches)Normal clean water organisms(Trout, perch, bass,mayfly, stonefly)8 ppm 8 ppmBiologicaloxygendem<strong>and</strong>Decomposition Septic Zone RecoveryZoneZoneClean Zone Clean ZoneFigure 22-5 Natural capital: dilution <strong>and</strong> decay of degradable, oxygen-dem<strong>and</strong>ing wastes <strong>and</strong> heat in astream, showing the oxygen sag curve (blue) <strong>and</strong> the curve of oxygen dem<strong>and</strong> (red). Depending on flow rates<strong>and</strong> the amount of pollutants, streams recover from oxygen-dem<strong>and</strong>ing wastes <strong>and</strong> heat if they are givenenough time <strong>and</strong> are not overloaded.The depth <strong>and</strong> width of the oxygen sag curve <strong>and</strong>thus the time <strong>and</strong> distance needed for a stream to recoverdepend on several factors. They include the volumeof incoming degradable wastes <strong>and</strong> the stream’svolume, flow rate, temperature, <strong>and</strong> pH level. Similaroxygen sag curves can be plotted when heated waterfrom industrial <strong>and</strong> power plants is discharged intostreams.What Have Developed Countries Doneto Reduce Stream Pollution? Good <strong>and</strong>Bad NewsMost developed countries have sharply reducedpoint-source pollution, but toxic chemicals <strong>and</strong>pollution from nonpoint sources are still problems.Water pollution control laws enacted in the 1970s havegreatly increased the number <strong>and</strong> quality of wastewatertreatment plants in the United States <strong>and</strong> mostother developed countries. Such laws also require industriesto reduce or eliminate point-source dischargesinto surface waters.These efforts have enabled the United States tohold the line against increased pollution by diseasecausingagents <strong>and</strong> oxygen-dem<strong>and</strong>ing wastes in mostof its streams. This is an impressive accomplishmentgiven the rise in the country’s economic activity, resourceconsumption, <strong>and</strong> population since passage ofthese laws.One success story is the cleanup of Ohio’s CuyahogaRiver. It was so polluted that in 1959 <strong>and</strong> again in1969 it caught fire <strong>and</strong> burned for several days as itflowed through Clevel<strong>and</strong>. The highly publicized imageof this burning river prompted elected officials toenact laws limiting the discharge of industrial wastesinto the river <strong>and</strong> sewage systems <strong>and</strong> provide funds toupgrade sewage treatment facilities. Today the river iscleaner <strong>and</strong> is widely used by boaters <strong>and</strong> anglers. Thisaccomplishment illustrates the power of bottom-uppressure by citizens to spur elected officials to change aseverely polluted river into an economically <strong>and</strong> ecologicallyvaluable public resource. Individuals matter!Another spectacular cleanup occurred in GreatBritain. In the 1950s, the Thames River was little morethan a flowing anaerobic sewer. Now, after more than45 years of effort <strong>and</strong> hundreds of millions of dollarsspent by British taxpayers <strong>and</strong> private industry, theThames has made a remarkable recovery. Commercialfishing is thriving <strong>and</strong> the number of fish species hasincreased 20-fold since 1960. In addition, many speciesof waterfowl <strong>and</strong> wading birds have returned to theirformer feeding grounds.There is also some bad news. Large fish kills <strong>and</strong>drinking water contamination still occur in parts of de-496 CHAPTER 22 Water Pollution
veloped countries. Two causes of these problems areaccidental or deliberate releases of toxic inorganic <strong>and</strong>organic chemicals by industries or mines <strong>and</strong> malfunctioningsewage treatment plants. A third cause is nonpointrunoff of pesticides <strong>and</strong> excess plant nutrientsfrom cropl<strong>and</strong> <strong>and</strong> animal feedlots.What Have Developing Countries Done to ReduceStream Pollution? Little ProgressStream pollution in most developing countries is a serious<strong>and</strong> growing problem.Available data indicate that stream pollution from dischargesof untreated sewage <strong>and</strong> industrial wastes is aserious <strong>and</strong> growing problem in most developingcountries. According to a 2003 report by the WorldCommission on Water in the 21st Century, half of theworld’s 500 major rivers are heavily polluted, most ofthem running through developing countries. Most ofthese countries cannot afford to build waste treatmentplants <strong>and</strong> do not have or do not enforce laws for controllingwater pollution.Industrial wastes <strong>and</strong> sewage pollute more thantwo-thirds of India’s water resources (Case Study, below)<strong>and</strong> 54 of the 78 streams monitored in China.Only about 10% of the sewage produced in Chinesecities is treated. In Latin America <strong>and</strong> Africa, moststreams passing through urban or industrial areas sufferfrom severe pollution.Case Study: India’s Ganges River: Religion,Poverty, <strong>and</strong> HealthReligious beliefs, cultural traditions, poverty, littleeconomic development, <strong>and</strong> a large populationinteract to cause severe pollution of the Ganges Riverin India.To India’s Hindu people, the Ganges is a holy river.Each day more than 1 million Hindus bathe or take a“holy dip” in the river. Many people also drink its water<strong>and</strong> use it to wash their clothes.Bad news. The Ganges is highly polluted. About350 million people—one-third of the country’s population—livein the Ganges River basin. Very little of thesewage produced by these people <strong>and</strong> by the industries<strong>and</strong> 29 large cities in the basin is treated.This situation is complicated by the Hindu beliefin cremating the dead to free the soul <strong>and</strong> throwing theashes in the holy Ganges to increase the chances of thesoul getting into heaven. Traditionally, wood firesburn most bodies in the open air. This creates air pollution<strong>and</strong> helps deplete India’s forests.It also causes water pollution because many peoplecannot afford enough wood for cremation. As a result,many bodies are dumped into the river withoutcremation or are only partially burned. Decompositionof these bodies depletes dissolved oxygen <strong>and</strong> addsdisease-carrying bacteria <strong>and</strong> viruses to the water. Thisproblem is expected to get worse because about 19million people are added to India’s population eachyear—about a third of them to the Ganges River basin.Good news. The Indian government has launched aplan to help clean up the river. It involves buildingwaste treatment plants in the basin’s 29 large cities <strong>and</strong>constructing 32 electric crematoriums along the banksof the river that can burn bodies more efficiently <strong>and</strong> at alower cost than wood cremation. The government alsointroduced 25,000 snapping turtles to devour corpses.Bad news. Most of the sewage treatment plants arenot completed or do not work very well <strong>and</strong> only afew of the crematoriums have been completed. Thereis also concern that many Hindus will not ab<strong>and</strong>on thetraditional ritual of wood cremation or will not be ableto afford any type of cremation.This situation shows how religious <strong>and</strong> culturalconditions <strong>and</strong> poverty can affect environmental problems<strong>and</strong> solutions to such problems.22-3 POLLUTION OF FRESHWATERLAKESWhy Are Lakes <strong>and</strong> Reservoirs More Vulnerableto Pollution than Most Streams? Too LittleFlow <strong>and</strong> MixingDilution of pollutants in lakes is less effective than inmost streams because most lake water is not mixedwell <strong>and</strong> has little flow.In lakes <strong>and</strong> reservoirs, dilution of pollutants often isless effective than in streams for two reasons. One isthat lakes <strong>and</strong> reservoirs often contain stratified layersthat undergo little vertical mixing. The other is thatthey have little flow. The flushing <strong>and</strong> changing of waterin lakes <strong>and</strong> large artificial reservoirs can take from1 to 100 years, compared with several days to severalweeks for streams.This means that lakes <strong>and</strong> reservoirs are more vulnerablethan streams to contamination by runoff ordischarge of plant nutrients, oil, pesticides, <strong>and</strong> toxicsubstances such as lead, mercury, <strong>and</strong> selenium. Thesecontaminants can kill bottom life <strong>and</strong> fish <strong>and</strong> birdsthat feed on contaminated aquatic organisms. Manytoxic chemicals <strong>and</strong> acids also enter lakes <strong>and</strong> reservoirsfrom the atmosphere.As they pass through food webs in lakes, the concentrationsof some chemicals can be biologically magnified.Examples include DDT (Figure 19-4, p. 411),PCBs (Figure 22-6, p. 498), some radioactive isotopes,<strong>and</strong> some mercury compounds.http://biology.brookscole.com/miller14497
Figure 22-6 Biological magnificationof PCBs (polychlorinated biphenyls)in an aquatic food chain in theGreat Lakes. Most of the 209 differentPCBs are insoluble in water,soluble in fats, <strong>and</strong> resistant to biological<strong>and</strong> chemical degradation—properties that result in their accumulationin the tissues of organisms<strong>and</strong> their biological amplification infood chains <strong>and</strong> webs. Although thelong-term health effects on peopleexposed to low levels of PCBs areunknown, high doses of PCBs in laboratoryanimals produce liver <strong>and</strong>kidney damage, gastric disorders,birth defects, skin lesions, hormonalchanges, smaller penis size, <strong>and</strong>tumors. Boys in Taiwan exposed toPCBs while in their mothers’ wombsdeveloped abnormally smallpenises. In the United States, manufacture<strong>and</strong> use of PCBs have beenbanned since 1976. Before then,millions of metric tons of these longlivedchemicals were released intothe environment. Many of them stillexist in bottom sediments of lakes,streams, <strong>and</strong> oceans.Phytoplankton0.0025 ppmWater0.000002 ppmHerring gull eggs124 ppmHerring gull124 ppmZooplankton0.123 ppmLake trout4.83 ppmRainbow smelt1.04 ppmWhat Is Cultural Eutrophication <strong>and</strong>How Can It Be Reduced? Too Muchof a Good ThingVarious human activities can overload lakes withplant nutrients, which decrease dissolved oxygen<strong>and</strong> kill some aquatic species.Eutrophication is the name given to the natural nutrientenrichment of lakes, mostly from runoff of plantnutrients such as nitrates <strong>and</strong> phosphates from surroundingl<strong>and</strong>. Over time, some lakes become moreeutrophic (Figure 7-17, right, p. 139), but others do notbecause of differences in the surrounding drainagebasins.An increase in plant nutrients can be beneficial topopulations of floating phytoplankton that feedaquatic organisms. In turn, this can increase thegrowth rate <strong>and</strong> abundance of some fish <strong>and</strong> other desirablespecies.But excessive inputs of nutrients can upsetaquatic ecosystems. Near urban or agricultural areas,human activities can greatly accelerate the input ofplant nutrients to a lake. This process is called culturaleutrophication. It is mostly nitrate- <strong>and</strong> phosphatecontainingeffluents from various sources that causesuch a change (Figure 22-7).During hot weather or drought, this nutrient overloadproduces dense growths or “blooms” of organismssuch as algae <strong>and</strong> cyanobacteria <strong>and</strong> thickgrowths of water hyacinths, duckweed, <strong>and</strong> otheraquatic plants. These dense colonies of plant life can reducelake productivity <strong>and</strong> fish growth by decreasingthe input of solar energy needed for photosynthesis.In addition, when the algae die, their decompositionby swelling populations of aerobic bacteria depletesdissolved oxygen in the surface layer of waternear the shore <strong>and</strong> in the bottom layer. This oxygen depletioncan kill fish <strong>and</strong> other aerobic aquatic animals. Ifexcess nutrients continue to flow into a lake, anaerobicbacteria take over <strong>and</strong> produce gaseous decompositionproducts such as smelly, highly toxic hydrogen sulfide<strong>and</strong> flammable methane.According to the U.S. <strong>Environmental</strong> ProtectionAgency (EPA), about one-third of the 100,000 mediumto large lakes <strong>and</strong> about 85% of the large lakes near majorpopulation centers in the United States have some498 CHAPTER 22 Water Pollution
Nitrogen compoundsproduced by cars<strong>and</strong> factoriesDischarge of untreatedmunicipal sewage(nitrates <strong>and</strong> phosphates)Discharge ofdetergents(phosphates)Natural runoff(nitrates <strong>and</strong>phosphates)Inorganic fertilizer runoff(nitrates <strong>and</strong> phosphates)Discharge of treatedmunicipal sewage(primary <strong>and</strong> secondarytreatment: nitrates<strong>and</strong> phosphates)Dissolving ofnitrogen oxides(from internal combustionengines <strong>and</strong> furnaces)Lake ecosystemnutrient overload<strong>and</strong> breakdown ofchemical cyclingManure runofffrom feedlots(nitrates, phosphates,ammonia)Runoff from streets,lawns, <strong>and</strong> constructionlots (nitrates <strong>and</strong>phosphates)Runoff <strong>and</strong> erosion(from cultivation,mining, construction,<strong>and</strong> poor l<strong>and</strong> use)Figure 22-7 Natural capital degradation: principal sources of nutrient overload causing cultural eutrophicationin lakes <strong>and</strong> coastal areas. The amount of nutrients from each source varies according to the types <strong>and</strong>amounts of human activities occurring in each airshed <strong>and</strong> watershed. The enlarged populations of algae <strong>and</strong>plants (stimulated by increased nutrient input) die. Then their decomposition by aerobic bacteria lowers levelsof dissolved oxygen. This can kill fish <strong>and</strong> other aquatic life <strong>and</strong> reduce biodiversity <strong>and</strong> the aesthetic <strong>and</strong>recreational value of the lake.degree of cultural eutrophication. One-fourth of thelakes in China also suffer from cultural eutrophication.Cultural eutrophication also occurs in marineecosystems, especially in coastal waters <strong>and</strong> partiallyenclosed estuaries <strong>and</strong> bays. It also affects enclosedseas, such as the Mediterranean, Baltic, <strong>and</strong> Black Seas.There are several ways to prevent or reduce culturaleutrophication. They include using advanced (but expensive)waste treatment systems to remove nitrates<strong>and</strong> phosphates before wastewater enters lakes, banningor limiting the use of phosphates in householddetergents <strong>and</strong> other cleaning agents, <strong>and</strong> using soilconservation <strong>and</strong> l<strong>and</strong>-use control to reduce nutrientrunoff.There are also several ways to clean up lakes sufferingfrom cultural eutrophication. Examples are mechanicallyremoving excess weeds, controlling undesirableplant growth with herbicides <strong>and</strong> algicides,<strong>and</strong> pumping air through lakes <strong>and</strong> reservoirs to avoidoxygen depletion (an expensive <strong>and</strong> energy-intensivemethod).As usual, pollution prevention is more effective<strong>and</strong> usually is cheaper in the long run than cleanup.Good news. If excessive inputs of plant nutrients arestopped, a lake can usually return to its previous state(see the two case studies that follow).Case Study: Lake Washington—A SuccessStoryLake Washington near Seattle has recovered from severecultural eutrophication.Lake Washington in the metropolitan area of Seattle isa success story of recovery from severe cultural eutrophicationcaused by decades of sewage <strong>and</strong> otherinputs.Recovery took place within about 4 years after thesewage was diverted into the nearby Puget Sound.This worked for three reasons. First, a large body ofwater (Puget Sound) with a rapid rate of exchange involvingPacific Ocean waters was available to receive<strong>and</strong> dilute the sewage wastes. Second, the lake had notyet filled with weeds <strong>and</strong> sediment, because of itslarge size <strong>and</strong> depth. Third, preventive action wastaken before the lake had become a shallow, highly eutrophiclake. Today, the lake’s water quality is good.http://biology.brookscole.com/miller14499
Bad news. Now the Puget Sound is in trouble. Thereis growing concern about increased urban runoffcaused by the area’s rapidly growing population, overflowsof raw sewage, <strong>and</strong> large inputs of toxic materialsinto the sound.Taking pollution from one place (Lake Washington)<strong>and</strong> putting it somewhere else (Puget Sound) is anoutput approach that can be overwhelmed by a combinationof more people <strong>and</strong> more wastes. The way outis to prevent most wastes from reaching either of thesetwo bodies of water.Case Study: Pollution in the Great Lakes—Hopeful ProgressPollution of the Great Lakes has dropped significantlybut there is a long way to go.The five interconnected Great Lakes of North America(Figure 22-8) formed about 10,500 years ago when retreatingglaciers melted <strong>and</strong> poured water into thel<strong>and</strong> basins carved out by the slowly moving glaciers.These lakes contain at least 95% of the fresh surfacewater in the United States <strong>and</strong> one-fifth of the world’sfresh surface water.The Great Lakes basin is also home for about 30%of the Canadian population <strong>and</strong> 14% of the U.S. population.At least 38 million people obtain their drinkingwater from these lakes.Despite their enormous size, these lakes are vulnerableto pollution from point <strong>and</strong> nonpoint sources.One reason is that less than 1% of the water enteringthese lakes flows out to the St. Lawrence River eachyear. Another reason is that in addition to l<strong>and</strong> runoffthese lakes get atmospheric deposition of large quanti-CANADASt. Louis R.MINNESOTAIOWASilver BayWISCONSINNipigon BayThunder BayLakeSuperiorMenominee R.Jackfish BayMICHIGAN Manistique R. St. Mary’s R.Green BayFox R.Sheboygan R.MichiganLakeLakeHuronSpanish R.MICHIGANSaginawBaySaginaw R.SystemSt. Clair R.Thames R.Detroit R.Rouge R.Raisin R.Maumee R.Black R.Gr<strong>and</strong>R.Lake EriePenetary BaySturgeonBayLakeAshtabula R.Cuyahoga R.Rocky R.OntarioNiagara FallsNiagara R.Buffalo R.BayofQuinteSt. Lawrence R.PENNSYLVANIANEW YORKILLINOIS INDIANA OHIOGreat Lakes drainage basinMost polluted areas, according to the Great Lakes Water Quality Board"Hot spots" of toxic concentrations in water <strong>and</strong> sedimentsEutrophic areasFigure 22-8 Natural capital degradation: the Great Lakes basin <strong>and</strong> the locations of some of its water qualityproblems. The Great Lakes region is dotted with several hundred ab<strong>and</strong>oned toxic waste sites listed by theEPA as Superfund sites to receive cleanup priority. (Data from U.S. <strong>Environmental</strong> Protection Agency)500 CHAPTER 22 Water Pollution
ties of acids, pesticides, <strong>and</strong> other toxic chemicals,often blown in from hundreds or thous<strong>and</strong>s of kilometersaway.By the 1960s, many areas of the Great Lakes weresuffering from severe cultural eutrophication, hugefish kills, <strong>and</strong> contamination from bacteria <strong>and</strong> a varietyof toxic industrial wastes. The impact on Lake Eriewas particularly intense because it is the shallowest ofthe Great Lakes <strong>and</strong> has the highest concentrations ofpeople <strong>and</strong> industrial activity along its shores. Manybathing beaches had to be closed, <strong>and</strong> by 1970 the lakehad lost most of its native fish.Since 1972, Canada <strong>and</strong> the United States havejoined forces <strong>and</strong> spent more than $20 billion on aGreat Lakes pollution control program. This programhas decreased algal blooms, increased dissolved oxygenlevels <strong>and</strong> sport <strong>and</strong> commercial fishing catches inLake Erie, <strong>and</strong> allowed most swimming beaches toreopen.These improvements occurred mainly because ofnew or upgraded sewage treatment plants, bettertreatment of industrial wastes, <strong>and</strong> bans on use of detergents,household cleaners, <strong>and</strong> water conditionersthat contained phosphates.Despite this important progress many problemsremain. Each August a large zone severely depleted ofdissolved oxygen is likely to stretch across the centerof Lake Erie. The oxygen-poor water in this zone killsfish <strong>and</strong> microorganisms that support the lake’s foodweb. During the last 10 years, the time that the zonelasts has increased from two weeks to a month <strong>and</strong> scientistsdo not know why. Possible causes include oxygendepletion by zebra mussels (Case Study, p. 267),undetected inputs of phosphates from fertilizersthrough storm runoff sewers, an unknown naturallyoccurring cycle, or climate change.More bad news. According to a 2000 survey by theEPA, more than three-fourths of the shoreline of theGreat Lakes is not clean enough for swimming or forsupplying drinking water. The EPA <strong>and</strong> EnvironmentCanada have identified 43 highly polluted shorelineareas. Nonpoint l<strong>and</strong> runoff of pesticides <strong>and</strong> fertilizersfrom urban sprawl now surpasses industrial pollutionas the greatest threat to the lakes. Sediments in 26toxic hot spots (Figure 22-8) remain heavily polluted.About half of the toxic compounds entering thelakes come from atmospheric deposition of pesticides,mercury from coal-burning plants, <strong>and</strong> other toxicchemicals from as far away as Mexico <strong>and</strong> Russia.Toxic chemicals such as PCBs have built up in foodchains <strong>and</strong> webs (Figure 22-6), contaminating manytypes of sport fish <strong>and</strong> depleting populations of birds,river otters, <strong>and</strong> other animals feeding on contaminatedfish. A recent survey by Wisconsin biologistsfound that one fish in four taken from the Great Lakesis unsafe for human consumption. Another problemhas been an 80% drop in EPA funding for cleanup ofthe Great Lakes since 1992.Some environmentalists call for banning the use oftoxic chlorine compounds such as bleach in the pulp<strong>and</strong> paper industry around the Great Lakes. Theywould also ban new incinerators (which can releasetoxic chemicals into the atmosphere) in the area, <strong>and</strong>they would stop the discharge into the lakes of 70 toxicchemicals that threaten human health <strong>and</strong> wildlife. Officialsin the industries involved have successfully opposedsuch bans.22-4 POLLUTION OF GROUNDWATERWhy Is Groundwater Pollution Such a SeriousProblem? Not Easily CleanedGroundwater can become contaminatedwith a variety of chemicals because it cannoteffectively cleanse itself <strong>and</strong> dilute <strong>and</strong> dispersepollutants.According to many scientists, a serious threat to humanhealth is the out-of-sight pollution of groundwater,a prime source of water for drinking <strong>and</strong> irrigation.Studies show that groundwater pollution comes fromnumerous sources (Figure 22-9, p. 502). People whodump or spill gasoline, oil, <strong>and</strong> paint thinners <strong>and</strong>other organic solvents onto the ground also contaminategroundwater.Although experts rate groundwater pollution as alow-risk ecological problem, they consider pollutantsin drinking water (much of it from groundwater) ahigh-risk health problem. Once a pollutant from aleaking underground tank or other source contaminatesgroundwater it permeates the nearby porouslayers of s<strong>and</strong>, gravel, or bedrock in the aquifer likewater saturating a sponge. This makes removal of thecontaminant difficult <strong>and</strong> costly.Then the contaminated water slowly flows throughthe aquifer <strong>and</strong> creates a widening plume of contaminatedwater. If this plume reaches a well used to extractgroundwater, the polluted water can get into drinkingwater <strong>and</strong> into water used to irrigate crops.When groundwater becomes contaminated, itcannot cleanse itself of degradable wastes as flowing surfacewater does (Figure 22-5). One reason is thatgroundwater flows so slowly—usually less than 0.3meter or 1 foot per day—that contaminants are not diluted<strong>and</strong> dispersed effectively. Another problem isthat groundwater usually has much lower concentrationsof dissolved oxygen (which helps decomposemany contaminants) <strong>and</strong> smaller populations of decomposingbacteria. Also, the usually cold temperaturesof groundwater slow down chemical reactionsthat decompose wastes.http://biology.brookscole.com/miller14501
Figure 22-9 Natural capital degradation: principalsources of groundwater contamination in the UnitedStates. Another source is saltwater intrusion from excessivegroundwater withdrawal (Figure 15-17,p. 320).Polluted airPesticides<strong>and</strong> fertilizersHazardous wasteinjection wellCoal stripmine runoffDeicingroad saltBuried gasoline<strong>and</strong> solvent tanksPumpingwellWaste lagoonL<strong>and</strong>fillGasoline stationWaterpumping wellSewerCesspool,septic tankAccidentalspillsLeakagefrom faultycasingUnconfined freshwater aquiferConfined freshwater aquiferConfinedaquiferGroundwaterflowDischargeThus it can take hundredsto thous<strong>and</strong>s of yearsfor contaminated groundwaterto cleanse itself of degradable wastes. On a human timescale, nondegradable wastes (such as toxic lead, arsenic,<strong>and</strong> fluoride) are there permanently.What Is the Extent of GroundwaterPollution? Uncertain Overall but Seriousin Some AreasLeaks from chemical storage ponds, undergroundstorage tanks <strong>and</strong> well piping, <strong>and</strong> seepage ofagricultural fertilizers can contaminate groundwater.On a global scale we do not know much about groundwaterpollution because few countries go to the greatexpense of locating, tracking, <strong>and</strong> testing aquifers. Butscientific studies in scattered parts of the world provideus with some bad news.According to the EPA <strong>and</strong> the U.S. Geological Survey,one or more organic chemicals contaminate about45% of municipal groundwater supplies in the UnitedStates. An EPA survey of 26,000 industrial waste ponds<strong>and</strong> lagoons in the United States found that one-thirdof them had no liners to prevent toxic liquid wastesfrom seeping into aquifers. One-third of these sites arewithin 1.6 kilometers (1 mile) of a drinking water well.The U.S. General Accounting Office estimated in2002 that at least 76,000 underground tanks storinggasoline, diesel fuel, home heating oil, <strong>and</strong> toxic solventswere leaking their contents into groundwaterin the United States (Figure 22-9). In California’sSilicon Valley, where electronics industries use undergroundtanks to store a variety of organic solvents,local authorities found leaks in 85% of the tanks theyinspected.During this century, scientists expect many of themillions of underground tanks installed around theworld in recent decades to corrode, leak, contaminategroundwater, <strong>and</strong> become a major global health problem.Determining the extent of a leak from a single undergroundtank can cost $25,000–250,000, <strong>and</strong> cleanupcosts range from $10,000 to more than $250,000. If thechemical reaches an aquifer, effective cleanup is oftennot possible or is too costly. Bottom line: wastes wethink we have thrown away or stored safely can escape<strong>and</strong> come back to haunt us.According to the WHO, an estimated 70 millionpeople in northern China <strong>and</strong> 30 million in northwest-502 CHAPTER 22 Water Pollution
ern India drink groundwater contaminated with highlevels of naturally occurring fluoride (F ). This cancause crippling backbone <strong>and</strong> neck damage <strong>and</strong> a varietyof dental problems.Groundwater used as a source of drinking watercan also be contaminated with nitrate ions (NO 3 ),especially in agricultural areas where nitrates in fertilizercan be leached into groundwater. Nitrite ions(NO 2 ) in the stomach, colon, <strong>and</strong> bladder can convertsome of the nitrate ions in drinking water to organiccompounds, which can cause cancer in various organsin more than 40 test animal species. The conversion ofnitrates in tap water to nitrites in infants under6 months old can cause a potentially fatal conditionknown as “blue baby syndrome,” in which blood lacksthe ability to carry sufficient oxygen to body cells.Toxic arsenic (As) contaminates drinking waterwhen a well is drilled into aquifers where soils <strong>and</strong>rock are naturally rich in arsenic. According to theWHO, more than 112 million people are drinking waterwith arsenic levels 5–100 times the WHO st<strong>and</strong>ard of10 parts per billion (ppb). They include an estimated 30million people in Bangladesh, 6 million in India’s stateof West Bengal, <strong>and</strong> 6 million in China. According to estimatesby the WHO, long-term exposure to arsenic indrinking water is likely to cause 200,000–270,000 prematuredeaths from cancer of the skin, bladder, <strong>and</strong>lung in Bangladesh alone.Good news. The United Nations Children’s Fund(UNICEF) <strong>and</strong> several nongovernmental organizationsin Bangladesh have started a program to evaluate wellsserving several million people to identify those contaminatedwith arsenic <strong>and</strong> mark them with red paint.Arsenic can also be released into the air <strong>and</strong> waterby coal burning, copper <strong>and</strong> lead smelting, municipaltrash incinerators, l<strong>and</strong>fills containing arsenic-ladenash produced by coal-burning power plants, <strong>and</strong> useof certain arsenic-containing pesticides.The international st<strong>and</strong>ard for arsenic in drinkingwater of 10 ppb was adopted in 1993 by the WHO <strong>and</strong>in 1998 by the European Union, <strong>and</strong> becomes the st<strong>and</strong>ardin the United States in 2006.But according to the WHO <strong>and</strong> other scientists,even the 10-ppb st<strong>and</strong>ard is not safe. A 2001 study bythe U.S. National Academy of Sciences found that routinelydrinking water with arsenic levels of even 3 ppbposes a 1 in 1,000 risk of developing bladder or lungcancer. Many scientists call for lowering the st<strong>and</strong>ardto 3–5 ppb, but this would be very expensive.Solutions: How Can We Protect Groundwater?Monitor <strong>and</strong> Say NoPrevention is the most effective <strong>and</strong> affordableway to protect groundwater from pollutants.Figure 22-10 lists ways to prevent <strong>and</strong> clean upgroundwater contamination. Treating a contaminatedaquifer involves eliminating the source of pollution<strong>and</strong> drilling monitoring wells to determine how far, inwhat direction, <strong>and</strong> how fast the contaminated plumeis moving. Then a computer model is used to projectfuture dispersion of the contaminant in the aquifer.The final step is to develop <strong>and</strong> implement a strategyto clean up the contamination (Figure 22-10, right).This time-consuming <strong>and</strong> expensive process is somewhatlike a blind surgeon trying to find <strong>and</strong> remove acancer in your body before it grows too large.Because of the difficulty <strong>and</strong> expense of cleaningup a contaminated aquifer, preventing contamination isthe most effective <strong>and</strong> cheapest way to protect groundwaterresources (Figure 22-10, left).Underground tanks in the United States <strong>and</strong> anumber of other developed countries are now strictlyregulated. In the United States, thous<strong>and</strong>s of old leakingtanks from gasoline stations <strong>and</strong> other facilitieshave been removed <strong>and</strong> the surrounding soil <strong>and</strong>groundwater have been treated to remove gasoline.This is expensive but there is little choice because thegroundwater has already been contaminated.PreventionFind substitutes fortoxic chemicalsKeep toxicchemicals out ofthe environmentInstall monitoringwells near l<strong>and</strong>fills<strong>and</strong> undergroundtanksRequire leakdetectors onunderground tanksBan hazardouswaste disposal inl<strong>and</strong>fills <strong>and</strong>injection wellsStore harmfulliquids inaboveground tankswith leak detection<strong>and</strong> collectionsystemsSolutionsGroundwater PollutionCleanupPump to surface,clean, <strong>and</strong> returnto aquifer (veryexpensive)Injectmicroorganisms toclean upcontamination(less expensivebut still costly)Pumpnanoparticles ofinorganiccompounds toremove pollutants(may be thecheapest, easiest,<strong>and</strong> most effectivemethod but is stillbeing developed)Figure 22-10 Solutions: methods for preventing <strong>and</strong> cleaningup contamination of groundwater. Which two of these solutionsdo you believe are the most important?http://biology.brookscole.com/miller14503
22-5 OCEAN POLLUTIONHow Much Pollution Can the Oceans Tolerate?We Do Not KnowOceans can disperse <strong>and</strong> break down large quantitiesof degradable pollutants if they are not overloaded.The oceans can dilute, disperse, <strong>and</strong> degrade largeamounts of raw sewage, sewage sludge, oil, <strong>and</strong> sometypes of degradable industrial waste, especially indeep-water areas. Also, some forms of marine life havebeen affected less by some pollutants than expected.This has led some scientists to suggest it is safer todump sewage sludge <strong>and</strong> most other harmful wastesinto the deep ocean than to bury them on l<strong>and</strong> or burnthem in incinerators. Other scientists disagree, pointingout we know less about the deep ocean than we doabout the moon. They add that dumping harmfulwastes in the ocean would delay urgently needed pollutionprevention <strong>and</strong> promote further degradation ofthis vital part of the earth’s life-support system.How Do Pollutants Affect Coastal Areas?More People <strong>and</strong> Development Equal MorePollutionPollution of coastal waters near heavily populatedareas is a serious problem.Coastal areas—especially wetl<strong>and</strong>s <strong>and</strong> estuaries, coralreefs, <strong>and</strong> mangrove swamps—bear the brunt of ourenormous inputs of pollutants <strong>and</strong> wastes into theocean (Figure 22-11). This is not surprising becauseabout 40% of the world’s population lives on or withinIndustryNitrogen oxides from autos<strong>and</strong> smokestacks, toxicchemicals, <strong>and</strong> heavymetals in effluents flowinto bays <strong>and</strong> estuaries.ClosedbeachCitiesToxic metals <strong>and</strong>oil from streets <strong>and</strong>parking lots pollutewaters; sewageadds nitrogen <strong>and</strong>phosphorus.Urban sprawlBacteria <strong>and</strong>viruses from sewers<strong>and</strong> septic tankscontaminate shellfishbeds <strong>and</strong> closebeaches; runoffof fertilizer fromlawns adds nitrogen<strong>and</strong> phosphorus.Closedshellfish bedsOxygen-depletedzoneContruction sitesSediments are washed into waterways,choking fish <strong>and</strong> plants, cloudingwaters, <strong>and</strong> blocking sunlight.FarmsRunoff of pesticides, manure, <strong>and</strong>fertilizers adds toxins <strong>and</strong> excessnitrogen <strong>and</strong> phosphorus.Red tidesExcess nitrogen causes explosivegrowth of toxic microscopic algae,poisoning fish <strong>and</strong> marine mammals.Toxic sedimentsChemicals <strong>and</strong> toxic metalscontaminate shellfish beds,kill spawning fish, <strong>and</strong>accumulate in the tissuesof bottom feeders.Oxygen-depleted zoneSedimentation <strong>and</strong> algaeovergrowth reduce sunlight,kill beneficial sea grasses,use up oxygen, <strong>and</strong> degrade habitat.Healthy zoneClear, oxygen-rich waterspromote growth of plankton<strong>and</strong> sea grasses, <strong>and</strong> support fish.Figure 22-11 Natural capital degradation: how residential areas, factories, <strong>and</strong> farms contribute to thepollution of coastal waters <strong>and</strong> bays. According to the UN Environment Programme, coastal water pollutioncosts the world $16 billion annually—$731,000 a minute—due to ill health <strong>and</strong> premature death.504 CHAPTER 22 Water Pollution
100 kilometers (62 miles) of the coast <strong>and</strong> 14 of theworld’s 15 largest metropolitan areas (each with 10 millionpeople or more) are near coastal waters.In most coastal developing countries <strong>and</strong> in somecoastal developed countries, municipal sewage <strong>and</strong> industrialwastes are dumped into the sea without treatment.For example, about 85% of the sewage from largecities along the Mediterranean Sea (with a coastal populationof 200 million people during tourist season) isdischarged into the sea untreated. This causes widespreadbeach pollution <strong>and</strong> shellfish contamination.Recent studies of some U.S. coastal waters havefound vast colonies of human viruses from raw sewage,effluents from sewage treatment plants (which do notremove viruses), <strong>and</strong> leaking septic tanks. According toone study, about one-fourth of the people using coastalbeaches in the United States develop ear infections, sorethroats, eye irritations, respiratory disease, or gastrointestinaldisease.Runoffs of sewage <strong>and</strong> agricultural wastes intocoastal waters introduce large quantities of nitrate(NO 3 ) <strong>and</strong> phosphate (PO 43) plant nutrients, whichcan cause explosive growth of harmful algae. Theseharmful algal blooms (HABs) are called red, brown, orgreen toxic tides, depending on their color. They canrelease waterborne <strong>and</strong> airborne toxins that damagefisheries, kill some fish-eating birds, reduce tourism,<strong>and</strong> poison seafood.According to a 2004 report by the U.N. EnvironmentProgramme, each year some 150 large oxygen-depletedzones (sometimes inaccurately called dead zones)form mostly in temperate coastal waters <strong>and</strong> in l<strong>and</strong>lockedseas such as the Baltic <strong>and</strong> Black Seas. Thesezones result from excessive nonpoint inputs of fertilizers<strong>and</strong> animal wastes from l<strong>and</strong> runoff <strong>and</strong> depositionof nitrogen compounds from the atmosphere. This culturaleutrophication depletes dissolved oxygen. Withoutoxygen most of the aquatic life (except bacteria)dies or moves elsewhere. The biggest such zone in U.S.waters <strong>and</strong> the second largest in the world forms everysummer in a narrow stretch of the Gulf of Mexico offthe mouth of the Mississippi River (Figure 22-12).Promising news. Scientists in Asia <strong>and</strong> elsewhere areexperimenting with adding certain types of fine clay tothe water to help control algal blooms. The idea is tofind clay with particles fine <strong>and</strong> heavy enough to stickto the algae <strong>and</strong> remove them by weighing them downlike microanchors. More tests are needed to determinethe effectiveness of the method <strong>and</strong> to be sure that theclay particles do not harm other aquatic organisms.The enclosed Baltic Sea is highly polluted becauseit receives runoff <strong>and</strong> air pollutants from a huge areawith more than 70 million people <strong>and</strong> 15% of theworld’s industrial production. Good news. In 1980, thecountries surrounding the Baltic Sea signed the HelsinkiConvention—the world’s first international agreementto reduce marine pollution. Despite some limitations,LOUISIANADepleted oxygenMississippiRiver BasinMissouriRiverMississippiRiverOhioRiverMississippiRiverGulf of MexicoFigure 22-12 Natural capital degradation: a large zone ofoxygen-depleted water (less than 2 ppm dissolved oxygen)forms for half of the year in the Gulf of Mexico as a result ofoxygen-depleting algal blooms. It is created mostly by huge inputsof nitrate (NO 3 ) <strong>and</strong> phosphate (PO 43) plant nutrientsfrom the massive Mississippi River basin. In 2002, the area ofthe zone (shown in green) was roughly equivalent to the area ofthe state of New Jersey. This problem is worsened by loss ofwetl<strong>and</strong>s, which help filter plant nutrients.this agreement serves as an example of how countriescan work together to help reduce common water pollutionproblems.Preventive measures for reducing the number <strong>and</strong>size of such oxygen-depleted zones include reducingnitrogen inputs from various sources (Figure 22-7), plantingforest <strong>and</strong> grassl<strong>and</strong>s to soak up excess nitrogen <strong>and</strong>keep it out of waterways, restoring coastal wetl<strong>and</strong>s, improvingsewage treatment to reduce discharge of nitratesinto waterways, requiring further reduction of NO x emissionsfrom motor vehicles, <strong>and</strong> phasing in forms of renewableenergy to replace the burning of fossil fuels.Case Study: The Chesapeake Bay: An Estuaryin TroublePollutants from six states contaminate the shallowChesapeake Bay estuary, but cooperative efforts havereduced some of the pollution inputs.Since 1960, the Chesapeake Bay—America’s largest estuary—hasbeen in serious trouble from water pollution,mostly because of human activities. One problemis that between 1940 <strong>and</strong> 2004, the number of peopleliving in the Chesapeake Bay area grew from 3.7 millionto 17 million, <strong>and</strong> may soon reach 18 million.Another problem is that the estuary receiveswastes from point <strong>and</strong> nonpoint sources scatteredthroughout a huge drainage basin that includes 9 largerivers <strong>and</strong> 141 smaller streams <strong>and</strong> creeks in parts ofhttp://biology.brookscole.com/miller14505
PENNSYLVANIAWESTVIRGINIAVIRGINIADrainagebasinNEW YORKMARYLANDBaltimorePoto mac R.WashingtonRappahannockRichmondHarrisburgSusquehanna R.Patuxent R.R.Yor k R.JamesR.NorfolkNEWJERSEYNo oxygenCooperstownChoptankDELAWAREcokeiNantmokePocoChesapeake BayATLANTICOCEANLow concentrationsof oxygenFigure 22-13 Natural capital degration: Chesapeake Bay, thelargest estuary in the United States, is severely degraded as aresult of water pollution from point <strong>and</strong> nonpoint sources in sixstates <strong>and</strong> from deposition of air pollutants.six states (Figure 22-13). Also, the bay is a huge pollutionsink because it is quite shallow <strong>and</strong> only 1% of thewaste entering it is flushed into the Atlantic Ocean.Phosphate <strong>and</strong> nitrate levels have risen sharply inmany parts of the bay, causing algal blooms <strong>and</strong> oxygendepletion. Commercial harvests of its once abundantoysters, crabs, <strong>and</strong> several important fish havefallen sharply since 1960 because of a combination ofpollution, overfishing, <strong>and</strong> disease.Studies show that point sources, primarily sewagetreatment plants <strong>and</strong> industrial plants (often in violationof their discharge permits), account for about 60%by weight of the phosphates. Nonpoint sources—mostly runoff from urban, suburban, <strong>and</strong> agriculturall<strong>and</strong> <strong>and</strong> deposition from the atmosphere—accountfor about 60% by weight of the nitrates.In 1983, the United States implemented the ChesapeakeBay Program. It is the country’s most ambitiousattempt at integrated coastal management in which citizens’groups, communities, state legislatures, <strong>and</strong> thefederal government have worked together to reducepollution inputs into the bay. Strategies include establishingl<strong>and</strong>-use regulations in the bay’s six watershedstates to reduce agricultural <strong>and</strong> urban runoff, banningphosphate detergents, upgrading sewage treatmentplants, <strong>and</strong> better monitoring of industrial discharges.In addition, wetl<strong>and</strong>s are being restored <strong>and</strong> large areasof the bay are being replanted with sea grasses tohelp filter out nutrients <strong>and</strong> other pollutants.This hard work has paid off. Between 1985 <strong>and</strong>2000, phosphorus levels declined 27%, nitrogen levelsdropped 16%, <strong>and</strong> grasses growing on the bay’s floorhave made a comeback. This is a significant achievementgiven the increasing population in the watershed<strong>and</strong> the fact that nearly 40% of the nitrogen inputscome from the atmosphere.However, there is still a long way to go, <strong>and</strong> asharp drop in state <strong>and</strong> federal funding has slowedprogress. According to a 2003 report prepared by theUniversity of Maryl<strong>and</strong>’s School of Law, “After yearsof dialogue <strong>and</strong> billions in expenditures, the bay is nohealthier than it was 10 years ago.”But despite some setbacks, the Chesapeake BayProgram shows what can be done when diversegroups work together to achieve goals that benefitboth wildlife <strong>and</strong> people.Solutions: Can Oysters Help Clean Up theChesapeake Bay? Should We Bring Them Back?Rebuilding the Chesapeake Bay’s depleted oysterpopulation with disease-resistant oysters couldgreatly reduce water pollution because oysters filteralgae <strong>and</strong> silt from water.Marine scientists are looking for ways to rebuild theChesapeake Bay’s once huge population of the easternoyster as a way to help clean up the water. Oysters arefilter feeders that vacuum up the algae <strong>and</strong> nutrientladensuspended silt that cause many of the ChesapeakeBay’s water pollution problems.The bay’s oyster population once served as a naturalwater purifier by filtering the bay’s entire volumeof water every 3 or 4 days. But overharvesting <strong>and</strong> twoparasitic oyster diseases have reduced the oyster populationto about 1% of its historic high. Consequently,today’s oyster population needs about a year to filterthe bay’s water.Computer models project that increasing the oysterpopulation to only 10% of its historic high wouldimprove water quality <strong>and</strong> spur the growth of underwatersea grass. Ways to do this include introducingdisease-resistant Asian oysters, seeding beds witholder oysters presumed to have some disease resistance,<strong>and</strong> setting aside 20–25% of the bay’s oyster bedsas sanctuaries to protect stocks from overharvesting.In 2003, Virginia officials approved a plan to put 1million Asian oysters in the bay. However, a 2003study by the National Academy of Sciences recommendedcaution in introducing nonnative species intothe Chesapeake Bay without carefully looking at thepossible harmful ecological effects of such a project.What Is Being Done to Control the Dumpingof Pollutants into the Ocean? There Is NoAwayParts of the world’s oceans are dump sites for avariety of toxic materials <strong>and</strong> sewage <strong>and</strong> garbagefrom ships.506 CHAPTER 22 Water Pollution
Dumping industrial waste off U.S. coasts hasstopped, although it still occurs in a number of otherdeveloped countries <strong>and</strong> some developing countries.But barges <strong>and</strong> ships still legally dump large quantitiesof dredge spoils (materials, often laden with toxicmetals, scraped from the bottoms of harbors <strong>and</strong>rivers to maintain shipping channels) at 110 sites offthe Atlantic, Pacific, <strong>and</strong> Gulf coasts of the UnitedStates.Many countries also dump large quantities ofsewage sludge into the ocean. It is a gooey mixture oftoxic chemicals, infectious agents, <strong>and</strong> settled solidsremoved from wastewater at sewage treatment plants.Good news. Since 1992, the United States hasbanned this practice. And 50 countries with at least80% of the world’s merchant fleet have agreed not todump sewage <strong>and</strong> garbage at sea.Bad news. This agreement is difficult to enforce<strong>and</strong> violations are common. Most ship owners savemoney by dumping wastes at sea <strong>and</strong>, if caught, getonly small fines. Each year as many as 2 millionseabirds <strong>and</strong> more than 100,000 marine mammals (includingwhales, seals, dolphins, <strong>and</strong> sea lions) diewhen they ingest or become entangled in fishing nets,ropes, <strong>and</strong> other debris dumped into the sea or discardedon beaches (see photo on p. viii).Under the London Dumping Convention of 1972,100 countries agreed not to dump highly toxic pollutants<strong>and</strong> high-level radioactive wastes in the opensea beyond the boundaries of their national jurisdictions.Since 1983, these same nations have observeda moratorium on the dumping of low-level radioactivewastes at sea, which in 1994 became a permanentban.But these agreements are hard to monitor <strong>and</strong>enforce. In 1992, it was learned that for decades, theformer Soviet Union had been dumping large quantitiesof high- <strong>and</strong> low-level radioactive wastes into theArctic Ocean <strong>and</strong> its tributaries.What Are the Major Sources of Ocean OilPollution? L<strong>and</strong>-Based Activities, Not Tankers,Are the Major CulpritsMost ocean oil pollution comes from humanactivities on the l<strong>and</strong>.Crude petroleum (oil as it comes out of the ground) <strong>and</strong>refined petroleum (fuel oil, gasoline, <strong>and</strong> other processedpetroleum products) reach the ocean from a number ofsources. In 1989, the Exxon Valdez oil tanker went offcourse, hit rocks, <strong>and</strong> released large amounts of oil intoAlaska’s Prince William Sound in an accident thatended up costing about $7 billion (including cleanupcosts <strong>and</strong> fines for damage against ExxonMobil). In2002, the oil tanker Prestige sank off the coast of Spain<strong>and</strong> over two years leaked about twice as much oil asthe Exxon Valdez. Such tanker accidents <strong>and</strong> blowoutsat offshore drilling rigs (when oil escapes under highpressure from a borehole in the ocean floor) get most ofthe publicity because of their high visibility.But much more oil is released from other smaller,day-to-day, <strong>and</strong> less visible activities. They include thenormal operation of offshore wells, washing oiltankers <strong>and</strong> releasing the oily water, loading <strong>and</strong> unloadingof oil tankers at ports, <strong>and</strong> leaks from oilpipelines, refineries, <strong>and</strong> storage tanks. Natural oilseeps also release large amounts of oil into the ocean atsome sites.Studies show that most ocean oil pollution comes fromactivities on l<strong>and</strong>. According to a 2002 study by the PewOceans Commission, every 8 months an amount of oilequal to that spilled by the Exxon Valdez tanker drainsfrom the l<strong>and</strong> into the oceans. Almost half (some expertsestimate 90%) of the oil reaching the oceans iswaste oil dumped on the ground, poured down thedrain, spilled, or leaked onto the l<strong>and</strong> or into sewersby cities, industries, <strong>and</strong> people changing their ownmotor oil.What Are the Effects of Oil Pollutionon Ocean Ecosystems <strong>and</strong> CoastalCommunities? Serious but Not Long-LastingOil pollution can have a number of harmful ecological<strong>and</strong> economic effects, but most disappear within3–15 years.The effects of oil on ocean ecosystems depend on anumber of factors: type of oil (crude or refined), typeof aquatic system, amount released, distance of releasefrom shore, time of year, weather conditions, averagewater temperature, <strong>and</strong> ocean currents.Volatile organic hydrocarbons in oil immediatelykill a number of aquatic organisms, especially in theirvulnerable larval forms. Some other chemicals formtarlike globs that float on the surface <strong>and</strong> coat thefeathers of birds (especially diving birds) <strong>and</strong> the fur ofmarine mammals. This oil coating destroys their naturalinsulation <strong>and</strong> buoyancy, causing many of them todrown or die of exposure from loss of body heat.Heavy oil components that sink to the ocean flooror wash into estuaries can smother bottom-dwellingorganisms such as crabs, oysters, mussels, <strong>and</strong> clamsor make them unfit for human consumption. Some oilspills have killed reef corals.Research shows that most (but not all) forms ofmarine life recover from exposure to large amounts ofcrude oil within about 3 years. But recovery from exposureto refined oil, especially in estuaries <strong>and</strong> saltmarshes, can take 10–15 years. The effects of spills incold waters <strong>and</strong> in shallow enclosed gulfs <strong>and</strong> baysgenerally last longer.http://biology.brookscole.com/miller14507
Oil slicks that wash onto beaches can have a seriouseconomic impact on coastal residents, who lose incomenormally gained from fishing <strong>and</strong> tourist activities. Oilpollutedbeaches washed by strong waves or currentsbecome clean after about a year, but beaches in shelteredareas remain contaminated for several years. Despitethe localized harmful effects, EPA experts rate oilspills as a low-risk ecological problem.How Well Can We Clean Up Oil Spills? NotVery WellCurrent methods can recover no more than about 15%of the oil from a major spill, explaining why preventionis the best strategy.If they are not too large, oil spills can be partiallycleaned up by mechanical, chemical, fire, <strong>and</strong> naturalmethods. Mechanical methods include using floatingbooms to contain the oil spill or keep it from reachingsensitive areas, skimmer boats to vacuum up some ofthe oil into collection barges, <strong>and</strong> absorbent devices suchas large mesh pillows filled with feathers or hair tosoak up oil on beaches or in waters too shallow forskimmer boats.Chemical methods include using coagulating agentsto cause floating oil to clump together for easierpickup or to sink to the bottom (where it usually doesless harm) <strong>and</strong> dispersing agents to break up oil slicks.But these agents can damage some types of organisms.Fire can burn off floating oil, but crude oil is hard to ignite<strong>and</strong> burning it produces air pollution.In time, the natural action of wind <strong>and</strong> wavesmixes or emulsifies oil with water (like emulsifiedsalad dressing), <strong>and</strong> bacteria biodegrade some of theoil. Scientists are developing biological methods inwhich “cocktails” of bacteria are sprayed on the oil tobreak it down into chemicals that the bacteria consumeor that disperse harmlessly into the sea. Addingspecial nutrients required by the bacteria usuallyspeeds up the decomposition process. This bioremediationcleanup by naturally occurring bacteria ischeaper <strong>and</strong> may be much more effective than othercleanup methods.Scientists estimate that current methods can recoverno more than 15% of the oil from a major spill.This explains why preventing oil pollution is the mosteffective <strong>and</strong> in the long run the least costly approach.Good news. Because of concern over the 1989 ExxonValdez oil spill, the Oil Pollution Act of 1990 set up atrust fund to provide up to $1 million per spill forcleanup. It also required that by 2015 all oil tankers operatingin U.S. waters must be constructed with twohulls—one inside the other—to help protect againstspills. Similar international laws have been established,<strong>and</strong> in 2002 the European Union voted to ban singlehulloil tankers from their waters by 2010 <strong>and</strong> by 2005for the largest tankers. Some members of Congresshave unsuccessfully proposed legislation to requiredouble hulls for tankers in U.S. waters by 2007.Bad news. In 2004, about half of the world’s 10,000oil tankers still had the older <strong>and</strong> more vulnerable singlehulls. Cruise ships can also pollute coastal waterswith oil <strong>and</strong> other waste—most of which is dumped atsea or in fragile coastal areas when the ships visit variousports. Scuba diving, anyone?Solutions: How Can We Protect CoastalWaters? Think PreventionPreventing or reducing the flow of pollutionfrom the l<strong>and</strong> <strong>and</strong> from streams emptying into theocean is the key to protecting the oceans.Figure 22-14 list ways analysts have suggested to prevent<strong>and</strong> reduce excessive pollution of coastal waters.Study this figure carefully.PreventionReduce input of toxicpollutantsSeparate sewage<strong>and</strong> storm linesBan dumping ofwastes <strong>and</strong> sewageby maritime <strong>and</strong>cruise ships incoastal watersBan ocean dumpingof sludge <strong>and</strong>hazardous dredgedmaterialProtect sensitiveareas fromdevelopment, oildrilling, <strong>and</strong> oilshippingRegulate coastaldevelopmentRecycle used oilRequire double hullsfor oil tankersSolutionsCoastal Water PollutionCleanupImprove oil-spillcleanupcapabilitiesSprinklenanoparticlesover an oil orsewage spill todissolve the oil orsewage withoutcreating harmfulbyproducts(still underdevelopment)Require at leastsecondarytreatment ofcoastal sewageUse wetl<strong>and</strong>s,solar-aquatic, orother methods totreat sewageFigure 22-14 Solutions: methods for preventing <strong>and</strong> cleaningup excessive pollution of coastal waters. Which two of these solutionsdo you believe are the most important?508 CHAPTER 22 Water Pollution
The key to protecting oceans is to reduce the flow ofpollution from the l<strong>and</strong> <strong>and</strong> from streams emptying intothe ocean. Thus ocean pollution control must be linkedwith l<strong>and</strong>-use <strong>and</strong> air pollution policies because aboutone-third of all pollutants entering the ocean worldwidecome from air emissions from l<strong>and</strong>-based sources.22-6 PREVENTING AND REDUCINGSURFACE WATER POLLUTIONHow Can We Reduce Surface Water Pollutionfrom Nonpoint Sources? Emphasize PreventionThe key to reducing nonpoint pollution, mostof it from agriculture, is to prevent it from reachingbodies of surface water.There are a number of ways to reduce nonpoint waterpollution, most of it from agriculture. Farmers canreduce soil erosion, especially by keeping cropl<strong>and</strong>covered with vegetation <strong>and</strong> by reforesting critical watersheds.They can also reduce the amount of fertilizerrunning off into surface waters <strong>and</strong> leaching intoaquifers by using slow-release fertilizer, using none onsteeply sloped l<strong>and</strong>, <strong>and</strong> planting buffer zones of vegetationbetween cultivated fields <strong>and</strong> nearby surfacewater.Applying pesticides only when needed <strong>and</strong> relyingmore on biological control of pests can reducepesticide runoff. Farmers can control runoff <strong>and</strong> infiltrationof manure from animal feedlots by plantingbuffers <strong>and</strong> locating feedlots <strong>and</strong> animal waste sitesaway from steeply sloped l<strong>and</strong>, surface water, <strong>and</strong>flood zones.Good news. In 2003 Smithfield Foods, a large porkproducer, announced plans to build a facility in Utahto convert the wastes from 500,000 hogs—about half ofits annual hog production in Utah—to make renewablebiodiesel fuel for vehicles. In addition, researchersare experimenting with planting poplar trees to suckup waste from contaminated hog waste lagoons.In 2002 a federal court forced the EPA to upholdthe intent of the Clean Water Act <strong>and</strong> require about15,500 of the nation’s largest livestock feedlots or factoryfarms to apply for EPA runoff permits by 2006, developplans to h<strong>and</strong>le manure <strong>and</strong> wastewater, <strong>and</strong> fileannual reports with the EPA. If this rule goes into effect,large livestock operations will have to obey thesame pollution control regulations that have been appliedto other industries since 1972.Livestock producers who have successfully foughtsuch regulation for over 30 years say the new rules willcost them too much, <strong>and</strong> they hope to persuade Congressto eliminate, delay, or weaken the new rules. Staytuned for developments.These tougher rules are spurring scientists tocome up with better ways to deal with animal waste.They are exploring ways to burn it, convert it to naturalgas, recycle undigested nutrients in manure backinto animal feed, <strong>and</strong> extract valuable chemicals frommanure to make plastics or even cosmetics.Other scientists are looking at ways to rinse awaymany of the soluble <strong>and</strong> smelly ingredients in manureto leave tough, strawlike particles of fiber that can bepressed into fiberboard for making cabinets <strong>and</strong> furniture.The resulting fiber is called animal processedfiber, a formal name for processed cow <strong>and</strong> hog poop.xHOW WOULD YOU VOTE? Should we greatly increase effortsto reduce water pollution from nonpoint sources? Castyour vote online at http://biology.brookscole.com/miller14.How Can We Reduce Water Pollution fromPoint Sources? Legal <strong>and</strong> Market ApproachesMost developed countries use laws to set waterpollution st<strong>and</strong>ards, but in most developingcountries such laws do not exist or are poorlyenforced.The Federal Water Pollution Control Act of 1972 (renamedthe Clean Water Act when it was amended in1977) <strong>and</strong> the 1987 Water Quality Act form the basis ofU.S. efforts to control pollution of the country’s surfacewaters. The Clean Water Act sets st<strong>and</strong>ards for allowedlevels of key water pollutants <strong>and</strong> requires pollutersto get permits specifying how much of variouspollutants they can discharge into aquatic systems.The EPA is also experimenting with a dischargetrading policy that uses market forces to reduce waterpollution (as has been done with sulfur dioxide for airpollution control, p. 454) in the United States. Underthis program a water pollution source is allowed topollute at a higher level than allowed in its permit bybuying credits from permit holders with pollution levelsbelow their allowed levels.Some environmentalists support discharge trading.But they warn that such a system is no better thanthe caps set for total pollution levels in various areas,<strong>and</strong> call for careful scrutiny of the cap levels. They alsowarn that discharge trading could allow pollutants tobuild up to dangerous levels in areas where credits arebought. In addition, they call for gradually loweringthe caps to encourage prevention of water pollution<strong>and</strong> development of better technology for controllingwater pollution, neither of which is a part of the currentEPA water pollution discharge trading system.Bad news. According to S<strong>and</strong>ra Postel, director ofthe Global Water Policy Project, most cities in developingcountries discharge 80–90% of their untreatedsewage directly into rivers, streams, <strong>and</strong> lakes, whichhttp://biology.brookscole.com/miller14509
are used for drinking water, bathing, <strong>and</strong> washingclothes.How Can We Reduce Water Pollution fromPoint Sources? The Technological ApproachSeptic tanks <strong>and</strong> various levels of sewagetreatment can reduce point-source waterpollution.In rural <strong>and</strong> suburban areas with suitable soils, sewagefrom each house can be discharged into a septic tank(Figure 22-15). About one-fourth of all homes in theUnited States are served by septic tanks.In U.S. urban areas, most waterborne wastes fromhomes, businesses, factories, <strong>and</strong> storm runoff flowthrough a network of sewer pipes to wastewater orsewage treatment plants. Some cities have a separate networkof pipes for carrying runoff of storm water fromstreets <strong>and</strong> parking lots. But 1,200 U.S. cities have combinedthe sewer lines for these two systems because itis cheaper.Bad news. Heavy rains or too many users hookedup to the system can cause combined sewer lines tooverflow <strong>and</strong> discharge untreated (raw) sewage directlyinto surface waters. According to the EPA, atleast 40,000 such overflows occur each year in theUnited States. The EPA estimated that each year1.8–3.5 million people get sick from swimming in waterscontaminated by sewage overflows. The EPA estimatesthat it would cost $10 billion a year for a decadeGravel orcrushedstoneHouseholdwastewaterDrainfieldSeptic tank withmanhole (for cleanout)Nonperforated pipeDistribution box (optional)Vent pipePerforated pipeFigure 22-15 Solutions: septic tank system used for disposalof domestic sewage <strong>and</strong> wastewater in rural <strong>and</strong> suburban areas.This system separates solids from liquids, digests organicmatter <strong>and</strong> large solids <strong>and</strong> discharges the liquid wastes in anetwork of buried pipes with holes over a large drainage or absorptionfield. As these wastes drain from the pipes <strong>and</strong> percolatedownward, the soil filters out some potential pollutants, <strong>and</strong>soil bacteria decompose biodegradable materials. To be effective,septic tank systems must be properly installed in soils withadequate drainage, not placed too close together or too nearwell sites, <strong>and</strong> pumped out when the settling tank becomes full.to install dual systems, add capacity, <strong>and</strong> repair the nation’s$2 trillion aging sewer network. To help protectpublic health, environmentalists want Congress tochange the Clean Water Act to require the EPA to monitorsewer leaks <strong>and</strong> overflows <strong>and</strong> report them topublic health authorities.Raw sewage reaching a treatment plant typicallyundergoes one or both of two levels of wastewatertreatment. One is primary sewage treatment. It is aphysical process that uses screens <strong>and</strong> a grit tank to removelarge floating objects <strong>and</strong> solids such as s<strong>and</strong><strong>and</strong> rock, <strong>and</strong> a settling tank that allows suspendedsolids to settle out as sludge (Figure 22-16). By itself,primary treatment removes about 60% of the suspendedsolids <strong>and</strong> 30–40% of the oxygen-dem<strong>and</strong>ingorganic wastes from sewage but removes no phosphates,nitrates, salts, radioisotopes, or pesticides.A second level is called secondary sewage treatment.It is a biological process in which aerobic bacteriaremove up to 90% of dissolved <strong>and</strong> biodegradable,oxygen-dem<strong>and</strong>ing organic wastes. This is done bytrickling wastewater through beds of gravel coveredwith films of aerobic bacteria or by passing it throughan aeration tank where air is pumped through a slurryof aerobic bacteria before the wastewater is sent to asecond settling tank.A combination of primary <strong>and</strong> secondary treatment(Figure 22-16) removes 95–97% of the suspendedsolids <strong>and</strong> oxygen-dem<strong>and</strong>ing organic wastes, 70% ofmost toxic metal compounds <strong>and</strong> nonpersistent syntheticorganic chemicals, 70% of the phosphorus(mostly as phosphates), 50% of the nitrogen (mostly asnitrates), <strong>and</strong> 5% of dissolved salts. But this process removesonly a tiny fraction of long-lived radioactiveisotopes <strong>and</strong> persistent organic substances such assome pesticides.Because of the Clean Water Act, most U.S. citieshave combined primary <strong>and</strong> secondary sewage treatmentplants. According to the EPA, however, at leasttwo-thirds of these plants have at times violated waterpollution regulations. Also, 500 cities have failed tomeet federal st<strong>and</strong>ards for sewage treatment plants,<strong>and</strong> 34 East Coast cities simply screen out large floatingobjects from their sewage before discharging it intocoastal waters.A third level of cleanup is advanced or tertiarysewage treatment. It is a series of specialized chemical<strong>and</strong> physical processes that remove specific pollutantsleft in the water after primary <strong>and</strong> secondarytreatment. Its most widespread use is to removephosphates <strong>and</strong> nitrates from wastewater before it isdischarged into surface waters to help reduce nutrientoverload. Advanced treatment is expensive <strong>and</strong> isused to treat only 5% of the wastewater in the UnitedStates.Before discharge, water from primary, secondary,or advanced treatment undergoes bleaching to remove510 CHAPTER 22 Water Pollution
PrimarySecondaryGritBar screen chamber Settling tank Aeration tank Settling tankChlorinedisinfection tankTo river, lake,or oceanRaw sewagefrom sewers Sludge (kills bacteria)Activated sludgeAir pumpSludge digesterFigure 22-16 Solutions: primary <strong>and</strong>secondary sewage treatment.Sludge drying bedDisposed of in l<strong>and</strong>fill orocean or applied to cropl<strong>and</strong>,pasture, or rangel<strong>and</strong>water coloration <strong>and</strong> disinfection to kill disease-carryingbacteria <strong>and</strong> some but not all viruses. The usualmethod for doing this is chlorination. But chlorine canreact with organic materials in water to form smallamounts of chlorinated hydrocarbons. Some of thesechemicals can cause cancers in test animals <strong>and</strong> maydamage the human nervous, immune, <strong>and</strong> endocrinesystems (Case Study, p. 416).Use of other disinfectants, such as ozone <strong>and</strong> ultravioletlight, is increasing. But they cost more <strong>and</strong> theireffects do not last as long as chlorination.What Should We Do with Sewage Sludge?An Unsettled ProblemSewage sludge can be used as a soil conditioner,but this can cause health problems if it containsinfectious bacteria <strong>and</strong> toxic chemicals.Sewage treatment produces a gooey sludge containinga slimy mixture of bacteria-laden solids <strong>and</strong> oftentoxicchemicals <strong>and</strong> metals when sewer systems mixindustrial <strong>and</strong> household waste. In the United States,about 9% by weight of this sludge is placed in largecircular digesters <strong>and</strong> kept warm for several weeks toallow anaerobic bacteria to decompose organic materials<strong>and</strong> produce compost for use as a soil conditioner.About 36% of the sludge, also known as biosolids, isused to fertilize farml<strong>and</strong>, forests, golf courses, cemeteries,parkl<strong>and</strong>, highway medians, <strong>and</strong> degradedl<strong>and</strong>. The remaining 55% is dumped in conventionall<strong>and</strong>fills where it can contaminate groundwater, or isincinerated. Such burning of waste can pollute the airwith toxic chemicals, <strong>and</strong> it produces a toxic ash usuallyburied in l<strong>and</strong>fills that the EPA says will eventuallyleak.From an ecological st<strong>and</strong>point, it is desirable to recycleplant nutrients in sewage sludge to the soil onl<strong>and</strong>. But there are problems with using sewage sludgeto fertilize crops (Figure 22-17, p. 512). As long as harmfulbacteria <strong>and</strong> other pathogens <strong>and</strong> toxic chemicalsare not present, sludge can fertilize l<strong>and</strong> used for foodcrops or livestock. But removing bacteria (usually byheating), toxic metals, <strong>and</strong> organic chemicals is expensive<strong>and</strong> rarely done in the United States. According toa 2002 report by the National Academy of Sciences, theEPA is using outdated science to set st<strong>and</strong>ards for usingsewage sludge as a fertilizer in the United States.Agrowing number of alleged health problems <strong>and</strong>lawsuits have resulted from use of sludge to fertilizecrops in the United States. To protect consumers <strong>and</strong>avoid lawsuits, some food packers such as Del Monte<strong>and</strong> Heinz have banned produce grown on farms usingsludge as a fertilizer.How Can We Improve Sewage Treatment?Eliminate ToxicsPreventing toxic chemicals from reaching sewagetreatment plants would eliminate such chemicals fromthe sludge <strong>and</strong> water discharged from such plants.<strong>Environmental</strong> scientist Peter Montague calls for redesigningsewage treatment systems to prevent toxichttp://biology.brookscole.com/miller14511
OdorsOdors may cause illness orindicate presence of harmful gases.Dust ParticlesParticles of dried sludge carry viruses<strong>and</strong> harmful bacteria that can be inhaled,infect cuts or enter homes.BUFFERZONEExposureChildren may walk orplay in fertilized fields.SludgeLivestock PoisoningCows may die after grazingon sludge-treated fields.GroundwaterContaminationHarmful chemicals<strong>and</strong> pathogens mayleach into groundwater<strong>and</strong> shallow wells.Surface RunoffHarmful chamicals<strong>and</strong> pathogens maypollute nearby streams,lakes, ponds, <strong>and</strong>wetl<strong>and</strong>s.Figure 22-17 Natural capital degradation: some potential problems with using sludge from sewage treatmentplants as a fertilizer on cropl<strong>and</strong>s. The EPA says that sludge is safe to use if applied following its guidelines.Scientists <strong>and</strong> people who have gotten sick from exposure to sludge fertilizer claim the guidelines areinsufficient <strong>and</strong> not adequately enforced.<strong>and</strong> hazardous chemicals from reaching sewage treatmentplants <strong>and</strong> thus from getting into sludge <strong>and</strong> thewater discharged from such plants.He suggests several ways to do this. One is to requireindustries <strong>and</strong> businesses to remove toxic <strong>and</strong>hazardous wastes from water sent to municipal sewagetreatment plants. Another is to encourage industries toreduce or eliminate toxic chemicals use <strong>and</strong> waste.Another suggestion is to have more households,apartment buildings, <strong>and</strong> offices eliminate sewage outputsby switching to waterless composting toilet systemsthat are installed, maintained, <strong>and</strong> managed by professionals.Such systems would be cheaper to install <strong>and</strong>maintain than current sewage systems because they donot require vast systems of underground pipes connectedto centralized sewage treatment plants. Theyalso save large amounts of water. They work great. Iused one for 15 years.xHOW WOULD YOU VOTE? Should we ban the dischargeof toxic chemicals into pipes leading to sewage treatmentplants? Cast your vote online at http://biology.brookscole.com/miller14.Solutions: How Can We Treat Sewageby Working with Nature? EcologicalPurificationNatural <strong>and</strong> artificial wetl<strong>and</strong>s <strong>and</strong> other ecologicalsystems can be used to treat sewage.John Todd has developed an ecological approach totreating sewage, which he calls living machines (Figure22-1). More than 150 cities <strong>and</strong> towns in the UnitedStates use natural <strong>and</strong> artificial wetl<strong>and</strong>s to treatsewage as a low-tech, low-cost alternative to expensivewaste treatment plants.For example, the coastal town of Arcata, California,created some 65 hectares (160 acres) of wetl<strong>and</strong>s betweenthe town <strong>and</strong> the adjacent Humboldt Bay. Themarshes <strong>and</strong> ponds, developed on this l<strong>and</strong> that wasonce a garbage dump, act as an inexpensive naturalwaste treatment plant. The project cost less than halfthe estimated cost of a conventional treatment plant.Here is how it works. First, sewage goes to sedimentationtanks, where the solids settle out as sludgethat is removed <strong>and</strong> processed for use as fertilizer.Next, the liquid is pumped into oxidation ponds,512 CHAPTER 22 Water Pollution
where bacteria break down remaining wastes. After amonth or so, the water is released into the artificialmarshes, where plants <strong>and</strong> bacteria carry out furtherfiltration <strong>and</strong> cleansing. Then the purified water flowsinto the Humboldt Bay with its abundant marine life.The marshes <strong>and</strong> ponds also serve as an AudubonSociety bird sanctuary <strong>and</strong> provide habitats for thous<strong>and</strong>sof otters, seabirds, <strong>and</strong> marine animals. The towncelebrates its natural sewage treatment system with anannual “Flush with Pride” festival. However, somecities do not have the l<strong>and</strong> available for this approach.Mark Nelson has developed a small, low-tech,<strong>and</strong> inexpensive artificial wetl<strong>and</strong> system to treat rawsewage from hotels, restaurants, <strong>and</strong> homes in developingcountries (Figure 22-18). This wastewater gardensystem removes 99.9% of fecal coliform bacteria <strong>and</strong>more than 80% of the nitrates <strong>and</strong> phosphates from incomingsewage that in most developing countries isoften dumped untreated into the ocean or into shallowholes in the ground. The water flowing out of suchsystems can be used to irrigate gardens or fields or toflush toilets <strong>and</strong> thus help save water.Genetic engineering may also get into the act. Theguts of some insects are resistant to pesticides. Researchershave isolated the gene that provides this resistance,<strong>and</strong> they have transferred it to easily culturedbacterial species. They envision passing contaminatedwater through a large vessel or bioreactor containingthe genetically modified bacteria that consume thepesticides. Stay tuned about developments in thispromising area of frontier science. This might be an interestingcareer choice.Currently about 1.7 billion people do not haveaccess to adequate sanitation. And the world’s populationis projected to add 2.9 billion more peoplebetween 2004 <strong>and</strong> 2050—an average of 172,000 newpeople per day needing access to safe drinking water<strong>and</strong> adequate sanitation. Without greatly increased investmentin conventional <strong>and</strong> unconventional sewagetreatment systems, the number of people with inadequatesanitation could reach 3 billion by 2050. Dealingwith this important challenge will take scientific <strong>and</strong>engineering ingenuity <strong>and</strong> lots of money.How Successful Has the United States Beenin Reducing Water Pollution? Good <strong>and</strong> BadNewsWater pollution laws have significantly improvedwater quality in many U.S. streams <strong>and</strong> lakes, butthere is a long way to go.Great news. According to the EPA, the Clean Water Actof 1972 led to a number of improvements in U.S. waterquality. Between 1992 <strong>and</strong> 2002, the number of Americansserved by community water systems that metfederal health st<strong>and</strong>ards increased from 79% to 94%.(1) Raw sewage drains bygravity into the first pool<strong>and</strong> flows through a longperforated PVC pipe intoa bed of limestone gravel.(3) Wastewater flows throughanother perforated pipeinto a second pool, wherethe same process is repeated.SewageWetl<strong>and</strong> typeplantsWetl<strong>and</strong> typeplantsTreatedwaterFirst concrete pool(2) Microbes in the limestone gravelbreak down the sewage intochemicals that can be absorbedby the plant roots, <strong>and</strong> the gravelabsorbs phosphorus.45 centimeterlayer of limestonegravel coated withdecomposing bacteriaSecond concrete pool(4) Treated water flowing from thesecond pool is nearly free ofbacteria <strong>and</strong> plant nutrients.Treated water can be recycledfor irrigation <strong>and</strong> flushing toilets.Figure 22-18 Solutions: wastewater garden. Hotels, restaurants, <strong>and</strong> homes in developing countriescan use this small gravity-fed artificial wetl<strong>and</strong> system to treat sewage. It uses only 1.9–3.8 square meters(20–30 square feet) of space per person.http://biology.brookscole.com/miller14513
Also, between 1972 <strong>and</strong> 2002, the percentage of U.S.stream lengths found to be fishable <strong>and</strong> swimmable increasedfrom 36% to 60% of those tested. And theamount of topsoil lost through agricultural runoff wascut by about 1.1 billion metric tons (1 billion tons) annually.In addition, between 1972 <strong>and</strong> 2002, the proportionof the U.S. population served by sewage treatmentplants increased from 32% to 74%. And between 1974<strong>and</strong> 2002, annual wetl<strong>and</strong> losses decreased by 80%.These are impressive achievements given the increasesin the U.S. population <strong>and</strong> per capita consumptionsince 1972.Bad news. In 2000, the EPA found that 45% of thecountry’s lakes <strong>and</strong> 40% of the streams surveyed weretoo polluted for swimming or fishing. The number ofpolluted streams, lakes, <strong>and</strong> estuaries could be muchhigher because only 19% of the country’s streamlengths, 43% of its lake <strong>and</strong> reservoir area, <strong>and</strong> 36% ofits estuaries have been tested for water quality.Runoff of animal wastes from hog, poultry, <strong>and</strong>cattle feedlots <strong>and</strong> meat processing facilities pollutes 7of every 10 U.S. rivers. Most livestock wastes are nottreated <strong>and</strong> are stored in lagoons that sometimes leak.They can also overflow or rupture as a result of excessiverainfall <strong>and</strong> spill their contents into nearby streams<strong>and</strong> rivers <strong>and</strong> sometimes into residential areas.Fish caught in more than 1,400 different waterways<strong>and</strong> more than a fourth of the nation’s lakes areunsafe to eat because of high levels of pesticides, mercury,<strong>and</strong> other toxic substances. A 2003 internal studyby the EPA found that at least half of the country’s6,600 largest industrial facilities <strong>and</strong> municipal wastewatertreatment plants have illegally discharged toxicor biological wastes into waterways for years withoutgovernment enforcement actions or fines.Should the U.S. Clean Water Act Be Strengthenedor Weakened? A Raging ControversySome want to strengthen the Clean Water Act whileothers want to weaken it.Some environmentalists <strong>and</strong> a 2001 report by theEPA’s inspector general call for the Clean Water Act tobe strengthened. Suggested improvements include increasedfunding <strong>and</strong> authority to control nonpointsources of pollution, upgrading the computer systemfor monitoring compliance with the law, <strong>and</strong> strengtheningprograms to prevent <strong>and</strong> control toxic waterpollution.Other suggestions include providing more funding<strong>and</strong> authority for integrated watershed <strong>and</strong> airshedplanning to protect groundwater <strong>and</strong> surface waterfrom contamination, <strong>and</strong> exp<strong>and</strong>ing the rights ofcitizens to bring lawsuits to ensure that water pollutionlaws are enforced. The National Academy of Sciencesalso calls for halting the loss of wetl<strong>and</strong>s, higher st<strong>and</strong>ardsfor wetl<strong>and</strong> restoration, <strong>and</strong> creating new wetl<strong>and</strong>sbefore filling any natural wetl<strong>and</strong>s.Many people oppose these proposals, contendingthat the Clean Water Act’s regulations <strong>and</strong> governmentwetl<strong>and</strong>s regulations are already too restrictive<strong>and</strong> costly. Farmers <strong>and</strong> developers see the law as acurb on their rights as property owners to fill in wetl<strong>and</strong>s.They also believe they should be compensatedfor any property value losses resulting from federalregulations protecting wetl<strong>and</strong>s.State <strong>and</strong> local officials want more discretion intesting for <strong>and</strong> meeting water quality st<strong>and</strong>ards. Theyargue that in many communities it is unnecessary <strong>and</strong>too expensive to test for all the water pollutants requiredby federal law.xHOW WOULD YOU VOTE? Should the U.S. Clean WaterAct be strengthened? Cast your vote online at http://biology.brookscole.com/miller14.22-7 DRINKING WATER QUALITYHow Is Urban Drinking Water Purified?The High-Tech Centralized ApproachCentralized water treatment plants that operatemuch like wastewater treatment plants can providesafe drinking water for city dwellers.Areas that depend on surface water for drinking usuallystore it in a reservoir for several days. This improvestaste <strong>and</strong> clarity by increasing dissolved oxygencontent <strong>and</strong> allowing suspended matter to settle. Nextthe water is pumped to a purification plant where it isfiltered as needed <strong>and</strong> chlorinated to meet governmentdrinking water st<strong>and</strong>ards. In areas with very puregroundwater sources, little treatment except disinfectionis necessary.How Can Modern Water-Purification SystemsBe Protected from Terrorist Acts? A DifficultProblemThe United States is upgrading security onwater purification <strong>and</strong> delivery systems, butit is difficult to protect such a vast <strong>and</strong> complexsystem.In the United States there is increased concern over terroristsadding harmful chemicals or biological agents toreservoirs <strong>and</strong> other parts of the nation’s vast networkof water purification systems. Reservoirs are so hugethat they are hard to poison with chemical or biologicalagents. Still, drinking water is hard to protect becauseof the large number of reservoirs, the vast network ofwater purification plants <strong>and</strong> water distribution systems,<strong>and</strong> accessibility of water systems on every streetthrough fire hydrants <strong>and</strong> service connections.514 CHAPTER 22 Water Pollution
Officials are working to find ways to make itharder to access or damage water purification plants<strong>and</strong> pipes. They are upgrading surveillance cameras<strong>and</strong> other security measures. They are also developingchemical tests <strong>and</strong> biological indicators that quicklyindicate the presence of chemical or biological agents,<strong>and</strong> they are working on emergency response plans incase of contamination. A major problem is that protectingthese systems will cost several billion dollars <strong>and</strong>so far Congress has not provided enough funds to getthe job done.How Can We Purify Rural Drinking Waterin Developing Countries? The Low-TechDecentralized ApproachResearchers have developed several simple <strong>and</strong>inexpensive ways for individuals <strong>and</strong> villagesin developing countries to purify drinking water.Ways to purify drinking water can be simple. In tropicalcountries without centralized water treatment systems,the WHO is urging people to purify drinkingwater by exposing a clear plastic bottle filled with contaminatedwater to intense sunlight. In the strong sunlightfound in most tropical countries, heat <strong>and</strong> thesun’s UV rays can kill infectious microbes in as little as3 hours. Painting one side of the bottle black can improveheat absorption in this simple solar disinfectionmethod. Where it has been used, incidences of dangerouschildhood diarrhea have decreased by 30–40%.In Bangladesh, households receive strips of clothfor filtering cholera-producing bacteria from drinkingwater. Villages where women use such strips to strainwater have cut cholera cases in half.Another simple method involves adding a smallamount of a chlorine-disinfectant solution to plastic orclay water-storage vessels with a narrow mouth <strong>and</strong>cap <strong>and</strong> a spigot—similar to what U.S. campers frequentlyuse. The storage vessel design helps protectthe disinfected water from additional bacterial contamination.Trials in Zambia, Kenya, <strong>and</strong> India showthat this approach can cut the rate of diarrheal diseasein half. This highly publicized method is now in use in15 developing countries.How Well Is Drinking Water QualityProtected by Law? The Legal ApproachMost developed countries have laws establishingdrinking water st<strong>and</strong>ards, but most developingcountries do not have such laws or do not enforcethem.About 54 countries, most of them in North America<strong>and</strong> Europe, have st<strong>and</strong>ards for safe drinking water.The U.S. Safe Drinking Water Act of 1974 requires theEPA to establish national drinking water st<strong>and</strong>ards,called maximum contaminant levels, for any pollutantsthat may have adverse effects on human health. However,such laws do not exist or are not enforced in mostdeveloping countries.Privately owned wells are not required to meetfederal drinking water st<strong>and</strong>ards for two reasons. Oneis that it costs at least $1,000 to test each well <strong>and</strong> ownerswould need to retest their water every few years.The other is that some homeowners oppose m<strong>and</strong>atorytesting <strong>and</strong> compliance.Health scientists call for strengthening the U.S.Safe Drinking Water Act in several ways. One is tocombine many of the drinking water treatment systemsthat serve fewer than 3,300 people with nearbylarger systems. Another is to strengthen <strong>and</strong> enforcepublic notification requirements about violations ofdrinking water st<strong>and</strong>ards. They also call for banningall toxic lead in new plumbing pipes, faucets, <strong>and</strong> fixtures(current law allows fixtures with up to 10% leadto be sold as lead free). According to the NaturalResources Defense Council (NRDC), such improvementswould cost about $30 a year per U.S. household.However, water-polluting industries are pressuringelected officials to weaken the Safe Drinking WaterAct. One proposal is to eliminate national tests ofdrinking water <strong>and</strong> public notification requirementsabout violations of drinking water st<strong>and</strong>ards.A second proposal is to allow states to give drinkingwater systems a permanent right to violate the st<strong>and</strong>ardfor a given contaminant if the provider claims itcannot afford to comply. Another suggestion is to eliminatethe requirement that water systems use affordable,feasible technology to remove cancer-causing contaminants.Finally, there are suggestions to greatly reducethe EPA budget for enforcing the Clean Water Act.xHOW WOULD YOU VOTE? Should the Safe Drinking WaterAct be strengthened? Cast your vote online at http://biology.brookscole.com/miller14.Is Bottled Water the Answer? Solutionor Expensive Rip-off?Some bottled water is not as pure as tap water <strong>and</strong>costs much more.Despite some problems, experts say the United Stateshas some of the world’s cleanest drinking water. Yetabout half of all Americans worry about getting sickfrom tap water contaminants, <strong>and</strong> many drink bottledwater or install expensive water purification systems.Studies reveal that in the United States bottledwater is 240 to 10,000 times more expensive than tapwater. In addition, about one-fourth of it is tap water,bacteria contaminate about one-third of it, <strong>and</strong> variouspotentially harmful organic chemicals contaminateabout one-fifth of it. On the other h<strong>and</strong>, some countrieshttp://biology.brookscole.com/miller14515
must rely on bottled water because some of their tapwater is too polluted to drink.Use of bottled water can also cause some environmentalproblems. For example, 1.4 million metric tons(1.5 million tons) of plastic bottles are thrown awayglobally each year, <strong>and</strong> toxic gases <strong>and</strong> liquids are releasedduring the manufacture of plastic water bottles.In addition, greenhouse gases <strong>and</strong> other air pollutantsare emitted by the fossil fuels burned to make plasticbottles <strong>and</strong> to deliver bottled water to suppliers.Before drinking expensive bottled water <strong>and</strong> buyingcostly home water purifiers, health officials suggestthat consumers have their water tested by localhealth authorities or private labs (not companies tryingto sell water purification equipment). The goals areto identify what contaminants (if any) must be removed<strong>and</strong> to determine the type of purificationneeded to remove such contaminants. Independent expertscontend that unless tests show otherwise, formost urban <strong>and</strong> suburban Americans served by largemunicipal drinking water systems, home water treatmentsystems are not worth the expense <strong>and</strong> maintenancehassles.Buyers should check out companies selling waterpurification equipment <strong>and</strong> be wary of claims that theEPA has approved a treatment device. Although theEPA does register such devices, it neither tests nor approvesthem.xHOW WOULD YOU VOTE? Should pollution st<strong>and</strong>ardsbe established for bottled water? Cast your vote online athttp://biology.brookscole.com/miller14.SolutionsWater Pollution• Prevent groundwater contamination• Greatly reduce nonpoint runoff• Reuse treated wastewater for irrigation• Find substitutes for toxic pollutants• Work with nature to treat sewage• Practice four R's of resource use (refuse, reduce,recycle, reuse)• Reduce resource waste• Reduce air pollution• Reduce poverty• Reduce birth ratesFigure 22-19 Solutions: methods for preventing <strong>and</strong> reducingwater pollution. Which two of these solutions do you believe arethe most important?How Can We Reduce Water Pollution?Individuals MatterShifting our priorities from controlling topreventing <strong>and</strong> reducing water pollution willrequire bottom-up political action by individuals<strong>and</strong> groups.It is encouraging that since 1970 most of the world’sdeveloped countries have enacted laws <strong>and</strong> regulationsthat have significantly reduced point-sourcewater pollution. Most of these improvements were theresult of bottom-up political pressure on elected officialsby individuals <strong>and</strong> organized groups. However,little has been done to reduce water pollution in mostdeveloping countries.To health scientists <strong>and</strong> environmentalists the nextstep is to increase efforts to reduce <strong>and</strong> prevent waterpollution in developed <strong>and</strong> developing countries byasking the question: How can we avoid producing waterpollutants in the first place? Figure 22-19 lists ways to dothis over the next several decades.This shift to preventing water pollution will not takeplace in developed countries without bottom-up politicalpressure on elected officials. It will not occur in developingcountries without similar pressure from citizensas well financial <strong>and</strong> technical aid from developedcountries. Figure 22-20 lists some actions you cantake to help reduce water pollution.What Can You Do?Water Pollution• Fertilize your garden <strong>and</strong> yard plants with manureor compost instead of commercial inorganic fertilizer.• Minimize your use of pesticides.• Never apply fertilizer or pesticides near a body of water.• Grow or buy organic foods.• Compost your food wastes.• Do not use water fresheners in toilets.• Do not flush unwanted medicines down the toilet.• Do not pour pesticides, paints, solvents, oil, antifreeze,or other products containing harmful chemicals downthe drain or onto the ground.Figure 22-20 What can you do? Ways to help reduce waterpollution.516 CHAPTER 22 Water Pollution
It is a hard truth to swallow, but nature does not care if welive or die. We cannot survive without the oceans, for example,but they can do just fine without us.ROGER ROSENBLATTCRITICAL THINKING1. Explain why dilution is not always the solution to waterpollution.2. For each of the eight categories of pollutants listed inTable 22-1, is it most likely to originate from (a) pointsources or (b) nonpoint sources?3. A large number of fish are found floating dead on alake during the summer. You are asked to determine thecause of the fish kill. What reason would you suggest forthe kill? What measurements would you make to verifyyour hypothesis?4. Are you for or against banning injection of liquid hazardouswastes into deep wells below drinking wateraquifers (Figure 22-9, p. 502)? Explain. What are the alternatives?5. When you flush a toilet, where does the wastewatergo? Trace the actual flow of this wastewater in yourcommunity from your toilet through sewers to a wastewatertreatment plant <strong>and</strong> from there to the environment.Try to visit a local sewage treatment plant to seewhat it does with your wastewater. Compare theprocesses it uses with those shown in Figure 22-16(p. 511). What happens to the sludge produced by thisplant? What improvements, if any, would you suggestfor this plant?6. Congratulations! You are in charge of sharply reducingwater pollution from nonpoint sources throughoutthe world. What are the three most important things youwould do?7. Congratulations! You are in charge of sharply reducinggroundwater pollution throughout the world. Whatare the three most important things you would do?8. Congratulations! You are in charge of providing safedrinking water for the poor <strong>and</strong> other people in developingcountries. What are the three most important thingsyou would do?PROJECTS1. In your community,a. What are the principal nonpoint sources of contaminationof surface water <strong>and</strong> groundwater?b. What is the source of drinking water?c. How is drinking water treated?d. How many times during each of the past 5 yearshave levels of tested contaminants violated federalst<strong>and</strong>ards? Were violations reported to the public?e. Has pollution led to fishing bans or warnings notto eat fish from any lakes or rivers in your region?f. Is groundwater contamination a problem? If so,where, <strong>and</strong> what has been done about the problem?g. Is there a vulnerable aquifer or critical rechargezone that needs protection to ensure the quality ofgroundwater? Is your local government aware ofthis? What action (if any) has it taken?2. Are storm drains <strong>and</strong> sanitary sewers combined orseparate in your area? Are there plans to reduce pollutionfrom runoff of storm water? If not, make an economicevaluation of the costs <strong>and</strong> benefits of developing separatestorm drains <strong>and</strong> sanitary sewers, <strong>and</strong> present yourfindings to local officials.3. Use library research, the Internet, <strong>and</strong> user interviewsto evaluate the relative effectiveness <strong>and</strong> costs of homewater purification devices. Determine the type or typesof water pollutants each device removes <strong>and</strong> the effectivenessof this process.4. Find out the price of tap water where you live. Thengo to a grocery or other store <strong>and</strong> get prices per liter (orother volume unit) on all the available types of bottledwater. Use these data to compare the price per liter ofvarious br<strong>and</strong>s of bottled water with the price of tapwater.5. Use the library or the Internet to find bibliographic informationabout William Ruckelshaus <strong>and</strong> Roger Rosenblatt,whose quotes appear at the beginning <strong>and</strong> end of thischapter.6. Make a concept map of this chapter’s major ideas, usingthe section heads, subheads, <strong>and</strong> key terms (in boldface).See material on the website for this book abouthow to prepare concept maps.LEARNING ONLINEThe website for this book contains study aids <strong>and</strong> manyideas for further reading <strong>and</strong> research. They include achapter summary, review questions for the entire chapter,flash cards for key terms <strong>and</strong> concepts, a multiple-choicepractice quiz, interesting Internet sites, references, <strong>and</strong> aguide for accessing thous<strong>and</strong>s of InfoTrac ® College Editionarticles. Log on tohttp://biology.brookscole.com/miller14Then click on the Chapter-by-Chapter area, choose Chapter22, <strong>and</strong> select a learning resource.http://biology.brookscole.com/miller14517
23 PestManagementPest &DiseaseControlCASE STUDYAlong Came a Spider—Biological Pest ControlSince agriculture began about 10,000 years ago, wehave been competing with insect pests for the food wegrow. Today we are not much closer to winning thiscompetition than we were then, mostly because of theastounding abilities of insect pests to multiply <strong>and</strong>,through natural selection, rapidly develop genetic resistanceto poisons we throw at them.Some Chinese farmers use a biological strategy tohelp control insect pests. Instead of spraying their rice<strong>and</strong> cotton fields with poisons, they build little strawhuts around the fields in the fall.These farmers are encouraging insects’ worstenemy, one that has hunted them for millions ofyears: spiders (Figure 23-1). The little huts are forhibernating spiders. Protected from the winter coldby the huts, far more of the hibernating spidersbecome active in the spring. Ravenous after theirwinter fast, they scuttle off into the fields to stalktheir insect prey.Even without human help, the world’s 30,000known species of spiders kill far more insects everyyear than insecticides do. A typical acre of meadowor woods contains an estimated 50,000–2 millionspiders, each devouring hundreds of insects peryear.Entomologist Willard H. Whitcomb found thatleaving strips of weeds around cotton <strong>and</strong> soybeanfields provides the kind of undergrowth favored byinsect-eating wolf spiders (Figure 23-1, left). He alsosings the praises of a type of banana spider, whichlives in warm climates <strong>and</strong> can keep a house clear ofcockroaches.In Maine, Daniel Jennings of the U.S. ForestService uses spiders to help control the spruce budworm,which devastates spruce <strong>and</strong> fir forests in theNortheast. Spiders also attack the much-feared gypsymoth, which destroys tree foliage.The idea of encouraging populations of spidersin fields, forests, <strong>and</strong> even houses scares some peoplebecause spiders have bad reputations. A few spiderspecies, such as the black widow, the brown recluse,<strong>and</strong> eastern Australia’s Sydney funnel web, are dangerousto people. But most spider species, includingthe ferocious-looking wolf spider, do not harm humans.Even the giant tarantula rarely bites people,<strong>and</strong> its venom is too weak to harm us or other largemammals unless we are allergic to it. As we seek newways to coexist with the insect rulers of the planet, wewould do well to be sure that spiders are on our side.This chapter looks first at the advantages <strong>and</strong> disadvantagesof the conventional chemical approach topest control based on using synthetic chemical pesticides.Then it discusses the advantages <strong>and</strong> disadvantagesof a variety of biological <strong>and</strong> ecological alternativesfor controlling pest populations.Figure 23-1 Natural capital: working with nature. Spiders are insects’ worst enemies. Most spiders, such asthe wolf spider (left) <strong>and</strong> the crab spider (right), found in many parts of the world, are harmless to humans.
A weed is a plant whose virtues have not yet been discovered.RALPH WALDO EMERSONThis chapter addresses the following questions:■■■■What are pesticides, <strong>and</strong> what types are used?What are the advantages <strong>and</strong> disadvantages of usingchemicals to kill insects <strong>and</strong> weeds?How well is pesticide use regulated in the UnitedStates?What are the alternatives to using conventionalpesticides, <strong>and</strong> what are the advantages <strong>and</strong> disadvantagesof each alternative?23-1 PESTICIDES: TYPES AND USESHow Does Nature Keep Pest Populationsunder Control? Natural EnemiesPredators, parasites, <strong>and</strong> disease organismsfound in nature control populations of most pestspecies as part of the earth’s free ecologicalservices.A pest is any species that competes with us for food, invadeslawns <strong>and</strong> gardens, destroys wood in houses,spreads disease, invades ecosystems, or is simply anuisance. Worldwide, only about 100 species of plants(which we call weeds), animals (mostly insects), fungi,<strong>and</strong> microbes (which can infect crop plants <strong>and</strong> livestockanimals) cause about 90% of the damage to thecrops we grow.In natural ecosystems <strong>and</strong> polyculture agroecosystems,natural enemies (predators, parasites, <strong>and</strong>disease organisms) control the populations of about98% of the potential pest species as part of the earth’sfree ecological services <strong>and</strong> thus help keep any onespecies from taking over for very long.When we clear forests <strong>and</strong> grassl<strong>and</strong>s, plant monoculturecrops (Figure 6-25, p. 118) <strong>and</strong> douse fields withpesticides, we upset many of these natural populationchecks <strong>and</strong> balances. Then we must devise ways to protectour monoculture crops, tree plantations, <strong>and</strong> lawnsfrom insects <strong>and</strong> other pests that nature once controlledat no charge.What Are Pesticides? Ways to Repel or KillPestsWe use chemicals to repel or kill pest organismsas plants have done for millions of years to defendthemselves against hungry herbivores.To help control pest organisms, we have developed avariety of pesticides or biocides—chemicals to kill orcontrol populations of organisms we consider undesirable.Common types of pesticides include insecticides(chemicals that kill insects by blocking reproduction,clogging their airways, or disrupting their nervoussystem), herbicides (chemicals that kill weeds by disruptingtheir metabolism <strong>and</strong> growth), fungicides (funguskillers), <strong>and</strong> rodenticides (rat <strong>and</strong> mouse killers).Biocide is a more accurate name for these chemicalsbecause most pesticides kill other organisms as well astheir pest targets.We did not invent the use of chemicals to repel orkill other species; plants have been producing chemicalsto ward off, deceive, or poison herbivores thatfeed on them for about 225 million years. This is anever-ending, ever-changing coevolutionary process:Herbivores overcome various plant defenses throughnatural selection; then new plant defenses are favoredby natural selection in this ongoing cycle of evolutionarypunch <strong>and</strong> counterpunch.As the human population grew <strong>and</strong> agriculturespread, people began looking for ways to protect theircrops, mostly by using chemicals to kill or repel insectpests. Sulfur was used as an insecticide well before500 B.C.; by the 1400s, people were applying toxic compoundsof arsenic, lead, <strong>and</strong> mercury to crops as insecticides.Farmers ab<strong>and</strong>oned this approach in the late1920s when the increasing number of human poisonings<strong>and</strong> fatalities prompted a search for less toxic substitutes.Bad news. Traces of these nondegradable toxicmetal compounds are still found in soils dosed withthem long ago.In the 1600s, farmers used nicotine sulfate, extractedfrom tobacco leaves, as an insecticide. In themid-1800s, two more natural pesticides were introduced:pyrethrum (obtained from the heads of chrysanthemumflowers) <strong>and</strong> rotenone (extracted from theroots of various tropical forest legumes). These firstgenerationpesticides were mainly natural chemicals orbotanicals borrowed from plants that had been defendingthemselves against insects eating them <strong>and</strong> herbivoresgrazing on them. In other words, we learned tocopy nature.In addition to protecting crops, people have usedchemicals produced by plants to repel or kill insects intheir households, yards, <strong>and</strong> gardens. Compared withsome commercial insecticides, these chemicals can beless expensive <strong>and</strong> less of a potential health hazard.See the website for this chapter to find out about naturalchemicals <strong>and</strong> methods that can be used to controlweeds <strong>and</strong> to repel or kill common pests such as ants,mosquitoes, cockroaches, flies, <strong>and</strong> fleas.What Is the Second Generation of Pesticides?Chemistry <strong>and</strong> Natural Plants to the RescueChemists have developed hundreds of chemicalsthat can kill or repel pests, <strong>and</strong> they have improvednatural pesticides produced by plants.A major pest control revolution began in 1939, whenentomologist Paul Müller discovered that DDThttp://biology.brookscole.com/miller14519
(dichlorodiphenyltrichloroethane), a chemical knownsince 1874, was a potent insecticide. DDT was the firstof the so-called second-generation pesticides. It soon becamethe world’s most used pesticide, <strong>and</strong> Müller receivedthe Nobel Prize in 1948 for his discovery. Sincethen, chemists have made hundreds of other pesticidesby making slight modifications in the molecules invarious classes of chemicals (Table 23-1).Since 1970 chemists have returned to natural repellents<strong>and</strong> poisons produced by plants. They havecopied nature by improving first-generation botanicalpesticides <strong>and</strong> adding microbotanicals (Table 23-1).They also developed pesticides based on a variety ofnatural chemicals found in the leaves <strong>and</strong> seeds of theremarkably versatile neem tree (Figure 11-17, p. 211,<strong>and</strong> Solutions, p. 213).In 2003, Colorado State University biologist JorgeVivanco discovered that knapweed, an invasive weedthat has taken over large areas of grazing l<strong>and</strong> in theWest, may hold the key to developing effective naturalherbicides. He <strong>and</strong> his colleagues found that the rootsof this plant secrete a toxic chemical compound (catechin)into the soil that can wipe out all other surroundingplants. They found that adding toxic catechin tothe soil or spraying it on weeds killed undesirableplants within a week. This new natural herbicide, discoveredby learning from nature, should soon be onthe market. Scientific curiosity <strong>and</strong> observing naturepay off.How Are Pesticides Used Today? AlmostEverywhereSince 1950 we have greatly increased our use ofa variety of increasingly toxic synthetic pesticideson crops, lawns, golf courses, <strong>and</strong> in households.Since 1950, pesticide use has risen more than 50-fold,<strong>and</strong> most of today’s pesticides are more than 10 timesas toxic as those used in the 1950s. About three-fourthsof these second-generation pesticides are used in de-Table 23-1 Major Types of PesticidesType Examples Persistence Biologically Magnified?InsecticidesChlorinated DDT, aldrin, dieldrin, toxaphene, lindane, High (2–15 years) Yeshydrocarbons chlordane, methoxychlor, mirexOrganophosphates Malathion, parathion, diazinon, TEPP, DDVP, Low to moderate (1–2 weeks), Nomevinphosbut some can last several yearsCarbamates Aldicarb, carbaryl (Sevin), propoxur, Low (days to weeks) Nomaneb, zinebBotanicals Rotenone, pyrethrum, <strong>and</strong> camphor Low (days to weeks) Noextracted from plants, synthetic pyrethroids(variations of pyrethrum), rotenoids(variations of rotenone), <strong>and</strong> neonicotinoids(variations of nicotine)Microbotanicals Various bacteria, fungi, protozoa Low (days to weeks) NoHerbicidesContact chemicals Atrazine, simazine, paraquat Low (days to weeks) NoSystemic chemicals 2,4-D, 2,4,5-T, Silvex, diuron, Mostly low (days to weeks) Nodaminozide (Alar), alachlor (Lasso),glyphosate (Roundup)Soil sterilants Tribulan, diphenamid, dalapon, butylate Low (days) NoFungicidesVarious chemicals Captan, pentachlorophenol, zeneb, methyl Most low (days) Nobromide, carbon bisulfideFumigantsVarious chemicals Carbon tetrachloride, ethylene dibromide, Mostly high Yes (for most)methyl bromide520 CHAPTER 23 Pest Management
veloped countries, but use in developing countries issoaring.After growing rapidly, pesticide use on crops inthe United States has leveled off since 1980, but nonagriculturaluses have increased. About one-fourth ofpesticide use in the United States is for ridding houses,gardens, lawns, parks, playing fields, swimmingpools, <strong>and</strong> golf courses of pests.According to the U.S. <strong>Environmental</strong> ProtectionAgency (EPA), the average lawn in the United States isdoused with 10 times more synthetic pesticides perhectare than U.S. cropl<strong>and</strong>. Golf courses get almost asmuch pesticide per hectare as lawns get. Childrenrolling around in the grass on treated lawns <strong>and</strong> in cityparks can pick up dangerous levels of some of thesechemicals. They are especially vulnerable because theyare still developing <strong>and</strong> can absorb more of thesechemicals in proportion to their body weight thanadults do. Health scientists warn that exposures tothese <strong>and</strong> other toxic chemicals early in life can increasethe risk of developing learning disabilities,behavioral problems, some forms of cancer, <strong>and</strong> otherchronic diseases in childhood <strong>and</strong> in adulthood. Pesticidecompany officials dispute such claims.The EPA also estimates that 84% of U.S. homesuse pesticide products such as bait boxes, pest strips,bug bombs, flea collars, pesticide pet shampoos, <strong>and</strong>weed killers. What pesticide products are used whereyou live?Sending someone roses, carnations, or other cutflowers is a nice gesture. Most of the cut flowers soldin the United States are imported from countries suchas Colombia <strong>and</strong> Ecuador. Bad news for romance. Accordingto a 1995 report by the World Resources Institute,flowers from these countries are heavily dosedwith fungicides, insecticides, <strong>and</strong> herbicides. Thisposes health threats to the tens of thous<strong>and</strong>s of workers,most of them women, who work in flower farms<strong>and</strong> greenhouses for about $5 a day. <strong>Environmental</strong>istsurge us to buy organic flowers.*Some pesticides, called broad-spectrum agents, aretoxic to many species; others, called selective or narrowspectrumagents, are effective against a narrowly definedgroup of organisms. Pesticides vary in their persistence,the length of time they remain deadly in theenvironment (Table 23-1). In 1962, biologist RachelCarson warned against relying on synthetic organicchemicals to kill insects <strong>and</strong> other species we deempests (Individuals Matter, p. 27).*You can search for local farms, farmers’ markets, <strong>and</strong> communitygroups that supply fresh <strong>and</strong> dried organic flowers atwww.localharvest.org. There are not many organic flower growersin the United States, but this could change if the dem<strong>and</strong>increased.23-2 THE CASE FOR PESTICIDESWhat Are the Advantages of ModernSynthetic Pesticides? Many BenefitsModern pesticides save lives, increase foodsupplies, increase profits for farmers, work fast,<strong>and</strong> are safe if used properly.Proponents of conventional chemical pesticides contendthat their benefits outweigh their harmful effects.Conventional pesticides have a number of importantbenefits.They save human lives. Since 1945, DDT <strong>and</strong> otherchlorinated hydrocarbon <strong>and</strong> organophosphate insecticidesprobably have prevented the premature deaths ofat least 7 million people (some say as many as 500 million)from insect-transmitted diseases such as malaria(carried by the Anopheles mosquito), bubonic plague(carried by rat fleas), <strong>and</strong> typhus (carried by body lice<strong>and</strong> fleas).They increase food supplies. According to the UNFood <strong>and</strong> Agriculture Organization, about 55% of theworld’s potential human food supply is lost to pests—about two-thirds of that before harvest <strong>and</strong> the rest after.Pests before <strong>and</strong> after harvest destroy an estimated37% of the potential U.S. food supply; insects cause 13%of these losses, plant pathogens 12%, <strong>and</strong> weeds 12%.Without pesticides, these losses would be worse, <strong>and</strong>food prices would rise. Figure 23-2 (p. 522) shows fiveof the most common insect pests in the United States<strong>and</strong> their ranges.They increase profits for farmers. Pesticide companiesestimate that every $1 spent on pesticides leadsto an increase in U.S. crop yields worth approximately$4 (but studies have shown this benefit dropsto about $2 if the harmful effects of pesticides areincluded).They work faster <strong>and</strong> better than alternatives. Pesticidescontrol most pests quickly at a reasonable cost,have a long shelf life, are easily shipped <strong>and</strong> applied,<strong>and</strong> are safe when h<strong>and</strong>led properly by farm workers.When genetic resistance occurs, farmers can usestronger doses or switch to other pesticides.When used properly, their health risks are very lowcompared with their benefits. According to ElizabethWhelan, director of the American Council on Science<strong>and</strong> Health (ACSH), which presents the position of thepesticide industry, “The reality is that pesticides, whenused in the approved regulatory manner, pose no riskto either farm workers or consumers.” According tothe EPA, the worst-case scenario is that synthetic pesticidesin food cause 0.5–1% of all cancer-related deathsin the United States, or 3,000–6,000 premature deathsper year, far less than the estimated number of livessaved each year by pesticides.http://biology.brookscole.com/miller14521
Figure 23-2 Geographic range of five majorpests in the lower 48 states of the UnitedStates. (Data from U.S. Department of Agriculture)GrasshopperAccording to studies by microbiologistBruce Ames, we consume farmore natural pesticides produced byplants than synthetic ones producedby humans. Ames also contends thatexposure to natural pesticides in foodcauses more cancers than exposureto synthetic pesticides—although neitherexposure poses much risk.Newer pesticides are safer <strong>and</strong> moreeffective than many older pesticides.Greater use is being made of botanicals<strong>and</strong> microbotanicals (Table 23-1).Derived originally from plants, theyare safer to users <strong>and</strong> less damagingto the environment than many olderpesticides. Genetic engineering is alsobeing used to develop pest-resistantcrop strains <strong>and</strong> genetically alteredcrops that produce pesticides.Many new pesticides are used atmuch lower rates per unit area than olderproducts. For example, applicationamounts per hectare for many newherbicides are 1/100 the rates for olderones, <strong>and</strong> genetically engineeredcrops could reduce the use of toxicinsecticides.Pink bollwormWhat Is the Ideal Pesticide?An Ongoing SearchScientists work to develop more effective <strong>and</strong> saferpesticides, but through coevolution pests find wayscombat the pesticides we throw at them.Scientists continue to search for the ideal pest-killingchemical, which would have these qualities:■ Affect only the target organism■ Not cause genetic resistance in the target organism■ Disappear or break down into harmless chemicalsafter doing its job■ Be more cost effective than doing nothingThe search continues, but so far no known naturalor synthetic pesticide chemical meets all or even mostof these criteria.ranges overlapGypsy mothcaterpillarEuropean red miteBoll weevil23-3 THE CASE AGAINST PESTICIDESWhat Is the Major Problem with UsingPesticides? Insects Have an EvolutionaryAdvantageInsects can rapidly become genetically resistant towidely used pesticides.Opponents of widespread pesticide use believe theirharmful effects outweigh their benefits. They cite severalserious problems with the use of conventionalpesticides.The major problem is that the widespread use ofsynthetic pesticides accelerates the development of genetic522 CHAPTER 23 Pest Management
U.S. Department of Agricultureresistance to these chemicals by pest organisms. Insectsbreed rapidly (Figure 23-3), <strong>and</strong> within 5–10 years(much sooner in tropical areas) they can develop immunityto pesticides through natural selection <strong>and</strong>come back stronger than before (Spotlight, p. 524).Weeds <strong>and</strong> plant disease organisms also develop geneticresistance, but more slowly. Since 1945, about 520species of insects (Figure 23-4), 280 plant disease organisms,<strong>and</strong> 150 weed species have developed geneticresistance to one or more pesticides.Because of genetic resistance, many insecticides(such as DDT) no longer do a good job of protectingpeople from insect-transmitted diseases in some partsof the world. This has led to the resurgence of tropicaldiseases such as malaria. Genetic resistance can alsoput farmers on a pesticide treadmill, whereby they paymore <strong>and</strong> more for a pest control program that oftenbecomes less <strong>and</strong> less effective.What Are Other <strong>Problems</strong> with UsingPesticides? Some Serious ConcernsPesticides can wipe out natural enemies of pestspecies, create new pest species, <strong>and</strong> end upin the environment, <strong>and</strong> some can harm wildlife<strong>and</strong> people.Another problem is that most pesticides kill beneficialspecies as well as the target pest species. For example, mostinsecticides kill natural predators <strong>and</strong> parasites thathelp control the populations of insect pest species.Wiping out natural predators can unleash new pests,Figure 23-3 A boll weevil, just one example of an insect capableof rapid breeding. In the cotton fields of the southern UnitedStates, these insects lay thous<strong>and</strong>s of eggs, producing a newgeneration every 21 days <strong>and</strong> as many as six generations in asingle growing season. Attempts to control the cotton boll weevilaccount for at least one-fourth of insecticide use in theUnited States. For example, it typically takes about 114 grams(one-quarter pound) of pesticides to make one cotton T-shirt.Some farmers are increasing their use of natural predators <strong>and</strong>other biological methods to control this major pest.Number of genetically resistant insect species600500400300200100DDT/cyclodienes (1946)1950 1960 1970 1980YearNeonicotinoids(1995)Pyrethroids (1978)Carbamates (1972)Organophosphates (1965)1990 2000 2010Figure 23-4 Between 1945 <strong>and</strong> 2000 about 520 insect speciesbecame genetically resistant to one or more widely used pesticides.Blue bars show time span over which types of pesticidegroups have been used. Dates in parentheses indicate the yearin which genetic resistance was first documented. (Data fromU.S. Department of Agriculture <strong>and</strong> the Worldwatch Institute)whose populations their predators had previously heldin check, <strong>and</strong> can cause other unexpected effects (Connections,p. 173). Of the 300 most destructive insectpests in the United States, 100 were once minor peststhat became major pests after widespread use of insecticides.With wolf spiders (Figure 23-1, left), wasps,predatory beetles, <strong>and</strong> other natural enemies out of theway, the population of a rapidly reproducing insectpest species can rebound <strong>and</strong> even get larger withindays or weeks after initially being controlled.Also, pesticides do not stay put. According to the U.S.Department of Agriculture (USDA), only 0.1–2% of theinsecticide applied to crops by aerial (Figure 23-5,p. 524) or ground spraying reaches the target pests.Also, less than 5% of herbicide applied to crops reachesthe target weeds. In other words, 98–99.9% of the pesticides<strong>and</strong> more than 95% of the herbicides we applyend up in the air, surface water, groundwater, bottomsediments, food, <strong>and</strong> nontarget organisms, includinghumans <strong>and</strong> wildlife (Figure 19-4, p. 411). Crops thathave been genetically altered to release small amountsof pesticides directly to pests can help overcome thisproblem. But this can promote genetic resistance tosuch pesticides.Some pesticides harm wildlife. According to theUSDA <strong>and</strong> the U.S. Fish <strong>and</strong> Wildlife Service, each yearpesticides applied to cropl<strong>and</strong> in the United Stateswipe out about 20% of U.S. honeybee colonies <strong>and</strong>damage another 15%. This costs farmers at least $200million per year from reduced pollination of vital crops.Pesticides also kill more than 67 million birds <strong>and</strong> 6–14million fish, <strong>and</strong> menace about one of every five endangered<strong>and</strong> threatened species in the United States.http://biology.brookscole.com/miller14523
Studies have linked exposure to some pesticidesto childhood leukemia, Parkinson’s disease, immunesystem disorders, <strong>and</strong> prostate <strong>and</strong> breast cancer.Some scientists are becoming increasingly concernedabout possible genetic mutations, birth defects,nervous system disorders (especially behavioral disorders),<strong>and</strong> effects on the immune <strong>and</strong> endocrine systemsfrom long-term exposure to low levels of variouspesticides (Case Study, p. 416). The pesticide industrydisputes such claims.National Archives/EPA DocumericaFigure 23-5 A crop duster spraying an insecticide on grapevinessouth of Fresno, California. Aircraft apply about 25% ofthe pesticides used on U.S. cropl<strong>and</strong>, but only 0.1–2% of theseinsecticides actually reach the target pests. To compensate forthe drift of pesticides from target to nontarget areas, aircraftapply up to 30% more pesticide than ground-based applicationdoes.Case Study: How Successful Have PesticidesBeen in Reducing Crop Losses in the UnitedStates? Barely Holding the LineA slightly higher percentage of the U.S. foodsupply is lost to pests today than in the 1940s.Studies indicate that pesticides have not been as effectivein reducing crop losses to pests in the United Statesas agricultural experts had hoped, mostly because ofgenetic resistance <strong>and</strong> reductions in natural predators.David Pimentel, an expert in insect ecology, hasevaluated data from more than 300 agriculturalscientists <strong>and</strong> economists <strong>and</strong> come to three majorconclusions.A Superbug Calledthe Silverleaf WhiteflySome pesticides can threaten human health. The WorldHealth Organization (WHO) <strong>and</strong> the UN EnvironmentProgramme (UNEP) estimate that each year pesticidesseriously poison at least 3 million agricultural workersin developing countries <strong>and</strong> at least 300,000 in theUnited States. This causes 20,000–40,000 deaths (about25 in the United States) per year. Health officials believethe actual number of pesticide-related illnesses<strong>and</strong> deaths among the world’s farm workers is greatlyunderestimated because of poor record-keeping, lackof doctors, inadequate reporting of illnesses, <strong>and</strong> faultydiagnoses.Each year about 110,000 Americans, mostly children,get sick from misuse or unsafe storage of pesticidesin the home, <strong>and</strong> about 20 die. According tostudies by the National Academy of Sciences, exposureto pesticide residues in food causes 4,000–20,000cases of cancer per year in the United States. Becauseroughly half of all people with cancer die prematurely,this amounts to about 2,000–10,000 premature deathsper year in the United States from exposure to legallyallowed pesticide residues in foods. This is higher thanthe EPA estimate of 3,000–6,000 premature deaths peryear. The pesticide industry disputes these claims.The ideal insect pest would attacka variety of plants, be highly prolific<strong>and</strong> have a short generationSPOTLIGHT time, have few natural predators,<strong>and</strong> be genetically resistant to anumber of pesticides.Bad news. The silverleaf whitefly has these characteristics,<strong>and</strong> farmers who have encountered it callit a superbug. This tiny white insect escaped frompoinsettia greenhouses in Florida in 1986 <strong>and</strong> hasbecome established in Florida, Arizona, California,<strong>and</strong> Texas.It is known to eat at least 500 species of plantsbut does not like onions <strong>and</strong> asparagus <strong>and</strong> has nonatural enemies. Dense swarms of these tiny insectsattack plants, suck them dry, <strong>and</strong> leave themwithered <strong>and</strong> dying.U.S. crop losses from this insect are greater than$200 million a year <strong>and</strong> are growing. Scientists arescouring the world looking for natural enemies ofthis superbug. Stay tuned.Critical ThinkingWhat is the ecological lesson to be learned fromsilverleaf whitefly?524 CHAPTER 23 Pest Management
What Goes Around CanCome AroundU.S. pesticide companies make<strong>and</strong> export to other countries pesticidesthat have been banned orCONNECTIONS severely restricted—or never evenapproved—for use in the UnitedStates. Other industrial countries also exportbanned <strong>and</strong> unapproved pesticides.But what goes around can come around. Inwhat environmentalists call a circle of poison,residues of some of these banned or unapprovedchemicals exported to other countries can returnto the exporting countries on imported food.Persistent pesticides such as DDT can also becarried by winds from other countries to theUnited States.<strong>Environmental</strong>ists have urged the U.S. Congress—withoutsuccess—to ban such exports. Supportersof pesticide exports argue that such salesincrease economic growth <strong>and</strong> provide jobs <strong>and</strong>that banned pesticides are exported only with theconsent of the importing countries. They also contendthat if the United States did not export pesticides,other countries would.In 1998, more than 50 countries met to finalizean international treaty that requires exportingcountries to have informed consent from importingcountries for exports of 22 pesticides <strong>and</strong> 5 industrialchemicals. In 2000, more than 100 countriesdeveloped an international agreement to banor phase out the use of 12 especially hazardouspersistent organic pollutants (POPs)—9 of thempersistent chlorinated hydrocarbon pesticides suchas DDT. In 2004, this treaty went into effect.Critical ThinkingShould U.S. companies be allowed to export pesticidesthat have been banned, severely restricted,or not approved for use in the United States?Explain.First, although the use of synthetic pesticides hasincreased 33-fold since 1942, about 37% of the U.S.food supply is lost to pests today compared to 31% inthe 1940s. Since 1942 losses attributed to insects almostdoubled from 7% to 13% despite a 10-fold increase inthe use of synthetic insecticides.Second, the estimated environmental, health, <strong>and</strong>social costs of pesticide use in the United States rangefrom $4 billion to $10 billion per year. The InternationalFood Policy Research Institute puts the estimatemuch higher, at $100–200 billion per year, or $5–10 indamages for every dollar spent on pesticides.Third, alternative pest management practices couldhalve the use of chemical pesticides on 40 major U.S.crops without reducing crop yields.Numerous studies <strong>and</strong> experience show that pesticideuse can be reduced significantly without reducingyields, <strong>and</strong> in some cases, yields increase. Swedenhas cut pesticide use in half with almost no decrease incrop yields. Campbell Soup uses no pesticides ontomatoes it grows in Mexico, <strong>and</strong> yields have notdropped. After a two-thirds cut in pesticide use on ricein Indonesia, yields increased by 15%.xHOW WOULD YOU VOTE? Do the advantages of using syntheticchemical pesticides outweigh their disadvantages?Cast your vote online at http://biology.brookscole.com/miller14.23-4 PESTICIDE REGULATIONHow Are Pesticides Regulated in the UnitedStates? The Legal ApproachAfederal law regulates pesticide use in the UnitedStates, but it can be improved.The Federal Insecticide, Fungicide, <strong>and</strong> RodenticideAct (FIFRA) was established by Congress in 1947 <strong>and</strong>amended in 1972. It requires EPA approval for use ofall commercial pesticides. Pesticide companies mustevaluate the biologically active ingredients in theirproducts for toxicity to animals <strong>and</strong>, by extrapolation,to humans. EPA officials then review such data frompesticide companies to determine whether the pesticidecan be registered for use. When a pesticide is approvedfor use on fruits or vegetables, the EPA sets atolerance level specifying the amount of toxic pesticideresidue that can legally remain on the crop when theconsumer eats it.The EPA banned or severely restricted the use of56 active pesticide ingredients between 1972 <strong>and</strong> 2004.The banned chemicals include most chlorinated hydrocarboninsecticides, several carbamates <strong>and</strong>organophosphates, <strong>and</strong> the systemic herbicides 2,4,5-T<strong>and</strong> Silvex (Table 23-1). However, there is still controversyover the ban of DDT <strong>and</strong> other chlorine-containingpesticides (Case Study, p. 526).Also, the 1996 Food Quality Protection Act (FQPA)increased public protection from pesticides. It requiresmanufacturers to demonstrate the safety of active ingredientsin new pesticide products for infants <strong>and</strong>children. The EPA must also consider the effects of simultaneousexposures to more than one pesticidewhen setting pesticide tolerance levels.However, banned or unregistered pesticides maybe manufactured in the United States <strong>and</strong> exported toother countries (Connections, above left). Also, accordingto scientific literature reviewed by the EPA,http://biology.brookscole.com/miller14525
approximately 165 of the active ingredients approvedfor use in U.S. pesticide products are known or suspectedhuman carcinogens. By 2004, only 43 of thesepesticide chemicals had been banned by the EPA ordiscontinued voluntarily by manufacturers.A study of Missouri children revealed a statisticallysignificant correlation between childhood braincancer <strong>and</strong> use of various pesticides in the home,including flea <strong>and</strong> tick collars, no-pest strips, <strong>and</strong>chemicals used to control pests such as roaches, ants,spiders, mosquitoes, <strong>and</strong> termites. Also, EPA scientistspublished a report in 2000 indicating that atrazine(widely used as a weed killer by farmers) could causeuterine, prostate, <strong>and</strong> breast cancer in humans <strong>and</strong> disruptreproductive development.Also, according to studies by the National Academyof Sciences, federal laws regulating pesticide usein the United States are inadequate <strong>and</strong> poorly enforcedby the EPA, Food <strong>and</strong> Drug Administration(FDA), <strong>and</strong> USDA. Another study by the NationalAcademy of Sciences found that up to 98% of the potentialrisk of developing cancer from pesticideresidues on food grown in the United States would beeliminated if EPA st<strong>and</strong>ards were as strict for pre-1972pesticides as they are for later ones.The pesticide industry disputes these findings <strong>and</strong>says that eating food grown by using pesticides for thepast 50 years has never harmed anyone in the UnitedStates. The industry also claims that the benefits ofpesticides far outweigh their disadvantages.<strong>Environmental</strong>ists <strong>and</strong> a number of health officialscall for strengthening U.S. pesticide laws to helpprevent contamination of groundwater by pesticides,improve the safety of farm workers who are exposedto high levels of pesticides, <strong>and</strong> allow citizens to suethe EPA for not enforcing the law. Pesticide manufacturersstrongly oppose such changes <strong>and</strong> lobby electedofficials to weaken FIFRA.Pesticide control laws in the United States couldbe improved. But most other countries (especiallydeveloping countries) have not made nearly asmuch progress as the United States has in regulatingpesticides.Case Study: Revisiting DDT— from Richesto RagsSince 1972 DDT has been banned in developedcountries, <strong>and</strong> there is controversy over itscontinuing use in some developing countries tocombat malaria.After its discovery in 1939, DDT quickly became theworld’s most widely used pesticide. It was a cheap<strong>and</strong> effective weapon to kill crop-devouring insects<strong>and</strong> mosquitoes <strong>and</strong> other insects that transmitted infectiousdiseases such as malaria. There is little doubtthat single-h<strong>and</strong>edly this chemical has saved manymillions of lives from infectious diseases.DDT’s role as a “chemical hero” began changingin 1962 when Rachel Carson published her book SilentSpring, which warned of the dangers of DDT <strong>and</strong> otherbroad-spectrum <strong>and</strong> persistent pesticides (IndividualsMatter, p. 27). This led to much closer scrutiny of suchpesticides <strong>and</strong> public pressure to ban DDT <strong>and</strong> its persistentchlorinated hydrocarbon chemical cousins thatwere also widely used as pesticides (Table 23-1).In 1970, the U.S. <strong>Environmental</strong> Protection Agencywas established. In 1972, the earlier Federal Insecticide,Fungicide, <strong>and</strong> Rodenticide Act (FIFRA) wasamended to give the EPA control over the registration<strong>and</strong> regulation of pesticides in the United States.In that same year, the EPA banned the use of DDT(<strong>and</strong> later the use of its similar chemical cousins) in theUnited States. The EPA banned DDT for several reasons.First, it is a broad-spectrum chemical that killsmany beneficial insects along with its target species.Second, it is a persistent chemical that remains in onechemical form or another in the environment for up to15 years <strong>and</strong> can be biologically magnified in foodwebs (Figure 19-4, p. 411). Third, it reduced populationsof many birds <strong>and</strong> other species, especially thosefeeding at high trophic levels in food webs, such as eagles<strong>and</strong> peregrine falcons. Fourth, there was some preliminarybut not conclusive evidence that it couldcause cancer in humans. Fifth, it was becoming less effectivebecause a growing number of insect pests thatconsume crops <strong>and</strong> transmit diseases had developedgenetic resistance to DDT <strong>and</strong> other chlorinated hydrocarbonpesticides. Some contend political pressurefrom the public <strong>and</strong> a growing environmental movementalso played a role in the ban of this chemical.Pesticide manufacturers opposed the ban butwere more than happy to supply more expensive alternatives.Debate over the DDT ban in the United Statescontinues today. There was considerable evidence forits ecological harm <strong>and</strong> more evidence has accumulated.But pesticide industry scientists say there wasnot enough evidence then (<strong>and</strong> today) that DDT cancause cancer in humans—one of the key reasons usedto ban the chemical under the FIFRA pesticide law.Critics of the ban try to separate the possibleharmful effects of DDT on humans from its effects onother species <strong>and</strong> ecosystems. They pose such questionsas, Do we want to protect penguins or people?Scientists say this is too simplistic because we cannotseparate harm to the environment from harm topeople. This is especially true for widely used <strong>and</strong>long-lived chemicals such as DDT that can build up infood webs <strong>and</strong> are now found in even the most remoteparts of the world.This was the heart of Rachel Carson’s warning.Traces of these chemicals are everywhere, including526 CHAPTER 23 Pest Management
our bodies, <strong>and</strong> we should be concerned about theirpossible long-term effects on both the environment <strong>and</strong>human health. Critics of pesticides contend that thebest way to reduce such risks is to prevent such chemicalsfrom reaching the environment. This would spurus to look for safer, affordable alternative chemicals<strong>and</strong> for biological <strong>and</strong> ecological ways to control pests.In addition, since 1975 there has been growing evidencethat very low levels of chlorine-containing pesticides<strong>and</strong> a variety of other fat-soluble chemicalsmay disrupt the human immune, endocrine, <strong>and</strong> nervoussystems by mimicking <strong>and</strong> disrupting the effectsof natural hormones in our bodies (Case Study, p. 416).The scientific jury is still out on if or how these chemicalsare harmful to humans.Critics of the ban on DDT <strong>and</strong> other chlorinatedhydrocarbon pesticides say the ban ended up increasinghuman deaths from exposure to pesticides. Why?Organophosphates that were less persistent <strong>and</strong> ecologicallydamaging replaced chlorinated hydrocarbonpesticides. But it turned out that these chemicals werehundreds <strong>and</strong> in some cases thous<strong>and</strong>s of times moretoxic to humans than DDT <strong>and</strong> its chemical cousins.As a result, these replacements killed a large numberof farm workers <strong>and</strong> children playing in sprayed fieldsor otherwise coming into contact with organophosphatepesticides.This led the EPA to ban the use of many organophosphates<strong>and</strong> then carbamates that followed them(Table 23-1). Since then new groups of pesticides suchas botanicals <strong>and</strong> microbotanicals have been developedthat are less harmful to humans <strong>and</strong> the environment.Although DDT is banned in developed countries,it has not gone away. It is manufactured legally in severalcountries <strong>and</strong> is still used to treat crops <strong>and</strong> to killdisease-carrying insects in a number of developingcountries.In 2000, delegates from 122 countries agreed on aglobal pollution prevention treaty to control, reduce,phase out, <strong>and</strong> destroy stockpiles of 12 persistent organicpollutants (POPs). This list of chemicals, calledthe dirty dozen, includes DDT <strong>and</strong> eight other chlorinecontainingpersistent pesticides.The treaty, which went into effect in 2004, allows25 countries to continue using DDT to combat malariauntil safer alternatives are available. This was allowedbecause the health benefits of using DDT to decreasemalaria far outweigh the remote possibility of harm topeople. Although DDT may prove to have some as-yetunknown harmful effects on humans, malaria killsabout 1 million people a year—most of them children—<strong>and</strong>sickens <strong>and</strong> weakens several hundred millionpeople.In addition, spraying low levels of DDT indoors<strong>and</strong> on bed nets would not spread large amounts of thechemical into the environment compared to blanketingcrop fields with DDT. This should slow the developmentof genetic resistance to DDT in malaria-carryingmosquitoes. Also, after the ban it was discovered thateven when mosquitoes developed genetic resistance toDDT, it still acted as a repellent <strong>and</strong> irritant that drovenocturnal mosquitoes out of homes before they had achance to bite. Despite this decision the World Bank<strong>and</strong> other international aid agencies do not provideloans or funds for malaria-control projects that involvethe use of DDT.Opponents argue that a complete ban on DDT willspur research efforts to find other cost-effective pesticidesfor killing malaria-causing mosquitoes <strong>and</strong> tofind alternatives to using pesticides. They supportWHO efforts to use a variety of methods to reduce thethreat of malaria.xHOW WOULD YOU VOTE? Should DDT <strong>and</strong> other persistentchlorine-containing pesticides still be used to control malariathroughout the world? Cast your vote online at http://biology.brookscole.com/miller14.23-5 ALTERNATIVES TOCONVENTIONAL CHEMICALPESTICIDESWhat Should Be the Primary Goal of PestControl? Pest Reduction Not EradicationReducing crop damage to an economically tolerablelevel should be the primary goal of pest controlefforts.In most cases, the primary goal of spraying with conventionalpesticides is to eradicate pests in the area affected.However, critics say the primary goal of anypest control strategy should be to reduce crop damageto an economically tolerable level. The point at whichthe economic losses caused by pest damage outweighthe cost of applying a pesticide is called the economicthreshold. Because of the risk of increased genetic resistance<strong>and</strong> other problems, continuing to spray beyondthe economic threshold can make matters worse <strong>and</strong>can cost more than it is worth.The problem is determining when the economicthreshold has been reached. This involves carefulmonitoring of crop fields to assess crop damage <strong>and</strong>determine pest populations.Many farmers do not want to bother doing this<strong>and</strong> instead are likely to use additional insurance sprayingto be on the safe side. One method used to reduceunnecessary insurance spraying is the purchase of pestlossinsurance. It pays farmers for losses caused by pests<strong>and</strong> is usually cheaper than using excess pesticides.Another source of increased pesticide use is cosmeticspraying. Extra pesticides are used because mostconsumers often buy only the best-looking fruits <strong>and</strong>http://biology.brookscole.com/miller14527
vegetables even though there is nothing wrong withblemished ones. The only solution to this problem isconsumer education. Would you buy blemished fruits<strong>and</strong> vegetables?What Are Other Ways to Control Pests?Copy NatureA mix of cultivation practices <strong>and</strong> biological <strong>and</strong>ecological alternatives to conventional chemicalpesticides can help control pests.Many scientists believe we should greatly increase theuse of biological, ecological, <strong>and</strong> other alternativemethods for controlling pests <strong>and</strong> diseases that affectcrops <strong>and</strong> human health. A number of methods areavailable.One is the use of various cultivation practices tofake out pest species. Examples are rotating the typesof crops planted in a field each year, adjusting plantingtimes so major insect pests either starve or get eaten bytheir natural predators, <strong>and</strong> growing crops in areaswhere their major pests do not exist. Also, farmers canincrease the use of polyculture, which uses plant diversityto reduce losses to pests.Homeowners can reduce weed invasions by cuttinggrass no lower than 8 centimeters (3 inches) high.This provides a dense enough cover to keep out crabgrass<strong>and</strong> many other undesirable weeds. Homeownerscan also avoid growing plants such as roses thatattract a number of insect pests <strong>and</strong> grow plants suchas chrysanthemums <strong>and</strong> marigolds that repel many insectpests.Genetic engineering can be used to speed up the developmentof pest- <strong>and</strong> disease-resistant crop strains (Figure23-6). But there is controversy over whether theprojected advantages of the increasing use of geneticallymodified plants <strong>and</strong> foods outweigh their projecteddisadvantages (Figure 14-19, p. 292).We can increase the use of biological pest control. Itinvolves importing natural predators (Figures 23-1<strong>and</strong> 23-7), parasites, <strong>and</strong> disease-causing bacteria <strong>and</strong>viruses to help regulate pest populations. More than1,000 species have been introduced to help control pestspecies in North America, with generally favorable results.For example, several species of European beetlesare being used in the United States to help reduce thepurple loosestrife plant that has invaded many U.S.wetl<strong>and</strong>s (Figure 13-5, p. 256).Biological control focuses on selected targetspecies, is nontoxic to other species, <strong>and</strong> minimizes geneticresistance. Also, it can save large amounts ofmoney—about $25 for every $1 invested in controlling70 pests in the United States. However, biologicalagents cannot always be mass produced, are oftenslower acting <strong>and</strong> more difficult to apply than conventionalpesticides, can sometimes multiply <strong>and</strong> becomeMonsantoFigure 23-6 The results of one example of using geneticengineering to reduce pest damage. Both tomato plants wereexposed to destructive caterpillars. The normal plant’s leavesare almost gone (left), whereas the genetically altered plant(right) shows little damage.Figure 23-7 Natural capital: biological pest control. An adultconvergent ladybug (right) is consuming an aphid (left).pests themselves, <strong>and</strong> must be protected from pesticidessprayed in nearby fields.Another strategy is insect birth control. This involvesraising males of insect pest species in the laboratory<strong>and</strong> sterilizing them by exposure to radiation orchemicals. The sterile males are released into an infestedarea to mate with fertile wild females who thenlay eggs that never hatch. This method has been usedto control the screwworm fly, a major livestock pestfrom the southeastern United States (Figure 23-8), <strong>and</strong>the Mediterranean fruit fly (medfly) during a 1990 outbreakin California. However, problems include highcosts, difficulties in knowing the mating time <strong>and</strong> behaviorof each target insect, <strong>and</strong> the large number ofsterile males needed. In addition, there are few speciesfor which this strategy works, <strong>and</strong> sterile males mustbe released continually to prevent pest resurgence.Sex attractants can also help control pests. Plants<strong>and</strong> animals have evolved a variety of natural attractantscalled pheromones. Scientists have identifiedmany of these natural chemicals <strong>and</strong> use them to lure528 CHAPTER 23 Pest Management
U.S. Department of AgricultureAgricultural Research Service/USDAFigure 23-8 Infestation of a steer by screwworm fly larvae inTexas. An adult steer can be killed in 10 days by thous<strong>and</strong>s ofmaggots feeding on a single wound.Figure 23-9Pheromones canhelp control populationsof pests, suchas the red scalemites that have infestedthis lemongrown in Florida.pests such as Japanese beetles into traps or to attracttheir natural predators into crop fields (usually themore effective approach). Pheromones can also be releasedinto the air to confuse insects <strong>and</strong> make it difficultfor them to find mates. More than 50 companiesworldwide sell about 250 pheromones to control pests(Figure 23-9).These chemicals attract only one species, work intrace amounts, have little chance of causing genetic resistance,<strong>and</strong> are not harmful to nontarget species.However, it is costly <strong>and</strong> time consuming to identify,isolate, <strong>and</strong> produce the specific sex attractant for eachpest or predator.Another approach is to use hormones that disrupt aninsect’s normal life cycle (Figure 23-10) <strong>and</strong> prevent itfrom reaching maturity <strong>and</strong> reproducing (Figure 23-11,p. 530). Insect hormones are natural chemicals producedby insects to regulate their growth at variousstages of their natural life cycle. By learning what hormonesan insect needs at various stages in its life, scientistscan use these chemicals to disrupt <strong>and</strong> kill the insect—anotherexample of learning from nature.Insect hormones have the same advantages as sexattractants. But they take weeks to kill an insect, oftenare ineffective with large infestations of insects, <strong>and</strong>sometimes break down before they can act. In addition,they must be applied at exactly the right time inthe target insect’s life cycle, can sometimes affect thetarget’s predators <strong>and</strong> other nonpest species, <strong>and</strong> aredifficult <strong>and</strong> costly to produce.Some farmers have controlled some insect pestsby spraying them with hot water. This has worked wellon cotton, alfalfa, <strong>and</strong> potato fields <strong>and</strong> in citrusgroves in Florida, <strong>and</strong> the cost is roughly equal to thatof using chemical pesticides.Another strategy is to expose foods to high-energygamma radiation. Such food irradiation extends foodshelf life <strong>and</strong> kills insects <strong>and</strong> parasitic worms (suchas trichinae in pork). It also kills harmful bacteriasuch as salmonella, which infects at least 51,000Americans <strong>and</strong> kills 2,000 each year, <strong>and</strong> E. coli, whichinfects more than 20,000 Americans <strong>and</strong> kills about250 each year. According to the U.S. FDA <strong>and</strong> theWHO, more than 2,000 studies show that foods exposedto low doses of gamma radiation are safe forhuman consumption.But critics of irradiating food argue that it formstrace amounts of certain chemicals that have causedcancer in laboratory animals. They also point out thatthe long-term health effects of eating irradiated foodare unknown <strong>and</strong> consumers do not want old <strong>and</strong> possiblyless nutritious food to be made to appear fresh<strong>and</strong> healthy by irradiation. They also support clear labelingof all irradiated foods so that consumers canJHMHMHJHLarvaEggsMHBlackJHPupaMHFigure 23-10 For normal insect growth, development, <strong>and</strong> reproductionto occur, certain juvenile hormones (JH) <strong>and</strong> moltinghormones (MH) must be present at genetically determinedstages in the insect’s life cycle. If applied at the proper time,synthetic hormones disrupt the life cycles of insect pests <strong>and</strong>help control their populations.http://biology.brookscole.com/miller14529
Agricultural Research Service/USDAFigure 23-11 A use of hormones to prevent insects frommaturing completely, making it impossible for them to reproduce.The stunted tobacco hornworm (left) was fed a hormonethat prevents production of molting hormones. They eat but diewhen they cannot shed the skin off of their bulging bodies—somewhat like being trapped in a tight wet suit while you put onlots of weight. A normal hornworm is shown on the right.make informed choices—a proposal that is opposed bysellers of such foods. Another problem: the poorly protectedfacilities for food irradiation contain radioactiveisotopes that terrorists could steal <strong>and</strong> use to makedirty nuclear bombs.Some consumers oppose irradiating food <strong>and</strong>refuse to eat it because they fear it is radioactive, but itis not. When food is irradiated it does not become radioactiveany more than you do when you get a dentalor chest X ray.Is Integrated Pest Management the Answer?A Combined Ecological ApproachAn ecological approach to pest control uses anintegrated mix of cultivation <strong>and</strong> biologicalmethods, <strong>and</strong> small amounts of selectedchemical pesticides as a last resort.An increasing number of pest control experts <strong>and</strong>farmers believe the best way to control crop pests is acarefully designed integrated pest management(IPM) program. In this approach, each crop <strong>and</strong> itspests are evaluated as parts of an ecological system.Then farmers develop a control program that includescultivation, biological, <strong>and</strong> chemical methods appliedin proper sequence <strong>and</strong> with the proper timing.The overall aim of IPM is not to eradicate pestpopulations but to reduce crop damage to an economicallytolerable level. Fields are monitored carefully todetermine when an economically damaging level ofpests has been reached. When this happens farmersfirst use biological methods (natural predators, parasites,<strong>and</strong> disease organisms) <strong>and</strong> cultivation controls,including vacuuming up harmful bugs. Small amountsof insecticides—mostly based on natural insecticidesproduced by plants—are applied only as a last resort.Also, different chemicals are used in order to slow thedevelopment of genetic resistance <strong>and</strong> to avoid killingpredators of pest species.In 1986, the Indonesian government banned 57 ofthe 66 pesticides used on rice <strong>and</strong> phased out pesticidesubsidies over a 2-year period. It also launched a nationwideeducation program to help farmers switch toIPM. The results were dramatic. Between 1987 <strong>and</strong>1992, pesticide use dropped by 65%, rice productionrose by 15%, <strong>and</strong> more than 250,000 farmers weretrained in IPM techniques. In Sri Lanka IPM increasedrice yields 11–44% <strong>and</strong> increased farmer incomes38–178%. Sweden <strong>and</strong> Denmark have used IPM to cuttheir pesticide use in half.The experiences of these <strong>and</strong> other countries showthat a well-designed IPM program can reduce pesticideuse <strong>and</strong> pest control costs by at least half, cut preharvestlosses from pests by half, <strong>and</strong> improve cropyields. It can also reduce inputs of fertilizer <strong>and</strong> irrigationwater <strong>and</strong> slow the development of genetic resistancebecause pests are assaulted less often <strong>and</strong> withlower doses of pesticides.Thus IPM is an important form of pollution preventionthat reduces risks to wildlife <strong>and</strong> human health.Consumers Union estimates that if all U.S. farmerspracticed IPM by 2020, public health risks from pesticideswould drop by 75%.Why Have More Farmers Not Switched toIntegrated Pest Management? Politics inActionGovernment subsidies for conventional pesticides,opposition by pesticide manufacturers, <strong>and</strong> a lackof experts to advise farmers hinder a widespreadshift to integrated pest management.Despite its promise, IPM, like any other form of pestcontrol, has some disadvantages. It requires expertknowledge about each pest situation including a pest’slife cycles, feeding habits, movements, <strong>and</strong> nestinghabits. It is also slower acting than conventional pesticides,<strong>and</strong> methods developed for a crop in one areamight not apply to areas with even slightly differentgrowing conditions. Also, initial costs may be higher,although long-term costs typically are lower thanthose of using conventional pesticides.Widespread use of IPM is hindered by governmentsubsidies of conventional chemical pesticides530 CHAPTER 23 Pest Management
<strong>and</strong> opposition from agricultural chemical companies,whose pesticide sales would drop sharply. There isalso a lack of experts to help farmers shift to IPM.A 1996 study by the National Academy of Sciencesrecommended that the United States shift from chemicallybased approaches to ecologically based pest managementapproaches. According to the study, within5–10 years, such a shift could cut U.S. pesticide use inhalf, as it has in several other countries.Agrowing number of scientists urge the USDA touse three strategies to promote IPM in the UnitedStates:■ Add a 2% sales tax on pesticides <strong>and</strong> use the revenueto fund IPM research <strong>and</strong> education■ Set up a federally supported IPM demonstrationproject on at least one farm in every county■ Train USDA field personnel <strong>and</strong> county farmagents in IPM so they can help farmers use thisalternativeThe pesticide industry has successfully opposed suchmeasures.Good news. Several UN agencies <strong>and</strong> the WorldBank have joined together to establish an IPM facility.Its goal is to promote use of IPM by disseminating information<strong>and</strong> establishing networks among researchers,farmers, <strong>and</strong> agricultural extension agentsinvolved in IPM.xHOW WOULD YOU VOTE? Should governments heavilysubsidize a switch to integrated pest management? Castyour vote online at http://biology.brookscole.com/miller14.We need to recognize that pest control is basically anecological, not a chemical, problem.ROBERT L. RUDDCRITICAL THINKING1. Do you agree or disagree that because DDT <strong>and</strong> theother banned chlorinated hydrocarbon pesticides poseno demonstrable threat to human health <strong>and</strong> have savedmillions of lives, they should again be approved for useon crops in the United States? Explain.2. If increased mosquito populations threatened youwith malaria or West Nile virus, would you spray DDTin your yard <strong>and</strong> inside your home to reduce the risk?Explain. What are the alternatives?3. Explain how widespread use of a pesticide can (a) increasethe damage done by a particular pest <strong>and</strong> (b) createnew pest organisms.4. Explain why biological pest control often is more successfulon a small isl<strong>and</strong> than on a continent.5. Should farmers be given government subsidies forswitching to integrated pest management (IPM)? Explainyour position.6. Should certain types of foods be irradiated to helpcontrol disease organisms <strong>and</strong> increase shelf life? Explain.If so, should such foods be required to carry aclear label stating that they have been irradiated?Explain.7. What changes, if any, do you believe should be madein the Federal Insecticide, Fungicide, <strong>and</strong> RodenticideAct <strong>and</strong> the Food Quality Protection Act that regulatepesticide use in the United States?8. Congratulations! You are in charge of pest control forthe entire world. What are the three most important componentsof your global pest management strategy?PROJECTS1. How are bugs <strong>and</strong> weeds controlled in (a) your yard<strong>and</strong> garden, (b) the grounds of your school, <strong>and</strong> (c) publicschool grounds, parks, <strong>and</strong> playgrounds in your community?2. List all pesticides used in or around your home. Comparethe results for your entire class. Which ones could beeliminated?3. Some research shows that although many peopleagree we need to make greater use of alternatives to conventionalpesticides for controlling pests, when they arefaced with an actual infestation from insects or rodentsthe first thing they do is spray with pesticides. Surveymembers of your class <strong>and</strong> other groups to help determinethe validity of these research findings.4. Use the library or the Internet to find bibliographic informationabout Ralph Waldo Emerson <strong>and</strong> Robert L. Rudd,whose quotes appear at the beginning <strong>and</strong> end of thischapter.5. Make a concept map of this chapter’s major ideas, usingthe section heads, subheads, <strong>and</strong> key terms (in boldface).Look at the website for this book for informationabout making concept maps.LEARNING ONLINEThe website for this book contains study aids <strong>and</strong> manyideas for further reading <strong>and</strong> research. They include achapter summary, review questions for the entire chapter,flash cards for key terms <strong>and</strong> concepts, a multiple-choicepractice quiz, interesting Internet sites, references, <strong>and</strong> aguide for accessing thous<strong>and</strong>s of InfoTrac ® College Editionarticles. Log on tohttp://biology.brookscole.com/miller14Then click on the Chapter-by-Chapter area, choose Chapter23, <strong>and</strong> select a learning resource.http://biology.brookscole.com/miller14531
24 Solid<strong>and</strong> Hazardous WasteCASE STUDYLove Canal:There Is No “Away”New York State Department of <strong>Environmental</strong> ConservationFigure 24-1 The Love Canal housing development nearNiagara Falls, New York, was built near a hazardous wastedump site. The photo shows the area when it was ab<strong>and</strong>oned in1980. In 1990, the EPA allowed people to buy some of the remaininghouses <strong>and</strong> move back into the area.Between 1942 <strong>and</strong> 1953, Hooker Chemicals <strong>and</strong>Plastics (owned by OxyChem since 1968) sealed chemicalwastes containing at least 200 different chemicalsinto steel drums <strong>and</strong> dumped them into an old canalexcavation (called Love Canal after its builder,William Love) near Niagara Falls, New York.In 1953, Hooker Chemicals filled the canal, coveredit with clay <strong>and</strong> topsoil, <strong>and</strong> sold it to the NiagaraFalls school board for $1. In 1957, Hooker warned theschool board not to disturb the clay cap because ofpossible danger from the buried toxic wastes.By 1959, an elementary school, playing fields, <strong>and</strong>949 homes had been built in the 10-square-block LoveCanal area (Figure 24-1). Some of the roads <strong>and</strong> sewerlines crisscrossing the dump site disrupted the claycap covering the wastes. In the 1960s, an expresswaywas built at one end of the dump. It blocked groundwaterfrom migrating to the Niagara River <strong>and</strong> allowedcontaminated groundwater <strong>and</strong> rainwater tobuild up <strong>and</strong> overflow the disrupted cap.Residents began complaining to city officials in1976 about chemical smells <strong>and</strong> chemical burns theirchildren received playing in the canal area, but theirconcerns were ignored. In 1977, chemicals began leakingfrom the badly corroded steel drums into stormsewers, gardens, basements of homes next to thecanal, <strong>and</strong> the school playground.In 1978, after media publicity <strong>and</strong> pressure fromresidents led by Lois Gibbs (a mother galvanized intoaction as she watched her children come down withone illness after another (see her Guest Essay on thewebsite for this chapter), the state acted. It closed theschool <strong>and</strong> arranged for the 239 homes closest to thedump to be evacuated, purchased, <strong>and</strong> destroyed.Two years later, after protests from families stillliving fairly close to the l<strong>and</strong>fill, President JimmyCarter declared Love Canal a federal disaster area,had the remaining families relocated, <strong>and</strong> offered federalfunds to buy 564 more homes. Because of the difficultyin linking exposure to a variety of chemicals tospecific health effects (Section 19-2, p. 410), the longtermhealth effects of exposure to hazardous chemicalsfor Love Canal residents remain unknown <strong>and</strong>controversial.The dumpsite has been covered with a new claycap <strong>and</strong> surrounded by a drainage system for pumpingleaking wastes to a new treatment plant. In 1990, stateofficials began selling 260 of the remaining houses inthe area—renamed Black Creek Village. Buyers mustsign an agreement stating that New York state <strong>and</strong> thefederal government make no guarantees or representationsabout the safety of living in these homes.Love Canal sparked creation of the Superfundlaw, which forced polluters to pay for cleaning upab<strong>and</strong>oned toxic waste dumps <strong>and</strong> made them waryof producing new ones. In 1983 Love Canal becamethe first Superfund site. After spending close to $400million in cleanup costs it was removed from theSuperfund priority list in 2004.The Love Canal incident is a vivid reminder ofthree lessons from nature: We can never really throwanything away; Wastes often do not stay put; <strong>and</strong>, preventingpollution is much safer <strong>and</strong> cheaper than trying to cleanit up.
Solid wastes are only raw materials we’re too stupid to use.ARTHUR C. CLARKEThis chapter examines the solid <strong>and</strong> hazardous wasteswe produce. It addresses the following questions:■ What is solid waste <strong>and</strong> how much do weproduce?■■■■■■■■What can we do to reduce, reuse, <strong>and</strong> recycle solidwaste?What are the advantages <strong>and</strong> disadvantages ofburning or burying solid waste?What is hazardous waste <strong>and</strong> how can we dealwith it?How can we detoxify hazardous waste?What are the advantages <strong>and</strong> disadvantages ofburning or burying hazardous waste?What can we do to reduce exposure to lead,mercury, <strong>and</strong> dioxins?How is hazardous waste regulated in the UnitedStates?How can we make the transition to a more sustainablelow-waste society?24-1 WASTING RESOURCESWhy Should We Care about Solid Waste?Resource Waste <strong>and</strong> PollutionSolid waste is a symptom of an unnecessary wasteof resources whose production causes pollution <strong>and</strong>environmental degradation.Solid waste is any unwanted or discarded materialthat is not a liquid or a gas. So what is the big deal? Formost people, garbage trucks arrive <strong>and</strong> whisk away thesolid waste they produce—out of sight, out of mind.In nature there is essentially no solid waste becausethe wastes of one organism become nutrients forother organisms. But humans will always producesome solid waste. Indeed, we produce such wastes directly<strong>and</strong> indirectly in almost everything we do. Thesolid waste we produce directly is called garbage. Butmost people do not realize that mines, factories, foodgrowers, <strong>and</strong> businesses supplying the goods <strong>and</strong> servicesthey use are responsible for about 98% of theworld’s solid waste.We need to be concerned about such waste productionfor two reasons. One is that much of it representsan unnecessary waste of the earth’s precious resources.The other is that producing the solid productswe use <strong>and</strong> often discard is responsible for hugeamounts of air pollution (including greenhouse gases),water pollution, soil erosion, <strong>and</strong> l<strong>and</strong> degradation(Figure 16-13, p. 343).Some good news is that we could reduce our direct<strong>and</strong> indirect production of solid waste by 75–90%, asyou will learn in this chapter.Case Study: How Much Solid Waste Does theUnited States Produce? Affluenza in ActionThe United States produces about a third of theworld’s solid waste <strong>and</strong> buries more than half of itin l<strong>and</strong>fills.What country produces the most solid waste? The answeris the United States that, with only 4.6% of theworld’s population, produces about one-third of theworld’s solid waste—a glaring symptom of affluenza(p. 14).About 98.5% of the solid waste in the UnitedStates (<strong>and</strong> in most developed countries) comes frommining, oil <strong>and</strong> natural gas production, agriculture,sewage sludge, <strong>and</strong> industrial activities (Figure 24-2).This solid waste is produced indirectly to providegoods <strong>and</strong> services to meet the needs <strong>and</strong> growingwants of consumers.Suppose you buy a desktop computer. You probablydo not know that making it used 700 or more differentmaterials obtained from mines, oil wells, <strong>and</strong>chemical factories all over the world. You may also beunaware that for every 0.5 kilogram (1 pound) of electronicsit contains, approximately 3,600 kilograms(8,000 pounds) of solid <strong>and</strong> liquid waste was createdsomewhere in the world. Extracting these resources<strong>and</strong> converting them into your computer also requiredlarge amounts of energy produced mostly by burningfossil fuels, which emits pollutants <strong>and</strong> CO 2 into the air.The remaining 1.5% of solid waste is municipalsolid waste (MSW)—often called garbage or trash—generated mostly by homes <strong>and</strong> workplaces. This smallMining <strong>and</strong> oil<strong>and</strong> gasproduction75%Industry9.5%Agriculture13%Sewage sludge1%Municipal1.5%Figure 24-2 Natural capital degradation: sources of the estimated11 billion metric tons (12 billion tons) of solid waste producedeach year in the United States. Mining, oil <strong>and</strong> gas production,agricultural, <strong>and</strong> industrial activities produce 65 timesas much solid waste as household activities. (Data from U.S.<strong>Environmental</strong> Protection Agency <strong>and</strong> U.S. Bureau of Mines)http://biology.brookscole.com/miller14533
part of the overall solid waste problem is still huge. Badnews. Between 1960 <strong>and</strong> 2001, the total amount of MSWin the United States each year increased 2.6-fold <strong>and</strong> isstill rising. Each year the United States generatesenough MSW to fill a bumper-to-bumper convoy ofgarbage trucks encircling the globe almost eight times!Between 1960 <strong>and</strong> 1990, the amount of MSW producedper person in the United States increased by 70%.Canada is the world’s second largest per capitaproducer of MSW. Japan <strong>and</strong> most developed countriesin Europe produce about half as much MSW per personas the United States, <strong>and</strong> most developing countriesproduce about one-fourth to one-tenth as much.What Is in U.S. Garbage? Paper RulesPaper products make up the largest percentageof municipal solid waste in the United States, butelectronic waste or e-waste is the fastest-growingtype of solid waste.Analysis of l<strong>and</strong>fill content shows that paper makesup about 38% of the trash buried in U.S. l<strong>and</strong>fills, followedby yard waste (12%), food waste (11%), <strong>and</strong>plastics (10%).But electronic waste or e-waste consisting of discardedTV sets, cell phones, computers, <strong>and</strong> otherelectronic devices is the fastest-growing solid wasteproblem in the United States <strong>and</strong> the world. It is also asource of toxic <strong>and</strong> hazardous wastes such as polyvinylchloride(PVC) <strong>and</strong> compounds containing lead<strong>and</strong> mercury that can contaminate the air, surface water,groundwater, <strong>and</strong> soil. In the United States, onlyabout 2% of such e-waste is recycled.How do we know the composition of trash in l<strong>and</strong>fills?Much of it comes from research by garbologistssuch as William Rathe who pioneered this field at theUniversity of Arizona. These scientists are modern versionsof archaeologists who examine people’s trash <strong>and</strong>dig holes in garbage dumps <strong>and</strong> analyze what they find.Many people think of l<strong>and</strong>fills as huge compostpiles where biodegradable wastes are decomposedwithin a few months. But garbologists looking at thecontents of l<strong>and</strong>fills found 50-year-old newspapersthat were still readable <strong>and</strong> hot dogs <strong>and</strong> pork chopsburied for decades that still looked edible. In l<strong>and</strong>fills(as opposed to open dumps), trash can resist decompositionfor perhaps centuries because it is tightlypacked <strong>and</strong> protected from sunlight, water, <strong>and</strong> air.What Does It Mean to Live in a High-WasteSociety? A Throwaway MentalityMost solid waste is a highly visible sign of howa society infected with affluenza wastes valuableresources.According to architect <strong>and</strong> environmental designerWilliam McDonough, the industrial revolution thathas been taking place for about 275 years has a numberof harmful consequences. It has put huge amountsof toxic material into the air, water, <strong>and</strong> soil. It has puthard-to-separate mixtures of potentially valuable resourcesin l<strong>and</strong>fills or other holes all over the planet,where they are too difficult or expensive to retrieve<strong>and</strong> separate into resources. It has spurred thous<strong>and</strong>sof complex government regulations, mainly designedto keep most people from being poisoned or harmedtoo quickly instead of keeping people <strong>and</strong> natural systemssafe for the long term.It has depleted <strong>and</strong> degraded the earth’s naturalcapital (top half of back cover) <strong>and</strong> eroded biodiversity<strong>and</strong> human cultural diversity. Finally, it has countedthese harmful consequences as economic progress becausethey raise the gross domestic product.Here are a few of the solid wastes consumersthrow away in the high-waste economy found in theUnited States:■ Enough aluminum to rebuild the country’s entirecommercial airline fleet every 3 months■ Enough tires each year to encircle the planetalmost three times■ Enough disposable diapers each year that if theywere linked end to end they would reach to the moon<strong>and</strong> back seven times■ About 2 billion disposable razors, 130 million cellphones, 50 million computers, <strong>and</strong> 8 million televisionsets each year■ Discarded carpet each year that would cover thestate of Delaware■ About 2.5 million nonreturnable plastic bottlesevery hour■ About 670,000 metric tons (1.5 billion pounds) ofedible food per year■ Enough office paper each year to build a wall3.5 meters (11 feet) high across the country from NewYork City to San Francisco■ Some 186 billion pieces of junk mail (an average of660 per American) each year, about 45% of which arethrown in the trash unopenedStrange things happen in a society infected with affluenza.For example, according to the United NationsEnvironment Programme, Americans spend more ontrash bags each year than 90 other countries spend foreverything. And American comedian Lily Tomlin observes,“We buy a wastebasket <strong>and</strong> take it home in aplastic bag. Then we take the wastebasket out of thebag, <strong>and</strong> put the bag in the wastebasket.”534 CHAPTER 24 Solid <strong>and</strong> Hazardous Waste
24-2 PRODUCING LESS WASTEWhat Are Our Options? Managementor PreventionWe can try to manage the solid wastes weproduce or try to reduce or prevent theirproduction.We can deal with the solid wastes we create in twoways. One is waste management. This is a high-waste approach(Figure 3-18, p. 53) that views waste productionas a largely unavoidable product of economic growth.It attempts to manage the resulting wastes in waysthat reduce environmental harm, mostly by mixing<strong>and</strong> often crushing them together <strong>and</strong> then buryingthem, burning them, or shipping them off to anotherstate or country. In effect, it mixes the wastes we producetogether <strong>and</strong> then transfers them from one part ofthe environment to another.The second approach is waste reduction, a low-wasteapproach that recognizes there is no “away.” It viewsmost solid waste as potential resources that we shouldbe reusing, recycling, or composting. With this approachwe should be taught to think of trash cans <strong>and</strong>garbage trucks as resource containers. Figure 24-3 listsways to reduce waste. Study this figure carefully.Waste reduction is based on the four R’s for dealingwith the wastes we produce: refuse, reduce, reuse, orrecycle (including composting). It is the preferred solutionbecause it tackles the problem of waste productionat the front end—before it occurs—rather than atthe back end after wastes have already been produced.It also saves matter <strong>and</strong> energy resources, reduces pollution(including emissions of greenhouse gases),helps protect biodiversity, <strong>and</strong> saves money.1st PriorityPrimary Pollution<strong>and</strong> Waste Prevention• Change industrialprocess to eliminateuse of harmfulchemicals• Purchase differentproducts• Use less of a harmfulproduct• Reduce packaging<strong>and</strong> materials inproducts• Make products thatlast longer <strong>and</strong> arerecyclable, reusable,or easy to repair2nd PrioritySecondary Pollution<strong>and</strong> Waste Prevention• Reuse products• Repair products• Recycle• Compost• Buy reusable <strong>and</strong>recyclable productsSolutions: How Can We Reduce Solid Waste?The <strong>Sustainability</strong> SixReducing consumption <strong>and</strong> redesigning the productswe produce are the best ways to cut waste production<strong>and</strong> promote sustainability.Here are six ways to reduce resource use, waste, <strong>and</strong>pollution—what we might call the sustainability six.First, consume less. Before buying anything, ask questionssuch as: Do I really need this or do I just want it?Can I buy it secondh<strong>and</strong> (reuse)? Can I borrow or rentit (reuse)?Second, redesign manufacturing processes <strong>and</strong> productsto use less material <strong>and</strong> energy. A skyscraper built todayincludes about a third less steel than one the samesize built in the 1960s because of the use of lighterweightbut higher-strength steel. The weight of carshas been reduced by about one-fourth by using suchsteel along with lightweight plastics <strong>and</strong> compositematerials. Plastic milk jugs weigh 40% less that theydid in the 1970s, <strong>and</strong> aluminum drink cans containone-third less aluminum. All of these changes involvesavings in energy use as well as materials.Third, redesign manufacturing processes to produceless waste <strong>and</strong> pollution. Most toxic organic solvents canbe recycled within factories or replaced with waterbasedor citrus-based solvents (Individuals Matter,p. 489). Hydrogen peroxide can be used instead of toxicchlorine to bleach paper <strong>and</strong> other materials. Threenontoxic ways to clean clothes are now available. Onecleans clothes with water in computer-controlled machines<strong>and</strong> another uses a nontoxic silicone solvent inconventional dry-cleaning machines. A new methodsubmerses clothes in liquid carbon dioxide. Checkyour local phone directory to locate dry cleaners thatuse these alternative methods.Fourth, develop productsLast Prioritythat are easy to repair, reuse,remanufacture, compost, or recycle.A Xerox photocopier withWaste Management• Treat waste to reducetoxicity• Incinerate waste• Bury waste inl<strong>and</strong>fills• Release waste intoenvironment fordispersal or dilutionFigure 24-3 Solutions: prioritiessuggested by prominent scientistsfor dealing with material use <strong>and</strong>solid waste. To date, these wastereductionpriorities have not been followedin the United States <strong>and</strong> inmost other countries. Instead, mostefforts are devoted to waste management(bury it or burn it). (Data fromU.S. <strong>Environmental</strong> ProtectionAgency <strong>and</strong> U.S. National Academyof Sciences)http://biology.brookscole.com/miller14535
every part reusable or recyclable for easy remanufacturingshould eventually save the company $1 billion inmanufacturing costs.Fifth, design products to last longer. Today’s tireshave an average life of 97,000 kilometers (60,000miles). Researchers believe this use could be extendedto at least 160,000 kilometers (100,000 miles).Sixth, eliminate or reduce unnecessary packaging.From an environmental st<strong>and</strong>point, the preferred hierarchyfor packaging is no packaging (nude products),minimal packaging, reusable packaging, <strong>and</strong> recyclable packaging.Canada has set a goal of using the first three ofthese packaging priorities to cut excess packaging inhalf. Here are some key questions for designers, manufacturers,<strong>and</strong> consumers to ask about packaging: Is itnecessary? Can it use fewer materials? Can it be reused?Are the resources that went into it renewable? Does itcontain the highest feasible amount of recycled material?Can it be biodegraded into harmless nutrients thatare recycled in the earth’s natural chemical cycles? Is itdesigned to be recycled easily? Can it be incineratedwithout producing harmful air pollutants or a toxicash? Can it be buried <strong>and</strong> decomposed in a l<strong>and</strong>fillwithout producing chemicals that can contaminategroundwater?Figure 24-4 lists some ways you can reduce youroutput of solid waste.Improvements in resource productivity <strong>and</strong> environmentaldesign are very important. But we can domuch better through a new resource productivityWhat Can You Do?Solid Waste• Follow the four R's of resource use: Refuse, Reduce,Reuse, <strong>and</strong> Recycle.• Ask yourself whether you relly need a particular item.• Rent, borrow, or barter goods <strong>and</strong> services when you can.• Buy things that are reusable, recyclable, or compostable,<strong>and</strong> be sure to reuse, recycle, <strong>and</strong> compost them.• Do not use throwaway paper <strong>and</strong> plastic plates, cups,<strong>and</strong> eating utensils, <strong>and</strong> other disposable items whenreusable or refillable versions are available.• Use e-mail in place of conventional paper mail.• Read newspapers <strong>and</strong> magazines online.• Buy products in concentrated form whenever possible.Figure 24-4 What can you do? Ways to reduce your output ofsolid waste.revolution. In their 1999 book Natural Capitalism, PaulHawken, Amory Lovins, <strong>and</strong> Hunter Lovins contendthat we have the knowledge <strong>and</strong> technology to greatlyincrease resource productivity by getting 75–90% morework or service from each unit of material resourceswe use. To these analysts, the only major obstacles tosuch an economic <strong>and</strong> ecological revolution are laws,policies, taxes, <strong>and</strong> subsidies that continue to rewardinefficient resource use <strong>and</strong> fail to reward efficient resourceuse. There are many fulfilling career choices forpeople wanting to become part of the resource productivityrevolution.24-3 THE ECOINDUSTRIALREVOLUTION AND SELLING SERVICESINSTEAD OF THINGSWhat Is the Ecoindustrial Revolution?Reducing Waste Production by CopyingNatureWe can make industrial manufacturing processesmore sustainable by redesigning them to mimic hownature deals with wastes.There are growing signs that a new ecoindustrial revolutionwill take place over the next 50 years. The goal isto make industrial manufacturing processes cleaner<strong>and</strong> more sustainable by redesigning them to mimichow nature deals with wastes. Recall that in nature thewaste outputs of one organism become the nutrient inputsof another organism, so all of the earth’s nutrientsare endlessly recycled.One way we can mimic nature is to recycle <strong>and</strong>reuse most chemicals used in industries instead ofdumping them into the environment. Another is tohave industries interact in complex resource exchangewebs where the wastes of one manufacturer becomeraw materials for another—similar to food webs innatural ecosystems (Figure 4-19, p. 69). This is happeningin Kalundborg, Denmark, where an electric powerplant <strong>and</strong> a number of nearby industries, farms, <strong>and</strong>homes work together to save money <strong>and</strong> reduce theiroutputs of waste <strong>and</strong> pollution. They do this by exchangingwaste outputs <strong>and</strong> thus converting them intoresources, as shown in Figure 24-5. Trace the connectionsin this diagram.Today there are about 20 ecoindustrial parks similarto the one in Kalundborg in various parts of theworld <strong>and</strong> more are being built or planned. Some arebeing developed on ab<strong>and</strong>oned industrial sites, calledbrownfields, which are cleaned up <strong>and</strong> redeveloped.In Europe at least one-third of all industrial wastesare sent to waste-material exchanges or clearinghouseswhere they are sold or given away as raw materials forother industries. About a tenth of the industrial waste536 CHAPTER 24 Solid <strong>and</strong> Hazardous Waste
PharmaceuticalplantSludgeLocal farmersGreenhousesSludgeFish farmingWasteHeatWasteWasteHeatWasteHeatOil refinerySulfurSurplusSulfuric acidproducerHeatSurplusNatural gasSurplusNatural gasElectricpowerplantWasteCalcium sulfateWasteHeatFlyAshArea homesCementmanufacturerWallboardfactoryFigure 24-5 Solutions: industrial ecosystem in Kalundborg, Denmark, reduces waste production bymimicking a natural food web. The wastes of one business become the raw materials for another. Wasteheat in the form of hot air or water can be piped from the power plant to several of the other sites.in the United States is sent to such clearinghouses, afigure that could be greatly increased.In addition to eliminating most waste <strong>and</strong> pollution,these industrial forms of biomimicry providemany economic benefits for businesses. They reducethe costs of controlling pollution <strong>and</strong> complying withpollution regulations. If a company does not add pollutantsto the environment, it does not have to worryabout government regulations or being sued becausethe wastes harm someone. The company also improvesthe health <strong>and</strong> safety of its workers by reducingtheir exposure to toxic <strong>and</strong> hazardous material <strong>and</strong>thus reduces company health-care insurance costs.Biomimicry also stimulates companies to come upwith new, environmentally beneficial chemicals, processes,<strong>and</strong> products that can be sold worldwide. Suchcompanies have a better image among consumersbased on results rather than public relations campaigns.In 1975, the Minnesota Mining <strong>and</strong> ManufacturingCompany (3M), which makes 60,000 different productsin 100 manufacturing plants, began a Pollution PreventionPays (3P) program. It redesigned equipment <strong>and</strong>processes, used fewer hazardous raw materials, identifiedhazardous chemical outputs (<strong>and</strong> recycled or soldthem as raw materials to other companies), <strong>and</strong> beganmaking more nonpolluting products.By 1998, 3M’s overall waste production was downby one-third, its air pollutant emissions per unit of productionwere 70% lower, <strong>and</strong> the company had savedmore than $750 million in waste disposal <strong>and</strong> materialcosts. Since 1990, a growing number of companieshave adopted similar programs. See the Guest Essayby Peter Montague on cleaner production on the websitefor this chapter.What Is a Service-Flow Economy? SellingServices Instead of ThingsBusinesses can greatly decrease their pollution<strong>and</strong> waste by shifting from selling goods to sellingservices that the goods provide.In the mid-1980s, German chemist Michael Braungart<strong>and</strong> Swiss industry analyst Walter Stahel independentlyproposed a new economic model that wouldprovide profits while greatly reducing resource use<strong>and</strong> waste. <strong>Their</strong> idea for more sustainable economieshttp://biology.brookscole.com/miller14537
Ray AndersonINDIVIDUALSMATTERRay Anderson(Figure 24-A) isCEO of Interface, acompany based inAtlanta, Georgia,that makes carpettiles. The company is the world’slargest commercial carpet manufacturer,with 26 factories in six countries,customers in 110 countries, <strong>and</strong>more than $1 billion in annual sales.Anderson changed the way heviewed the world <strong>and</strong> his businessafter reading Paul Hawken’s bookThe Ecology of Commerce. In 1994, heannounced plans to develop the nation’sfirst totally sustainable greencorporation.He has implemented hundredsof projects with the goals of zerowaste, greatly reduced energy use,<strong>and</strong> eventually zero use of fossilfuels by relying on renewable solarenergy. By 1999, the company hadreduced resource waste by almost30% <strong>and</strong> reduced energy wasteenough to save $100 million. Oneof Interface’s factories in Californiaruns mostly on solar cells to producethe world’s first solar-madecarpet.To achieve the goal of zerowaste, Anderson plans to stop sellingcarpet <strong>and</strong> lease it as a way toencourage recycling. For a monthlyfee, the company will install,clean, <strong>and</strong> inspect the carpeton a monthly basis,repair worn carpet tilesovernight, <strong>and</strong> recycleworn-out tiles into newcarpeting. As Andersonputs it, “We wantto harvest yesterday’scarpets <strong>and</strong> recyclethem with zero scrapgoing to the l<strong>and</strong>fill <strong>and</strong>zero emissions into the eco-system—<strong>and</strong> run the whole thingon sunlight.”Anderson is one of a growingnumber of business leaders committedto finding a more economically<strong>and</strong> ecologically sustainable way todo business while still making aprofit for stockholders. Between1993 <strong>and</strong> 1998, the company’s revenuesdoubled <strong>and</strong> profits tripled,mostly because the companysaved $130 million inmaterial costs with aninvestment of lessthan $40 million.Anderson says heis having a blast.Figure 24-A Ray Andersoninvolves shifting from our current material-flow economy(Figure 3-18, p. 53) to a service-flow economy overthe next few decades. Instead of buying most goodsoutright, customers would use eco-leasing, renting theservices that such goods provide.In a service-flow economy, a manufacturer makesmore money on a product if it uses the minimumamount of materials, lasts as long as possible, <strong>and</strong> is easyto maintain, repair, remanufacture, reuse, or recycle.There is evidence that such an economic shiftbased on eco-leasing is under way. Since 1992, the XeroxCorporation has been leasing most of its copy machinesas part of its mission to provide document servicesinstead of selling photocopiers. When the servicecontract expires, Xerox takes the machine back forreuse or remanufacture <strong>and</strong> has a goal of sending nomaterial to l<strong>and</strong>fills or incinerators. To save money,machines are designed to use recycled paper, have fewparts, be energy efficient, <strong>and</strong> emit as little noise, heat,ozone, <strong>and</strong> copier chemical waste as possible. Canonin Japan <strong>and</strong> Fiat in Italy are taking similar measures.Another example is Carrier, the world’s leadingmaker of air conditioning equipment, which nowleases cooling services. Carrier teams up with other serviceproviders to install superefficient windows <strong>and</strong>more efficient lighting <strong>and</strong> to make other energyefficiencyupgrades that reduce the cooling needs of itscustomers. Carrier makes money by providing suchservices rather than installing equipment.Dow <strong>and</strong> several other chemical companies aredoing a booming business in leasing organic solvents(used mostly to remove grease from surfaces), photographicdeveloping chemicals, <strong>and</strong> dyes <strong>and</strong> pigments.In this chemical service business, the companydelivers the chemicals, helps the client set up a recoverysystem, takes away the recovered chemicals, <strong>and</strong>delivers new chemicals as needed.Finally, Ray Anderson, CEO of a large carpet tilecompany, plans to lease rather than sell carpet(Individuals Matter, above). There are many entrepreneurial<strong>and</strong> career opportunities in the emerging service-floweconomy.24-4 REUSEWhat are the Advantages <strong>and</strong>Disadvantages of Reuse? Improves<strong>Environmental</strong> Quality for Some, CanCreate Hazards for OthersReusing products is an important way to reduceresource use, waste, <strong>and</strong> pollution in developedcountries but can create hazards for the poorin developing countries.Reuse involves cleaning <strong>and</strong> using materials over <strong>and</strong>over <strong>and</strong> thus increasing the typical life span of aproduct. This form of waste reduction reduces use of538 CHAPTER 24 Solid <strong>and</strong> Hazardous Waste
matter <strong>and</strong> energy resources, cuts pollution <strong>and</strong> waste,creates local jobs, <strong>and</strong> saves money. Traditional formsof reuse include salvaging automobile parts fromolder cars in junkyards <strong>and</strong> salvaging bricks, doors,fine woodwork, <strong>and</strong> other items from old houses <strong>and</strong>buildings.However, in today’s high-throughput societies wehave increasingly substituted throwaway tissues forreusable h<strong>and</strong>kerchiefs, disposable paper towels <strong>and</strong>napkins for reusable cloth ones, throwaway paperplates <strong>and</strong> cups <strong>and</strong> plastic utensils for reusable plates,cups, <strong>and</strong> silverware, <strong>and</strong> throwaway beverage containersfor refillable ones. We even have disposablecameras.Reuse is alive <strong>and</strong> well in most developing countriesbut can be a health hazard for the poor. About80% of the e-waste in the United States, including discardedTV sets, computers, <strong>and</strong> cell phones, is shippedto China, India, Pakistan, <strong>and</strong> other (mostly Asian)countries where labor is cheap <strong>and</strong> environmental regulationsare weak or pooly enforced. Workers there,many of them children, dismantle the products to recoverreusable parts <strong>and</strong> are thus exposed to toxic metalssuch as lead, mercury, <strong>and</strong> cadmium. The scrap leftover is dumped in waterways <strong>and</strong> fields, or burned inopen fires, which exposes the workers to toxic dioxins.In cities such as Manila in the Philippines, MexicoCity, <strong>and</strong> Cairo, Egypt, large numbers of people—many of them children—eke out a living by scavenging,sorting, <strong>and</strong> selling materials they get from opencity dumps. This exposes them to toxins <strong>and</strong> infectiousdiseases.Should We Use Refillable Containers?Reviving ReuseRefilling <strong>and</strong> reusing containers uses less resources<strong>and</strong> energy, produces less waste, saves money, <strong>and</strong>creates local jobs.Two examples of reuse are refillable glass beveragebottles <strong>and</strong> refillable soft drink bottles made of polyethyleneterephthalate (PET) plastic. Typically suchbottles make 15 round-trips before they become toodamaged for reuse <strong>and</strong> then are recycled. Reusingthese containers saves energy (Figure 24-6) <strong>and</strong> reducesthe pollution <strong>and</strong> wastes associated with usingenergy resources. Refilling beverage bottles also stimulateslocal economies by creating local jobs related totheir collection <strong>and</strong> refilling. Moreover, studies byCoca-Cola <strong>and</strong> PepsiCo of Canada show that their softdrinks in 0.5-liter (16-ounce) bottles cost one-third lessin refillable bottles than in throwaway bottles.But big companies make more money by producing<strong>and</strong> shipping throwaway beverage <strong>and</strong> food containersat centralized facilities. This shift has put manysmall local bottling companies, breweries, <strong>and</strong> canneriesout of business.Aluminum can, used onceSteel can, used onceRecycled steel canGlass drink bottle, used onceRecycled aluminum canRecycled glass drink bottleRefillable drink bottle, used 10 times0 8 1624 32Energy (thous<strong>and</strong>s of kilocalories)Figure 24-6 Energy consumption for different types of 350-milliliter (12-fluid-ounce) beverage containers. (Data fromArgonne National Laboratory)Denmark <strong>and</strong> Canada’s Prince Edward Isl<strong>and</strong>have led the way by banning all beverage containersthat cannot be reused. To encourage use of refillableglass bottles, Ecuador has a refundable beverage containerdeposit fee that is half of the cost of the drink. InFinl<strong>and</strong>, 95% of the soft drink, beer, wine, <strong>and</strong> spiritscontainers are refillable, <strong>and</strong> in Germany, about threefourthsare refillable.xHOW WOULD YOU VOTE? Do you support banning allbeverage containers that cannot be reused, as Denmark hasdone? Cast your vote online at http://biology.brookscole.com/miller14.What Are Other Ways to Reuse Things?Reducing Throwaway ItemsWe can use reusable shopping bags, food containers,<strong>and</strong> shipping pallets, <strong>and</strong> borrow tools from toollibraries.Cloth bags can be used to carry groceries <strong>and</strong> otheritems instead of paper or plastic bags. Both plastic <strong>and</strong>paper bags are environmentally harmful, <strong>and</strong> thequestion of which is more damaging has no clear-cutanswer. To encourage people to bring reusable bags,stores in the Netherl<strong>and</strong>s <strong>and</strong> Irel<strong>and</strong> charge for shoppingbags. As a result, the use of plastic shopping bagsdropped by 90–95% in both countries. In 2004, supermarketsin Shanghai, China’s largest city, began chargingshoppers for plastic bags in an attempt to reducewaste.xHOW WOULD YOU VOTE? Should consumers have topay for plastic or paper bags at grocery <strong>and</strong> other stores?Cast your vote online at http://biology.brookscole.com/miller14.http://biology.brookscole.com/miller14539
What Can You Do?Other examples of reusable items are metal orplastic lunchboxes <strong>and</strong> plastic containers for storinglunchbox items <strong>and</strong> refrigerator leftovers, instead ofusing throwaway plastic wrap <strong>and</strong> aluminum foil.Manufacturers can use shipping pallets made ofrecycled plastic waste instead of throwaway woodpallets. In 1991, Toyota shifted entirely to reusableshipping containers. A similar move by the XeroxCorporation saves the company more than $3 millionper year.Another example of reuse involves tool libraries(such as those in Berkeley, California, <strong>and</strong> TakomaPark, Maryl<strong>and</strong>) where people can check out a varietyof power <strong>and</strong> h<strong>and</strong> tools.Figure 24-7 lists several ways for you to reusesome of the items you buy.24-5 RECYCLINGReuse• Buy beverages in refillable glass containers insteadof cans or throwaway bottles.• Use reusable plastic or metal lunchboxes.• Carry s<strong>and</strong>wiches <strong>and</strong> store food in the refrigeratorin reusable containers instead of wrapping them inaluminum foil or plastic wrap.• Use rechargeable batteries <strong>and</strong> recycle them whentheir usefull life is over.• Carry groceries <strong>and</strong> other items in a reusablebasket, a canvas or string bag, or a small cart.• Use reusable sponges <strong>and</strong> washable cloth napkins,dishtowels, <strong>and</strong> h<strong>and</strong>kerchiefs instead ofthrowaway paper ones.Figure 24-7 What can you do? Ways to reuse some of theitems you buy.What Is Recycling? An <strong>Environmental</strong>Success StoryRecycling is an important way to collect wastematerials <strong>and</strong> turn them into useful products thatcan be sold in the marketplace.Recycling involves reprocessing discarded solid materialsinto new, useful products. Recycling has a numberof important benefits to people <strong>and</strong> the environment(Figure 24-8). Recycling also reduces unsightly <strong>and</strong>costly litter. Picking up litter thrown along highwaysby thoughtless consumers costs the United Statesabout $500 million a year. Households <strong>and</strong> workplacesproduce five major types of materials that can be recycled:paper products (including newspaper, magazines,office paper, <strong>and</strong> cardboard), glass, aluminum, steel, <strong>and</strong>some types of plastics.Materials collected for recycling can be reprocessedin two ways. Primary or closed-loop recycling occurswhen waste is recycled into new products of the sametype—turning used newspapers into new newspaper<strong>and</strong> used aluminum cans into new aluminum cans, forexample.Secondary recycling, also called downcycling, involvesconverting waste materials into different products.For example, used tires can be shredded <strong>and</strong>converted into rubberized road surfacing <strong>and</strong> newspaperscan be converted to cellulose insulation.<strong>Environmental</strong>ists distinguish between two typesof wastes that can be recycled. One is preconsumer orinternal waste. It consists of waste generated in a manufacturingprocess <strong>and</strong> recycled instead of being discarded.The other is postconsumer or external wastegenerated by consumer use of products. There is about25 times more preconsumer than postconsumer waste.It is important to recycle both types.In theory, just about anything is recyclable, butonly two things count. First, will the item actually berecycled? Sometimes separated wastes collected for recyclingare mixed with other wastes <strong>and</strong> sent to l<strong>and</strong>fillsor incinerated, mostly when prices for recycledraw materials fall sharply.Second, will businesses <strong>and</strong> individuals completethe recycling loop by buying products that are madefrom recycled materials? If we do not buy those products,recycling does not work.But we cannot close the loop <strong>and</strong> do our bit in creatinga market for recycled materials unless we caneasily identify whether a product is made entirely orpartly from recycled material. This would be clear ifgovernments require that all products made from recycledmaterials have an easily recognized logo <strong>and</strong> alabel clearly showing the percentage of recycled materialthey contain, perhaps with a highly visible stripwith a green bar extending from 0 to 100%.Switzerl<strong>and</strong> <strong>and</strong> Japan recycle about half of theirMSW. The United States recycles about 30% of itsMSW—up from 6.4% in 1960. This roughly 5-fold increasein recycling is an impressive achievement. Butthe country’s total amount of solid waste has continuedto increase although the MSW per person has leveledoff since 1990. Studies indicate that with economicincentives <strong>and</strong> better design of waste managementsystems the United States <strong>and</strong> other developed countriescould recycle 60–80% of their MSW.540 CHAPTER 24 Solid <strong>and</strong> Hazardous Waste
Reduces globalwarmingReduces aciddepositionReduces urbanair pollutionMakes fuelsupplieslast longerReducesair pollutionSavesenergyReducesenergy dem<strong>and</strong>Reduces solidwaste disposalRecyclingReduces waterpollutionReducesmineraldem<strong>and</strong>ProtectsspeciesReduceshabitatdestructionFigure 24-8 Solutions: <strong>Environmental</strong> benefits of recycling. In addition to these environmental benefits, recyclingsaves more money <strong>and</strong> creates far more jobs than burning wastes or disposing of them in l<strong>and</strong>fills—assumingthat all of these operations receive equal or no government subsidies or tax breaks. Which two of thesebenefits do you believe are the most important? Despite its many benefits, recycling is still an output approachthat deals with wastes after they are produced instead of a way to reduce the overall flow of resources.How Useful Is Composting? Recyclingby Copying NatureComposting biodegradable organic waste mimicsnature by recycling plant nutrients to the soil.Composting is a simple process in which we copy natureto recycle some of the biodegradable organic wastes weproduce. The organic material produced by compostingcan be added to soil to supply plant nutrients, slowsoil erosion, retain water, <strong>and</strong> improve crop yields.Some cities in Austria, Belgium, Denmark, Germany,Luxembourg, <strong>and</strong> Switzerl<strong>and</strong> recover <strong>and</strong>compost more than 85% of their biodegradable wastes.Bad news. Only about 5% of the paper, yard, <strong>and</strong> vegetablefood waste in U.S. MSW is composted, but studiesshow that it could be raised to 35%.Such wastes can be collected <strong>and</strong> composted incentralized community facilities, as is done in manyEuropean Union countries. The resulting compost canbe used as an organic soil fertilizer, topsoil, or l<strong>and</strong>fillcover. It can also be used to help restore eroded soil onhillsides <strong>and</strong> along highways, strip-mined l<strong>and</strong>, overgrazedareas, <strong>and</strong> eroded cropl<strong>and</strong>.To be successful, a large-scale composting programmust be located carefully <strong>and</strong> control odors,because people do not want to live near a giant compostpile or plant. Composting programs must alsoexclude toxic materials that can contaminate the compost<strong>and</strong> make it unsafe for fertilizing crops <strong>and</strong>lawns.You can easily make your own compost by collectingorganic wastes in a backyard bin. For details oncomposting, see the website for this chapter.How Should We Recycle Solid Waste?To Separate or Not to SeparateThere is disagreement over whether to sendmixed urban wastes to centralized resourcerecovery plants or have individuals sort recyclablesfor collection <strong>and</strong> sale to manufacturers as rawmaterials.One way to recycle is to send mixed urban wastes to acentralized materials-recovery facility (MRF) shown inFigure 24-9 (p. 542). There, machines or workers separatethe mixed waste to recover valuable materials forhttp://biology.brookscole.com/miller14541
Outside usesEnergy recovery(steam <strong>and</strong>electricity)Incinerator(paper, plastics,rubber, food,yard waste)PipelineShredderSeparatorFood,grass,leavesMetalsRubberGlassPlasticsPaperResidueCompostRecycled to primary manufacturersor reformulated for new productsL<strong>and</strong>fill<strong>and</strong>reclaimingdisturbedl<strong>and</strong>FertilizerConsumer (user)Figure 24-9 Solutions: a generalized materials-recovery facility (MRF) sorts mixed wastes for recycling <strong>and</strong>burning to produce energy. Because such plants need high volumes of trash to be economical, they discouragereuse <strong>and</strong> waste reduction.sale to manufacturers as raw materials. The remainingpaper, plastics, <strong>and</strong> other combustible wastes are recycledor burned to produce steam or electricity to runthe recovery plant or to sell to nearby industries orhomes. Ash from the incinerator is buried in a l<strong>and</strong>fill.Trace the flow of materials through an MRF as diagrammedin Figure 24-9.Such plants are expensive to build, operate, <strong>and</strong>maintain. They can emit toxic air pollutants, if not operatedproperly, <strong>and</strong> they produce a toxic ash thatmust be disposed of safely.MRFs are hungry beasts that must have a large inputof garbage to make them financially successful.Thus their owners have a vested interest in increasingthroughput of matter <strong>and</strong> energy resources to producemore trash—the reverse of what prominent scientistsbelieve we should be doing (Figure 24-3).To many experts, it makes more sense economically<strong>and</strong> environmentally for households <strong>and</strong> businessesto separate their trash into recyclable categoriessuch as glass, paper, metals, certain types of plastics,<strong>and</strong> compostable materials. Then these segregatedwastes are collected <strong>and</strong> sold to scrap dealers, compostplants, <strong>and</strong> manufacturers.The source separation approach has several advantagesover the centralized approach. It produces muchless air <strong>and</strong> water pollution <strong>and</strong> has lower start-upcosts <strong>and</strong> operating costs than an MRF. It also savesmore energy, provides more jobs per unit of material,<strong>and</strong> yields cleaner <strong>and</strong> usually more valuable recyclables.In addition, it educates people about the needfor waste reduction, reuse, <strong>and</strong> recycling.To promote separation of wastes for recycling,many communities use a pay-as-you-throw (PAUT)waste collection system. It charges households <strong>and</strong>businesses for the amount of mixed waste picked upbut does not charge for pickup of materials separatedfor recycling.542 CHAPTER 24 Solid <strong>and</strong> Hazardous Waste
xHOW WOULD YOU VOTE? Should households <strong>and</strong> businessesbe charged for the amount of mixed waste pickedup but not charged for pickup of materials separated forrecycling? Cast your vote online at http://biology.brookscole.com/miller14.Case Study: How Much Wastepaper Is BeingRecycled? Encouraging NewsRecycling paper has a number of environmental <strong>and</strong>economic benefits <strong>and</strong> is easy to do.Paper (especially newspaper <strong>and</strong> cardboard) is easy torecycle. Recycling newspaper involves removing itsink, glue, <strong>and</strong> coating <strong>and</strong> then reconverting it to pulpthat is pressed into new paper. A variety of affordablehigh-quality recycled papers are available to meetmost printing dem<strong>and</strong>s (including this book).About 42% of the world’s industrial tree harvest isused to make paper. With 4.6% of the world’s population,the United States consumes about 30% of theworld’s paper <strong>and</strong> buries or incinerates more than halfof this paper. Currently the United States recycles about49% of its wastepaper (up from 25% in 1989) <strong>and</strong> 70% ofits corrugated cardboard containers. At least 10 othercountries recycle 50–97% of their wastepaper <strong>and</strong> paperboard,with a global recycling rate of 43%. Bad news.Despite a 49% recycling rate, the amount of paperthrown away each year in the United States is morethan all of the paper consumed in China. Also, about95% of books <strong>and</strong> magazines produced in the UnitedStates are printed on virgin paper. Some individuals<strong>and</strong> groups have been letting magazine <strong>and</strong> book publishersknow that they will no longer buy their productsunless they greatly increase their use of recycled paper.One problem associated with making paper is thechlorine (Cl 2 ) <strong>and</strong> chlorine compounds (such as chlorinedioxide, ClO 2 ), used to bleach about 40% of theworld’s pulp for making paper. These compounds arecorrosive to processing equipment, hazardous forworkers, hard to recover <strong>and</strong> reuse, <strong>and</strong> harmful whenreleased to the environment. However, a growingnumber of paper mills (mostly in the European Union)are replacing chlorine-based bleaching chemicals withchemicals such as hydrogen peroxide (H 2 O 2 ) or oxygen(O 2 ).<strong>Environmental</strong>ists propose that governments requirepaper companies to use labels that list the recycledcontent of paper products <strong>and</strong> whether the paperwas bleached with chlorine or a chlorine-free process.In 2000, 90% of the copier paper purchased bythe U.S. government (one of the country’s largestbuyers) had 30% recycled content. In 2002, Staples, amajor office supply company, pledged to phase outpurchases of paper products from endangered forests<strong>and</strong> achieve an average of 30% postconsumer recycledcontent in all paper products it sells. Managementwill provide annual reports on progress towardthese goals. The company adopted the goals in responseto a 2-year grassroots effort called The PaperCampaign, a coalition of dozens of citizens’ groupsdedicated to protecting forests <strong>and</strong> increasing the useof recycled paper. Bottom-up political action <strong>and</strong> usingthe power of the pocketbook work.Case Study: Is It Feasible to Recycle Plastics?Some <strong>Problems</strong>Recycling many plastics is chemically <strong>and</strong> economicallydifficult.Plastics are made of various types of large polymer orresin molecules made by chemically linking monomermolecules (petrochemicals) produced mostly from oil<strong>and</strong> natural gas (Figure 24-10).Currently, only about 10% by weight of all plasticwastes in the United States are recycled, for three reasons.First, many plastics are difficult to isolate fromother wastes because the many different resins used tomake them are often difficult to identify <strong>and</strong> someplastics are composites of different resins. Most plasticsalso contain stabilizers <strong>and</strong> other chemicals thatmust be removed before recycling.Blow molding(hollow objects)ProductsBottles, milk jugs,soda bottles,drums, containersSource MaterialsNatural gas Petroleum CoalRefiningFeedstocksMonomers (small molecules)Molding(solid objects)PolymerizationPolymersResins (giant molecules)ManufacturingProductsAppliancehousings, CDs,toys, plastic parts,aircraft, boatsExtrusion(flat, rolled, <strong>and</strong>tubular shapes)ProductsVinyl siding,plastic film <strong>and</strong>bags, pipeFigure 24-10 How plastics are made. (Adopted from Society ofthe Plastics Industry)http://biology.brookscole.com/miller14543
Second, recovering individual plastic resins doesnot yield much material because only small amountsof any given resin are used per product. Third, the priceof oil used to produce petrochemicals for making plasticresins is so low that the cost of virgin plastic resins ismuch lower than that of recycled resins. An exceptionis PET (polyethylene terephthalate), used mostly inplastic drink bottles. It can be melted <strong>and</strong> remanufacturedinto products such as fleece, clothing, carpet, <strong>and</strong>nonfood packaging. However, the PET collected for recyclingmust not have other plastics mixed with it. Forexample, a single PVC (polyvinyl chloride) bottle in atruckload of PET can render it useless for recycling.Thus, m<strong>and</strong>ating that plastic products contain acertain amount of recycled plastic resins is unlikely towork. It could also hinder the use of recycled plasticsin reducing the resource content <strong>and</strong> weight of manywidely used items such as plastic bags <strong>and</strong> bottles.Cargill Dow, a joint venture by a giant agriculturalcompany (Cargill) <strong>and</strong> a chemical company (Dow), ismanufacturing biodegradable <strong>and</strong> recyclable plasticcontainers made from a polymer called polyactide(ACT) made from the sugar in corn syrup. Instead of beingsent to l<strong>and</strong>fills, containers made from this bio-plasticcould be composted to produce a soil conditioner.Toyota, the world’s No. 2 automaker is investing$38 billion in a process that makes plastics from plants.By 2020, it expects to control two-thirds of the world’ssupply of such bioplastics.Does Recycling Make Economic Sense? Yesfor Many MaterialsRecycling materials such as paper <strong>and</strong> metalshas important economic <strong>and</strong> environmentalbenefits.Whether recycling makes monetary sense depends onhow you look at the economic <strong>and</strong> environmental benefits<strong>and</strong> costs of recycling. Critics say recycling doesnot make sense if it costs more to recycle materialsthan to send them to a l<strong>and</strong>fill or incinerator. They alsopoint out that recycling is often not needed to savel<strong>and</strong>fill space because many areas are not running outof space.Critics concede that recycling may make economicsense for valuable <strong>and</strong> easy-to-recycle materials (suchas aluminum, paper, <strong>and</strong> steel), but not for cheap orplentiful resources such as glass from silica <strong>and</strong> mostplastics that are expensive to recycle.Critics of recycling also argue that it should payfor itself. But proponents of recycling point out thatconventional garbage disposal systems are paid formostly by charges to households <strong>and</strong> businesses. Sowhy should recycling be held to a different st<strong>and</strong>ard<strong>and</strong> forced to compete on an uneven playing field?Proponents also point out that the primary benefitof recycling is not reducing the use of l<strong>and</strong>fills <strong>and</strong> incineratorsbut the other important benefits it providesfor people <strong>and</strong> the environment (Figure 24-8). Theypoint to studies showing that the net economic, health,<strong>and</strong> environmental benefits of recycling far outweighthe costs. Also, they remind us that the recycling industryis an important part of the U.S. economy. It employsabout 1.1 million people <strong>and</strong> its annual incomeis much larger than both the mining <strong>and</strong> the wastemanagement industries together.Cities that make money by recycling <strong>and</strong> havehigher recycling rates tend to use a single-pickup systemfor materials to be recycled <strong>and</strong> garbage that cannot berecycled instead of a more expensive dual-pickup system.In single-pickup systems, dealing with recyclablescosts about half as much per metric ton as disposingthe same amount of waste in most modernl<strong>and</strong>fills.Successful systems also tend to use a pay-as-youthrowsystem. San Francisco, California, uses such asystem to recycle almost half of its MSW.xHOW WOULD YOU VOTE? Do the advantages of recyclingmaterials such as paper <strong>and</strong> metals outweigh the disadvantages?Cast your vote online at http://biology.brookscole.com/miller14.Why Do We Not Have More Reuse <strong>and</strong>Recycling? Faulty Accounting <strong>and</strong> anUneven Economic Playing FieldPrices of goods that do not tell the ecological truth,too few government subsidies <strong>and</strong> tax breaks, lowl<strong>and</strong>fill dumping costs, <strong>and</strong> price fluctuations hinderreuse <strong>and</strong> recycling.Four factors hinder reuse <strong>and</strong> recycling. First is afaulty accounting system in which the market price ofa product does not include the harmful environmentalhealth costs associated with the product during its lifecycle (Figure 24-11). Many scientists <strong>and</strong> economistsbelieve that a life-cycle analysis should be made <strong>and</strong>published for products.Second, there is an uneven economic playing fieldbecause in most countries resource-extracting industriesreceive more government tax breaks <strong>and</strong> subsidiesthan recycling <strong>and</strong> reuse industries. We get moreof what we reward.Third, charges for depositing wastes in l<strong>and</strong>fills(called tipping fees) in the United States are lower thanthose in most of Europe. Fourth, the dem<strong>and</strong> <strong>and</strong> thusthe price paid for recycled materials fluctuate mostlybecause buying goods made with recycled materials isnot a priority for most governments, businesses, <strong>and</strong>individuals.544 CHAPTER 24 Solid <strong>and</strong> Hazardous Waste
Disposalwaste, pollutionUsebleach,detergents,water,pollutionTransportenergy,pollutionLIFE-CYCLE ANALYSIS OF A SHIRTPackagingpaper, plastics,waste, pollutionRecycleReuseless resourceuse <strong>and</strong> waste,less pollutionRaw materialsfertilizer,energy, water,pollutionManufacturingenergy, waste,pollutionProcessingenergy,cleaners,dyes,pollutionFigure 24-11 Life-cycle analysis of the resources used <strong>and</strong> pollutantsproduced over the lifetime of a product. Including all ofthese costs in the market prices of the products we buy wouldallow us to compare the harmful environmental costs of differentproducts <strong>and</strong> thus make more informed choices about theproducts we buy.How can we encourage reuse <strong>and</strong> recycling? Proponentssay that leveling the economic playing field isthe best way to start. Governments can increase subsidies<strong>and</strong> tax breaks for reusing <strong>and</strong> recycling materials(the carrot) <strong>and</strong> decrease subsidies <strong>and</strong> tax breaks formaking items from virgin resources (the stick).Another way to encourage recycling is to greatlyincrease use of the pay-as-you-throw (PAUT) system <strong>and</strong>encourage or require government purchases of recycledproducts to help increase dem<strong>and</strong> <strong>and</strong> lowerprices. Governments can also pass laws requiring companiesto take back <strong>and</strong> recycle or reuse packaging discardedby consumers. Globally, at least 29 countries(most in the European Union) have such “take-back”laws. In the Netherl<strong>and</strong>s, all packaging waste isbanned from l<strong>and</strong>fills. In 2002, the European Unionadopted a ruling requiring its member countries to recycle55–80% of all packaging waste by 2008.Governments can also require manufacturers totake back <strong>and</strong> recycle or reuse appliances, computers<strong>and</strong> other electronic equipment, <strong>and</strong> motor vehicles atthe end of their useful lives. Such product stewardship isrequired for car manufacturers <strong>and</strong> appliance makersin European Union (EU) countries <strong>and</strong> for major appliancesin Japan.The EU also requires companies to take back electronicproducts from consumers without charge <strong>and</strong>bans e-waste in municipal solid waste. Beginning in2006, manufacturers must begin phasing out use oftoxic <strong>and</strong> hazardous materials in electronic products.These product stewardship policies create a strong economicinventive for companies to redesign products forsafer <strong>and</strong> easier recycling, reuse, <strong>and</strong> remanufacturing.The United States lags far behind the EuropeanUnion in dealing with the problem of e-waste. However,in 2003, the office supplier Staples announced aprogram that allows store visitors to drop off their cellphones, PDAs, pagers, <strong>and</strong> rechargeable batteries forrecycling. A portion of the proceeds from this recyclingprogram will be donated to the Sierra Club to helpsupport environmental education <strong>and</strong> conservationprograms. In 2004, Staples, the Product StewardshipInstitute, <strong>and</strong> the U.S. EPA announced a partnership totest a pilot program for recycling e-waste. Under thisprogram several major electronics manufacturers willpay for recycling of their name br<strong>and</strong> products takenback to Staples.xHOW WOULD YOU VOTE? Should governments pass lawsrequiring manufacturers to take back <strong>and</strong> reuse or recycleall packaging waste, appliances, electronic equipment, <strong>and</strong>motor vehicles at the end of their useful lives? Cast your voteonline at http://biology.brookscole.com/miller14.Finally, we can require labels on all products listingrecycled content <strong>and</strong> the types <strong>and</strong> amounts of anyhazardous materials they contain—similar to labels onfood products that list ingredients <strong>and</strong> provide nutritionalinformation. This can help consumers makemore informed choices about the environmental consequencesof buying certain products.24-6 BURNING AND BURYINGSOLID WASTEWhat Are the Advantages <strong>and</strong> Disadvantagesof Burning Solid Waste? A Faded Rose in SomeCountriesJapan <strong>and</strong> a few European countries incinerate mostof their municipal waste, but this is done less in theUnited States <strong>and</strong> in other European countries.Globally, municipal solid waste is burned in over 1,000large waste-to-energy incinerators, which boil water tomake steam for heating water or space or for producingelectricity. Trace the flow of materials through theprocess as diagrammed in Figure 24-12 (p. 246). Japan<strong>and</strong> Switzerl<strong>and</strong> burn more than half of their MSW inincinerators compared to 16% in the United States <strong>and</strong>about 8% in Canada.In some plants, called mass-burn incinerators,mixed trash is dumped into a huge furnace. This savesthe expense <strong>and</strong> hazards of removing nonburnablematerial. But often there are air pollution <strong>and</strong> corrosionhttp://biology.brookscole.com/miller14545
Power plantSteamElectricityTurbineGeneratorSmokestackCraneWetscrubberBoilerFurnaceElectrostaticprecipitatorConveyorWaste pitWaterBottomashDirtywaterFlyashConventionall<strong>and</strong>fillWastetreatmentHazardouswastel<strong>and</strong>fillFigure 24-12 Solutions: waste-to-energy incinerator with pollution controls that burns mixed solid waste <strong>and</strong>recovers some of the energy to produce steam used for heating or producing electricity. (Adapted from EPA,Let’s Reduce <strong>and</strong> Recycle)problems because of the difficulty of having to constantlyadjust combustion conditions for differentmixes of trash.In refuse-derived fuel incinerators, burnable waste isseparated from unburnable <strong>and</strong> recyclable materials.Burning only combustible waste produces more energy<strong>and</strong> also leads to less air pollution.Figure 24-13 lists the advantages <strong>and</strong> disadvantagesof using incinerators to burn solid <strong>and</strong> hazardouswaste. Study this figure carefully.Since 1985, more than 280 new incinerator projectshave been delayed or canceled in the United States becauseof high costs, concern over air pollution, <strong>and</strong> intensecitizen opposition.Figure 24-13 Trade-offs: advantages <strong>and</strong> disadvantages of incineratingsolid waste. These trade-offs also apply to the incineration of hazardouswaste. Pick the single advantage <strong>and</strong> disadvantage that you thinkare the most important.AdvantagesReduced trashvolumeLess need forl<strong>and</strong>fillsLow waterpollutionQuick <strong>and</strong>easyT rade-OffsIncinerationDisadvantagesHigh costAir pollution(especiallytoxic dioxins)Produces ahighly toxic ashEncourageswaste productionDiscouragesrecycling <strong>and</strong> wastereduction546 CHAPTER 24 Solid <strong>and</strong> Hazardous Waste
What Are the Advantages <strong>and</strong> Disadvantagesof Burying Solid Waste? A Widely Used LastResortMost of the world’s municipal solid waste is buriedin l<strong>and</strong>fills that will eventually leak toxic liquidsinto the soil <strong>and</strong> underlying aquifers.About 54% by weight of the MSW in the United Statesis buried in sanitary l<strong>and</strong>fills, compared to 90% in theUnited Kingdom, 80% in Canada, 15% in Japan, <strong>and</strong>12% in Switzerl<strong>and</strong>. There are two types of l<strong>and</strong>fills.Open dumps are essentially fields or holes in theground where garbage is deposited <strong>and</strong> sometimescovered with soil. They are rare in developed countriesbut widely used in many developing countries.In newer l<strong>and</strong>fills, called sanitary l<strong>and</strong>fills, solidwastes are spread out in thin layers, compacted, <strong>and</strong>covered daily with a fresh layer of clay or plastic foam.Modern state-of-the-art l<strong>and</strong>fills on geologically suitablesites <strong>and</strong> away from lakes, rivers, floodplains, <strong>and</strong>aquifer recharge zones are lined with clay <strong>and</strong> plasticbefore being filled with garbage, as seen in Figure 24-14.Note in the figure that the l<strong>and</strong>fill bottom is coveredwith a second impermeable liner, usually made of severallayers of clay, thick plastic, <strong>and</strong> s<strong>and</strong>. This liner collectsleachate (rainwater contaminated as it percolatesthrough the solid waste) <strong>and</strong> is intended to prevent itsleakage into groundwater. Wells are drilled around thel<strong>and</strong>fill to monitor any leakage.Collected leachate is pumped from the bottom ofthe l<strong>and</strong>fill, stored in tanks, <strong>and</strong> sent to a regularsewage treatment plant or an on-site treatment plant.When full, the l<strong>and</strong>fill is covered with clay, s<strong>and</strong>,gravel, <strong>and</strong> topsoil to prevent water from seeping in.When l<strong>and</strong>fill is full,layers of soil <strong>and</strong> clayseal in trashTopsoilS<strong>and</strong>ClayMethane storage<strong>and</strong> compressorbuildingElectricitygeneratorbuildingLeachatetreatment systemGarbageProbes to detectmethane leaksMethane gasrecovery wellPipes collect explosivemethane gas used as fuelto generate electricityLeachatestorage tankCompactedsolid wasteGroundwatermonitoring wellLeachatemonitoringwellGarbageS<strong>and</strong>Synthetic linerS<strong>and</strong>ClaySubsoilLeachate pipesClay <strong>and</strong> plastic liningto prevent leaks; pipescollect leachate frombottom of l<strong>and</strong>fillLeachate pumped upto storage tank forsafe disposalGroundwaterFigure 24-14 Solutions: state-of-the-art sanitary l<strong>and</strong>fill, which is designed to eliminate or minimize environmentalproblems that plague older l<strong>and</strong>fills. Even such state-of-the-art l<strong>and</strong>fills are expected to leak eventually,passing both the effects of contamination <strong>and</strong> cleanup costs on to future generations. Since 1997, only thisstate-of-the art type of l<strong>and</strong>fill can operate in the United States. As a result, many older <strong>and</strong> small l<strong>and</strong>fills havebeen closed <strong>and</strong> replaced with larger local <strong>and</strong> regional modern l<strong>and</strong>fills.http://biology.brookscole.com/miller14547
These new l<strong>and</strong>fills are equipped with a connectednetwork of vent pipes to collect l<strong>and</strong>fill gas(consisting mostly of two greenhouse gases, methane<strong>and</strong> carbon dioxide) released by the underground decompositionof wastes. The methane is filtered out <strong>and</strong>burned in small gas turbines to produce steam or electricityfor nearby facilities or sold to utilities for use asa fuel. In the United States Waste Management has decidedthat producing <strong>and</strong> selling power from methaneproduced by decomposing garbage in its many l<strong>and</strong>fillsis a major business opportunity. Figure 24-15 liststhe advantages <strong>and</strong> disadvantages of using sanitaryl<strong>and</strong>fills to dispose of solid waste.Thous<strong>and</strong>s of older <strong>and</strong> ab<strong>and</strong>oned l<strong>and</strong>fills in theUnited States (<strong>and</strong> elsewhere) do not have gas collectionsystems <strong>and</strong> will emit methane <strong>and</strong> carbon dioxide,both potent greenhouse gases, for decades.Contamination of groundwater <strong>and</strong> nearby surfacewater by leachate from unlined <strong>and</strong> lined olderl<strong>and</strong>fills is also a serious problem. Some 86% of olderAdvantagesNo open burningLittle odorLowgroundwaterpollution if sitedproperlyCan be builtquicklyLow operatingcostsCan h<strong>and</strong>lelarge amountsof wasteFilled l<strong>and</strong> canbe used forotherpurposesNo shortage ofl<strong>and</strong>fill space inmany areasTrade-OffsSanitary L<strong>and</strong>fillsDisadvantagesNoise <strong>and</strong> trafficDustAir pollution fromtoxic gases <strong>and</strong>volatile organiccompoundsReleasesgreenhouse gases(methane <strong>and</strong> CO 2 )unless they arecollectedGroundwatercontaminationSlow decompositionof wastesDiscouragesrecycling <strong>and</strong> wastereductionEventually leaks <strong>and</strong>can contaminategroundwaterFigure 24-15 Trade-offs: advantages <strong>and</strong> disadvantagesof using sanitary l<strong>and</strong>fills to dispose of solid waste. Pick thesingle advantage <strong>and</strong> disadvantage that you think are the mostimportant.U.S. l<strong>and</strong>fills studied have contaminated groundwater,<strong>and</strong> a fifth of all Superfund hazardous waste sites areformer municipal l<strong>and</strong>fills. In other words, most olderl<strong>and</strong>fills throughout the world are chemical timebombs that release greenhouse gases <strong>and</strong> can eventuallyleak hazardous chemicals.xHOW WOULD YOU VOTE? Do the advantages of buryingsolid waste in sanitary l<strong>and</strong>fills outweigh the disadvantages?Cast your vote online at http://biology.brookscole.com/miller14.24-7 HAZARDOUS WASTEWhat Is Hazardous Waste? ToxicThreatsDeveloped countries produce about 80–90%of the world’s solid <strong>and</strong> liquid wastes that canharm people, <strong>and</strong> most such wastes are notregulated.Hazardous waste is any discarded solid or liquid materialthat is toxic, ignitable, corrosive, or reactive enoughto explode or release toxic fumes. According to the UNEnvironment Programme, developed countries produce80–90% of these wastes.In the United States, about 5% of all hazardouswaste is regulated under the Resource Conservation<strong>and</strong> Recovery Act (RCRA, pronounced “RICK-ra”)<strong>and</strong> is often referred to as RCRA hazardous waste. RCRAdoes not regulate■ Radioactive wastes■ Hazardous <strong>and</strong> toxic materials discarded byhouseholds (Figure 24-16)■ Mining wastes■ Oil- <strong>and</strong> gas-drilling wastes (routinely dischargedinto surface waters or dumped into unlined pits <strong>and</strong>l<strong>and</strong>fills)■ Liquid waste containing organic hydrocarboncompounds (80% of all liquid hazardous waste) cementkiln dust produced when liquid hazardouswastes are burned in a cement kiln■ Wastes from the thous<strong>and</strong>s of small businesses <strong>and</strong>factories that generate less than 100 kilograms (220pounds) of hazardous waste per monthAbout 72% of these hazardous wastes are producedby chemical <strong>and</strong> petroleum industries <strong>and</strong>another 22% are generated by mining <strong>and</strong> metal processingindustries.The amount of hazardous <strong>and</strong> toxic waste in theUnited States <strong>and</strong> other countries is likely to increasebecause of the projected 80% global increase in chemical548 CHAPTER 24 Solid <strong>and</strong> Hazardous Waste
What Harmful Chemicals Are in Your Home?Figure 24-16 Harmful chemicalsfound in many homes. Congress hasexempted disposal of these householdmaterials from government regulation.Make a survey to see which of thesechemicals are in your home.Cleaning• Disinfectants• Drain, toilet, <strong>and</strong>window cleaners• Spot removers• Septic tank cleanersPaint• Latex <strong>and</strong> oil-based paints• Paint thinners, solvents,<strong>and</strong> strippers• Stains, varnishes,<strong>and</strong> lacquers• Wood preservatives• Artist paints <strong>and</strong> inksGeneral• Dry-cell batteries(mercury <strong>and</strong> cadmium)• Glues <strong>and</strong> cementsproduction (including many of hazardous <strong>and</strong> toxicchemicals) between 1995 <strong>and</strong> 2020.How Safe Are U.S. Chemical Plants fromTerrorist Attacks? Toxic TerrorismLarge amounts of hazardous wastes could bereleased into the environment by terroristattacks on major chemical plants in the UnitedStates.Managers of industrial plants that manufacture <strong>and</strong>use chemicals work hard to prevent accidental releaseof chemicals that can harm workers or nearby residents.But accidents can happen, as thous<strong>and</strong>s of peopleliving near a pesticide manufacturing plant inBhopal, India, learned in 1984 (Case Study, right).The 2001 act of terrorism on New York City’sWorld Trade Center Towers <strong>and</strong> the Pentagon hasheightened concerns about terrorist acts against suchplants. Roughly 20,000 industrial plants in the UnitedStates contain large quantities of hazardous chemicals.Analysts view such plants as easy targets for acts ofsabotage by terrorists.A 1999 government study found that chemicalplant security ranged from “fair to very poor.” In 2000,Gardening• Pesticides• Weed killers• Ant <strong>and</strong> rodent killers• Flea powdersAutomotive• Gasoline• Used motor oil• Antifreeze• Battery acid• Solvents• Brake <strong>and</strong> transmissionfluid• Rust inhibitor <strong>and</strong>rust removerthe EPA estimated that in a worstcasesituation more than 1 millionpeople could be killed or injuredby a terrorist attack on any one of123 major U.S. chemical plants.Case Study: A Black Day inBhopal, IndiaThe world’s worst industrialaccident occurred in 1984 at apesticide plant in Bhopal, India.December 2, 1984, will long be ablack day for India. On that datethe world’s worst industrial accidentoccurred at a Union Carbidepesticide plant in Bhopal, India.An explosion in an undergroundstorage tank released alarge quantity of highly toxic methyl isocyanate (MIC)gas, used to produce carbamate pesticides. Investigationfound that water leaking into the tank throughfaulty valves <strong>and</strong> corroded pipes caused an explosivechemical reaction.Once in the atmosphere, some of the toxic MICwas converted to more deadly hydrogen cyanide gas.The toxic cloud of gas settled over about 78 squarekilometers (30 square miles), exposing up to 600,000people. Many were illegal squatters living near theplant because they had no other place to go. Thedeadly cloud spread through Bhopal without warningbecause the plant’s warning sirens had been turned offto save money.According to Indian officials, at least 8,000 peopledied within a few days after the accident. The InternationalCampaign for Justice in Bhopal estimates thatby 2003 the accident had killed 23,000 <strong>and</strong> climbing. Italso puts the number of people suffering from chronicillnesses from the accident at 120,000–150,000. An internationalteam of medical specialists estimated in1996 that 50,000–60,000 people sustained permanentinjuries such as blindness, lung damage, <strong>and</strong> neurologicalproblems. With any of these estimates, this wasthe world’s largest industrial tragedy.http://biology.brookscole.com/miller14549
Indian officials claim that Union Carbide probablycould have prevented the tragedy by spending nomore than $1 million to upgrade plant equipment <strong>and</strong>improve safety. According to an investigation byIndia’s Central Bureau of Investigation (CBI), corporatemanagers of Union Carbide in the United Statesmade a decision to save money by cutting back onmaintenance <strong>and</strong> safety because the plant had provento be a financial disappointment for the company. TheCBI found that on the night of the disaster six safetymeasures designed to prevent a leak of toxic materialswere inadequate, shut down, or malfunctioning.After the accident, Union Carbide reduced thecorporation’s liability risks for compensating victimsby selling off a portion of its assets <strong>and</strong> giving much ofthe profits to its shareholders in the form of specialdividends. In 1994, Union Carbide sold its holdings inIndia <strong>and</strong> later was taken over by Dow Chemical.In 1989, Union Carbide agreed to pay an out-ofcourtsettlement of $470 million to compensate the victims(low estimate of 3,000 deaths) without admittingany guilt or negligence concerning the accident. In1992, the Court of the Chief Judicial Magistrate forBhopal charged Warren Anderson, CEO of UnionCarbide at the time of the accident, with “culpablehomicide” (the equivalent of manslaughter) <strong>and</strong> issueda warrant for his arrest. Since then he has refusedto appear in court <strong>and</strong> the U.S. government has not respondedto India’s request to extradite him to India tost<strong>and</strong> trial. Every December since 1984, marchers inBhopal have paraded an effigy of Warren Andersonthrough town <strong>and</strong> burned it. Dow, which bought upUnion Carbide in 1999, refused to accept any of thecompany’s alleged Bhopal liabilities.by Lois Gibbs on the website for this chapter. This is aninput approach that tries to reduce the production ofsuch wastes <strong>and</strong> their release into the air, water, <strong>and</strong>soil. With this approach, scientists look for substitutesfor toxic or hazardous materials, reuse or recycle themwithin industrial cycles, or use them as raw materialsfor new products (Figure 24-5) instead of burning orburying them.Figure 24-17 lists the priorities that prominent scientistsbelieve we should follow in dealing with hazardouswaste. Study this figure carefully. Denmark isfollowing these priorities but most countries are not.How Can We Remove or Detoxify HazardousWaste? Science to the RescueChemical <strong>and</strong> biological methods can be used toremove hazardous wastes or to reduce their toxicity.In Denmark, all hazardous <strong>and</strong> toxic waste from industries<strong>and</strong> households is delivered to 21 transferstations throughout the country. The waste is thentransferred to a large treatment facility. There, aboutthree-fourths of the waste is detoxified by physical,chemical, <strong>and</strong> biological methods <strong>and</strong> the rest isburied in a carefully designed <strong>and</strong> monitored l<strong>and</strong>fill.Physical methods used to detoxify hazardous wastesinclude filtering out solids, distilling liquid mixtures toseparate out harmful chemicals, <strong>and</strong> precipitating suchchemicals from solution. Especially deadly wastes canbe encapsulated in glass, cement, or ceramics <strong>and</strong> thenisolated in storage sites.Chemical reactions can also be used to converthazardous chemicals to less harmful or harmless chem-What Can We Do with Hazardous Waste?Manage It or Produce LessWe can burn, bury, detoxify, reuse, recycle, ornot produce hazardous wastes.We can manage hazardous waste mostly by burningor burying it. This is an output approach thattries to figure out what to do with such wastesafter we have produced them.We can also use a pollution preventionor waste reduction approach.See the Guest Essay on this subjectL<strong>and</strong>treatmentIncinerationProduce Less WasteManipulateprocessesto eliminateor reduceproductionThermaltreatmentRecycle <strong>and</strong>reuseConvert to Less Hazardous or Nonhazardous SubstancesChemical,physical, <strong>and</strong>biologicaltreatmentOcean <strong>and</strong>atmosphericassimilationFigure 24-17 Solutions: prioritiessuggested by prominent scientistsfor dealing with hazardous waste.To date, these priorities have notbeen followed in the United States ormost other countries. (Data from U.S.National Academy of Sciences)L<strong>and</strong>fillUndergroundinjectionPut in Perpetual StorageWastepilesSurfaceimpoundmentsSaltformationsArid regionunsaturatedzone550 CHAPTER 24 Solid <strong>and</strong> Hazardous Waste
icals. Scientists are testing the use of cyclodextrin—atype of sugar made from corn starch—to remove toxicmaterials such as solvents <strong>and</strong> pesticides from contaminatedsoil <strong>and</strong> groundwater. To clean up a site, asolution of cyclodextrin is injected. After this molecular-spongematerial moves through the soil or groundwater<strong>and</strong> attracts various toxic chemicals, it ispumped out of the ground, stripped of its contaminants,<strong>and</strong> reused.Some scientists <strong>and</strong> engineers consider biologicaltreatment as the wave of the future for cleaning upsome types of toxic <strong>and</strong> hazardous waste. Oneapproach is bioremediation, in which bacteria <strong>and</strong> enzymesare used to help destroy toxic or hazardous substancesor convert them to harmless compounds. Seethe Guest Essay by John Pichtel on this topic on thewebsite for this chapter.Another biological way to treat hazardous wastesis phytoremediation. It involves using natural orgenetically engineered plants to absorb, filter, <strong>and</strong> removecontaminants from polluted soil <strong>and</strong> water (Figure24-18). For example, researchers at the Universityof Georgia used genetic engineering to add extradetoxifying power to a cottonwood tree. They inserteda mercury-detoxifying gene of E. coli into the genomeof a common soil bacterium, which was incorporatedinto day-old cottonwood trees. After reaching maturitysuch trees can extract more mercury ions (Hg 2 )fromRadioactivecontaminantsOrganiccontaminantsInorganicmetal contaminantsPoplar treeBrake fernSunflowerWillow treeIndian mustardL<strong>and</strong>fillOilspillPollutedgroundwaterinDecontaminatedwater outPollutedleachateSoilSoilGroundwaterGroundwaterRhizofiltration Phytostabilization Phytodegradation PhytoextractionRoots of plants such assunflowers with dangling rootson ponds or in greenhousescan absorb pollutants such asradioactive strontium-90 <strong>and</strong>cesium-137 <strong>and</strong> variousorganic chemicals.Plants such as willowtrees <strong>and</strong> poplarscan absorbchemicals <strong>and</strong> keepthem from reachinggroundwater ornearby surface water.Plants such as poplarscan absorb toxic organicchemicals <strong>and</strong> breakthem down into lessharmful compoundswhich they store orrelease slowly into the air.Roots of plants such as Indianmustard <strong>and</strong> brake ferns canabsorb toxic metals such aslead, arsenic, <strong>and</strong> others <strong>and</strong>store them in their leaves.Plants can then be recycled orharvested <strong>and</strong> incinerated.Figure 24-18 Phytoremediation. Ways that various types of plants can be used as pollution sponges to cleanup soil <strong>and</strong> water <strong>and</strong> radioactive substances (left), organic compounds (center), <strong>and</strong> toxic metals (right).(Data from American Society of Plant Physiologists, U.S. <strong>Environmental</strong> Protection Agency, <strong>and</strong> Edenspace)http://biology.brookscole.com/miller14551
contaminated soil than conventional cottonwoods.Various plants have been identified as potential “pollutionsponges” to help clean up soil <strong>and</strong> water contaminatedwith chemicals such as pesticides, organicsolvents, radioactive metals, <strong>and</strong> toxic metals such aslead, mercury, <strong>and</strong> arsenic. Figure 24-19 lists advantages<strong>and</strong> disadvantages of phytoremediation. Studythis figure carefully.Another way to detoxify hazardous waste is witha plasma torch. Plasma—a fourth state of matter—isan ionized gas made up of electrically conductive ions<strong>and</strong> electrons. Passing electrical current through a gasto generate an electric arc <strong>and</strong> very high temperaturescan create a plasma. This process can be carried outcontinuously in a plasma torch somewhat similar to awelding torch.High temperatures from the torch can decomposeliquid or solid hazardous organic material into ions<strong>and</strong> atoms that can be converted into simple molecules,cleaned up, <strong>and</strong> released as a gas. They can alsoconvert hazardous inorganic matter into a moltenglassy material that encapsulates toxic metals <strong>and</strong>keeps them from leaching into groundwater.AdvantagesSmallMobile. Easy tomove to differentsitesProduces no toxicashT rade-OffsPlasma ArcDisadvantagesHigh costProduces CO 2 <strong>and</strong>COCan releaseparticulates <strong>and</strong>chlorine gasCan vaporize <strong>and</strong>release toxic metals<strong>and</strong> radioactiveelementsFigure 24-20 Trade-offs: advantages <strong>and</strong> disadvantages ofusing a plasma arc torch to detoxify hazardous wastes. Pick thesingle advantage <strong>and</strong> disadvantage that you think are the mostimportant.T rade-OffsAdvantagesEasy to establishInexpensiveCan reducematerial dumpedinto l<strong>and</strong>fillsProduces little airpollution comparedto incinerationLow energy usePhytoremediationDisadvantagesSlow (can takeseveral growingseasons)Effective only atdepth plant rootscan reachSome toxic organicchemicals mayevaporate from plantleavesSome plants canbecome toxic toanimalsFigure 24-19 Trade-offs: advantages <strong>and</strong> disadvantages ofusing phytoremediation to remove or detoxify hazardous waste.Pick the single advantage <strong>and</strong> disadvantage that you think arethe most important.One approach is to feed solid or liquid waste materialinto a reaction chamber where the heat of theplasma breaks down organic molecules such as oil,solvents, <strong>and</strong> paint into their basic atoms, which thenrecombine into gases.Another approach is to drill a small hole into acontaminated site such as an old l<strong>and</strong>fill, insert thetorch, <strong>and</strong> turn it on. The process is repeated over agrid pattern to decontaminate an entire area. Unlikeincineration, the plasma process produces no toxic ashthat must be disposed of safely.Figure 24-20 lists the advantages <strong>and</strong> disadvantagesof using a plasma arc torch to detoxify hazardouswaste.What Are the Advantages <strong>and</strong> Disadvantagesof Burning <strong>and</strong> Burying Hazardous Waste?Last ResortsHazardous waste can be incinerated or disposedof on or underneath the earth’s surface, but this canpollute the air <strong>and</strong> water.Hazardous waste can be incinerated. This has thesame mixture of advantages <strong>and</strong> disadvantages asburning solid wastes (Figure 24-13). Two major disadvantagesof incinerating hazardous waste is that itreleases air pollutants such as toxic dioxins <strong>and</strong> producesa highly toxic ash that must be safely <strong>and</strong> permanentlystored.552 CHAPTER 24 Solid <strong>and</strong> Hazardous Waste
Most hazardous waste in the United States is disposedof on l<strong>and</strong> in deep underground wells, surfaceimpoundments such as ponds, pits, or lagoons, <strong>and</strong>state-of-the-art l<strong>and</strong>fills.In deep-well disposal, liquid hazardous wastes arepumped under pressure through a pipe into dry,porous geologic formations or zones of rock far beneathaquifers tapped for drinking <strong>and</strong> irrigation water.Theoretically, these liquids soak into the porousrock material <strong>and</strong> are isolated from overlying groundwaterby essentially impermeable layers of rock.Figure 24-21 lists the advantages <strong>and</strong> disadvantagesof deep-well disposal of liquid hazardous wastes.Take time to study this figure. Many scientists believecurrent regulations for deep-well disposal in theUnited States are inadequate <strong>and</strong> should be improved.xHOW WOULD YOU VOTE? Do the advantages of deepwelldisposal of hazardous waste outweigh their disadvantages?Cast your vote online at http://biology.brookscole.com/miller14.Surface impoundments are excavated depressionssuch as ponds, pits, or lagoons into which liquid hazardouswastes are drained <strong>and</strong> stored (Figure 22-9,p. 502). As water evaporates, the waste settles <strong>and</strong> becomesmore concentrated. Figure 24-22 lists the advantages<strong>and</strong> advantages of this method. Study this figurecarefully. EPA studies found that 70% of these storagebasins in the United States have no liners <strong>and</strong> as manyas 90% may threaten groundwater. According to theAdvantagesSafe method ifsites are chosencarefullyWastes can beretrieved ifproblemsdevelopEasy to doLow costT rade-OffsDeep Underground WellsDisadvantagesLeaks or spills atsurfaceLeaks fromcorrosion of wellcasingExisting fracturesor earthquakescan allow wastesto escape intogroundwaterEncourageswaste productionFigure 24-21 Trade-offs: advantages <strong>and</strong> disadvantages ofinjecting liquid hazardous wastes into deep underground wells.Pick the single advantage <strong>and</strong> disadvantage that you think arethe most important.AdvantagesLow constructioncostsLow operatingcostsCan be builtquicklyWastes can beretrieved ifnecessaryCan store wastesindefinitely withsecure doublelinersT rade-OffsSurface ImpoundmentsDisadvantagesGroundwatercontaminationfrom leaking liners(or no lining)Air pollution fromvolatile organiccompoundsOverflow fromfloodingDisruption <strong>and</strong>leakage fromearthquakesPromotes wasteproductionFigure 24-22 Trade-offs: advantages <strong>and</strong> disadvantages ofstoring liquid hazardous wastes in surface impoundments. Pickthe single advantage <strong>and</strong> disadvantage that you think are themost important.EPA, eventually all liners are likely to leak <strong>and</strong> cancontaminate groundwater.Sometimes liquid <strong>and</strong> solid hazardous wastes areput into drums or other containers <strong>and</strong> buried in carefullydesigned <strong>and</strong> monitored secure hazardous wastel<strong>and</strong>fills (Figure 24-23, p. 554). Many large companieshave secure l<strong>and</strong>fills to treat their own hazardouswaste but there are 23 commercial hazardous wastel<strong>and</strong>fills in the United States.Sweden goes further <strong>and</strong> buries its concentratedhazardous wastes in underground vaults made of reinforcedconcrete. By contrast, in the United Kingdommost hazardous wastes are mixed with householdgarbage <strong>and</strong> stored in hundreds of conventional l<strong>and</strong>fillsthroughout the country.Hazardous wastes can also be stored in carefullydesigned aboveground buildings. This is especially usefulin areas where the water table is close to the surfaceor areas that are above aquifers used for drinking water.These structures are built to withst<strong>and</strong> storms <strong>and</strong>to prevent the release of toxic gases. Leaks are monitored<strong>and</strong> any leakage is collected <strong>and</strong> treated.Each year there are more than 500,000 shipments ofhazardous chemicals in the United States. Most go bytrucks or trains to l<strong>and</strong>fills <strong>and</strong> incinerators. Hazardousraw materials are also shipped to manufacturingplants. On average, these shipments result in about13,000 accidents per year in the United States, involvingabout 100 deaths, than 10,000 injuries, <strong>and</strong> evacuationshttp://biology.brookscole.com/miller14553
Figure 24-23 Solutions: securehazardous waste l<strong>and</strong>fill.ImperviousclayBulk wasteGas ventTopsoilEarthS<strong>and</strong>Plastic coverImpervious clay capClay capof more than 500,000 people.Most communities do not havethe equipment <strong>and</strong> trained personnelneeded to deal with hazardouswaste spills. How well isyour community prepared todeal with such spills? In the future,some of the risks might bereduced by using solid nanoparticlematerials to absorb thehazardous liquids.Figure 24-24 lists ways youcan reduce your environmentalinput of hazardous waste.EarthWatertableGroundwaterDouble leachatecollection systemPlasticdoublelinerReactivewastesin drumsLeakdetectionsystemGroundwatermoniteringwellWhat Are Brownfields? Recycling DangerousSitesMany ab<strong>and</strong>oned industrial <strong>and</strong> other hazardouswaste sites are being cleaned up <strong>and</strong> put to use.Brownfields are ab<strong>and</strong>oned industrial <strong>and</strong> commercialsites usually contaminated with hazardous wastes. Examplesinclude factories, junkyards, older l<strong>and</strong>fills,<strong>and</strong> gas stations. Some 450,000–600,000 brownfieldsites exist in the United States, often in economicallydistressed inner cities.What Can You Do?Hazardous WasteBrownfields can be cleaned up <strong>and</strong> reborn asparks, nature reserves, athletic fields, ecoindustrialparks (p. 536), <strong>and</strong> neighborhoods. But first old oil <strong>and</strong>grease, industrial solvents, toxic metals, <strong>and</strong> other contaminantsmust be removed from their soil <strong>and</strong>groundwater. Such efforts have been hampered byconcerns about legal liability for the contamination.However, Congress <strong>and</strong> almost half of the states havepassed laws limiting the liability for developers <strong>and</strong>their lenders.Brownfield redevelopment is now seen as a wayto rebuild parts of cities, create jobs, <strong>and</strong> increase thetax base. By 2004, more than 40,000 former brownfieldsites had been redeveloped in the United States <strong>and</strong>many other projects are under way.• Use pesticides in the smallest amount possible.• Use less harmful substances instead of commercialchemicals for most household cleaners. For example,use liquid ammonia to clean appliances <strong>and</strong> windows;vinegar to polish metals, clean surfaces, <strong>and</strong> removestains <strong>and</strong> mildew; baking soda to clean householdutensils, deodorize, <strong>and</strong> remove stains; borax to removestains <strong>and</strong> mildew.• Do not dispose of pesticides, paints, solvents, oil,antifreeze, or other products containing hazardouschemicals by flushing them down the toilet, pouringthem down the drain, burying them, throwing theminto the garbage, or dumping them down storm drains.Figure 24-24 What can you do? Ways to reduce your input ofhazardous waste into the environment.24-8 CASE STUDIES: LEAD, MERCURY,AND DIOXINSWhat Is the Threat from Lead? A Toxic MetalLead is especially harmful to children <strong>and</strong> is still usedin leaded gasoline <strong>and</strong> household paints in about100 countries.Because it is a chemical element, lead (Pb) does notbreak down in the environment. Lead is a potent neurotoxinthat can harm the nervous system, especiallyin young children. Each year, 12,000–16,000 Americanchildren under age 9 are treated for acute lead poisoning,<strong>and</strong> about 200 die. About 30% of the survivors sufferfrom palsy, partial paralysis, blindness, <strong>and</strong> mentalretardation.554 CHAPTER 24 Solid <strong>and</strong> Hazardous Waste
PreventionPhase out leadedgasoline worldwidePhase out wasteincinerationResearch indicates that childrenunder age 6 <strong>and</strong> unborn fetuseswith even fairly low bloodlevels of lead are especially vulnerableto nervous system impairment,lowered IQ (by anaverage of 7.4 points), shortenedattention span, hyperactivity,hearing damage, <strong>and</strong> various behaviordisorders.Good news. Between 1976 <strong>and</strong>2000, the percentage of U.S. childrenages 1 to 5 with blood leadlevels above the current safetyst<strong>and</strong>ard dropped from 85% to2.2%, preventing at least 9 millionchildhood lead poisonings. Theprimary reason was that governmentregulations banned leadedgasoline in 1976 (with completephaseout by 1986) <strong>and</strong> leadbasedpaints in 1970 (but illegaluse continued until about 1978)—an excellent example of thepower of pollution prevention.Bad news. Even with the encouragingdrop in average bloodlevels of lead, the U.S. Centers forDisease Control <strong>and</strong> Preventionestimates that at least 400,000 U.S.children still have unsafe bloodlevels of lead, caused by exposurefrom a number of sources. A majorsource is inhalation or ingestion of lead particlesfrom peeling lead-based paint found in about 38 millionhouses built before 1960. Lead can also leach fromwater lines <strong>and</strong> pipes <strong>and</strong> faucets containing lead. Inaddition, a 1993 study by the U.S. National Academy ofSciences <strong>and</strong> numerous other studies indicate there is nosafe level of lead in children’s blood.Health scientists have proposed a number of waysto help protect children from lead poisoning, as listedin Figure 24-25. Taking most of these actions will costan estimated $50 billion in the United States. Buthealth officials say the alternative is to keep poisoning<strong>and</strong> mentally h<strong>and</strong>icapping millions of children.Although the threat from lead has been reduced inthe United States, this is not the case in many developingcountries. About 80% of the gasoline sold in theworld today is unleaded, but about 100 countries stilluse leaded gasoline. The World Health Organization(WHO) estimates that 130–200 million children aroundthe world are at risk from lead poisoning, <strong>and</strong> 15–18million children in developing countries have permanentbrain damage because of lead poisoning—mostlyTest blood for lead by age 1Ban lead solder inplumbing pipes, fixtures,<strong>and</strong> food cansBan lead glazing forceramicware used toserve foodBan c<strong>and</strong>les withlead coresSolutionsLead PoisoningControlSharply reduce leademissions from old <strong>and</strong>new incineratorsReplace lead pipes <strong>and</strong>plumbing fixturescontaining lead solderRemove leaded paint<strong>and</strong> lead dust from olderhouses <strong>and</strong> apartmentsRemove lead from TVsets <strong>and</strong> computermonitors beforeincineration or l<strong>and</strong>disposalTest for lead in existingceramicware used toserve foodTest existing c<strong>and</strong>lesfor leadWash fresh fruits <strong>and</strong>vegetablesFigure 24-25 Solutions: ways to help protect children from lead poisoning. Which two of the solutionsdo you believe are the most important?from use of leaded gasoline. Good news. China recentlyphased out leaded gasoline in less than three years.What Is the Threat from Mercury? Some FishMay Come With a Side of Toxic MercuryMercury is released into the environment mostly byburning coal <strong>and</strong> incinerating wastes <strong>and</strong> can build tohigh levels in some types of fish consumed by humans.Mercury—the only metal that is liquid at room temperature—isused in thermometers, dental fillings,fluorescent lights, mercury light switches, <strong>and</strong> otherelectrical equipment <strong>and</strong> is released into the atmospherefrom burning coal <strong>and</strong> incinerating municipal<strong>and</strong> industrial wastes. Mercury compounds are alsoused as paint pigments, fungicides, insecticides, <strong>and</strong> indry-cell batteries.Once released into the atmosphere from naturalor human sources, elemental mercury often is convertedto more toxic inorganic <strong>and</strong> organic mercurycompounds, as shown in Figure 24-26. Trace the pathsin this diagram.http://biology.brookscole.com/miller14555
AIRWINDSPRECIPITATIONWINDSPRECIPITATIONHg <strong>and</strong> SO 2Hg 2+ <strong>and</strong> acidsHg 2+ <strong>and</strong> acidsIncineratorHuman sourcesCoalburningplantElementalmercuryvapor(Hg)PhotochemicaloxidationInorganicmercury<strong>and</strong> acids(Hg 2+ )Inorganic mercury<strong>and</strong> acids(Hg 2+ )DepositionRunoff of Hg 2+ <strong>and</strong>acidsDepositionVaporizationWATERDepositionSmall fishLarge fishBIOMAGNIFICATIONIN FOOD CHAINPhytoplanktonZooplanktonElementalmercury liquid(Hg)SettlesoutOxidationInorganicmercury(Hg 2+ )SettlesoutBacteria<strong>and</strong> acidsBacteriaOrganicmercury(CH 3 Hg + )SettlesoutSEDIMENTFigure 24-26 Cycling of mercury in aquatic environments, in which mercury is converted from one form to another.The most toxic form to humans is methylmercury (CH 3 Hg ), which can be biologically magnified inaquatic food chains. Some mercury is also released back into the atmosphere as mercury vapor.Humans are exposed to mercury in two ways.One is by inhaling vaporized elemental mercury (Hg)or particulates of inorganic mercury (Hg 2 ) salts (suchas HgS <strong>and</strong> HgCl 2 ). The other is eating fish contaminatedwith methylmercury (CH 3 Hg ), which is verytoxic <strong>and</strong> can be biologically magnified in food chains<strong>and</strong> webs. The greatest risk is brain damage from exposureto low levels of methylmercury (CH 3 Hg ) infetuses <strong>and</strong> young children whose nervous systemsare still developing.Mercury is released naturally from rocks, soil, <strong>and</strong>volcanoes <strong>and</strong> by vaporization from the ocean. However,50–75% of mercury emissions are believed tocome from human activities, mostly coal burning <strong>and</strong>to a lesser degree waste incineration. Mercury is alsoreleased into the air when it is used to help extractgold <strong>and</strong> silver from ores, in some chlorine manufacturingprocesses, <strong>and</strong> when a fluorescent light bulbbreaks.These human-related sources emit elemental mercury(Hg) vapor <strong>and</strong> particles of inorganic mercury(Hg 2 ) salts into the atmosphere. Within hours to days,these forms of mercury fall back to the earth’s l<strong>and</strong> <strong>and</strong>aquatic systems in rain, snow, or as dry particles. Somefalls out locally <strong>and</strong> some in downwind areas.Once moderately harmful inorganic mercury ions(Hg 2 ) enter an aquatic system, bacteria often convertit to highly toxic methylmercury that can be biologicallymagnified in food chains <strong>and</strong> webs (Figure 24-26).This explains why high levels of methylmercury are oftenfound in the tissues of sharks, swordfish, kingmackerel, tilefish, <strong>and</strong> albacore (white) tuna feeding athigh trophic levels in food chains <strong>and</strong> webs. In 2004,the Food <strong>and</strong> Drug Administration (FDA) <strong>and</strong> the U.S.556 CHAPTER 24 Solid <strong>and</strong> Hazardous Waste
EPA advised women who may become pregnant, pregnantwomen, <strong>and</strong> nursing mothers not to eat shark,swordfish, king mackerel, or tilefish <strong>and</strong> to limit theirconsumption of albacore tuna to no more than 170grams (6 ounces) per week. They also advised such individualsto check local advisories about the safety offish caught in local lakes, rivers, <strong>and</strong> coastal areas.Levels of methylmercury in lakes <strong>and</strong> lake organismsappear to be connected to acid deposition, becausethe conversion rate of inorganic mercury tomethylmercury is higher in acidified lakes.According to a 2001 study by the Centers forDisease Control <strong>and</strong> Prevention, 8% of Americanwomen of childbearing age risk having a baby bornwith irreversible neurological problems because of exposureof the fetus to mercury, mostly from the mothereating seafood contaminated with methylmercury.<strong>Problems</strong> include brain <strong>and</strong> nerve system damage thatcan result in cerebral palsy, delayed onset of walking<strong>and</strong> talking, learning disabilities, tremors, irritability,impaired coordination, <strong>and</strong> memory loss. In theUnited States, up to 300,000 babies born each year areat risk from such problems due to mercury exposurewhile in the womb.Figure 24-27 lists ways to prevent or control humanexposure to mercury. In its 2003 report on global mercurypollution, the UN EnvironmentProgramme recommendedphasing out coalburning <strong>and</strong> waste incinerationas rapidly as possible.PreventionPhase out wasteincinerationRemove mercury fromcoal before it is burnedConvert coal to liquidor gaseous fuelSwitch from coal tonatural gas <strong>and</strong>renewable energyresources suchas wind, solar cells,<strong>and</strong> hydrogenPhase out use ofmercury in all productsunless they are recycledIn 2003, environmentalengineers David Mazyck <strong>and</strong>Chang Yu Wu at the Universityof Florida developed away to remove much of themercury from smokestackemissions. They inject tinyparticles of silica <strong>and</strong> a chemicalthat, when exposed to UVlight, produces highly reactivemolecules that removemost of the mercury insmokestack gases. The mercurycan be removed from thesilica so that the silica can bereused. And the mercury canbe sold for use in productssuch as fluorescent bulbs. Theresearchers have founded acompany, Sol-gel PowerTechnologies, to develop thetechnology.In 2000, the U.S. EPA officiallydetermined that mercuryis a hazardous substanceas defined by the Clean Air Act, which requiresthat emissions of such substances be strictly controlled.However, in 2003 the Bush administration opposedinternational limits on mercury emissions <strong>and</strong>other m<strong>and</strong>atory measures aimed at reducing the riskof mercury exposure, mostly from burning coal <strong>and</strong> incineratinghazardous wastes. Also, government analysisshows that President Bush’s proposed Clear Skiesair pollution control program will reduce mercury pollutionless than current regulations under the CleanAir Act <strong>and</strong> could allow emissions of mercury to tripleby 2013. In 2003, by executive order President Bush exemptedthe country’s more polluting coal-burningpower plants from having to follow a rule in the CleanAir Act that would require them to upgrade their airpollution control equipment whenever they do a significantexpansion (p. 456). This will further delay reducingmercury emissions by exempting the plantswith the highest mercury emissions from the requirementsof the Clean Air Act <strong>and</strong> result in hot spots nearsuch plants with high mercury levels.xHOW WOULD YOU VOTE? Should coal-burning electricity<strong>and</strong> industrial plants be required to sharply reduce mercuryemissions? Cast your vote online at http://biology.brookscole.com/miller14.SolutionsMercury PollutionControlSharply reduce mercuryemissions from coalburningplants <strong>and</strong>incineratorsTax each unit of mercuryemitted by coal-burningplants <strong>and</strong> incineratorsCollect <strong>and</strong> recyclemercury-containingelectric switches, relays,<strong>and</strong> dry-cell batteriesRequire labels on allproducts containingmercuryFigure 24-27 Solutions: ways to prevent or control inputs of mercury into the environment fromhuman activities—mostly through coal-burning plants <strong>and</strong> incinerators. Which two of these solutionsdo you believe are the most important?http://biology.brookscole.com/miller14557
How Dangerous Are Dioxins? ControversyOver Unintended CulpritsDioxins are potentially harmful chlorinatedhydrocarbons produced as by-products of variousindustrial processes such as waste incineration <strong>and</strong>paper bleaching.Dioxins (or polychlorinated dibenzodioxins) are afamily of more than 75 different chlorinated hydrocarboncompounds. They form as by-products in hightemperaturechemical reactions involving chlorine<strong>and</strong> hydrocarbons.Dioxins (or polychlorinated dibenzodioxins) aremainly unwanted by-products or unintended consequencesof a wide range of industrial processes. Naturalprocesses such as forest fires <strong>and</strong> volcanic eruptionsalso produce them.Worldwide, incineration of municipal <strong>and</strong> medicalwastes accounts for about 70% of dioxin <strong>and</strong> furan releasesto the atmosphere. Other sources include woodburningfireplaces, coal-fired power plants, metalsmelting <strong>and</strong> refining facilities, wood-pulp <strong>and</strong> papermills, <strong>and</strong> sludge from municipal wastewater treatmentplants.Toxicology studies indicate that about 30 dioxincompounds have significant toxicity. One dioxin compound,TCDD, is the most toxic (Table 19-1, p. 414) <strong>and</strong>the most widely studied. Dioxins are persistent chemicalsthat linger in the environment for decades, especiallyin soil <strong>and</strong> human fat tissue. About 90% of thehuman exposure to trace levels of dioxins occursthrough eating contaminated food.There is concern about possible harmful healtheffects on humans <strong>and</strong> wildlife from exposure to lowlevels of dioxins. A 2001 draft report of an EPAsponsoredcomprehensive review of the scientific literatureby more than 100 scientists around the worldcame to three major conclusions.First, TCDD is a human carcinogen, <strong>and</strong> otherdioxin compounds are likely human carcinogens, especiallyfor people who eat large amounts of fattymeats <strong>and</strong> dairy products. Second, the most powerfulpossible effects of exposure to low levels of dioxin onhumans are disruption of the reproductive, endocrine,<strong>and</strong> immune systems (Case Study, p. 416) <strong>and</strong> harmfuleffects on developing fetuses. Third, very low levels ofdioxin in the environment can cause serious damageto certain wildlife species. But industries producingdioxins say the dangers of long-term exposure of humansto low levels of dioxins are overestimated.Because it will take decades to resolve these issues,some environmental <strong>and</strong> health scientists call for usinga precautionary strategy to sharply reduce emissions ofdioxins now. This would be done mostly by banningthe use of chlorine for bleaching paper (as severalEuropean countries have done) <strong>and</strong> eliminating chlorinatedhydrocarbon compounds that produce dioxinsfrom hazardous wastes burned in incinerators, iron oresintering plants, <strong>and</strong> cement kilns.A 2003 report by the National Academy of Sciencesrecommended that the United States take precautionarysteps to reduce dioxin levels, especially in food. Thepanel of medical experts called for testing livestock forage<strong>and</strong> feed for dioxins, setting lower limits for dioxinsin food products <strong>and</strong> dietary supplements, <strong>and</strong> testingthe products for dioxin levels. They also said thegovernment should encourage people to eat less fat<strong>and</strong> meat, which tend to have higher levels of dioxins.Bad news. These things are not being done.24-9 HAZARDOUS WASTEREGULATION IN THE UNITEDSTATESWhat Is the Resource Conservation <strong>and</strong>Recovery Act? Tracking Hazardous Wastefrom Cradle to GraveU.S. firms producing fairly large amounts ofhazardous waste must get a permit from the EPA<strong>and</strong> submit a record tracking these wastes fromproduction to disposal.In 1976, the U.S. Congress passed the Resource Conservation<strong>and</strong> Recovery Act (RCRA, mentioned previously)<strong>and</strong> amended it in 1984. This law has three major requirements.First, the EPA is to identify hazardouswastes <strong>and</strong> set st<strong>and</strong>ards for their management bystates. Second, firms that store, treat, or dispose of morethan 100 kilograms (220 pounds) of hazardous wastesper month must have a permit stating how suchwastes are to be managed. Third, permit holders mustuse a cradle-to-grave system to keep track of waste theytransfer from a point of generation (cradle) to an approvedoff-site disposal facility (grave) <strong>and</strong> submitproof of this to the EPA.What Is the Superfund Act? Cleaning UpAb<strong>and</strong>oned Waste SitesIn the United States, the EPA identifies ab<strong>and</strong>onedhazardous waste sites, cleans them up, <strong>and</strong> sends thebill to all responsible parties it can find.In 1980, the U.S. Congress passed the Comprehensive<strong>Environmental</strong> Response, Compensation, <strong>and</strong> Liability Act,commonly known as the CERCLA or Superfund program.Through taxes on chemical raw materials, thislaw plus later amendments has provided a trust fundto achieve three goals.One is to identify ab<strong>and</strong>oned hazardous wastedump sites (Spotlight, p. 559), underground tanksleaking toxic chemicals, <strong>and</strong> other hazardous wastesites. Second is to protect <strong>and</strong> if necessary clean upgroundwater near such sites <strong>and</strong> to clean up the sites.558 CHAPTER 24 Solid <strong>and</strong> Hazardous Waste
When they can be found, responsible parties must payfor the cleanup. If no responsible parties can be found,the government cleans up the site using a fund financedby taxes on oil <strong>and</strong> chemical companies.The third goal is to put the worst sites that representan immediate <strong>and</strong> severe threat to human healthon a National Priorities List (NPL) to be cleaned up viaremoval, treatment, incineration, bioremediation, orphytoremediation.At the beginning of 2004, the EPA had identifiedabout 11,300 sites in need of cleanup, including 1,250on the priority list. Since the Superfund started in1983, 300 sites have been cleaned up according to governmentst<strong>and</strong>ards <strong>and</strong> removed from the NPL.Cleanup has been substantially completed on about72% of the remaining 1,250 priority sites at an averagecost of $20 million per site.The five states with the most sites are New Jersey(113), California (96), Pennsylvania (92), New York(90), <strong>and</strong> Michigan (67). California’s Santa ClaraCounty, the birthplace of the nation’s semiconductorindustry in what is called Silicon Valley, contains moreSuperfund priority sites than any other county in thenation. This is not surprising, because a single semiconductorplant uses 500 to 1,000 different chemicals,many of them toxic.The former U.S. Office of Technology Assessment<strong>and</strong> the Waste Management Research Institute estimatethat the Superfund list could eventually includeat least 10,000 priority sites, with cleanup costs of up to$1 trillion, not counting legal fees—a glaring exampleof why preventing pollution is cheaper than cleaningit up.In 1984, Congress amended the Superfund Act togive citizens the right to know what toxic chemicals arebeing stored or released in their communities. This includedrequiring 20,000 large manufacturing facilitiesto report their annual releases of 582 toxic chemicalsinto the environment. In order, the four industries emittingthe largest amounts of toxic air pollutants in 2001were mining (46%), electric utilities (17%), chemicalproduction (9%), <strong>and</strong> primary metal production (8%).Between 1988 <strong>and</strong> 2001, toxic emissions in the UnitedStates dropped by 55%. However, this still means that2.8 million metric tons (3.1 million tons) of toxic chemicalswere legally released into the air, water, <strong>and</strong> groundduring 2001—an average of 9.5 kilograms (21 pounds)for each American. You can look at this Toxic ReleaseInventory to find out what toxic chemicals are beingstored <strong>and</strong> released in your neighborhood by going tothe EPA website at www.epa.gov/tri/.Who Should Pay for Cleaning Up SuperfundSites? Polluters or Taxpayers?The Superfund law was designed to have polluterspay for cleaning up ab<strong>and</strong>oned hazardous waste sites,Using Honeybees toDetect Toxic PollutantsHoneybees are being used todetect the presence of toxic <strong>and</strong>radioactive chemicals in concentrationsas low as several partsSPOTLIGHTper trillion. On their forays from ahive, bees pick up water, nectar, pollen, suspendedparticulate matter, volatile organic compounds,<strong>and</strong> radioactive material found in the air near thesites they visit.The bees then bring these materials back to thehive. There they fan the air vigorously with theirwings to regulate the hive’s temperature. This actionreleases <strong>and</strong> circulates pollutants they pickedup into the air inside the hive.Scientists have put portable hives, each containing7,000–15,000 bees, near known or suspectedhazardous waste sites. A small copper tube attachedto the side of each hive pumps air out.Portable equipment is used to analyze the air fortoxic <strong>and</strong> radioactive materials.To find out where the bees have gone to foragefor food, a botanist uses a microscope to examinepollen grains to determine what kinds of plantsthey come from. These data can be correlated withthe plants found in an area up to 1.6 kilometers(1 mile) from each hive. This allows scientists to developmaps of toxicity levels <strong>and</strong> hot spots on largetracts of l<strong>and</strong>.This approach is much cheaper than setting upa number of air pollution monitors around mines,hazardous waste dumps, <strong>and</strong> other sources of toxic<strong>and</strong> radioactive pollutants. These biological indicatorspecies have helped locate <strong>and</strong> track toxic pollutants<strong>and</strong> radioactive material at more than 30 sitesacross the United States.Critical ThinkingBecause honeybees can pick up toxic pollutantsanywhere they go, should honey from all beehivesbe tested for such pollutants before it is placed onthe market? Explain.but now taxpayers are footing the bill when theculprits cannot be found.To keep taxpayers from footing most of the bill,cleanups of Superfund sites were based on the polluterpaysprinciple. The EPA is charged with finding the partiesresponsible for each site, requiring them to pay forthe entire cleanup, <strong>and</strong> suing them if they do not.When the EPA can find no responsible party, it drawsmoney out of the Superfund for cleanup. This fundwas financed by taxes on oil <strong>and</strong> chemical companies.However, many of the remaining Superfund sites werecreated by mining <strong>and</strong> smelting industries that werenot required to pay taxes into the fund.http://biology.brookscole.com/miller14559
Since the Superfund program began, polluters<strong>and</strong> their insurance companies have been workinghard to do away with the polluter-pays principle at theheart of the program <strong>and</strong> make it mostly a taxpayerpaysapproach. This strategy, which has been successful,has four components. First, deny responsibility(stonewall) to tie up the EPA in expensive legal suitsfor years. Second, sue local governments <strong>and</strong> smallbusinesses to make them responsible for cleanup, bothas a delaying tactic <strong>and</strong> to turn them into opponents ofSuperfund’s strict liability requirements.Third, mount a public relations campaign declaringthat toxic dumps pose little threat, cleanup is tooexpensive compared to the risks involved, <strong>and</strong> theSuperfund law is unfair, wasteful, <strong>and</strong> ineffective.Fourth, persuade Congress not to renew the tax on oil<strong>and</strong> chemical companies that financed the Superfund.The EPA points out that the strict polluter-paysprinciple in the Superfund Act has been effective inmaking illegal dump sites virtually relics of the past—an important form of pollution prevention for the future.It has also forced waste producers, fearful of futureliability claims, to reduce their production of suchwaste <strong>and</strong> to recycle or reuse much more of it.Congress passed a law that went into effect in 2002that generally eliminates financial liability for smallbusiness <strong>and</strong> residential property owners that contributedonly small amounts of hazardous waste to Superfundsites. However, Congress has refused to renewthe tax on oil <strong>and</strong> chemical companies that financed theSuperfund after it expired in 1995. As a result, the Superfundis now broke <strong>and</strong> taxpayers, not polluters, arefooting the bill for future cleanups when the responsibleparties cannot be found. The addition of new sites hasslowed down, <strong>and</strong> government funds available forcleanup have been reduced. This is an important issuefor the one out of four Americans who lives within 6.4kilometers (4 miles) of a superfund site. Are you or anymembers of your family one of these individuals?xHOW WOULD YOU VOTE? Should the U.S. Congress reinstatethe polluter-pays principle by using taxes from chemical,oil, mining, <strong>and</strong> smelting companies to reestablish a fund forcleaning up existing <strong>and</strong> new Superfund sites? Cast your voteonline at http://biology.brookscole.com/miller14.24-10 ACHIEVING A LOW-WASTESOCIETYWhat Is the Role of Grassroots Action?Making a DifferenceIn the United States, citizens have kept large numbersof incinerators, l<strong>and</strong>fills, <strong>and</strong> hazardous wastetreatment plants from being built in their local areas.In the United States, individuals have worked togetherto prevent hundreds of incinerators, l<strong>and</strong>fills, or treat-ment plants for hazardous <strong>and</strong> radioactive wastesfrom being built in or near their communities. Oppositionhas grown as numerous studies have shown thatsuch facilities have traditionally been located in communitiespopulated mostly by African Americans,Asian Americans, Latinos, <strong>and</strong> poor whites. This practicehas been cited as an example of environmental injustice.See the Guest Essay on this subject by RobertBullard on the website for this chapter.Health risks from incinerators <strong>and</strong> l<strong>and</strong>fills, whenaveraged over the entire country, are quite low, but therisks for people living near these facilities are muchhigher. They, not the rest of the population, are theones whose health, lives, <strong>and</strong> property values are beingthreatened.Manufacturers <strong>and</strong> waste industry officials pointout that something must be done with the toxic <strong>and</strong>hazardous wastes produced to provide people withcertain goods <strong>and</strong> services. They contend that if localcitizens adopt a “not in my back yard” (NIMBY) approach,the waste still ends up in someone’s back yard.Many citizens do not accept this argument. Tothem, the best way to deal with most toxic or hazardouswastes is to produce much less of them, as suggested bythe National Academy of Sciences (Figure 24-17). Forsuch materials, their goal is “not in anyone’s back yard”(NIABY) or “not on planet Earth” (NOPE) by emphasizingpollution prevention <strong>and</strong> use of the precautionaryprinciple.What Can Be Done at the International Level?The POPs TreatyAn international treaty calls for phasing out the useof harmful persistent organic pollutants (POPs).In 2001, the UN Commission on Human Rightsdeclared that being able to live free of pollution is a basichuman right. There is a long way to go in convertingthis ideal into reality, but important progress hasbeen made.Between 1989 <strong>and</strong> 1994, an international treaty tolimit transfer of hazardous waste from one country toanother was developed. And in 2000, delegates from122 countries completed a global treaty to control 12persistent organic pollutants (POPs).These widely used toxic chemicals are insoluble inwater <strong>and</strong> soluble in fat. This means that in the fatty tissuesof humans <strong>and</strong> other organisms feeding at hightrophic levels in food webs, they can become concentratedat levels hundreds of thous<strong>and</strong> times higherthan in the general environment (Figure 19-4, p. 411,<strong>and</strong> Figure 22-6, p. 498). These persistent pollutants canalso be transported long distances by wind <strong>and</strong> water.The list of 12 chemicals, sometimes called the dirtydozen, includes DDT, eight other chlorine-containingpersistent pesticides (Table 23-1, p. 520), PCBs, dioxins,<strong>and</strong> furans. The goals of the treaty are to ban or phase560 CHAPTER 24 Solid <strong>and</strong> Hazardous Waste
out use of these chemicals <strong>and</strong> to detoxify or isolatestockpiles of them. About 25 countries can continueusing DDT to combat malaria until safer alternativesare available. Developed nations will provide developingnations about $150 million per year to help themswitch to safer alternatives to the 12 POPs.<strong>Environmental</strong>ists consider the POPs treaty an importantmilestone in international environmental lawbecause it uses the precautionary principle to manage<strong>and</strong> reduce the risks from toxic chemicals. This list isexpected to grow as scientific studies uncover moreevidence of toxic <strong>and</strong> environmental damage fromsome of the chemicals we use.In 2000, the Swedish Parliament enacted a lawthat by 2020 would ban all chemicals that are persistent<strong>and</strong> can bioaccumulate in living tissue. This lawalso requires an industry to perform risk assessmentson all old <strong>and</strong> new chemicals <strong>and</strong> show that thesechemicals are safe to use, as opposed to requiring thegovernment to show they are dangerous. In otherwords, chemicals are assumed guilty until their innocencecan be established—the reverse of the currentpolicy in the United States <strong>and</strong> most countries. There isstrong opposition to this approach in the UnitedStates, especially by industries producing potentiallydangerous chemicals.How Can We Make the Transition to aLow-Waste Society? A New VisionA number of the principles <strong>and</strong> programs discussedin this chapter can be used to make the transition to alow-waste society during this century.According to physicist Albert Einstein, “A clever personsolves a problem, a wise person avoids it.” Toprevent pollution <strong>and</strong> reduce waste production, manyenvironmental scientists urge us to underst<strong>and</strong> <strong>and</strong>live by four key principles:■ Everything is connected.■ There is no “away” for the wastes we produce.■ Dilution is not always the solution to pollution.■ The best <strong>and</strong> cheapest way to deal with waste <strong>and</strong>pollution is to produce less pollutants <strong>and</strong> to reuse<strong>and</strong> recycle most of the materials we use.Currently, the order of priorities for dealing withsolid waste in the United States <strong>and</strong> in most countriesis the reverse of the order suggested by prominent scientistsin Figure 24-3. It does not have to be that way.Some scientists <strong>and</strong> economists estimate that 60–80%of the solid waste we produce can be eliminated by acombination of reducing waste production, reusing <strong>and</strong>recycling materials (including composting), <strong>and</strong> redesigningmanufacturing processes <strong>and</strong> buildings toproduce less waste.The governments of Norway, Austria, <strong>and</strong> theNetherl<strong>and</strong>s have committed themselves to reducetheir resource waste by 75%. Other countries are followingtheir lead.Likewise, there is growing interest in <strong>and</strong> use ofincreased resource productivity, pollution prevention,ecoindustrial systems, <strong>and</strong> service-flow businesses.In addition, at least 24 countries have eco-labelingprograms that certify a product or service as having metspecified environmental st<strong>and</strong>ards. The first wasGermany’s Blue Angel program, begun in 1978. It nowawards its seal of approval to more than 3,900 products<strong>and</strong> services. Other examples are India’s Ecomark,Singapore’s Green Label, <strong>and</strong> the Green Seal program inthe United States.Such revolutions start off slowly but can acceleraterapidly as their economic, ecological, <strong>and</strong> healthadvantages become more apparent to investors, businessleaders, elected officials, <strong>and</strong> citizens.The key to addressing the challenge of toxics use <strong>and</strong> wastesrests on a fairly straightforward principle: harness theinnovation <strong>and</strong> technical ingenuity that has characterizedthe chemicals industry from its beginning <strong>and</strong> channel thesequalities in a new direction that seeks to detoxify our economy.ANNE PLATT MCGINNCRITICAL THINKING1. Use the second law of thermodynamics (p. 51) to explainwhy a properly designed source-separation recyclingprogram takes less energy <strong>and</strong> produces less pollutionthan a centralized program that collects mixed wasteover a large area <strong>and</strong> hauls it to a centralized facilitywhere workers or machinery separate the wastes forrecycling.2. Are you for or against bringing about an ecoindustrialrevolution in the country <strong>and</strong> community where you live?Explain. Do you believe it will be possible to phase insuch a revolution over the next two to three decades?Explain.3. Explain why some businesses participating in an exchange<strong>and</strong> chemical-cycling network (Figure 24-5,p. 537) might produce large amounts of waste for use asresources within the network rather than redesigningtheir manufacturing processes to reduce waste production.Is this acceptable? Explain.4. Are you for or against shifting to a service-flow economyin the country <strong>and</strong> community where you live? Explain.Do you believe it will be possible to shift to such an economyover the next two to three decades? Explain.5. In 2003, Changing World Technologies built a pilotplant to test a process it has developed that can convert amixture of computers, old tires, turkey bones <strong>and</strong> feathers,<strong>and</strong> other wastes into oil by mimicking <strong>and</strong> speedingup the way that nature converts biomass into oil. If thisrecycling process turns out to be technologically <strong>and</strong> economicallyfeasible, explain why it could increase wasteproduction.http://biology.brookscole.com/miller14561
6. Would you oppose having a hazardous waste l<strong>and</strong>fill,waste treatment plant, deep-injection well, or incineratorin your community? Explain. If you oppose these disposalfacilities, how do you believe the hazardous wastegenerated in your community <strong>and</strong> your state should bemanaged?7. Give your reasons for agreeing or disagreeing witheach of the following proposals for dealing with hazardouswaste:a. Reduce the production of hazardous waste <strong>and</strong> encouragerecycling <strong>and</strong> reuse of hazardous materialsby charging producers a tax or fee for each unit ofwaste generated.b. Ban all l<strong>and</strong> disposal <strong>and</strong> incineration of hazardouswaste to encourage recycling, reuse, <strong>and</strong> wastetreatment <strong>and</strong> to protect air, water, <strong>and</strong> soil fromcontamination.c. Provide low-interest loans, tax breaks, <strong>and</strong> other financialincentives to encourage industries producinghazardous waste to reduce, recycle, reuse, treat,<strong>and</strong> decompose such waste.8. Congratulations! You are in charge of the world. Listthe three most important components of your strategyfor dealing with (a) solid waste <strong>and</strong> (b) hazardous waste.PROJECTS1. Collect all of the trash (excluding food waste) that yougenerate in a typical week. Measure its total weight <strong>and</strong>volume. Sort it into major categories such as paper, plastic,metal, <strong>and</strong> glass. Then weigh each category <strong>and</strong> calculatethe percentage in each category. What percentageof this waste consists of materials that could be recycledor reused? What percentage of the items could you havedone without? Tally <strong>and</strong> compare the results for your entireclass.2. What percentage of the municipal solid waste in yourcommunity is (a) placed in a l<strong>and</strong>fill, (b) incinerated,(c) composted, <strong>and</strong> (d) recycled? What technology isused in local l<strong>and</strong>fills <strong>and</strong> incinerators? What leakage<strong>and</strong> pollution problems have local l<strong>and</strong>fills or incineratorshad? Does your community have a recycling program?Is it voluntary or m<strong>and</strong>atory? Does it have curbsidecollection? Drop-off centers? Buyback centers? Ahazardous waste collection system? Devise a plan for improvingthe MSW system in your community <strong>and</strong> submitit to local officials.3. Make a survey of the hazardous materials (Figure24-16, p. 549) found in your house or apartment,or in your family home if you live in a dorm. Which ofthese materials are actually used? Call city officials tofind out how you can dispose of hazardous chemicalsyou do not need.4. What hazardous wastes are produced at your school?What happens to these wastes?5. Go to the EPA Superfund website at www.epa.gov/superfund/sites/npl/npl.htm. Click on your state tofind out how many hazardous sites it has on the NationalPriority List. Find any sites close to where you live or goto school. Click on each site near you to learn about itshistory, what types of pollutants it contains, the sourcesof these pollutants, how it is being cleaned up, <strong>and</strong>progress toward this goal.6. If possible, visit a local recycling center or materialsrecoveryfacility to find out how it works, where thematerials separated out for recycling go, how the pricesof these separated materials have fluctuated in the last3 years, <strong>and</strong> the major problems faced by the facility.7. Go to a large office supply store <strong>and</strong> compare pricesfor comparable grades of copy paper made from virginpaper with those containing some recycled content.Make the same price comparison at a stationery store.8. Use the library or the Internet to find bibliographic informationabout Arthur C. Clarke <strong>and</strong> Anne Platt McGinn,whose quotes appear at the beginning <strong>and</strong> end of thischapter.9. Make a concept map of this chapter’s major ideas, usingthe section heads, subheads, <strong>and</strong> key terms (in boldface).Look on the website for this book for informationabout making concept maps.LEARNING ONLINEThe website for this book contains study aids <strong>and</strong> manyideas for further reading <strong>and</strong> research. They include achapter summary, review questions for the entire chapter,flash cards for key terms <strong>and</strong> concepts, a multiple-choicepractice quiz, interesting Internet sites, references, <strong>and</strong> aguide for accessing thous<strong>and</strong>s of InfoTrac ® College Editionarticles. Log on tohttp://biology.brookscole.com/miller14Then click on the Chapter-by-Chapter area, choose Chapter24, <strong>and</strong> select a learning resource.562 CHAPTER 24 Solid <strong>and</strong> Hazardous Waste
25 SustainableCitiesBiodiversityEnergyAirWaterCASE STUDYThe Ecocity Conceptin Curitiba, Brazil<strong>Environmental</strong> <strong>and</strong> urban designers envision the developmentof more sustainable cities, called ecocities orgreen cities. The ecocity is not a futuristic dream. One ofthe world’s most livable <strong>and</strong> sustainable major cities isCuritiba, Brazil, with more than 2.5 million people.This city decided in 1969 to focus on mass transit.Curitiba probably has the world’s best bus system,which each day carries more than three-fourths of itspeople throughout the city along express lanes dedicatedto buses (Figure 25-1).Bike paths run throughout most of the city. Carsare banned from 49 blocks of the city’s downtown area,which has a network of pedestrian walkways connectedto bus stations, parks, <strong>and</strong> bike paths. BecauseCuritiba relies less on automobiles, it uses less energyper person <strong>and</strong>has less air pollution,greenhousegas emissions,<strong>and</strong> traffic congestionthan mostcomparable cities.CitycenterTo reduce flood damage <strong>and</strong> add green space, thecity transformed flood-prone areas along its rivers intoa series of interconnected parks that are crisscrossed bybike paths. Volunteers have planted more than 1.5 milliontrees throughout the city. No tree in the city can becut down without a permit, <strong>and</strong> two trees must beplanted for each one cut.The city recycles roughly 70% of its paper <strong>and</strong> 60%of its metal, glass, <strong>and</strong> plastic, which is sorted by householdsfor collection three times a week. Recovered materialsare sold mostly to the city’s more than 500 majorindustries that must meet strict pollution st<strong>and</strong>ards.Most industries are in an industrial park outside thecity limits.Amajor bus line runs to the park, but manyof the workers live nearby <strong>and</strong> can walk or bike to work.The city uses old buses as roving classrooms togive the poor basic skills needed for jobs. Other retiredbuses have become health clinics, soup kitchens, <strong>and</strong>some of the city’s 200 day-care centers, which are open11 hours a day <strong>and</strong> are free for low-income parents.The poor receive free medical, dental, <strong>and</strong> childcare,<strong>and</strong> 40 feeding centers are available for street children.The city has a build-it-yourself system that giveseach poor family a plot of l<strong>and</strong>, building materials, twotrees, <strong>and</strong> an hour’s consultation with an architect.In Curitiba, virtually all households have electricity,drinking water, <strong>and</strong> trash collection. About 95% ofits citizens can read <strong>and</strong> write <strong>and</strong> 83% of the adultshave at least a high school education. All schoolchildrenstudy ecology. Polls show that 99% of the city’sinhabitants would not want to live anywhere else.This ecocity design is the brainchild of architect<strong>and</strong> former college teacher Jaime Lerner, who hasserved as the city’s mayor three times since 1969. Underhis leadership, the municipal government dedicated itselfto two goals. First, find simple, innovative, fast,cheap, <strong>and</strong> fun solutions to problems. Second, establisha government that is honest, accountable, <strong>and</strong> open topublic scrutiny.An exciting challenge during this century will beto reshape existing cities <strong>and</strong> design new ones likeCuritiba that are more livable <strong>and</strong> sustainable <strong>and</strong> thathave a lower environmental impact.RouteExpressInterdistrictDirectFeederWorkersFigure 25-1 Solutions: bus system in Curitiba, Brazil. Thissystem moves large numbers of passengers around rapidlybecause each of the five major spokes has two express lanesused only by buses. Double- <strong>and</strong> triple-length bus sections arehooked together as needed, <strong>and</strong> boarding is speeded up bythe use of extra-wide doors <strong>and</strong> raised tubes that allow passengersto pay before getting on the bus (top left).
The city is not an ecological monstrosity. It is rather the placewhere both the problems <strong>and</strong> the opportunities of moderntechnological civilization are most potent <strong>and</strong> visible.PETER SELFThis chapter addresses the following questions:■■■■■How is the world’s population distributed betweenrural <strong>and</strong> urban areas, <strong>and</strong> what factors determinehow urban areas develop?What are the major resource <strong>and</strong> environmentalproblems of urban areas?How do transportation systems shape urbanareas <strong>and</strong> growth, <strong>and</strong> what are the advantages<strong>and</strong> disadvantages of various forms oftransportation?What methods are used for planning <strong>and</strong> controllingurban growth?How can cities be made more sustainable <strong>and</strong> moredesirable places to live?25-1 URBANIZATION AND URBANGROWTHWhat <strong>Causes</strong> Urban Growth? Magnetsfor Business <strong>and</strong> Hope for the PoorMany people move to cities because “push” factorsforce them out of rural areas <strong>and</strong> “pull” factors givethem the hope of finding jobs <strong>and</strong> a better lifein the city.At the beginning of the industrial revolution about275 years ago most people lived in rural areas <strong>and</strong>small villages <strong>and</strong> towns. Today almost half of theworld’s people live in densely populated urban areas,as rural people have migrated to cities with the hopeof finding jobs <strong>and</strong> a better life.Urban areas grow in two ways—by natural increase(more births than deaths) <strong>and</strong> by immigration,mostly from rural areas. This urban immigration isinfluenced by push factors such as poverty, lack of l<strong>and</strong>to grow food, declining agricultural jobs, famine, <strong>and</strong>war that force people out of rural areas. Rural peopleare also pulled to urban areas in search of jobs, food,housing, a better life, entertainment, <strong>and</strong> freedomfrom religious, racial, <strong>and</strong> political conflicts.People are also pushed <strong>and</strong> pulled to cities bygovernment policies that favor urban over rural areas.For example, developing countries spend most of theirbudgets on economic development <strong>and</strong> job creation inurban areas, especially in capital cities where theirleaders live. Some governments establish lower foodprices in urban areas, which pleases city dwellers,helps keep leaders in power, <strong>and</strong> attracts the ruralpoor.What Are the Worldwide Patternsof Urbanization <strong>and</strong> Urban Growth?More People <strong>and</strong> More PovertyUrban populations are growing rapidly throughoutthe world, <strong>and</strong> many cities in developing countrieshave become centers of poverty.A country’s degree of urbanization is the percentageof its population living in an urban area. Urbangrowth is the rate of increase of urban populations.Five major trends are important in underst<strong>and</strong>ingthe problems <strong>and</strong> challenges of urbanization <strong>and</strong> urbangrowth. First, the proportion of the global populationliving in urban areas is increasing. Between 1850 <strong>and</strong>2004, the percentage of people living in urban areas increasedfrom 2% to 48% (Figure 25-2). According toUN projections, by 2007 half of the world’s people willlive in urban areas <strong>and</strong> by 2030 about 60% will. Between2004 <strong>and</strong> 2030 the world’s urban population isprojected to increase from 3.1 billion to 5 billion. Almostall of this growth will occur in already overcrowdedcities in developing countries such as India,Brazil, China, <strong>and</strong> Mexico (Figure 25-2).Second, the number of large cities is mushrooming. In2004 more than 400 cities had a million or more people,<strong>and</strong> this is projected to increase to 564 by 2015. Todaythere are 18 megacities or meagalopolises (up from 8 in1985) with 10 million or more people—most of them indeveloping countries (Figure 25-2).A third trend is that urbanization <strong>and</strong> urban populationsare increasing rapidly in developing countries (Figure25-3). Between 2004 <strong>and</strong> 2030, the degree of urbanizationin developing countries is expected to increasefrom 41% to 56%. In Latin American <strong>and</strong> Caribbe<strong>and</strong>eveloping countries, 75% of the people are urb<strong>and</strong>wellers compared to only 35% in Africa <strong>and</strong> 39%in Asia.Fourth, urban growth is much slower in already heavilyurbanized developed countries (with 76% urbanization)than in developing countries. North America’s urbanizationis 79%, the highest in the world. By 2030 urbanizationin developed countries is projected to increaseto 84%.Fifth, poverty is becoming increasingly urbanized asmore poor people migrate from rural to urban areas, mostlyin developing countries. The United Nations estimatesthat at least 1 billion poor people live in the urban areasof developing countries. If you visit poor areas ofsuch a city your senses may be overwhelmed with achaotic but vibrant crush of people, vehicles of allsorts, street vendors, traffic jams, noise, smells, smokefrom wood <strong>and</strong> coal fires, <strong>and</strong> people sleeping onstreets or living in crowed, unsanitary, <strong>and</strong> rickety <strong>and</strong>unsafe slums <strong>and</strong> shantytowns.564 CHAPTER 25 Sustainable Cities
Karachi10.4 million16.2 millionDhaka13.2 million22.8 million Beijing10.8 million11.7 millionLos Angeles13.3 million14.5 millionMexico City18.3 million20.4 millionSao Paulo18.3 million21.2 millionNew York16.8 million17.9 millionLagos12.2 million24.4 millionCairo10.5 million11.5 millionMumbai(Bombay)16.5 million22.6 millionDelhi13.0 million20.9 millionCalcutta13.3 million16.7 millionJakarta11.4 million17.3 millionTokyo26.5 million27.2 millionOsaka11.0 million11.0 millionManila10.1 million11.5 millionShanghai12.8 million13.6 millionKey2001 (estimated)2015 (projected)Buenos Aires12.1 million13.2 millionFigure 25-2 Major urban areas throughout the world based on satellite images of the earth at night that showcity lights. Currently, the 48% of the world’s people living in urban areas occupy about 2% of the earth’s l<strong>and</strong>area. Note that most of the world’s urban areas are found along the coasts, <strong>and</strong> most of Africa <strong>and</strong> much of theinterior of South America, Asia, <strong>and</strong> Australia are dark at night. This figure also shows the populations of theworld’s 18 megacities with 10 or more million people in 2001 <strong>and</strong> their projected populations in 2015. Note thatall but four are located in developing countries. Use this figure to list in order the world’s five most populouscities in 2001 <strong>and</strong> the five most populous ones projected for 2015. (National Geophysical Data Center/NationalOceanic <strong>and</strong> Atmospheric Administration <strong>and</strong> United Nations)Population (billions)4.53.01.501950 1970 1990 2010 2030YearDevelopingCountriesDeveloped CountriesProjectionsFigure 25-3 Urban population in developed <strong>and</strong> developingcountries, 1950–2003, with projections to 2030. (Data fromUnited Nations Population Division)How Urbanized Is the United States?City-Dwellers DominateAlmost eight of every ten Americans live in urban areas,about half of them in sprawling suburbs.Between 1800 <strong>and</strong> 2004, the percentage of the U.S.population living in urban areas increased from 5% to79%. The population has shifted in four phases. First,people migrated from rural areas to large central cities. Currently,three-fourths of Americans live in 271 metropolitanareas (cities with at least 50,000 people), <strong>and</strong> nearlyhalf live in consolidated metropolitan areas containing1 million or more residents (Figure 25-4, p. 566).Second, many people migrated from large centralcities to suburbs <strong>and</strong> smaller cities. Currently, about 51%live in the suburbs <strong>and</strong> 30% in central cities.Third, many people migrated from the North <strong>and</strong>East to the South <strong>and</strong> West. Since 1980, about 80% of theU.S. population increase has occurred in the South <strong>and</strong>West, particularly near the coasts. California in theWest, with 34.5 million people, is the most populousstate, followed by Texas in the Southwest with 21.3million. This shift is expected to continue.Fourth, some people have migrated from urban areasback to rural areas since the 1970s, <strong>and</strong> especially since1990.How Has the Quality of Urban Lifein the United States Changed? Progress<strong>and</strong> ChallengesThe quality of urban life improved significantly formost Americans during the last century, but there isstill a long way to go.Since 1920, many of the worst urban environmentalproblems in the United States have been reduced significantly.Most people have better working <strong>and</strong> housingconditions, <strong>and</strong> air <strong>and</strong> water quality have improved(Figure 10-11, p. 181). Better sanitation, publicwater supplies, <strong>and</strong> medical care have slashed deathrates <strong>and</strong> the prevalence of sickness from malnutrition<strong>and</strong> infectious diseases. And concentrating most of thehttp://biology.brookscole.com/miller14565
SeattleLosAngelesPortl<strong>and</strong>BoiseSan FranciscoFresno Las VegasSan DiegoSalt LakeCityProvoPhoenixTucsonDenverLaredoMinneapolisAustinKansasCityTulsaDallasHoustonMcAllenChicagoSt. LouisCincinnatiNashvilleCharlotteMemphisAtlantaNaplesRaleighWilmingtonMyrtle BeachOrl<strong>and</strong>oBostonNew YorkWashington, D.C.Figure 25-4 Major urban areas in the United States based onsatellite images of the earth at night that show city lights (top).About 8 out of 10 Americans live in urban areas that occupy about1.7% of the l<strong>and</strong> area of the lower 48 states. Areas with names inwhite are the fastest-growing metropolitan areas. Nearly half (48%)of Americans live in consolidated metropolitan areas with 1 millionor more people, which are projected to merge into megalopolises(bottom <strong>and</strong> Figure 25-7, p. 568). (Data from National GeophysicalData Center/National Oceanic <strong>and</strong> Atmospheric Administration,U.S. Census Bureau)population in urban areas has helped protect the country’sbiodiversity by reducing the destruction <strong>and</strong>degradation of wildlife habitat.However, a number of U.S. cities, especially olderones, have deteriorating services <strong>and</strong> aging infrastructures(streets, schools, bridges, housing, <strong>and</strong> sewers).Many also face budget crunches from rising costs assome businesses <strong>and</strong> people move to the suburbs orrural areas <strong>and</strong> reduce revenues from property taxes.And there is rising poverty in the centers of many oldercities, where unemployment typically is 50% or higher.What Is Urban Sprawl <strong>and</strong> What Are ItsEffects? Paving Paradise <strong>and</strong> Drivingto Get AnywhereWhen there is ample <strong>and</strong> affordable l<strong>and</strong>, urban areastend to sprawl outward, swallowing up surroundingcountryside.Another major problem in the United States <strong>and</strong> othercountries with lots of room for expansion is urbansprawl. Growth of low-density development on theedges of cities <strong>and</strong> towns gobbles up surroundingcountryside—frequently prime farml<strong>and</strong> or forests—<strong>and</strong> increases dependence on cars (Figure 25-5). Theresult is a far-flung hodgepodge of housing developments,shopping malls, parking lots, <strong>and</strong> office complexes—looselyconnected by multilane highways.Before sprawl, people in cities <strong>and</strong> small townslived, shopped, <strong>and</strong> worked close to their homes <strong>and</strong>could meet most of their daily needs by walking.Every few blocks had a small grocery store, a pharmacy,professional offices, <strong>and</strong> other stores. Often shopowners lived above their stores or rented out suchspaces. Most people could walk, bike, or take masstransit to neighborhood schools <strong>and</strong> parks without theneed for a car.Starting in 1945, most U.S. cities began spreadingout <strong>and</strong> more people followed what was advertised asthe “American Dream,” living in their own house ontheir own piece of l<strong>and</strong> away from the central city.Six major factors promoted urban sprawl in theUnited States. First, ample l<strong>and</strong> was available for mostcities to spread outward. Second, federal governmentloan guarantees for new single-family homes for WorldWarIIveterans stimulated the development of suburbs.Third, low-cost gasoline <strong>and</strong> the federal <strong>and</strong> statefunding of highways encouraged automobile use <strong>and</strong>566 CHAPTER 25 Sustainable Cities
Image provided courtesy of theU.S. Geological Survey1952 19671972 1995Figure 25-5 Urban sprawl in <strong>and</strong> around Las Vegas, Nevada,1952–1995—a process that has continued. Between 1970 <strong>and</strong> 2004,the population of water-short Clark County which includes Las Vegasmore than quadrupled from 463,000 to 2 million. The growth is expectedto continue but may be limited by lack of water (Spotlight,p. 326).the development of once-inaccessible outlying tracts ofl<strong>and</strong> that were affordable for many Americans.Fourth, tax laws encouraged home ownership byallowing deduction of interest on home loans from incometaxes. Fifth, most state <strong>and</strong> local zoning lawsrequired large residential lots <strong>and</strong> separation of residential<strong>and</strong> commercial use of l<strong>and</strong> in new communities.Sixth, most urban areas consist of numerous politicaljurisdictions, which rarely work together to developan overall plan for managing <strong>and</strong> controllingurban growth <strong>and</strong> sprawl. In a nutshell, urban sprawl isthe product of affordable l<strong>and</strong>, automobiles, cheap gasoline,<strong>and</strong> poor urban planning.Figure 25-6 shows some of the undesirable consequencesof urban sprawl. Look carefully at this figure.Urban sprawl has increased travel time in automobiles,decreased energy efficiency, increased urbanflooding problems, <strong>and</strong> destroyed prime cropl<strong>and</strong>,forests, open space, <strong>and</strong> wetl<strong>and</strong>s. It has also led to theeconomic decline of many central cities.To pay for heavily mortgaged houses <strong>and</strong> cars,adults in a typical suburban family have to spendMALLL<strong>and</strong> <strong>and</strong> BiodiversityLoss of cropl<strong>and</strong>Loss of forests <strong>and</strong> grassl<strong>and</strong>sLoss of wetl<strong>and</strong>sLoss <strong>and</strong> fragmentation ofwildlife habitatsIncreased wildlife roadkillIncreased soil erosionHuman Health<strong>and</strong> AestheticsContaminated drinking water<strong>and</strong> airWeight gainNoise pollutionSky illumination at nightTraffic congestionWaterIncreased runoffIncreased surface water <strong>and</strong>groundwater pollutionIncreased use of surface water<strong>and</strong> groundwaterDecreased storage of surfacewater <strong>and</strong> groundwaterIncreased floodingDecreased natural sewagetreatmentYour ShopEnergy, Air, <strong>and</strong> ClimateIncreased energy use<strong>and</strong> wasteIncreased air pollutionIncreased greenhouse gasemissionsEnhanced global warmingWarmer microclimate(heat isl<strong>and</strong> effect)Economic EffectsHigher taxesDecline of downtownbusiness districtsIncreased unemploymentin central cityLoss of tax base in central cityFigure 25-6 Someundesirable impactsof urban sprawl or cardependentdevelopment.Do you live inan area suffering fromurban sprawl?http://biology.brookscole.com/miller14567
NewarkAllentownHarrisburgBaltimoreWashingtonBowash (Boston toWashington)PhiladelphiaSpringfieldHartfordNew YorkDetroitChicagoToledo AkronChipitts (Chicago to Pittsburgh)BostonProvidenceClevel<strong>and</strong>PittsburghFigure 25-7 Two megalopolises: Bowash, consisting of urbansprawl <strong>and</strong> coalescence between Boston <strong>and</strong> Washington,D.C., <strong>and</strong> Chipitts, extending from Chicago to Pittsburgh.For more than 6,000 years, cities have been centersof economic development, education, jobs, technologicaldevelopments, culture, social change, <strong>and</strong>political power. The high density of urban populationsprovides governments <strong>and</strong> businesses with significantcost advantages in delivering goods <strong>and</strong> services.Urban residents in many parts of the world livelonger than rural residents, <strong>and</strong> urban populationstend to have lower infant mortality <strong>and</strong> fertility rates.In addition, urban dwellers generally have better accessto medical care, family planning, education, <strong>and</strong>social services than people in rural areas.Urban areas also have some environmental advantages.For example, recycling is more economicallyfeasible because of the large concentrations of recyclablematerials, <strong>and</strong> per capita expenditures onenvironmental protection are higher in urban areas.Also, concentrating people in urban areas helps preservebiodiversity by reducing the stress on wildlifehabitats.many of their non-working hours driving to <strong>and</strong> fromwork, or running err<strong>and</strong>s over a vast suburban l<strong>and</strong>scape.This leaves many of them with little energy <strong>and</strong>time for their children <strong>and</strong> themselves, or getting toknow their neighbors.In 2003, Reid Ewing <strong>and</strong> other researchers discovereda connection between sprawling suburbs <strong>and</strong>spreading waistlines. They found that people living insuburbs, where it is hard to get anywhere on foot or bybicycle, are heavier than those in central cities <strong>and</strong> inpedestrian-friendly towns.As they grow <strong>and</strong> sprawl outward, separate urbanareas may merge to form a megalopolis. For example,the remaining open space between Boston, Massachusetts,<strong>and</strong> Washington, D.C., is rapidly urbanizing <strong>and</strong>coalescing. The result is an almost continuous 800-kilometer-long (500-mile-long) urban area that issometimes called Bowash (Figure 25-7 <strong>and</strong> Figure 25-4,bottom).Megalopolises developing all over the world includethe area between Amsterdam <strong>and</strong> Paris inEurope, Japan’s Tokyo–Yokohama–Osaka–Kobe corridorknown as Tokohama, <strong>and</strong> the Brazilian industrialtriangle made up of São Paulo, Rio de Janeiro, <strong>and</strong>Belo Horizonte.25-2 URBAN RESOURCE ANDENVIRONMENTAL PROBLEMSCase Study: What Are the Advantages ofUrbanization? Concentrating People HelpsUrban areas can offer more job opportunities <strong>and</strong>better education <strong>and</strong> health, <strong>and</strong> can help protectbiodiversity by concentrating people.Case Study: What Are the Disadvantagesof Urbanization? Concentrating PeopleHas Some Harmful EffectsCities are rarely self-sustaining, <strong>and</strong> theythreaten biodiversity, lack trees, grow littleof their food, concentrate pollutants <strong>and</strong> noise,spread infectious diseases, <strong>and</strong> are centersof poverty, crime, <strong>and</strong> terrorism.Although urban dwellers occupy only about 2% of theearth’s l<strong>and</strong> area, they consume about three-fourths ofall resources. Because of this <strong>and</strong> their high waste output(Figure 25-8), most of the world’s cities are notself-sustaining systems.Large areas of l<strong>and</strong> must be disturbed <strong>and</strong> degradedto provide urban dwellers with food, water,energy, minerals, <strong>and</strong> other resources. This decreasesthe earth’s biodiversity. Also, as cities exp<strong>and</strong> they destroyrural cropl<strong>and</strong>, fertile soil, forests, wetl<strong>and</strong>s, <strong>and</strong>wildlife habitats. At the same time, they provide littleof the food they use. From an environmental st<strong>and</strong>point,urban areas are somewhat like gigantic vacuumcleaners, sucking up much of the world’s matter, energy,<strong>and</strong> living resources <strong>and</strong> spewing out pollution,wastes, <strong>and</strong> heat. Thus, urban areas have large ecologicalfootprints (Figure 1-7, p. 10) that extend far beyondtheir boundaries. If you live in a city, calculate its ecologicalfootprint by going to the website www.redefiningprogress.org/.Also see the Guest Essay on thistopic by Michael Cain on this chapter’s website.In urban areas most trees, shrubs, <strong>and</strong> other plantsare destroyed to make way for buildings, roads, <strong>and</strong>parking lots. Most cities thus largely lose the benefitsprovided by vegetation that would help absorb airpollutants, give off oxygen, help cool the air throughtranspiration, provide shade, reduce soil erosion, muf-568 CHAPTER 25 Sustainable Cities
InputsOutputsEnergyFoodWaterRawmaterialsManufacturedgoodsMoneyInformationSolid wastesWaste heatAir pollutantsWater pollutantsGreenhouse gasesManufactured goodsNoiseWealthIdeasFigure 25-8 Natural capital degradation: Urban areas rarely are sustainable systems. The typical citydepends on large nonurban areas of l<strong>and</strong> <strong>and</strong> water for huge inputs of matter <strong>and</strong> energy resources <strong>and</strong> forlarge outputs of waste matter <strong>and</strong> heat. For example, according to an analysis by Mathis Wackernagel <strong>and</strong>William Rees, an area 58 times as large as that of London is needed to supply its residents with resources.They estimate that meeting the needs of all the world’s people at the same rate of resource use as that ofLondon would take at least three more earths.fle noise, provide wildlife habitats, <strong>and</strong> give aestheticpleasure. As one observer remarked, “Most cities areplaces where they cut down all or most of the trees <strong>and</strong>then name the streets after them.”As cities grow <strong>and</strong> water dem<strong>and</strong>s increase, expensivereservoirs <strong>and</strong> canals must be built <strong>and</strong> deeperwells drilled. This can deprive rural <strong>and</strong> wild areas ofsurface water <strong>and</strong> deplete groundwater faster than it isreplenished.Flooding also tends to be greater in cities, in somecases because they are built on floodplains or in lowlyingcoastal areas subject to natural flooding. Anotherreason is that covering l<strong>and</strong> with buildings, asphalt,<strong>and</strong> concrete causes precipitation to run off quickly<strong>and</strong> overload storm drains. In addition, urban developmentoften destroys or degrades wetl<strong>and</strong>s that actas natural sponges to help absorb excess water.Another threat is that many of the world’s largestcities are in coastal areas (Figure 25-2) that could beflooded sometime in this century if sea levels rise dueto projected global warming.Because of their high population <strong>and</strong> resource consumption,urban dwellers produce most of the world’sair pollution, water pollution, <strong>and</strong> solid <strong>and</strong> hazardouswastes. Also, pollutant levels are generally higher inurban areas because they are produced in a smallerarea <strong>and</strong> cannot be as readily dispersed <strong>and</strong> diluted asare those produced in most rural areas.Most urban dwellers are subjected to noise pollution:any unwanted, disturbing, or harmful sound thatimpairs or interferes with hearing, causes stress, hampersconcentration <strong>and</strong> work efficiency, or causes accidents.Noise levels (Figure 25-9, p. 570) above 65 dBAare considered unacceptable, <strong>and</strong> prolonged exposureto levels above 85 dBA can cause permanent hearingdamage.In addition, high population densities in urban areascan increase the spread of infectious diseases, especiallyif adequate drinking water <strong>and</strong> sewage systemsare not available.Cities generally are warmer, rainier, foggier, <strong>and</strong>cloudier than suburbs <strong>and</strong> nearby rural areas mostlybecause of their buildings, pavement, <strong>and</strong> lack ofgreen space. The enormous amounts of heat generatedby cars, factories, furnaces, lights, air conditioners, <strong>and</strong>heat-absorbing dark roofs <strong>and</strong> roads in cities create anurban heat isl<strong>and</strong> surrounded by cooler suburban <strong>and</strong>rural areas.Higher CO 2 <strong>and</strong> soot concentrations from fossilfuel–burning, cars, factories, <strong>and</strong> buildings intensifythis heat-isl<strong>and</strong> effect. The higher CO 2 levels can increaseplant growth, expecially opportunistic speciessuch as ragweed, that can worsen asthma. Also, tinysoot <strong>and</strong> other particles help deliver pollen, mold, <strong>and</strong>other allergens deep into the lungs. This may helpexplain why childhood asthma rates have climbedhttp://biology.brookscole.com/miller14569
Noise Levels (in dbA)Permanent damagebegins after 8-hourexposure0 10 20 30 40 50 60 70 80 90 100 110 120 130 140 15085NormalQuietbreathing rural areaWhisperQuietroomRainfallNormalconversationVacuumcleanerAveragefactoryLawnmowerRock music Earphonesat loud levelBoomcarsChainsawThunderclap(nearby)Air raidsirenMilitaryrifleFigure 25-9 Noise levels (in decibel-A [dBA] sound pressure units) of some common sounds. Sound pressurebecomes damaging at about 75 dBA <strong>and</strong> painful at around 120 dBA. At 180 dBA it can kill. Because the dB<strong>and</strong> dBA scales are logarithmic, sound pressure is multiplied 10-fold with each 10-decibel rise. Thus a risefrom 30 dBA (quiet rural area) to 60 dBA (normal restaurant conversation) represents a 1,000-fold increase insound pressure on the ear. You are being exposed to a sound level high enough to cause permanent hearingdamage if you need to raise your voice to be heard above the racket, if a noise causes your ears to ring, or ifnearby speech seems muffled. Ways to control noise include modifying noisy activities <strong>and</strong> devices, shieldingnoisy devices or processes, shielding workers from noise, moving noisy operations or machinery away frompeople, <strong>and</strong> using anti-noise (a new technology that cancels out one noise with another).steadily in recent years in many U.S. <strong>and</strong> Canadian urbanareas. As cities grow <strong>and</strong> merge, their heat isl<strong>and</strong>salso merge <strong>and</strong> can keep polluted air from being diluted<strong>and</strong> cleansed.There are also problems with the artificial lightcreated by urban areas (Figures 25-2 <strong>and</strong> 25-4). Lightingup the sky prevents people from seeing the gloriesof a starry night <strong>and</strong> hinders astronomers from conductingtheir research. There is also growing evidencethat artificial light is affecting plants <strong>and</strong> animals in avariety of ecosystems. Species affected by such lightpollution include turtles who lay their eggs on beachesat night <strong>and</strong> migrating birds that are lured off courseby lights on high-rise office buildings <strong>and</strong> fatally collidewith such structures. Chicago, Illinois, leads U.S.efforts to have major city-center buildings turn offtheir lights between 11 P.M. <strong>and</strong> dawn, <strong>and</strong> Toronto,Canada, has had a similar lights-out program since1996.Wesley College professor Marianne Moore <strong>and</strong>her colleagues have found evidence that artificial illuminationcan alter aquatic ecosystems <strong>and</strong> could ultimatelydecrease water quality. Minute zooplanktonavoid predators by remaining well below the surfaceduring the day <strong>and</strong> then rising to graze on algae atnight. But artificial light from urban glows can discouragetheir nightly surface feeding. If their grazingis inhibited, algae populations could explode <strong>and</strong>these blooms would deplete dissolved oxygen neededby fish <strong>and</strong> decrease water quality.Urban areas can intensify poverty <strong>and</strong> socialproblems. Crime rates also tend be higher in urban areasthan in rural areas (Connections, p. 572). And urbanareas are more likely <strong>and</strong> desirable targets for terroristacts.Case Study: How Do the Urban Poor inDeveloping Countries Live—Living on theEdge with Ingenuity <strong>and</strong> HopeMost of the urban poor in developing countrieslive in crowded, unhealthy, <strong>and</strong> dangerousconditions, but many are better off than therural poor.Many of the world’s poor live in crowded central cityslums—multifamily tenements <strong>and</strong> rooming houseswhere three to six people live in a single room. Most ofthese dwellings have inadequate sanitation <strong>and</strong> ventilation<strong>and</strong> many are in unsafe structures. Others live insquatter settlements <strong>and</strong> shantytowns on the outskirts ofmost cities in developing countries, some perched precariouslyon steep hillsides subject to l<strong>and</strong>slides. Inthese illegal settlements, people take over unoccupiedl<strong>and</strong> <strong>and</strong> build shacks from corrugated metal, plasticsheets, scrap wood, <strong>and</strong> other scavenged building materials.Still others live or sleep on the streets, havingnowhere else to go.Squatters living near the edge of survival in theseareas usually lack clean water, sewers, electricity, <strong>and</strong>roads, <strong>and</strong> often are subject to severe air <strong>and</strong> waterpollution <strong>and</strong> hazardous wastes from nearby factories(Case Study, p. 549). <strong>Their</strong> locations may be especiallyprone to l<strong>and</strong>slides, flooding, earthquakes, or volcaniceruptions.Most cities cannot afford to provide squatters withbasic protections <strong>and</strong> services, <strong>and</strong> their officials fearthat doing so will attract even more of the rural poor.Many city governments regularly bulldoze squattershacks <strong>and</strong> send police to drive the illegal settlers out.The people later move back in or develop anothershantytown somewhere else.570 CHAPTER 25 Sustainable Cities
Despite joblessness, squalor, overcrowding, <strong>and</strong>environmental <strong>and</strong> health hazards, most squatters <strong>and</strong>slum residents are better off than the rural poor. Withbetter access to family planning programs, they tendto have fewer children <strong>and</strong> better access to schools.They work, raise families, educate their children, <strong>and</strong>often have to care for their parents. Some work togetherto establish water supplies, sewer, <strong>and</strong> healthcare facilities, <strong>and</strong> schools. Many squatter settlementsprovide a sense of community <strong>and</strong> a vital safety net ofneighbors, friends, <strong>and</strong> relatives.Mexico City is an example of an urban area in crisis.About 18.3 million people—roughly one of everysix Mexicans—live there (Figure 25-2). It is the world’ssecond most populous city, <strong>and</strong> each year, about210,000 new residents arrive.Mexico City suffers from severe air pollution, closeto 50% unemployment, deafening noise, overcrowding,traffic congestion, inadequate public transportation,<strong>and</strong> a soaring crime rate. More than one-third ofits residents live in slums called barrios or in squattersettlements without running water or electricity.At least 3 million people have no sewer facilities.This means huge amounts of human waste are depositedin gutters, vacant lots, <strong>and</strong> open sewers everyday, attracting armies of rats <strong>and</strong> swarms of flies. Whenthe winds pick up dried excrement, a fecal snow oftenfalls on parts of the city. Open garbage dumps also contributedust <strong>and</strong> bacteria to the atmosphere. This bacteria-ladenfallout leads to widespread salmonella <strong>and</strong>hepatitis infections, especially among children.Mexico City has one of the world’s worst photochemicalsmog problems because of a combination oftoo many cars <strong>and</strong> polluting industries, a sunny climate,<strong>and</strong> topographical bad luck. The city lies in ahigh-elevation bowl-shaped valley surrounded onthree sides by mountains—ideal conditions for thermalinversions that trap pollutants at ground level(Figure 20-7, top, p. 443). Since 1982, the amount ofcontamination in the city’s air has more than tripled,<strong>and</strong> breathing that air is said to be roughly equivalentto smoking three packs of cigarettes a day.The city’s air <strong>and</strong> water pollution cause an estimated100,000 premature deaths per year. Writer CarlosFuentes has nicknamed this megacity “MakesickoCity.”Water dem<strong>and</strong>s are pushing the city’s aquifer beyondits limits. Energy costs to extract water havesoared as wells have become much deeper. Withdrawalfrom aquifers caused parts of the city to subsideby 9 meters (30 feet) during the twentieth century.Some areas now subside as much as 30 centimeters(1 foot) a year.The city government has banned cars from a 50-block central zone, required catalytic converters on allcars made after 1991, phased out use of leaded gasoline,<strong>and</strong> replaced old buses, taxis, <strong>and</strong> delivery vehicleswith cleaner vehicles running mostly on liquefiedpetroleum gas. The city also planted more than 25 milliontrees to help absorb pollutants <strong>and</strong> bought somel<strong>and</strong> for use as green space.Some progress has been made. The percentage ofdays each year in which air pollution st<strong>and</strong>ards are violatedhas fallen from 50% to 20%. But the city still hasan inadequate mass transportation system <strong>and</strong> weak,poorly enforced air pollution st<strong>and</strong>ards for industries<strong>and</strong> motor vehicles. If you were in charge of MexicoCity, what are the three most important things youwould do?xHOW WOULD YOU VOTE? Should squatters around citiesof developing countries be given title to l<strong>and</strong> they live on?Cast your vote online at http://biology.brookscole.com/miller14.25-3 TRANSPORTATION AND URBANDEVELOPMENTHow Do L<strong>and</strong> Availability <strong>and</strong> TransportationSystems Affect Urban Development? Stackor SprawlL<strong>and</strong> availability determines whether a city growsvertically or spreads out horizontally <strong>and</strong> whetherit relies mostly on mass transportation or theautomobile.The two main types of ground transportation are individual(such as cars, motor scooters, bicycles, <strong>and</strong>walking) <strong>and</strong> mass (mostly buses <strong>and</strong> rail systems).About 90% of all travel in the world is by foot, bicycle,motor scooter, or bus—mostly because only about 10%of the world’s people can afford a car.L<strong>and</strong> availability is a key factor determining thetypes of transportation people use. If a city cannotspread outward, it must grow vertically—upward<strong>and</strong> downward (below ground)—so it occupies asmall l<strong>and</strong> area with a high population density. Mostpeople living in such compact cities like Hong Kong<strong>and</strong> Tokyo walk, ride bicycles, or use energy-efficientmass transit.A combination of cheap gasoline, plentiful l<strong>and</strong>,<strong>and</strong> a network of highways produces dispersed cities.They are found in countries such the United States,Canada, <strong>and</strong> Australia, where ample l<strong>and</strong> often isavailable for outward expansion. Sprawling cities dependon the automobile; motor vehicles are increasingin both compact <strong>and</strong> dispersed cities. Today there areabout 700 million cars, trucks, <strong>and</strong> buses in the world.By 2050, the number of motor vehicles is projected toincrease sevenfold to 3.5 billion—2.5 billion of them intoday’s developing countries.Is this sustainable? No one knows. Some analystsbelieve that phasing in motor vehicles with cleanburninghybrid <strong>and</strong> fuel cell engines would allow thehttp://biology.brookscole.com/miller14571
How Can Reducing CrimeHelp the Environment?Most people do not realize that reducingcrime can help improveenvironmental quality. CrimesCONNECTIONS such as robbery, assault, <strong>and</strong>shootings can have several harmfulenvironmental effects.It can drive people out of cities, which are ourmost energy-efficient living arrangements. Everybrick in an ab<strong>and</strong>oned urban building represents anenergy waste equivalent to burning a 100-watt lightbulb for 12 hours. Each new suburb means replacingfarml<strong>and</strong> or reservoirs of natural biodiversity suchas forests with dispersed, energy- <strong>and</strong> resourcewastingroads, houses, <strong>and</strong> shopping centers.Crime can make people less willing to walk, bicycle,<strong>and</strong> use energy-efficient public transit systems.It also forces many people to use more energyto deter burglars. For example, trees <strong>and</strong> bushesnear a house help save energy by reducing solarheat gain in the summer <strong>and</strong> providing windbreaksin the winter. But to help reduce break-ins manyhomeowners clear away trees <strong>and</strong> bushes near theirhouses, as well as installing yard lights <strong>and</strong> leavingindoor lights, TVs, <strong>and</strong> radios on to deter burglars.The threat of crime also causes overpackagingof many items to deter shoplifting or poisoning offood or drug items.Critical ThinkingCan you think of any environmental benefits ofcertain types of crimes?world’s motor vehicle fleet to double while emittingless air pollution than today’s fleet.Vehicle emissions are not the only problem. Producingmotor vehicles <strong>and</strong> building roads, parkinglots, <strong>and</strong> garages use huge amounts of energy <strong>and</strong>matter resources that produce pollution <strong>and</strong> environmentaldegradation. Also, motor vehicles take upspace <strong>and</strong> thus cause congestion as their numbersmultiply. More <strong>and</strong> more people could end up stuck intraffic jams in fuel-efficient <strong>and</strong> low-polluting cars goingnowhere.What Is the Role of Motor Vehiclesin the United States? Cars RulePassenger vehicles account for almost all U.S. urbantransportation <strong>and</strong> travel to work, <strong>and</strong> each yearAmericans drive as far as everyone else in the worldcombined.America showcases the advantages <strong>and</strong> disadvantagesof living in a society dominated by motor vehicles.With 4.6% of the world’s people, the United States hasalmost a third of the world’s motor vehicles. Abouttwo-thirds of the 225 million motor vehicles (excludingbig trucks <strong>and</strong> buses) in the United States are cars<strong>and</strong> the remainder are sport utility vehicles (SUVs),pickup trucks, <strong>and</strong> vans.Mostly because of urban sprawl <strong>and</strong> convenience,passenger vehicles are used for 98% of all urban transportation<strong>and</strong> 91% of travel to work in the UnitedStates. About three-fourths of all trips are less than 1.6kilometers (1 mile) from home. About 75% of Americansdrive alone to work, 5% commute on public transit,<strong>and</strong> 0.5% bicycle to work. Mostly because of urbansprawl <strong>and</strong> a network of highways, Americans driveabout 4 trillion kilometers (2.5 trillion miles) each year,about the same distance driven by all other drivers inthe world. Each year American vehicles consumeabout 43% of the world’s gasoline. According to theAmerican Public Transit System, if Americans doubledtheir use of mass transit from the current 5% to 10%, itwould reduce U.S. dependence on oil by 40%.Many governments in rapidly industrializingcountries such as China want to develop an automobile-centeredtransportation system. Suppose Chinasucceeds in having one or two cars in every garage<strong>and</strong> consumes oil at the U.S. rate. According to environmentalleader Lester R. Brown, China would thenneed slightly more oil each year than the world nowproduces <strong>and</strong> would have to pave an area equal to halfof the l<strong>and</strong> it now uses to produce food.What Are the Advantages <strong>and</strong> Disadvantagesof Motor Vehicles? A Troubled LoveAffairMotor vehicles provide personal benefits <strong>and</strong> helprun economies, but they also kill lots of people,pollute the air, promote urban sprawl, <strong>and</strong> lead totime- <strong>and</strong> gas-wasting traffic jams.Motor vehicles have a number of important benefits.On a personal level, they provide mobility <strong>and</strong> are aconvenient <strong>and</strong> comfortable way to get from one placeto another. They also are symbols of power, sex, socialstatus, <strong>and</strong> success for many people. For some theyalso provide escape from an increasingly hectic world.From an economic st<strong>and</strong>point, much of theworld’s economy is built on producing motor vehicles<strong>and</strong> supplying roads, services, <strong>and</strong> repairs for them. Inthe United States, for example, $1 of every $4 spent<strong>and</strong> one of every six nonfarm jobs is connected to theautomobile. And five of the seven largest U.S. industrialfirms produce motor vehicles or their fuel.Despite their important benefits, motor vehicleshave many harmful effects on people <strong>and</strong> the environment.They have killed almost 18 million people since1885, when Karl Benz built the first automobile.Throughout the world they kill an estimated 1.2 millionpeople each year—an average of 3,300 deaths per572 CHAPTER 25 Sustainable Cities
day—<strong>and</strong> injure another 15 million. Each year theyalso kill about 50 million wild animals <strong>and</strong> family pets.In the United States, motor vehicle accidents killmore than 40,000 people a year <strong>and</strong> injure another5 million, at least 300,000 of them severely. Car accidentshave killed more Americans than have all wars in thecountry’s history.Motor vehicles are the world’s largest source of airpollution. They emit six of the eight major air pollutants(Table 20-2, p. 438), which prematurely kill30,000–60,000 people per year in the United States,according to the <strong>Environmental</strong> Protection Agency.Motor vehicles are also the fastest-growing source ofcarbon dioxide emissions—now producing almostone-fourth of them. In addition, they account for twothirdsof the oil used in the United States <strong>and</strong> one-thirdof the world’s oil consumption.Motor vehicles have helped create urban sprawl.At least a third of urban l<strong>and</strong> worldwide <strong>and</strong> half inthe United States is devoted to roads, parking lots,gasoline stations, <strong>and</strong> other automobile-related uses.This prompted urban expert Lewis Mumford to suggestthat the U.S. national flower should be the concretecloverleaf.Another problem is congestion. If current trendscontinue, U.S. motorists will spend an average of2 years of their lives in traffic jams, wasting about$60 billion a year in gasoline <strong>and</strong> lost time.Building more roads may not be the answer. Manyanalysts agree with the idea, stated by economistRobert Samuelson, that “cars exp<strong>and</strong> to fill availableconcrete.”Motor vehicles have harmful economic costs,mostly because of deaths <strong>and</strong> injuries, higher insurancerates, pollution, work time wasted in trafficjams, <strong>and</strong> decreased property values near noisy, congestedroads. According to the International Center forTechnology Assessment, such costs amount to $1,970–5,990 per American each year. Because these costs arenot included in the prices of motor vehicles <strong>and</strong> gasoline,most people do not associate them with the motorvehicles they buy <strong>and</strong> use.How Can We Reduce Automobile Use?Use Honest AccountingWe can reduce automobile use by having userspay for its harmful effects but this is politicallyunpopular.<strong>Environmental</strong>ists <strong>and</strong> a number of economists suggestthat one way to reduce the harmful effects of automobileuse is to make drivers pay directly for most ofthe harmful costs of automobile use—a user-pays approachbased on honest environmental accounting.One option is to include the estimated harmful costs ofdriving as a tax on gasoline. Such taxes would amountto about $1.30–2.10 per liter ($5–8 per gallon) of gasolinein the United States <strong>and</strong> would spur the use ofmore energy-efficient motor vehicles.Proponents urge governments to use gasoline taxrevenues to help finance mass transit systems, bikepaths, <strong>and</strong> sidewalks. The government could reducetaxes on income <strong>and</strong> wages to offset the increased taxeson gasoline <strong>and</strong> thus make such a tax shift more politicallyacceptable.Another way to reduce automobile use <strong>and</strong> congestionis to raise parking fees <strong>and</strong> charge tolls onroads, tunnels, <strong>and</strong> bridges—especially during peaktraffic times. For example, densely populated Singaporeis rarely congested because it taxes cars heavily<strong>and</strong> auctions the rights to buy a car. Also, anyone drivingdowntown pays a daily user fee of $3–6 that risesduring rush hours. The government uses the revenuefrom taxes <strong>and</strong> fees to fund an excellent mass transitsystem. This approach is also being used in Oslo,Norway; Melbourne, Australia; <strong>and</strong> London, Engl<strong>and</strong>.In London, charging $8 for any vehicle entering thecentral city during the workday has cut traffic congestionby a fourth <strong>and</strong> increased use of mass transit.Scores of cities including Rome, Italy; Stockholm,Sweden; Copenhagen, Denmark; Prague, Czechoslovakia;Geneva, Switzerl<strong>and</strong>; <strong>and</strong> Curitiba, Brazil,(p. 563) have established car-free areas.More than 300 cities in Germany, Austria, Italy,Switzerl<strong>and</strong>, <strong>and</strong> the Netherl<strong>and</strong>s have a car-sharingnetwork. Each member pays for a card that openslockers containing keys to cars parked at designatedspots around a city. Members reserve a car in advanceor call the network <strong>and</strong> are directed to the closestlocker <strong>and</strong> car. They are billed monthly for the timethey use a car <strong>and</strong> the distance they travel. In Berlin,Germany, car sharing has cut car ownership by 75%<strong>and</strong> car commuting by nearly 90%.Another way to reduce car use <strong>and</strong> accidents <strong>and</strong>save gasoline is the electronic commute in which peopleuse computers <strong>and</strong> other telecommunication devicesto do all or much of their work at home. Shopping onlinealso reduces the need to travel to shopping malls<strong>and</strong> other stores, although this is offset partially by increaseddelivery truck trips.Is It Feasible to Reduce Automobile Use in theUnited States? Kicking Auto Addiction Is HardReducing car use in the United States is difficultbecause of political opposition from the public <strong>and</strong>powerful car-related industries, too little emphasis onestablishing modern, efficient mass transit options,<strong>and</strong> addiction to cars.Most analysts doubt that the approaches just discussedare feasible in the United States, for three reasons.First, it faces strong political opposition from twogroups, one being the public, largely unaware of thehuge hidden costs they are already paying. The otherhttp://biology.brookscole.com/miller14573
group is the politically powerful transportation-relatedindustries such as oil <strong>and</strong> tire companies, roadbuilders, carmakers, <strong>and</strong> many real estate developers.However, taxpayers might accept sharp increases ingasoline taxes if the extra costs were offset by decreasesin taxes on wages <strong>and</strong> income.Second, fast, efficient, reliable, <strong>and</strong> affordable masstransit options <strong>and</strong> bike paths are not widely availablein most of the United States. In addition, the dispersednature of most U.S. urban areas makes people dependenton cars.Third, most people who can afford cars are virtuallyaddicted to them, <strong>and</strong> many people in the U.S. <strong>and</strong>elsewhere who cannot afford a car hope to buy onesomeday.What Are Alternatives to the Car? Use YourMuscles <strong>and</strong> Travel with OthersAlternatives include walking, bicycling, drivingscooters, <strong>and</strong> taking subways, trolleys, trains, <strong>and</strong>buses.There are a number of alternatives to cars, each withadvantages <strong>and</strong> disadvantages. One widely used alternativeis the bicycle. Because of their advantages(Figure 25-10), bicycles outsell cars by more than twoto one.AdvantagesAffordableProduce nopollutionQuietRequire littleparking spaceEasy tomaneuver intrafficTake fewresources tomakeVery energyefficientProvide exerciseT rade-OffsBicyclesDisadvantagesLittle protectionin an accidentDo not protectriders frombad weatherNot practical fortrips longer than8 kilometers(5 miles)Can be tiring(except for electricbicycles)Lack of secure bikeparkingFigure 25-10 Trade-offs: advantages <strong>and</strong> disadvantages ofbicycles. Pick the single advantage <strong>and</strong> disadvantage that youthink are the most important.AdvantagesAffordableProduce less airpollution than carsRequire littleparking spaceEasy to maneuverin trafficElectric scootersare quiet <strong>and</strong>produce littlepollutionT rade-OffsMotor ScootersDisadvantagesLittle protection inan accidentDoes not protectdrivers from badweatherGasoline enginesare noisyGasoline enginesemit largequantities of airpollutantsFigure 25-11 Trade-offs: advantages <strong>and</strong> disadvantages ofmotor scooters. Pick the single advantage <strong>and</strong> disadvantagethat you think are the most important.Bicycles are widely used for urban trips in countriessuch as the Netherl<strong>and</strong>s, China, <strong>and</strong> Japan. Bicycling<strong>and</strong> walking account for about 28% of the trips inthe Netherl<strong>and</strong>s, compared to only 6% in the UnitedStates. In Copenhagen, Denmark, 2,300 bicycles areavailable for public use at no charge. The system is financedby ads attached to the bicycle frames <strong>and</strong>wheels, <strong>and</strong> is so popular that each bicycle is used onaverage once every 8 minutes.Only one of every 200 Americans bicycle to work.But one out of five say they would do so if safe bikelanes were available <strong>and</strong> if their employers providedsecure bike storage <strong>and</strong> showers at work.About 2 million electric bicycles are on the roadworldwide, <strong>and</strong> about 400,000 more are added eachyear. Existing bikes can easily be converted to electricbikes, <strong>and</strong> new ones can be bought for $500–1,200. Bicyclespowered by small fuel cells should be availablewithin a few years.Motor scooters have advantages <strong>and</strong> disadvantages(Figure 25-11) <strong>and</strong> are especially useful for people indeveloping countries who cannot afford a car. Electricscooters can reduce air pollution <strong>and</strong> noise.Heavy-rail systems (subways, elevated railways,<strong>and</strong> metro trains) <strong>and</strong> light-rail systems (streetcars,trolley cars, <strong>and</strong> tramways) have their advantages <strong>and</strong>disadvantages (Figure 25-12). To be cost effective, railsystems must travel along densely populated corridorsin urban areas. At one time the United States hadan effective light-rail system, but it was dismantled topromote car <strong>and</strong> bus use (Case Study, p. 576).The rail system in Hong Kong is one of theworld’s most successful for three reasons. First, the574 CHAPTER 25 Sustainable Cities
T rade-OffsMass Transit RailT rade-OffsBusesAdvantagesDisadvantagesAdvantagesDisadvantagesMore energyefficient than carsProduces less airpollution than carsRequires lessl<strong>and</strong> than roads<strong>and</strong> parking areasfor cars<strong>Causes</strong> fewerinjuries <strong>and</strong>deaths than carsReduces carcongestion in citiesExpensive to build<strong>and</strong> maintainCost effective onlyalong a denselypopulated narrowcorridorCommits riders totransportationschedulesCan cause noise<strong>and</strong> vibration fornearby residentsMore flexible thanrail systemCan be reroutedas neededCost less todevelop <strong>and</strong>maintain thanheavy-rail systemCan greatlyreduce car use<strong>and</strong> pollutionCan lose moneybecause theyneed low faresto attract ridersOften get caughtin traffic unlessoperating inexpress lanesCommits riders totransportationschedulesNoisyFigure 25-12 Trade-offs: advantages <strong>and</strong> disadvantages ofmass transit rail systems in urban areas. Pick the single advantage<strong>and</strong> disadvantage that you think are the most important.Figure 25-13 Trade-offs: advantages <strong>and</strong> disadvantagesof bus systems in urban areas. Pick the single advantage <strong>and</strong>disadvantage that you think are the most important.city is densely populated, making it ideal for a rapidrailsystem running through its corridor. Second, halfthe population can walk to a subway station in 5 minutes.Third, a car is an economic liability in thiscrowded city even for those who can afford one.Buses are the most widely used form of masstransit within urban areas, mainly because they havemore advantages than disadvantages (Figure 25-13).Curitiba, Brazil, has one of the world’s best bus systems(Figure 25-1).A rapid-rail system between urban areas is anotheroption. In western Europe <strong>and</strong> Japan, high-speed bullettrains travel between cities at up to 330 kilometers(200 miles) per hour. Figure 25-14 lists the major advantages<strong>and</strong> disadvantages of such rapid rail systems.In 2004, Shanghai, China, began operating theworld’s first commercial high-speed magnetic levitationtrain between its airport <strong>and</strong> downtown. Thetrain, suspended in air slightly above the track <strong>and</strong>propelled forward by strong repulsive <strong>and</strong> attractivemagnetic forces, travels much faster than bullettrains.In the United States, a high-speed bullet train networkcould replace airplanes, buses, <strong>and</strong> private carsfor most medium-distance travel between majorAmerican cities (Figure 25-15, p. 576). Critics say sucha system would cost too much in government subsidies.But this ignores the fact that motor vehicle trans-T rade-OffsRapid RailAdvantagesDisadvantagesCan reduce travel by caror planeIdeal for trips of 200–1,000kilometers (120–620 miles)Much more energy efficientper rider over the samedistance than a car or planeExpensive to run <strong>and</strong> maintainMust operate along heavilyused routes to be profitableCause noise <strong>and</strong> vibration fornearby residentsFigure 25-14 Trade-offs: advantages<strong>and</strong> disadvantages of rapid-rail systemsbetween urban areas. Pick the singleadvantage <strong>and</strong> disadvantage that youthink are the most important.http://biology.brookscole.com/miller14575
In the United States, 80% of federal gasoline taxrevenue is used to build <strong>and</strong> maintain highways, <strong>and</strong>only 20% is used for mass transit, bike paths, <strong>and</strong>walkways. This encourages states <strong>and</strong> cities to investin highways instead of mass transit. The federal taxcode also penalizes mass transit users <strong>and</strong> those whobicycle or walk to work because employers who provideparking for their employees can deduct this expensefrom their taxes.xHOW WOULD YOU VOTE? Should half of the gasoline taxbe used to develop mass transit, bike lanes, <strong>and</strong> other alternativesto the car? Cast your vote online at http://biology.brookscole.com/miller14.Figure 25-15 Solutions: potential routes for high-speed bullet trainsin the United States <strong>and</strong> parts of Canada. Such a system could allowrapid, comfortable, safe, <strong>and</strong> affordable travel between major cities in aregion. It would greatly reduce dependence on cars, buses, <strong>and</strong> airplanesfor trips between these urban areas. (Data from High Speed RailAssociation)portation receives subsidies of $300–600 billion peryear in the United States.Case Study: Mass Transit in the United States—Destroying a Great SystemIn the early 1900s the United States had one of theworld’s best streetcar systems, but it was bought up<strong>and</strong> destroyed by several companies in order to sellcars <strong>and</strong> buses.In 1917, all major U.S. cities had efficient electric trolleyor streetcar (light-rail) systems. Many peoplethink of Los Angeles as the original car-dominatedcity. But in the early 20th century Los Angeles had thelargest electric-rail mass transit system in the UnitedStates.That changed when General Motors, FirestoneTire, St<strong>and</strong>ard Oil of California, Phillips Petroleum,<strong>and</strong> Mack Truck (which also made buses) formed aholding company called National City Lines. By 1950,the holding company had purchased privately ownedstreetcar systems in 83 major cities. It then dismantledthese systems to increase sales of cars <strong>and</strong> buses.The courts found the companies guilty of conspiracyto eliminate the country’s light-rail system, but thedamage had already been done. The executives responsiblewere fined $1 each, <strong>and</strong> each company paida fine of $5,000, less than the profit returned by replacinga single streetcar with a bus.During this same period, National City Linesworked to convert electric-powered commuter locomotivesto much more expensive <strong>and</strong> less reliablediesel-powered locomotives. The resulting increasedcosts contributed significantly to the sharp decline ofthe nation’s railroad system.25-4 URBAN LAND-USE PLANNINGAND CONTROLWhat Is Conventional L<strong>and</strong>-Use Planning?Focusing on GrowthMost l<strong>and</strong>-use planning in the United States leadsto poorly controlled urban sprawl <strong>and</strong> environmentaldegradation <strong>and</strong> funds this often-destructive processwith property taxes.Most urban <strong>and</strong> some rural areas use some form ofl<strong>and</strong>-use planning to determine the best present <strong>and</strong>future use of each parcel of l<strong>and</strong>.Much l<strong>and</strong>-use planning is based on the assumptionthat considerable future population growth <strong>and</strong>economic development should be encouraged, regardlessof environmental <strong>and</strong> other consequences. Typicallythis leads to uncontrolled or poorly controlledurban growth <strong>and</strong> sprawl.A major reason for this often destructive processin the United States <strong>and</strong> some other countries is that90% of the revenue that local governments use toprovide public services such as schools, police <strong>and</strong>fire protection, <strong>and</strong> water <strong>and</strong> sewer systems comesfrom property taxes levied on all buildings <strong>and</strong> propertybased on their economic value. Thus local governmentsoften try to raise money by promoting economicgrowth because they usually cannot raiseproperty tax rates enough to meet exp<strong>and</strong>ing needs.Typically the long-term result is poorly managedeconomic growth, leading to more environmentaldegradation.L<strong>and</strong>-use planning can be aided by the use of geographicinformation system (GIS) technology (Figure4-35, p. 84). Many cities <strong>and</strong> counties in the UnitedStates have used this technology to convert their planningmaps into digital form.In the 1990s, GIS data from satellite images, historicaldata, <strong>and</strong> census data were used to create mapsshowing snapshots of certain years of urban developmentin the Baltimore, Maryl<strong>and</strong>–Washington, D.C.,576 CHAPTER 25 Sustainable Cities
area (Figure 25-7) between 1862 <strong>and</strong> 1999. They werepresented in an animated video showing how the citiesmerged into one gigantic urban area by the 1990s. Thevideo helped a governor of Maryl<strong>and</strong> win legislativeapproval for an antisprawl, smart growth program.What Are the Advantages <strong>and</strong> Disadvantagesof Using Zoning to Control L<strong>and</strong> Use? Usefulbut ImprovableZoning is useful but can favor high-priceddevelopment over environmental protection<strong>and</strong> can discourage innovative solutionsto urban problems.Once a l<strong>and</strong>-use plan is developed, governments controlthe uses of various parcels of l<strong>and</strong> by legal <strong>and</strong> economicmethods. The most widely used approach is zoning,in which various parcels of l<strong>and</strong> are designated forcertain uses.Zoning can be used to control growth <strong>and</strong> protectareas from certain types of development. For example,cities such as Portl<strong>and</strong>, Oregon, <strong>and</strong> Curitiba, Brazil,(p. 563) have used zoning to encourage high-densitydevelopment along major mass transit corridors to reduceautomobile use <strong>and</strong> air pollution.Despite its usefulness, zoning has several drawbacks,one being that some developers can influence ormodify zoning decisions in ways that cause destructionof wetl<strong>and</strong>s, prime cropl<strong>and</strong>, forested areas, <strong>and</strong>open space. Another problem is that zoning often favorshigh-priced housing, factories, hotels, <strong>and</strong> otherbusinesses over protecting environmentally sensitiveareas <strong>and</strong> providing low-cost housing. The reason is,again, that most local governments depend on propertytaxes for their revenue.In addition, overly strict zoning can discourage innovativeapproaches to solving urban problems. Forexample, the pattern in the United States <strong>and</strong> in someother countries has been to prohibit businesses in residentialareas, which increases suburban sprawl. Someurban planners want to return to mixed-use zoning tohelp reduce sprawl. For example, in the 1970s, Portl<strong>and</strong>,Oregon, decided that it could cut driving <strong>and</strong>gasoline consumption by resurrecting the idea ofneighborhood grocery stores. It worked.How Is Smart Growth Used to Control Growth<strong>and</strong> Sprawl? Channeling Growth <strong>and</strong> Reiningin the CarSmart growth can control growth patterns, discourageurban sprawl, reduce car dependence, <strong>and</strong> protectecologically sensitive areas.There is growing use of the concept of smart growth ornew urbanism to encourage more environmentally sustainabledevelopment that requires less dependence oncars, controls <strong>and</strong> directs sprawl, <strong>and</strong> reduces wastefulresource use. It recognizes that urban growth will occur.But it uses zoning laws <strong>and</strong> an array of other toolsto channel growth to areas where it can cause lessharm, discourage sprawl, protect ecologically sensitive<strong>and</strong> important l<strong>and</strong>s <strong>and</strong> waterways, <strong>and</strong> developmore environmentally sustainable urban areas <strong>and</strong>neighborhoods that are more enjoyable places to live.Figure 25-16 (p. 578) lists smart growth tools used toprevent <strong>and</strong> control urban growth <strong>and</strong> sprawl. Which,if any, of these tools are being used in your community?The most widely used ways to slow <strong>and</strong> controlurban sprawl are to set growth boundaries aroundcities, preserve open space outside of urban areas, developspaces within urban areas that have been leftbehind from urban sprawl, create new towns <strong>and</strong> villageswithin existing cities, <strong>and</strong> revitalize neighborhoods<strong>and</strong> downtown areas.Portl<strong>and</strong>, Oregon used some of these strategies tocontrol sprawl <strong>and</strong> reduce dependence on the car, <strong>and</strong>it worked. Since 1975 Portl<strong>and</strong>’s population has grownby about 50% but its urban area has increased by only2%. And abundant green space <strong>and</strong> natural beauty isjust 20 minutes from downtown.The city also encourages clustered, mixed-useneighborhood development consisting of stores, lightindustries, professional offices, high-density housing,<strong>and</strong> access to mass transit that allows most people tomeet their daily needs without a car. Portl<strong>and</strong> has furtherreduced car use by developing an excellent lightrailline <strong>and</strong> an extensive network of bus lines, bikelanes, <strong>and</strong> walkways. Employers are encouraged togive their employees bus passes instead of providingparking spaces. Downtown Portl<strong>and</strong> is a vibrant <strong>and</strong>thriving community <strong>and</strong>, in 2000, Money magazinelisted Portl<strong>and</strong> as the most livable city in the UnitedStates. Curitiba, Brazil (p. 563) has also used a varietyof such strategies to control sprawl <strong>and</strong> reduce dependenceon the car. And car-free villages have been createdin cities such as Munich, Germany; Vancouver,Canada; <strong>and</strong> Zurich, Switzerl<strong>and</strong>. Several studies haveshown that most forms of smart growth provide morejobs <strong>and</strong> spur more economic renewal than conventionaleconomic growth.China has taken the strongest st<strong>and</strong> of any countryagainst sprawl. The government has designated80% of the country’s arable l<strong>and</strong> as fundamental l<strong>and</strong>.Building on such l<strong>and</strong> requires approval from local<strong>and</strong> provincial governments <strong>and</strong> the State Council—somewhat like having to get congressional approvalfor a new subdivision in the United States. Developersviolating these rules face the death penalty. Nationall<strong>and</strong>-use planning also is used in Japan <strong>and</strong> much ofwestern Europe.Most European countries have been successfulin discouraging urban sprawl <strong>and</strong> encouraging compactcities. They have controlled development at thenational level <strong>and</strong> imposed high gasoline taxes tohttp://biology.brookscole.com/miller14577
Limits <strong>and</strong> RegulationsLimit building permitsUrban growth boundariesGreenbelts around citiesPublic review of newdevelopmentZoningEncourage mixed useConcentrate developmentalong mass transportationroutesPromote high-density clusterhousing developmentsPlanningEcological l<strong>and</strong>-useplanning<strong>Environmental</strong> impactanalysisIntegrated regionalplanningState <strong>and</strong> national planningSolutionsSmart Growth ToolsProtectionPreserve existing open spaceBuy new open spaceBuy development rights that prohibitcertain types of development on l<strong>and</strong>parcelsTaxesTax l<strong>and</strong>, not buildingsTax l<strong>and</strong> on value of actual use (suchas forest <strong>and</strong> agriculture) instead ofhighest value as developed l<strong>and</strong>Tax BreaksFor owners agreeing legally to notallow certain types of development(conservation easements)For cleaning up <strong>and</strong> developingab<strong>and</strong>oned urban sites (brownfields)Revitalization <strong>and</strong> New GrowthRevitalize existing towns <strong>and</strong> citiesBuild well-planned new towns <strong>and</strong>villages within citiesFigure 25-16 Solutions: smart growth or new urbanism tools used to prevent <strong>and</strong> controlurban growth <strong>and</strong> sprawl.Since the mid-1970s, Oregon has hada comprehensive statewide l<strong>and</strong>-useplanning process based on three administrativedecisions:■ To permanently zone all rurall<strong>and</strong> in Oregon as forest, agricultural,or urban l<strong>and</strong>■ To draw an urban growth linearound each community in thestate, with no urban developmentallowed outside the boundary■ To place control over l<strong>and</strong>-useplanning in state h<strong>and</strong>s through theL<strong>and</strong> Conservation <strong>and</strong>Development CommissionNot surprisingly, the last actionhas been the most controversial. It isbased on the idea that public goodtakes precedence over private propertyrights—a well-established principlein most European countriesbut generally opposed in the UnitedStates.Oregon’s plan has worked becauseit is not designed to “just sayno” to development. Instead, it encouragescertain kinds of development,such as dense urban developmentthat helps prevent destructionof cropl<strong>and</strong>s, wetl<strong>and</strong>s, <strong>and</strong> biodiversityin the surrounding area.Because of the plan, most of thestate’s rural areas remain undeveloped.Before these l<strong>and</strong>-use <strong>and</strong>planning laws, the state lost about12,100 hectares (30,000 acres) ofagricultural l<strong>and</strong> a year; now it isonly losing about 810 hectares (2,000acres) a year.discourage car use <strong>and</strong> encourage people to live closerto workplaces <strong>and</strong> shops. High taxes on heating fuelalso encourage people to live in apartments <strong>and</strong> smallhouses. Governments have used most of the resultinggasoline <strong>and</strong> heating fuel tax revenues to develop efficienttrain <strong>and</strong> other mass transit systems within <strong>and</strong>between cities.Solutions: L<strong>and</strong>-Use Planning in Oregon—Control from the TopOregon has zoned rural l<strong>and</strong> to prevent environmentaldegradation, controlled urban growth,<strong>and</strong> put l<strong>and</strong>-use planning in the h<strong>and</strong>s of stateofficials.How Can Urban Open Space Be Preserved<strong>and</strong> Used? Be Protective <strong>and</strong> CreativeSmall <strong>and</strong> large parks, greenbelts, urban growthboundaries, cluster development, <strong>and</strong> greenwayscan be used to preserve open space.One way to preserve open space outside a city is toemploy Oregon’s urban growth boundary model, usedalso in the states of Washington <strong>and</strong> Tennessee. A moretraditional way is to preserve significant blocks ofopen space in the form of municipal parks. CentralPark in New York City, Golden Gate Park in SanFrancisco, <strong>and</strong> Grant Park in Chicago are examples oflarge urban parks. Many European cities also havelarge- <strong>and</strong> medium-size parks.578 CHAPTER 25 Sustainable Cities
MajorhighwaysGreenbeltUrban centerSatellite townsFigure 25-17 Establishing a greenbelt around a large city cancontrol urban growth <strong>and</strong> provide open space for recreation<strong>and</strong> other nondestructive uses. Satellite towns sometimes arebuilt outside the belt. Highways or rail systems can be used totransport people around the periphery or into the central city.named after the trees <strong>and</strong> wildlife they displaced suchas Oak Lane, Cedar Drive, Pheasant Run, <strong>and</strong> FoxFields.In recent years, builders have increasingly used apattern, known as cluster development, in which highdensityhousing units are concentrated on one portionof a parcel, with the rest of the l<strong>and</strong> (often 30–50%) usedfor commonly shared open space (Figure 25-18,bottom). When done properly, high-density cluster developmentsare a win-win solution for residents, developers,<strong>and</strong> the environment. Residents get more open<strong>and</strong> recreational space, aesthetically pleasing surroundings,<strong>and</strong> lower heating <strong>and</strong> cooling costs becausesome walls are shared. Developers can cut theircosts for site preparation, roads, utilities, <strong>and</strong> otherforms of infrastructure.Some communities are going further <strong>and</strong> usingprinciples of new urbanism to develop entire villages<strong>and</strong> recreate mixed-use neighborhoods within existingcities. These principles include walkability with mostthings within a 10-minute walk of home <strong>and</strong> work byIn 1883, Minneapolis, Minnesota, officials vowedto create “the finest <strong>and</strong> most beautiful system of publicparks <strong>and</strong> boulevards of any city in America.” Inthe eyes of many, this goal has been achieved. Todaythe city has 170 parks spaced so that most homes inMinneapolis are within six blocks of a green space.Some cities provide open space <strong>and</strong> control urbangrowth by surrounding a large city with a greenbelt(Figure 25-17): an open area used for recreation, sustainableforestry, or other nondestructive uses. Satellitetowns can be built outside the belt. Ideally, the outlyingtowns <strong>and</strong> the central city are linked by an extensivepublic transport system. Many cities in westernEurope <strong>and</strong> Canadian cities such as Toronto <strong>and</strong>Vancouver have used this approach.We can also let nature reclaim spaces we have developedas examples of reconciliation ecology (p. 247).On the west side of Manhattan, New York, for example,an ab<strong>and</strong>oned elevated rail line now supporsabundant plant <strong>and</strong> animal life—an example of naturecreating a self-seeding, self-sustaining urban l<strong>and</strong>scapewithout human input.Undevelopedl<strong>and</strong>Typical housingdevelopmentCluster housingdevelopmentMarshClusterCreekCreekCase Study: How Is New Urbanism CreatingMore Livable Spaces? Returning to TraditionalNeighborhood DevelopmentThere is a growing movement to create mixed-usevillages <strong>and</strong> neighborhoods within urban areas wherepeople can live, work <strong>and</strong> shop close to their homes.Since World War II, the typical approach to suburbanhousing development in the United States has been tobulldoze a tract of woods or farml<strong>and</strong> <strong>and</strong> build rowsof houses on st<strong>and</strong>ard-size lots (Figure 25-18, middle).Many of these developments <strong>and</strong> their streets arePondClusterFigure 25-18 Conventional <strong>and</strong> cluster housing developmentsas they might appear if constructed on the same l<strong>and</strong> area.With cluster development, houses, town houses, condominiums,<strong>and</strong> two- to six-story apartments are built on part of thetract. The rest, typically 30–50% of the area, is left as openspace, parks, <strong>and</strong> cycling <strong>and</strong> walking paths.http://biology.brookscole.com/miller14579
ecognizing that our bodies are biologically designedfor walking; mixed-use <strong>and</strong> diversity where there is a mixof pedestrian-friendly shops, offices, apartments, <strong>and</strong>homes <strong>and</strong> people of different ages, classes, cultures,<strong>and</strong> races; quality urban design emphasizing beauty,aesthetics, <strong>and</strong> architectural diversity; environmentalsustainability based on developemnt with minimal environmentalimpact; <strong>and</strong> smart transportation withhigh-quality trains connecting neighborhoods, towns,<strong>and</strong> cities. The goal is to create places that uplift, enrich,inspire the human spirit, <strong>and</strong> that are incubatorsof friendship, cooperation, <strong>and</strong> civic engagement.One of the larger examples is the newly constructedmixed-use Mayfaire Village within the city ofWilmington, North Carolina. This 162-hectare (400-acre) village has clusters consisting of a town retailcenter with loft rental apartments above some stores,condominiums, apartments, rental houses, singlefamilyhomes, offices, hotels, <strong>and</strong> lots of green <strong>and</strong>recreational space. The town center is within easywalking or biking distance of the housing clusters. Amajor portion of the site is dedicated to open spacessuch as soccer fields, parks, bike paths, <strong>and</strong> hikingtrails, all within a few minutes of the housing <strong>and</strong>shopping clusters. About one-fourth of the site is preservedin its natural state. The village is located only afew minutes from Wrightsville Beach on the AtlanticOcean. Other examples of such villages are MiznerPlace in Boca Raton, Florida; Middleton Hills nearMadison, Wisconsin; Phillips Place in Charlotte, NorthCarolina; Kentl<strong>and</strong>s in Gaithersberg, Maryl<strong>and</strong>; <strong>and</strong>Valencia, California (near Los Angeles).25-5 MAKING URBAN AREAS MORELIVABLE AND SUSTAINABLEHow Can We Make Cities More Sustainable,Desirable Places to Live? The Ecocity ConceptAn ecocity allows people to walk, bike, or takemass transit for most of their travel, <strong>and</strong> recycles<strong>and</strong> reuses most of its wastes, grows much of itsown food, <strong>and</strong> protects biodiversity by preservingsurrounding l<strong>and</strong>.According to most environmentalists <strong>and</strong> urban planners,the primary problem is not urbanization but ourfailure to make cities more sustainable <strong>and</strong> livable. Theycall for us to make new <strong>and</strong> existing urban areas moreself-reliant, sustainable, <strong>and</strong> enjoyable places to livethrough good ecological design. See the Guest Essay onthis topic by David Orr on the website for this chapter.A more environmentally sustainable city, called anecocity or green city, emphasizes:■■Preventing pollution <strong>and</strong> reducing wasteUsing energy <strong>and</strong> matter resources efficiently■ Recycling <strong>and</strong> reusing at least 60% of all municipalsolid waste■ Using solar <strong>and</strong> other locally available renewableenergy resources■ Protecting <strong>and</strong> encouraging biodiversity by preservingsurrounding l<strong>and</strong> <strong>and</strong> protecting <strong>and</strong> restoringnatural systems <strong>and</strong> wetl<strong>and</strong>s within urban areas■ Promoting urban gardens <strong>and</strong> farm markets■ Promoting green design of buildings, includinggreen roofs■ Using solar-powered living machines (Figure 22-1,p. 491) <strong>and</strong> wetl<strong>and</strong>s to treat sewage (Solutions,p. 512)An ecocity is a people-oriented city, not a car-orientedcity. Its residents are able to walk, bike, or uselow-polluting mass transit for most of their travel. Anecocity requires that all buildings, vehicles, <strong>and</strong> appliancesmeet high energy-efficiency st<strong>and</strong>ards. Trees<strong>and</strong> plants adapted to the local climate <strong>and</strong> soils areplanted throughout to provide shade <strong>and</strong> beauty, supplywildlife habitats, <strong>and</strong> reduce pollution, noise, <strong>and</strong>soil erosion. Small organic gardens <strong>and</strong> a variety ofplants adapted to local climate conditions often replacemonoculture grass lawns.Ab<strong>and</strong>oned lots <strong>and</strong> industrial sites <strong>and</strong> pollutedcreeks <strong>and</strong> rivers are cleaned up <strong>and</strong> restored. Nearbyforests, grassl<strong>and</strong>s, wetl<strong>and</strong>s, <strong>and</strong> farms are preserved.Much of an ecocity’s food comes from nearby organicfarms, solar greenhouses, <strong>and</strong> community gardens.There are also small gardens on rooftops <strong>and</strong> in yards,ab<strong>and</strong>oned lots, <strong>and</strong> window boxes. People designing<strong>and</strong> living in ecocities take seriously the advice LewisMumford gave more than three decades ago: “Forgetthe damned motor car <strong>and</strong> build cities for lovers <strong>and</strong>friends.”The ecocity is not a futuristic dream, as you saw inthe chapter opening case study about Curitiba, Brazil.Other more environmentally sustainable <strong>and</strong> livablecities include Waitakere City, New Zeal<strong>and</strong>; Helsinki,Finl<strong>and</strong>; Leicester, Engl<strong>and</strong>; Portl<strong>and</strong>, Oregon (p. 578);Davis, California; Olympia, Washington; <strong>and</strong> Chattanooga,Tennessee (Case Study, p. 581).China is planning to develop 10 model environmentalor ecocities. The first project focuses on transformingSuzhou, a rapidly exp<strong>and</strong>ing city of 2.2million people just 64 kilometers (40 miles) fromShanghai. It is one of China’s oldest cities that is internationallyknown for its combination of history, culture,<strong>and</strong> greenery. Green initiatives include relocatingpolluting industries outside of the city, a pilot projectrequiring local taxis to run on natural gas, buildingfour light rail <strong>and</strong> subway lines, a seven-story heightlimit on buildings in the city’s center, <strong>and</strong> l<strong>and</strong>scapingthe city’s network of canals. It is promoting the useof solar water heaters, plans to phase out gasoline-580 CHAPTER 25 Sustainable Cities
powered motorcycles by 2007, <strong>and</strong> is planning a networkof battery exchange <strong>and</strong> disposal centers to servethe rapidly increasing use of electric-powered bicycles<strong>and</strong> mopeds.China has a long way to go in converting its urbansustainability goals into reality. But if successful,China could become model for the world in ecocitydesign.Case Study: Chattanooga, Tennessee—FromBrown to GreenLocal officials <strong>and</strong> citizens have worked togetherto transform Chattanooga from a highly pollutedcity to one of the most sustainable <strong>and</strong> livable citiesin the United States.In the 1950s, Chattanooga was known as one of thedirtiest cities in the United States. Its air was so pollutedby smoke from its coke ovens <strong>and</strong> steel mills thatpeople sometimes had to turn on their headlights inthe middle of the day. The Tennessee River flowingthrough the city’s industrial wastel<strong>and</strong> bubbled withtoxic waste.People <strong>and</strong> industries fled the downtown area<strong>and</strong> left a wastel<strong>and</strong> of ab<strong>and</strong>oned factories, boardedupbuildings, high unemployment, <strong>and</strong> crime.Within two decades, Chattanooga transformed itselfinto one of the most livable cities in the UnitedStates. Efforts began in 1984 when civic leaders used aseries of town meetings as part of a Vision 2000process—a 20-week series of community meetingsbrought together more than 1,700 citizens from allwalks of life to build a consensus about what the citycould be at the turn of the century. Citizens identifiedthe city’s main problems, set goals, <strong>and</strong> brainstormedthous<strong>and</strong>s of ideas for solutions.By 1995, Chattanooga had met most of its originalgoals, which included encouraging zero-emission industriesto locate there <strong>and</strong> replacing its diesel buseswith a fleet of quiet, zero-emission electric buses,made by a new local firm. The city reduced car use inthe downtown by building satellite parking lots <strong>and</strong>providing free <strong>and</strong> rapid bus service to <strong>and</strong> from thecity center. The city also launched an innovative recyclingprogram after citizen activists <strong>and</strong> environmentalistsblocked construction of a new garbage incinerator.Another project involved renovating much of thecity’s existing low-income housing <strong>and</strong> building newlow-income rental units.Chattanooga built the nation’s largest freshwateraquarium, which became the centerpiece for downtownrenewal. The city also developed a 35-kilometerlong(22-mile-long) riverfront park along both sides ofthe Tennessee River running through downtown. Thepark is filled with shade trees, flowers, fountains, <strong>and</strong>street musicians, <strong>and</strong> draws more than 1 million visitorsper year.As property values <strong>and</strong> living conditions have improved,people <strong>and</strong> businesses are moving backdowntown. An ab<strong>and</strong>oned place once filled with despairis now a vibrant community filled with hope.These accomplishments show what citizens, environmentalists,<strong>and</strong> business leaders can do when theywork together to develop <strong>and</strong> achieve common goals.In 1993, the community began the process again inRevision 2000. More than 2,600 participants identifiedadditional goals <strong>and</strong> more than 120 recommendationsfor further improvements. One goal is to transform ablighted brownfield in South Chattanooga into an environmentallyadvanced, mixed community of residences,retail stores, <strong>and</strong> zero-emission industrieswhere employees can live near their workplaces.This new low-waste ecoindustrial park is modeledafter the one in Kalundborg, Denmark (Figure 24-5,p. 537). Underground tunnels will link 30 industrialbuildings to share heating, cooling, <strong>and</strong> water supplies<strong>and</strong> to use the waste matter <strong>and</strong> energy of some enterprisesas resources for others. The new ecoindustrialarea will also have an ecology center using a livingmachine (Figure 22-1, p. 491) to treat sewage, wastewater,<strong>and</strong> contaminated soils.According to many environmentalists, urbanplanners, <strong>and</strong> economists, urban areas that fail to becomemore livable <strong>and</strong> ecologically sustainable overthe next few decades are inviting economic depression<strong>and</strong> increased unemployment, pollution, <strong>and</strong> socialtension. What is your community doing?A sustainable world will be powered by the sun; constructedfrom materials that circulate repeatedly; made mobile bytrains, buses, <strong>and</strong> bicycles; populated at sustainable levels;<strong>and</strong> centered around just, equitable, <strong>and</strong> tight-knitcommunities.GARY GARDNERCRITICAL THINKING1. Do you prefer living in a rural, suburban, small-town,or urban environment? Describe the ideal environment inwhich you would like to live, <strong>and</strong> list the environmentaladvantages <strong>and</strong> disadvantages of living in such a place.Compare your answers with those of other members ofyour class.2. Do you believe the United States or the country whereyou live should develop a comprehensive <strong>and</strong> integratedmass transit system over the next 20 years, includingbuilding an efficient rapid-rail network for travel within<strong>and</strong> between its major cities? How would you pay forsuch a system?3. If you own a car or hope to own one, what conditions,if any, would encourage you to rely less on the automobile<strong>and</strong> to travel to school or work by bicycle, on foot, bymass transit, or by carpool or vanpool?http://biology.brookscole.com/miller14581
4. Do you believe Oregon’s approach to l<strong>and</strong>-use planning(Solutions, p. 578) should be used in the state orarea where you live? Explain your position.5. In June 1996, representatives from many countries metin Istanbul, Turkey, at the Second UN Conference on HumanSettlements (nicknamed the City Summit). One issuewas the question of whether housing is a universalright (a position supported by most developing countries)or just a need (supported by the United States <strong>and</strong>several other developed countries). What is your positionon this issue? Defend your choice.6. Some analysts suggest phasing out federal, state, <strong>and</strong>government subsidies that encourage sprawl by fundingroads, single-family housing, <strong>and</strong> large malls <strong>and</strong> superstores.These would be replaced with subsidies that encouragesidewalks <strong>and</strong> bicycle paths, multifamily housing,high-density residential development, <strong>and</strong> a mix ofhousing, shops, <strong>and</strong> offices (mixed-use development). Doyou support this approach? Explain.7. Congratulations! You are in charge of the world. Listthe five most important features of your urban policy.PROJECTS1. Consult local officials to determine how l<strong>and</strong> use isdecided in your community. What roles do citizens playin this process?2. For a class or group project, borrow one or moredecibel meters from your school’s physics or engineeringdepartment or from a local electronics repair shop. Makea survey of sound pressure levels at various times of day<strong>and</strong> at several locations. Plot the results on a map. Also,measure sound levels in a room with a sound system <strong>and</strong>from earphones at several different volume settings. Ifpossible, measure sound levels at an indoor concert, aclub, <strong>and</strong> inside <strong>and</strong> outside a boom car at various distancesfrom the speakers. Correlate your findings withthose in Figure 25-9, p. 570.3. As a class project, (a) evaluate l<strong>and</strong> use <strong>and</strong> l<strong>and</strong>-useplanning by your school, (b) draw up an improved planbased on ecological principles <strong>and</strong> the principles of sustainabilitylisted in Figure 9-15, p. 174, <strong>and</strong> (c) submit theplan to school officials.4. As a class project, use the following criteria to rate thecommunity where you live or go to school on a greenindex from 0 to 10. Rate the community for each of thefollowing questions <strong>and</strong> average the results to get anoverall score. Are existing trees protected <strong>and</strong> new onesplanted throughout the city? Do you have parks to enjoy?Can you swim in any nearby lakes <strong>and</strong> rivers? Whatis the quality of your water <strong>and</strong> air? Is there an effectivenoise pollution reduction program? Does your city havea recycling program, a composting program, <strong>and</strong> ahazardous waste collection program, with the goal ofreducing the current solid waste output by at least 60%?Is there an effective mass transit system? Are there bicyclepaths? Are all buildings required to meet high energyefficiencyst<strong>and</strong>ards? How much of the energy is obtainedfrom locally available renewable resources? Areenvironmental regulations for existing industry toughenough <strong>and</strong> enforced well enough to protect citizens? Dolocal officials look carefully at an industry’s environmentalrecord <strong>and</strong> plans before encouraging it to locate inyour city or county? Is ecological planning used to makel<strong>and</strong>-use decisions? Are city officials actively planning toimprove the quality of life for all of its citizens? If so,what is the plan? Compare your answers with those byother members of your class.5. Use the library or the Internet to find bibliographic informationabout Peter Self <strong>and</strong> Gary Gardner, whosequotes appear at the beginning <strong>and</strong> end of this chapter.6. Make a concept map of this chapter’s major ideas, usingthe section heads, subheads, <strong>and</strong> key terms (in boldface).Look on the website for this book for informationabout making concept maps.LEARNING ONLINEThe website for this book contains study aids <strong>and</strong> manyideas for further reading <strong>and</strong> research. They include achapter summary, review questions for the entire chapter,flash cards for key terms <strong>and</strong> concepts, a multiple-choicepractice quiz, interesting Internet sites, references, <strong>and</strong> aguide for accessing thous<strong>and</strong>s of InfoTrac ® College Editionarticles. Log on tohttp://biology.brookscole.com/miller14Then click on the Chapter-by-Chapter area, choose Chapter25, <strong>and</strong> select a learning resource.582 CHAPTER 25 Sustainable Cities
26 <strong>and</strong>Economics, Environment,<strong>Sustainability</strong>PollutionControlCASE STUDYHow Important Are NaturalResources?Economics is the study of how individuals <strong>and</strong>societies choose to use limited or scarce resources tosatisfy their unlimited wants. Recall that economicgrowth is an increase in a nation’s capacity to providepeople with goods <strong>and</strong> services, <strong>and</strong> economicdevelopment is the improvement of human livingst<strong>and</strong>ards by economic growth. For more than 200years there has been a debate on whether there arelimits to economic growth.Neoclassical economists such as Milton Friedman<strong>and</strong> Robert Samuelson view economic growth asboth necessary <strong>and</strong> desirable. Neoclassical economistsalso view economic growth as unlimitedbecause if we deplete a particular resourcewe should be able to useour ingenuity <strong>and</strong> technologyto find a substitute.For example, ifwe run out ofoil weshouldNo-tillcultivationForestconservationProduction ofenergy-efficientfuel-cell carsbe able to find a substitute such as hydrogen or nuclearpower. Thus, natural capital is viewed as an importantbut not indispensable economic resource.Ecological economists such as Herman Daly <strong>and</strong>Robert Costanza disagree. They point out that there areno substitutes for many natural resources, such as air,water, fertile soil, <strong>and</strong> biodiversity. They conclude thatultimately economic growth is limited because someforms of economic growth can deplete <strong>and</strong> degrade thequantity <strong>and</strong> quality of these irreplaceable forms ofnatural capital. They call for us to redesign our economicsystems to encourage environmentally sustainableforms of economic development <strong>and</strong> to discourageenvironmentally harmful forms of economic growth.In the middle of this debate are environmentaleconomists.They generally agree with ecological economiststhat some forms of economic growth are notsustainable. But they believe we can modify the principlesof neoclassical economics <strong>and</strong> reform currenteconomic systems, rather than totallyUnderground CO 2storage usingab<strong>and</strong>oned oil wellsHigh-speed trainsredesigning them. Figure 26-1 showssome of the forms of economicgrowth <strong>and</strong> development thatmost ecological <strong>and</strong> environmentaleconomists wantto encourage.Solar-cellfieldsDeep-seaCO 2 storageBicyclingCommunities ofpassive solar homesL<strong>and</strong>fillCluster Wind farmshousingdevelopmentWaterconservationRecyclingplantRecycling, reuse,<strong>and</strong> compostingFigure 26-1 Solutions: these are some components ofmore environmentally sustainable economic developmentfavored by ecological <strong>and</strong> environmental economists. Thegoal is to have economic systems put more emphasis onconserving <strong>and</strong> sustaining the air, water, soil, biodiversity,<strong>and</strong> other natural resources that sustain all life <strong>and</strong> alleconomies.
When it is asked how much it will cost to protect the environment,one more question should be asked: How much will itcost our civilization if we do not?GAYLORD NELSONThis chapter discusses how we can use economics topromote environmental quality <strong>and</strong> sustainability. Itaddresses the following questions:■■■■■■■What are economic systems <strong>and</strong> how do theywork?How do economists differ in their views of economicsystems, pollution control, <strong>and</strong> resourcemanagement?How can we monitor economic <strong>and</strong> environmentalprogress?What is full-cost pricing?What economic tools can we use to help us shift tofull-cost pricing?How does poverty reduce environmental quality,<strong>and</strong> how can we reduce poverty?How can we shift to more environmentallysustainable economies over the next fewdecades?26-1 ECONOMIC RESOURCES ANDSYSTEMSWhat Is a Pure Free Market? A TheoreticalModel of Supply, Dem<strong>and</strong>, <strong>and</strong> Marginal Costs<strong>and</strong> BenefitsA purely free market is an ideal that does not matchreal world markets.A pure free-market economic system is a theoreticalideal or model in which buyers (dem<strong>and</strong>ers) <strong>and</strong> sellers(suppliers) freely interact in markets without anygovernment or other interference to make all economicdecisions. No one can influence the price at which agood or service sells. All parties have full access to themarket <strong>and</strong> enough information about the beneficial<strong>and</strong> harmful aspects of economic goods <strong>and</strong> servicesto make decisions.According to these ideals, all economic decisionsare governed solely by the competitive interactions ofdem<strong>and</strong> (the amount of a good or service that peoplewant), supply (the amount of a good or service that isavailable), <strong>and</strong> price (the market cost of a good or service).Supply is represented on the graph in Figure 26-2by the blue curve showing how much a producer ofany good or service is willing to supply (measured onthe horizontal quantity axis) for different prices (measuredon the vertical price axis). Dem<strong>and</strong> is shown onthe orange curve showing how much consumers willpay for different quantities of the good or service.The point at which the curves intersect is calledthe market price equilibrium point, where the supplier’sWhat Supports <strong>and</strong> Drives Economies?Three Types of CapitalAn economic system produces <strong>and</strong> distributesgoods <strong>and</strong> services by using natural, human, <strong>and</strong>physical resourcesAn economic system is the social institution throughwhich goods <strong>and</strong> services are produced, distributed<strong>and</strong> consumed to satisfy people’s unlimited wants inthe most efficient possible way.Recall that capital is any form of wealth used to sustaina business or produce more wealth. Three types ofresources or capital are used to produce goods <strong>and</strong> services.One is natural resources, or natural capital, thematerials produced by the earth’s natural processes,which support all economies <strong>and</strong> all life (top half ofback cover). See the Guest Essay on this topic by PaulHawken on the website for this chapter.A second resource type is human resources or humancapital, people’s physical <strong>and</strong> mental talents thatprovide skills <strong>and</strong> abilities, innovation, culture, <strong>and</strong>organization. A third type is physical or manufacturedresources, items made from natural resourceswith the help of human resources, such as tools, machinery,equipment, factories, <strong>and</strong> shipping facilities.Price (low to high)0Dem<strong>and</strong> curveQuantitydem<strong>and</strong>edQuantitysuppliedSurplusShortageQuantitysuppliedQuantitySupply curveIf the price is toohigh, more of agood is availablethan buyers arewilling to buy.At this market equilibriumprice, the quantity of a goodsuppliers are willing to sell isthe same as the quantitybuyers are willing to buy.If the price is too low,buyers want to buy morethan suppliers arewilling to sell.Quantitydem<strong>and</strong>edFigure 26-2 Supply, dem<strong>and</strong>, <strong>and</strong> market equilibrium for agood or service in a pure market system. If all factors exceptprice, supply, <strong>and</strong> dem<strong>and</strong> are held fixed, market equilibriumoccurs at the point at which the dem<strong>and</strong> <strong>and</strong> supply curves intersect.This is the price at which sellers are willing to sell <strong>and</strong>buyers are willing to pay for the good or service provided.584 CHAPTER 26 Economics, Environment, <strong>and</strong> <strong>Sustainability</strong>
price matches what buyers are willing to pay for thesame quantity <strong>and</strong> a sale is made. In Figure 26-2 it isthe point at which the supply <strong>and</strong> dem<strong>and</strong> curves intersect.In a pure free market economy such competitionbetween willing sellers <strong>and</strong> buyers is said to bringabout the greatest efficiency of resource use. Profit orloss is the difference between the cost of producingsomething <strong>and</strong> the price buyers are willing to pay.Changes in supply <strong>and</strong> dem<strong>and</strong> can shift one orboth curves back <strong>and</strong> forth, <strong>and</strong> thus change the equilibriumprice. For example, when supply is increased(shifting the blue curve to the right) <strong>and</strong> dem<strong>and</strong> remainsthe same the equilibrium price will go down.Similarly, when dem<strong>and</strong> is increased (shifting the orangecurve to the right) <strong>and</strong> supply remains the same,the equilibrium price will increase. Try moving thecurves in Figure 26-2 in different ways that representchanges in supply <strong>and</strong> dem<strong>and</strong>, <strong>and</strong> notice how theequilibrium price changes.Two related economic concepts are those of marginalcosts <strong>and</strong> marginal benefits. In economics, anythingdescribed as marginal usually refers to an increase insome measurement involving a certain number ofunits of a good or service <strong>and</strong> that number of unitsplus one. Marginal cost is the increase in total cost resultingfrom producing one more unit of a good or service.For example, a supplier (seller) might ask “Howmuch would it cost <strong>and</strong> how much profit might I makeif I produce one more unit of my product? Look at Figure26-2 again, <strong>and</strong> note that if you start at any pointon the quantity axis <strong>and</strong> move to the right, the supplycurve takes you up on the price axis. The difference betweena seller’s starting price <strong>and</strong> the new price representsthe seller’s marginal cost—the cost of producingthat one more unit. The seller’s marginal benefit is theprofit made by producing <strong>and</strong> selling one more unit.Similarly, when a seller produces one more unit ofaproduct or service, the increase in the benefit that itprovides to a buyer is the marginal benefit. For example,as a buyer you might ask how much would I benefitif I buy one more shirt? You can think of marginal benefitof buying a new shirt as the difference between thebenefit you gain from having ten shirts <strong>and</strong> the benefityou enjoyed from having nine. In this case, the shirtmaker’smarginal cost is the difference between the costof producing 1000 shirts <strong>and</strong> the cost of producing 1001.And your marginal cost is what it costs you to buy onemore shirt. A sale occurs if both the seller <strong>and</strong> buyerfind the marginal costs <strong>and</strong> benefits advantageous. Inreal world economics, marginal costs <strong>and</strong> benefits arewhat actually determine prices <strong>and</strong> benefits to consumers<strong>and</strong> costs <strong>and</strong> profits to producers.In fact, the market economic systems found in thereal world do not meet the theoretical conditions describedabove. In practice truly free markets do not exist.Businesses strive to drive their competitors out ofbusiness <strong>and</strong> exert as much control as possible over theprices of the goods <strong>and</strong> services they provide. Companieslobby for government subsidies, tax breaks, or regulationsthat give their products a market advantageover their competitors. Some companies also try towithhold information from consumers about dangersposed by products unless the government requiresthem to provide such information.Also, there are exceptions to the free market theoryof supply <strong>and</strong> dem<strong>and</strong>. Some consumers may buy agood or service regardless of its price. For example,raising the price of gasoline or cigarettes may not significantlyreduce consumer dem<strong>and</strong> because some buyersfeel they have to have these products. Economists callthis price inelasticity.Why Have Governments Intervenedin Market Economic Systems? Making Upfor Market DeficienciesGovernments intervene in market systems to helpprovide economic stability, national security, <strong>and</strong>public services such as education, crime protection,<strong>and</strong> environmental protection.Markets often work well in guiding the production ofprivate goods, but experience shows that they cannot berelied upon to provide the adequate levels of public servicessuch as national security <strong>and</strong> environmental protection.Thus governments intervene in market systemsto help correct market failures. For example, a singleseller or buyer (monopoly) or a single group of sellersor buyers (oligopoly) might come to dominate the market<strong>and</strong> thus control supply or dem<strong>and</strong> <strong>and</strong> price for agood or service. Governments can prevent this <strong>and</strong>other market failures through laws <strong>and</strong> regulations.Governments can also promote economic stability bytrying to control boom-<strong>and</strong>-bust cycles that occur inmarket systems.Other reasons for government interventions are to■ Provide public services such as national security<strong>and</strong> education■ Provide an economic safety net for people who becauseof health, age, <strong>and</strong> other factors cannot meettheir basic needs■ Protect people from fraud, trespass, theft, <strong>and</strong> bodilyharm■ Establish <strong>and</strong> enforce civil rights <strong>and</strong> propertyrights■ Protect the health <strong>and</strong> safety of workers <strong>and</strong>consumers■ Prevent or reduce pollution <strong>and</strong> depletion of naturalresourceshttp://biology.brookscole.com/miller14585
Manage public l<strong>and</strong> resources such as nationalforests, parks, <strong>and</strong> wildlife reserves■26-2 ECONOMISTS’ VIEWSOF POLLUTION CONTROL ANDRESOURCE MANAGEMENTHow Do Economists Differ in <strong>Their</strong> Viewof Market-Based Economic Systems? TheImportance of Natural CapitalNeoclassical economists see natural resourcesas a component of an economic system, <strong>and</strong> ecologicaleconomists see economic systems as a componentof nature’s economy.Neoclassical economists view the earth’s natural capitalas a subset or part of a human economic system (Figure26-3). Natural resources are seen as important butnot vital because of our ability to find substitutes forscarce resources <strong>and</strong> ecosystem services.To neoclassical economists, economic growth isnecessary, desirable, <strong>and</strong> essentially unlimited. It isseen as the best way to provide jobs <strong>and</strong> distributewealth. If the economy is growing, there is moneyavailable to provide jobs, develop new resources, <strong>and</strong>supply public services such as environmental protection,education, national security, <strong>and</strong> crime protection.In this prevailing view, the global economy is,<strong>and</strong> should be, hard-wired to accelerating growthbased mostly on increasing throughputs of matter <strong>and</strong>energy resources. (Figure 3-18, p. 53).Ecological <strong>and</strong> environmental economists disagreewith this model. They view economic systems as subsystemsof the environment that depend heavily on theearth’s irreplaceable natural resources (Figure 26-4).According to ecological economist Herman Daly, theneoclassical model of an economy “ignores the originof natural resources flowing into the system <strong>and</strong> thefate of wastes flowing out of the system. It is as if a biologisthad a model of an animal that contained a circulatorysystem but had no digestive system that tiedit firmly to the environment at both ends.” Ecologicaleconomists also believe that conventional economicgrowth eventually is unsustainable because it can depleteor degrade the natural resources on which economicsystems depend.Ecological <strong>and</strong> environmental economists distinguishbetween unsustainable economic growth <strong>and</strong>environmentally sustainable economic development(Figure 26-5, p. 588). They call for making a shift fromour current economy based on unlimited economicgrowth to a more environmentally sustainable economy,or eco-economy. See the Guest Essay on this topic byHerman Daly on the website for this chapter.Various ecological <strong>and</strong> environmental economistshave suggested eight strategies to help make the shiftto an eco-economy over the next several decades.■ Use resources more efficiently■ Use indicators that monitor economic <strong>and</strong> environmentalhealth.■ Have the market prices of goods <strong>and</strong> services includetheir harmful effects on the environment <strong>and</strong>human health (full-cost pricing).■ Phase out environmentally harmful governmentsubsidies <strong>and</strong> tax breaks.■ Shift taxes by lowering taxes on income <strong>and</strong>wealth <strong>and</strong> increasing taxes on pollution <strong>and</strong> resourcewaste.■ Pass laws <strong>and</strong> regulations to prevent pollution <strong>and</strong>resource depletion in certain areas.■ Use tradable permits or rights to pollute or use resourceswithin programs that limit overall pollution<strong>and</strong> resource use in given areas.■ Use eco-labeling to identify products produced byenvironmentally sound methods <strong>and</strong> thus help consumersmake informed choices.Let us look at these solutions in more detail.+ + =Natural Resources Manufactured Resources Human Resources Goods <strong>and</strong> ServicesFigure 26-3 Neoclassical economists view the earth’s natural capital, or natural resources, as a subset orpart of a human economic system. They contend that economic growth is not limited by the earth’s naturalresources because we should be able to find substitutes for scarce resources <strong>and</strong> ecosystem services.Economic growth is seen as good <strong>and</strong> essentially unlimited.586 CHAPTER 26 Economics, Environment, <strong>and</strong> <strong>Sustainability</strong>
SunEARTHFigure 26-4 Ecological economistssee all economies as human subsystemsthat depend on resources<strong>and</strong> services provided by the sun<strong>and</strong> the earth’s natural resources.HeatNaturalCapitalAir, water,l<strong>and</strong>, soil,biodiversity,minerals,raw materials,energyresources,<strong>and</strong> dilution,decomposition,<strong>and</strong> recyclingservicesEconomicSystemsProductionConsumptionDepletion ofnonrenewableresourcesDegradation <strong>and</strong>depletion of renewableresources used fasterthan replenishedPollution <strong>and</strong> wastefrom overloadingnature’s waste disposal<strong>and</strong> recycling systemsRecycling<strong>and</strong>reuseHow Can Technological DevelopmentsImprove Market Efficiency? ProducingMore with LessBetter technology <strong>and</strong> more efficient productionsystems can produce goods <strong>and</strong> services with fewerresources.All economists agree that technological developments<strong>and</strong> more efficient production systems can mean thatfewer resources are needed to produce the sameamount of a good or service.For example, between 1975 <strong>and</strong> 1995 the foodoutput of the United States <strong>and</strong> most countries perunit of l<strong>and</strong> increased while the inputs of labor <strong>and</strong>resources such as water <strong>and</strong> fertilizer needed to produceeach unit of that output fell. However, ecological<strong>and</strong> environmental economists warn that such increasesin the efficiency of food production might notbe sustainable because of the degradation of soil, water,<strong>and</strong> other natural resources needed to producefood. These economists believe that this may be a factorin the leveling off of global grain production since1985 (Figure 14-16, p. 287).Economists agree that increases in technological<strong>and</strong> production efficiencies can cause significantchanges to supply, dem<strong>and</strong>, <strong>and</strong> prices for a good orservice. For example, technological improvements canmake it cheaper to produce a good or service <strong>and</strong> increaseits supply at a particular price. This can cause itsmarket equilibrium point (Figure 26-2) to shift to alower price <strong>and</strong> thus benefit buyers. Trace such a shift inFigure 26-2.Scarcity of a resource can stimulate research <strong>and</strong>development for new <strong>and</strong> more efficient technologies<strong>and</strong> production systems <strong>and</strong> a search for new reserves(Figure 16-10, p. 340) <strong>and</strong> for substitutes for such resources.It can also lead to increased recycling <strong>and</strong>reuse of a resource (Figure 16-16, p. 345).For example, scarcity of a metal such as copper hasled to improved technology for extracting <strong>and</strong> processinglower-grade ores, use of microorganisms that can beused to remove copper (<strong>and</strong> other metals) from its ore,increased recycling of copper, <strong>and</strong> use of aluminum as asubstitute for copper in wiring. This can lead to lowerprices <strong>and</strong> a rise in dem<strong>and</strong>, which can eventually depletereserves, raise prices, <strong>and</strong> stimulate a new searchfor improved technology <strong>and</strong> substitutes.However, ecological <strong>and</strong> environmental economistswarn that as dem<strong>and</strong> keeps rising at somepoint the harmful environmental effects of extracting,http://biology.brookscole.com/miller14587
CharacteristicProduction emphasisNatural resourcesResource productivityResource throughputResource typeemphasizedResource fatePollution controlGuiding principlesUnsustainableEconomic GrowthQuantityNot very importantInefficient(high waste)HighNonrenewableMatter discardedCleanup(output reduction)Risk–benefitanalysis<strong>Environmental</strong>lySustainableEconomicDevelopmentQualityVery importantEfficient(low waste)LowRenewableMatter recycled,reused, orcompostedPrevention(input reduction)Prevention <strong>and</strong>precautionFigure 26-5 Comparison of unsustainable economic growth <strong>and</strong> environmentallysustainable economic development according to ecological economists <strong>and</strong>many environmental economists.processing, <strong>and</strong> using increasing amounts of variousnonrenewable mineral <strong>and</strong> energy resources can limittheir availability <strong>and</strong> that in some cases substitutesmay not be available.Highcurve crosses the supply curve is the point atwhich it no longer pays to remove the coal. Theoptimum level of coal mining is at or belowthat equilibrium point.You might think that pollution control isan all-or-nothing proposition—that the bestsolution is to clean up every last bit of anypollutant. In fact, there are optimum levelsfor various kinds of pollution, because themarginal cost of pollution control also goesup for each unit of a pollutant removed fromthe environment. Figure 26-7 shows variouspossible optimal levels of pollution control.In this case, clean-up costs are shown on theblue curve. This is the supply curve, becausethe service supplied is removal of pollutants.Note that it slopes up more sharply (costingmore) as we get closer to removing 100% ofthe pollutant in question.The red line in Figure 26-7 represents thedem<strong>and</strong> for cleanup by users of water or air.With their air or drinking water polluted, consumersare initially up in arms, but as the pollutantis removed, their concern is relieved<strong>and</strong> dem<strong>and</strong> approaches zero. In other words,the marginal benefits of pollution control decreasewith each unit of pollution removed.At some point, the cost of removing thepollutant gets higher than what people arewilling to pay, as their dem<strong>and</strong> for clean-uplessens. That point is the equilibrium point,or the optimum level for clean-up.How Do Economists Value PollutionControl <strong>and</strong> Resource Management? SomeAdvocate Using Market Prices While OthersDisagreeEconomists think about optimum levels ofpollution control <strong>and</strong> resource use, but there isconsiderable disagreement on how to arrive at thoselevels.An important concept in environmental economics isthat of optimum levels for pollution control <strong>and</strong> resourceuse. In the early days of a new coal mining operation,for example, the cost of removing coal is easy for developersto recover in sales of their product. However, aftermost of the more readily accessible coal has been removed,taking what is left can become too costly. In thiscase, the marginal cost of removal goes up with eachunit of coal taken. Figure 26-6 shows this in terms ofsupply, dem<strong>and</strong>, <strong>and</strong> equilibrium. Where the dem<strong>and</strong>CostLow0 25 50Coal removed (%)Optimum level ofresource use75 100Figure 26-6 The cost of mining coal (blue line) rises with eachadditional unit removed. Mining a certain amount of coal isprofitable, but at some point the cost of mining exceeds themonetary benefits (red line). That is, the marginal cost of miningincreases while the marginal benefits decrease as more coal isremoved. Where the two curves meet is theoretically the optimumlevel of resource use.588 CHAPTER 26 Economics, Environment, <strong>and</strong> <strong>Sustainability</strong>
CostHighLowOptimum pollutionclean-up level0 25 50 75 100Pollution removed (%)Figure 26-7 The cost of cleaning up pollution (blue line) riseswith each additional unit removed. Cleaning up a certainamount of pollution is affordable, but at some point the cost ofpollution control is greater than the harmful costs of the pollutionto society. That is, the marginal cost of pollution clean-up increases(blue line) <strong>and</strong> the marginal benefits decrease (redline) as more pollution is removed. Where the blue curve intersectswith any other curve is a point of optimum pollution controlfor the pollutant represented.Another factor determining the shape <strong>and</strong> placementof the dem<strong>and</strong> curve is how much people valuetheir resources. If no one cares whether or not the waterin a lake is clear or groundwater is pure, the optimumlevel of clean-up will be close to zero. But if theydem<strong>and</strong> a clean lake <strong>and</strong> groundwater, the optimumlevel will rise. In other words, pollution control (or resourceuse) that is optimum for some will be high orlow for others. The levels depend on human values asmuch as anything else.Case Study: What is Cost-Benefit Analysis,<strong>and</strong> How Can It Be Improved? Weighing Costs<strong>and</strong> Benefits to Make ChoicesComparing likely costs <strong>and</strong> benefits of an environmentalaction can help with decision-making,but it is a limited tool.Another widely used tool for making economic decisionsabout how to control pollution <strong>and</strong> manage resourcesis cost-benefit analysis (CBA). It involvescomparing estimated costs <strong>and</strong> benefits for actionssuch as implementing a pollution control regulation,building a dam on a river, filling in a wetl<strong>and</strong>, or preservingan area of forest. It involves trying to estimatethe optimum level of pollution clean up (Figure 26-7)or resource use (Figure 26-6).CBA is one of the main tools economists <strong>and</strong> decisionmakers throughout the world use to help themmake decisions about pollution control, biodiversityprotection, <strong>and</strong> the construction of roads, airports,dams <strong>and</strong> other facilities.Making a CBA involves determining who or whatmight be affected by a particular regulation or project,projecting potential outcomes, evaluating alternativeactions, <strong>and</strong> determining who benefits <strong>and</strong> who isharmed. Then an attempt is made to assign monetarycosts <strong>and</strong> benefits to each of the factors <strong>and</strong> componentsinvolved.Direct costs involving l<strong>and</strong>, labor, materials, <strong>and</strong>pollution-control technologies are often fairly easy toestimate. But indirect costs of things we value such asclean air <strong>and</strong> water that are not traded in the marketplaceare difficult to make <strong>and</strong> are controversial. Wecan put estimated price tags on human life, goodhealth, clean air <strong>and</strong> water, <strong>and</strong> various forms of naturalcapital such as an endangered species, a forest, awetl<strong>and</strong>, <strong>and</strong> other forms of natural capital. However,the monetary values that different people assign tosuch things vary widely because of different assumptions<strong>and</strong> value judgments. This can lead to a widerange of projected costs <strong>and</strong> benefits.CBA is controversial because making accurate estimatesof costs <strong>and</strong> benefits is difficult. They are alsoeasy to manipulate by parties supporting or opposinga particular regulation or project.Because of these drawbacks, CBA can lead towide ranges of benefits <strong>and</strong> costs with a lot of roomfor error. For example, one U.S. industry-sponsoredCBA estimated that compliance with a st<strong>and</strong>ard toprotect U.S. workers from vinyl chloride would cost$65–90 billion. In the end, meeting the st<strong>and</strong>ard costthe industry less than $1 billion. A study by theWashington-based Economic Policy Institute foundthat the estimated costs made by industries for complyingwith proposed environmental regulations inthe United States are almost always more (<strong>and</strong> oftenmuch more) than the actual costs of implementingthe regulations.Some environmental groups use CBA to help evaluateproposed environmental projects <strong>and</strong> regulations.But some environmentalists oppose putting too muchemphasis on using this approach as a primary factor indecision making because the large uncertainties involvedallow manipulation of the data <strong>and</strong> estimatesto come up with a desired result.If conducted fairly <strong>and</strong> accurately, CBA is a usefultool for helping making economic decisions. To minimizepossible abuses <strong>and</strong> errors, environmentalists<strong>and</strong> economists advocate using the following guidelinesfor a CBA:■■■Use uniform st<strong>and</strong>ards.Clearly state all assumptions used.Rate the reliability of data used.http://biology.brookscole.com/miller14589
■ Estimate short- <strong>and</strong> long-term benefits <strong>and</strong> costsfor all affected population groups.■ Compare the costs <strong>and</strong> benefits of alternativecourses of action.■ Summarize the range of estimated costs <strong>and</strong>benefits.Various economists make use of tools such as optimumlevels <strong>and</strong> CBA in different ways. The neoclassicalapproach would tend to value resources strictly accordingto market information. They would look at thegoing prices for timber or coal, for example, or estimatethe amount of money that tourists are likely tospend visiting a lake after it is cleaned up. They wouldcalculate marginal costs <strong>and</strong> benefits of developing aresource or of cleaning up pollution somewhere, <strong>and</strong>then determine optimum levels of resource use or pollutioncontrol.<strong>Environmental</strong> <strong>and</strong> ecological economists wouldtend to be less bound by market prices. They might assignhigher-than-market values to resources to accountfor their importance to ecosystem health, biodiversity,<strong>and</strong> future generations. They would thus determinehigher optimum levels of pollution control <strong>and</strong> loweroptimum levels of resource use than would some neoclassicaleconomists.Have environmental regulations in the UnitedStates been worth the cost to industry, business, <strong>and</strong>consumers? There are different opinions on this issuedepending on how CBA analyses are made. However,a 2003 joint study by the White House <strong>and</strong> the Office ofManagement <strong>and</strong> Budget (OMB) estimated that the totalannual benefits from EPA regulations between 1992<strong>and</strong> 2002 ranged from $121–193 billion compared toannual costs of $23.3–26.6 billion. Thus according tothis CBA, the economic benefits of such regulationshave exceeded their costs by a factor of 4.5 to 8.26-3 MONITORING ENVIRONMENTALPROGRESSHow Can We Evaluate <strong>Environmental</strong>Quality <strong>and</strong> Human Well-Being? Develop<strong>and</strong> Use New IndicatorsWe need new indicators to accurately reflectchanging levels of environmental quality <strong>and</strong>human health.Economists <strong>and</strong> environmental scientists want measurementsthat can indicate what is happening in aneconomy <strong>and</strong> in nature’s economy. Gross domestic product(GDP), <strong>and</strong> per capita GDP indicators provide ast<strong>and</strong>ardized <strong>and</strong> useful method for measuring <strong>and</strong>comparing the economic outputs of nations.Economists who developed the GDP manydecades ago never intended it to be used for measuringenvironmental quality or human well-being. Butmost governments <strong>and</strong> business leaders incorrectlyuse this narrowly defined indicator that way. The GDPis deliberately designed to measure the annual economicvalue of all goods <strong>and</strong> services produced withina country without attempting to make any distinctionbetween goods <strong>and</strong> services that are environmentallyor socially beneficial <strong>and</strong> those that are harmful.<strong>Environmental</strong> <strong>and</strong> ecological economists <strong>and</strong> environmentalscientists call for the development of newindicators to help monitor environmental quality <strong>and</strong>human well-being. One approach is to develop indicatorsthat add to the GDP things not counted in themarketplace that enhance environmental quality <strong>and</strong>human well-being. They would also subtract from theGDP the costs of things that lead to a lower quality oflife <strong>and</strong> depletion of natural resources.One such indicator is the genuine progress indicator(GPI), introduced in 1995 by Redefining Progress, anonprofit organization that develops economics <strong>and</strong>policy tools to help evaluate <strong>and</strong> promote sustainability.(This group also developed the concept of ecologicalfootprints, Figure 1-7, p. 10 <strong>and</strong> Figure 9-12, p. 172).Within the GPI, the estimated value of beneficial transactionsthat meet basic needs, but in which no moneychanges h<strong>and</strong>s, are added to the GDP. Examples areunpaid volunteer work, healthcare for family members,childcare, <strong>and</strong> housework. Then the estimatedharmful environmental costs (such as pollution <strong>and</strong> resourcedepletion <strong>and</strong> degradation) <strong>and</strong> social costs(such as crime) are subtracted from the GDP.Genuine benefits not harmfulprogress GDP included in environmentalindicator market transactions <strong>and</strong> social costsFigure 26-8 compares the per capita GDP <strong>and</strong> GPIfor the United States between 1950 <strong>and</strong> 2000. Note thatwhile the per capita GDP rose sharply, the per capitaGPI stayed nearly flat <strong>and</strong> declined slightly between1975 <strong>and</strong> 2000.A similar indicator is the Index of SustainableEconomic Welfare (ISEP) developed by ecological economistsHerman Daly <strong>and</strong> John Cobb. It combines estimatesof income, natural resource depletion, environmentaldegradation, economic benefits from volunteerwork, <strong>and</strong> distribution of income for different countries.The United Nations has developed an indicator ofhuman well-being based on measurements of a country’sst<strong>and</strong>ard of living, education, <strong>and</strong> life expectancy.Others call for a much more detailed indicatorbased on carrying out materials balance measurements.Itinvolves, for any good or service, measuring necessaryinputs of matter <strong>and</strong> energy resources from the envi-590 CHAPTER 26 Economics, Environment, <strong>and</strong> <strong>Sustainability</strong>
onment, their flow rates through the economy, <strong>and</strong> theoutputs of pollution, waste, <strong>and</strong> heat into the environment(Figure 3-18, p. 53). This approach would give usdetailed information on how conditions are changing,what problems are more serious than others, <strong>and</strong> whatsolutions work the best. However, it is difficult <strong>and</strong>costly to get such information, especially for nonmarkettransactions, as discussed below.The GPI <strong>and</strong> other environmental <strong>and</strong> social indicatorsare far from perfect <strong>and</strong> include many crude estimates.But without such indicators, we do not knowmuch about what is happening to people, the environment,<strong>and</strong> the planet’s natural resource base, <strong>and</strong> wehave no effective way to measure what policies work.In effect, according to ecological <strong>and</strong> environmentaleconomists, we are trying to guide national <strong>and</strong> globaleconomies through treacherous economic <strong>and</strong> environmentalwaters at ever-increasing speeds without agood radar system.The good news is that several of these indicators areavailable. The bad news is that they are not widely used<strong>and</strong> reported. Proponents call for us to get to the pointthat every time a change in GDP is reported we alsoget information on a change in one or more environmental<strong>and</strong> social indicators.How Can We Assign Monetary Valuesto Resources Not Traded in the Marketplace?Ways to Represent NatureEconomists have developed several ways toestimate the nonmarket values of the earth’secological services.<strong>Environmental</strong> <strong>and</strong> ecological economists have developedvarious tools for estimating the values of theearth’s ecological services, as discussed earlier onp. 204.This involves estimating nonuse values not representedin market transactions. One is an existence valuebased on knowing that an old-growth forest or endangeredspecies exists, even though we may never seethem or use them. Another is aesthetic value based onputting a monetary value on a forest, species, or partof nature because of its beauty. A third type, called abequest or option value, is based on the willingness ofpeople to pay to protect some forms of natural capitalfor use by future generations.Economists have developed several ways to estimatethe monetary value of resources that cannot bepriced by conventional means. One approach is to estimatea mitigation cost of how much it would take to offsetan environmental damage. For example, howmuch would it cost to protect a forest from cutting,move an endangered species to a new habitat, or restorea statue damaged by air pollution?1996 Dollars per person35,00030,00025,00020,00015,00010,0005,00001950Per capita gross domestic product (GDP)Per capita genuine progress indicator (GPI)1960 1970 1980 1990 2000YearFigure 26-8 Comparison of the per capita gross domesticproduct (GDP) <strong>and</strong> per capita genuine progress indicator (GPI)in the United States between 1950 <strong>and</strong> 2000. (Data fromRedefining Progress, 2002)Another method is to estimate a willingness to pay byusing a survey to determine how much people would bewilling to pay to keep a particular species from becomingextinct, a particular forest from being cut down, or aspecific river or beach from being polluted. This approachis controversial because people may inflate theirestimates <strong>and</strong> not indicate the prices they would reallypay to preserve various nonuse values.How Can We Estimate the Future Valueof a Resource? Assigning Discount RatesEconomists use discount rates to estimate the futurevalue of a resource.The discount rate is an estimate of a resource’s futureeconomic value compared to its present value. It isbased on the idea that having something today may beworth more than it will be in the future. The size of thediscount rate (usually given as a percentage) is a primaryfactor affecting how a resource such as a forest orfishery is used or managed.At a zero discount rate, for example, a st<strong>and</strong> ofredwood trees worth $1 million today will still beworth $1 million 50 years from now. However, mostbusinesses, the U.S. Office of Management <strong>and</strong> Budget,<strong>and</strong> the World Bank typically use a 10% annual discountrate to evaluate how resources should be used.At this rate, the st<strong>and</strong> of redwood trees will be worthonly $10,000 in 50 years. With this discount rate, itmakes sense from an economic st<strong>and</strong>point for anowner to cut these trees down as quickly as possible<strong>and</strong> invest the money in something else.http://biology.brookscole.com/miller14591
The value of discount rates are controversial. Proponentscite several reasons for using high (5–10%)discount rates. One is that inflation may reduce thevalue of their future earnings on a resource. Another isinnovation or changes in consumer preferences couldmake a product or resource obsolete. For example, natural-lookingcomposites of wood made from plasticsmay reduce the future use <strong>and</strong> market value of renewableredwood, <strong>and</strong> wind <strong>and</strong> hydrogen may greatly reducethe economic value of nonrenewable oil in thefuture. Also resource owners argue that without a highdiscount rate, they can make more money by investingtheir capital in some other venture.Critics point out that high discount rates encouragesuch rapid exploitation of resources for immediatepayoffs <strong>and</strong> that sustainable use of most renewablenatural resources is virtually impossible. These criticsbelieve that a 0% or even a negative discount rateshould be used to protect unique <strong>and</strong> scarce resources.They also point out that moderate discount rates of1–3% would make it profitable to use nonrenewable<strong>and</strong> renewable resources more sustainably or slowly.In addition, suppose that an acceptable substitute for aresource such as redwood or oil does not becomeavailable. Then these resources could become priceless.As you can see, there are no easy ways to makesuch decisions.Economic return is not always the determiningfactor in how resources are used or managed. In somecases, farmers <strong>and</strong> owners of forests, wetl<strong>and</strong>s, <strong>and</strong>other resources use ethical concerns in determining howthey use <strong>and</strong> manage such resources. <strong>Their</strong> respect forthe l<strong>and</strong> <strong>and</strong> nature or what they believe to be their responsibilityto future generations can override theirdesire for short-term profit at the expense of long-termresource <strong>and</strong> environmental sustainability.26-4 HARMFUL EXTERNAL COSTSAND FULL-COST PRICINGWhat Are External or Indirect Costs?Hidden CostsThe direct price you pay for something does notinclude indirect environmental, health, <strong>and</strong> otherharmful costs associated with its production<strong>and</strong> use.All economic goods <strong>and</strong> services have internal or directcosts associated with producing them. For example, ifyou buy a car the direct price you pay includes thecosts of raw materials, labor, <strong>and</strong> shipping, as well as amarkup to allow the car company <strong>and</strong> its dealers someprofits. Once you buy the car you must pay additionaldirect costs for gasoline, maintenance, <strong>and</strong> repair.Making, distributing, <strong>and</strong> using any economicgood or service also involve indirect or external costs orbenefits not included in the market price <strong>and</strong> affectingpeople other than the buyer <strong>and</strong> seller. Economists callsuch costs <strong>and</strong> benefits externalities. A positive externalitybenefits someone not involved in an economictransaction. For example, if a car dealer volunteers toremove litter <strong>and</strong> debris from a stretch of highway youwill benefit even if you have never bought a car fromthe dealer.A negative externality is a harmful cost borne bysomeone not involved in an economic transaction. Forexample, extracting <strong>and</strong> processing raw materials tomake a car uses nonrenewable energy <strong>and</strong> mineral resources,produces solid <strong>and</strong> hazardous wastes, disturbsl<strong>and</strong>, <strong>and</strong> pollutes the air <strong>and</strong> water (Figure 16-13,p. 343). These external costs not included in the price ofthe car can have short- <strong>and</strong> long-term harmful effectson other people <strong>and</strong> on the earth’s life-support systems.Because these harmful external costs are not includedin the market price of a car, most people do notconnect them with car ownership. Still, the car buyer<strong>and</strong> other people in a society pay these hidden costssooner or later, in the form of poorer health, highercosts of health care <strong>and</strong> insurance, higher taxes for pollutioncontrol, traffic congestion, <strong>and</strong> l<strong>and</strong> used forhighways <strong>and</strong> parking.Similarly, in the United States, the price of gasolinewas about $1.75 per gallon (46¢ per liter) in mid-2004. But this price did not include the external costsjust listed along with lost work time while stalled intraffic jams <strong>and</strong> the harmful effects of urban sprawl(Figure 25-6, p. 567). According to a study by JohnHoltzclaw, when we include the harmful indirectcosts, American consumers are really paying about$1.80–2.25 per liter ($3–8.60 per gallon)—dependingmostly on whether the military costs of ensuring accessto Middle Eastern oil are included. And thesecosts do not include the future harmful effects on climatechange (Figure 21-13, p. 475) caused in part byCO 2 emissions from motor vehicles. In addition, theprice of lumber does not include the value of the ecologicalservices provided by intact forests (Figure 11-7,left, p. 200) or government subsidies to the timberindustry.What Is Full-Cost Pricing? Creating An<strong>Environmental</strong>ly Honest MarketIncluding external costs in market prices informsconsumers about the cost of their purchases on theearth’s life-support systems <strong>and</strong> to human health.For many economists, creating an environmentallytransparent or honest market system is a way to deal withthe harmful costs of goods <strong>and</strong> services. It requires in-592 CHAPTER 26 Economics, Environment, <strong>and</strong> <strong>Sustainability</strong>
cluding costs, as much as possible, in the market priceof any good or service, such that its price would comeas close as possible to its full cost—its actual internalcosts plus its actual external costs.This system would allow consumers to make moreinformed choices, because they would be aware of mostor all the costs involved, which is one of the major goalsof a truly free-market economy. It would likely causeconsumers to give more thought to choosing fuelefficientcars over much more expensive gas-guzzlers.Many people would probably conserve more water becauseits price would be much higher. They might alsoproduce less trash, because the cost of collecting <strong>and</strong>disposing of nonrecyclable trash would go way up.With full-cost pricing, some eco-friendly (orgreen) goods <strong>and</strong> services that now cost more wouldeventually cost less because internalizing externalcosts encourages producers to invent more resourceefficient<strong>and</strong> less-polluting methods of production,thereby cutting their production costs. Jobs would belost in environmentally harmful businesses as consumersmore often chose green products, but morejobs would be created in environmentally beneficialbusinesses. If a shift to full-cost pricing took place overseveral decades, most environmentally harmful businesseswould have time to transform themselves intoenvironmentally beneficial businesses. And consumerswould have time to adjust their purchases <strong>and</strong>buying habits to more environmentally friendly products<strong>and</strong> services.xHOW WOULD YOU VOTE? Should full-cost pricing be usedin setting the market prices of goods <strong>and</strong> services? Cast yourvote online at http://biology.brookscole.com/miller14.Full-cost pricing seems to make a lot of sense. Sowhy is it not used more widely? There are various reasons.One is that many producers of harmful <strong>and</strong>wasteful goods would have to charge more <strong>and</strong> somewould go out of business. Naturally, they oppose suchpricing.Also, it is difficult to put a price tag on many environmental<strong>and</strong> health costs. But to ecological <strong>and</strong>environmental economists, making the best possibleestimates is far better than not including such costs inwhat we pay for most goods <strong>and</strong> services.Phasing in such a system requires government action.Few if any companies will volunteer to reduceshort-term profits by becoming more environmentallyresponsible. For example, assume you own an electronicscompany <strong>and</strong> you believe that we should allpay for the pollution resulting from production of electronicsproducts. Assume also that your competitorsdo not believe this. Will you raise your prices to includethe estimated costs of that pollution, while theydo not? If you do, your customers will probably buytheir electronics from your competitors. Most consumersare looking for the best price, <strong>and</strong> by doing theright thing, you may eventually go bankrupt. So fullcostpricing has to be initiated across the market by anoutside force, namely, the government.Governments can use several strategies to encourageor force producers to work toward full-cost pricingincluding phasing out environmentally harmful subsidies,levying taxes on environmentally harmful goods<strong>and</strong> services, passing laws to regulate pollution <strong>and</strong>resource depletion, <strong>and</strong> using tradable permits for pollutionor resource use. Let us look at these <strong>and</strong> otherstrategies in more detail.26-5 WAYS TO IMPROVEENVIRONMENTAL QUALITYAND SHIFT TO FULL-COST PRICINGHow Can Ending Certain Subsidies <strong>and</strong>Tax Breaks Improve <strong>Environmental</strong> Quality<strong>and</strong> Reduce Resource Waste? Not Rewarding<strong>Environmental</strong>ly Harmful ActivitiesWe can improve environmental quality <strong>and</strong>help phase in full-cost pricing by removingenvironmentally harmful government subsidies<strong>and</strong> tax breaks.Government subsidies <strong>and</strong> tax breaks can accelerate resourcedevelopment, depletion, <strong>and</strong> degradation. Wecurrently give depletion allowances <strong>and</strong> tax breaks tomining, oil, <strong>and</strong> coal companies for getting minerals<strong>and</strong> oil out of the ground. Taxpayers subsidize the costof irrigation water for farmers <strong>and</strong> help to providesubsidies <strong>and</strong> low-cost loans to buy fishing boats.One way to encourage a shift to full-cost pricing isto phase out environmentally harmful subsidies <strong>and</strong> taxbreaks, which cost the world’s governments about$1.9 trillion a year, according to studies by NormanMyers <strong>and</strong> other analysts. This is about 4.5% of the $42trillion value of all of the goods <strong>and</strong> services producedthroughout the world in 2004 <strong>and</strong> creates a huge economicincentive for environmental destruction <strong>and</strong>degradation.On paper, phasing out such subsidies may seemlike a great idea. But it involves political decisions thatoften are opposed successfully by powerful interestsreceiving the subsidies <strong>and</strong> tax breaks. They want tokeep, <strong>and</strong> if possible increase, these benefits <strong>and</strong> oftenoppose subsidies <strong>and</strong> tax breaks for more environmentallybeneficial competitors. For example, the fossilfuel <strong>and</strong> nuclear power industries in the United States(<strong>and</strong> in most developed countries) have gotten hugegovernment subsidies compared to those for lesshttp://biology.brookscole.com/miller14593
harmful competing alternatives, such as conservation<strong>and</strong> wind power (Figure 18-34, p. 407). Removingthese harmful subsidies <strong>and</strong> tax breaks would level theeconomic playing field <strong>and</strong> promote the use of thecheapest <strong>and</strong> least environmentally harmful energyalternatives.Some countries are beginning to reduce environmentallyharmful subsidies. Japan, France, <strong>and</strong>Belgium have phased out all coal subsidies. Germanyhas cut coal subsidies in half <strong>and</strong> plans to phase themout completely by 2010. China has cut coal subsidiesby about 73% <strong>and</strong> has imposed a tax on high-sulfurcoals. Between 1997 <strong>and</strong> 2001, these two actions helpedreduce China’s coal use by 5% at a time when its economyexp<strong>and</strong>ed by one-third. Thus shifts toward fullcostpricing can reduce resource use <strong>and</strong> pollutionwhile encouraging more environmentally sustainableforms of economic growth <strong>and</strong> development.How Can Green Taxes <strong>and</strong> Fees <strong>and</strong>Tax Shifting Improve <strong>Environmental</strong>Quality <strong>and</strong> Reduce Resource Waste?Making Polluters <strong>and</strong> Consumers Pay theFull PriceTaxes <strong>and</strong> fees on pollution <strong>and</strong> resource use cantake us closer to full-cost pricing <strong>and</strong> shifting taxesfrom wages <strong>and</strong> profits to pollution <strong>and</strong> waste helpsmakes this feasible.Another way to discourage pollution <strong>and</strong> resourcewaste is to use green taxes or effluent fees to help internalizemany of the harmful environmental costs ofproduction <strong>and</strong> consumption. Higher fees can also becharged for extracting lumber <strong>and</strong> minerals from publicl<strong>and</strong>s, using water provided by governmentfinancedprojects, <strong>and</strong> using public l<strong>and</strong>s for livestockgrazing.Taxes can be levied on a per-unit basis on the releaseof pollution <strong>and</strong> hazardous or nuclear waste produced,<strong>and</strong> on the use fossil fuels, timber, <strong>and</strong> minerals.Figure 26-9 lists advantages <strong>and</strong> disadvantages of usinggreen taxes <strong>and</strong> fees.xHOW WOULD YOU VOTE? Do the advantages of greentaxes <strong>and</strong> fees outweigh the disadvantages? Cast your voteonline at http://biology.brookscole.com/miller14.To many analysts, the tax system in most countriesis backwards. It can discourage what we want moreof—jobs, income, <strong>and</strong> profit-driven innovation—<strong>and</strong>encourage what we want less of—pollution, resourcewaste, <strong>and</strong> environmental degradation. A more environmentallysustainable economic system would lowertaxes on labor, income, <strong>and</strong> wealth <strong>and</strong> raise taxes onenvironmentally harmful activities.With such a tax shift, for example, a tax on coalwould include the increased health costs of breathingpolluted air, damages from acid deposition, <strong>and</strong> estimatedcosts from climate change. Then taxes on wages<strong>and</strong> wealth could be reduced by the amount producedby the coal tax.Shifting more of the tax burden from wages <strong>and</strong>profits to pollution <strong>and</strong> waste has a number of advantages(Figure 26-10). Some 2,500 economists, includingeight Nobel Prize winners, have endorsed the conceptof tax shifting. According to N. Gregory Mankiw, whochairs the President’s Council of Economic Advisers:“Cutting income taxes while increasing gasoline taxeswould lead to more rapid economic growth, less trafficcongestion, safer roads, <strong>and</strong> reduced risk of globalwarming—all without jeopardizing long-term fiscalsolvency. This may be the closest thing to a free lunchthat economics has to offer.” Such taxes wouldalso stimulate the production <strong>and</strong> use of more fuelefficientmotor vehicles <strong>and</strong> reduce dependence on importedoil.Economists also point out that successful implementationof green taxes would require such a taxAdvantagesHelps bringabout full-costpricingProvidesincentive forbusinesses to dobetter to savemoneyCan changebehavior ofpolluters <strong>and</strong>consumers iftaxes <strong>and</strong> feesare set at a highenough levelEasilyadministered byexisting taxagenciesFairly easy todetect cheatersTrade-Offs<strong>Environmental</strong> Taxes <strong>and</strong> FeesDisadvantagesPenalizes lowincomegroupsunless safety netsare providedHard to determineoptimum level fortaxes <strong>and</strong> feesNeed to frequentlyreadjust levels,which is technically<strong>and</strong> politicallydifficultGovernments maysee this as a way ofincreasing generalrevenue instead ofusing funds toimproveenvironmentalquality <strong>and</strong> reducetaxes on income,payroll, <strong>and</strong> profitsFigure 26-9 Trade-offs: advantages <strong>and</strong> disadvantages ofusing environmental or green taxes <strong>and</strong> fees to reduce pollution<strong>and</strong> resource waste. Pick the single advantage <strong>and</strong> disadvantagethat you think are the most important.594 CHAPTER 26 Economics, Environment, <strong>and</strong> <strong>Sustainability</strong>
• Decreases depletion <strong>and</strong> degradation ofnatural resources• Improves environmental quality by full-cost pricing• Encourages pollution prevention <strong>and</strong> waste reduction• Stimulates creativity in solving environmentalproblems to avoid paying pollution taxes <strong>and</strong> therebyincreases profits• Rewards recycling <strong>and</strong> reuse• Relies more on marketplace rather than regulation forenvironmental protection• Provides jobs• Can stimulate sustainable economic development• Allows cuts in income, payroll, <strong>and</strong> sales taxesFigure 26-10 Solutions: Advantages of taxing wages <strong>and</strong>profits less <strong>and</strong> pollution <strong>and</strong> waste more. Pick the two advantagesthat you think are the most important.shift. It would have to be phased in over 15 to 20 yearsto allow businesses to plan for the future <strong>and</strong> depreciateexisting capital investments over their useful lives.And because consumption taxes place a larger burdenon the poor <strong>and</strong> lower middle-class than do incometaxes, governments would need to provide safety netsin the form of lifeline payments or credits for essentialssuch as food, fuel, <strong>and</strong> housing.Nine western European countries have begun trialversions of such tax shifting, known as environmentaltax reform. So far only a small amount of revenue hasbeen shifted by taxes on emissions of CO 2 <strong>and</strong> toxicmetals, garbage production, <strong>and</strong> vehicles entering congestedcities. But such experience shows that this ideaworks.xHOW WOULD YOU VOTE? Do you favor shifting taxes onwages <strong>and</strong> profits to pollution <strong>and</strong> waste? Cast your voteonline at http://biology.brookscole.com/miller14.How Can <strong>Environmental</strong> Laws <strong>and</strong>Regulations Improve <strong>Environmental</strong>Quality <strong>and</strong> Reduce Resource Waste?Encouraging Innovation<strong>Environmental</strong> laws <strong>and</strong> regulations work bestif they motivate companies to find innovative ways tocontrol <strong>and</strong> prevent pollution <strong>and</strong> reduce resourcewaste.Most economists agree that government interventionin the marketplace is needed to control or prevent pol-lution, reduce resource waste, <strong>and</strong> encourage full-costpricing.Regulation is a widely used form of government intervention.It involves enacting <strong>and</strong> enforcing lawsthat set pollution st<strong>and</strong>ards, regulate harmful activitiessuch as releasing toxic chemicals into the environment,<strong>and</strong> require that certain irreplaceable or slowly replenishedresources be protected from unsustainable use.Many environmentalists <strong>and</strong> business leadersagree that innovation-friendly regulations can motivatecompanies to develop eco-friendly products <strong>and</strong> processesthat can increase profits <strong>and</strong> competitiveness innational <strong>and</strong> international markets. But they also agreethat some overly costly pollution control regulationsdiscourage innovation. Some regulations are too prescriptive,for example, m<strong>and</strong>ating specific technologies.Some set compliance deadlines that are too shortto allow companies to find innovative solutions, <strong>and</strong>they discourage risk taking <strong>and</strong> experimentation.Consider the difference between the United States<strong>and</strong> Sweden concerning their regulation of the pulp<strong>and</strong> paper industries. In the 1970s, strict U.S. regulationswith short compliance deadlines forced companiesto adopt the best available end-of-pipe waterpollution treatment systems, which were costly.By contrast, in Sweden the government startedwith slightly less strict st<strong>and</strong>ards <strong>and</strong> longer compliancedeadlines but clearly indicated that tougherst<strong>and</strong>ards would follow. This more flexible <strong>and</strong> innovation-friendlyapproach gave companies time to focuson redesigning their production processes instead ofrelying mostly on waste treatment. It also spurred themto look for innovative ways to prevent pollution <strong>and</strong>improve resource productivity to meet stricter futurest<strong>and</strong>ards. They developed processes for pulping <strong>and</strong>chlorine-free bleaching processes that met the emissionst<strong>and</strong>ards, lowered operating costs, <strong>and</strong> gave them acompetitive advantage in international markets.Experience shows that an innovation-friendly regulatoryprocess emphasizes pollution prevention <strong>and</strong>waste reduction <strong>and</strong> requires industry <strong>and</strong> environmentalinterests to work together in developing realisticst<strong>and</strong>ards <strong>and</strong> timetables. It sets goals, but freesindustries to meet them in any way that works, <strong>and</strong> establishesst<strong>and</strong>ards strict enough to promote real innovation,allowing enough time for it. It also uses marketincentives such as emissions <strong>and</strong> resource-use charges<strong>and</strong> tradable pollution <strong>and</strong> resource-use permits to encouragecompliance <strong>and</strong> innovation.Finally, pollution control regulations have to bedesigned to improve environmental quality while notbeing too costly. Recall that the marginal cost for removinga specific pollutant from gases or wastewaterbeing discharged rises with each additional unit ofthat pollutant that is removed (Figure 26-7).http://biology.brookscole.com/miller14595
There are problems with the regulatory approach.One is that ecological economists, health scientists,<strong>and</strong> business leaders often disagree in theirestimates of the harmful costs of pollution. Even scientistsin the same field often have different estimatesof such costs because they lack data <strong>and</strong> hold differentassumptions.Also, many regulations are geared toward achievingoptimum levels of pollution over a large area suchas a whole state. Some critics raise environmental justicequestions about who benefits <strong>and</strong> who suffersfrom such regulations. Levels may be optimum for thestate, but not for the people living near or downwindor downriver from a polluting power plant, incinerator,or factory. They are being exposed to much higherlevels of pollution than are the majority of people inthe state. See the Guest Essay on this topic by RobertBullard on the website for this chapter.In addition, assigning monetary values to lostlives, ecosystems, <strong>and</strong> ecological services is difficult<strong>and</strong> controversial, <strong>and</strong> varies widely because of lack ofdata <strong>and</strong> different assumptions <strong>and</strong> value judgments.But assigning little or no value to such things meansthey will not be counted at all in determining optimumpollution levels.Figure 26-11 shows the evolution of several phasesof environmental management through regulation.The period between 1970 <strong>and</strong> 1985 can be viewed asthe resistance-to-change management era, during whichmany companies <strong>and</strong> government regulators developedan adversarial relationship, <strong>and</strong> companies resented<strong>and</strong> actively resisted environmental regulations(Figure 26-11, left). In addition, many government regulatorsthought they had to prescribe ways for reluctantcompanies to clean up their pollution emissions. Mostcompanies responded by hiring outside environmentalconsultants (who usually favored end-of-pipe pollutioncontrol solutions) <strong>and</strong> by using lawyers to opposeor find legal loopholes in the regulations. They also lobbiedelected officials to have environmental laws <strong>and</strong>regulations overthrown, weakened, or changed to allowfor easy compliance.By 1985, most company managers accepted environmentalregulations <strong>and</strong> continued to rely mostly onpollution control. However, they placed little emphasison trying to find innovative solutions to pollution<strong>and</strong> resource waste problems because the regulationswere too strict <strong>and</strong> the market rewards too low.In the 1990s, a growing number of company managersbegan to realize that environmental improvementis an economic <strong>and</strong> competitive opportunityinstead of a cost to be resisted. This was the beginningof the innovative management era, which environmental<strong>and</strong> business visionaries project will gothrough several phases over the next 40–50 years (Figure26-11).During this time, many consumers began buyinggreen products. Some firms also recognized that theirshareholder value depends in part on having a goodenvironmental record. A growing number of firms beganlooking for innovative <strong>and</strong> profitable ways to reduceresource use, pollution, <strong>and</strong> waste (Figure 24-5,p. 537 <strong>and</strong> Individuals Matter, p. 538). As a result, theenvironment is becoming an important component ofbusiness strategic planning. And many corporationsnow routinely issue environmental <strong>and</strong> sustainabilityreports to their stockholders.This has been stimulated by the more than $2 trillionthat exists in environmentally <strong>and</strong> sociallyscreened investment funds <strong>and</strong> environmental <strong>and</strong>sustainability concerns of shareholders, insurancecompanies, bond-ranking agencies, <strong>and</strong> managers ofstate pension funds. In 2002, for example, institutionalinvestors managing over $4.5 trillion in assets wrotethe 500 largest global corporations asking them for fulldisclosure of the emissions of climate-changing gases<strong>and</strong> their policies on reducing the risks from climatechange.Resistance-to-Change ManagementPhase 1 Phase 2Phase 3Innovation-Directed ManagementPhase 4Phase 5Phase 6Pollution control<strong>and</strong> confrontationAcceptance withoutinnovationTotal qualitymanagementLife-cyclemanagementProcessdesignmanagementTotal life qualitymanagementPollution prevention<strong>and</strong> increasedresourceproductivityProductstewardship <strong>and</strong>selling servicesinstead ofthingsCleantechnologyEcoindustrialwebs,environmentallysustainableeconomies<strong>and</strong> societiesFigure 26-11 Solutions: evolution of environmental management.596 CHAPTER 26 Economics, Environment, <strong>and</strong> <strong>Sustainability</strong>
Should We Rely More on Tradable Pollution<strong>and</strong> Resource-Use Permits? The MarketplaceCan WorkThe government can set a limit on pollutionemissions or use of a resource, give pollutionor resource use permits to users, <strong>and</strong> allow them totrade their permits in the marketplace.A market-approach is for the government to grant tradablepollution <strong>and</strong> resource-use permits. The governmentsets a limit or cap on total emissions of a pollutant oruse of a resource such as a fishery. Then it issues orauctions permits that allocate the total among manufacturersor users.A permit holder not using its entire allocation canuse it as a credit against future expansion, use it in anotherpart of its operation, or sell it to other companies.In the United States, this approach has been used to reducethe emissions of sulfur dioxide <strong>and</strong> several otherair pollutants, as discussed on p. 454. Tradable rightscan also be established among countries to help preservebiodiversity <strong>and</strong> reduce emissions of greenhousegases <strong>and</strong> other pollutants with harmful regional orglobal effects.Figure 26-12 lists advantages <strong>and</strong> disadvantagesof using tradable pollution <strong>and</strong> resource-use permits.The effectiveness of such programs depends on howhigh or low the initial cap is set <strong>and</strong> the rate at whichthe cap is reduced.xHOW WOULD YOU VOTE? Do the advantages of usingtradable pollution <strong>and</strong> resource use permits to reduce pollution<strong>and</strong> resource waste outweigh the disadvantages? Castyour vote online at http://biology.brookscole.com/miller14.How Can Eco-Labeling Improve <strong>Environmental</strong>Quality <strong>and</strong> Reduce Resource Waste?Informing ConsumersLabeling environmentally beneficial goods <strong>and</strong>resources extracted by more sustainable methodscan help consumers decide what goods <strong>and</strong> servicesto buy.We can use product eco-labeling to encourage companiesto develop green products <strong>and</strong> services <strong>and</strong> to helpconsumers select more environmentally beneficialproducts <strong>and</strong> services. Eco-labeling programs havebeen developed in Europe, Japan, Canada, <strong>and</strong> theTrade-OffsTradable <strong>Environmental</strong> PermitsAdvantagesDisadvantagesFlexibleEasy to administerEncourages pollutionprevention <strong>and</strong> wastereductionCan guaranteeachievement of capsPermit pricesdetermined by markettransactionsConfronts ethicalproblem of how muchpollution or resourcewaste is acceptableContronts problem ofhow permits should befairly distributedBig polluters <strong>and</strong> resource wasters can buy theirway outMay not reduce pollution at dirtiest plantsCan exclude small companies from buyingpermitsCaps can be too lowCaps must be gradually reduced to encourageinnovationDetermining caps is difficultMust decide who gets permits <strong>and</strong> whyAdministrative costs high with many participantsEmissions <strong>and</strong> resource wastes must bemonitoredSelf-monitoring can promote cheatingSets bad example by selling legal rights topollute or waste resourcesFigure 26-12 Trade-offs: advantages <strong>and</strong> disadvantages of using tradable pollution <strong>and</strong> resourceusepermits to reduce pollution <strong>and</strong> resource waste. Pick the single advantage <strong>and</strong> disadvantagethat you think are the most important.http://biology.brookscole.com/miller14597
Germany:Blue Angel (1978)Canada:<strong>Environmental</strong>Choice (1988)United States:Green Seal (1989)Nordic Council:White Swan (1989)European Union:Eco-label (1992)China:<strong>Environmental</strong>label (1993)Figure 26-13 Solutions: symbols used in some of the eco-labeling programs that evaluate green orenvironmentally favorable products.United States where, for example, the Green Seal labelingprogram has certified more than 300 products; seeFigure 26-13.Eco-labels are also being used to identify fishcaught by sustainable methods (certified by the MarineStewardship Council) <strong>and</strong> to certify timber produced<strong>and</strong> harvested by sustainable methods (evaluated byorganizations such as the Forestry Stewardship Council;Solutions, p. 205).26-6 REDUCING POVERTY TOIMPROVE ENVIRONMENTAL QUALITYAND HUMAN WELL-BEINGHow Is the World’s Wealth Distributed?Flowing up to the RichSince 1960, most of the financial benefits of globaleconomic growth have flowed up to the rich ratherthan down to the poor.Poverty is usually defined as the inability to meetone’s basic economic needs. According to a 2000 WorldBank study, half of humanity is trying to live on lessthan $3 (U.S.) a day <strong>and</strong> one of every five people onthe planet is struggling to survive on an income ofroughly $1 (U.S.) per day.Poverty has numerous harmful health <strong>and</strong> environmentaleffects (Figure 1-11, p. 13, <strong>and</strong> Figure 19-18,p. 429) <strong>and</strong> has been identified as one of the five majorcauses of the environmental problems we face (Figure1-10, p. 13).Most neoclassical economists believe a growingeconomy can help the poor by creating more jobs, enablingmore of the increased wealth to reach workers,<strong>and</strong> providing greater tax revenues that can be used tohelp the poor help themselves. Economists call this thetrickle-down effect.However, since 1960, most of the benefits ofglobal economic growth as measured by income haveflowed up to the rich rather than down to the poor(Figure 26-14). Since 1980, growth of this wealth gaphas increased. According to Ismail Serageldin, theplanet’s richest three people have more wealth thanthe combined GDP of the world’s 47 poorest countries<strong>and</strong> their 600 million people. In V<strong>and</strong>ana Shiva’swords, “Resources move from the poor to the rich,<strong>and</strong> pollution moves from the rich to the poor.” SouthAfrican President Thabo Mbeki told delegates at the2003 Johannesburg World Summit on SustainableDevelopment, “A global human society based onpoverty for many <strong>and</strong> prosperity for a few, characterizedby isl<strong>and</strong>s of wealth, surrounded by a sea ofpoverty, is unsustainable.”These trends do not mean that economic growthcauses poverty. Instead, they mean that for a variety ofreasons rich nations <strong>and</strong> individuals have devotedonly a small fraction of their wealth to helping reducepoverty <strong>and</strong> its harmful effects on the environment<strong>and</strong> human well-being.Poverty is also sustained by corruption, absence ofproperty rights, insufficient legal protection, <strong>and</strong> inabilityof many poor people to borrow money to growcrops or start a small business.Case Study: What Is the Role of the WorldBank in Economic Development? Controversyover Big LoansThe World Bank makes loans to developingcountries for their economic development, buta number of these loans have had harmfulenvironmental <strong>and</strong> social effects.The World Bank is the major player in global economicdevelopment. It was formed in 1945 afterWorld War II to provide loans for rebuilding Europe<strong>and</strong> Japan. In the 1950’s the focus shifted to providingloans to aid the economic development of developingcountries, provided mostly by private investors in the150 countries that jointly own the bank. Investors hopeto make a profit on the funds they put up, mostly frominterest paid on the loans. The United States providesmore of the investment capital than any other country<strong>and</strong> the presidents of the bank have all been Americans.598 CHAPTER 26 Economics, Environment, <strong>and</strong> <strong>Sustainability</strong>
Figure 26-14 Data on the global distribution of income showthat most of the world’s income has flowed up; the richest 20%of the world’s population receive more of the world’s incomethan all of the remaining 80%. Each horizontal b<strong>and</strong> in this diagramrepresents one-fifth of the world’s population. This upwardflow of global income has accelerated since 1960 <strong>and</strong> especiallysince 1980. This trend can increase environmental degradationby increasing average per capita consumption by therichest 20% of the population <strong>and</strong> causing the poorest 20% ofthe world’s people to use renewable resources faster than theyare replenished in order to survive. (Data from UN DevelopmentProgramme <strong>and</strong> Ismail Serageldin, “World Poverty <strong>and</strong>Hunger—A Challenge for Science,” Science 296 (2002): 54–58)A number of World Bank loans for large-scaledams, roads into tropical forests, <strong>and</strong> mining operationshave been environmentally destructive <strong>and</strong>controversial.Critics accuse the bank of making loans for largescaleprojects without evaluating the long-term environmental<strong>and</strong> social impacts <strong>and</strong> without requiringadequate safeguards to help reduce or eliminate harmfulenvironmental <strong>and</strong> social impacts. Critics also callfor the bank to focus more on making moderate <strong>and</strong>small-scale loans that benefit the poor directly.Another problem is that to make enough money topay the interest on their loans, many developing countriessell their mineral, timber, <strong>and</strong> other resources todeveloped counties at low prices. This depletes theirnatural capital <strong>and</strong> can eventually leave them withoutenough resources to support future economic development.Also, interest payments can deplete nationalbudgets, leaving little for health, education, <strong>and</strong> otherimportant programs.In recent years, environmentalists <strong>and</strong> representativesof the poor have staged large-scale protestsagainst such policies. In response, the bank has beguntrying to carry out more detailed reviews of the environmental<strong>and</strong> social impacts of its loans. But it remainsto be seen how such reviews will affect the bank’s lendingpolicies.How Can We Reduce Poverty? Help the PoorHelp ThemselvesWe can sharply cut poverty by forgivingthe international debts of the poorest countries<strong>and</strong> greatly increasing international aid <strong>and</strong>small individual loans to help the poor helpthemselves.Analysts point out that reducing poverty requires thegovernments of most developing countries to makepolicy changes. One is to shift more of the nationalbudget to help the rural <strong>and</strong> urban poor work theirway out of poverty. Another is to give villages <strong>and</strong> theurban poor title to common l<strong>and</strong>s <strong>and</strong> to crops <strong>and</strong>trees they plant.Encouraging sustainable forms of economicdevelopment can help reduce global poverty but analystssay that by itself this is not enough. Analysts suggestthat one way to help reduce global poverty is toforgive at least 60% of the $2.4 trillion debt that developingcountries owe to developed countries <strong>and</strong> internationallending agencies <strong>and</strong> all of the $422 billiondebt of the poorest <strong>and</strong> most heavily indebted countrieson the condition that the money saved on the debtinterest be spent on meeting basic human needs. Currently,developing countries pay almost $300 billionper year in interest to developed countries to servicethis debt. According to environmental economist JohnPeet, this inability to “service their debt assures perpetualpoverty for the poor nations, <strong>and</strong>, effectively,perpetual servitude to the rich nations.”Critics say that many countries relieved of somedebt will take on more debt, <strong>and</strong> they want assurancesthat most of the savings from debt relief are passed onto the poor in the form of titles to l<strong>and</strong>, education, jobs,<strong>and</strong> better health care.Developed countries can increase nonmilitarygovernment <strong>and</strong> private aid to developing countries,with mechanisms to assure that most of the aid goes directlyto the poor to help them become more self-reliant<strong>and</strong> to help provide social safety nets such as welfare,unemployment payments, <strong>and</strong> pension benefits thatare available in most developed countries. Developedcountries also need to mount a massive global effort tocombat malnutrition <strong>and</strong> the infectious diseases thatkill millions of people prematurely, helping perpetuatepoverty. Another approach is for lending agencies tomake small loans to poor people who want to increasetheir income (Solutions, p. 601). They should also makeinvestments in small-scale infrastructure that help thepoor such as solar cell power facilities in villages,small-scale irrigation projects, <strong>and</strong> farm-to-marketroads. Lending agencies can also make investments inhelping sustain <strong>and</strong> restore the resource bases of fisheries,forests, <strong>and</strong> small-scale agriculture that providemore than half of the world’s jobs.http://biology.brookscole.com/miller14599
Developed countries can help developing countriescreate more environmentally sustainable economies,or eco-economies. According to Robert B.Shapiro, former CEO of Monsanto, “If emergingeconomies have to relive the entire industrial revolutionwith all its waste, its energy use, <strong>and</strong> its pollution,I think it’s all over.”Finally, there is a need for both developed countries<strong>and</strong> developing countries to stabilize their populations.Many analysts also call for encouraging thepolitical <strong>and</strong> social empowerment of the poor, especiallywomen. This can be done by putting more decisionmaking at the local level <strong>and</strong> integrating humanrights with sustainable development.According to the United Nations DevelopmentProgramme (UNDP), it will cost about $50 billion ayear to provide universal access to basic services suchas education, health, nutrition, family planning, safewater, <strong>and</strong> sanitation. The UNDP notes that this is lessthan 0.1% of the world’s annual income <strong>and</strong> is only afraction of what the world devotes each year to militaryspending (Figure 26-15).World militaryU.S. militaryU.S. highwaysU.S. pet foodsU.S. EPAU.S. foreign aidU.S. cosmeticseliminatehunger <strong>and</strong>malnutritionprovide cle<strong>and</strong>rinking waterfor allprovide basichealthcarefor allprotecttropicalforestseliminateilliteracyExpenditures per year (2003)$12 billiion$8 billiion$8 billiion$8 billiionExpenditures per year needed to$8 billiion$5 billiion$12 billiion$11 billiion$19 billiion$29 billiionFigure 26-15 What should our priorities be? (Data from UnitedNations, World Health Organization, U.S. Department of Commerce,<strong>and</strong> U.S. Office of Management <strong>and</strong> Budget)$449 billiion26-7 MAKING THE TRANSITIONTO MORE ENVIRONMENTALLYSUSTAINABLE ECONOMIESHow Can We Make a Transition to anEco-Economy? Copy Nature <strong>and</strong> Use Full-CostPricingAn eco-economy copies nature’s four principlesof sustainability <strong>and</strong> environmental economicstrategies.On page 586, I listed environmental economic strategiesthat have been discussed at length in this chapter.Eco-economies will increasingly employ these strategies—environmentallysensitive economic indicators,full-cost pricing, tax shifting, <strong>and</strong> eco-labeling, amongmany others.An eco-economy mimics the processes that sustainthe earth’s natural systems (Figure 9-15, p. 174). PaulHawken <strong>and</strong> several other business leaders <strong>and</strong> economistshave suggested ways for using these guidelines<strong>and</strong> various economic tools for making the transition tomore environmentally sustainable eco-economies overthe next several decades. They echowhat has been discussed in this chapter<strong>and</strong> are summarized in Figure 26-16$956 billiion (p. 602). Hawken’s simple golden rulefor an eco-economy is this: “Leave theworld better than you found it, take no morethan you need, try not to harm life or the environment, <strong>and</strong>make amends if you do.”As we make the transition to more environmentallysustainable economies during this century, LesterR. Brown projects that some environmentally harmfulbusinesses will decline <strong>and</strong> become sunset businesses,<strong>and</strong> others that are more environmentally sustainable—eco-friendly,businesses will grow in importance.Figure 26-17 (p. 603) lists some of both types. The rightside of this figure might give you some ideas for a careerchoice. Forward-looking owners <strong>and</strong> investors insunset businesses will use their profits <strong>and</strong> capital toinvest in emerging eco-friendly businesses.Case Study: How Are Germany <strong>and</strong> theNetherl<strong>and</strong>s Working to Achieve More<strong>Environmental</strong>ly Sustainable Economies?Leading the WayGermany <strong>and</strong> the Netherl<strong>and</strong>s have dedicatedthemselves to making their economies moreenvironmentally sustainable for economic <strong>and</strong>ecological reasons.Germany <strong>and</strong> the Netherl<strong>and</strong>s are working to maketheir economies more environmentally sustainable. InGermany sales of environmental protection goods <strong>and</strong>services—already more than $600 billion per year—areprojected to rise.600 CHAPTER 26 Economics, Environment, <strong>and</strong> <strong>Sustainability</strong>
Microloans to the PoorMost of theworld’s poor wantto earn more, becomemore selfreliant,<strong>and</strong> haveSOLUTIONSa better life. Butthey have no credit record. Also,they have few if any assets to usefor collateral to secure a loan tobuy seeds <strong>and</strong> fertilizer for farmingor tools <strong>and</strong> materials for a smallbusiness.For almost three decades an innovativetool called microlending ormicrofinance has helped deal withthis problem. For example, sinceeconomist Muhammad Yunusstarted it in 1976, the Grameen (Village)Bank in Bangladesh has providedmore than $4 billion in microloans(varying from $50 to $500)to several million mostly poor,rural, <strong>and</strong> l<strong>and</strong>less women in 40,000villages. About 94% of the loans areto women who start their ownsmall businesses as sewers,weavers, bookbinders, peanut fryers,or vendors.To stimulate repayment <strong>and</strong>provide support, the GrameenBank organizes microborrowersinto five-member “solidarity”groups. If one member of the groupmisses a weekly payment or defaultson the loan, the other membersof the group must make thepayments.The Grameen Bank’s experiencehas shown that microlending isboth successful <strong>and</strong> profitable. Forexample, less than 3% of microloanrepayments to the Grameen Bankare late, <strong>and</strong> the repayment rate onits loans is 90–95%, much higherthan the repayment rate for conventionalloans by commercialbanks throughout most of theworld.About half of Grameen’s borrowersmove above the poverty linewithin 5 years, <strong>and</strong> domestic violence,divorce, <strong>and</strong> birth rates arelower among most borrowers.Microloans to the poor by theGrameen Bank are being used todevelop day-care centers, healthclinics, reforestation projects, drinkingwater supply projects, literacyprograms, <strong>and</strong> group insuranceprograms. People also use them tobring small-scale solar <strong>and</strong> windpower systems to rural villages.Grameen’s model has inspiredthe development of microcreditprojects in more than 58 countriesthat have reached 36 million people(including dependents), <strong>and</strong> thenumber is growing rapidly.Critical ThinkingWhy do you think there has beenlittle use of microloans by internationaldevelopment <strong>and</strong> lendingagencies such as the World Bank<strong>and</strong> the International MonetaryFund? How might this situation bechanged?Mostly because of stricter air pollution regulations,German companies have developed some ofthe world’s cleanest <strong>and</strong> most efficient gas turbines<strong>and</strong> invented the world’s first steel mill that uses nocoal. Germany sells these <strong>and</strong> other improved environmentaltechnologies globally. Germany is alsoone of the world’s leading manufacturers of windturbines.In 1977, the German government started the BlueAngel eco-labeling program to inform consumers aboutproducts that cause the least environmental harm (Figure26-13). Most international companies use theGerman market to test <strong>and</strong> evaluate green products.German car companies, as part of a recycling revolution,are required to pick up <strong>and</strong> recycle all domesticcars they make, <strong>and</strong> such take-back requirements are beingextended to almost all products to reduce use of energy<strong>and</strong> virgin raw materials. Germany is selling theserecycling technologies to other countries.Germany’s government has supported research<strong>and</strong> development aimed at making it the world’sleader in solar-cell <strong>and</strong> wind turbine technology <strong>and</strong>hydrogen fuel.Finally, Germany provides about $1 billion peryear in green foreign aid to developing countries,much of it is designed to stimulate dem<strong>and</strong> for Germantechnologies <strong>and</strong> products.In 1989, the Netherl<strong>and</strong>s—a tiny country withabout 16 million people—began implementing aNational <strong>Environmental</strong> Policy Plan, or Green Plan, asa result of widespread public alarm over decliningenvironmental quality. The goal is to slash productionof many types of pollution by 70–90% <strong>and</strong> achieve theworld’s first environmentally sustainable economy,ideally within a few decades.The government began by identifying eight majorareas for improvement: climate change, acid deposition,eutrophication, toxic chemicals, waste disposal,groundwater depletion, unsustainable use of renewable<strong>and</strong> nonrenewable resources, <strong>and</strong> local nuisances(mostly noise <strong>and</strong> odor pollution).Then the government formed task forces consistingof people in industry, government, <strong>and</strong> citizens’groups for each of the eight areas, asking each task forceto agree on targets <strong>and</strong> timetables for drastically reducingpollution. Each group was free to pursue whateverpolicies or technologies it wanted, but if a group couldnot agree, the government would impose its own targets<strong>and</strong> timetables <strong>and</strong> stiff penalties for industries notmeeting certain pollution reduction goals.Each task force focused on four general themes.(1) life-cycle management (Figure 26-11, right); (2) energyefficiency, with the government committing $385million per year to energy conservation programs;http://biology.brookscole.com/miller14601
Figure 26-16 Solutions: principles forshifting to more environmentally sustainableeconomies or eco-economies duringthis century.EconomicsReward (subsidize) earthsustainingbehaviorPenalize (tax <strong>and</strong> do notsubsidize) earthdegradingbehaviorShift taxes from wages<strong>and</strong> profits to pollution <strong>and</strong>wasteUse full-cost pricingSell more services insteadof more thingsDo not deplete naturalcapital<strong>Environmental</strong>lySustainableEconomy(Eco-Economy)Resource Use<strong>and</strong> PollutionReduce resource use<strong>and</strong> waste by refusing,reducing, reusing, <strong>and</strong>recyclingImprove energyefficiencyRely more onrenewable solar <strong>and</strong>geothermal energyShift from a carbonbased(fossil fuel)economy to arenewable fuel–basedeconomyLive off income fromnatural capitalReduce povertyEcology <strong>and</strong>PopulationUse environmentalindicators to measureprogressMimic naturePreserve biodiversityCertify sustainablepractices <strong>and</strong> productsRepair ecologicaldamageUse eco-labels onproductsStabilize population byreducing fertility(3) environmentally sustainable technologies, alsosupported by a government program; <strong>and</strong> (4) improvingpublic awareness through a massive governmentsponsoredpublic education program.Many of the country’s leading industrialists likethe Green Plan becaue they can make investments inpollution prevention <strong>and</strong> pollution control with lessfinancial risk <strong>and</strong> a high degree of certainty aboutlong-term environmental policy. And they are free todeal with the problems in ways that make the mostsense for their businesses. Industrial leaders have alsolearned that creating more efficient <strong>and</strong> environmentallysound products <strong>and</strong> processes often reducescosts <strong>and</strong> increases profits as they are sold at home<strong>and</strong> abroad.The Netherl<strong>and</strong>s plan is the first attempt by anycountry to foster a national debate on the issue of environmentalsustainability <strong>and</strong> to encourage innovativesolutions to environmental problems. Is the planworking? There is a long way to go, but the news isencouraging. Most of the target groups have met or exceededtheir goals on schedule. A huge amount of environmentalresearch by the government <strong>and</strong> privatesector has taken place. This has led to an increase in organicagriculture, greater reliance on bicycles in somecities, <strong>and</strong> more ecologically sound new housing developments.But some of the more ambitious goalssuch as decreasing CO 2 levels may have to be reviseddownward or even ab<strong>and</strong>oned.Shifting to eco-economies over the next severaldecades this will require bold leadership by businessleaders <strong>and</strong> elected officials <strong>and</strong> bottom-up politicalpressure from concerned citizens. Forward-looking investors,corporate executives, <strong>and</strong> political leaders arerecognizing that the environmental revolution is also aneconomic revolution.Converting the economy of the 21st century into one that isenvironmentally sustainable represents the greatest investmentopportunity in history.LESTER R. BROWN AND CHRISTOPHER FLAVINCRITICAL THINKING1. Should we attempt to maximize economic growthby producing <strong>and</strong> consuming more <strong>and</strong> more economicgoods <strong>and</strong> services? Explain. What are thealternatives?602 CHAPTER 26 Economics, Environment, <strong>and</strong> <strong>Sustainability</strong>
Sunset BusinessesCoal miningOil productionNuclear powerEnergy-wasting motorvehiclesMiningThrowaway productsClear-cut loggingPaper productionConventional pesticideproductionUnsustainable farmingWater well drillingConventional economicsConventional engineering,design, <strong>and</strong> architectureBusiness travel<strong>Environmental</strong>lySustainableEconomy(Eco-Economy)Solar-cell productionHydrogen productionFuel-cell productionWind turbine productionWind farm constructionGeothermal energyproductionProduction of energyefficientfuel-cell cars,trucks, <strong>and</strong> busesConventional <strong>and</strong> electricbicycle productionLight-rail constructionSustainable agricultureIntegrated pestmanagementAquacultureRecycling, reuse, <strong>and</strong>compostingSustainable forestryEco-Friendly BusinessesSoil conservationWater conservationPollution preventionEcoindustrial designBiodiversitymanagement <strong>and</strong>protectionEcological restorationDisease prevention<strong>Environmental</strong>engineering, design,<strong>and</strong> architectureEcocity urban design<strong>Environmental</strong> science<strong>Environmental</strong> educationEcological economics<strong>Environmental</strong>accountingTeleconferencingFigure 26-17The projecteddecline of environmentallyharmful, or sunset,businesses<strong>and</strong> rise of moreenvironmentallysustainable, oreco-friendly,businesses duringthis century.As this transitiontakesplace, jobs willdecrease insunset businesses(left)<strong>and</strong> increase ineco-friendlybusinesses(right). (Datafrom Lester R.Brown, EarthPolicy Institute)2. According to one definition, sustainable developmentinvolves meeting the needs of the present human generationwithout compromising the ability of future generationsto meet their needs, as discussed in Chapter 1. Whatdo you believe are the needs referred to in this definition?Compare this definition with the definition of environmentallysustainable economic development given inFigure 26-5, p. 588.3. Suppose that over the next 20 years the current harmfulenvironmental <strong>and</strong> health costs of goods <strong>and</strong> servicesare internalized so that their market prices reflect theirtotal costs. What harmful <strong>and</strong> beneficial effects mightsuch full-cost pricing have on your lifestyle?4. Explain why you agree or disagree with the proposalsthat various analysts have made for sharply reducingpoverty, as discussed on pages 599–600, Which two ofthese proposals do you believe are the most important?5. Explain why you agree or disagree with each of themajor principles for shifting to a more environmentallysustainable economy listed in Figure 26-16, p. 602. Whichthree do you believe are the most important?6. Congratulations! You are in charge of the world. Listyour five most important actions for shifting to ecoeconomiesover the next 50 years.PROJECTS1. List all the economic goods you use, <strong>and</strong> then identifythose that meet your basic needs <strong>and</strong> those that satisfyyour wants. Identify any economic wants you (a) wouldbe willing to give up, (b) you believe you should give upbut are unwilling to, <strong>and</strong> (c) hope to give up in the future.Relate the results of this analysis to your personal impacton the environment. Compare your results with those ofyour classmates.2. Pick one of the suggestions listed under “Eco-FriendlyBusiness” in Figure 26-17 (above) <strong>and</strong> develop a businessplan for a company that would provide the service youselected. For example, assume you’ll go into the businessof ecological restoration <strong>and</strong> describe: (a) your service,(b) your customers, (c) your mission statement, <strong>and</strong>(d) your strategy for promoting the business.3. Pick a regulation in the state or country where youlive (such as a water pollution law or regulation) <strong>and</strong> examinehow it affects businesses <strong>and</strong> other organizations.Determine whether it is an innovation-friendly regulation<strong>and</strong> explain why or why not. If not, how could it bemade more innovation-friendly?4. Interview officials at a company in your town or regionto get their views on one or more environmentalhttp://biology.brookscole.com/miller14603
egulations affecting their industry. Describe the effectsof that regulation on the company <strong>and</strong> the company’s approachtoward dealing with it.5. Use the library or the Internet to find bibliographic informationabout Gaylord Nelson, Lester R. Brown, <strong>and</strong>Christopher Flavin, whose quotes appear at the beginning<strong>and</strong> end of this chapter.6. Make a concept map of this chapter’s major ideas, usingthe section heads, subheads, <strong>and</strong> key terms (in boldfacetype). Look on the website for this book for informationabout making concept maps.LEARNING ONLINEThe website for this book contains study aids <strong>and</strong> manyideas for further reading <strong>and</strong> research. They include achapter summary, review questions for the entire chapter,flash cards for key terms <strong>and</strong> concepts, a multiple-choicepractice quiz, interesting Internet sites, references, <strong>and</strong> aguide for accessing thous<strong>and</strong>s of InfoTrac ® College Editionarticles. Log on tohttp://biology.brookscole.com/miller14Then click on the Chapter-by-Chapter area, choose Chapter26, <strong>and</strong> select a learning resource.604 CHAPTER 26 Economics, Environment, <strong>and</strong> <strong>Sustainability</strong>
27 <strong>and</strong>Politics, Environment,<strong>Sustainability</strong>CASE STUDYRescuing a RiverIn the 1960s, Marion Stoddart (Figure 27-1) movedto Groton, Massachusetts, on the Nashua River, thenconsidered one of the nation’s filthiest rivers. Fordecades, industries <strong>and</strong> towns along the river hadused it as a dump. Dead fish bobbed on its waves, <strong>and</strong>at times the water was red, green, or blue from pigmentsdischarged by paper mills.Instead of thinking nothing could be done, Stoddartcommitted herself to restoring the Nashua <strong>and</strong>establishing public parkl<strong>and</strong>s along its banks.She did not start by filing lawsuits or organizingdemonstrations. Instead she created a careful cleanupplan <strong>and</strong> approached state officials with her ideas.They laughed, but she was not discouraged <strong>and</strong> beganpracticing the most time-honored skill of politics: oneon-onepersuasion. She identified power brokers inthe riverside communities <strong>and</strong> began to educate them,win them over, <strong>and</strong> get them to cooperate in cleaningup the river.She also got the state to ban open dumping inthe river. When federal matching funds promisedfor building a treatment plant failed to materialize,Stoddart gathered 13,000 signatures on a petition sentto President Richard Nixon. The funds arrived in ahurry.Stoddart’s next success was getting a federalgrant to beautify the river. She hired high schooldropouts to clear away mounds of debris. When theriver cleanup was completed, she persuaded communitiesalong the river to create a riverside park <strong>and</strong>woodl<strong>and</strong>s along both banks.Now, four decades later, the Nashua is still clean.Several new water treatment plants have been built,<strong>and</strong> a citizens’ group founded by Stoddart keepswatch on water quality. The river supports manykinds of fish <strong>and</strong> other wildlife, <strong>and</strong> its waters areused for canoeing <strong>and</strong> recreation. The project is testimonyto what a committed individual can do to bringabout change from the bottom up by getting people towork together. For her efforts, the UN EnvironmentProgramme named Stoddart an outst<strong>and</strong>ing worldwideworker for the environment.Politics is the process by whichindividuals <strong>and</strong> groups try to influenceor control the policies <strong>and</strong> actionsof governments at local, state,national, <strong>and</strong> international levels.Politics is concerned with who haspower over the distribution of resources<strong>and</strong> who gets what, when,<strong>and</strong> how. Many people think of politicsin national terms, but what directlyaffects most people is whathappens in their local community.© Seth ResnickFigure 27-1 Individuals matter: MarionStoddart canoeing on the Nashua River nearGroton, Massachusetts. She spent morethan two decades spearheading successfulefforts to have this river cleaned up.
Politics is the art of making good decisions on insufficientevidence.LORD KENNETThis chapter discusses how we can use politics to promoteenvironmental quality <strong>and</strong> sustainability. It addressesthe following questions:■■■■■■What major environmental <strong>and</strong> political challengesdo we face in this century?How do democracies work, <strong>and</strong> what factorshinder the ability of democracies to deal withenvironmental problems?How do we influence, develop, <strong>and</strong> implementenvironmental policy?What is the role of environmental law in dealingwith environmental problems?What are the major types <strong>and</strong> roles of environmentalgroups <strong>and</strong> their opponents?What types of global environmental policies <strong>and</strong>treaties exist, <strong>and</strong> how might they be improved?27-1 ENVIRONMENTALAND POLITICAL CHALLENGESFOR THIS CENTURYWhat Changes in <strong>Environmental</strong> Awareness<strong>and</strong> Focus Have Taken Place: Some MajorShiftsThere have been seven shifts in the way we view<strong>and</strong> deal with environmental problems.This chapter examines the strengths <strong>and</strong> weaknessesof political systems in dealing environmental problems.Before doing this we need to underst<strong>and</strong> the natureof the environmental problems we face in terms ofnations <strong>and</strong> the international community of nations.Since the 1970s there have been seven shifts in thetypes <strong>and</strong> focus of the environmental problems weface. One is increasing concern about the harmful effectsof human activities on biodiversity <strong>and</strong> other forms of naturalcapital that support all life <strong>and</strong> economies. This isleading to increased emphasis on protecting <strong>and</strong>restoring entire ecosystems instead of focusing primarilyon keeping individual species from becomingprematurely extinct. To be effective this will require internationalcooperative efforts.A second is a shift from local to regional <strong>and</strong> globalconcerns about emissions of air <strong>and</strong> water pollutantsthat can be transported from one region or country toanother. One example is a significant increase in emissionsof sulfur <strong>and</strong> nitrogen compounds, especially inAsia, that can blanket large regions with smog <strong>and</strong>harmful <strong>and</strong> acid forming chemicals. Another exampleis rising levels of carbon dioxide in the atmospherefrom burning fossil fuels <strong>and</strong> clearing forests that canaffect regional <strong>and</strong> global climate patterns. A third exampleis rising levels of nitrogen compounds in the atmosphere<strong>and</strong> aquatic systems because of emissions ofgaseous nitrogen compounds by power plants <strong>and</strong>motor vehicles <strong>and</strong> rapidly growing runoff of nitrogenfertilizers from cropl<strong>and</strong> <strong>and</strong> urban l<strong>and</strong> into rivers,lakes, <strong>and</strong> coastal waters.A third shift involves growing concern over thethreat of climate change <strong>and</strong> its potential to disrupt ecological,economic, <strong>and</strong> political systems. Many analystsconsider this threat <strong>and</strong> the related problem of biodiversityloss to be the two most important environmentalproblems we face.A four shift is a growing awareness of the pollutionproblems of developing countries—especially those in theheavily populated urban areas of China, India, Mexico,<strong>and</strong> Brazil—that are undergoing rapid industrialization<strong>and</strong> economic growth. Many people in thesecountries now have some of the world’s highest levelsof exposure to tiny particles in indoor <strong>and</strong> outdoor air,lead (mostly from burning leaded gasoline), <strong>and</strong> exposureto infectious organisms in drinking water. A fifth<strong>and</strong> related shift is a growing awareness of the harmful effectsof poverty on the environment <strong>and</strong> human health (p. 13).Sixth is increasing concern about possible effects oftrace amounts of some synthetic organic (carbon-based)chemicals on human health <strong>and</strong> wildlife. Examples arepesticides, plastics, industrial chemicals, drugs, <strong>and</strong>food additives. We know little about the potentiallyharmful environmental <strong>and</strong> health effects of traceamounts of such chemicals.So far our approach has been to assume that suchchemicals are innocent until shown to be harmful.Now there is a shift, led by the European Union, tohave nations <strong>and</strong> the international community assumethat such chemicals are potentially harmful untilshown to be harmless. This leads to increased emphasison preventing pollutants from reaching the environmentinstead of trying to clean them up after theyhave been dispersed into the environment.The seventh shift involves relying more on the internationalcommunity to deal with environmental problems inan increasingly globalized world <strong>and</strong> economy. So far wehave not been very effective in bringing about this importantshift.In the 1970s the United States led the world in recognizing<strong>and</strong> dealing with local <strong>and</strong> national environmentalproblems. However, since then it has given upa leadership position in dealing with the increasinglyurgent regional <strong>and</strong> global environmental problemswe face. <strong>Environmental</strong> leadership is now comingmostly from the nations of the European Union. However,major nations such as the United States, China,<strong>and</strong> India will have to assume leadership positions forglobal environmental efforts to succeed. This will requirecooperative efforts among government, busi-606 CHAPTER 27 Politics, Environment, <strong>and</strong> <strong>Sustainability</strong>
ness, <strong>and</strong> environmental leaders <strong>and</strong> bottom-up politicalpressure from individual citizens <strong>and</strong> environmentalorganizations.27-2 DEALING WITHENVIRONMENTAL PROBLEMSIN DEMOCRACIESWhat Is a Democracy, <strong>and</strong> HowDo Democratic Governments Work?Government By <strong>and</strong> For the PeopleIn a democracy people elect others to govern,<strong>and</strong> can freely express their opinions <strong>and</strong>beliefs.Democracy is government by the people throughelected officials <strong>and</strong> representatives. In a constitutionaldemocracy, a constitution provides the basis of governmentauthority, limits government power by m<strong>and</strong>atingfree elections, <strong>and</strong> guarantees free speech.Political institutions in constitutional democraciesare designed to allow gradual change to ensure economic<strong>and</strong> political stability. In the United States, forexample, rapid <strong>and</strong> destabilizing change is curbed bya system of checks <strong>and</strong> balances that distributes poweramong the three branches of government—legislative,executive, <strong>and</strong> judicial—<strong>and</strong> among federal, state, <strong>and</strong>local governments.In passing laws, developing budgets, <strong>and</strong> formulatingregulations, elected <strong>and</strong> appointed governmentofficials must deal with pressure from many competingspecial-interest groups. Each group advocates passinglaws, providing subsidies or tax breaks, or establishingregulations favorable to its cause <strong>and</strong> weakening or repealinglaws, subsidies, taxes, <strong>and</strong> regulations unfavorableto its position.Some special-interest groups, such as corporations,are profit-making organizations, <strong>and</strong> others are nonprofitnongovernmental organizations (NGOs). Examples ofNGOs are labor unions <strong>and</strong> major <strong>and</strong> grassroots environmentalorganizations.What Factors Hinder the Ability ofDemocracies to Deal with <strong>Environmental</strong><strong>Problems</strong>? A Short-Term OutlookDemocracies are designed to deal mostly withshort-term, isolated problems.The deliberate design of democracies to promote stabilityis highly desirable. But several related features ofdemocratic governments hinder their ability to dealwith environmental problems. One is a tendency to reactto short-term, isolated environmental problems, insteadof regarding them as parts of a whole <strong>and</strong> actingto prevent them from occurring. Many important environmentalproblems such as climate change, biodiversityloss, <strong>and</strong> long-lived hazardous waste have longrangeeffects, are related to one another, <strong>and</strong> require integratedlong-term solutions emphasizing prevention.But because elections are held every few years,most politicians seeking re-election are compelled tofocus on short-term, isolated problems rather than oncomplex, interrelated, time-consuming, <strong>and</strong> long-termproblems.Most politicians will no longer be in office whenharmful long-term effects from environmental problemsappear. And there is no powerful political constituencyrepresenting future generations or long-termenvironmental sustainability.Another problem is that most elected officialsmust spend much of their time raising money to getreelected—leaving them too little time for dealing withreal issues. Finally, too many political leaders do notunderst<strong>and</strong> how the earth’s natural systems work <strong>and</strong>how they support all life, economies, <strong>and</strong> societies.This lack of ecological literacy is dangerous in thesetimes when we are moving through treacherous ecologicalwaters at an increasing speed.27-3 DEVELOPING, INFLUENCING,AND IMPLEMENTING ENVIRONMENTALPOLICYWhat Principles Can Guide Us in Making<strong>Environmental</strong> Policy Decisions? PrinciplesAre ImportantSeveral principles can guide us in makingenvironmental decisions.An environmental policy consists of laws, rules, <strong>and</strong>regulations related to an environmental problem thatare developed, implemented, <strong>and</strong> enforced by a particulargovernment agency. Analysts have suggested thatlegislators <strong>and</strong> individuals evaluating existing or proposedenvironmental policy should be guided by severalprinciples:■ The humility principle: Our underst<strong>and</strong>ing of nature<strong>and</strong> of the consequences of our actions is quite limited.■ The reversibility principle: Try not to do somethingthat cannot be reversed later if the decision turns outto be wrong. For example, most biologists believe thecurrent large-scale destruction <strong>and</strong> degradation offorests, wetl<strong>and</strong>s, wild species, <strong>and</strong> other componentsof the earth’s biodiversity is irreversible on a humantime scale.■ The precautionary principle: When much evidenceindicates that an activity threatens human health orthe environment, take measures to prevent or reduceharm, even if some of the cause-<strong>and</strong>-effect relationshipsare not fully established scientifically. In suchcases, it is better to be safe than sorry.http://biology.brookscole.com/miller14607
■ The prevention principle: Whenever possible, makedecisions that help prevent a problem from occurringor becoming worse.■ The polluter pays principle: Develop regulations <strong>and</strong>use economic tools such as full-cost pricing to insurethat polluters bear the cost of the pollutants <strong>and</strong>wastes they produce.■ The integrative principle: Make decisions that involveintegrated solutions to environmental <strong>and</strong> otherproblems.■ The public participation principle: Citizens shouldhave open access to environmental data <strong>and</strong> information<strong>and</strong> the right to participate in developing, criticizing,<strong>and</strong> modifying environmental policies.■ The human rights principle: All people have a rightto an environment that does not harm their health <strong>and</strong>well-being.■ The environmental justice principle: Establish environmentalpolicy so that no group of people bears anunfair share of the harmful environmental risks fromindustrial, municipal, <strong>and</strong> commercial operations orfrom the execution of environmental laws, regulations,<strong>and</strong> policies. <strong>Environmental</strong> justice, as discussedin Chapter 26, means that every person isentitled to protection from environmental hazards regardlessof race, gender, age, national origin, income,social class, or any other factor. See the Guest Essay onthis subject by Robert D. Bullard in the website for thischapter.How Can Individuals Affect <strong>Environmental</strong>Policy? All Politics Is LocalMost improvements in environmental qualityare the result of millions of citizens putting pressureon elected officials <strong>and</strong> of individuals developinginnovative solutions to environmental problems.A major theme of this book is that individuals matter.History shows that significant social change usuallycomes from the bottom up when individuals join withothers to bring about change. Without grassroots politicalaction by millions of individual citizens <strong>and</strong> organizedgroups, the air you breathe <strong>and</strong> the water youdrink today would be much more polluted, <strong>and</strong> muchmore of the earth’s biodiversity would have disappeared.Figure 27-2 lists ways you can influence <strong>and</strong>change government policies in constitutional democracies.Which, if any, of these things do you do?In developed countries many people devote muchof their lives to acquiring more things instead of participatingin building more just <strong>and</strong> sustainable communities.In the United States, only a small percentageof people vote or participate in political campaigns<strong>and</strong> elections.Influencing <strong>Environmental</strong> Policy• Become informed on issues• Run for office (especially at local level)• Make your views known at public hearings• Make your views known to elected representatives• Contribute money <strong>and</strong> time to c<strong>and</strong>idates for office• VoteWhat Can You Do?• Form or join nongovernment organizations (NGOs)seeking change• Support reform of election campaign financingFigure 27-2 What can you do? Ways you can influence environmentalpolicy.In addition, an increasing number of Americans<strong>and</strong> citizens of some other countries are too busy, tired,distracted, or cynical to participate in helping maketheir communities better places to live. Instead of becominginvolved in their communities <strong>and</strong> helping developenvironmental policies, many believe they canperform their environmental duty by recycling, buyingenvironmentally friendly products, planting a tree,composting, eating organic food, buying shade-growncoffee, driving a fuel-efficient vehicle, <strong>and</strong> perhapsmailing a check to an environmental organization.These are important <strong>and</strong> responsible activities thathelp the environment But in order to influence environmentalpolicy people need to actively work togetherto improve communities <strong>and</strong> neighborhoods, asthe citizens of Chattanooga, Tennessee (p. 581) <strong>and</strong>Curitiba, Brazil (p. 563) have done These <strong>and</strong> othercases have demonstrated the validity of the insight ofAldo Leopold: “All ethics rest upon a single premise:that the individual is a member of a community of interdependentparts.” Thus what we do at the locallevel has global implications—much like dropping apebble in a lake <strong>and</strong> watching the resulting ripplesspread outward. This is the meaning of the slogan,“Think globally <strong>and</strong> act locally.”Case Study: What Is <strong>Environmental</strong>Leadership? An Option for Each of Us<strong>Environmental</strong> leaders provide vision, focus,resources, <strong>and</strong> other types of support to peoplewho want to make changes to environmental policies,<strong>and</strong> each of us can play a leadership role.608 CHAPTER 27 Politics, Environment, <strong>and</strong> <strong>Sustainability</strong>
Leaders are persons whom other people choose to followbecause of their vision, credibility, courage, orcharisma. Good leaders help people to focus their energy,to set goals, <strong>and</strong> to pursue those goals efficiently.And leaders often provide the resources <strong>and</strong> moralsupport that people need to keep going when theirgoals seem to be slipping away. So if a group wants toinfluence environmental policy, an energetic leader isindispensable.History judges political leaders by whether <strong>and</strong>how they respond to the great issues of their day. Today’spolitical leaders face climate change, loss of biodiversity,poverty, <strong>and</strong> other related environmentalproblems.One such politician, Prime Minister Tony Blair ofthe United Kingdom, believes that environmentaldegradation is the key issue for this generation <strong>and</strong> that“climate change is unquestionably the most urgentenvironmental challenge.” He calls for the UnitedKingdom <strong>and</strong> other nations of the world to reduce carbondioxide emissions by 60% by 2050 <strong>and</strong> for a “newinternational consensus to protect the environment <strong>and</strong>combat the devastating impacts of climate change.”Solutions to global environmental problems willrequire leadership from the United States, the world’swealthiest <strong>and</strong> most powerful society. However, insteadof leading us toward solutions, the majority ofelected U.S. officials are leading a charge in the oppositedirection. They are weakening environmentallaws, withdrawing from international efforts to dealwith climate change, weakening national <strong>and</strong> internationalbiodiversity protection, lowering nonmilitaryforeign aid for fighting poverty, <strong>and</strong> encouraging theuse of fossil fuels, instead of increasing energy conservation<strong>and</strong> relying much more on renewable energyresources.According to a 2004 article by environmental writerBill McKibben, “It is odd for American environmentaliststo ...realize that we no longer play a leading role ofany kind. If you spend much time at international conferences,you see that we are no more the center of gravity,the fount of new ideas. Long before President Bushditched the Kyoto treaty, we were drifting toward theback of the pack.”Since 1980, the United States has been mired in thepolitics of confrontation, polarization, <strong>and</strong> deadlockon environmental <strong>and</strong> many other major issues. Thereare many reasons for this situation, but many analystssay that one is a lack of vision <strong>and</strong> leadership.The United States is also losing out as a leader inthe development <strong>and</strong> sales of key environmental technologies.According to a 2004 column by Thomas L.Friedman, the United States is beginning to lose itscompetitive <strong>and</strong> innovative edge in science <strong>and</strong> technologyto Japan <strong>and</strong> several western European nations<strong>and</strong> possibly in the near future to the rapidly developingcountries of China <strong>and</strong> India. He points out that“the percentage of Americans graduating with bachelor’sdegrees in science <strong>and</strong> engineering is less thanhalf of the comparable percentage in China <strong>and</strong> Japan,<strong>and</strong> that U.S. government investments are lagging inphysics, chemistry, <strong>and</strong> engineering.”Before 1980, the United States was on the cuttingedge of developing promising environmental technologiessuch as wind turbines, solar cells, <strong>and</strong> fuel-efficientcars. This began changing when in 1980 Congress guttedresearch <strong>and</strong> development support for these <strong>and</strong>other promising environmental technologies.Now Denmark has taken over as the leader in developing<strong>and</strong> selling wind turbines <strong>and</strong> Germany <strong>and</strong>Japan have become leaders in the development of solarcells. Japan, led by Toyota Motor Company, has becomethe global leader in the development of hybridmotor vehicles. In 2004, investment analysts warnedthat because of a lack of sufficient government R & D<strong>and</strong> tax breaks, the United States may loose the race todominate the development <strong>and</strong> sales of hydrogenpoweredfuel cells. Canada, Japan, <strong>and</strong> the EuropeanUnion are each devoting more money on fuel-cell <strong>and</strong>hydrogen research than the United States. Go to partsof western Europe <strong>and</strong> you will see many examples ofgreen architecture <strong>and</strong> increasingly green <strong>and</strong> livablecities <strong>and</strong> downtowns—ideas that are just beginningto receive some attention in the United States. As thesaying goes, “you snooze, you lose.”According to some critics, much of this failure ofvision <strong>and</strong> leadership on the part of the United States isthe result of the immense political power of the country’scoal, oil, nuclear power, mining, <strong>and</strong> automobileindustries. For decades these mature <strong>and</strong> profitable industrieshave received huge taxpayer-financed governmentsubsidies <strong>and</strong> tax breaks <strong>and</strong> have succeededin preventing other more environmentally sustainablebusinesses from receiving similar levels of governmentsupport (Figure 18-34, p. 407). In economics <strong>and</strong> politics,you get more of what you reward.Some scientists warn of a dangerous trend in theUnited States involving suppressing, discrediting, oraltering scientific facts <strong>and</strong> falsely labeling ideas acceptedas sound science as junk science. On February18, 2004, more than 60 scientists, including severalNobel laureates, released a statement accusing the Bushadministration of deliberately distorting scientific fact“for partisan political ends.” These <strong>and</strong> other scientistswarn that the integrity of the government scientific advisoryprocess is being undermined by suppressingstudies not favorable to political goals, replacing scientificadvisory committees with members more partial toindustry positions, selectively gutting research budgetsfor studies that might produce results undermining politicalgoals, <strong>and</strong> firing or transferring government scientistswho speak out or release scientific informationhttp://biology.brookscole.com/miller14609
unfavorable to the administration’s political goals. Administrativeofficials deny such charges.The way out of this quagmire, some analysts say,is for individuals to work together to elect ecologicallyliterate officials who will provide environmental leadershipfor the United States <strong>and</strong> the world. Thus leadershipat the grassroots level is perhaps the key tosolving a leadership crisis at higher levels.Each of us can provide leadership on environmentalor other issues in three ways. One is to lead by example,using our own lifestyles <strong>and</strong> beliefs to demonstratethat change is possible <strong>and</strong> beneficial.A second approach is to work within existing economic<strong>and</strong> political systems to bring about environmentalimprovement. We can influence political decisions bycampaigning <strong>and</strong> voting for c<strong>and</strong>idates <strong>and</strong> by communicatingwith elected officials. We can also send amessage to companies making harmful environmentproducts or policies by voting with our wallets <strong>and</strong> lettingthem know what we have done. You would besurprised at how few consumer complaints it takes fora company to change its ways because of a fear of havinga bad public image. We can also work within thesystem by choosing environmental careers (IndividualsMatter, below).A third form of environmental leadership is to runfor a local office. Look in the mirror. Maybe you are onewho can make a difference as an office holder.A fourth form involves proposing <strong>and</strong> working forbetter solutions to environmental problems. Leadership ismore than being against something. It also involvescoming up with alternatives <strong>and</strong> getting people to worktogether to achieve them, especially in today’s oftenhostilepolitical climate.Solutions: Election Finance Reform in theUnited States: Taking the Government BackDrastic reform of the election financing systemcan reduce the influence of special-interest moneyin elections in the United States.It should come as no surprise that in the U.S. politicalsystem (<strong>and</strong> those in most other democratic countries),people with money <strong>and</strong> power have greatest influencein deciding who gets elected, what causes they supportafter being elected, <strong>and</strong> whether they get reelected.Most analysts <strong>and</strong> about 80% of citizens polledagree that the U.S. political system is based more onmoney than on citizens’ votes <strong>and</strong> concerns. This isone reason that voter turnout for federal elections inthe United States dropped from 74% in 1900 to 49% in2000. And many people who do vote often feel theyare simply choosing the lesser of two evils.According to social analyst Paul H. Ray, surveyupon survey shows that over 70% of U.S. voters areunhappy with the country’s system for financing elections.This explains why a growing number of peopleof all political persuasions see drastic election finance reformas the single most important way to reduce theinfluence of special-interest money in local, state, <strong>and</strong>federal elections in the United States. They urgeAmerican citizens to focus their efforts on this crucialEnivronmental CareersINDIVIDUALSMATTERIn the UnitedStates <strong>and</strong> otherdeveloped countries,the green jobmarket is one of thefastest-growingsegments of the economy.Many employers are activelyseeking environmentally educatedgraduates. They are especially interestedin people with scientific <strong>and</strong>engineering backgrounds <strong>and</strong> doublemajors (business <strong>and</strong> ecology,for example) or double minors.Other possibilities are majors inbusiness administration <strong>and</strong> environmentallaw.Throughout this book I have exposedyou to various career possi-bilities in this exciting <strong>and</strong> challengingfield. They include environmentalengineering, sustainable forestry<strong>and</strong> range management, parks <strong>and</strong>recreation management, air <strong>and</strong> waterquality control, solid waste <strong>and</strong>hazardous waste management, recycling,urban <strong>and</strong> rural l<strong>and</strong>-useplanning, computer modeling, ecologicalrestoration, <strong>and</strong> soil, water,fishery, <strong>and</strong> wildlife conservation<strong>and</strong> management.<strong>Environmental</strong> careers can alsobe found in education, environmentalplanning, environmental management,environmental health,toxicology, geology, ecology, conservationbiology, chemistry, climatology,population dynamics <strong>and</strong>regulation (demography), law,risk analysis, risk management,accounting, environmental journalism,design <strong>and</strong> architecture, energyconservation <strong>and</strong> analysis,renewable-energy technologies,hydrology, consulting, public relations,activism <strong>and</strong> lobbying, economics,diplomacy, development<strong>and</strong> marketing, publishing (environmentalmagazines <strong>and</strong> books),<strong>and</strong> teaching <strong>and</strong> law enforcement(pollution detection <strong>and</strong> enforcementteams).Critical ThinkingHave you considered an environmentalcareer? Why or why not?610 CHAPTER 27 Politics, Environment, <strong>and</strong> <strong>Sustainability</strong>
issue as the key to making government more responsiveto ordinary people on environmental <strong>and</strong> othermatters.One suggestion for reducing the excessive influenceof powerful special interests is to let the people(taxpayers) alone finance election campaigns, with lowspending limits. C<strong>and</strong>idates could use their ownmoney, but could not accept direct or indirect donationsfrom any other individuals, groups, or parties.With such a reform, elected officials could spendtheir time governing instead of raising money <strong>and</strong>catering to powerful special interests. Office seekerswould not need to be wealthy. Special-interest groupswould be heard because of the validity of their ideas,not the size of their pocketbooks.Some steps have been taken to reform election financing.Thanks to the work of many citizens, c<strong>and</strong>idatesrunning for office in four states—Arizona,Maine, Massachusetts, <strong>and</strong> Vermont—have the optionof rejecting all private campaign contributions <strong>and</strong>qualifying for full public financing of their campaignswithin certain spending limits.xHOW WOULD YOU VOTE? Do you support financingfederal, state, <strong>and</strong> local election campaigns with taxpayerfunds only? Cast your vote online at http://biology.brookscole.com/miller14.How Can Organizations Change toFoster Better Policy Making? Be Nimble,Flexible, <strong>and</strong> Adaptive in a RapidlyWorldTo achieve more sustainable environmentalpolicies, most organizations will be more effectiveif they shift from hierarchical to networkmodels.Businesses, governments, <strong>and</strong> all organizations are enteringa new era in which to thrive <strong>and</strong> survive, mostmust shift from rigid, slow-acting, top-down hierarchicalorganizations to something more flexible thatcan adapt quickly to changing conditions. This new organizationalmodel is that of a network instead of thatof a hierarchy.In a hierarchy consisting of a pyramid of increasinglypowerful layers of decision makers, informationtakes a long route to the top, <strong>and</strong> decisions take timeto filter down. People in such organizations are usedmore as information transmitters than as innovatorsof new ideas. The result is a lack of good informationat the top, a rigid set of controls <strong>and</strong> rules, <strong>and</strong> too littleinnovation. In today’s rapidly changing <strong>and</strong> increasinglyglobalized <strong>and</strong> interconnected world, suchhierarchical structures are rapidly going the way ofdinosaurs.Hierarchies are necessary for the stable functioningof some parts of governments <strong>and</strong> for some businesses.But many organizations are shifting to a flatter,leaner, <strong>and</strong> more adaptable network structure withoutas many middle- <strong>and</strong> senior managers. In such organizations,information flows rapidly to all members ofthe network, not unlike the way energy <strong>and</strong> matterflow through food webs in ecosystems. It is one way ofachieving more organizational sustainability by copyingnature. More open <strong>and</strong> democratic informationflow makes it much easier to adapt to changing conditions,<strong>and</strong> it promotes cooperation <strong>and</strong> innovation.Some analysts say that the European Union is slowlyemerging as an example of a new <strong>and</strong> more flexiblenetwork form of government.In the network model, leaders still have a vital role.<strong>Their</strong> job is to develop vision, values, <strong>and</strong> objectives fortheir organizations. Then they must promote feedbackfrom employees, encourage innovation <strong>and</strong> adaptation,<strong>and</strong> establish employee performance goals.An important aspect of emerging network organizationsis their use of adaptive management strategies(Figure 11-23, p. 218) to cope with new information<strong>and</strong> changing conditions, to learn from experience,<strong>and</strong> to modify plans quickly as needed. This approachuses the basic techniques of science (Figure 3-2, p. 33)<strong>and</strong> systems analysis (Figure 4-36, p. 85) to developcomputer models for examining alternative plans <strong>and</strong>projecting possible outcomes or scenarios. The primarygoal is to anticipate problems rather than simplyreact to them.Plans should be flexible <strong>and</strong> easy to change in responseto new information, unexpected developments,<strong>and</strong> changing conditions. Progress toward goals is regularlymonitored <strong>and</strong> evaluated, <strong>and</strong> this informationis used as feedback to adapt the plan as needed. Anygroup seeking to influence environmental or otherpolicies will need to adopt such organizational structures<strong>and</strong> strategies.Case Study: How Is <strong>Environmental</strong> PolicyMade in the United States? A Complicated<strong>and</strong> Thorny ProcessFormulating, legislating, <strong>and</strong> executing environmentalpolicy in the United States is a complex,difficult, <strong>and</strong> controversial process.The federal government consists of three separate butinterconnected branches: legislative, executive, <strong>and</strong> judicial.The legislative branch, called the Congress <strong>and</strong>composed of the House of Representatives <strong>and</strong> theSenate, has two main duties. One is to approve <strong>and</strong>oversee government policy by passing laws that establisha government agency or instruct an existingagency to take on new tasks or programs. The other ishttp://biology.brookscole.com/miller14611
to oversee the functioning <strong>and</strong> funding of variousagencies of the executive branch concerned with carryingout government policies.The executive branch consists of the president, <strong>and</strong> astaff that together oversee the various agencies authorizedby Congress to carry out government policies.Major agencies responsible for environmental policyare listed in Figure 27-3. The president also proposes annualbudgets, legislation, <strong>and</strong> appointees for executivepositions, which must be approved by Congress, <strong>and</strong>tries to persuade Congress <strong>and</strong> the public to support hisor her policy proposals.PresidentWhite HouseOffice• Overall policy• Agency coordinationOffice ofManagement<strong>and</strong> Budget• Budget• Agency coordination <strong>and</strong>managementCouncil on<strong>Environmental</strong>Quality• <strong>Environmental</strong> policy• Agency coordination• <strong>Environmental</strong> impact statementsDepartmentof Health<strong>and</strong> HumanServices<strong>Environmental</strong>ProtectionAgencyDepartmentof JusticeDepartmentof theInteriorDepartmentof AgricultureDepartmentof Defense• Health• Air <strong>and</strong> waterpollution• Noise• Pesticides• Solid waste• Radiation• Toxic substances• <strong>Environmental</strong>litigation• Endangered species• Energy• Minerals• National parks• Public l<strong>and</strong>s• Fish <strong>and</strong> wildlife• Water development• Soil conservation• Forestry• Civil worksconstruction• Dredge <strong>and</strong> fillpermits• Pollution controlfrom defensefacilitiesNuclearRegulatoryCommissionDepartmentof StateDepartmentof CommerceDepartmentof LaborDepartmentof Housing<strong>and</strong> UrbanDevelopmentDepartment ofTransportation• Licensing <strong>and</strong>regulation ofnuclear power• Internationalenvironment• Oceanic <strong>and</strong>atmosphericmonitoring <strong>and</strong>research• Occupational health• Housing• Urban parks• Urban planning• Airplane noise• Mass transit• Oil pollution• RoadsDepartmentof EnergyTennesseeValleyAuthority• Energy policy• Petroleum allocation• Electric powergenerationFigure 27-3 Major federal agencies concerned with establishing regulations <strong>and</strong> implementing environmentallaws in the United States. Such agencies are established by Congress but are run by the president as part ofthe executive branch of government. This diagram shows only the environmental responsibilities of theseagencies. Many have a broad range of other responsibilities.612 CHAPTER 27 Politics, Environment, <strong>and</strong> <strong>Sustainability</strong>
LobbyistsLobbyistsLawmaking bodyPublic hearingSpecial interest groupsPublic advisoryRegulating enforcement bodyLaws <strong>and</strong>regulationsLegal actionLawyersLegal actionLawyers<strong>Environmental</strong>organizationsCourtsCorporations <strong>and</strong>small businessLaws <strong>and</strong>regulationsMembership supportBoycottsIndividualPurchase recyclable,recycled, <strong>and</strong> environmentallysafe productsRecycle cans,bottles, paper,<strong>and</strong> plasticPlant agardenDonate clothes<strong>and</strong> used goodsto charitiesUse water, energy,<strong>and</strong> otherresources efficientlyUse mass transit,walk, ride a bike,or carpoolFigure 27-4 Greatly simplified overview of how individuals <strong>and</strong> lobbyists for <strong>and</strong> against a particularenvironmental law interact with the legislative, executive, <strong>and</strong> judicial branches of government in theUnited States. The bottom of this diagram also shows some ways in which individuals can bring about environmentalchange through their own lifestyles. See the website for this book for details on contactingelected representatives.The judicial branch consists of a complex <strong>and</strong> layeredseries of courts at the local, state, <strong>and</strong> federal levels.These courts enforce <strong>and</strong> interpret different lawspassed by legislative bodies.The major function of the federal government is todevelop <strong>and</strong> implement policy for dealing with variousissues. Policy is typically composed of laws passed bythe legislative branch, regulations instituted by the executivebranch to put laws into effect, <strong>and</strong> funding toimplement <strong>and</strong> enforce the laws <strong>and</strong> regulations.Figure 27-4 is a greatly simplified overview of how individuals<strong>and</strong> lobbyists for <strong>and</strong> against a particular environmentallaw interact with the three branches ofgovernment in the United States. Trace the flows of information<strong>and</strong> feedback in this diagram.Several steps are involved in establishing federalenvironmental policy (or any other policy). First, lawmakersmust acknowledge that an environmentalproblem exists <strong>and</strong> that the government has a responsibilityto address it. Next, an interested party (such asa citizen, a group, a legislator, or the president) createsa bill hoping to pass it into law to deal with the problem.Converting a bill into a law is a complex processthat you can trace in Figure 27-5 (p. 614). An importanthttp://biology.brookscole.com/miller14613
Figure 27-5 How a bill introducedinto the U.S.House of Representativesbecomes a law. Individualcitizens <strong>and</strong> lobbyinggroups (Figure 27-4) can influencehow the bill is writtenbefore it is introduced<strong>and</strong> what happens to it atevery stage of this complexprocess. Once a bill issigned into law, it goes toappropriations committeesin both houses for agreementon how much fundingit will receive. Without adequatefunding, a law cannotbe implemented. Continuedintervention by individuals<strong>and</strong> lobbying groups can bevery important at this stage.House of RepresentativesIntroduction of Bill by MemberWe will assume this is anappropriations bill, so the Constitutionspecifies that it be introduced inthe House.Referral to St<strong>and</strong>ing Committeeby leadership <strong>and</strong>parliamentarianHow a Bill Becomes a Law(if introduced in the House)SenateReferral to St<strong>and</strong>ing Committeeby leadership <strong>and</strong>parliamentarianCommittee Action• Possible referral to subcommittee• Alternatives similar to those of theHouseCalendar placementCommittee Action• Possible referral tosubcommittee• Hearings on major bills common• Committee decisions:TableDefeatAccept <strong>and</strong> reportAmend <strong>and</strong> reportRewriteCalendar PlacementRules Committee (major bills)Hearings to decide whether bill willgo to the floor earlier thancalendar date.Senate Floor ActionAlternatives similar to those of theHouse include rejection, acceptance,or additional amendmentsConference CommitteeIf the Senate approves a bill that is notidentical to the one passed in theHouse, a conference committee isrequested. This committee consists ofappointed members from both houseswho compromise on a final version ofthe bill.This compromise version is thensent to each house for final approval.Back to the Senate FloorBill is signed by Speaker <strong>and</strong>Vice-President.House Floor Action• Reading, general debate• Second reading• Amendment(s) report tothe House• Third reading• Passage or defeatPresident• Approve• Veto• Pocket veto• Permit bill to become law withouthis or her signatureLawhi S i I614 CHAPTER 27 Politics, Environment, <strong>and</strong> <strong>Sustainability</strong>
1969197019711972197319741975197619771978197919801981198219831984198519861987198819891990199119921993199419951996National <strong>Environmental</strong> Policy Act (NEPA)Clean Air ActClean Water Act; Coastal Zone Management Act;Federal Insecticide, Fungicide, <strong>and</strong> Rodenticide Act;Marine Mammal Protection ActEndangered Species ActSafe Drinking Water ActResource Conservation <strong>and</strong> Recovery Act; Toxic SubstancesControl Act; National Forest Management ActSoil <strong>and</strong> Water Conservation Act; Clean Water Act;Clean Air Act AmendmentsNational Energy ActSuperfund (CERCLA); National Energy Act Amendments;Coastal Zone Management Act AmendmentsEndangered Species Act AmendmentsHazardous <strong>and</strong> Solid Waste Amendment Act (SARA);Safe Drinking Water Act AmendmentsEndangered Species Act AmendmentsSuperfund Amendments <strong>and</strong> ReauthorizationClean Water Act AmendmentsFederal Insecticide , Fungicide, <strong>and</strong> RodenticideAct Amendments; Endangered Species Act AmendmentsClean Air Act Amendments; Reauthorization of Superfund;Waste Reduction ActEnergy Policy ActEndangered Species Act AmendmentsSafe Drinking Water Act AmendmentsFigure 27-6 Some major environmental laws <strong>and</strong> theiramended versions enacted in the United States since 1969. Amore detailed list is found on the website for this chapter.factor in this process is lobbying in which individualsor groups use public pressure, personal contacts, <strong>and</strong>political action to persuade legislators to vote or act intheir favor. Some lobbyists are unpaid individualswho believe in a particular issue <strong>and</strong> others are paidprofessionals. The complex ballet of lobbyists competingfor influence among legislators is a fascinating <strong>and</strong>important process.Most environmental bills are evaluated by asmany as 10 committees in the House of Representatives<strong>and</strong> the Senate. Effective proposals often areweakened by this fragmentation <strong>and</strong> by lobbyingfrom groups opposing the law. Nonetheless, since the1970s, a number of important environmental lawshave been passed in the United States, as discussedthroughout this text. Figure 27-6 lists some of the majorenvironmental laws passed in the United Statessince 1969.Passing a law is not enough to make policy. Thenext step involves trying to get enough funds appropriatedto implement <strong>and</strong> enforce the law. Indeed,developing <strong>and</strong> adopting a budget is the most important <strong>and</strong>controversial activity of the executive <strong>and</strong> legislativebranches.Once a law has been passed <strong>and</strong> funded, the appropriategovernment department or agency mustdraw up regulations or rules for implementing it. Legislaturesoften give agencies considerable leeway forfilling in the details on how a law will work. The resultingrules can put teeth into the law, or if drawnweakly, can render the law toothless.An affected group may take the agency to courtfor failing to implement <strong>and</strong> enforce the regulations effectively,or for enforcing them too rigidly.Politics plays an important role in the policies <strong>and</strong>staffing of environmental regulatory agencies—dependingon what political party is in power <strong>and</strong> theprevailing environmental attitudes. Industries facingenvironmental regulations often put political pressureon regulatory agencies <strong>and</strong> lobby to have the presidentappoint people to high positions in such agencies whocome from the industries being regulated. In otherwords, the regulated try to take over the agencies <strong>and</strong>become the regulators—described by some as “puttingfoxes in charge of the henhouse.”In addition, people in regulatory agencies workclosely with <strong>and</strong> often develop friendships with officialsin the industries they are regulating. Some industriesoffer regulatory agency employees high-payingjobs in an attempt to influence their regulatory decisions.This can lead to what is called a revolving door, asemployees move back <strong>and</strong> forth between industry <strong>and</strong>government.According to social scientists, the development ofpublic policy in democracies often goes through a policylife cycle consisting of four stages: recognition, formulation,implementation, <strong>and</strong> control. Figure 27-7 (p. 616)illustrates this cycle <strong>and</strong> shows the general positions ofseveral major environmental problems in the policylife cycle in the United States <strong>and</strong> most other developedcountries. Carefully study this figure.http://biology.brookscole.com/miller14615
Figure 27-7 Generalposition of severalmajor environmentalproblems in the policylife cycle in mostdeveloped countries.RecognitionIdentify the problem.Nonpoint-sourcewater pollutionIndoor air pollutionReuseMining wastesGroundwatercontaminationFormulationLook for solutions.Global warmingUrban sprawlNuclear wastesBiodiversity protectionPollution preventionToxic wastesImplementationImplement solutions.Acid depositionOzone depletionMunicipal solid wasteProtectingendangeredspeciesPest controlControlThings are improving.Outdoor air pollutionSewage treatmentDrinking watertreatmentPoint-source waterpollutionRecycling<strong>Environmental</strong>lyharmful subsidiesMarket prices donot includeenvironmentallyharmful costsNeed for integratedenvironmentalmanagementResource productivityAquifer depletion<strong>Environmental</strong>justiceSustainableeconomicdevelopmentSoil erosionSome infectiousdiseases27-4 ENVIRONMENTAL LAWWhat Is <strong>Environmental</strong> Law <strong>and</strong> HowDoes It Evolve? A Mix of Legislation <strong>and</strong>TraditionThe body of environmental laws is constantlyevolving through legislation <strong>and</strong> lawsuits.<strong>Environmental</strong> law is a body of statements definingwhat is reasonable environmental behavior for individuals<strong>and</strong> groups, according to the larger community,<strong>and</strong> attempting to balance competing social <strong>and</strong>private interests. It includes statutory laws, administrativelaws, <strong>and</strong> common laws.Statutory laws are those developed <strong>and</strong> passed bylegislative bodies such as federal <strong>and</strong> state governments.Administrative laws consist of administrativerules <strong>and</strong> regulations, executive orders, <strong>and</strong> enforcementdecisions related to the implementation <strong>and</strong> interpretationof statutory laws. Common law is a bodyof unwritten rules <strong>and</strong> principles derived from thous<strong>and</strong>sof past legal decisions along with commonly acceptedpractices, or norms, within a society. Most of itconsists of case law, a body of legal opinions derivedfrom past court decisions. The body of laws is continuouslyevolving, as almost every major environmentalregulation is challenged in court.Most environmental lawsuits are civil suits—thosebrought to settle disputes or damages between oneparty <strong>and</strong> another. Many common law cases are settledusing the legal principle of nuisance. A nuisance occurswhen people use their property in a way that causesannoyance or injury to others. For example, a homeownermay bring a nuisance suit against a nearby factorybecause of the noise it generates.In such a civil suit, the plaintiff, the party bringingthe charge, seeks to collect damages for injuries tohealth or for economic loss from the defendant, theparty being charged. The plaintiff may also seek an injunction,by which the defendant would be required tostop whatever action is causing the harm. An individualor a clearly identified group may bring such asuit. A class action suit is a civil suit filed by a group,often a public interest or environmental group, on behalfof a larger number of citizens who allege similardamages but who need not be listed <strong>and</strong> representedindividually.Using the principles of common law, the courtmay side with the plaintiff if it finds that the loss ofsleep, health problems, or other damage from the noiseis greater than the cost of eliminating or reducing thenoise. Short of closing the factory, often the court triesto find a reasonable or balanced solution to the problem.For example, it may order the factory to reduce616 CHAPTER 27 Politics, Environment, <strong>and</strong> <strong>Sustainability</strong>
noise to certain levels or to eliminate it during certainperiods, such as at night.Another principle used in common law cases isnegligence in which a party causes damage by knowinglyacting in an unlawful or unreasonable manner.For example, a company may be found negligent if itfails to h<strong>and</strong>le hazardous waste in a way required bya statutory law. A court may also find a companynegligent if it fails to do something a reasonable personwould do, such as testing waste for certain harmfulchemicals before dumping it into a sewer, l<strong>and</strong>fill,or river. Generally, negligence is harder to prove thannuisance.What Factors Hinder the Effectivenessof <strong>Environmental</strong> Lawsuits in the UnitedStates? Mostly Money <strong>and</strong> Time<strong>Environmental</strong> lawsuits are expensive <strong>and</strong> difficultto win.Several factors limit the effectiveness of environmentallawsuits. First, any person bringing the suit must establishthat she or he has the legal right or legal st<strong>and</strong>ingto do so in a particular court. To have such a right,plaintiffs must show that they have personally sufferedhealth or financial losses from some alleged environmentalactivity.Second, bringing any lawsuit is expensive—toomuch so for most individuals. Large organizations, onthe other h<strong>and</strong>, can often afford to defend themselvesin court for months or years.Third, public interest law firms cannot recover attorneys’fees unless Congress has specifically authorizedit in the laws that those firms are seeking to haveenforced. By contrast, corporations can reduce theirtaxes by deducting their legal expenses—in effect havingthe public pay for part of their legal fees. In otherwords, the legal playing field is uneven <strong>and</strong> in financialterms is stacked against individuals <strong>and</strong> groups of privatecitizens filing environmental lawsuits.Fourth, to stop a nuisance or to collect damagesfrom a nuisance or an act of negligence, plaintiffsmust establish they have been harmed in some significantway <strong>and</strong> that the defendant caused the harm. Doingthis can be difficult <strong>and</strong> costly. Suppose a company(the defendant) is charged with causing cancerin individuals by polluting a river. If hundreds ofother industries <strong>and</strong> cities dump waste into that river,establishing that the defendant is the culprit is verydifficult <strong>and</strong> requires expensive investigation, scientificresearch, <strong>and</strong> expert testimony. In addition, it ishard to establish that a particular chemical caused theplaintiffs’ cancers.Fifth, most states have statues of limitations, lawsthat limit how long a plaintiff can take to sue after aparticular event occurs. These statutes often make itessentially impossible for victims of cancer, whichmay take 10–20 years to develop, to file or win a negligencesuit.Sixth, the court, or series of courts if the case is appealed,may take years to reach a decision. During thattime a defendant may continue the allegedly damagingaction unless the court issues a temporary injunctionagainst it until the case is decided.Finally, some corporations, developers, <strong>and</strong> governmentagencies file strategic lawsuits against publicparticipation (SLAPPs) against citizens who publiclycriticize a business for some activity such as pollutingor a government agency for not performing its legalobligation to protect the public. SLAPPs range from$100,000 to $100 million but average $9 million persuit. For example, in Texas when a woman publiclycalled a nearby l<strong>and</strong>fill a dump the l<strong>and</strong>fill ownerssued her husb<strong>and</strong> for $5 million for failing to “controlhis wife.” Judges who recognize them for what theyare throw out about 90% of the SLAPPs that go tocourt. But individuals <strong>and</strong> groups hit with SLAPPsmust hire lawyers, <strong>and</strong> typically spend 1–3 years defendingthemselves.Most SLAPPs are not meant to be won, but are intendedto intimidate individuals <strong>and</strong> activist groups—to keep them from exercising their democratic rights tocriticize or oppose projects they believe are environmentallyharmful. Once fear <strong>and</strong> rising defense costsshake the victim of a SLAPP, the defendant often dropsthe suit. Sometimes a company or government agencyoffers to drop the lawsuit if the defendants agree tostop their protest <strong>and</strong> never discuss the case or opposethe plaintiff again.Some citizen activists have fought back withcounter suits <strong>and</strong> have been awarded damages. For example,a Missouri woman who was sued for criticizinga medical waste incinerator won an $86.5 million judgmentagainst the incinerator’s owner.Even after paying such awards, corporations <strong>and</strong>developers generally save money by filing such suits.Unlike the people they are suing, they can count legal<strong>and</strong> liability insurance costs as business expenses <strong>and</strong>write them off on their taxes. In other words, they getall taxpayers to pay much of the cost of lawsuitsagainst a few taxpayers who are exercising their rightsas citizens.Because of the numerous difficulties just discussed,an increasing number of environmental lawsuitsare being settled out of court. Some are settledprivately <strong>and</strong> others by mediation, in which a neutralparty tries to resolve the dispute in a way that is acceptableto both parties. Mediation is much less costly<strong>and</strong> time consuming <strong>and</strong> may provide a more satisfactoryresolution of a dispute than going to court. But asettlement drawn up by mediation is not legally bindingunless the terms of the agreement make it so. Thusmonths of mediation can result in an agreement thatpolluters may ignore.http://biology.brookscole.com/miller14617
Despite many obstacles, proponents of environmentallaw have accomplished a great deal since the1960s. In the United States, more than 20,000 attorneysin 100 public interest law firms <strong>and</strong> groups specializepartly or entirely in environmental <strong>and</strong> consumer law.In addition, many other lawyers <strong>and</strong> scientific expertsparticipate in environmental <strong>and</strong> consumer lawsuitsas needed <strong>and</strong> sometimes without charge.Analysts have suggested three major reforms tohelp level the legal playing field for citizens sufferingenvironmental damage. First, pressure Congress topass a law allowing juries <strong>and</strong> judges to award citizenstheir attorney fees, to be paid by the defendants, insuccessful lawsuits.Second, establish rules <strong>and</strong> procedures for identifyingfrivolous SLAPP suits so that cases without factualor legal merit could be dismissed within a few weeksrather than years. Third, raise the fines for violators ofenvironmental laws <strong>and</strong> punish more violators withjail sentences. Polls indicate that 84% of Americans considerdamaging the environment to be a serious crime.Case Study: What Are the Major Types of<strong>Environmental</strong> Laws in the United States?A Variety of ApproachesU.S. environmental laws set pollution st<strong>and</strong>ards,screen toxic substances, evaluate environmentalimpacts, encourage resource conservation, <strong>and</strong>protect various ecosystems <strong>and</strong> species fromharm.Concerned citizens have persuaded Congress to enacta number of important federal environmental <strong>and</strong> resourceprotection laws (Figure 27-6) that seek to protectenvironmental quality by using various approaches.One is to set st<strong>and</strong>ards for pollution levels (as in the CleanAir Acts <strong>and</strong> the Federal Water Pollution Control Act).Another is to screen new substances for safety (as in theToxic Substances Control Act).A third type of legislation encourages resource conservation(the Resource Conservation <strong>and</strong> RecoveryAct <strong>and</strong> the National Energy Act). A fourth type setsaside or protects various ecosystems, resources, <strong>and</strong> species(the Endangered Species Act <strong>and</strong> the Wilderness Act).Afifth approach is to require evaluation of the environmentalimpact of an activity proposed by a federal agency, asin the National <strong>Environmental</strong> Policy Act or NEPA passedin 1970. Under NEPA, an environmental impact statement(EIS) must be developed for every major federal projectlikely to have an important effect on environmentalquality. The EIS must describe why the proposed projectis needed, its short-term <strong>and</strong> long-term beneficial<strong>and</strong> harmful environmental impacts, ways to lessenharmful impacts, <strong>and</strong> an evaluation of alternatives. AnEIS typically takes 6–9 months to develop <strong>and</strong> is oftenhundreds of pages long. The documents must be published<strong>and</strong> are open to public comment.NEPA does not prohibit environmentally harmfulgovernment projects but it requires federal agencies totake environmental consequences into account in makingdecisions <strong>and</strong> exposes proposed projects <strong>and</strong> theirlikely harmful effects to public scrutiny. At least36 U.S. states <strong>and</strong> a number of other countries—includingCanada, Sweden, France, New Zeal<strong>and</strong>, <strong>and</strong>Australia—have passed laws similar to NEPA.<strong>Environmental</strong>ists have used EISs to block harmfulprojects or get them modified to reduce their environmentalimpacts. Many agree that NEPA has helpedfederal agencies to evaluate <strong>and</strong> reduce the harmfulenvironmental impacts of their projects <strong>and</strong> activities.Critics say EISs are costly <strong>and</strong> can unnecessarilydelay projects by requiring too much analysis (paralysisby analysis). Proponents say analysis is needed tomake government agencies think more seriouslyabout the impact of proposed projects <strong>and</strong> to examinealternatives.Opponents of environmentalists have targetedNEPA as a law that needs to be weakened or repealed.In 2003, the Bush administration began looking atways to overhaul NEPA <strong>and</strong> asked Congress to exemptthe Department of Defense (DOD) from havingto file EISs in the interests of national security. <strong>Environmental</strong>istsoppose this because national security isinvolved in only a few of the wide range of potentiallydamaging projects undertaken by the DOD, <strong>and</strong> suchprojects can dealt with individually.Some environmental laws <strong>and</strong> presidential executiveorders contain glowing rhetoric about goals butlittle guidance on how to meet them, leaving this taskto regulatory agencies <strong>and</strong> the courts. In other cases,these acts specify one or more of the following generalprinciples for setting regulations. First, expose peopleto no unreasonable risk (food regulations in the Food,Drug, <strong>and</strong> Cosmetic Act). Second, expose people to littleor no risk (the zero-discharge goals of the SafeDrinking Water <strong>and</strong> Clean Water Acts). Third, set st<strong>and</strong>ardsbased on best available technology (the CleanAir, Clean Water, <strong>and</strong> Safe Drinking Water Acts).Fourth, use cost–benefit analysis (the Toxic SubstancesControl Act). Fifth, make the polluter pay (the SuperfundLaw until recently)27-5 ENVIRONMENTAL GROUPSAND THEIR OPPONENTSWhat Are the Roles of Major <strong>Environmental</strong>Groups? Watchdogs <strong>and</strong> Agents ofChange<strong>Environmental</strong> groups monitor environmentalactivities, work to pass <strong>and</strong> strengthen environmentallaws, <strong>and</strong> work with corporations to find solutionsto environmental problems.618 CHAPTER 27 Politics, Environment, <strong>and</strong> <strong>Sustainability</strong>
The spearhead of the global conservation <strong>and</strong> environmentalmovement consists of more than 100,000 nonprofitNGOs working at the international, national,state, <strong>and</strong> local levels—up from about 2,000 in 1970.The growing influence of these organizations is one ofthe most important changes influencing environmentaldecisions <strong>and</strong> policies.NGOs range from grassroots groups with justa few members to global organizations like the 5-million-member World Wide Fund for Nature with officesin 48 countries. Other international groups withlarge memberships include Greenpeace, the WorldWildlife Fund, the Nature Conservancy (Solutions,p. 216), Grameen Bank (Solutions, p. 601), <strong>and</strong> ConservationInternational.Using e-mail <strong>and</strong> the Internet, environmentalNGOs have organized themselves into an array ofpowerful international networks. Examples includethe Pesticide Action, Climate Action, InternationalRivers, Women’s Environment <strong>and</strong> Development, <strong>and</strong>Biodiversity Action Networks. They collaborate acrossborders, gathering environmental information, monitoringenvironmental change, <strong>and</strong> acting quickly. Theymonitor the environmental activities of governments,corporations, <strong>and</strong> international agencies such as theWorld Bank <strong>and</strong> the World Trade Organization (WTO).They expose corruption <strong>and</strong> violations of national<strong>and</strong> international environmental agreements, such asCITES, which prohibits international trade of endangeredspecies. Groups such as Conservation International<strong>and</strong> the Nature Conservancy have brokereddebt-for-nature swaps where developing countriesagree to protect ecologically important areas in exchangefor reduction of their international debt. NGOsare also watchdogs for environmental accountabilityat the local level.In the United States, more than 8 million citizensbelong to over 30,000 NGOs dealing with environmentalissues. They range from small grassrootsgroups to large heavily funded groups, led by chief executiveofficers <strong>and</strong> staffed by expert lawyers, scientists,economists, lobbyists, <strong>and</strong> fund raisers. The 10largest of these—sometimes called the “group of 10”—are the World Wildlife Fund, Sierra Club, NationalWildlife Federation, Audubon Society, Greenpeace,Friends of the Earth, Natural Resources DefenseCouncil, Wilderness Society, Ducks Unlimited, <strong>and</strong>Izaak Walton League. Many of these <strong>and</strong> other smallerenvironmental groups doubled <strong>and</strong> tripled their membershipsbetween 1980 <strong>and</strong> 2000, mostly in response toincreased fundraising activities <strong>and</strong> to attempts toweaken or repeal environmental laws <strong>and</strong> regulations.However, many members do not actively participatein the activities of such organizations <strong>and</strong> up to halfdo not renew their memberships.The large groups have become powerful <strong>and</strong> importantforces within the political system, by workingindividually <strong>and</strong> together in coalitions to help persuadeCongress to pass <strong>and</strong> strengthen environmentallaws <strong>and</strong> to fight off attempts to weaken or repeal them.However, these large environmental groups mustguard against being subverted by the political systemthey work to improve. This is a risk because thesegroups rely heavily on corporate donations, <strong>and</strong> manyof them have corporate executives as board members,trustees, or council members.The good news is that instead of acting as adversaries,some industries <strong>and</strong> environmental groups areworking together to find solutions to environmentalproblems. For example, <strong>Environmental</strong> Defense hasworked with McDonald’s to redesign its packagingsystem to eliminate polyethylene foam clamshell hamburgercontainers. It has also worked with GeneralMotors to help remove high-pollution cars from theroad <strong>and</strong> with various multinational corporations toset targets for reducing their carbon dioxide emissions.The World Resources Institute is collaborating withleading businesses to build a market among corporationsfor electrical power produced from renewableenergy resources.Some environmental groups have shifted some resourcesfrom demonstrating <strong>and</strong> litigating to publicizingresearch on innovative solutions to environmentalproblems. For example, to promote the use of chlorinefreepaper, Greenpeace Germany printed a magazineusing such paper <strong>and</strong> encouraged readers to dem<strong>and</strong>that magazine publishers switch to chlorine-free paper.Shortly thereafter, several major magazines madethat shift.What Are the Roles of Grassroots<strong>Environmental</strong> Groups? Citizen Actionfrom the Bottom UpThous<strong>and</strong>s of citizens’ groups working to improveenvironmental quality form the base of the globalenvironmental movement.The base of the environmental movement in the UnitedStates <strong>and</strong> throughout the world consists of thous<strong>and</strong>sof grassroots citizens’ groups organized to improve environmentalquality, often at the local level. Accordingto political analyst Konrad von Moltke, “There isn’t agovernment in the world that would have done anythingfor the environment if it weren’t for the citizengroups.”These groups carry out a number of environmentalroles. One is to work with individuals <strong>and</strong> communitiesto oppose harmful projects such as l<strong>and</strong>fills,waste incinerators, nuclear waste dumps, clear-cuttingof forests, <strong>and</strong> various development projects. Theyhave also pressured government officials to take actionwhen group members have been victims of environmentalharm or of environmental injustice because ofthe unequal distribution of environmental risks. Seehttp://biology.brookscole.com/miller14619
the Guest Essay on environmental justice by Robert D.Bullard on the website for this chapter.Grassroots groups have also formed l<strong>and</strong> trusts<strong>and</strong> other local organizations to save wetl<strong>and</strong>s, forests,farml<strong>and</strong>, <strong>and</strong> ranchl<strong>and</strong> from development. Theyhave helped restore degraded rivers <strong>and</strong> wetl<strong>and</strong>s,<strong>and</strong> have converted ab<strong>and</strong>oned urban lots into communitygardens <strong>and</strong> parks. Some groups are coalitionsof workers <strong>and</strong> environmentalists who aim to improveworker safety <strong>and</strong> health.International examples of grassroots NGOs areKenya’s Green Belt Movement (Individuals Matter,p. 214) in which citizens plant trees on public <strong>and</strong> privatel<strong>and</strong>; India’s long-st<strong>and</strong>ing Chipko movementwhere villagers protect trees by hugging them <strong>and</strong> thusplacing themselves between the trees <strong>and</strong> axes <strong>and</strong>chainsaws; <strong>and</strong> Sri Lanka’s Sarvodaya Shramadanamovement, which has developed wells for drinkingwater, gardening, <strong>and</strong> other small-scale improvementprojects in 12,000 villages.Taken together, a loosely connected network ofgrassroots NGOs working for bottom-up political, social,economic, <strong>and</strong> environmental change can beviewed as an emerging citizen-based global sustainabilitymovement. These millions of citizens are becominginformed <strong>and</strong> empowered by access to the World WideWeb, cell phones, e-mail, faxes, GIS mapping programs,<strong>and</strong> other components of the global communicationsweb.As Jeremy Rifkin puts it, “We are rapidly movingfrom geopolitics to biosphere politics.” According toRifkin, the Internet, coupled with our better underst<strong>and</strong>ingof how the earth sustains itself, will allow us,for the first time in human history, to really think globally<strong>and</strong> act locally.The late John W. Gardner, former cabinet official<strong>and</strong> founder of Common Cause, suggested using thefollowing basic rules for effective political action bygrassroots organizations:■Have a full-time continuing organization.■ Limit the number of targets <strong>and</strong> hit them hard.Groups dilute their effectiveness by taking on toomany issues.■ Organize for action, not just for study, discussion,or education.■ Form alliances with other organizations on a particularissue.■ Communicate positions in an accurate, concise,<strong>and</strong> moving way.■Persuade <strong>and</strong> use positive reinforcement.■ Concentrate efforts mostly at the state <strong>and</strong> locallevels.Some grassroots environmental groups use nonviolent<strong>and</strong> nondestructive tactics of protest marches,pickets, road blocks, tree sitting (Individuals Matter,p. 206), confronting illegal whaling ships, street theater,<strong>and</strong> other devices for generating publicity to helpeducate <strong>and</strong> sway members of the public to theircauses. Many of these tactics are borrowed from MahatmaG<strong>and</strong>hi’s successful nonviolent civil disobediencestrategy in helping win India’s independencefrom Great Britain <strong>and</strong> the U.S. civil rights movement.Some find the tactics of these groups controversialwhile others admire them for st<strong>and</strong>ing up for their beliefsin nonviolent ways.xHOW WOULD YOU VOTE? Do you support the use of nonviolent<strong>and</strong> nondestructive civil disobedience tactics byenvironmental groups <strong>and</strong> individuals? Cast your vote onlineat http://biology.brookscole.com/miller14.Much more controversial are militant environmentalgroups that break into labs to free animals usedto test drugs or that destroy property such as bulldozers<strong>and</strong> SUVs. Most environmentalists opposesuch tactics because they involve illegal <strong>and</strong> destructiveacts, give other environmentalists a bad name,<strong>and</strong> play into the h<strong>and</strong>s of environmentalists’ politicalopponents.Case Study: <strong>Environmental</strong> Actionby Students in the United States—Makinga DifferenceMany student environmental groups work to bringabout environmental improvements in their schools<strong>and</strong> local communities.Since 1988, there has been a boom in environmentalawareness on a number of college campuses <strong>and</strong> publicschools across the United States.* Most student environmentalgroups work with members of the faculty<strong>and</strong> administration to bring about environmental improvementsin their schools <strong>and</strong> local communities.Many of these groups make environmental auditsof their campuses or schools.** Then they use the datagathered to propose changes that will make their campusor school more ecologically sustainable, usuallysaving money in the process.*See Ecodemia: Campus <strong>Environmental</strong> Stewardship at the Turn of the21st Century (Washington, D.C.: National Wildlife Federation,1995) <strong>and</strong> the Campus <strong>Environmental</strong> Yearbook, published annuallyby the National Wildlife Federation.**Details for conducting such audits are found in April Smith<strong>and</strong> the Student <strong>Environmental</strong> Action Coalition, Campus Ecology:A Guide to Assessing <strong>Environmental</strong> Quality <strong>and</strong> CreatingStrategies for Change (Los Angeles: Living Planet Press, 1993),<strong>and</strong> Jane Heinze-Fry, Green Lives, Green Campuses, available freeon the website for this textbook.620 CHAPTER 27 Politics, Environment, <strong>and</strong> <strong>Sustainability</strong>
Such audits have resulted in numerous improvements.For example, Morris A. Pierce, a graduate studentat the University of Rochester in New York,developed an energy management plan adopted by thatschool’s board of trustees. Under this plan, a capital investmentof $33 million is projected to save the university$60 million over 20 years. Students have also helpedconvince almost 80% of universities <strong>and</strong> colleges in theUnited States to develop recycling programs.At Bowdoin College in Maine, chemistry professorDana Mayo <strong>and</strong> student Caroline Foote developedthe concept of microscale experiments, in which smalleramounts of chemicals are used. This has reduced toxicwastes. Today more than half of all undergraduates inchemistry in the United States use such microscaletechniques, as do universities in a growing number ofother countries. At Carnegie-Mellon University, studentsin introductory chemistry courses can carry outa number of experiments using a virtual or “no-spill”laboratory.Students at Oberlin College in Ohio helped designa more sustainable environmental studies building. AtNorthl<strong>and</strong> College in Wisconsin, students helpeddesign a “green” dorm that features a large wind generator,panels of solar cells, recycled furniture, <strong>and</strong> waterless(composting) toilets.At Minnesota’s St. Olaf College, students havecarried out sustainable agriculture <strong>and</strong> ecologicalrestoration projects. Students at Brown Universitystudied the impacts of lead <strong>and</strong> other toxic pollutantsin low-income neighborhoods in nearby Providence,Rhode Isl<strong>and</strong>.A 1997 report by the National Wildlife Federation’sCampus Ecology Program found that 23 student-researched<strong>and</strong> student-motivated projects hadsaved the participating universities <strong>and</strong> colleges $16.3million. According to this study, implementing similarprograms in the nation’s 3,700 universities <strong>and</strong> collegescould help improve environmental quality <strong>and</strong>environmental education <strong>and</strong> save more than $15 billion.Such student-spurred environmental activities<strong>and</strong> research studies are spreading to universities in atleast 42 other countries. See Noel Perrin’s Guest Essayon this topic on this chapter’s website.How Successful Have <strong>Environmental</strong>Groups <strong>and</strong> <strong>Their</strong> OpponentsBeen? Achievements <strong>and</strong>Setbacks<strong>Environmental</strong> groups have helped educate thepublic <strong>and</strong> business <strong>and</strong> political leaders aboutenvironmental issues <strong>and</strong> pass environmental laws,but an organized movement has underminedmany of these efforts.Since 1970, a variety of environmental groups in theUnited States <strong>and</strong> other countries have helped increaseunderst<strong>and</strong>ing of environmental issues by the generalpublic <strong>and</strong> some business <strong>and</strong> government leaders.They have also gained public support for an array ofenvironmental <strong>and</strong> resource-use laws in the UnitedStates <strong>and</strong> other countries. In addition, they havehelped individuals deal with a number of local environmentalproblems.Polls show that more than 80% of the U.S. publicstrongly support environmental laws <strong>and</strong> regulations<strong>and</strong> do not want them weakened. But polls also showthat less than 10% of the U.S. public views the environmentas one of the nation’s most pressing problems. Asa result, environmental concerns often do not gettransferred to the ballot box. As one political scientistput it, “<strong>Environmental</strong> concerns are like the FloridaEverglades, a mile wide but only a few inches deep.”And since 1980 a well-organized <strong>and</strong> well-fundedmovement has undermined much of the improvementin environmental underst<strong>and</strong>ing <strong>and</strong> support for environmentalconcerns in the United States.One problem is that the focus of environmental issueshas shifted from easy-to-see dirty smokestacks<strong>and</strong> burning rivers to more complex <strong>and</strong> controversialenvironmental problems that are less visible, harder tounderst<strong>and</strong> <strong>and</strong> solve, <strong>and</strong> that have long-range harmfuleffects. Examples are climate change, wasted energy,ozone depletion, biodiversity loss, nonpoint-sourcewater pollution, <strong>and</strong> unseen groundwater pollution.Explaining such complex issues to the public <strong>and</strong> mobilizingsupport for often controversial, long-range solutionsto such problems is difficult. See the Guest Essayon environmental reporting by Andrew C. Revkin onthe website for this chapter.Another problem is that many environmentalistshave brought mostly bad news. History shows thatbearers of bad news are not received well, <strong>and</strong> opponentsof environmentalists have used this to undermineenvironmental concerns.History also shows that people are moved to bringabout change mostly by an inspiring, positive vision ofwhat the world could be like, one that provides hopefor the future. So far, environmentalists with a varietyof beliefs <strong>and</strong> goals have not worked together to developbroad, compelling, <strong>and</strong> positive visions that canbe used as road maps for a more sustainable future forhumans <strong>and</strong> other species.Instead of using confrontation, some people areworking to mediate environmental disputes by gettingeach side to listen to one another’s concerns, to try tofind areas of agreement, <strong>and</strong> to work together to findsolutions (Solutions, p. 622). This approach is beingused successfully in places such as the Netherl<strong>and</strong>s(p. 602), the Chesapeake Bay area (p. 505), the Greathttp://biology.brookscole.com/miller14621
How Can We Improve <strong>Environmental</strong> Laws<strong>and</strong> Regulations? Time for a Checkup<strong>Environmental</strong>istsagree that somegovernment lawsSOLUTIONS <strong>and</strong> regulations gotoo far <strong>and</strong> that bureaucratssometimes develop <strong>and</strong>impose unfair <strong>and</strong> excessivelycostly regulations. They argue thatthe solution is to stop regulatoryabuse, not to throw out or seriouslyweaken the body of laws <strong>and</strong> regulationsthat help protect the publicgood.According to environmentaleconomist William Ashworth,Government regulation did not fallout of the sky; it was erected, pieceby-piece,as an attempt to deal withthe damage caused by unrestrainedproperty rights <strong>and</strong> the unregulatedfree-market system....We do notneed to deconstruct regulation, butto reconstruct it.To accomplish this, a growingnumber of analysts urge environmentaliststo take a hard look at existingenvironmental laws <strong>and</strong> regulations.Which laws or parts of lawshave worked, <strong>and</strong> why? Whichhave failed, <strong>and</strong> why? Which governmentbureaucracies concernedwith developing <strong>and</strong> enforcing environmental<strong>and</strong> resource regulationshave abused their power orhave not been responsive enough tothe needs of ordinary people? Howcan such abuses be corrected? Whatexisting environmental laws (orparts of such laws) <strong>and</strong> regulationsshould be repealed or modified?What environmental problemslend themselves to market-basedapproaches (free-market environmentalism),<strong>and</strong> which ones donot? What roles should pollutionprevention, waste reduction, <strong>and</strong>the precautionary principle playin environmental legislation <strong>and</strong>regulation?These are important issues thatenvironmentalists, business leaders,elected officials, <strong>and</strong> governmentregulators need to address with acooperative, problem-solving spirit.Critical ThinkingIdentify an environmental law inthe United States (or in the countrywhere you live) that you believeneeds to be improved. How wouldyou improve it?Lakes (p. 500), Chattanooga, Tennessee (p. 581), <strong>and</strong>Curitiba, Brazil (p. 563).What Are the Goals of the <strong>Environmental</strong>ists’Opponents in the United States? Undermine,Weaken, <strong>and</strong> CrushSince 1980, a political movement has attemptedto discredit, weaken, <strong>and</strong> destroy the environmentalmovement in the United States.Despite general public approval, there is strong oppositionto many environmental proposals, laws, <strong>and</strong>regulations by three major groups. First, some corporateleaders, some corporations, <strong>and</strong> other powerfulpeople see environmental laws <strong>and</strong> regulations asthreats to their wealth <strong>and</strong> power. Second, some citizenssee environmental laws <strong>and</strong> regulations as threatsto their private property rights (p. 242) <strong>and</strong> jobs. Third,some state <strong>and</strong> local government officials resent havingto implement federal environmental laws <strong>and</strong> regulationswithout federal funding (unfunded m<strong>and</strong>ates)or disagree with certain regulations.Since 1980, businesses, individuals, <strong>and</strong> someelected officials have mounted a strong campaign toweaken or repeal existing environmental laws <strong>and</strong>regulations, change the way in which public l<strong>and</strong>s areused (p. 199), <strong>and</strong> destroy the reputation <strong>and</strong> effectivenessof the U.S. environmental movement.Some groups seeking to weaken or do away withenvironmental laws <strong>and</strong> regulations have many members<strong>and</strong> large budgets. Examples are the NationalFarm Bureau <strong>and</strong> the Cattleman’s Association.Some of these groups are genuine grassroots organizations,while others are primarily lobbying groupsfor various industries. People for the West, for example,is an organization claiming to represent ordinaryrural people. But almost all of its budget <strong>and</strong> 12 of its13 board members come from mining <strong>and</strong> timber companies.Sometimes it takes careful research to determinewho is behind a group with an environmentallyfriendly name.Because of the efforts of their opponents, majorenvironmental groups in the United States have spentmost of their time <strong>and</strong> money since 1980 trying to preventexisting environmental laws <strong>and</strong> regulationsfrom being weakened or repealed.27-6 GLOBAL ENVIRONMENTALPOLICYSolutions: Should We Exp<strong>and</strong> the Conceptof National <strong>and</strong> Global Security?The Big ThreeMany analysts believe that environmental securityis as important as military <strong>and</strong> economic security.Countries are legitimately concerned with military security<strong>and</strong> economic security. However, ecologists pointout that all economies are supported by the earth’s622 CHAPTER 27 Politics, Environment, <strong>and</strong> <strong>Sustainability</strong>
natural capital. According to environmental expertNorman Myers,If a nation’s environmental foundations are degradedor depleted, its economy may well decline, its socialfabric deteriorate, <strong>and</strong> its political structure becomedestabilized as growing numbers of people seek to sustainthemselves from declining resource stocks. Thus,national security is no longer about fighting forces <strong>and</strong>weaponry alone. It relates increasingly to watersheds,cropl<strong>and</strong>s, forests, genetic resources, climate, <strong>and</strong> otherfactors that, taken together, are as crucial to a nation’ssecurity as are military factors.Proponents of this view call for all countries tomake environmental security a major focus of diplomacy<strong>and</strong> government policy at all levels. This wouldbe implemented by having a council of advisers madeup of highly qualified experts in environmental, economic,<strong>and</strong> military security who integrate all threesecurity concerns in making major decisions.xHOW WOULD YOU VOTE? Do you believe that environmentalsecurity is just as important as economic <strong>and</strong> militarysecurity? Cast your vote online at http://biology.brookscole.com/miller14.What Is the Role of International<strong>Environmental</strong> Organizations? Major PlayersInternational environmental organizations gather<strong>and</strong> evaluate environmental data, help developenvironmental treaties, <strong>and</strong> provide funds <strong>and</strong> loansfor sustainable economic development.A symphony of international environmental organizationshelps shape <strong>and</strong> set environmental policy.Perhaps the most influential is the United Nationswith a large family of organizations such as the UNEnvironment Programme (UNEP), the World HealthOrganization (WHO), United Nations DevelopmentProgramme (UNDP), <strong>and</strong> the Food <strong>and</strong> AgricultureOrganization (FAO).Other organizations that make or influence environmentaldecisions are the World Bank, the GlobalEnvironment Facility (GEF), <strong>and</strong> the World ConservationUnion (IUCN). The website for this chapter has alist of major international environmental organizations.These organizations have played important roles in■ Exp<strong>and</strong>ing underst<strong>and</strong>ing of environmental issues■ Gathering <strong>and</strong> evaluating environmental data■ Helping develop <strong>and</strong> monitor international environmentaltreaties■ Providing funds <strong>and</strong> loans for sustainable economicdevelopment <strong>and</strong> reducing poverty■ Helping more than 100 nations develop environmentallaws <strong>and</strong> institutionsDespite their often limited funding, these diverseorganizations have made important contributions toglobal <strong>and</strong> national environmental progress since 1970.Since the 1972 UN Conference on the HumanEnvironment in Stockholm, Sweden, progress hasbeen made in addressing environmental issues at theglobal level. Political scientist Keith Caldwell creditsthe Stockholm conference with forcing many governmentsto develop domestic environmental programs<strong>and</strong> legitimizing not harming the biosphere as anobject of national <strong>and</strong> international concern <strong>and</strong> policy.It also created the United Nations EnvironmentProgramme (UNEP) to help develop the global environmentalagenda. But the UNEP is a small <strong>and</strong> underfundedagency. Figure 27-8 (p. 624) lists some of thegood <strong>and</strong> bad news about international efforts to dealwith global environmental problems such as poverty,climate change, biodiversity loss, <strong>and</strong> ocean pollution.Carefully study this figure.The primary focus of the international communityon environmental problems has been the developmentof various international environmental laws <strong>and</strong> nonbindingpolicy declarations called conventions. Over500 international environmental treaties <strong>and</strong> agreements—knownas multilateral environmental agreements(MEAs)—have been developed, two-thirds of themsigned in recent decades. The website for this chapterlists some of the major MEAs.To date, the Montreal <strong>and</strong> Copenhagen Protocolsfor protecting the ozone layer are the most successfulexamples of how the global community can work togetherto deal with a serious global environmentalchallenge (p. 488). Figure 27-9 (p. 624) lists some majorproblems with MEAs <strong>and</strong> solutions to these problems.During the past 30 years James Gustave (Gus)Speth has either created or run many of the world’smost important environmental organizations, includingthe Natural Resources Defense Council, the WhiteHouse Council on <strong>Environmental</strong> Quality, <strong>and</strong> theUnited Nations Development Program, <strong>and</strong> is nowdean of Yale University’s School of Forestry <strong>and</strong> <strong>Environmental</strong>Studies. In 1994, he wrote the book Red Skyat Morning, summarizing his insider view of globalenvironmental efforts. He gives a failing grade to almostevery effort.Here are some of his observations. The UnitedStates “led the fight for national-level [environmental]policies in the 1970s. But with the exception of theMontreal <strong>and</strong> Copenhagen Protocols for protecting theozone layer, the United States has largely failed to giveinternational leadership on the global environmentalagenda.... The world needs a United States that leadsby example <strong>and</strong> diplomacy, with generosity <strong>and</strong>compassion.”“The current system of international efforts to helpthe environment simply isn’t working. ...The climatehttp://biology.brookscole.com/miller14623
Trade-OffsGlobal Efforts on <strong>Environmental</strong> <strong>Problems</strong>Good NewsBad News<strong>Environmental</strong> protectionagencies in 115 nationsOver 500 internationalenvironmental treaties <strong>and</strong>agreementsUN Environment Programme(UNEP) created in 1972 tonegotiate <strong>and</strong> monitorinternational environmentaltreaties1992 Rio Earth Summit adoptedkey principles for dealing withglobal environmental problems2002 Johannesburg EarthSummit attempted to implementpolicies <strong>and</strong> goals of 1992Rio summit <strong>and</strong> find ways toreduce povertyMost internationalenvironmental treaties lackcriteria for monitoring <strong>and</strong>evaluating their effectiveness1992 Rio Earth Summit led tononbinding agreements withoutenough funding to implement themBy 2003 there was littleimprovement in the majorenvironmental problemsdiscussed at the 1992 RioEarth Summit2002 Johannesburg EarthSummit failed to provideadequate goals, deadlines,<strong>and</strong> funding for dealing withglobal environmental problemssuch as climate change,biodiversity loss, <strong>and</strong> povertyFigure 27-8 Trade-offs: good <strong>and</strong> bad news about international efforts to deal with global environmentalproblems. Pick the single piece of good news <strong>and</strong> the single piece of bad news thatyou think are the most important.SolutionsInternational <strong>Environmental</strong> Treaties<strong>Problems</strong>Take a long timeto develop <strong>and</strong>are weakened byrequiring fullconsensusPoorly monitored<strong>and</strong> enforcedLack of fundingfor monitoring <strong>and</strong>enforcementTreaties are notintegrated withone anotherSolutionsDo not require fullconsensus amongregulating partiesEstablishprocedures formonitoring <strong>and</strong>enforcementIncrease fundingfor monitoring <strong>and</strong>enforcementHarmonize orintegrate existingagreementsFigure 27-9 Major problems with global environmental treaties<strong>and</strong> agreements <strong>and</strong> solutions to these problems.convention is not protecting climate, the biodiversityconvention is not protecting biodiversity, the desertificationconvention is not preventing desertification”<strong>and</strong> ...“the Law of the Sea is not protecting fisheries.Nor are they poised to do so in the immediate future.”And protection of the world’s forest has not even“reached the point of a convention.”According to Speth, “Global environmental problemshave gone from bad to worse <strong>and</strong> governmentsare not yet prepared to deal with them.” However, hedoes cite some success in the protocols on protectingthe ozone layer, the Convention on the Trade inEndangered Species (CITES), <strong>and</strong> the Ocean DumpingConvention.Speth says that “In general, the issue with majortreaties is not weak enforcement or weak compliance;the issue is weak treaties. These agreements are easyfor governments to slight because their impressivegoals are not followed by clear requirements, targets,<strong>and</strong> timetables ...<strong>and</strong> an unwillingness to commitfinancial resources for real incentives.” He says that“international law is still far too dominated by the outmodedconcept that only governments get to play” insteadof following a principle in the 1972 Rio conventionthat “environmental issues are best h<strong>and</strong>led withthe participation of all concerned citizens.”624 CHAPTER 27 Politics, Environment, <strong>and</strong> <strong>Sustainability</strong>
Speth <strong>and</strong> several other national <strong>and</strong> internationalenvironmental leaders call for establishing a WorldEnvironment Organization (WEO) to help develop<strong>and</strong> oversee global environmental policies. He says itis strange that we have World Trade Organization(WTO), World Health Organization (WHO), <strong>and</strong> anumber of other similar organizations but no World<strong>Environmental</strong> Organization (WEO). He asks us toimagine what might have happened with global environmentalpolicies if the developed nations “hadput as much energy into a WEO as they have put intothe WTO.”Case Study: Is Encouraging Global FreeTrade <strong>Environmental</strong>ly Helpful or Harmful?A Difficult IssueThere is concern that current rules for reducingglobal trade barriers may weaken national lawsthat protect the environment, consumers, <strong>and</strong>workers.Like it or not, we are in an age of rapid economic, political,<strong>and</strong> social globalization. Exp<strong>and</strong>ing internationaltrade is seen as a way to stimulate economiesaround the world, help distribute wealth, <strong>and</strong> decreasepoverty.According to the economic comparative advantagehypothesis, each country or place in a country oftenhas an advantage over other areas in producing or sellingone or more types of goods or services. These advantagescan result from various factors such as a poolof cheap or technically skilled labor or availability ofresources such as minerals, good soil, ample water, solarenergy, or wind.International free trade allows companies providinggoods <strong>and</strong> services to take advantage of thecheapest labor <strong>and</strong> resources anywhere in the world.In theory, this should also lower the market prices ofgoods <strong>and</strong> services for consumers. For example, recentlysome major American companies have been usingIndian workers as computer programmers becausetheir hourly wage is about one-fifth the wage of programmersin the United States. This has alarmedAmerican workers who have lost well-paying jobs inthis <strong>and</strong> other fields where jobs are being outsourced toother countries.On April 15, 1994, representatives of 120 nationssigned the Uruguay Round of the General Agreementon Tariffs <strong>and</strong> Trade (GATT). This is a revised versionof the 1948 GATT convention, which attempted tolower tariff barriers to world trade between membernations. The new GATT established a World TradeOrganization (WTO) <strong>and</strong> gave it the status of a majorinternational organization similar in stature <strong>and</strong>power to the United Nations <strong>and</strong> the World Bank. TheWTO’s role is to enforce the new GATT rules of worldtrade <strong>and</strong> settle disputes about these rules betweennations.Currently, the WTO has 141 member countries.Representatives of the Quad Countries—the UnitedStates, Canada, Japan, <strong>and</strong> the European Union—determinemost WTO policy. GATT <strong>and</strong> the WTO are the resultof negotiations among the world’s major industrialnations, which regulate 90% of all international trade.GATT has removed some trade barriers that restrictinternational trade by developing nations. Butcritics complain that the system is designed to ensurethat the primary role of most developing nations is tosupply raw materials, such as minerals, timber, <strong>and</strong>agricultural commodities, to developed nations, whichturn these imported resources into high-priced goodstraded in international markets. As a result, critics saythat such developing nations get little of the incomegenerated by international trade.Most WTO officials are trade experts <strong>and</strong> corporatelawyers, representing primarily the interests oftransnational corporations. The WTO has no electedrepresentatives <strong>and</strong> is not subject to freedom of informationlaws or public review of its proceedings <strong>and</strong>decisions. Any member country can charge any otherWTO member country with violating one of theWTO’s complex international trade rules.When this occurs, several things happen. First, thecase is decided in secret by a tribunal of three anonymousWTO judges, usually corporate lawyers with noparticular expertise in the issues being decided. Thereare no conflict-of-interest restraints on tribunal members,<strong>and</strong> no information about their possible conflictsof interest is available to the public.Second, all documents, transcripts, <strong>and</strong> details ofthe proceedings are kept secret <strong>and</strong> only the results areannounced.Third, only official government representatives ofthe countries involved can submit documents or appearbefore the tribunal.Fourth, decisions are binding worldwide <strong>and</strong> canbe appealed only to another tribunal of judges withinthe WTO. A final panel ruling can be appealed to theentire WTO but can be overturned only by agreementof all WTO members. This is virtually impossible becausethe winning country is unlikely to vote to overturna ruling in its favor.Any country (or part of a country) that violates aruling of WTO panels has four choices: amend its lawsto comply with WTO rules, pay annual compensationto the winning country, pay high tariffs imposed onthe disputed goods by the WTO, or find itself shunned<strong>and</strong> locked out of global commerce.Proponents argue that this significant transfer ofpower from nations to the WTO is necessary <strong>and</strong> beneficialfor several reasons. First, globalization of trade isinevitable <strong>and</strong> we have to take part in guiding it. Second,http://biology.brookscole.com/miller14625
educing global trade barriers will benefit developingcountries, whose products often are at a competitivedisadvantage in the global marketplace because oftrade barriers erected by developed countries.Third, reducing global trade barriers can stimulateeconomic growth in all countries by allowing consumersto buy more things at lower prices. Fourth,globalization of trade will raise the environmental <strong>and</strong>health st<strong>and</strong>ards of developing countries.However, opponents contend that current WTOrules will have several harmful consequences. First,they will increase the economic <strong>and</strong> political power oftransnational corporations <strong>and</strong> decrease the power ofsmall businesses, citizens, <strong>and</strong> democratically electedgovernments. Second, they will eliminate many jobs<strong>and</strong> lower wages in developed countries <strong>and</strong> eventuallyin developing countries as transnational companiesmove their operations throughout the world insearch of cheap labor, natural resources, <strong>and</strong> lower environmentalst<strong>and</strong>ards. Third, current WTO rules willweaken environmental <strong>and</strong> health <strong>and</strong> safety st<strong>and</strong>ardsin developed countries.According to critics, some WTO rules <strong>and</strong> omissionsof principles affect the ability of national, state,<strong>and</strong> local governments to protect the environment, thehealth of citizens, <strong>and</strong> worker health <strong>and</strong> safety. Hereare some examples:■ Governments cannot set st<strong>and</strong>ards for how importedproducts are produced or harvested. Thismeans, for example, that government purchasing policiescannot discriminate against materials producedby child labor or slave labor. Also, they cannot requirethat items be manufactured from recycled materials orthat fish-harvesting methods be protective of dolphinsor turtles, for example.■ Current WTO rules do not recognize the rights ofcountries to take action to protect the atmosphere, theoceans, <strong>and</strong> other parts of the global commons. Thereis concern that some provisions of internationaltreaties to protect biodiversity <strong>and</strong> the ozone layer<strong>and</strong> to reduce the threats of global warming might beruled illegal under WTO rules.■ All national, state, or local environmental, health,<strong>and</strong> safety laws <strong>and</strong> regulations must be based onglobally accepted scientific evidence <strong>and</strong> risk analysisshowing there is a worldwide scientific consensus onthe danger. Otherwise, they are considered to be tradebarriers that exceed WTO international st<strong>and</strong>ards.Because of the inherent scientific <strong>and</strong> other uncertaintiesin determining health risks <strong>and</strong> carrying out riskanalysis, this requirement is almost impossible tomeet. In other words, the burden of proof falls onthose trying to prevent pollution rather than on polluters(Figure 27-10). This means that chemicals, products,<strong>and</strong> technologies cannot be banned on the basis<strong>Environmental</strong>ScientistsPollution Control Using Risk AnalysisBurden of ProofPollutersPollution Prevention <strong>and</strong> Precautionary Principle<strong>Environmental</strong>ScientistsBurden of ProofPollutersFigure 27-10 The environmental burden of proof falls ondifferent parties, depending on the system used.of the pollution prevention <strong>and</strong> precautionary principles—twoof the foundation stones of modern environmentalprotection.■ National laws covering packaging, recycling, <strong>and</strong>eco-labeling of items involved in international marketsare illegal barriers to trade. Enforcing this rule caneffectively cancel the third mainstay of modern environmentalprotection: consumers’ right to know aboutthe safety <strong>and</strong> content of products through labeling.If allowed to st<strong>and</strong>, environmentalists contendthat the four WTO rules just described will force usback to an earlier <strong>and</strong> less effective era of using end-ofpipepollution cleanup based on uncertain <strong>and</strong> easilymanipulated risk assessment as the primary ways fordealing with pollution.On a more positive note, nations may be able touse the WTO to reduce environmentally harmful subsidiesthat distort the economic playing field. But thiswould also prevent using subsidies to reward companiesproducing environmentally beneficial goods <strong>and</strong>services—an important part of the proposed strategyfor developing eco-economies (Figure 26-16, p. 602).Solutions: Improving Trade Agreements:<strong>Environmental</strong>ly Sustainable TradeCritics call for changing trade agreementsto make WTO proceedings more open <strong>and</strong> toestablish global st<strong>and</strong>ards for protecting theenvironment, consumers, <strong>and</strong> workers.Critics of current trade agreements would rewrite <strong>and</strong>correct what they believe are serious weaknesses inGATT <strong>and</strong> turn it into GAST: the General Agreement forSustainable Trade.They offer several suggestions for doing this.■ Set minimum environmental, consumer protection,<strong>and</strong> worker health <strong>and</strong> safety st<strong>and</strong>ards for all participatingcountries.626 CHAPTER 27 Politics, Environment, <strong>and</strong> <strong>Sustainability</strong>
■ Open all discussions <strong>and</strong> findings of any GATTpanel or other WTO body to global public scrutiny<strong>and</strong> inputs from experts on the issues involved.■ Incorporate the precautionary <strong>and</strong> pollution preventionprinciples into WTO rules.■ Protect the rights of consumers to know about thehealth <strong>and</strong> environmental impact of imported productsthey purchase by allowing eco-labeling programs.■ Recognize the right of countries to use trade measuresto protect the global commons.■ Allow countries to require that imported or exporteditems be manufactured totally or partially fromrecycled materials.■ Allow national, state, or local governments to restrictimports of products from countries shown by internationalinvestigation to use child or slave labor orviolate universally recognized human rights.■ Allow international environmental agreements<strong>and</strong> treaties to prevail when they conflict with WTOrules or the rules of any other trade agreement.■ Set up <strong>and</strong> fund a World <strong>Environmental</strong> Organization(WEO) as a counterbalance to the power <strong>and</strong>influence of the WTO over global <strong>and</strong> national environmentalpolicy.Unless citizens <strong>and</strong> NGOs exert intense pressureon legislators in the Quad countries governing theWTO, critics warn that such safeguards will not be incorporatedinto GATT <strong>and</strong> other international tradeagreements.xHOW WOULD YOU VOTE? Do you favor changing tradeagreements to make WTO proceedings more open <strong>and</strong>to establish global st<strong>and</strong>ards for protecting the environment,consumers, <strong>and</strong> workers? Cast your vote online athttp://biology.brookscole.com/miller14.INDIVIDUALSMATTERSevern Cullis-SuzukiAt the age of 12 Severn Cullis-Suzuki <strong>and</strong> three of herVancouver, Canada, schoolmatesraised money to go to the 1992Rio Earth Summit. She was invitedto address the delegates. Inher speech, which had a great impact <strong>and</strong> receiveda st<strong>and</strong>ing ovation, she said: “In school you teachus not to fight with others, to work things out, torespect others, to clean up our mess, not to hurtother creatures, to share, not be greedy. Then whydo you go out <strong>and</strong> do these things you tell us notto do? You grownups say you love us, but I challengeyou, please, to make your actions reflectyour words.”She went on to get a B.S. degree in biology fromYale University <strong>and</strong> was invited to attend the 2002Johannesburg Earth Summit as a member of UNSecretary-General Kofi Annan’s World Summit advisorypanel.As a member of today’s younger generation,what advice does she have? “When I was little theworld was simple. But as a young adult, I amlearning that as we have to make choices—education,career, lifestyle—life gets more <strong>and</strong> more complicated.She reports that much of what she wantedfor the world’s future when she was 12 “was idealistic<strong>and</strong> naïve.”“Today I am no longer a child, but I’m worriedabout what kind of environment my childrenwill grow up in. ... Wearenotfacing up to ourmess. We are not facing up to our lifestyles. ...Real environmental change depends on us. Wecan’t wait for our leaders. ... Thechallenges aregreat, but if we accept individual responsibility<strong>and</strong> make sustainable choices, we will rise to thechallenges.”Can We Develop More <strong>Environmental</strong>lySustainable Political <strong>and</strong> Economic Systemsin the Next Few Decades? Establishing a NewPartnershipWe need to work together to find <strong>and</strong> implementinnovative solutions to local, national, <strong>and</strong>global environmental, economic, <strong>and</strong> socialproblems.<strong>Environmental</strong>ists call for people from all political persuasions<strong>and</strong> walks of life to work together to developa positive vision for a transition to more environmentallysustainable societies <strong>and</strong> economies throughoutthe world (Individuals Matter, above right).A major goal would be to promote the developmentof creative experiments at local levels—such asthe one in Curitiba, Brazil (p. 563)—that could bespread to other areas over the next few decades. A secondgoal is to get citizens, business leaders, <strong>and</strong>elected officials to cooperate in trying to find <strong>and</strong> implementinnovative solutions to local, national, <strong>and</strong>global environmental, economic, <strong>and</strong> social problems.Some progress is being made in developing moreenvironmentally sustainable societies, especially inseveral European Union countries <strong>and</strong> in Canada. TheWorld Economic Forum, The Yale Center for <strong>Environmental</strong>Law <strong>and</strong> Policy, <strong>and</strong> the Center for InternationalEarth Science Information Network (CIESIN) at ColumbiaUniversity have developed an <strong>Environmental</strong><strong>Sustainability</strong> Index (ESI). It measures the overall environmentalprogress of 142 countries using 20 core indicators,including urban air quality, resource use, <strong>and</strong>environmental regulation.http://biology.brookscole.com/miller14627
In 2002, Finl<strong>and</strong>, Norway, Sweden, Canada, <strong>and</strong>Switzerl<strong>and</strong> had in order the highest ESI scores.Kuwait, the United Arab Emigrates, North Korea, Iraq,<strong>and</strong> Saudi Arabia had the lowest score. The UnitedStates ranked 45th out of the 142 countries evaluated.It received a high rating for decreasing water pollution<strong>and</strong> conventional air pollutants <strong>and</strong> active discussionof environmental policy. But it received a low rating onreducing greenhouse gas emissions <strong>and</strong> reducing resourcewaste.Proponents recognize that making a cultural shiftto more environmentally sustainable societies over thenext few decades will be controversial, <strong>and</strong> like all significantchange it will not be predictable, orderly, orpainless.According to business leader Paul Hawken, makingthis change meansthinking big <strong>and</strong> long into the future. It also means doingsomething now. It means electing people who reallywant to make things work, <strong>and</strong> who can imagine a betterworld. It means writing to companies <strong>and</strong> tellingthem what you think. It means never forgetting thatthe cash register is the daily voting booth in democraticcapitalism.Several guidelines have been suggested for fosteringcooperation instead of confrontation as we dealwith important environmental problems. First, recognizethat business is not the enemy. Businesses are hereto make money for their investors <strong>and</strong> stockholders.So why not reward them <strong>and</strong> encourage new environmentalinnovations by shifting government subsidiesfrom earth-degrading activities to earth-sustaining activities<strong>and</strong> by shifting taxes from income <strong>and</strong> wealthto pollution <strong>and</strong> resource waste? <strong>Environmental</strong>ists<strong>and</strong> leaders of corporations could thus become partnersin a joint quest for environmental <strong>and</strong> economicsustainability.Second, shift the emphasis for dealing with environmentalproblems to preventing or minimizingthem. Third, use well-designed <strong>and</strong> carefully monitoredmarketplace solutions to prevent most environmentalproblems instead of relying primarily on laws,regulations, <strong>and</strong> litigation in dealing with environmentalproblems.Fourth, cooperate <strong>and</strong> innovate to find win-winsolutions to environmental problems instead of usingconfrontational tactics to come up with less effective I-win-you-lose solutions in which the earth always endsup losing.Fifth, stop exaggerating. People on both sides ofthorny environmental issues should take a vow not toexaggerate or distort their positions in attempts toplay win-lose environmental games. They should recognizethat there are trade-offs in any environmentaldecision—as presented throughout this book—<strong>and</strong>work together to find balanced win-win solutions thatare implemented in a flexible <strong>and</strong> adaptive manner.In working to make the earth a better place tolive, we should be guided by historian ArnoldToynbee’s observation, “If you make the world everso little better, you will have done splendidly, <strong>and</strong>your life will have been worthwhile,” <strong>and</strong> by GeorgeBernard Shaw’s reminder that “indifference is the essenceof inhumanity.”In the end, it all comes back to each of us taking responsibility.We all have to decide whether we want tobe part of the problem or part of the solution to the environmentalchallenges we face.As the wagon driver said when they came to a long, hard hill,“Them that’s going on with us, get out <strong>and</strong> push. Them thatain’t, get out of the way.”ROBERT FULGHUMCRITICAL THINKING1. What are the greatest strengths <strong>and</strong> weaknesses of thesystem of government in your country with respect to(a) protecting the environment <strong>and</strong> (b) ensuring environmentaljustice for all? What three major changes, if any,would you make in this system?2. Explain why you agree or disagree with the nine principlesrecommended by some analysts for use in makingenvironmental policy decisions listed on pp. 607–608.3. Rate the last four presidents of the United States (orleaders of the country where you live) on a scale of 1–10in terms of their ability to act as environmental leaders.4. Suppose a presidential c<strong>and</strong>idate ran on a platformcalling for the federal government to phase in a tax ongasoline so that, over 5–10 years, the price of gasolinewould rise to $5–8 a gallon (as is the case in Japan <strong>and</strong> mostwestern European nations). The c<strong>and</strong>idate argues that thistax increase is necessary to encourage oil <strong>and</strong> gasoline conservation,reduce air pollution, slow global warming, <strong>and</strong>enhance future economic, environmental, <strong>and</strong> military security.The c<strong>and</strong>idate also says the tax revenue would beused to reduce taxes on wages <strong>and</strong> profits <strong>and</strong> to providean economic safety net for the poor <strong>and</strong> lower middleclass. Would you vote for this c<strong>and</strong>idate who wants togreatly increase the price of gasoline? Explain.5. What are the advantages <strong>and</strong> disadvantages of usingonly public funds to finance all election campaigns? Explainwhy you support or oppose such an idea. Whymight the major environmental groups in the UnitedStates not support such a reform? Should they?6. Explain why you agree or disagree with each of threesolutions given on p. 618 for leveling the legal playingfield for citizens who have suffered environmental harm.Try to interview an environmental lawyer <strong>and</strong> a corporatelawyer to get their views on this.628 CHAPTER 27 Politics, Environment, <strong>and</strong> <strong>Sustainability</strong>
7. Explain why you agree or disagree with each of thesuggestions listed on pp. 626–627 for improving orrevising the current rules of the World Trade Organization.Do you favor establishing a World <strong>Environmental</strong>Organization? Explain.8. Some people say: “Most people will not become involvedin making the world a better place so why shouldI?” “Individuals cannot make a difference.” “People willact only when there is a crisis, <strong>and</strong> by then it will be toolate.” Do you have any of these attitudes? Compare yourresponse with those of other members of your class.Some analysts say that these are merely excuses or rationalizationssome people use to avoid getting involved,<strong>and</strong> as such, are forms of intellectual dishonesty <strong>and</strong> civic<strong>and</strong> ethical laziness. Do you agree with this assessment?9. Congratulations! You are in charge of formulating environmentalpolicy in the country where you live. Listthe three most important components of your policy.Compare your views with those of other members ofyour class <strong>and</strong> see if you can agree on a consensus policy.PROJECTS1. Polls have identified five categories of U.S. citizensin terms of their concern over environmental quality:(1) those involved in a wide range of environmental activities,(2) those who do not want to get involved but arewilling to pay more for a cleaner environment, (3) thosewho are not involved because they disagree with manyenvironmental laws <strong>and</strong> regulations, (4) those who areconcerned but do not believe individual action will makemuch difference, <strong>and</strong> (5) those who strongly oppose theenvironmental movement. To which group do you belong?Compare the results of members in your class <strong>and</strong>determine the percentage in each category. As a class,conduct a similar poll on your campus.2. Have each member of your class select a particular environmentallaw, <strong>and</strong> evaluate it in terms of (a) its use ofor failure to use the principles listed on pp. 607–608 <strong>and</strong>(b) the role that environmental organizations <strong>and</strong> citizenactions played in its development. Compare the resultsof these analyses.3. Pick a particular environmental law in the UnitedStates or in the country where you live. Use the library orthe Internet to evaluate the law’s major strengths <strong>and</strong>weaknesses. Decide whether the law should be weakened,strengthened, or abolished, <strong>and</strong> explain why. Listthe three most important ways you believe the lawshould be improved.4. Try to interview (a) a lobbyist for an industry seekingto weaken a specific environmental law, (b) a lobbyist foran environmental group seeking to strengthen the law,(c) an EPA official supporting strengthening the law, <strong>and</strong>(d) an elected representative who must make a decisionabout the law. Compare their views <strong>and</strong> perspectives,<strong>and</strong> come to a conclusion about what should be done. Ifyou cannot get interviews, set up a mock discussionpanel with class members taking each of these roles.5. What student environmental groups, if any, are activeat your school? How many people actively participate inthem? Pick one of these groups <strong>and</strong> find out what environmentallybeneficial things have they done. What actionstaken by this group, if any, do you disagree with?Why?6. Use the library or the Internet to learn about <strong>and</strong> evaluatethe effectiveness of a particular national or internationalenvironmental group. What is your chosen group’smission? How successful has the group been in fulfillingits mission? To what do you attribute its success or failure?7. Use the Internet <strong>and</strong> the local phonebook to identifyenvironmental or conservation groups in your area.Contact them for information on their activities <strong>and</strong>their achievements <strong>and</strong> report this information to yourclass.8. Use the library or the Internet to learn about <strong>and</strong> evaluatea specific environmentally related decision made bythe World Trade Organization in determining whether ornot a member nation violated one of its internationaltrade rules. Explain why you agree or disagree with thisdecision.9. Use the library or the Internet to find bibliographic informationabout Lord Kennet <strong>and</strong> Robert Fulghum, whosequotes appear at the beginning <strong>and</strong> end of this chapter.10. Make a concept map of this chapter’s major ideas,using the section heads, subheads, <strong>and</strong> key terms (inboldface type). Look at the website for this book for informationabout making concept maps.LEARNING ONLINEThe website for this book contains study aids <strong>and</strong> manyideas for further reading <strong>and</strong> research. They include achapter summary, review questions for the entire chapter,flash cards for key terms <strong>and</strong> concepts, a multiple-choicepractice quiz, interesting Internet sites, references, <strong>and</strong>a guide for accessing thous<strong>and</strong>s of InfoTrac ® CollegeEdition articles. Log on tohttp://biology.brookscole.com/miller14Then click on the Chapter-by-Chapter area, choose Chapter27, <strong>and</strong> select a learning resource.http://biology.brookscole.com/miller14629
28 Ethics,<strong>Environmental</strong> Worldviews,<strong>and</strong> <strong>Sustainability</strong>CASE STUDYBiosphere 2: A Lessonin HumilityIn 1991, eight scientists (four men <strong>and</strong> four women)were sealed into Biosphere 2, a $200 million facilitydesigned to be a self-sustaining life-support system(Figure 28-1) <strong>and</strong> to increase our underst<strong>and</strong>ing of theearth’s life-support system: Biosphere 1.The 1.3-hectare (3.2-acre) sealed system of interconnecteddomes was built in the desert near Tucson,Arizona. It had a tropical rain forest, savanna, desert,lakes, streams, freshwater <strong>and</strong> saltwater wetl<strong>and</strong>s,<strong>and</strong> a mini-ocean with a coral reef.The facility was stocked with more than 4,000species of organisms. Sunlight <strong>and</strong> external naturalgas–powered generators provided energy. TheBiospherians were to be isolated for 2 years <strong>and</strong> toraise their own food using intensive organic agriculture,breathe air recirculated by plants, <strong>and</strong> drinkwater cleansed by natural recycling processes.From the beginning there were many unexpectedproblems. The life-support system began unraveling.Large amounts of oxygen disappeared when soil organismsconverted it to carbon dioxide. Additionaloxygen had to be pumped in from the outside to keepthe Biospherians from suffocating.The nitrogen <strong>and</strong> carbon recycling systems alsofailed to function properly. Levels of nitrous oxide rosehigh enough to threaten the occupants with braindamage <strong>and</strong> had to be controlled by outside intervention.Carbon dioxide skyrocketed to levels that threatenedto poison the humans <strong>and</strong> spurred the growth ofweedy vines that choked out food crops. Plant nutrientsleached from the soil <strong>and</strong> polluted the water systems.Tropical birds died after the first freeze. AnArizona ant species got into the enclosure, proliferated,<strong>and</strong> killed off most of the system’s introducedinsect species. After the majority of the introducedinsect species became extinct, the facility was overrunwith cockroaches <strong>and</strong> katydids. All together, 19 of theBiosphere’s 25 small animal species became extinct.Before the 2-year period was up, all plant-pollinatinginsects became extinct, thereby dooming to extinctionmost of the plant species.Despite many problems, the facility’s waste <strong>and</strong>wastewater were recycled, <strong>and</strong> the Biospherians wereable to produce 80% of their food supply.Scientists Joel Cohen <strong>and</strong> David Tilman, whoevaluated the project, concluded, “No one yet knowshow to engineer systems that provide humans withlife-supporting services that natural ecosystems providefor free.”Columbia University took over Biosphere 2 as a researchfacility for a few years, but ab<strong>and</strong>oned it in 2003.Figure 28-1 Biosphere 2, constructed near Tucson, Arizona, was designed to be a self-sustaining life-supportsystem for eight people sealed into the facility in 1991. The experiment failed because of a breakdown in itsnutrient cycling systems.
The main ingredients of an environmental ethic are caringabout the planet <strong>and</strong> all of its inhabitants, allowing unselfishnessto control the immediate self-interest that harms others,<strong>and</strong> living each day so as to leave the lightest possible footprintson the planet.ROBERT CAHNThis chapter involves discussions of values, beliefs<strong>and</strong> ethics—subjects on which people disagree. Yetsolving environmental problems requires grapplingwith our values <strong>and</strong> beliefs, implementing them inour lives, discussing them with one another, <strong>and</strong>working to agree on courses of action for solvingproblems.This chapter addresses the following questions:■ What human-centered environmental worldviewsguide most industrial societies?■ What are some life-centered <strong>and</strong> earth-centeredenvironmental worldviews?■ What ethical guidelines might be used to help uswork with the earth?■ How can we live more sustainably?28-1 ENVIRONMENTAL WORLDVIEWSIN INDUSTRIAL SOCIETIESWhat Is an <strong>Environmental</strong> Worldview?Beliefs <strong>and</strong> ValuesYour environmental worldview is how you thinkthe world works, what you believe your role in itshould be, <strong>and</strong> what you believe is right <strong>and</strong> wrongin terms of environmental behavior.People disagree about how serious our environmentalproblems are <strong>and</strong> what we should do about them. Theconflicts arise mostly out of differing environmentalworldviews: how people think the world works, whatthey believe their role in it should be, <strong>and</strong> what theybelieve is right <strong>and</strong> wrong in terms of environmentalbehavior (environmental ethics).People with widely differing environmentalworldviews can take the same data, be logically consistent,<strong>and</strong> arrive at quite different conclusions becausethey start with different assumptions, beliefs,<strong>and</strong> values.Figure 28-2 (p. 632) shows some different types ofenvironmental worldviews. Most can be characterizedas human-centered, earth-centered, or some combinationof both. As you move from the center of Figure 28-2to the outside rings, the worldviews become lesshuman-centered <strong>and</strong> more earth-centered <strong>and</strong> devotedto sustaining the earth’s natural systems (ecosystems),life-forms (biodiversity), <strong>and</strong> life-support system (biosphere)for the benefit of humans <strong>and</strong> other forms oflife.How Do We Decide What Is Right <strong>and</strong> Wrong<strong>Environmental</strong> Behavior? A Search for EthicalPrinciplesSeveral philosophies can help us decide what is right<strong>and</strong> wrong environmental behavior.There are several major moral philosophical systemsthat deal with the concepts of what constitutes right<strong>and</strong> wrong environmental (or other) behavior.One is universalism, developed by philosopherssuch as Plato (427–347 B.C.E.) <strong>and</strong> Immanuel Kant(1724–1804). According to this view, there are basicprinciples of ethics, or rules of right <strong>and</strong> wrong, thatare universal <strong>and</strong> unchanging. Some believe that Godor other sources of wisdom have provided ethicalguidelines. Others believe that these rules can be discoveredthrough reason, experience, <strong>and</strong> knowledge.Another philosophy is utilitarianism, developedby Jeremy Bentham (1748–1832) <strong>and</strong> John Stuart Mill(1806–1873). It says that an action is right if it producesthe greatest satisfaction or pleasure for the greatestnumber of people. Critics contend that this assumesthat we can somehow quantitatively measure happiness<strong>and</strong> compare it among different people.A related moral philosophy is consequentialism,which proposes that whether an act is morally right orwrong depends on its consequences. In effect, we determinecorrect moral conduct solely by conducting a costbenefitanalysis of the consequences of our actions.Thus an action is morally right if its consequences as awhole are more favorable than unfavorable.Another philosophy of right <strong>and</strong> wrong is relativism,promoted by ancient Greek teachers calledSophists who disagreed with Plato’s universalistethics. It asserts that moral values of right <strong>and</strong> wrongare relative to cultures, eras, or situations <strong>and</strong> there areno absolute principles of right <strong>and</strong> wrong.According to the philosophy of rationalism, we c<strong>and</strong>evelop principles of right <strong>and</strong> wrong by using logic toanalyze ideas <strong>and</strong> arguments. This philosophy basedon the power of reason was developed by philosopherssuch as René Descartes (1596–1650), BenedictDe Spinoza (1632–1677), <strong>and</strong> Gottfried W. Leibniz(1646–1716).According to nihilism, often associated withFriedrich Nietzsche (1844–1900 ), the concepts of values<strong>and</strong> moral beliefs are useless because nothing canbe known or communicated. There is no purpose ormeaning to life except the struggle to survive in which“might is right.”Because this is not a philosophy textbook, the briefsummaries of several moral philosophies just givenhttp://biology.brookscole.com/miller14631
More holisticMore atomisticBiosphere- or Earth-centeredEcosystem-centeredBiocentric(life-centered)PlanetarymanagementAnthropocentric(human-centered)Self-centeredInstrumentalvalues playbigger roleIntrinsicvalues playbigger roleStewardship<strong>Environmental</strong>wisdomFigure 28-2 <strong>Environmental</strong> worldviews lie on a continuum running from more self- <strong>and</strong> human-centered(center) to biosphere- or earth-centered (outer rings). (Diagram developed by Scott Spoolman)are necessarily superficial <strong>and</strong> incomplete. There aremany complex arguments involved in evaluatingthese <strong>and</strong> other moral philosophies that you can exploreby studying philosophy.What Is the Difference between Instrumental<strong>and</strong> Intrinsic Values? Usefulness versusExistenceLife forms have value because of their usefulnessto us or to the biosphere or merely because theyexist.What we value largely determines how we act. <strong>Environmental</strong>philosophers normally divide values intotwo types. One type, called instrumental or utilitarian,values life-forms because of their usefulness to us or tothe biosphere. The concept of preserving natural capital<strong>and</strong> biodiversity because they sustain life <strong>and</strong> supporteconomies is an instrumental value based mostly on theusefulness of these natural goods <strong>and</strong> services to us.A second type, called intrinsic or inherent, valuesa form of life just because it exists, regardless ofwhether it has any usefulness to us.As worldviews go from being human-cenetered tomore earth-centered (moving out from the center ofFigure 28-2) instrumental values play a lesser role, <strong>and</strong>intrinsic values become more important. The view thata wild species, an ecosystem, biodiversity, or the biospherehas value only because of its usefulness to us iscalled an anthropocentric (human-centered) instrumentalvalue.In contrast, the view that these forms of life arevaluable simply because they exist, independently oftheir use to human beings, is called a biocentric (lifecentered)intrinsic value. According to a biocentricworldview, all species <strong>and</strong> ecosystems <strong>and</strong> the biospherehave both intrinsic <strong>and</strong> instrumental value, we are justone of many species, <strong>and</strong> we have an ethical responsibilitynot to impair the long-term sustainability <strong>and</strong>adaptability of the earth’s natural systems for all life.What Are the Major Human-Centered<strong>Environmental</strong> Worldviews? Managers <strong>and</strong>StewardsIn the human-centered view, we are the planet’smost important species <strong>and</strong> should become managersor stewards of the earth.Some people in today’s industrial consumer societieshave a planetary management worldview. Accordingto this human-centered environmental worldview, weare the planet’s most important <strong>and</strong> dominant species<strong>and</strong> we can <strong>and</strong> should manage the earth mostly forour own benefit. Other species <strong>and</strong> parts of nature areseen as having only instrumental value based on howuseful they are to us. This is a form of utilitarianism.Figure 28-3 (left) summarizes the four major beliefsor assumptions of this environmental worldview. Hereare three variations of this environmental worldview:■ The no-problem school. We can solve any environmental,population, or resource problems with moreeconomic growth <strong>and</strong> development, better management,<strong>and</strong> better technology.■ The free-market school. The best way to managethe planet for human benefit is through a free-market632 CHAPTER 28 <strong>Environmental</strong> Worldviews, Ethics, <strong>and</strong> <strong>Sustainability</strong>
global economy with minimal government interference<strong>and</strong> regulations. All public property resourcesshould be converted to private property resources<strong>and</strong> the global marketplace, governed by pure freemarketcompetition, should decide essentiallyeverything.■ The spaceship-earth school. The earth is like a spaceship:a complex machine that we can underst<strong>and</strong>,dominate, change, <strong>and</strong> manage to prevent environmentaloverload <strong>and</strong> provide a good life for everyone.This view developed as a result of photographs takenfrom space showing the earth as a finite planet, or anisl<strong>and</strong> in space (Figure 5-1, p. 88). This led many peopleto see that the earth is our only home <strong>and</strong> we hadbetter treat it with care.Another anthropocentric environmental worldviewis the stewardship worldview. According to thisincreasingly popular view, we have an ethical responsibilityto be caring <strong>and</strong> responsible managers, or stewards,of the earth. We can <strong>and</strong> should make the world abetter place for our species <strong>and</strong> others through love,care, knowledge, <strong>and</strong> technology. Figure 28-3 (center)summarizes the major beliefs of this worldview.According to the stewardship view, as we use theearth’s natural capital, we are borrowing from theearth <strong>and</strong> from future generations, <strong>and</strong> we have anethical responsibility to pay the debt by leaving theearth in at least as good a condition as we enjoy.In thinking about our responsibility toward futuregenerations, some analysts believe we should considerthe wisdom of the 18th century Iroquois Confederationof Native Americans: In our every deliberation, wemust consider the impact of our decisions on the next sevengenerations.28-2 LIFE-CENTERED AND EARTH-CENTERED ENVIRONMENTALWORLDVIEWSCan We Manage the Planet? Look atBiosphere 2Some analysts doubt that we can effectivelymanage the planet.Some people believe any human-centered worldviewwill eventually fail because it wrongly assumes wenow have or can gain enough knowledge to becomeeffective managers or stewards of the earth.According to these analysts, the unregulated globalfree-market approach will not work because it is basedon increased losses or degradation of the earth’s natural<strong>Environmental</strong> WorldviewsPlanetary Management Stewardship <strong>Environmental</strong> Wisdom• As the planet's most importantspecies, we are in charge ofthe earth.• Because of our ingenuity <strong>and</strong>technology we will not run outof resources.• The potential for economicgrowth is essentially unlimited.• Our success depends on howwell we manage the earth's lifesupportsystems mostly for ourbenefit.• We are the planet's mostimportant species but we have anethical responsibility to care forthe rest of nature.• We will probably not run out ofresources, but they should notbe wasted.• We should encourageenvironmentally beneficial formsof economic growth <strong>and</strong>discourage environmentallyharmful forms.• Our success depends on howwell we manage the earth's lifesupportsystems for our benefit<strong>and</strong> for the rest of nature.• Nature exists for all species <strong>and</strong>we are not in charge of the earth.• Resources are limited, should notbe wasted, <strong>and</strong> are not all for us.• We should encourage earthsustainingforms of economicgrowth <strong>and</strong> discourage earthdegradingforms.• Our success depends on learninghow nature sustains itself <strong>and</strong>integrating such lessons fromnature into the ways we think<strong>and</strong> act.Figure 28-3 Comparison of two opposing environmental worldviews. Which of these environmental worldviewscomes closer to your own environmental worldview?http://biology.brookscole.com/miller14633
capital <strong>and</strong> focuses on short-term economicbenefits regardless of the harmful long-termenvironmental <strong>and</strong> social consequences.The image of the earth as an isl<strong>and</strong> orship in space has played an important role inraising global environmental awareness. Butcritics argue that thinking of the earth as aspaceship that we can manage is an oversimplified<strong>and</strong> misleading way to view an incrediblycomplex <strong>and</strong> ever-changing planet.This view was supported by the failure ofBiosphere 2 (p. 630).These critics point out that we do noteven know how many species live on theearth, much less what their roles are <strong>and</strong>how they interact with one another <strong>and</strong> theirnonliving environment. We have only aninkling of what goes on in a h<strong>and</strong>ful of soil, ameadow, a pond, or any other part of theearth.As biologist David Ehrenfeld puts it, “Inno important instance have we been able todemonstrate comprehensive successful managementof the world, nor do we underst<strong>and</strong>it well enough to manage it even in theory.”According to environmental educator DavidOrr: “On balance, I think, we are becomingmore ignorant because we are losing culturalknowledge about how to inhabit our placeson the planet sustainably, while impoverishingthe genetic knowledge accumulatedthrough millions of years of evolution.”What Are Life-Centered <strong>and</strong>Eco-Centered Worldviews? DecidingWhat to Protect <strong>and</strong> SustainSome believe we should focus onprotecting species from prematureextinction <strong>and</strong> others on not destroyingor degrading ecosystems, biodiversity,<strong>and</strong> the earth’s life support systems.People disagree over how far we should extendour ethical concerns for various forms orlevels of life (Figure 28-4). Some critics believethat human-centered environmental worldviewsshould be exp<strong>and</strong>ed to recognize theinherent or intrinsic value of all forms of life regardlessof their potential or actual use to us.Most people with a life-centered worldviewbelieve we have an ethical responsibilityto avoid causing the premature extinction ofspecies through our activities, for three reasons.First, each species is a unique storehouseof genetic information that should beBiosphereBiodiversity(Earth's genes, species,<strong>and</strong> ecosystems)EcosystemsAll species on earthAll animal speciesAll individualsof an animal speciesAll peopleNationCommunity<strong>and</strong> friendsFamilySelfFigure 28-4 Levels of ethical concern. Peopledisagree over how far we should extend our ethicalconcerns on this scale. How far up this scale wouldyou extend your own ethical concerns?respected <strong>and</strong> protected because it exists(intrinsic value). Second, each species is apotential economic good for human use(instrumental value). Third, populations ofspecies are capable through evolution <strong>and</strong>speciation of adapting to changing environmentalconditions.Trying to decide whether all or onlysome species should be protected from prematureextinction resulting from human activitiesis a difficult <strong>and</strong> controversial ethicalproblem. It is hard to know where to drawthe line <strong>and</strong> be ethically consistent.Here are three of the issues involved:First, should all species be protected frompremature extinction because of their intrinsicvalue, or should only certain ones be preservedbecause of their known or potentialinstrumental value to us or to their ecosystems?Second, should all insect <strong>and</strong> bacterialspecies be protected, or should we attemptto exterminate those that eat our crops, harmus, or transmit disease organisms?Third, should we emphasize protectingkeystone <strong>and</strong> foundation species over otherspecies that play lesser roles in ecosystems?Some people believe we must go beyondfocusing on species. They believe we have anethical responsibility not to degrade theearth’s ecosystems, biodiversity, <strong>and</strong> biospherefor this <strong>and</strong> future generations of humans<strong>and</strong> other species. In other words, theyhave an earth-centered, or ecocentric, environmentalworldview, devoted to preserving theearth’s biodiversity <strong>and</strong> the functioning of itslife-support systems for all forms of life.Why should we care about the earth’sbiodiversity? According to the late enviromentalist<strong>and</strong> systems expert DonellaMeadows,Biodiversity contains the accumulated wisdomof nature <strong>and</strong> the key to its future. Ifyou wanted to destroy a society, you wouldburn its libraries <strong>and</strong> kill its intellectuals.You would destroy its knowledge. Nature’sknowledge is contained in the DNA withinliving cells. The variety of genetic informationis the driving engine of evolution <strong>and</strong>the source of adaptability.634 CHAPTER 28 <strong>Environmental</strong> Worldviews, Ethics, <strong>and</strong> <strong>Sustainability</strong>
What Is the <strong>Environmental</strong> WisdomWorldview? Learning to Work with theEarthAccording to this view we are not in charge,should not waste the earth’s finite resources, <strong>and</strong>should live more sustainably by mimicking the waysin which the earth has sustained itself for billionsof years.As we move out from the center of Figure 28-2, we seelife-centered <strong>and</strong> then earth-centered worldviews.One earth-centered worldview is called the environmentalwisdom worldview. Its major beliefs are summarizedin Figure 28-3 (right). In many respects, it isthe opposite of the planetary management worldview(Figure 28-3, left).According to this worldview, because we are notin charge of the biosphere, we should learn how it hasmaintained itself over billions of years <strong>and</strong> use whatwe learn to sustain ourselves <strong>and</strong> the biosphere intothe future (Figure 9-15, p. 174).This worldview includes the belief that the earthdoes not need us managing it in order to go on,whereas we do need the earth in order to survive. Accordingto this view we cannot save the earth because itdoes not need saving. What we need to save is the existenceof our own species <strong>and</strong> other species that may becomeextinct because of our activities.<strong>Sustainability</strong> expert Lester W. Milbrath asks us totry this thought experiment: “Imagine that, suddenly,all the humans disappeared, but all the buildings,roads, shopping malls, factories, automobiles, <strong>and</strong>other artifacts of modern civilization were left behind.What then? After three or four centuries, buildingswould have crumbled, vehicles would have rusted <strong>and</strong>fallen apart, <strong>and</strong> plants would have recolonized fields,roads, parking lots, even buildings. Water, air, <strong>and</strong> soilwould gradually clear up; some endangered specieswould flourish. Nature would thrive splendidly withoutus.” See Lester Milbrath’s Guest Essay on this topicon the website for this chapter.Others say we do not need to be biocentrists orecocentrists to value life <strong>and</strong> the earth. They point outthat the human-centered stewardship environmentalworldview also calls for us to value individuals,species, <strong>and</strong> the earth’s life-support systems as part ofour responsibility as the earth’s caretakers.What Is the Deep Ecology <strong>Environmental</strong>Worldview? Thinking Deeply about OurResponsibilitiesThe beliefs of deep ecology call for us to think moredeeply about our obligations toward both human<strong>and</strong> nonhuman life.Arelated ecocentric environmental worldview is thedeep ecology worldview, which consists of eight premisesdeveloped in 1972 by Norwegian philosopher ArneNaess, in conjunction with philosopher GeorgeSessions <strong>and</strong> sociologist Bill Devall. First, each nonhumanform of life on the earth has inherent value,independent of its value to humans. Second, the fundamentalinterdependence <strong>and</strong> diversity of life-formscontribute to the flourishing of human <strong>and</strong> nonhumanlife on earth.Third, humans have no right to reduce this interdependence<strong>and</strong> diversity except to satisfy vital needs.Fourth, present human interference with the nonhumanworld is excessive, <strong>and</strong> the situation is worseningrapidly. Fifth, because of the damage caused by this interference,it would be better for humans, <strong>and</strong> muchbetter for nonhumans, if there were a substantial decreasein the human population.Sixth, basic economic <strong>and</strong> technological policiesmust therefore be changed. Seventh, the predominantideology must change such that measurements of thequality of life focus on the overall health of the environment<strong>and</strong> all living things, rather than on the materialwealth of individuals <strong>and</strong> societies. Eighth, those whosubscribe to these points have an obligation directly orindirectly to try to implement the necessary changes.Naess also described some lifestyle guidelinescompatible with the basic beliefs of deep ecology. Theyinclude appreciating all forms of life, consuming less,emphasizing satisfaction of vital needs rather thanwants, working to improve the st<strong>and</strong>ard of living forthe world’s poor, working to eliminate injustice towardfellow humans or other species, <strong>and</strong> acting nonviolently.Deep ecology is not an ecoreligion, nor is it antireligiousor antihuman, as some of its critics haveclaimed. It is a set of beliefs that would have us thinkmore deeply about the inherent value of all life on theearth <strong>and</strong> about our obligations toward all life.What Is the Ecofeminist <strong>Environmental</strong>Worldview? Give Women a FairChanceWomen should be given the same rights as men<strong>and</strong> treated as equal partners in our joint quest todevelop more environmentally sustainable<strong>and</strong> just societies.French writer Françoise d’Eaubonne coined the termecofeminism in 1974. It includes a spectrum of views onthe relationships of women to the earth <strong>and</strong> to maledominatedsocieties (patriarchies). Most ecofeministsagree that we need a life-centered or earth-centeredenvironmental worldview. However, they believe amain cause of our environmental problems is not justhttp://biology.brookscole.com/miller14635
human centeredness, but specifically male centeredness(<strong>and</strong>rocentrism).Many ecofeminists argue that the rise of maledominatedsocieties <strong>and</strong> environmental worldviewssince the advent of agriculture is primarily responsiblefor our violence against nature <strong>and</strong> for the oppressionof women <strong>and</strong> minorities as well. To such ecofeminists,our shift from hunter–gatherer to agricultural<strong>and</strong> industrial societies changed our view of naturefrom that of a nurturing mother to that of a foe to beconquered.Ecofeminists note that women earn less than 10%of all wages, own less than 1% of all property, <strong>and</strong> inmost societies have far fewer rights than men. Theseanalysts also argue that to become primary players inthe male power-<strong>and</strong>-domination game, most womenare forced to emphasize the characteristics deemedmasculine <strong>and</strong> become “honorary men.”Some ecofeminists suggest that oppression bymen has driven women closer to nature <strong>and</strong> madethem more compassionate <strong>and</strong> nurturing. As oppressedmembers of society, they argue, many womenhave more experience in dealing with interpersonalconflicts, bringing people together, acting as caregivers,<strong>and</strong> identifying emotionally with injustice,pain, <strong>and</strong> suffering. Thus women with such qualitiesare in a better position to help lead as we struggle todevelop more environmentally sustainable <strong>and</strong> just societies.Such societies would be based on cooperation,rather than confrontation <strong>and</strong> domination, <strong>and</strong> onfinding win-win solutions to our environmental <strong>and</strong>human problems instead of win-lose solutions often associatedwith our current male-dominated societies.Ecofeminists argue that women should be treatedas equal partners with men. They do not want just afair share of the patriarchal pie or to be given tokenroles or co-opted into the male power game. Theywant to work with men to bake an entirely new pie.They hope to heal the rift between humans <strong>and</strong> nature<strong>and</strong> end oppression based on sex, race, class, <strong>and</strong> cultural<strong>and</strong> religious beliefs.Ecofeminists are not alone in calling for us to encouragethe rise of life-centered people who emphasizethe best human characteristics: gentleness, caring,compassion, nonviolence, cooperation, <strong>and</strong> love.xHOW WOULD YOU VOTE? Which one of the followingcomes closest to your environmental worldview: planetarymanagement, stewardship, environmental wisdom, deepecology, ecofeminist? Cast your vote online at http://biology.brookscole.com/miller14.Which Worldview Is More Likely to ProveCorrect? Catastrophe vs. Continuing GrowthUsing images of economic or ecological collapsecan deter us from preventing or slowing the spreadof environmental degradation.The planetary management, stewardship, <strong>and</strong> environmentalwisdom worldviews differ over whetherthere are physical <strong>and</strong> biological limits to economicgrowth, beyond which ecological <strong>and</strong> economic collapseare likely to occur. This argument has been goingon since Thomas Malthus published his book The Principlesof Political Economy in 1836.In 2000, conservation biologist Carlos Davidsonproposed a way to bridge the gap between differingworldviews <strong>and</strong> to help motivate the political changesneeded to halt or slow the spread of environmentaldegradation.Davidson disagrees with the view of some economiststhat technology will allow continuing economicgrowth without causing serious environmental damage.However, he also disagrees with the view thatcontinuing economic growth based on consuming <strong>and</strong>degrading natural capital will lead to ecological <strong>and</strong>economic crashes.Instead of crashes, he suggests the metaphor of agradually unraveling tapestry to describe the effects ofenvironmental degradation. He asks us to think of natureas a diverse tapestry—an incredible variety of biomes,aquatic systems, <strong>and</strong> ecosystems.The tapestry is losing threads, more in some areasthan in others, <strong>and</strong> is even torn in some places, but it isunlikely to simply fall apart. However, he believes thatdegradation in parts of the earth’s ecological tapestryis occurring; is likely to increase because of problemssuch as climate change <strong>and</strong> biodiversity; <strong>and</strong> must beprevented <strong>and</strong> slowed by using the pollution prevention<strong>and</strong> precautionary principles.However, Davidson believes that using catastrophemetaphors such as “ecological collapse” <strong>and</strong> “goingover a cliff” can hinder these efforts. He arguesthat repeated predictions of catastrophe, like the boywho cried wolf, will be heard at first, but later ignored.As a result, people will lose motivation to preventmore tears in nature’s tapestry or to look more deeplyat the causes of the damage.xHOW WOULD YOU VOTE? Do you believe there are physical<strong>and</strong> biological limits to human economic growth? Castyour vote online at http://biology.brookscole.com/miller14.28-3 LIVING MORE SUSTAINABLYWhat Are the Main Components of<strong>Environmental</strong> Literacy? Underst<strong>and</strong>ing<strong>and</strong> Caring about How the Earth Works <strong>and</strong>Sustains Itself<strong>Environmental</strong>ly literate citizens <strong>and</strong> leaders areneeded to build more environmentally sustainable<strong>and</strong> just societies.Most environmentalists believe that learning how tolive more sustainably requires a foundation of envi-636 CHAPTER 28 <strong>Environmental</strong> Worldviews, Ethics, <strong>and</strong> <strong>Sustainability</strong>
onmental education. They cite some of the key goalsof environmental education or ecological literacy.■ Develop respect or reverence for all life.■ Underst<strong>and</strong> as much as we can about how the earthworks <strong>and</strong> sustains itself, <strong>and</strong> use such knowledge to guideour lives, communities, <strong>and</strong> societies.■ Look for connections within the biosphere <strong>and</strong> betweenour actions <strong>and</strong> the biosphere.■ Use critical thinking skills to become seekers of environmentalwisdom instead of overfilled vessels of environmentalinformation.■ Underst<strong>and</strong> <strong>and</strong> evaluate our environmental worldview<strong>and</strong> see this as a lifelong process.■ Learn how to evaluate the beneficial <strong>and</strong> harmful environmentalconsequences of our lifestyle <strong>and</strong> professionalchoices, today <strong>and</strong> in the future.■ Foster a desire to make the world a better place <strong>and</strong> acton this desire.Specifically, an ecologically literate person shouldhave a basic comprehension of:■ Concepts such as environmental sustainability,natural capital, exponential growth, carrying capacity,<strong>and</strong> risks <strong>and</strong> risk analysis■ <strong>Environmental</strong> history (to help keep us from repeatingpast mistakes)■ The laws of thermodynamics <strong>and</strong> the law of conservationof matter■ Basic principles of ecology■ Ways to sustain biodiversity■■■■■■Sustainable agriculture <strong>and</strong> forestrySustainable citiesSustainable water useNonrenewable <strong>and</strong> renewable energy resourcesSoil <strong>and</strong> mineral resourcesPollution prevention <strong>and</strong> waste reduction■ <strong>Environmental</strong>ly sustainable economic <strong>and</strong> politicalsystems■ <strong>Environmental</strong> ethicsAccording to environmental educator MitchellThomashow, four basic questions should be at theheart of environmental literacy.First, where do the things I consume come from?Second, what do I know about the place where I live?Third, how am I connected to the earth <strong>and</strong> other livingthings? Fourth, what is my purpose <strong>and</strong> responsibilityas a human being?How we answer these questions determines ourecological identity. What are your answers to these fourquestions?Figure 28-5 summarizes guidelines <strong>and</strong> strategiesfor achieving more sustainable societies that have beendiscussed throughout this book.How Can We Learn from the Earth? Seeking<strong>Environmental</strong> WisdomIn addition to formal learning, we need to learnby experiencing nature directly.Formal environmental education is important, but is itenough? Many analysts say no <strong>and</strong> urge us to take theGuidleinesLeave world in asgood a shapeas—or betterthan—we found itDo not degrade ordeplete theearth's naturalcapital, <strong>and</strong> liveoff the naturalincome it providesCopy natureTake no more thanwe needDo not reducebiodiversityTry not to harmlife, air, water, soilDo not change theworld's climateHelp maintain theearth's capacityfor self-repairDo not overshootthe earth'scarrying capacityRepair pastecologicaldamageSolutionsDeveloping <strong>Environmental</strong>lySustainable SocietiesStrategiesSustain biodiversityEliminate povertyDevelop ecoeconomiesBuild sustainablecommunitiesDo not userenewableresources fasterthan nature canreplace themUse sustainableagricultureDepend more onlocally availablerenewable energyfrom the sun, wind,flowing water, <strong>and</strong>sustainablebiomassEmphasizepollution prevention<strong>and</strong> wastereductionDo not wastematter <strong>and</strong> energyresourcesRecycle, reuse,<strong>and</strong> compost60–80% of matterresourcesMaintain a humanpopulation sizesuch that needsare met withoutthreatening lifesupportsystemsEmphasizeecologicalrestorationFigure 28-5 Solutions: guidelines <strong>and</strong> strategies for achievingmore sustainable societies.http://biology.brookscole.com/miller14637
time to escape the cultural <strong>and</strong> technological body armorwe use to insulate ourselves from nature <strong>and</strong> toexperience nature directly.They suggest we kindle a sense of awe, wonder,mystery, <strong>and</strong> humility by st<strong>and</strong>ing under the stars, sittingin a forest or taking in the majesty <strong>and</strong> power ofan ocean.We might pick up a h<strong>and</strong>ful of soil <strong>and</strong> try tosense the teeming microscopic life within it that keepsus alive. We might look at a tree, mountain, rock, orbee <strong>and</strong> try to sense how it is a part of us <strong>and</strong> we a partof it as interdependent participants in the earth’s lifesustainingrecycling processes.Many psychologists believe that consciously orunconsciously we spend much of our lives in a searchfor roots: something to anchor us in a bewildering <strong>and</strong>frightening sea of change. As philosopher Simone Weilobserved, “To be rooted is perhaps the most important<strong>and</strong> least recognized need of the human soul.”Earth-focused philosophers say that to be rooted,each of us needs to find a sense of place: a stream, amountain, a yard, or any piece of the earth we feel atone with—a place we know, experience emotionally,<strong>and</strong> love. When we become part of that place, it becomesa part of us. Then we are driven to defend itfrom harm <strong>and</strong> to help heal its wounds.This might lead us to recognize that the healing ofthe earth <strong>and</strong> the healing of the human spirit are one<strong>and</strong> the same. We might discover <strong>and</strong> tap into whatAldo Leopold calls “the green fire that burns in ourhearts” <strong>and</strong> use this as a force for respecting <strong>and</strong> workingwith the earth <strong>and</strong> with one another.How Can We Live More Simply? Escapingfrom AffluenzaSome people are voluntarily adopting lifestylesin which they enjoy life more by consuming less.Many analysts urge us to learn how to live more simply.Seeking happiness through the pursuit of materialthings is considered folly by almost every major religion<strong>and</strong> philosophy. Yet it is preached incessantly bymodern advertising that encourages us to buy more<strong>and</strong> more things. Some affluent people in developedcountries are adopting a lifestyle of voluntary simplicity,doing <strong>and</strong> enjoying more with less by learning to livemore simply. Voluntary simplicity is based onMahatma G<strong>and</strong>hi’s principle of enoughness: “The earthprovides enough to satisfy every person’s need but notevery person’s greed. . . . When we take more than weneed, we are simply taking from each other, borrowingfrom the future, or destroying the environment <strong>and</strong>other species.”Most of the world’s major religions have similarteachings. For example, “Why do you spend yourmoney for that which is not bread, <strong>and</strong> your labor forthat which does not satisfy?” (Christianity: Old Testament,Isaiah 55:2). “Eat <strong>and</strong> drink, but waste not by excess”(Islam: Koran 7.31). “One should abstain from acquisitiveness”(Hinduism: Acarangastura 2.119). “Hewho knows he has enough is rich” (Taoism: Tao TeChing, Chapter 33).Implementing these principles means asking ourselves,“How much is enough?” The answer is noteasy because people in affluent societies are conditionedto want more <strong>and</strong> more, <strong>and</strong> they often think ofsuch wants as vital needs (Spotlight, p. 639).Voluntary simplicity is a form of environmentallyethical consumption. It begins by asking a series ofquestions before buying anything: Do I really needthis, or do I merely want it? Can I buy it secondh<strong>and</strong>(reuse)? Can I borrow, rent, lease, or share it? Can Ibuild it myself?The decision to buy something triggers anotherset of questions: Is the product produced in an environmentallysustainable manner? Did the workerswho produced it get fair wages for their work, <strong>and</strong> didthey have safe <strong>and</strong> healthful working conditions? Is itdesigned to last as long as possible? Is it easy to repair,upgrade, reuse, <strong>and</strong> recycle?Figure 28-6 summarizes some ethical guidelinesproposed by various ethicists <strong>and</strong> philosophers for livingmore sustainably or simply on the earth. In thewords of biologist David Suzuki, “Family, friends,Biosphere <strong>and</strong>EcosystemsSpecies <strong>and</strong> CulturesIndividualResponsibilityFigure 28-6 Solutions: some ethicalguidelines for living more sustainably.Help sustain the earth’snatural capital <strong>and</strong>biodiversityDo the least possibleenvironmental harmwhen altering natureAvoid prematureextinction of any speciesmostly by protecting <strong>and</strong>restoring its habitatAvoid prematureextinction of any humancultureDo not inflictunnecessary suffering orpain on any animalUse no more of theearth’s resources thanyou need638 CHAPTER 28 <strong>Environmental</strong> Worldviews, Ethics, <strong>and</strong> <strong>Sustainability</strong>
What Are Our Basic Needs?Obviously, each ofus has a basic needfor enough food,clean air, clean water,shelter, <strong>and</strong>SPOTLIGHTclothing to keep usalive <strong>and</strong> in good health. Accordingto various psychologists <strong>and</strong> othersocial scientists, each of us also hasother basic needs:■ A secure <strong>and</strong> meaningful livelihoodto provide our basic materialneeds■ Good physical <strong>and</strong> mentalhealth■ The opportunity to learn <strong>and</strong>give expression to our intellectual,mechanical, <strong>and</strong> artistic talents■ A nurturing family <strong>and</strong> friends<strong>and</strong> a peaceful <strong>and</strong> secure communitythat help us develop our capacityfor caring <strong>and</strong> loving relationshipswhile giving us the freedomto make personal choices■ A clean <strong>and</strong> healthy environmentthat is vibrant with biological<strong>and</strong> cultural diversity■ A sense of belonging to <strong>and</strong> caringfor a particular place <strong>and</strong> community■ An assurance that our children<strong>and</strong> gr<strong>and</strong>children will be able tomeet these same basic needsA difficult but fundamental questionis asking how much of the stuffwe are all urged to buy helps usmeet these basic needs. Indeed, psychologistspoint out that many peoplebuy things in the hope or beliefthey will make up for not meetingsome of the basic needs listed here.Critical Thinking1. What basic needs, if any, wouldyou add to or remove from the listgiven here?2. Which of the basic needs listedhere (or additional ones you wouldadd) do you feel are being met foryou? What are your plans for tryingto fulfill any of your unfulfilledneeds? Relate these plans to yourenvironmental worldview.community—these are the sources of the greatest love<strong>and</strong> joy we experience as humans. ... None of thesepleasures requires us to consume things from theEarth, yet each is deeply fulfilling.”How Can We Be More Effective as <strong>Environmental</strong>Citizens? Avoid Mental Traps <strong>and</strong>Despair, Be Adaptable, <strong>and</strong> Enjoy LifeWe can help make the world a better place bynot falling into mental traps that lead to denial<strong>and</strong> inaction <strong>and</strong> by keeping our empowering feelingsof hope slightly ahead of our immobilizing feelingsof despair.When we first encounter an environmental problem,our initial response often is to find someone or somethingto blame, such as greedy industrialists or uncaringpoliticians. It is the fault of such villains, <strong>and</strong> weare the victims. This response can lead to despair, denial,apathy, <strong>and</strong> inaction because we feel powerless tostop or influence these forces.Upon closer examination we may realize that weall make some direct or indirect contributions to theenvironmental problems we face. Yet, we do not wantto feel guilty or bad about the environmental harm ourlifestyles may be inflicting. Thus we try not to thinkabout it much—another path to denial <strong>and</strong> inaction.According to primatologist Jane Goodall, “Thegreatest danger to our future is apathy. ... Can weovercome apathy? Yes, but only if we have hope. ...Technology alone is not enough. We must engage withour hearts also.”Analysts suggest that we move beyond blame,guilt, fear, denial, <strong>and</strong> apathy by recognizing <strong>and</strong>avoiding common mental traps that lead to denial, indifference,<strong>and</strong> inaction. These traps include gloom<strong>and</strong>-doompessimism (it is hopeless), blind technologicaloptimism (science <strong>and</strong> technofixes will save us), fatalism(we have no control over our actions <strong>and</strong> the future),extrapolation to infinity (if I cannot change the entireworld quickly, I will not try to change any of it), paralysisby analysis (searching for the perfect worldview,philosophy, solutions, <strong>and</strong> scientific information beforedoing anything), <strong>and</strong> faith in simple, easy answers.We will all accomplish more if we keep our empoweringfeelings of hope slightly ahead of our immobilizingfeelings of despair. It is also important not touse guilt <strong>and</strong> fear to try to motivate other people.Recognizing that there is no single correct or bestsolution to the environmental problems we face is alsoimportant. Indeed, one of nature’s most importantlessons is that preserving diversity—in this case, beingflexible <strong>and</strong> adaptable in trying a variety of solutionsto our problems—is the best way to adapt to theearth’s <strong>and</strong> life’s largely unpredictable, ever-changingconditions.Finally, we should have fun <strong>and</strong> take time to enjoylife. Laugh every day <strong>and</strong> enjoy nature, beauty, friendship,<strong>and</strong> love. This empowers us to become goodearth citizens who practice good earthkeeping.http://biology.brookscole.com/miller14639
What Are the Major Components of the<strong>Environmental</strong> Revolution? A Call forGreatnessThe message of environmentalism is not gloom<strong>and</strong> doom, fear, <strong>and</strong> catastrophe but hope, apositive vision of the future, <strong>and</strong> a call for greatnessin dealing with the environmental challengeswe face.The environmental revolution that many environmentalistscall for us to bring about during this centurywould have several components:■ A biodiversity protection revolution devoted to protecting<strong>and</strong> sustaining the genes, species, natural systems,<strong>and</strong> chemical <strong>and</strong> biological processes that makeup the earth’s biodiversity.■ An efficiency revolution, that minimizes the wastingof matter <strong>and</strong> energy resources.■ A solar–hydrogen revolution based on decreasingour dependence on carbon-based nonrenewable fossilfuels <strong>and</strong> increasing our dependence on forms of renewablesolar energy that can be used to producehydrogen fuel from water.■ A pollution prevention revolution that reduces pollution<strong>and</strong> environmental degradation from harmfulchemicals, preventing their release into the environmentby recycling or reusing them, <strong>and</strong> learning tolive without them.■ A sufficiency revolution, dedicated to meeting thebasic needs of all people on the planet while affluentsocieties learn to live more sustainably by living withless.■ A demographic revolution based on reducing fertilityto bring the size <strong>and</strong> growth rate of the human populationinto balance with the earth’s ability to supporthumans <strong>and</strong> other species more sustainably.■ An economic <strong>and</strong> political revolution in which we useeconomic systems to reward environmentally beneficialbehavior <strong>and</strong> to discourage environmentallyharmful behavior.Opponents of such a cultural change like to paintenvironmentalists as messengers of gloom, doom, <strong>and</strong>hopelessness. But the message of environmentalism is notgloom <strong>and</strong> doom, fear, <strong>and</strong> catastrophe but hope <strong>and</strong> a positivevision of the future.We should rejoice in our environmental accomplishments,but the real question is, Where do we gofrom here? How can past environmental advances betransferred to developing countries? How can humansmake the cultural transition to more environmentallysustainable societies based on learning from <strong>and</strong>working with nature?As you have read in this book, we have an incrediblearray of technological <strong>and</strong> economic solutions tothe environmental problems we face. The challenge forall of us is to implement such solutions by convertingenvironmental wisdom <strong>and</strong> beliefs into political action.This requires becoming involved in making theworld a better place. As G<strong>and</strong>hi said many years ago,“We must become the change we want to see.” This requiresunderst<strong>and</strong>ing that individuals matter. Virtuallyall of the environmental progress we have made duringthe last few decades occurred because individualsb<strong>and</strong>ed together to insist that we can do better.This journey begins in your own community becausein the final analysis all sustainability is local. Wehelp make the world more sustainable by working tomake our local communities more sustainable. Thisbegins with your own lifestyle. This is the meaning ofthe motto, “Think globally, act locally.”Throughout this book I have used various figuresto list things that you can do to act as a responsible environmentalcitizen. I suggest that you review such actionsby looking at Figures 11-25 (p. 222), 12-16 (p. 249),14-30 (p. 303), 15-27 (p. 330), 18-36 (p. 408), 20-22(p. 460), 21-19 (p. 483), 21-26 (p. 488), 22-20 (p. 516), 24-4(p. 536), 24-7 (p. 540), 24-24 (p. 554), 27-2 (p. 608) <strong>and</strong>the more general list in Figure 28-5 (p. 637).As you review these ideas, I suggest you mark offthe things you are doing. Then try to pick out two orthree of the items in each list that you believe are themost important things to do <strong>and</strong> combine them into amaster list. Each week try to carry out at least one ofthese actions until you have worked through your entirelist.What Is the Earth Charter? Four EthicalGuidelinesRespect <strong>and</strong> care for life <strong>and</strong> biodiversity<strong>and</strong> build more sustainable, just, democratic,<strong>and</strong> peaceful societies for present <strong>and</strong> futuregenerations.In March 2000, the Earth Charter was finalized. Morethan 100,000 people in 51 countries <strong>and</strong> 25 global leadersin environment, business, politics, religion, <strong>and</strong>education took part in creating this charter. It is a documentcreating an ethical <strong>and</strong> moral framework to guidethe conduct of people <strong>and</strong> nations toward each other<strong>and</strong> the earth. Here are its four guiding principles:■ Respect earth <strong>and</strong> life in all its diversity.■ Care for life with underst<strong>and</strong>ing, love, <strong>and</strong> compassion.■ Build societies that are free, just, participatory, sustainable,<strong>and</strong> peaceful.■ Secure earth’s bounty <strong>and</strong> beauty for present <strong>and</strong>future generations.It is an incredibly exciting time to be alive as westruggle to implement such ideals by entering into a640 CHAPTER 28 <strong>Environmental</strong> Worldviews, Ethics, <strong>and</strong> <strong>Sustainability</strong>
new relationship with the earth that keeps us all alive<strong>and</strong> supports our economies. The transition to a moresustainable world will not be easy but it can be done ifenough of us care.Envision the earth’s life-sustaining processes as abeautiful <strong>and</strong> diverse web of interrelationships—akaleidoscope of patterns, rhythms, <strong>and</strong> connectionswhose very complexity <strong>and</strong> multitude of possibilitiesremind us that cooperation, sharing, honesty, humility,<strong>and</strong> love should be the guidelines for our behavior towardone another <strong>and</strong> the earth.When there is no dream, the people perish.PROVERBS 29:18CRITICAL THINKING1. Some analysts argue that the problems with Biosphere2 resulted mostly from inadequate design <strong>and</strong> that a betterteam of scientists <strong>and</strong> engineers could make it work.Explain why you agree or disagree with this view.2. This chapter has summarized a number of differentenvironmental worldviews. Analyze them <strong>and</strong> find thebeliefs you agree with, as a description your own environmentalworldview. Which of your beliefs were addedor modified as a result of taking this course? Compareyour answer with those of your classmates.3. Explain why you agree or disagree with the followingideas: (a) Everyone has the right to have as many childrenas he or she wants. (b) Each member of the humanspecies has a right to use as many resources as he or shewants. (c) Individuals should have the right to do anythingthey want with l<strong>and</strong> they own. (d) Nature shouldbe used, not preserved. (e) Species exist to be used byhumans. (f) All forms of life have an intrinsic value <strong>and</strong>therefore have a right to exist. (g) All organisms are interconnected<strong>and</strong> interdependent. (h) We have no right toharm <strong>and</strong> kill animals by using them for furs <strong>and</strong> to testfor toxic chemicals, pharmaceutical drugs, or cosmetics.Are your answers consistent with the beliefs of your environmentalworldview that you described in question 2?4. Theologian Thomas Berry calls the industrial consumersociety built on the human-centered, planetarymanagement environmental worldview the “supremepathology of all history.” He says, “We can break themountains apart; we can drain the rivers <strong>and</strong> flood thevalleys. We can turn the most luxuriant forests intothrowaway paper products. We can tear apart the greatgrass cover of the western plains, <strong>and</strong> pour toxic chemicalsinto the soil <strong>and</strong> pesticides onto the fields, until thesoil is dead <strong>and</strong> blows away in the wind. We can pollutethe air with acids, the rivers with sewage, the seas withoil. ... We can invent computers capable of processingten million calculations per second. And why? To increasethe volume <strong>and</strong> speed with which we move naturalresources through the consumer economy to thejunk pile or the waste heap. ... If, in these activities, thetopography of the planet is damaged, if the environmentis made inhospitable for a multitude of living species,then so be it. We are, supposedly, creating a technologicalwonderworld. ... But our supposed progress ...isbringing us to a wasteworld instead of a wonderworld.”Explain why you agree or disagree with this assessment.5. Some analysts believe learning environmental wisdomby experiencing the earth <strong>and</strong> forming an emotionalbond with its life-forms <strong>and</strong> processes is unscientific,mystical nonsense based on a romanticized view of nature.They believe better scientific underst<strong>and</strong>ing of howthe earth works <strong>and</strong> improved technology are the bestways to achieve sustainability. Do you agree or disagree?Explain.6. Try to answer the following fundamental ecologicalquestions about the corner of the world you inhabit:Where does your water come from? Where does the energyyou use come from? What kinds of soils are underyour feet? What types of wildlife are your neighbors?Where does your food come from? Where does yourwaste go?7. How do you feel about (a) carving huge faces of peoplein mountains, (b) driving an off-road motorized vehiclein a desert, grassl<strong>and</strong>, or forest, (c) using throwawaypaper towels, tissues, napkins, <strong>and</strong> plates, (d) wearingfurs, <strong>and</strong> (e) having tropical fish, birds, snakes, or otherwild animals as pets? Are your answers consistent withthe beliefs of your environmental worldview that youdescribed in question 2?8. Review your experience with the mental traps describedon p. 639. Which of these traps have you falleninto? Were you aware you had been ensnared by any ofthem? Do you plan to free yourself from these traps?How?PROJECTS1. Use a combination of the major existing societal, economic,<strong>and</strong> environmental trends, possible new trends,<strong>and</strong> your imagination to construct three different scenariosof what the world might be like in 2060. Identify thescenario you favor, <strong>and</strong> outline a strategy for achievingthis alternative future. Compare your scenarios <strong>and</strong>strategies with those of your classmates.2. Make an environmental audit of your school. Rateeach of the following items on a scale of 1 through 10,with 10 being the highest rating. What proportion of eachof the major types of matter resources used are recycled,reused, or composted? What priority does your schoolgive to buying recycled materials? How much does yourschool emphasize energy efficiency, use of renewableforms of solar energy, <strong>and</strong> environmental design in developingnew buildings <strong>and</strong> renovating existing ones?Does it use ecologically sound planning in deciding howits grounds <strong>and</strong> buildings are managed <strong>and</strong> used? Doesyour school limit the use of toxic chemicals in its buildings<strong>and</strong> on its grounds? What proportion of its food purchasescomes from nearby farmers? What proportion ofthe food it purchases is grown by sustainable or organichttp://biology.brookscole.com/miller14641
agriculture? Average the number assigned to each categoryto come up with an overall environmental rating ofyour school. Compare your ratings with those of othermembers of your class <strong>and</strong> come up with a list of the fivemost important things that need to be done to improvethe environmental rating of your school. Share your findingswith school officials.3. Does your school’s curriculum provide all graduateswith the basic elements of environmental literacy? Towhat extent are the funds in its financial endowments investedin enterprises that are working to develop or encourageenvironmental sustainability? Over the past20 years, what important roles have its graduates playedin making the world a better <strong>and</strong> more sustainable placeto live? Using such information, rate your school on a1–10 scale in terms of its contributions to environmentalawareness <strong>and</strong> sustainability. Develop a detailed planillustrating how your school could become better atachieving such goals, <strong>and</strong> present this information toschool officials, alumni, parents, <strong>and</strong> financial backers.4. If you knew you were going to die <strong>and</strong> had an opportunityto address everyone in the world for 5 minutes,what would you say? Write out your 5-minute speech<strong>and</strong> compare it with those of other members of your class.5. Write an essay in which you identify key environmentalexperiences that have influenced your life <strong>and</strong> thushelped form your current ecological identity. Examplesmay include (a) fond childhood memories of specialplaces where you connected with the earth through emotionalexperiences, (b) places you knew <strong>and</strong> cherishedthat have been polluted, developed, or destroyed, (c) keyevents that forced you to think about environmental valuesor worldviews, (d) people or educational experiencesthat influenced your underst<strong>and</strong>ing of <strong>and</strong> concern aboutenvironmental problems <strong>and</strong> challenges, <strong>and</strong> (e) directexperience <strong>and</strong> contemplation of wild places. Share yourexperiences with other members of your class.6. Use the library or the Internet to find bibliographic informationabout Robert Cahn, whose quote is found at thebeginning of this chapter.7. Make a concept map of this chapter’s major ideas,using the section heads, subheads, <strong>and</strong> key terms (inboldface type). Look on the website for this book for informationabout making concept maps.LEARNING ONLINEThe website for this book contains study aids <strong>and</strong> manyideas for further reading <strong>and</strong> research. They include achapter summary, review questions for the entire chapter,flash cards for key terms <strong>and</strong> concepts, a multiple-choicepractice quiz, interesting Internet sites, references, <strong>and</strong>a guide for accessing thous<strong>and</strong>s of InfoTrac ® CollegeEdition articles. Log on tohttp://biology.brookscole.com/miller14Then click on the Chapter-by-Chapter area, choose Chapter28, <strong>and</strong> select a learning resource.642 CHAPTER 28 <strong>Environmental</strong> Worldviews, Ethics, <strong>and</strong> <strong>Sustainability</strong>
APPENDIX 1UNITS OF MEASURELENGTHMetric1 kilometer (km) 1,000 meters (m)1 meter (m) 100 centimeters (cm)1 meter (m) 1,000 millimeters (mm)1 centimeter (cm) 0.01 meter (m)1 millimeter (mm) 0.001 meter (m)English1 foot (ft) 12 inches (in)1 yard (yd) 3 feet (ft)1 mile (mi) 5,280 feet (ft)1 nautical mile 1.15 milesMetric–English1 kilometer (km) 0.621 mile (mi)1 meter (m) 39.4 inches (in)1 inch (in) 2.54 centimeters (cm)1 foot (ft) 0.305 meter (m)1 yard (yd) 0.914 meter (m)1 nautical mile 1.85 kilometers (km)AREAMetric1 square kilometer (km 2 ) 1,000,000 square meters (m 2 )1 square meter (m 2 ) 1,000,000 square millimeters (mm 2 )1 hectare (ha) 10,000 square meters (m 2 )1 hectare (ha) 0.01 square kilometer (km 2 )English1 square foot (ft 2 ) 144 square inches (in 2 )1 square yard (yd 2 ) 9 square feet (ft 2 )1 square mile (mi 2 ) 27,880,000 square feet (ft 2 )1 acre (ac) 43,560 square feet (ft 2 )Metric–English1 hectare (ha) 2.471 acres (ac)1 square kilometer (km 2 ) 0.386 square mile (mi 2 )1 square meter (m 2 ) 1.196 square yards (yd 2 )1 square meter (m 2 ) 10.76 square feet (ft 2 )1 square centimeter (cm 2 ) 0.155 square inch (in 2 )VOLUMEMetric1 cubic kilometer (km 3 ) 1,000,000,000 cubic meters (m 3 )1 cubic meter (m 3 ) 1,000,000 cubic centimeters (cm 3 )1 liter (L) 1,000 milliliters (mL) 1,000 cubic centimeters (cm 3 )1 milliliter (mL) 0.001 liter (L)1 milliliter (mL) 1 cubic centimeter (cm 3 )English1 gallon (gal) 4 quarts (qt)1 quart (qt) 2 pints (pt)Metric–English1 liter (L) 0.265 gallon (gal)1 liter (L) 1.06 quarts (qt)1 liter (L) 0.0353 cubic foot (ft 3 )1 cubic meter (m 3 ) 35.3 cubic feet (ft 3 )1 cubic meter (m 3 ) 1.30 cubic yards (yd 3 )1 cubic kilometer (km 3 ) 0.24 cubic mile (mi 3 )1 barrel (bbl) 159 liters (L)1 barrel (bbl) 42 U.S. gallons (gal)MASSMetric1 kilogram (kg) 1,000 grams (g)1 gram (g) 1,000 milligrams (mg)1 gram (g) 1,000,000 micrograms (µg)1 milligram (mg) 0.001 gram (g)1 microgram (g) 0.000001 gram (g)1 metric ton (mt) 1,000 kilograms (kg)English1 ton (t) 2,000 pounds (lb)1 pound (lb) 16 ounces (oz)Metric–English1 metric ton (mt) 2,200 pounds (lb) 1.1 tons (t)1 kilogram (kg) 2.20 pounds (lb)1 pound (lb) 454 grams (g)1 gram (g) 0.035 ounce (oz)ENERGY AND POWERMetric1 kilojoule (kJ) 1,000 joules (J)1 kilocalorie (kcal) 1,000 calories (cal)1 calorie (cal) 4,184 joules (J)Metric–English1 kilojoule (kJ) 0.949 British thermal unit (Btu)1 kilojoule (kJ) 0.000278 kilowatt-hour (kW-h)1 kilocalorie (kcal) 3.97 British thermal units (Btu)1 kilocalorie (kcal) 0.00116 kilowatt-hour (kW-h)1 kilowatt-hour (kW-h) 860 kilocalories (kcal)1 kilowatt-hour (kW-h) 3,400 British thermal units (Btu)1 quad (Q) 1,050,000,000,000,000 kilojoules (kJ)1 quad (Q) 2,930,000,000,000 kilowatt-hours (kW-h)TEMPERATURE CONVERSIONSFahrenheit(°F) to Celsius(°C):°C (°F 32.0) 1.80Celsius(°C) to Fahrenheit(°F):°F (°C 1.80) 32.0APPENDIX 1A1
A PPENDIX 2MAJOR EVENTS IN U.S. ENVIRONMENTAL HISTORY1891–97 Timbercutting banned onlarge tracts of public l<strong>and</strong>.1920–27 Publichealth boardsestablishedin most cities.1870s 1880s 1890s 1900s 1910s 1920s1872Yellowstone NationalPark established. AmericanForestry Associationorganized by privatecitizens to protect forests.American Public HealthAssociation formed.1870First officialwildlife refugeestablishedat Lake Merritt,California.1880Killer fog in Londonkills 700 people.1893Few remainingAmerican bisongiven refuge inYellowstoneNational Park.1892 Sierra Clubfounded by JohnMuir to promoteincreasedpreservationof public l<strong>and</strong>.Killer fog inLondon kills1,000 people.1891Forest ReserveAct authorizedthe president toset asideforest reserves.1890Governmentdeclares thecountry's frontierclosed. YosemiteNational Parkestablished.1918 Migratory Bird Actrestricts hunting ofmigratory birds.1916 National Park Service Actcreates National ParkSystem <strong>and</strong> National Park Service.1915 Ecologists formEcological Society of America.1912 Public Health Service Actauthorizes governmentinvestigation of water pollution.1911 Weeks Act allows Forest Serviceto purchase l<strong>and</strong> at headwaters ofnavigable streams as part ofNational Forest System.1908 Swedish chemist Svante Arrhenius arguesthat increased emissions from burning fossil fuels willlead to global warming.1906 Antiquities Act allows president to set asideareas on federal l<strong>and</strong>s as national monuments.Pure Food <strong>and</strong> Drug Act enacted.1905 U.S. Forest Service created. Audubon Society foundedby private citizens to preserve country's bird species.1904 Child lead poisoning linked to lead-based paints.1903 First National Wildlife Refuge at Pelican Isl<strong>and</strong>,Florida, established by President Theodore Roosevelt.1902 Reclamation Act promotes irrigation<strong>and</strong> water development projects in arid West.1900 Lacey Act bans interstate shipment ofbirds killed in violation of state laws.1870–1930Figure 1 Examples of the increased role of the federal government in resource conservation <strong>and</strong> public health<strong>and</strong> establishment of key private environmental groups, 1870–1930.A2 APPENDIX 2
1930s 1940s 1950s1938 Federal Food, Drug,<strong>and</strong> Cosmetic Act regulatesconsumer foods, drugs,<strong>and</strong> cosmetics.1937 Federal Aid in WildlifeRestoration Act levies federaltax on gun <strong>and</strong> ammunitionsales, with funds used forwildlife research <strong>and</strong> protection.Term greenhouse effect coinedby Professor Glen Trewaha.1935 Soil Conservation Act createsSoil Erosion Service. WildernessSociety founded.1934 Taylor Grazing Act regulateslivestock grazing on public l<strong>and</strong>s.Migratory Bird Hunting Stamp Actrequires federal license for duckhunters, with funds used for waterfowlrefuges. Dust bowl storms begin in Midwest.1949 AldoLeopold’s S<strong>and</strong>County Almanacpublished.1948 Air pollutiondisaster at Donora,Pennsylvania, kills20 <strong>and</strong> sickens7,000 people.1947 Federal Insecticide,Fungicide, <strong>and</strong> RodenticideAct regulates useof pesticides. EvergladesNational Park established.Defenders of Wildlifefounded.1941 Rooftop solar waterheaters widely usedin Florida.1940 U.S. Fish <strong>and</strong>Wildlife Service createdto manage NationalWildlife Refugesystem <strong>and</strong> protectendangered species.1957 Price-Anderson Act greatlylimits liability of power plantowners <strong>and</strong> the government incases of a major nuclear powerplant accident.1956 Water Pollution Control Actprovides grants to states for watertreatment plants. 1,000 peoplekilled in London smog incident.1954 Atomic Energy Act promotesdevelopment of nuclear power plants.1952 4,000 people die in London killer smog.1950 The Nature Conservancy formed.1933 Civilian Conservation Service established.1930–1960Figure 2 Some important conservation <strong>and</strong> environmental events, 1930–1960.APPENDIX 2A3
1965–69Severe pollution of Lake Eriekills fish <strong>and</strong> closes beaches.1960s1961 WorldWildlife Fundfounded.1963 300 deaths<strong>and</strong> thous<strong>and</strong>s ofillnesses in New YorkCity from air pollution.Clean Air Act beginsregulation of airpollution with stricteramendments in 1965,1970, <strong>and</strong> 1990.1962 Rachel Carson publishes SilentSpring to alert the public aboutharmful effects of pesticides. 750people die in London smog incident.1964 WildernessAct establishesNationalWildernessSystem.1965 L<strong>and</strong> <strong>and</strong> WaterConservation Act authorizesfederal funds for local, state,<strong>and</strong> federal purchase of openspace <strong>and</strong> parkl<strong>and</strong>.1967 <strong>Environmental</strong>Defense Fundformed.1968 Biologist Paul Ehrlichpublishes The PopulationBomb. Biologist GarrettHardin publishes Tragedyof the Commons article.UN Biosphere Conference todiscuss global environmentalproblems.1969 Oil-polluted CuyahogaRiver, flowing throughClevel<strong>and</strong>, Ohio, catchesfire <strong>and</strong> burns for 8 days.Leaks from offshore oilwell off coast of SantaBarbara, California, killwildlife <strong>and</strong> pollute beaches.<strong>Environmental</strong> Policy Actrequires federal agenciesto evaluate environmentalimpact of their actions.Apollo mission photo ofthe earth from space leadsto spaceship-earthenvironmental worldview.1960SFigure 3 Some important environmental events during the 1960s.A4 APPENDIX 2
1970s1971Biologist BarryCommonerpublishesThe ClosingCircle explainingecologicalproblems <strong>and</strong>callingfor pollutionprevention.1973OPEC oil embargo.Lead-BasedPaint PoisoningAct regulates useof lead in toys <strong>and</strong>cooking <strong>and</strong>eating utensils.Convention onInternational Tradein EndangeredSpecies (CITES)becomesinternational law.1975Energy Policy <strong>and</strong>Conservation Actpromotes energyconservation.1974Chemists Sherwood Rol<strong>and</strong> <strong>and</strong> MarioMolina suggest CFCs are depleting theozone in stratosphere. Lester Brownfounds the Worldwatch Institute. SafeDrinking Water Act sets st<strong>and</strong>ards forcontaminants in public water supply.1972Oregon passes first beverage bottle recycling law. Publicationof Limits to Growth, which challenges idea of unlimitedeconomic growth. David Brower founds Earth Isl<strong>and</strong> Institute.Federal <strong>Environmental</strong> Pesticide Control Act regulatesregistration of pesticides based on tests <strong>and</strong> degree of risk.Ocean Dumping Act; Marine Protection, Research, <strong>and</strong>Sanctuaries Act; <strong>and</strong> Coastal Zone Management Act helpregulate <strong>and</strong> protect oceans <strong>and</strong> coastal areas. MarineMammal Protection Act encourages protection <strong>and</strong>conservation of marine mammals. Consumer Product SafetyAct helps consumers from hazardous products. UN conferenceon the Human Environment in Stockholm, Sweden.1977Clean Water Act strengthensregulation of drinking waterquality, with additionalamendments in 1981 <strong>and</strong> 1987.Surface Mining Control <strong>and</strong>Reclamation Act regulatessurface mining <strong>and</strong>encourages reclamation ofmined l<strong>and</strong>. Amory B. Lovinspublishes The Soft Energy Pathcalling for switching from fossilfuels <strong>and</strong> nuclear power tosolar energy. U.S. Departmentof Energy created.1978Love Canal, New York,housing developmentevacuated because oftoxic wastes leaking fromold dumpsite. FederalL<strong>and</strong> Policy <strong>and</strong>Management Actstrengthens regulation ofpublic l<strong>and</strong>s by the Bureauof L<strong>and</strong> Management.1979Accident atThree Mile Isl<strong>and</strong>nuclear powerplant inPennsylvania.Oil shortagebecause ofrevolution in Iran.1970First Earth Day. EPA established byPresident Richard Nixon. OccupationalHealth <strong>and</strong> Safety Act promotes safeworking conditions. Resources RecoveryAct regulates waste disposal <strong>and</strong>encourages recycling <strong>and</strong> waste reduction.National <strong>Environmental</strong> Policy Act passed.Clean Air Act passed. Natural ResourcesDefense Council created.1976National Forest Management Act establishes guidelines for managingnational forests.Toxic Control Substances Act regulates many toxicsubstances not regulated under other laws. Resource Conservation<strong>and</strong> Recovery Act requires tracking of hazardous waste <strong>and</strong> encouragesrecycling, resource recovery, <strong>and</strong> waste reduction. Noise Control Actregulates harmful noise levels. UN Conference on Human Settlements.1970SFigure 4 Some important environmental events during the 1970s, sometimes called the environmental decade.APPENDIX 2A5
1980–89Rise of a strong anti-environmental movement.1980s1985 Scientists discover annualseasonal thinning of the ozonelayer above Antarctica.1984 Toxic fumes leaking frompesticide plant in Bhopal, India,kill at least 6,000 people <strong>and</strong> injure50,000–60,000. Lester R. Brownpublishes first annual State of the World report.1986 Explosion of Chernobylnuclear power plant in Ukraine.Times Beach, Missouri,evacuated <strong>and</strong> boughtby EPA because ofdioxin contamination.1983 U.S. EPA <strong>and</strong> National Academy of Sciences publishreports finding that build-up of carbon dioxide <strong>and</strong> othergreenhouse gases will lead to global warming.1980 Superfund law passed to clean up ab<strong>and</strong>oned toxic wastedumps. Alaska National Interest L<strong>and</strong>s Conservation Act protects42 billion hectares (104 million acres) of l<strong>and</strong> in Alaska.1987 Montreal Protocolto halve emissions ofozone-depletingCFCs signed by24 countries.International BaselConvention controlsmovement ofhazardous wastesfrom one countryto another.1989 Exxon Valdezoil tankeraccident inAlaska's PrinceWilliam Sound.1988 Industry-backedwise-use movementestablished to weaken<strong>and</strong> destroy U.S.environmental movement.Biologist E. O. Wilsonpublishes Biodiversity,detailing how humanactivities are affectingthe earth's diversityof species.1980sFigure 5 Some important environmental events during the 1980s.A6 APPENDIX 2
1991–2000Continuing efforts by antienvironmentalmovementto repeal or weaken environmentallaws <strong>and</strong> discreditenvironmental movement.1995–2000Most efforts by Republic<strong>and</strong>ominatedCongress to weakenor do away with environmentallaws are vetoed byPresident Bill Clinton.2001–2004President George W. Bush, backed by a Republic<strong>and</strong>ominatedCongress, weakens many environmentallaws, withdraws the U.S. from participation in aglobal climate change treaty, <strong>and</strong> greatly increasesprivate energy <strong>and</strong> mineral development <strong>and</strong> timbercutting on public l<strong>and</strong>s.1990s2000s1990 Twentieth annual Earth Dayobserved by 200 million people in141 nations. Clean Air Actamended to increase regulation ofair pollutants such as sulfur dioxide<strong>and</strong> nitrogen oxides <strong>and</strong> allowtrading of air pollution credits.National <strong>Environmental</strong> EducationAct authorizes funding ofenvironmental educationprograms at elementary<strong>and</strong> secondary school level.1992 Almost 1,700of the world’s seniorscientists release awarning about theseriousness of theworld’s environmentalproblems. UNenvironmental summitat Rio de Janeiro, Brazil.International Conventionon Biological Diversity.1991 Persian Gulf War toprotect oil supplies inMiddle East. Moratoriumon mining in Antarcticafor 50 years. NationalPeople of Color summitto promote environmentaljustice.1995 Paul Cruzen,Mario Molina, <strong>and</strong>Sherwood Rowl<strong>and</strong>win Nobel Prizefor their work onozone depletion bychlorofluorocarbons(CFCs).1994 UN Conferenceon Population <strong>and</strong>Development held inCairo, Egypt. CaliforniaDesert Protection Actadds to the NationalPark System <strong>and</strong>wilderness system.1993 Paul Hawkenpublishes the Ecologyof Commerce discussingrelationships betweenecology <strong>and</strong> business.2000 President BillClinton protects largeareas in national forestsfrom roads <strong>and</strong> logging<strong>and</strong> protects variousparcels of publicl<strong>and</strong> as nationalmonuments.International Treatyon Persistent OrganicPollutants (POPS)requires phaseoutof twelve harmfulchemicals.1997 Meeting of 161 nations inKyoto, Japan, to negotiate atreaty to help slow globalwarming. Evaluation shows littleprogress in meeting goals of1992 Earth Summit meeting.1996 Theo Coburn publishes Our StolenFuture warning of dangers from hormonedisruptingchemicals.2001 UN InternationalPanel on ClimateChange (IPCC) cites“new <strong>and</strong> strongerevidence that most ofthe observed warmingduring the past 50 yearsis attributable to humanactivities.”1990–2004Figure 6 Some important environmental events, 1990–2004.APPENDIX 2A7
A PPENDIX 3SOME BASIC CHEMISTRYHow Can Elements Be Arranged in thePeriodic Table According to <strong>Their</strong>Chemical Properties? Chemists havedeveloped a way to classify the elementsaccording to their chemical behavior, inwhat is called the periodic table of elements(Figure 1). Each of the horizontal rows inthe table is called a period. Each vertical columnlists elements with similar chemicalproperties <strong>and</strong> is called a group.The partial periodic table in Figure 1shows how the elements can be classifiedas metals, nonmetals, <strong>and</strong> metalloids. Mostof the elements found to the left <strong>and</strong> atthe bottom of the table are metals, whichusually conduct electricity <strong>and</strong> heat <strong>and</strong>are shiny. Examples are sodium (Na), calcium(Ca), aluminum (Al), iron (Fe), lead(Pb), <strong>and</strong> mercury (Hg). Atoms of suchmetals achieve a more stable state by losingone or more of their electrons to form positivelycharged ions such as Na , Ca 2 ,<strong>and</strong> Al 3 .*Hydrogen, a nonmetal, is placed by itself abovethe center of the table because it does not fit verywell into any of the groups.Nonmetals, found in the upper right ofthe table, do not conduct electricity verywell <strong>and</strong> usually are not shiny. Examples arehydrogen (H),* carbon (C), nitrogen (N),oxygen (O), phosphorus (P), sulfur (S),chlorine (Cl), <strong>and</strong> fluorine (F). Atoms ofsome nonmetals such as chlorine, oxygen,<strong>and</strong> sulfur tend to gain one or more electronslost by metallic atoms to form negativelycharged ions such as O 2 ,S 2 , <strong>and</strong>Cl . Atoms of nonmetals can also combinewith one another to form molecules inwhich they share one or more pairs of theirelectrons.The elements arranged in a diagonalstaircase pattern between the metals <strong>and</strong>nonmetals have a mixture of metallic<strong>and</strong> nonmetallic properties <strong>and</strong> are calledmetalloids. Figure 1 also identifies the elementsrequired as nutrients for all or someforms of life <strong>and</strong> elements that are moderatelyor highly toxic to all or most forms oflife. Six nonmetallic elements—carbon (C)oxygen (O), hydrogen (H), nitrogen (N),sulfur (S), <strong>and</strong> phosphorus (P)—make upabout 99% of the atoms of all living things.What Are Ionic <strong>and</strong> Covalent Bonds?Sodium chloride (NaCl) consists of athree-dimensional network of oppositelycharged ions (Na <strong>and</strong> Cl ) held togetherby the forces of attraction between oppositecharges (Figure 2). The strong forces ofattraction between such oppositelycharged ions are called ionic bonds. Becauseionic compounds consist of ions formedfrom atoms of metallic (positive ions) <strong>and</strong>nonmetallic (negative ions) elements,they can be described as metal-nonmetalcompounds.Figure 3 shows the chemical formulas<strong>and</strong> shapes of the molecules for severalGroupIA3Lilithium11Nasodium19K4Beberyllium12Mgmagnesium20Capotassium calcium37Rbrubidium55Cscesium38Srstrontium56IIABabarium21Scsc<strong>and</strong>ium39Yyttrium57LaAtomic numberSymbolName22Tititanium40Zrzirconium72Hflanthanium hafnium23V24Cr25Mn26Fevanadium chromium manganese iron41Nbniobium73Tatantalum42Mo43Tc44Ru27Cocobalt45Rhmolybdenum technetium ruthenium rhodium74WtungstenMetalsNonmetalsMetalloids75Rerhenium76Ososmium1HhydrogenIIIB IVB VB VIB VIIB VIIIB IB IIB77Irindium1Hhydrogen80Hgmercury28Ninickel46Pdpalladium78PtplatinumRequired forall or somelife-formsModeratelyto highlytoxic29Cucopper47Agsilver79Augold30Znzinc48Cdcadmium80HgmercuryIIIA IVA VA VIA VIIA5 6 7 8 9B C N O Fboron carbon13 14nitrogen oxygen fluorine15 16 17Al Si P S Claluminum silicon31 32phosphorus sulfur chlorine33 34 35Ga Ge As Se Brgallium germanium arsenic49 50 51selenium bromine52 53In Sn Sb Te Iindium tin antimony tellurium iodine81 82 83 84 85Ti Pb Bi Po Atthallium lead bismuth polonium astatineVIIIA2Hehelium10Neneon18Arargon36Krkrypton54Xexenon86RnradonFigure 1 Abbreviated periodic table of elements. Elements in the same vertical column, called agroup, have similar chemical properties. To simplify matters at this introductory level, only 72 of the115 known elements are shown.A8 APPENDIX 3
OHcommon covalent compounds, formedwhen atoms of one or more nonmetallic elements(Figure 1) combine with one another.The bonds between the atoms in suchmolecules are called covalent bonds <strong>and</strong>form when the atoms in the molecule shareone or more pairs of their electrons. Becausethey are formed from atoms of nonmetallicelements, molecular or covalentcompounds can be described as nonmetalnonmetalcompounds.What Are Hydrogen Bonds? Ionic <strong>and</strong>covalent bonds form between the ions oratoms within a compound. There are alsoweaker forces of attraction between the moleculesof covalent compounds (such aswater) resulting from an unequal sharing ofelectrons by two atoms.For example, an oxygen atom has amuch greater attraction for electrons th<strong>and</strong>oes a hydrogen atom. Thus, in a watermolecule, the electrons shared between theoxygen atom <strong>and</strong> its two hydrogen atomsare pulled closer to the oxygen atom, butnot actually transferred to the oxygenatom. As a result, the oxygen atom in awater molecule has a slightly negative partialcharge, <strong>and</strong> its two hydrogen atomshave a slightly positive partial charge(Figure 4, p. A-4, top).The slightly positive hydrogen atoms inone water molecule are then attracted to theslightly negative oxygen atoms in anotherwater molecule. These forces of attractionbetween water molecules are called hydrogenbonds (Figure 4, p. A-4, top). Hydrogenbonds also form between other covalentmolecules or portions of such moleculescontaining hydrogen <strong>and</strong> nonmetallic atomswith a strong ability to attract electrons.What Are Nucleic Acids? Nucleic acidsare made by linking hundreds to thous<strong>and</strong>sof four different types of monomers, callednucleotides. Each nucleotide consists of (1) aphosphate group, (2) a sugar molecule containingfive carbon atoms (deoxyribose inDNA molecules <strong>and</strong> ribose in RNA molecules),<strong>and</strong> (3) one of four different nucleotidebases (represented by A, G, C, <strong>and</strong> T,the first letter in each of their names) (Figure5, p. A-4).In the cells of living organisms, these nucleotideunits combine in different numbers<strong>and</strong> sequences to form nucleic acids such asvarious types of DNA <strong>and</strong> RNA. Hydrogenbonds formed between parts of the four nucleotidesin DNA hold two DNA str<strong>and</strong>stogether like a spiral staircase, forming adouble helix (Figure 6, p. A-4). DNA moleculescan unwind <strong>and</strong> replicate themselves.Cl – Na + Cl –Na +Cl – Na +Cl – Na + Cl –Figure 2 A solid crystal of an ionic compoundsuch as sodium chloride consists of athree-dimensional array of opposite chargedions held together by ionic bonds resultingfrom the strong forces of attraction betweenopposite electrical charges. They are formedwhen an electron is transferred from a metallicatom such as sodium (Na) to a nonmetallicelement such as chlorine (Cl). Such compoundstend to exist as solids at normal roomtemperature <strong>and</strong> atmospheric pressure.HONNClClH 2hydrogenO 2oxygenN 2nitrogenCI 2chlorineONOCOHClHHNOnitrogen oxideCOcarbon monoxideHCIhydrogen chlorideH 2 OwaterONOOCOOSOOOONO 2nitrogen dioxideHHCHCH 4methaneHCO 2carbon dioxideHNHNH 3ammoniaHSO 2sulfur dioxideOOSOSO 3sulfur trioxideHO 3ozoneSHH 2 Shydrogen sulfideFigure 3 Chemical formulas <strong>and</strong>shapes for some molecular compoundsformed when atoms of one ormore nonmetallic elements combinewith one another. The bonds betweenthe atoms in such molecules arecalled covalent bonds. Molecularcompounds tend to exist as gases orliquids at normal room temperature<strong>and</strong> atmospheric pressure.APPENDIX 3A9
Figure 4 Hydrogen bonds. Slightly unequal sharing of electrons in thewater molecule creates a molecule with a slightly negatively charged end<strong>and</strong> a slightly positively charged end. Because of this electrical polarity,hydrogen atoms of one water molecule are attracted to oxygen atoms ofanother water molecule. These forces of attraction between water moleculesare called hydrogen bonds.Hδ+δ−OH Hδ+ δ+Hδ− δ+OHδ+δ−OHδ+δ−OH Hδ+ δ+δ−O HHδ+δ+Slightlynegativechargeδ−OH Hδ+ δ+δ−O HH δ+δ+δ−OH Hδ+ δ+SlightlypositivechargeHydrogenbondsFigure 5 Generalized structure of nucleotide moleculeslinked in various numbers <strong>and</strong> sequences toform large nucleic acid molecules such as varioustypes of DNA (deoxyribose nucleic acid) <strong>and</strong> RNA(ribose nucleic acid). In DNA the 5-carbon sugar ineach nucleotide is deoxyribose; in RNA it is ribose.The four basic nucleotides used to make variousforms of DNA molecules differ in the types of nucleotidebases they contain—guanine (G), cytosine (C),adenine (A), <strong>and</strong> thymine (T).Deoxyribose in DNAribose in RNAPhosphate 5-Carbon sugar Nucleotide baseGCATGuanineCytosineAdenineThymineGCCGATSPTS = Deoxyribose sugarP = Phosphate groupHydrogen bondsSPPSCCSPAGCPA STPSPS T APGC SPT SPSPGFigure 6 Portion of the double helix of a DNA molecule. The helix is composedof two spiral (helical) str<strong>and</strong>s of nucleotides, each containing a unitof phosphate (P), deoxyribose (S), <strong>and</strong> one of four nucleotide bases: guanine(G), cytosine (C), adenine (A), <strong>and</strong> thymine (T). The two str<strong>and</strong>s areheld together by hydrogen bonds formed between various pairs of thenucleotide bases. Guanine (G) bonds with cytosine (C), <strong>and</strong> adenine (A)with thymine (T).AGTCA10 APPENDIX 3
A PPENDIX 4CLASSIFYING AND NAMING SPECIESHow Can Species Be Classified? Biologistsclassify species into different kingdoms,on the basis of similarities <strong>and</strong> differencesin characteristics such as their (1) modes ofnutrition, (2) cell structure, (3) appearance,<strong>and</strong> (4) developmental features.In this book, the earth’s organisms areclassified into six kingdoms: eubacteria,archaebacteria, protists, fungi, plants, <strong>and</strong> animals.Most bacteria, fungi, <strong>and</strong> protists aremicroorganisms: organisms so small theycannot be seen with the naked eye.Eubacteria consist of all single-celled prokaryotic(Figure 4-3, left, p. 58) bacteria exceptarchaebacteria. Examples are variouscyanobacteria <strong>and</strong> bacteria such as Staphylococcus<strong>and</strong> Streptococcus.KingdomPhylumSubphylumClassOrderFamilyGenusSpeciesSpeciesAnimalia Many-celled eukaryoticorganismsChordata Animals with notochord (along rod of stiffened tissue), nervecord, <strong>and</strong> a pharynx (a muscular tubeused in feeding, respiration, or both)Vertebrata Spinal cord enclosed in abackbone of cartilage or bone;<strong>and</strong> skull bones that protect the brainMammalia Animals whose youngare nourished by milk produced bymammary gl<strong>and</strong>s of females; <strong>and</strong>that have hair or fur <strong>and</strong> warm bloodPrimates Animals that live in treesor are descended fromtree dwellersArchaebacteria are single-celled bacteriathat are evolutionarily closer to eukaryoticcells than to eubacteria. Examples are(1) methanogens that live in anaerobic sedimentsof lakes <strong>and</strong> swamps <strong>and</strong> in animalguts, (2) halophiles that live in extremelysalty water, <strong>and</strong> (3) thermophiles that live inhot springs, hydrothermal vents, <strong>and</strong> acidicsoil.Protists (Protista) are mostly single-celledeukaryotic organisms such as diatoms,dinoflagellates, amoebas, golden brown <strong>and</strong>yellow-green algae, <strong>and</strong> protozoans. Someprotists cause human diseases such asmalaria <strong>and</strong> sleeping sickness.Fungi are mostly many-celled, sometimesmicroscopic, eukaryotic organismssuch as mushrooms, molds,mildews, <strong>and</strong> yeasts. Many fungiare decomposers. Other fungikill various plants <strong>and</strong> causehuge losses of cropsHominidae Upright animals withtwo-legged locomotion <strong>and</strong>binocular vision<strong>and</strong> valuable trees.Plants (Plantae) aremostly many-celledeukaryotic organismssuch as red,brown, <strong>and</strong> greenalgae <strong>and</strong> mosses,ferns, <strong>and</strong>floweringHomo Upright animals with large brain,language, <strong>and</strong> extended parentalcare of youngsapiens Animals with sparse body hair,high forehead, <strong>and</strong> large brainsapiens sapiens Animals capable ofsophisticated cultural evolutionplants (whose flowers produce seeds thatperpetuate the species). Some plants such ascorn <strong>and</strong> marigolds are annuals, which completetheir life cycles in one growing season;others are perennials, which can live formore than 2 years, such as roses, grapes,elms, <strong>and</strong> magnolias.Animals (Animalia) are also many-celledeukaryotic organisms. Most, called invertebrates,have no backbones. They includesponges, jellyfish, worms, arthropods (insects,shrimp, <strong>and</strong> spiders), mollusks (snails,clams, <strong>and</strong> octopuses), <strong>and</strong> echinoderms(sea urchins <strong>and</strong> sea stars). Insects play rolesthat are vital to our existence (p. 64). Vertebrates(animals with backbones <strong>and</strong> a brainprotected by skull bones) include fishes(sharks <strong>and</strong> tuna), amphibians (frogs <strong>and</strong>salam<strong>and</strong>ers), reptiles (crocodiles <strong>and</strong>snakes), birds (eagles <strong>and</strong> robins), <strong>and</strong> mammals(bats, elephants, whales, <strong>and</strong> humans).How Are Species Named? Within eachkingdom, biologists have created subcategoriesbased on anatomical, physiological,<strong>and</strong> behavioral characteristics. Kingdomsare divided into phyla, which are dividedinto subgroups called classes. Classes aresubdivided into orders, which are furtherdivided into families. Families consist of genera(singular, genus), <strong>and</strong> each genus containsone or more species. Note that theword species is both singular <strong>and</strong> plural. Figure1 shows this detailed taxonomic classificationfor the current human species.Most people call a species by its commonname, such as robin or grizzly bear. Biologistsuse scientific names (derived fromLatin) consisting of two parts (printed initalics or underlined) to describe a species.The first word is the capitalized name (orabbreviation) for the genus to which the organismbelongs. This is followed by alowercase name that distinguishes thespecies from other members of thesame genus. For example, the scientificname of the robin is Turdus migratorius(Latin for “migratory thrush”),<strong>and</strong> the grizzly bear goes by the scientificname Ursus horribilis (Latinfor “horrible bear”).Figure 1 Taxonomic classificationof the latest human species,Homo sapiens sapiens.APPENDIX 4A11
A PPENDIX 5BRIEF HISTORY OF THE AGE OF OILSome milestones in the Age of Oil:■■■1905: Oil supplies 10% of U.S. energy.1925: United States produces 71% of the world’s oil.1930: Because of an oil glut, oil sells for 10¢ a barrel.■ 1953: U.S. oil companies account for about half of theworld’s oil production <strong>and</strong> the United States is the world’sleading oil exporter.■ 1955: United States has 20% of the world’s estimated oilreserves.■ 1960: OPEC formed so developing countries, with most ofthe world’s known oil <strong>and</strong> projected oil reserves, can get ahigher price for their oil.■ 1973: United States uses 30% of the world’s oil, imports 36%of this oil, <strong>and</strong> has only 5% of the world’s proven oil reserves.■ 1973–1974: OPEC reduces oil imports to the West <strong>and</strong> bansoil exports to the U.S. because of its support for Israel in the 18-day Yom Kippur War with Egypt <strong>and</strong> Syria. World oil prices risesharply (Figure 17-11, p. 358) <strong>and</strong> lead to double-digit inflationin the United States <strong>and</strong> many other countries <strong>and</strong> a global economicrecession.■1975: Production of estimated U.S. oil reserves peaks.■ 1981: Iran–Iraq war pushes global oil prices to a historic high(Figure 17-13, p. 359).■1983: Facing an oil glut, OPEC cuts its oil prices.■ 1985: U.S. domestic oil production begins to decline <strong>and</strong> isnot expected to increase enough to affect the global price of oilor to reduce U.S. dependence on oil imports (Figure 17-12,p. 358).■ August 1990–June 1991: United States <strong>and</strong> its allies fight thePersian Gulf War to oust Iraqi invaders of Kuwait <strong>and</strong> to protectWestern access to Saudi Arabian <strong>and</strong> Kuwaiti oil supplies.■ 2004: OPEC has 67% of world oil reserves <strong>and</strong> produces 40%of the world’s oil. U.S. has only 2.9% of oil reserves, uses 26% ofthe world’s oil production, <strong>and</strong> imports 55% of its oil.■ 2010: U.S. could be importing at least 61% of the oil it uses asconsumption continues to exceed production (Figure 17-12,p. 358).■ 2010–2030: Production of oil from the world’s estimated oilreserves is expected to peak. Oil prices expected to increasegradually as the dem<strong>and</strong> for oil increasingly exceeds the supply—unlessthe world decreases dem<strong>and</strong> by wasting less energy<strong>and</strong> shifting to other sources of energy.■ 2010–2048: Domestic U.S. oil reserves projected to be 80%depleted.■ 1979: Iran’s Islamic Revolution shuts down most of Iran’s oilproduction <strong>and</strong> reduces world oil production.■2042–2083: Gradual decline in dependence on oil.A12 APPENDIX 5
GLOSSARYabiotic Nonliving. Compare biotic.acid See acid solution.acid deposition The falling of acids <strong>and</strong>acid-forming compounds from the atmosphereto the earth’s surface. Acid depositionis commonly known as acid rain, aterm that refers only to wet deposition ofdroplets of acids <strong>and</strong> acid-formingcompounds.acid rain See acid deposition.acid solution Any water solution that hasmore hydrogen ions (H ) than hydroxideions (OH ); any water solution with a pHless than 7. Compare basic solution, neutralsolution.active solar heating system System thatuses solar collectors to capture energy fromthe sun <strong>and</strong> store it as heat for space heating<strong>and</strong> water heating. Liquid or air pumpedthrough the collectors transfers the capturedheat to a storage system such as aninsulated water tank or rock bed. Pumps orfans then distribute the stored heat or hotwater throughout a dwelling as needed.Compare passive solar heating system.adaptation Any genetically controlledstructural, physiological, or behavioralcharacteristic that helps an organism survive<strong>and</strong> reproduce under a given set ofenvironmental conditions. It usually resultsfrom a beneficial mutation. See biologicalevolution, differential reproduction, mutation,natural selection.adaptive management Flexible managementthat views attempts to solve problemsas experiments, analyzes failures to seewhat went wrong, <strong>and</strong> tries to modify <strong>and</strong>improve an approach before ab<strong>and</strong>oning it.Because of the inherent unpredictability ofcomplex systems, it often uses the precautionaryprinciple as a management tool. Seeprecautionary principle.adaptive radiation Process in whichnumerous new species evolve to fill vacant<strong>and</strong> new ecological niches in changed environments,usually after a mass extinction.Typically, this takes millions of years.adaptive trait See adaptation.administrative laws Administrative rules<strong>and</strong> regulations, executive orders, <strong>and</strong>enforcement decisions related to the implementation<strong>and</strong> interpretation of statutorylaws.advanced sewage treatment Specializedchemical <strong>and</strong> physical processes that reducethe amount of specific pollutants left inwastewater after primary <strong>and</strong> secondarysewage treatment. This type of treatmentusually is expensive. See also primary sewagetreatment, secondary sewage treatment.aerobic respiration Complex process thatoccurs in the cells of most living organisms,in which nutrient organic molecules such asglucose (C 6 H 12 O 6 ) combine with oxygen(O 2 ) <strong>and</strong> produce carbon dioxide (CO 2 ),water (H 2 O), <strong>and</strong> energy. Compare photosynthesis.affluenza Unsustainable addiction tooverconsumption <strong>and</strong> materialism exhibitedin the lifestyles of affluent consumers inthe United States <strong>and</strong> other developedcountries.age structure Percentage of the population(or number of people of each sex) ateach age level in a population.agricultural revolution Gradual shiftfrom small, mobile hunting <strong>and</strong> gatheringb<strong>and</strong>s to settled agricultural communities inwhich people survived by learning how tobreed <strong>and</strong> raise wild animals <strong>and</strong> to cultivatewild plants near where they lived. Itbegan 10,000–12,000 years ago. Compareenvironmental revolution, hunter–gatherers,industrial–medical revolution, information <strong>and</strong>globalization revolution.agroecology See sustainable agriculture,low-input agriculture, <strong>and</strong> organic farming.agroforestry Planting trees <strong>and</strong> cropstogether.air pollution One or more chemicals inhigh enough concentrations in the air toharm humans, other animals, vegetation, ormaterials. Excess heat <strong>and</strong> noise are alsoconsidered forms of air pollution. Suchchemicals or physical conditions are calledair pollutants. See primary pollutant, secondarypollutant.albedo Ability of a surface to reflect light.alien species See nonnative species.allele Slightly different molecular formfound in a particular gene.alley cropping Planting of crops in stripswith rows of trees or shrubs on each side.alpha particle Positively charged matter,consisting of two neutrons <strong>and</strong> two protons,that is emitted as a form of radioactivityfrom the nuclei of some radioisotopes. Seealso beta particle, gamma rays.altitude Height above sea level. Comparelatitude.anaerobic respiration Form of cellularrespiration in which some decomposersget the energy they need through thebreakdown of glucose (or other nutrients)in the absence of oxygen. Compare aerobicrespiration.ancient forest See old-growth forest.animal manure Dung <strong>and</strong> urine of animalsused as a form of organic fertilizer.Compare green manure.annual Plant that grows, sets seed, <strong>and</strong>dies in one growing season. Compareperennial.anthropocentric Human-centered. Comparebiocentric.aquaculture Growing <strong>and</strong> harvesting offish <strong>and</strong> shellfish for human use in freshwaterponds, irrigation ditches, <strong>and</strong> lakes,or in cages or fenced-in areas of coastallagoons <strong>and</strong> estuaries. See fish farming, fishranching.aquatic Pertaining to water. Compareterrestrial.aquatic life zone Marine <strong>and</strong> freshwaterportions of the biosphere. Examples includefreshwater life zones (such as lakes <strong>and</strong>streams) <strong>and</strong> ocean or marine life zones(such as estuaries, coastlines, coral reefs,<strong>and</strong> the deep ocean).aquifer Porous, water-saturated layers ofs<strong>and</strong>, gravel, or bedrock that can yield aneconomically significant amount of water.arable l<strong>and</strong> L<strong>and</strong> that can be cultivated togrow crops.area strip mining Type of surface miningused where the terrain is flat. An earthmoverstrips away the overburden, <strong>and</strong> apower shovel digs a cut to remove the mineraldeposit. After removal of the mineral,the trench is filled with overburden, <strong>and</strong> anew cut is made parallel to the previousone. The process is repeated over the entiresite. Compare dredging, mountaintop removal,open-pit mining, subsurface mining.arid Dry. A desert or other area with anarid climate has little precipitation.GLOSSARYG1
artificial selection Process by whichhumans select one or more desirable genetictraits in the population of a plant or animalspecies <strong>and</strong> then use selective breeding to producepopulations containing many individualswith the desired traits. Compare geneticengineering, natural selection.asexual reproduction Reproduction inwhich a mother cell divides to produce twoidentical daughter cells that are clones ofthe mother cell. This type of reproduction iscommon in single-celled organisms. Comparesexual reproduction.atmosphere The whole mass of airsurrounding the earth. See stratosphere,troposphere.atmospheric pressure A measure of themass per unit area of air.atom Minute unit made of subatomic particlesthat is the basic building block of allchemical elements <strong>and</strong> thus all matter; thesmallest unit of an element that can exist<strong>and</strong> still have the unique characteristics ofthat element. Compare ion, molecule.atomic number Number of protons in thenucleus of an atom. Compare mass number.autotroph See producer.background extinction Normal extinctionof various species as a result of changes inlocal environmental conditions. Comparemass depletion, mass extinction.bacteria Prokaryotic, one-celled organisms.Some transmit diseases. Most act asdecomposers <strong>and</strong> get the nutrients theyneed by breaking down complex organiccompounds in the tissues of living or deadorganisms into simpler inorganic nutrientcompounds.barrier isl<strong>and</strong>s Long, thin, low offshoreisl<strong>and</strong>s of sediment that generally run parallelto the shore along some coasts.basic solution Water solution with morehydroxide ions (OH ) than hydrogen ions(H ); water solution with a pH greater than7. Compare acid solution, neutral solution.benthos Bottom-dwelling organisms.Compare decomposer, nekton, plankton.beta particle Swiftly moving electronemitted by the nucleus of a radioactive isotope.See also alpha particle, gamma rays.bioaccumulation An increase in theconcentration of a chemical in specificorgans or tissues at a level higher thanwould normally be expected. Comparebiomagnification.biocentric Life-centered. Compareanthropocentric.biocides See pesticides.biodegradable Capable of being brokendown by decomposers.biodegradable pollutant Material thatcan be broken down into simpler substances(elements <strong>and</strong> compounds) by bacteriaor other decomposers. Paper <strong>and</strong> mostorganic wastes such as animal manure arebiodegradable but can take decades tobiodegrade in modern l<strong>and</strong>fills. Comparedegradable pollutant, nondegradable pollutant,slowly degradable pollutant.biodiversity Variety of different species(species diversity), genetic variability amongindividuals within each species (geneticdiversity), variety of ecosystems (ecologicaldiversity), <strong>and</strong> functions such as energy flow<strong>and</strong> matter cycling needed for the survivalof species <strong>and</strong> biological communities (functionaldiversity).biofuel Gas or liquid fuel (such asethyl alcohol) made from plant material(biomass).biogeochemical cycle Natural processesthat recycle nutrients in various chemicalforms from the nonliving environment toliving organisms <strong>and</strong> then back to the nonlivingenvironment. Examples are the carbon,oxygen, nitrogen, phosphorus, sulfur,<strong>and</strong> hydrologic cycles.bioinformatics Applied science of managing,analyzing, <strong>and</strong> communicating biologicalinformation.biological amplification See biomagnification.biological community See community.biological diversity See biodiversity.biological evolution Change in thegenetic makeup of a population of a speciesin successive generations. If continued longenough, it can lead to the formation of anew species. Note that populations—notindividuals—evolve. See also adaptation, differentialreproduction, natural selection, theoryof evolution.biological oxygen dem<strong>and</strong> (BOD)Amount of dissolved oxygen needed byaerobic decomposers to break down theorganic materials in a given volume ofwater at a certain temperature over a specifiedtime period.biological pest control Control of pestpopulations by natural predators, parasites,or disease-causing bacteria <strong>and</strong> viruses(pathogens).biomagnification Increase in concentrationof DDT, PCBs, <strong>and</strong> other slowlydegradable, fat-soluble chemicals inorganisms at successively higher trophiclevels of a food chain or web. Comparebioaccumulation.biomass Organic matter produced byplants <strong>and</strong> other photosynthetic producers;total dry weight of all living organisms thatcan be supported at each trophic level in afood chain or web; dry weight of all organicmatter in plants <strong>and</strong> animals in an ecosystem;plant materials <strong>and</strong> animal wastesused as fuel.biome Terrestrial regions inhabited bycertain types of life, especially vegetation.Examples are various types of deserts,grassl<strong>and</strong>s, <strong>and</strong> forests.biopharming Use of genetically engineeredanimals to act as biofactories forproducing drugs, vaccines, antibodies,hormones, industrial chemicals such asplastics <strong>and</strong> detergents, <strong>and</strong> human bodyorgans.biosphere Zone of earth where life isfound. It consists of parts of the atmosphere(the troposphere), hydrosphere (mostlysurface water <strong>and</strong> groundwater), <strong>and</strong>lithosphere (mostly soil <strong>and</strong> surfacerocks <strong>and</strong> sediments on the bottomsof oceans <strong>and</strong> other bodies of water)where life is found. Sometimes called theecosphere.biotic Living organisms. Compare abiotic.biotic potential Maximum rate at whichthe population of a given species canincrease when there are no limits on its rateof growth. See environmental resistance.birth rate See crude birth rate.bitumen Gooey, black, high-sulfur,heavy oil extracted from tar s<strong>and</strong> <strong>and</strong> thenupgraded to synthetic fuel oil. See tar s<strong>and</strong>.breeder nuclear fission reactor Nuclearfission reactor that produces more nuclearfuel than it consumes by converting nonfissionableuranium-238 into fissionableplutonium-239.broadleaf deciduous plants Plants suchas oak <strong>and</strong> maple trees that survive drought<strong>and</strong> cold by shedding their leaves <strong>and</strong>becoming dormant. Compare broadleaf evergreenplants, coniferous evergreen plants.broadleaf evergreen plants Plants thatkeep most of their broad leaves yearround.Examples are the trees found in thecanopies of tropical rain forests. Comparebroadleaf deciduous plants, coniferous evergreenplants.buffer Substance that can react withhydrogen ions in a solution <strong>and</strong> thus holdthe acidity or pH of a solution fairly constant.See pH.calorie Unit of energy; amount of energyneeded to raise the temperature of 1 gramof water 1°C (unit on Celsius temperaturescale). See also kilocalorie.cancer Group of more than 120 differentdiseases, one for each type of cell in thehuman body. Each type of cancer producesa tumor in which cells multiply uncontrollably<strong>and</strong> invade surrounding tissue.carbon cycle Cyclic movement of carbonin different chemical forms from the environmentto organisms <strong>and</strong> then back to theenvironment.carcinogen Chemicals, ionizing radiation,<strong>and</strong> viruses that cause or promote thedevelopment of cancer. See cancer. Comparemutagen, teratogen.carnivore Animal that feeds on other animals.Compare herbivore, omnivore.carrying capacity (K) Maximum populationof a particular species that a given habitatcan support over a given period.cell Smallest living unit of an organism.Each cell is encased in an outer membraneor wall <strong>and</strong> contains genetic material(DNA) <strong>and</strong> other parts to perform its lifefunction. Organisms such as bacteria consistof only one cell, but most of the organismswe are familiar with contain many cells. Seeeukaryotic cell, prokaryotic cell.G2GLOSSARY
CFCsSee chlorofluorocarbons.chain reaction Multiple nuclear fissions,taking place within a certain mass of a fissionableisotope, that release an enormousamount of energy in a short time.chemical One of the millions of differentelements <strong>and</strong> compounds found naturally<strong>and</strong> synthesized by humans. See compound,element.chemical change Interaction betweenchemicals in which there is a change in thechemical composition of the elements orcompounds involved. Compare nuclearchange, physical change.chemical evolution Formation of theearth <strong>and</strong> its early crust <strong>and</strong> atmosphere,evolution of the biological molecules necessaryfor life, <strong>and</strong> evolution of systems ofchemical reactions needed to produce thefirst living cells. These processes arebelieved to have occurred about 1 billionyears before biological evolution. Comparebiological evolution.chemical formula Shorth<strong>and</strong> way to showthe number of atoms (or ions) in the basicstructural unit of a compound. Examplesare H 2 O, NaCl, <strong>and</strong> C 6 H 12 O 6 .chemical reaction See chemical change.chemosynthesis Process in which certainorganisms (mostly specialized bacteria)extract inorganic compounds from theirenvironment <strong>and</strong> convert them into organicnutrient compounds without the presenceof sunlight. Compare photosynthesis.chlorinated hydrocarbon Organic compoundmade up of atoms of carbon, hydrogen,<strong>and</strong> chlorine. Examples are DDT <strong>and</strong>PCBs.chlorofluorocarbons (CFCs) Organiccompounds made up of atoms of carbon,chlorine, <strong>and</strong> fluorine. An example isFreon-12 (CCl 2 F 2 ), used as a refrigerant inrefrigerators <strong>and</strong> air conditioners <strong>and</strong> inmaking plastics such as Styrofoam. GaseousCFCs can deplete the ozone layer whenthey slowly rise into the stratosphere <strong>and</strong>their chlorine atoms react with ozonemolecules.chromosome Agrouping of various genes<strong>and</strong> associated proteins in plant <strong>and</strong> animalcells that carry certain types of geneticinformation. See genes.chronic undernutrition An ongoingcondition suffered by people who cannotgrow or buy enough food to meet theirbasic energy need. Compare malnutrition,overnutrition.civil suit Lawsuit in which a plaintiffseeks to collect damages for injuries or foreconomic loss or have the court issue a permanentinjunction against further wrongfulaction. Compare class action suit.class action suit Civil lawsuit in which agroup files a suit on behalf of a larger numberof citizens who allege similar damagesbut who need not be listed <strong>and</strong> representedindividually. Compare civil suit.clear-cutting Method of timber harvestingin which all trees in a forested area areremoved in a single cutting. Compare seedtreecutting, selective cutting, shelterwood cutting,strip cutting.climate Physical properties of the troposphereof an area based on analysis of itsweather records over a long period (at least30 years). The two main factors determiningan area’s climate are temperature, with itsseasonal variations, <strong>and</strong> the amount <strong>and</strong>distribution of precipitation. Compareweather.climax community See maturecommunity.coal Solid, combustible mixture of organiccompounds with 30–98% carbon by weight,mixed with various amounts of water <strong>and</strong>small amounts of sulfur <strong>and</strong> nitrogen compounds.It forms in several stages as theremains of plants are subjected to heat <strong>and</strong>pressure over millions of years.coal gasification Conversion of solid coalto synthetic natural gas (SNG).coal liquefaction Conversion of solid coalto a liquid hydrocarbon fuel such as syntheticgasoline or methanol.coastal wetl<strong>and</strong> L<strong>and</strong> along a coastline,extending inl<strong>and</strong> from an estuary, that iscovered with salt water all or part of theyear. Examples are marshes, bays, lagoons,tidal flats, <strong>and</strong> mangrove swamps. Compareinl<strong>and</strong> wetl<strong>and</strong>.coastal zone Warm, nutrient-rich, shallowpart of the ocean that extends from thehigh-tide mark on l<strong>and</strong> to the edge of ashelflike extension of continental l<strong>and</strong>masses known as the continental shelf.Compare open sea.coevolution Evolution in which two ormore species interact <strong>and</strong> exert selectivepressures on each other that can lead eachspecies to undergo various adaptations. Seeevolution, natural selection.cogeneration Production of two usefulforms of energy, such as high-temperatureheat or steam <strong>and</strong> electricity, from the samefuel source.cold front Leading edge of an advancingmass of cold air. Compare warm front.commensalism An interaction betweenorganisms of different species in which onetype of organism benefits <strong>and</strong> the other typeis neither helped nor harmed to any greatdegree. Compare mutualism.commercial extinction Depletion of thepopulation of a wild species used as aresource to a level at which it is no longerprofitable to harvest the species.commercial inorganic fertilizer Commerciallyprepared mixture of plant nutrientssuch as nitrates, phosphates, <strong>and</strong>potassium applied to the soil to restore fertility<strong>and</strong> increase crop yields. Compareorganic fertilizer.common law Body of unwritten rules <strong>and</strong>principles derived from thous<strong>and</strong>s of pastlegal decisions. It is based on evaluation ofwhat is reasonable behavior in attemptingto balance competing social interests. Comparestatutory law.common-property resource Resourcethat people normally are free to use;each user can deplete or degrade theavailable supply. Most are renewable <strong>and</strong>owned by no one. Examples are cleanair, fish in parts of the ocean not underthe control of a coastal country, migratorybirds, gases of the lower atmosphere,<strong>and</strong> the ozone content of the upper atmosphere(stratosphere). See tragedy of thecommons.community Populations of all speciesliving <strong>and</strong> interacting in an area at aparticular time.competition Two or more individualorganisms of a single species (intraspecificcompetition) or two or more individuals ofdifferent species (interspecific competition)attempting to use the same scarce resourcesin the same ecosystem.competitive exclusion principle Notwo species can occupy exactly the samefundamental niche indefinitely in a habitatwhere there is not enough of a particularresource to meet the needs of both species.See ecological niche, fundamental niche, realizedniche.complexity In ecological terms, refers tothe number of species in a community ateach trophic level <strong>and</strong> the number oftrophic levels in a community.compost Partially decomposed organicplant <strong>and</strong> animal matter used as a soil conditioneror fertilizer.compound Combination of atoms, oroppositely charged ions, of two or moredifferent elements held together by attractiveforces called chemical bonds. Compareelement.concentration Amount of a chemical in aparticular volume or weight of air, water,soil, or other medium.condensation nuclei Tiny particleson which droplets of water vapor cancollect.coniferous evergreen plants Conebearingplants (such as spruces, pines,<strong>and</strong> firs) that keep some of their narrow,pointed leaves (needles) all year. Comparebroadleaf deciduous plants, broadleaf evergreenplants.coniferous trees Cone-bearing trees,mostly evergreens, that have needle-shapedor scalelike leaves. They produce woodknown commercially as softwood. Comparedeciduous plants.consensus science See sound science.conservation Sensible <strong>and</strong> carefuluse of natural resources by humans.People with this view are called conservationists.conservation biologist Biologist whoinvestigates human impacts on thediversity of life found on the earth(biodiversity) <strong>and</strong> develops practical plansfor preserving such biodiversity. Compareconservationist, ecologist, environmentalist,environmental scientist, preservationist,restorationist.GLOSSARYG3
conservation biology Multidisciplinaryscience created to deal with the crisis ofmaintaining the genes, species, communities,<strong>and</strong> ecosystems that make up earth’sbiological diversity. Its goals are to investigatehuman impacts on biodiversity <strong>and</strong> todevelop practical approaches to preservingbiodiversity.conservationist Person concerned withusing natural areas <strong>and</strong> wildlife in waysthat sustain them for current <strong>and</strong> futuregenerations of humans <strong>and</strong> other forms oflife. Compare conservation biologist, ecologist,environmentalist, environmental scientist,preservationist, restorationist.conservation-tillage farming Crop cultivationin which the soil is disturbed little(minimum-tillage farming) or not at all (notillfarming) to reduce soil erosion, lowerlabor costs, <strong>and</strong> save energy. Compare conventional-tillagefarming.constancy Ability of a living system, suchas a population, to maintain a certain size.Compare inertia, resilience. See homeostasis.consumer Organism that cannot synthesizethe organic nutrients it needs <strong>and</strong> getsits organic nutrients by feeding on the tissuesof producers or of other consumers;generally divided into primary consumers(herbivores), secondary consumers (carnivores),tertiary (higher-level) consumers, omnivores,<strong>and</strong> detritivores (decomposers <strong>and</strong>detritus feeders). In economics, one whouses economic goods.contour farming Plowing <strong>and</strong> plantingacross the changing slope of l<strong>and</strong>, ratherthan in straight lines, to help retain water<strong>and</strong> reduce soil erosion.contour strip mining Form of surfacemining used on hilly or mountainous terrain.A power shovel cuts a series of terracesinto the side of a hill. An earthmoverremoves the overburden, <strong>and</strong> a powershovel extracts the coal, with the overburdenfrom each new terrace dumped ontothe one below. Compare area strip mining,dredging, mountaintop removal, open-pit mining,subsurface mining.controlled burning Deliberately set, carefullycontrolled surface fires that reduceflammable litter <strong>and</strong> decrease the chances ofdamaging crown fires. See ground fire, surfacefire.conventional-tillage farming Cropcultivation method in which a planting surfaceis made by plowing l<strong>and</strong>, breaking upthe exposed soil, <strong>and</strong> then smoothing thesurface. Compare conservation-tillage farming.convergent plate boundary Area whereearth’s lithospheric plates are pushedtogether. See subduction zone. Comparedivergent plate boundary, transform fault.coral reef Formation produced by massivecolonies containing billions of tinycoral animals, called polyps, that secrete astony substance (calcium carbonate) aroundthemselves for protection. When the coralsdie, their empty outer skeletons form layers<strong>and</strong> cause the reef to grow. They are foundin the coastal zones of warm tropical <strong>and</strong>subtropical oceans.core Inner zone of the earth. It consists ofa solid inner core <strong>and</strong> a liquid outer core.Compare crust, mantle.corrective feedback loop See negative feedbackloop.corridors Long areas of l<strong>and</strong> connectinghabitat that would otherwise becomefragmented.cost–benefit analysis (CBA) Estimates<strong>and</strong> comparison of short-term <strong>and</strong> longtermbenefits (gains) <strong>and</strong> costs (losses) froman economic decision.cover crops The planting of crops such asalfalfa, clover, or rye immediately after harvestto help protect <strong>and</strong> hold the soil.critical mass Amount of fissionable nucleineeded to sustain a nuclear fission chainreaction.crop rotation Planting a field, or an areaof a field, with different crops from year toyear to reduce soil nutrient depletion. Aplant such as corn, tobacco, or cotton, whichremoves large amounts of nitrogen from thesoil, is planted one year. The next year alegume such as soybeans, which adds nitrogento the soil, is planted.crown fire Extremely hot forest fire thatburns ground vegetation <strong>and</strong> treetops.Compare controlled burning, ground fire, surfacefire.crude birth rate Annual number of livebirths per 1,000 people in the population ofa geographic area at the midpoint of a givenyear. Compare crude death rate.crude death rate Annual number ofdeaths per 1,000 people in the population ofa geographic area at the midpoint of a givenyear. Compare crude birth rate.crude oil Gooey liquid consisting mostlyof hydrocarbon compounds <strong>and</strong> smallamounts of compounds containing oxygen,sulfur, <strong>and</strong> nitrogen. Extracted from undergroundaccumulations, it is sent to oilrefineries, where it is converted to heatingoil, diesel fuel, gasoline, tar, <strong>and</strong> othermaterials.crust Solid outer zone of the earth. It consistsof oceanic crust <strong>and</strong> continental crust.Compare core, mantle.cultural eutrophication Overnourishmentof aquatic ecosystems with plant nutrients(mostly nitrates <strong>and</strong> phosphates) because ofhuman activities such as agriculture, urbanization,<strong>and</strong> discharges from industrialplants <strong>and</strong> sewage treatment plants. Seeeutrophication.cyanobacteria Single-celled, prokaryotic,microscopic organisms. Before being reclassifiedas monera, they were called bluegreenalgae.DDT Dichlorodiphenyltrichloroethane, achlorinated hydrocarbon that has beenwidely used as an insecticide but is nowbanned in some countries.death rate See crude death rate.debt-for-nature swap Agreement inwhich a certain amount of foreign debt iscanceled in exchange for local currencyinvestments that will improve naturalresource management or protect certainareas in the debtor country from harmfuldevelopment.deciduous plants Trees, such as oaks <strong>and</strong>maples, <strong>and</strong> other plants that survive duringdry seasons or cold seasons by sheddingtheir leaves. Compare coniferous trees, succulentplants.decomposer Organism that digests partsof dead organisms <strong>and</strong> cast-off fragments<strong>and</strong> wastes of living organisms by breakingdown the complex organic molecules inthose materials into simpler inorganic compounds<strong>and</strong> then absorbing the solublenutrients. Producers return most of thesechemicals to the soil <strong>and</strong> water for reuse.Decomposers consist of various bacteria<strong>and</strong> fungi. Compare consumer, detritivore,producer.deductive reasoning Using logic to arriveat a specific conclusion based on a generalizationor premise. It goes from the generalto the specific. Compare inductive reasoning.defendant The individual, group ofindividuals, corporation, or governmentagency being charged in a lawsuit. Compareplaintiff.deforestation Removal of trees from aforested area without adequate replanting.degradable pollutant Potentially pollutingchemical that is broken down completelyor reduced to acceptable levels bynatural physical, chemical, <strong>and</strong> biologicalprocesses. Compare biodegradable pollutant,nondegradable pollutant, slowly degradablepollutant.degree of urbanization Percentage of thepopulation in the world, or a country, livingin areas with a population of more than2,500 people (higher in some countries).Compare urban growth.democracy Government by the peoplethrough their elected officials <strong>and</strong>appointed representatives. In a constitutionaldemocracy, a constitution provides the basisof government authority <strong>and</strong> puts restraintson government power through free elections<strong>and</strong> freely expressed public opinion.demographic transition Hypothesis thatcountries, as they become industrialized,have declines in death rates followed bydeclines in birth rates.demography The study of the size, composition,<strong>and</strong> distribution of human populations<strong>and</strong> the causes <strong>and</strong> consequences ofchanges in these characteristics.depletion time The time it takes to use acertain fraction, usually 80%, of the knownor estimated supply of a nonrenewableresource at an assumed rate of use. Finding<strong>and</strong> extracting the remaining 20% usuallycosts more than it is worth.desalination Purification of salt water orbrackish (slightly salty) water by removal ofdissolved salts.desert Biome in which evaporationexceeds precipitation <strong>and</strong> the averageamount of precipitation is less than 25 cen-G4GLOSSARY
timeters (10 inches) a year. Such areas havelittle vegetation or have widely spaced,mostly low vegetation. Compare forest,grassl<strong>and</strong>.desertification Conversion of rangel<strong>and</strong>,rain-fed cropl<strong>and</strong>, or irrigated cropl<strong>and</strong> todesertlike l<strong>and</strong>, with a drop in agriculturalproductivity of 10% or more. It usually iscaused by a combination of overgrazing,soil erosion, prolonged drought, <strong>and</strong> climatechange.detritivore Consumer organism that feedson detritus, parts of dead organisms, <strong>and</strong>cast-off fragments <strong>and</strong> wastes of livingorganisms. The two principal types aredetritus feeders <strong>and</strong> decomposers.detritus Parts of dead organisms <strong>and</strong>cast-off fragments <strong>and</strong> wastes of livingorganisms.detritus feeder Organism that extractsnutrients from fragments of dead organisms<strong>and</strong> their cast-off parts <strong>and</strong> organic wastes.Examples are earthworms, termites, <strong>and</strong>crabs. Compare decomposer.deuterium (D; hydrogen-2) Isotope of theelement hydrogen, with a nucleus containingone proton <strong>and</strong> one neutron <strong>and</strong> a massnumber of 2.developed country Country that is highlyindustrialized <strong>and</strong> has a high per capitaGNP. Compare developing country.developing country Country that has lowto moderate industrialization <strong>and</strong> low tomoderate per capita GNP. Most are locatedin Africa, Asia, <strong>and</strong> Latin America. Comparedeveloped country.dieback Sharp reduction in the populationof a species when its numbers exceedthe carrying capacity of its habitat. See carryingcapacity.differential reproduction Phenomenon inwhich individuals with adaptive genetictraits produce more living offspring than doindividuals without such traits. See naturalselection.dioxins Family of 75 different chlorinatedhydrocarbon compounds formed asunwanted by-products in chemical reactionsinvolving chlorine <strong>and</strong> hydrocarbons,usually at high temperatures.discount rate The economic value aresource will have in the future comparedwith its present value.dissolved oxygen (DO) content Amountof oxygen gas (O 2 ) dissolved in a given volumeof water at a particular temperature<strong>and</strong> pressure, often expressed as a concentrationin parts of oxygen per million partsof water.distribution Area over which we can finda species. See range.disturbance A discrete event thatdisrupts an ecosystem or community.Examples of natural disturbances includefires, hurricanes, tornadoes, droughts, <strong>and</strong>floods. Examples of human-caused disturbancesinclude deforestation, overgrazing,<strong>and</strong> plowing.divergent plate boundary Area whereearth’s lithospheric plates move apart inopposite directions. Compare convergentplate boundary, transform fault.DNA (deoxyribonucleic acid) Large moleculesin the cells of organisms that carrygenetic information in living organisms.domesticated species Wild species tamedor genetically altered by crossbreeding foruse by humans for food (cattle, sheep, <strong>and</strong>food crops), pets (dogs <strong>and</strong> cats), or enjoyment(animals in zoos <strong>and</strong> plants in gardens).Compare wild species.dose The amount of a potentially harmfulsubstance an individual ingests, inhales, orabsorbs through the skin. Compare response.See dose-response curve, median lethal dose.dose-response curve Plot of data showingeffects of various doses of a toxic agent on agroup of test organisms. See dose, medianlethal dose, response.doubling time The time it takes (usuallyin years) for the quantity of somethinggrowing exponentially to double. It can becalculated by dividing the annual percentagegrowth rate into 70.drainage basin See watershed.dredging Type of surface mining in whichchain buckets <strong>and</strong> draglines scrape up s<strong>and</strong>,gravel, <strong>and</strong> other surface deposits coveredwith water. It is also used to remove sedimentfrom streams <strong>and</strong> harbors to maintainshipping channels. See dredge spoils. Comparearea strip mining, contour strip mining,mountaintop removal, open-pit mining, subsurfacemining.drift-net fishing Catching fish in hugenets that drift in the water.drought Condition in which an areadoes not get enough water because oflower-than-normal precipitation or higherthan-normaltemperatures that increaseevaporation.early successional plant species Plantspecies found in the early stages of successionthat grow close to the ground, canestablish large populations quickly underharsh conditions, <strong>and</strong> have short lives.Compare late successional plant species, midsuccessionalplant species.earthquake Shaking of the ground resultingfrom the fracturing <strong>and</strong> displacement ofrock, which produces a fault, or from subsequentmovement along the fault.ecological diversity The variety of forests,deserts, grassl<strong>and</strong>s, oceans, streams, lakes,<strong>and</strong> other biological communities interactingwith one another <strong>and</strong> with their nonlivingenvironment. See biodiversity. Comparefunctional diversity, genetic diversity, speciesdiversity.ecological efficiency Percentage of energytransferred from one trophic level toanother in a food chain or web.ecological footprint Amount of biologicallyproductive l<strong>and</strong> <strong>and</strong> water needed tosupply each person or population with therenewable resources they use <strong>and</strong> to absorbor dispose of the wastes from such resourceuse. It measures the average environmentalimpact of individuals or populations in differentcountries <strong>and</strong> areas.ecological niche Total way of life or roleof a species in an ecosystem. It includes allphysical, chemical, <strong>and</strong> biological conditionsa species needs to live <strong>and</strong> reproducein an ecosystem. See fundamental niche, realizedniche.ecological restoration Deliberate alterationof a degraded habitat or ecosystem torestore as much of its ecological structure<strong>and</strong> function as possible.ecological succession Process in whichcommunities of plant <strong>and</strong> animal species ina particular area are replaced over time by aseries of different <strong>and</strong> often more complexcommunities. See primary succession, secondarysuccession.ecologist Biological scientist who studiesrelationships between living organisms <strong>and</strong>their environment. Compare conservationbiologist, conservationist, environmentalist,environmental scientist, preservationist,restorationist.ecology Study of the interactions of livingorganisms with one another <strong>and</strong> with theirnonliving environment of matter <strong>and</strong>energy; study of the structure <strong>and</strong> functionsof nature.economic decision Deciding what goods<strong>and</strong> services to produce, how to producethem, how much to produce, <strong>and</strong> how todistribute them to people.economic depletion Exhaustion of 80% ofthe estimated supply of a nonrenewableresource. Finding, extracting, <strong>and</strong> processingthe remaining 20% usually costs morethan it is worth. May also apply to thedepletion of a renewable resource, such as afish or tree species.economic development Improvement ofliving st<strong>and</strong>ards by economic growth. Compareeconomic growth, environmentally sustainableeconomic development.economic growth Increase in the capacityto provide people with goods <strong>and</strong> servicesproduced by an economy; an increase ingross domestic product (GDP)). Compareeconomic development, environmentally sustainableeconomic development, sustainable economicdevelopment. See gross domestic product.economic resources Natural resources,capital goods, <strong>and</strong> labor used in an economyto produce material goods <strong>and</strong> services.See natural resources.economics The study of how individuals<strong>and</strong> societies choose to use limited or scarceresources to satisfy their unlimited wants.economic system Method that a group ofpeople uses to choose what goods <strong>and</strong> servicesto produce, how to produce them,how much to produce, <strong>and</strong> how to distributethem to people. See pure free-market economicsystem.economy System of production, distribution,<strong>and</strong> consumption of economic goods.ecosphere See biosphere.GLOSSARYG5
ecosystem Community of differentspecies interacting with one another <strong>and</strong>with the chemical <strong>and</strong> physical factors makingup its nonliving environment.ecosystem services Natural services ornatural capital that support life on the earth<strong>and</strong> are essential to the quality of humanlife <strong>and</strong> the functioning of the world’seconomies. See natural resources.ecotone Transitional zone in which onetype of ecosystem tends to merge withanother ecosystem. See edge effect.edge effect The existence of a greaternumber of species <strong>and</strong> a higher populationdensity in a transition zone (ecotone)between two ecosystems than in either adjacentecosystem. See ecotone.electromagnetic radiation Forms ofkinetic energy traveling as electromagneticwaves. Examples are radio waves, TVwaves, microwaves, infrared radiation, visiblelight, ultraviolet radiation, X rays, <strong>and</strong>gamma rays. Compare ionizing radiation,nonionizing radiation.electron (e) Tiny particle moving aroundoutside the nucleus of an atom. Each electronhas one unit of negative charge <strong>and</strong>almost no mass. Compare neutron, proton.element Chemical, such as hydrogen (H),iron (Fe), sodium (Na), carbon (C), nitrogen(N), or oxygen (O), whose distinctly differentatoms serve as the basic building blocksof all matter. Two or more elements combineto form compounds that make up mostof the world’s matter. Compare compound.endangered species A wild species withso few individual survivors that the speciescould soon become extinct in all or most ofits natural range. Compare threatened species.endemic species Species that is found inonly one area. Such species are especiallyvulnerable to extinction.energy Capacity to do work by performingmechanical, physical, chemical,or electrical tasks or to cause a heattransfer between two objects at differenttemperatures.energy efficiency Percentage of the totalenergy input that does useful work <strong>and</strong> isnot converted into low-quality, usually uselessheat in an energy conversion system orprocess. See energy quality, net energy. Comparematerial efficiency.energy productivity See energy efficiency.energy quality Ability of a form of energyto do useful work. High-temperature heat<strong>and</strong> the chemical energy in fossil fuels <strong>and</strong>nuclear fuels are concentrated high-qualityenergy. Low-quality energy such as lowtemperatureheat is dispersed or diluted<strong>and</strong> cannot do much useful work. See highqualityenergy, low-quality energy.environment All external conditions <strong>and</strong>factors, living <strong>and</strong> nonliving (chemicals <strong>and</strong>energy), that affect an organism or otherspecified system during its lifetime.environmental degradation Depletion ordestruction of a potentially renewableresource such as soil, grassl<strong>and</strong>, forest, orwildlife that is used faster than it is naturallyreplenished. If such use continues, theresource becomes nonrenewable (on ahuman time scale) or nonexistent (extinct).See also sustainable yield.environmental ethics Human beliefsabout what is right or wrong environmentalbehavior.environmentalism A social movementdedicated to protecting the earth’s lifesupport systems for us <strong>and</strong> other species.environmentalist Person who is concernedabout the impact of people onenvironmental quality <strong>and</strong> believe thatsome human actions are degrading parts ofthe earth’s life-support systems for humans<strong>and</strong> many other forms of life. Compare conservationbiologist, conservationist, ecologist,environmental scientist, preservationist,restorationist.environmental justice Fair treatment<strong>and</strong> meaningful involvement of all peopleregardless of race, color, sex, national origin,or income with respect to the development,implementation, <strong>and</strong> enforcement of environmentallaws, regulations, <strong>and</strong> policies.environmentally sustainable economicdevelopment Development that encouragesforms of economic growth that meetthe basic needs of the current generations ofhumans <strong>and</strong> other species without preventingfuture generations of humans <strong>and</strong> otherspecies from meeting their basic needs <strong>and</strong>discourages environmentally harmful <strong>and</strong>unsustainable forms of economic growth. Itis the economic component of an environmentallysustainable society. Compare economicdevelopment, economic growth.environmentally sustainable societySociety that satisfies the basic needs of itspeople without depleting or degrading itsnatural resources <strong>and</strong> thereby preventingcurrent <strong>and</strong> future generations of humans<strong>and</strong> other species from meeting their basicneeds.environmental movement Efforts by citizensat the grassroots level to dem<strong>and</strong> thatpolitical leaders enact laws <strong>and</strong> developpolicies to curtail pollution, clean up pollutedenvironments, <strong>and</strong> protect pristineareas <strong>and</strong> species from environmentaldegradation.environmental policy Laws, rules, <strong>and</strong>regulations related to an environmentalproblem that are developed, implemented,<strong>and</strong> enforced by a particular governmentagency.environmental resistance All the limitingfactors that act together to limit the growthof a population. See biotic potential, limitingfactor.environmental revolution Culturalchange involving halting populationgrowth <strong>and</strong> altering lifestyles, political <strong>and</strong>economic systems, <strong>and</strong> the way we treat theenvironment so that we can help sustain theearth for ourselves <strong>and</strong> other species. Thisinvolves working with the rest of nature bylearning more about how nature sustainsitself. See environmental wisdom worldview.Compare agricultural revolution, huntergatherers,industrial-medical hunter–gatherers,industrial–medical revolution, information <strong>and</strong>globalization revolution.environmental science An interdisciplinarystudy that uses information from thephysical sciences <strong>and</strong> social sciences tolerantof how the earth works, how we interactwith the earth, <strong>and</strong> how to deal with environmentalproblems.environmental scientist Scientist whouses information from the physical sciences<strong>and</strong> social sciences to underst<strong>and</strong> how theearth works, learn how humans interactwith the earth, <strong>and</strong> develop solutions toenvironmental problems. Compare conservationbiologist, conservationist, ecologist,preservationist, restorationist.environmental wisdom worldviewBeliefs that (1) nature exists for all theearth’s species, not just for us, <strong>and</strong> we arenot in charge of the rest of nature;(2) resources are limited, should not bewasted, <strong>and</strong> are not all for us; (3) we shouldencourage earth-sustaining forms of economicgrowth <strong>and</strong> discourage earthdegradingforms of economic growth; <strong>and</strong>(4) our success depends on learning tocooperate with one another <strong>and</strong> with therest of nature instead of trying to dominate<strong>and</strong> manage earth’s life-support systemsprimarily for our own use. Compare frontierenvironmental worldview, planetary managementworldview, spaceship-earth worldview,stewardship worldview.environmental worldview How peoplethink the world works, what they thinktheir role in the world should be, <strong>and</strong> whatthey believe is right <strong>and</strong> wrong environmentalbehavior (environmental ethics).EPA U.S. <strong>Environmental</strong> ProtectionAgency; responsible for managing federalefforts to control air <strong>and</strong> water pollution,radiation <strong>and</strong> pesticide hazards, environmentalresearch, hazardous waste, <strong>and</strong> solidwaste disposal.epidemiology Study of the patterns ofdisease or other harmful effects from toxicexposure within defined groups of peopleto find out why some people get sick <strong>and</strong>some do not.epiphyte Plant that uses its roots to attachitself to branches high in trees, especially intropical forests.erosion Process or group of processes bywhich loose or consolidated earth materialsare dissolved, loosened, or worn away <strong>and</strong>removed from one place <strong>and</strong> deposited inanother. See weathering.estuary Partially enclosed coastal area atthe mouth of a river where its freshwater,carrying fertile silt <strong>and</strong> runoff from thel<strong>and</strong>, mixes with salty seawater.eukaryotic cell Cell containing a nucleus, aregion of genetic material surrounded by amembrane. Membranes also enclose severalof the other internal parts found in aeukaryotic cell. Compare prokaryotic cell.euphotic zone Upper layer of a body ofwater through which sunlight can penetrate<strong>and</strong> support photosynthesis.G6GLOSSARY
eutrophication Physical, chemical, <strong>and</strong>biological changes that take place after alake, estuary, or slow-flowing streamreceives inputs of plant nutrients—mostlynitrates <strong>and</strong> phosphates—from natural erosion<strong>and</strong> runoff from the surrounding l<strong>and</strong>basin. See cultural eutrophication.eutrophic lake Lake with a large or excessivesupply of plant nutrients, mostlynitrates <strong>and</strong> phosphates. Comparemesotrophic lake, oligotrophic lake.evaporation Conversion of a liquid into agas.even-aged management Method of forestmanagement in which trees, sometimes of asingle species in a given st<strong>and</strong>, are maintainedat about the same age <strong>and</strong> size <strong>and</strong>are harvested all at once. Compare unevenagedmanagement.evergreen plants Plants that keep some oftheir leaves or needles throughout the year.Examples are ferns <strong>and</strong> cone-bearing trees(conifers) such as firs, spruces, pines, redwoods,<strong>and</strong> sequoias. Compare deciduousplants, succulent plants.evolution See biological evolution.exhaustible resource See nonrenewableresource.existence value See intrinsic value.exotic species See nonnative species.experiment Procedure a scientist uses tostudy some phenomenon under knownconditions. Scientists conduct some experimentsin the laboratory <strong>and</strong> others innature. The resulting scientific data or factsmust be verified or confirmed by repeatedobservations <strong>and</strong> measurements, ideally byseveral different investigators.exploitation competition Situation inwhich two competing species have equalaccess to a specific resource but differ inhow quickly or efficiently they exploit it.See interference competition, interspecificcompetition.exponential growth Growth in whichsome quantity, such as population size oreconomic output, increases at a constantrate per unit of time (such as 2% per year).An example is the growth sequence 2, 4, 8,16, 32, 64 <strong>and</strong> so on; when the increase inquantity over time is plotted, this type ofgrowth yields a curve shaped like the letterJ. Compare linear growth.external benefit Beneficial socialeffect of producing <strong>and</strong> using an economicgood that is not included in the marketprice of the good. Compare external cost,full cost.external cost Harmful social effect of producing<strong>and</strong> using an economic good that isnot included in the market price of thegood. Compare external benefit, full cost,internal cost.externalities Social benefits (“goods”) <strong>and</strong>social costs (“bads”) not included in themarket price of an economic good. Seeexternal benefit, external cost. Compare fullcost, internal cost.extinction Complete disappearance of aspecies from the earth. This happens whena species cannot adapt <strong>and</strong> successfullyreproduce under new environmental conditionsor when it evolves into one or morenew species. Compare speciation. See alsoendangered species, mass depletion, mass extinction,threatened species.family planning Providing information,clinical services, <strong>and</strong> contraceptives to helppeople choose the number <strong>and</strong> spacing ofchildren they want to have.famine Widespread malnutrition <strong>and</strong>starvation in a particular area because of ashortage of food, usually caused bydrought, war, flood, earthquake, or othercatastrophic events that disrupt food production<strong>and</strong> distribution.feedback loop Circuit of sensing, evaluating,<strong>and</strong> reacting to changes in environmentalconditions as a result of information fedback into a system; it occurs when onechange leads to some other change, whicheventually reinforces or slows the originalchange. See negative feedback loop, positivefeedback loop.feedlot Confined outdoor or indoor spaceused to raise hundreds to thous<strong>and</strong>s ofdomesticated livestock. Compare rangel<strong>and</strong>.fermentation See anaerobic respiration.fertility The number of births that occurto an individual woman or in a population.fertilizer Substance that adds inorganic ororganic plant nutrients to soil <strong>and</strong> improvesits ability to grow crops, trees, or other vegetation.See commercial inorganic fertilizer,organic fertilizer.first law of thermodynamics In anyphysical or chemical change, no detectableamount of energy is created or destroyed,but in these processes energy can bechanged from one form to another; you cannotget more energy out of something thanyou put in; in terms of energy quantity, youcannot get something for nothing (there isno free lunch). This law does not apply tonuclear changes, in which energy can beproduced from small amounts of matter.See second law of thermodynamics.fishery Concentrations of particularaquatic species suitable for commercial harvestingin a given ocean area or inl<strong>and</strong> bodyof water.fish farming Form of aquaculture inwhich fish are cultivated in a controlledpond or other environment <strong>and</strong> harvestedwhen they reach the desired size. See alsofish ranching.fish ranching Form of aquaculture inwhich members of a fish species such assalmon are held in captivity for the first fewyears of their lives, released, <strong>and</strong> then harvestedas adults when they return from theocean to their freshwater birthplace tospawn. See also fish farming.fissionable isotope Isotope that cansplit apart when hit by a neutron at theright speed <strong>and</strong> thus undergo nuclearfission. Examples are uranium-235 <strong>and</strong>plutonium-239.floodplain Flat valley floor next to astream channel. For legal purposes, theterm often applies to any low area that hasthe potential for flooding, including certaincoastal areas.flows See throughputs.flyway Generally fixed route along whichwaterfowl migrate from one area to anotherat certain seasons of the year.food chain Series of organisms in whicheach eats or decomposes the preceding one.Compare food web.food web Complex network of manyinterconnected food chains <strong>and</strong> feedingrelationships. Compare food chain.forest Biome with enough average annualprecipitation (at least 76 centimeters, or 30inches) to support growth of various treespecies <strong>and</strong> smaller forms of vegetation.Compare desert, grassl<strong>and</strong>.fossil fuel Products of partial or completedecomposition of plants <strong>and</strong> animals thatoccur as crude oil, coal, natural gas, orheavy oils as a result of exposure to heat<strong>and</strong> pressure in the earth’s crust over millionsof years. See coal, crude oil, naturalgas.fossils Skeletons, bones, shells, bodyparts, leaves, seeds, or impressions of suchitems that provide recognizable evidence oforganisms that lived long ago.free-access resource See common-propertyresource.freons See chlorofluorocarbons.freshwater life zones Aquatic systemswhere water with a dissolved salt concentrationof less than 1% by volume accumulateson or flows through the surfaces ofterrestrial biomes. Examples are st<strong>and</strong>ing(lentic) bodies of freshwater such as lakes,ponds, <strong>and</strong> inl<strong>and</strong> wetl<strong>and</strong>s <strong>and</strong> flowing(lotic) systems such as streams <strong>and</strong> rivers.Compare biome.front The boundary between two airmasses with different temperatures <strong>and</strong>densities. See cold front, warm front.frontier worldview Viewing undevelopedl<strong>and</strong> as a hostile wilderness to be conquered(cleared, planted) <strong>and</strong> exploited for itsresources as quickly as possible. Compareenvironmental wisdom worldview, planetarymanagement worldview, spaceship-earth worldview,stewardship worldview.frontier forest See old-growth forest.frontier science Preliminary scientificdata, hypotheses, <strong>and</strong> models that have notbeen widely tested <strong>and</strong> accepted. Comparejunk science, sound science.full cost Cost of a good when its internalcosts <strong>and</strong> its estimated short- <strong>and</strong> long-termexternal costs are included in its marketprice. Compare external cost, internal cost.functional diversity Biological <strong>and</strong> chemicalprocesses or functions such as energyflow <strong>and</strong> matter cycling needed for the survivalof species <strong>and</strong> biological communities.See biodiversity, ecological diversity, geneticdiversity, species diversity.GLOSSARYG7
fundamental niche The full potentialrange of the physical, chemical, <strong>and</strong> biologicalfactors a species can use if there is nocompetition from other species. See ecologicalniche. Compare realized niche.fungicide Chemical that kills fungi.Gaia hypothesis Hypothesis that theearth is alive <strong>and</strong> can be considered a systemthat operates <strong>and</strong> changes by feedbackof information between its living <strong>and</strong> nonlivingcomponents.gamma rays A form of ionizing electromagneticradiation with a high energy contentemitted by some radioisotopes. Theyreadily penetrate body tissues. See alsoalpha particle, beta particle.gangue Waste or undesired material in anore. See ore.GDP See gross domestic product.gene flow Movement of genes betweenpopulations, which can lead to changes inthe genetic composition of local populations.gene mutation See mutation.gene pool The sum total of all genesfound in the individuals of the populationof a particular species.generalist species Species with a broadecological niche. They can live in manydifferent places, eat a variety of foods, <strong>and</strong>tolerate a wide range of environmental conditions.Examples are flies, cockroaches,mice, rats, <strong>and</strong> human beings. Comparespecialist species.genes Coded units of information aboutspecific traits that are passed on from parentsto offspring during reproduction. Theyconsist of segments of DNA moleculesfound in chromosomes.gene splicing See genetic engineering.genetic adaptation Changes in thegenetic makeup of organisms of a speciesthat allow the species to reproduce <strong>and</strong> gaina competitive advantage under changedenvironmental conditions. See differentialreproduction, evolution, mutation, naturalselection.genetically modified organism (GMO)Organism whose genetic makeup has beenmodified by genetic engineering.genetic diversity Variability in thegenetic makeup among individuals within asingle species. See biodiversity. Compare ecologicaldiversity, functional diversity, speciesdiversity.genetic drift Change in the genetic compositionof a population by chance. It isespecially important for small populations.genetic engineering Insertion of an aliengene into an organism to give it a beneficialgenetic trait. Compare artificial selection,natural selection.genome Complete set of genetic informationfor an organism.geographic isolation Separation of populationsof a species for long times intodifferent areas.geology Study of the earth’s dynamic history.Geologists study <strong>and</strong> analyze rocks<strong>and</strong> the features <strong>and</strong> processes of the earth’sinterior <strong>and</strong> surface.geothermal energy Heat transferred fromthe earth’s underground concentrations ofdry steam (steam with no water droplets),wet steam (a mixture of steam <strong>and</strong> waterdroplets), or hot water trapped in fracturedor porous rock.global climate change Abroad term thatrefers to changes in the earth’s climatemostly as a result of changes in temperature<strong>and</strong> precipitation.globalization Broad process of globalsocial, economic, <strong>and</strong> environmental changethat leads to an increasingly integratedworld. See information <strong>and</strong> globalization revolution.global warming Warming of the earth’satmosphere because of increases in theconcentrations of one or more greenhousegases primarily as a result of human activities.See greenhouse effect, greenhouse gases.grassl<strong>and</strong> Biome found in regions wheremoderate annual average precipitation(25–76 centimeters, or 10–30 inches) isenough to support the growth of grass <strong>and</strong>small plants but not enough to supportlarge st<strong>and</strong>s of trees. Compare desert, forest.greenhouse effect A natural effect thatreleases heat in the atmosphere (troposphere)near the earth’s surface. Watervapor, carbon dioxide, ozone, <strong>and</strong> severalother gases in the lower atmosphere (troposphere)absorb some of the infrared radiation(heat) radiated by the earth’s surface.This causes their molecules to vibrate <strong>and</strong>transform the absorbed energy into longerwavelengthinfrared radiation (heat) in thetroposphere. If the atmospheric concentrationsof these greenhouse gases rise <strong>and</strong>they are not removed by other naturalprocesses, the average temperature of thelower atmosphere will increase gradually.Compare global warming. See also naturalgreenhouse effect.greenhouse gases Gases in the earth’slower atmosphere (troposphere) that causethe greenhouse effect. Examples are carbondioxide, chlorofluorocarbons, ozone,methane, water vapor, <strong>and</strong> nitrous oxide.green manure Freshly cut or still-growinggreen vegetation that is plowed into the soilto increase the organic matter <strong>and</strong> humusavailable to support crop growth. Compareanimal manure.green revolution Popular term for introductionof scientifically bred or selectedvarieties of grain (rice, wheat, maize) that,with high enough inputs of fertilizer <strong>and</strong>water, can greatly increase crop yields.gross domestic product (GDP) Annualmarket value of all goods <strong>and</strong> servicesproduced by all firms <strong>and</strong> organizations,foreign <strong>and</strong> domestic, operating within acountry.gross primary productivity (GPP) Therate at which an ecosystem’s producers capture<strong>and</strong> store a given amount of chemicalenergy as biomass in a given length of time.Compare net primary productivity.ground fire Fire that burns decayedleaves or peat deep below the ground surface.Compare crown fire, surface fire.groundwater Water that sinks into the soil<strong>and</strong> is stored in slowly flowing <strong>and</strong> slowlyrenewed underground reservoirs calledaquifers; underground water in the zone ofsaturation, below the water table. Comparerunoff, surface water.habitat Place or type of place where anorganism or population of organisms lives.Compare ecological niche.habitat fragmentation Breakup of a habitatinto smaller pieces, usually as a result ofhuman activities.half-life Time needed for one-half of thenuclei in a radioisotope to emit its radiation.Each radioisotope has a characteristic halflife,which may range from a few millionthsof a second to several billion years. Seeradioisotope.hazard Something that can cause injury,disease, economic loss, or environmentaldamage. See also risk.hazardous chemical Chemical that cancause harm because it is flammable orexplosive, can irritate or damage the skin orlungs (such as strong acidic or alkaline substances),or can cause allergic reactions ofthe immune system (allergens). See alsotoxic chemical.hazardous waste Any solid, liquid, orcontainerized gas that can catch fire easily,is corrosive to skin tissue or metals, isunstable <strong>and</strong> can explode or release toxicfumes, or has harmful concentrations of oneor more toxic materials that can leach out.See also toxic waste.heat Total kinetic energy of all the r<strong>and</strong>omlymoving atoms, ions, or moleculeswithin a given substance, excluding theoverall motion of the whole object. Heatalways flows spontaneously from a hotsample of matter to a colder sample of matter.This is one way to state the second lawof thermodynamics. Compare temperature.herbicide Chemical that kills a plant orinhibits its growth.herbivore Plant-eating organism. Examplesare deer, sheep, grasshoppers, <strong>and</strong> zooplankton.Compare carnivore, omnivore.heterotroph See consumer.high An air mass with a high pressure.Compare low.high-input agriculture See industrializedagriculture.high-quality energy Energy that is concentrated<strong>and</strong> has great ability to performuseful work. Examples are high-temperatureheat <strong>and</strong> the energy in electricity, coal,oil, gasoline, sunlight, <strong>and</strong> nuclei of uranium-235.Compare low-quality energy.high-quality matter Matter that is concentrated<strong>and</strong> contains a high concentrationof a useful resource. Compare low-qualitymatter.G8GLOSSARY
high-throughput economy The situationin most advanced industrialized countries,in which ever-increasing economic growthis sustained by maximizing the rate atwhich matter <strong>and</strong> energy resources areused, with little emphasis on pollutionprevention, recycling, reuse, reduction ofunnecessary waste, <strong>and</strong> other forms ofresource conservation. Compare lowthroughputeconomy, matter-recyclingeconomy.HIPPO Acronym for habitat destruction<strong>and</strong> fragmentation, invasive species,population growth, pollution, <strong>and</strong> overharvesting.homeostasis Maintenance of favorableinternal conditions in a system despite fluctuationsin external conditions. See constancy,inertia, resilience.host Plant or animal on which a parasitefeeds.human capital See human resources.human resources Physical <strong>and</strong> mental talentsof people used to produce, distribute,<strong>and</strong> sell an economic good. Compare manufacturedresources, natural resources.humus Slightly soluble residue of undigestedor partially decomposed organicmaterial in topsoil. This material helpsretain water <strong>and</strong> water-soluble nutrients,which can be taken up by plant roots.hunter–gatherers People who get theirfood by gathering edible wild plants <strong>and</strong>other materials <strong>and</strong> by hunting wild animals<strong>and</strong> fish. Compare agricultural revolution,environmental revolution, industrial–medicalrevolution, information <strong>and</strong> globalizationrevolution.hydrocarbon Organic compound ofhydrogen <strong>and</strong> carbon atoms. The simplesthydrocarbon is methane (CH 4 ), the majorcomponent of natural gas.hydroelectric power plant Structure inwhich the energy of falling or flowing waterspins a turbine generator to produce electricity.hydrologic cycle Biogeochemical cyclethat collects, purifies, <strong>and</strong> distributes theearth’s fixed supply of water from the environmentto living organisms <strong>and</strong> then backto the environment.hydropower Electrical energy producedby falling or flowing water. See hydroelectricpower plant.hydrosphere The earth’s liquid water(oceans, lakes, other bodies of surfacewater, <strong>and</strong> underground water), frozenwater (polar ice caps, floating ice caps, <strong>and</strong>ice in soil, known as permafrost), <strong>and</strong> watervapor in the atmosphere. See also hydrologiccycle.identified resources Deposits of a particularmineral-bearing material of which thelocation, quantity, <strong>and</strong> quality are known orhave been estimated from direct geologicalevidence <strong>and</strong> measurements. Compareundiscovered resources.igneous rock Rock formed when moltenrock material (magma) wells up from theearth’s interior, cools, <strong>and</strong> solidifies intorock masses. Compare metamorphic rock, sedimentaryrock. See rock cycle.immature community Community at anearly stage of ecological succession. It usuallyhas a low number of species <strong>and</strong> ecologicalniches <strong>and</strong> cannot capture <strong>and</strong> useenergy <strong>and</strong> cycle critical nutrients as efficientlyas more complex, mature communities.Compare mature community.immigrant species See nonnativespecies.immigration Migration of people into acountry or area to take up permanent residence.indicator species Species that serveas early warnings that a communityor ecosystem is being degraded. Comparekeystone species, native species, nonnativespecies.inductive reasoning Using observations<strong>and</strong> facts to arrive at generalizations orhypotheses. It goes from the specific to thegeneral <strong>and</strong> is widely used in science. Comparedeductive reasoning.industrialized agriculture Usinglarge inputs of energy from fossil fuels(especially oil <strong>and</strong> natural gas), water,fertilizer, <strong>and</strong> pesticides to produce largequantities of crops <strong>and</strong> livestock for domestic<strong>and</strong> foreign sale. Compare subsistencefarming.industrial–medical revolution Use ofnew sources of energy from fossil fuels<strong>and</strong> later from nuclear fuels, <strong>and</strong> useof new technologies, to grow food <strong>and</strong>manufacture products. Compare agriculturalrevolution, environmental revolution,hunter–gatherers, information <strong>and</strong> globalizationrevolution.industrial smog Type of air pollution consistingmostly of a mixture of sulfur dioxide,suspended droplets of sulfuric acidformed from some of the sulfur dioxide,<strong>and</strong> a variety of suspended solid particles.Compare photochemical smog.inertia Ability of a living system to resistbeing disturbed or altered. Compare constancy,resilience.infant mortality rate Number of babiesout of every 1,000 born each year that diebefore their first birthday.infiltration Downward movement ofwater through soil.information <strong>and</strong> globalization revolutionUse of new technologies such as the telephone,radio, television, computers, theInternet, automated databases, <strong>and</strong> remotesensing satellites to enable people tohave increasingly rapid access to muchmore information on a global scale. Compareagricultural revolution, environmentalrevolution, hunter–gatherers, industrial–-medical revolution.inherent value See intrinsic value.inl<strong>and</strong> wetl<strong>and</strong> L<strong>and</strong> away from thecoast, such as a swamp, marsh, or bog, thatis covered all or part of the time with freshwater.Compare coastal wetl<strong>and</strong>.inorganic compounds All compounds notclassified as organic compounds. See organiccompounds.inorganic fertilizer See commercial inorganicfertilizer.input Matter, energy, or informationentering a system. Compare output, throughput.input pollution control See pollution prevention.insecticide Chemical that kills insects.instrumental value Value of an organism,species, ecosystem, or the earth’s biodiversitybased on its usefulness to us. Compareintrinsic value.integrated pest management (IPM) Combineduse of biological, chemical, <strong>and</strong>cultivation methods in proper sequence<strong>and</strong> timing to keep the size of a pest populationbelow the size that causes economicallyunacceptable loss of a crop or livestockanimal.intercropping Growing two or more differentcrops at the same time on a plot. Forexample, a carbohydrate-rich grain thatdepletes soil nitrogen <strong>and</strong> a protein-richlegume that adds nitrogen to the soil maybe intercropped. Compare monoculture, polyculture,polyvarietal cultivation.interference competition Situationin which one species limits access ofanother species to a resource, regardlessof whether the resource is abundant orscarce. See exploitation competition, interspecificcompetition.internal cost Direct cost paid by the producer<strong>and</strong> the buyer of an economic good.Compare external benefit, external cost, fullcost.interplanting Simultaneously growing avariety of crops on the same plot. See agroforestry,intercropping, polyculture, polyvarietalcultivation.interspecific competition Attempts bymembers of two or more species to use thesame limited resources in an ecosystem. Seecompetition, competitive exclusion principle,intraspecific competition.intertidal zone The area of shorelinebetween low <strong>and</strong> high tides.intraspecific competition Attempts bytwo or more organisms of a single species touse the same limited resources in an ecosystem.See competition, interspecific competition.intrinsic rate of increase (r) Rate at whicha population could grow if it had unlimitedresources. Compare environmental resistance.intrinsic value Value of an organism,species, ecosystem, or the earth’s biodiversitybased on its existence, regardless ofwhether it has any usefulness to us. Compareinstrumental value.invertebrates Animals that have no backbones.Compare vertebrates.ion Atom or group of atoms with one ormore positive () or negative () electricalcharges. Compare atom, molecule.GLOSSARYG9
ionizing radiation Fast-moving alpha orbeta particles or high-energy radiation(gamma rays) emitted by radioisotopes.They have enough energy to dislodge oneor more electrons from atoms they hit,forming charged ions in tissue that can reactwith <strong>and</strong> damage living tissue. Comparenonionizing radiation.isotopes Two or more forms of a chemicalelement that have the same number of protonsbut different mass numbers becausethey have different numbers of neutrons intheir nuclei.J-shaped curve Curve with a shape similarto that of the letter J; can represent prolongedexponential growth. See exponentialgrowth.junk science Scientific results or hypothesespresented as sound science but nothaving undergone the rigors of the peerreview process. Compare frontier science,sound science.kerogen Solid, waxy mixture of hydrocarbonsfound in oil shale rock. Heatingthe rock to high temperatures causes thekerogen to vaporize. The vapor is condensed,purified, <strong>and</strong> then sent to a refineryto produce gasoline, heating oil, <strong>and</strong> otherproducts. See also oil shale, shale oil.keystone species Species that play rolesaffecting many other organisms in anecosystem. Compare indicator species, nativespecies, nonnative species.kilocalorie (kcal) Unit of energy equal to1,000 calories. See calorie.kilowatt (kW) Unit of electrical powerequal to 1,000 watts. See watt.kinetic energy Energy that matter hasbecause of its mass <strong>and</strong> speed or velocity.Compare potential energy.K-selected species Species that produce afew, often fairly large offspring but invest agreat deal of time <strong>and</strong> energy to ensure thatmost of those offspring reach reproductiveage. Compare r-selected species.K-strategists See K-selected species.kwashiorkor Type of malnutrition thatoccurs in infants <strong>and</strong> very young childrenwhen they are weaned from mother’smilk to a starchy diet low in protein. Seemarasmus.lake Large natural body of st<strong>and</strong>ing freshwaterformed when water from precipitation,l<strong>and</strong> runoff, or groundwater flow fillsa depression in the earth created by glaciation,earth movement, volcanic activity, or agiant meteorite. See eutrophic lake,mesotrophic lake, oligotrophic lake.l<strong>and</strong> degradation Occurs when natural orhuman-induced processes decrease thefuture ability of l<strong>and</strong> to support crops, livestock,or wild species.l<strong>and</strong>fill See sanitary l<strong>and</strong>fill.l<strong>and</strong>-use planning Process for decidingthe best present <strong>and</strong> future use of each parcelof l<strong>and</strong> in an area.late successional plant species Mostlytrees that can tolerate shade <strong>and</strong> form afairly stable complex forest community.Compare early successional plant species, midsuccessionalplant species.latitude Distance from the equator. Comparealtitude.law of conservation of energy See firstlaw of thermodynamics.law of conservation of matter In anyphysical or chemical change, matter isneither created nor destroyed but merelychanged from one form to another; inphysical <strong>and</strong> chemical changes, existingatoms are rearranged into different spatialpatterns (physical changes) or differentcombinations (chemical changes).law of tolerance The existence, abundance,<strong>and</strong> distribution of a species in anecosystem are determined by whether thelevels of one or more physical or chemicalfactors fall within the range tolerated by thespecies. See threshold effect.LD50 See median lethal dose.LDC See developing country.leaching Process in which various chemicalsin upper layers of soil are dissolved <strong>and</strong>carried to lower layers <strong>and</strong>, in some cases,to groundwater.less developed country (LDC) See developingcountry.life-cycle cost Initial cost plus lifetimeoperating costs of an economic good. Comparefull cost.life expectancy Average number of yearsa newborn infant can be expected to live.limiting factor Single factor that limits thegrowth, abundance, or distribution of thepopulation of a species in an ecosystem. Seelimiting factor principle.limiting factor principle Too much or toolittle of any abiotic factor can limit or preventgrowth of a population of a species inan ecosystem, even if all other factors are ator near the optimum range of tolerance forthe species.linear growth Growth in which a quantityincreases by some fixed amount duringeach unit of time. An example is growththat increases by units of two in thesequence 2, 4, 6, 8, 10, <strong>and</strong> so on. Compareexponential growth.liquefied natural gas (LNG) Natural gasconverted to liquid form by cooling to avery low temperature.liquefied petroleum gas (LPG) Mixtureof liquefied propane (C 3 H 8 ) <strong>and</strong> butane(C 4 H 10 ) gas removed from natural gas <strong>and</strong>used as a fuel.lithosphere Outer shell of the earth, composedof the crust <strong>and</strong> the rigid, outermostpart of the mantle outside the asthenosphere;material found in earth’s plates. Seecrust, mantle.loams Soils containing a mixture of clay,s<strong>and</strong>, silt, <strong>and</strong> humus. Good for growingmost crops.lobbying The process by which individualsor groups use public pressure, personalcontacts, <strong>and</strong> political action to persuadelegislators to vote or act in their favor.logistic growth Pattern in which exponentialpopulation growth occurs when thepopulation is small, <strong>and</strong> population growthdecreases steadily with time as the populationapproaches the carrying capacity. SeeS-shaped curve.low An air mass with a low pressure.Compare high.low-input agriculture See sustainableagriculture.low-quality energy Energy that is dispersed<strong>and</strong> has little ability to do usefulwork. An example is low-temperature heat.Compare high-quality energy.low-quality matter Matter that is diluteor dispersed or contains a low concentrationof a useful resource. Compare highqualitymatter.low-throughput economy Economybased on working with nature by recycling<strong>and</strong> reusing discarded matter, preventingpollution, conserving matter <strong>and</strong> energyresources by reducing unnecessary waste<strong>and</strong> use, not degrading renewableresources, building things that are easy torecycle, reuse, <strong>and</strong> repair, not allowing populationsize to exceed the carrying capacityof the environment, <strong>and</strong> preserving biodiversity<strong>and</strong> ecological integrity. See environmentalworldview. Compare high-throughputeconomy, matter-recycling economy.low-waste society See low-throughputeconomy.LPG See liquefied petroleum gas.macroevolution Long-term, large-scaleevolutionary changes among groups ofspecies. Compare microevolution.macronutrients Chemical elements thatorganisms need in large amounts to live,grow, or reproduce. Examples are carbon,oxygen, hydrogen, nitrogen, phosphorus,sulfur, potassium, calcium, magnesium, <strong>and</strong>iron. Compare micronutrients.magma Molten rock below the earth’ssurface.malnutrition Faulty nutrition, caused by adiet that does not supply an individual withenough protein, essential fats, vitamins,minerals, <strong>and</strong> other nutrients needed forgood health. Compare overnutrition, undernutrition.mangrove swamps Swamps found on thecoastlines in warm tropical climates. Theyare dominated by mangrove trees, any ofabout 55 species of trees <strong>and</strong> shrubs that canlive partly submerged in the salty environmentof coastal swamps.mantle Zone of the earth’s interiorbetween its core <strong>and</strong> its crust. Compare core,crust. See lithosphere.manufactured resources Manufactureditems made from natural resources <strong>and</strong>used to produce <strong>and</strong> distribute economicgoods <strong>and</strong> services bought by consumers.These include tools, machinery, equipment,factory buildings, <strong>and</strong> transportation <strong>and</strong>G10GLOSSARY
distribution facilities. Compare humanresources, natural resources.manure See animal manure, greenmanure.marasmus Nutritional deficiency diseasecaused by a diet that does not have enoughcalories <strong>and</strong> protein to maintain goodhealth. See kwashiorkor, malnutrition.marginal benefit Increase in benefit whena seller produces one more unit of a productor service. Compare marginal cost.marginal cost Increase in total cost resultingfrom producing one more unit of a goodor service. Compare marginal benefit.mass The amount of material in anobject.mass depletion Widespread, often globalperiod during which extinction rates arehigher than normal but not high enough toclassify as a mass extinction. Compare backgroundextinction, mass extinction.mass extinction A catastrophic, widespread,often global event in which majorgroups of species are wiped out over a shorttime compared with normal (background)extinctions. Compare background extinction,mass depletion.mass number Sum of the number ofneutrons (n) <strong>and</strong> the number of protons (p)in the nucleus of an atom. It gives theapproximate mass of that atom. Compareatomic number.mass transit Buses, trains, trolleys, <strong>and</strong>other forms of transportation that carrylarge numbers of people.material efficiency Total amount of materialneeded to produce each unit of goods orservices. Also called resource productivity.Compare energy efficiency.matter Anything that has mass (theamount of material in an object) <strong>and</strong> takesup space. On the earth, where gravity ispresent, we weigh an object to determine itsmass.matter quality Measure of how useful amatter resource is, based on its availability<strong>and</strong> concentration. See high-quality matter,low-quality matter.matter-recycling economy Economy thatemphasizes recycling the maximumamount of all resources that can be recycled.The goal is to allow economic growth tocontinue without depleting matterresources <strong>and</strong> without producing excessivepollution <strong>and</strong> environmental degradation.Compare high-throughput economy, lowthroughputeconomy.mature community Fairly stable, selfsustainingcommunity in an advanced stageof ecological succession; usually has adiverse array of species <strong>and</strong> ecologicalniches; captures <strong>and</strong> uses energy <strong>and</strong> cyclescritical chemicals more efficiently than simpler,immature communities. Compareimmature community.maximum sustainable yield See sustainableyield.MDC See developed country.median lethal dose (LD50) Amount of atoxic material per unit of body weight oftest animals that kills half the test populationin a certain time.megacity City with 10 million or morepeople.meltdown The melting of the core of anuclear reactor.mesosphere Third layer of the atmosphere;found above the stratosphere. Comparestratosphere, troposphere.mesotrophic lake Lake with a moderatesupply of plant nutrients. Compareeutrophic lake, oligotrophic lake.metabolism Ability of a living cell ororganism to capture <strong>and</strong> transform matter<strong>and</strong> energy from its environment to supplyits needs for survival, growth, <strong>and</strong> reproduction.metamorphic rock Rock producedwhen a preexisting rock is subjected to hightemperatures (which may cause it to meltpartially), high pressures, chemically activefluids, or a combination of these agents.Compare igneous rock, sedimentary rock. Seerock cycle.metastasis Spread of malignant (cancerous)cells from a tumor to other parts of thebody.metropolitan area See urban area.microclimates Local climatic conditionsthat differ from the general climate of aregion. Various topographic features of theearth’s surface such as mountains <strong>and</strong> citiestypically create them.microevolution The small geneticchanges a population undergoes. Comparemacroevolution.micronutrients Chemical elements thatorganisms need in small or even traceamounts to live, grow, or reproduce. Examplesare sodium, zinc, copper, chlorine, <strong>and</strong>iodine. Compare macronutrients.microorganisms Organisms such as bacteriathat are so small that they can be seenonly by using a microscope.micropower systems Systems of smallscaledecentralized units that generate1–10,000 kilowatts of electricity. Examplesinclude microturbines, fuel cells, <strong>and</strong> householdsolar panels <strong>and</strong> solar roofs.midsuccessional plant species Grasses<strong>and</strong> low shrubs that are less hardy thanearly successional plant species. Compareearly successional plant species, late successionalplant species.mineral Any naturally occurring inorganicsubstance found in the earth’s crust asa crystalline solid. See mineral resource.mineral resource Concentration of naturallyoccurring solid, liquid, or gaseousmaterial in or on the earth’s crust in a form<strong>and</strong> amount such that extracting <strong>and</strong> convertingit into useful materials or items iscurrently or potentially profitable. Mineralresources are classified as metallic (such asiron <strong>and</strong> tin ores) or nonmetallic (such as fossilfuels, s<strong>and</strong>, <strong>and</strong> salt).minimum-tillage farming See conservation-tillagefarming.minimum viable population (MVP) Estimateof the smallest number of individualsnecessary to ensure the survival of a populationin a region for a specified timeperiod, typically ranging from decades to100 years.mixture Combination of one or more elements<strong>and</strong> compounds.model An approximate representation orsimulation of a system being studied.molecule Combination of two or moreatoms of the same chemical element (suchas O 2 ) or different chemical elements (suchas H 2 O) held together by chemical bonds.Compare atom, ion.monoculture Cultivation of a single crop,usually on a large area of l<strong>and</strong>. Comparepolyculture, polyvarietal cultivation.more developed country (MDC) Seedeveloped country.mountaintop removal Type of surfacemining that uses explosives, massiveshovels, <strong>and</strong> even larger machinery calleddraglines to remove the top of a mountainto expose seams of coal underneath amountain. Compare area strip mining, contourstrip mining.multiple use Use of an ecosystem such asa forest for a variety of purposes such astimber harvesting, wildlife habitat, watershedprotection, <strong>and</strong> recreation. Comparesustainable yield.municipal solid waste Solid materialsdiscarded by homes <strong>and</strong> businesses in ornear urban areas. See solid waste.mutagen Chemical or form of radiationthat causes inheritable changes (mutations)in the DNA molecules in the genes foundin chromosomes. See carcinogen, mutation,teratogen.mutation A r<strong>and</strong>om change in DNA moleculesmaking up genes that can yieldchanges in anatomy, physiology, or behaviorin offspring. See mutagen.mutualism Type of species interaction inwhich both participating species generallybenefit. Compare commensalism.native species Species that normally live<strong>and</strong> thrive in a particular ecosystem. Compareindicator species, keystone species, nonnativespecies.natural capital See natural resources.natural gas Underground deposits ofgases consisting of 50–90% by weightmethane gas (CH 4 ) <strong>and</strong> small amounts ofheavier gaseous hydrocarbon compoundssuch as propane (C 3 H 8 ) <strong>and</strong> butane (C 4 H 10 ).natural greenhouse effect Heat buildupin the troposphere because of the presenceof certain gases, called greenhouse gases.Without this effect, the earth would benearly as cold as Mars, <strong>and</strong> life as we knowit could not exist. Compare global warming.natural ionizing radiation Ionizingradiation in the environment from naturalsources.GLOSSARYG11
natural lawSee scientific law.natural radioactive decay Nuclear changein which unstable nuclei of atoms spontaneouslyshoot out particles (usually alphaor beta particles) or energy (gamma rays) ata fixed rate.natural rate of extinction See backgroundextinction.natural recharge Natural replenishmentof an aquifer by precipitation, whichpercolates downward through soil <strong>and</strong>rock. See diagram on top half of back cover,recharge area.natural resources The earth’s naturalmaterials <strong>and</strong> processes that sustain life onthe earth <strong>and</strong> our economies. Comparehuman resources, manufactured resources.natural selection Process by which a particularbeneficial gene (or set of genes) isreproduced in succeeding generations morethan other genes. The result of natural selectionis a population that contains a greaterproportion of organisms better adapted tocertain environmental conditions. See adaptation,biological evolution, differential reproduction,mutation.negative feedback loop Situation inwhich a change in a certain direction providesinformation that causes a system tochange less in that direction. Compare positivefeedback loop.nekton Strongly swimming organismsfound in aquatic systems. Compare benthos,plankton.net energy Total amount of useful energyavailable from an energy resource or energysystem over its lifetime, minus the amountof energy used (the first energy law), automaticallywasted (the second energy law),<strong>and</strong> unnecessarily wasted in finding, processing,concentrating, <strong>and</strong> transporting it tousers.net primary productivity (NPP) Rate atwhich all the plants in an ecosystem producenet useful chemical energy; equal tothe difference between the rate at which theplants in an ecosystem produce usefulchemical energy (gross primary productivity)<strong>and</strong> the rate at which they use some ofthat energy through cellular respiration.Compare gross primary productivity.neutral solution Water solution containingan equal number of hydrogen ions (H )<strong>and</strong> hydroxide ions (OH ); water solutionwith a pH of 7. Compare acid solution, basicsolution.neutron (n) Elementary particle in thenuclei of all atoms (except hydrogen-1). Ithas a relative mass of 1 <strong>and</strong> no electriccharge. Compare electron, proton.niche See ecological niche.nitrogen cycle Cyclic movement of nitrogenin different chemical forms from theenvironment to organisms <strong>and</strong> then back tothe environment.nitrogen fixation Conversion of atmosphericnitrogen gas into forms useful toplants by lightning, bacteria, <strong>and</strong> cyanobacteria;it is part of the nitrogen cycle.noise pollution Any unwanted, disturbing,or harmful sound that impairs or interfereswith hearing, causes stress, hampersconcentration <strong>and</strong> work efficiency, or causesaccidents.nondegradable pollutant Materialthat is not broken down by naturalprocesses. Examples are the toxic elementslead <strong>and</strong> mercury. Compare biodegradablepollutant, degradable pollutant, slowly degradablepollutant.nonionizing radiation Forms of radiantenergy such as radio waves, microwaves,infrared light, <strong>and</strong> ordinary light that do nothave enough energy to cause ionization ofatoms in living tissue. Compare ionizingradiation.nonnative species Species that migrateinto an ecosystem or are deliberately oraccidentally introduced into an ecosystemby humans. Compare native species.nonpersistent pollutant See degradablepollutant.nonpoint source Large or dispersed l<strong>and</strong>areas such as crop fields, streets, <strong>and</strong> lawnsthat discharge pollutants into the environmentover a large area. Compare pointsource.nonrenewable mineral resource A concentrationof naturally occurring nonrenewablematerial in or on the earth’s crust thatcan be extracted <strong>and</strong> processed into usefulmaterials at an affordable cost.nonrenewable resource Resource thatexists in a fixed amount (stock) in variousplaces in the earth’s crust <strong>and</strong> has thepotential for renewal by geological, physical,<strong>and</strong> chemical processes taking placeover hundreds of millions to billions ofyears. Examples are copper, aluminum,coal, <strong>and</strong> oil. We classify these resources asexhaustible because we are extracting <strong>and</strong>using them at a much faster rate than theywere formed. Compare renewable resource.nontransmissible disease A disease thatis not caused by living organisms <strong>and</strong> doesnot spread from one person to another.Examples are most cancers, diabetes, cardiovasculardisease, <strong>and</strong> malnutrition.Compare transmissible disease.no-till farming See conservation-tillagefarming.nuclear change Process in which nuclei ofcertain isotopes spontaneously change, orare forced to change, into one or more differentisotopes. The three principal types ofnuclear change are natural radioactivity,nuclear fission, <strong>and</strong> nuclear fusion. Comparechemical change, physical change.nuclear energy Energy released whenatomic nuclei undergo a nuclear reactionsuch as the spontaneous emission of radioactivity,nuclear fission, or nuclear fusion.nuclear fission Nuclear change in whichthe nuclei of certain isotopes with largemass numbers (such as uranium-235 <strong>and</strong>plutonium-239) are split apart into lighternuclei when struck by a neutron. Thisprocess releases more neutrons <strong>and</strong> a largeamount of energy. Compare nuclear fusion.nuclear fusion Nuclear change in whichtwo nuclei of isotopes of elements with alow mass number (such as hydrogen-2<strong>and</strong> hydrogen-3) are forced together atextremely high temperatures until theyfuse to form a heavier nucleus (such ashelium-4). This process releases a largeamount of energy. Compare nuclear fission.nucleus Extremely tiny center of an atom,making up most of the atom’s mass. It containsone or more positively charged protons<strong>and</strong> one or more neutrons with no electricalcharge (except for a hydrogen-1 atom,which has one proton <strong>and</strong> no neutrons in itsnucleus).nutrient Any food or element an organismmust take in to live, grow, or reproduce.nutrient cycle See biogeochemical cycle.oil s<strong>and</strong> Deposit of a mixture of clay,s<strong>and</strong>, water, <strong>and</strong> varying amounts of a tarlikeheavy oil known as bitumen. Bitumencan be extracted from tar s<strong>and</strong> by heating. Itis then purified <strong>and</strong> upgraded to syntheticcrude oil. See bitumen.oil shale Fine-grained rock containingvarious amounts of kerogen, a solid, waxymixture of hydrocarbon compounds. Heatingthe rock to high temperatures convertsthe kerogen into a vapor that can be condensedto form a slow-flowing heavy oilcalled shale oil. See kerogen, shale oil.old-growth forest Virgin <strong>and</strong> old, secondgrowthforests containing trees that areoften hundreds, sometimes thous<strong>and</strong>s ofyears old. Examples include forests ofDouglas fir, western hemlock, giantsequoia, <strong>and</strong> coastal redwoods in the westernUnited States. Compare second-growthforest, tree plantation.oligotrophic lake Lake with a low supplyof plant nutrients. Compare eutrophic lake,mesotrophic lake.omnivore Animal that can use both plants<strong>and</strong> other animals as food sources. Examplesare pigs, rats, cockroaches, <strong>and</strong> people.Compare carnivore, herbivore.open dumps Fields or holes in the groundwhere garbage is placed <strong>and</strong> sometimescovered with soil. They are rare in developedcountries, but widely used in manydeveloping countries. Compare santitaryl<strong>and</strong>fill.open-pit mining Removing minerals suchas gravel, s<strong>and</strong>, <strong>and</strong> metal ores by diggingthem out of the earth’s surface <strong>and</strong> leavingan open pit. Compare area strip mining, contourstrip mining, dredging, mountaintopremoval, subsurface mining.open sea The part of an ocean that isbeyond the continental shelf. Comparecoastal zone.ore Part of a metal-yielding material thatcan be economically <strong>and</strong> legally extracted ata given time. An ore typically contains twoparts: the ore mineral, which contains thedesired metal, <strong>and</strong> waste mineral material(gangue).organic compounds Compounds containingcarbon atoms combined with each otherG12GLOSSARY
<strong>and</strong> with atoms of one or more other elementssuch as hydrogen, oxygen, nitrogen,sulfur, phosphorus, chlorine, <strong>and</strong> fluorine.All other compounds are called inorganiccompounds.organic farming Producing crops <strong>and</strong>livestock naturally by using organic fertilizer(manure, legumes, compost) <strong>and</strong> naturalpest control (bugs that eat harmfulbugs, plants that repel bugs, <strong>and</strong> environmentalcontrols such as crop rotation)instead of using commercial inorganic fertilizers<strong>and</strong> synthetic pesticides <strong>and</strong> herbicides.See sustainable agriculture.organic fertilizer Organic material suchas animal manure, green manure, <strong>and</strong> compost,applied to cropl<strong>and</strong> as a source ofplant nutrients. Compare commercial inorganicfertilizer.organism Any form of life.other resources Identified <strong>and</strong> undiscoveredresources not classified as reserves.Compare identified resources, reserves, undiscoveredresources.output Matter, energy, or informationleaving a system. Compare input,throughput.output pollution control See pollutioncleanup.overburden Layer of soil <strong>and</strong> rock overlyinga mineral deposit. Surface miningremoves this layer.overfishing Harvesting so many fish of aspecies, especially immature fish, that notenough breeding stock is left to replenishthe species <strong>and</strong> it becomes unprofitable toharvest them.overgrazing Destruction of vegetationwhen too many grazing animals feed toolong <strong>and</strong> exceed the carrying capacity of arangel<strong>and</strong> or pasture area.overnutrition Diet so high in calories,saturated (animal) fats, salt, sugar, <strong>and</strong>processed foods <strong>and</strong> so low in vegetables<strong>and</strong> fruits that the consumer runs high risksof diabetes, hypertension, heart disease, <strong>and</strong>other health hazards. Compare malnutrition,undernutrition.oxygen-dem<strong>and</strong>ing wastes Organic materialsthat are usually biodegraded by aerobic(oxygen-consuming) bacteria if there isenough dissolved oxygen in the water. Seealso biological oxygen dem<strong>and</strong>.ozone depletion Decrease in concentrationof ozone (O 3 ) in the stratosphere. Seeozone layer.ozone layer Layer of gaseous ozone (O 3 )in the stratosphere that protects life on earthby filtering out most harmful ultravioletradiation from the sun.PANs Peroxyacyl nitrates. Group of chemicalsfound in photochemical smog.parasite Consumer organism that lives onor in <strong>and</strong> feeds on a living plant or animal,known as the host, over an extended periodof time. The parasite draws nourishmentfrom <strong>and</strong> gradually weakens its host; it mayor may not kill the host. See parasitism.parasitism Interaction between species inwhich one organism, called the parasite,preys on another organism, called the host,by living on or in the host. See host, parasite.parts per billion (ppb) Number of partsof a chemical found in 1 billion parts of aparticular gas, liquid, or solid.parts per million (ppm) Number of partsof a chemical found in 1 million parts of aparticular gas, liquid, or solid.parts per trillion (ppt) Number of parts ofa chemical found in 1 trillion parts of a particulargas, liquid, or solid.passive solar heating system System thatcaptures sunlight directly within a structure<strong>and</strong> converts it into low-temperature heatfor space heating or for heating water fordomestic use without the use of mechanicaldevices. Compare active solar heating system.pasture Managed grassl<strong>and</strong> or enclosedmeadow that usually is planted withdomesticated grasses or other forage to begrazed by livestock. Compare feedlot, rangel<strong>and</strong>.pathogen Organism that produces disease.PCBs See polychlorinated biphenyls.per capita GDP Annual gross domesticproduct (GDP) of a country divided by itstotal population at midyear. It gives theaverage slice of the economic pie per person.Used to be called per capita GNP. Seegross domestic product.percolation Passage of a liquid throughthe spaces of a porous material such as soil.perennial Plant that can live for morethan 2 years. Compare annual.permafrost Perennially frozen layer of thesoil that forms when the water there freezes.It is found in arctic tundra.permeability The degree to which undergroundrock <strong>and</strong> soil pores are interconnected<strong>and</strong> thus a measure of the degree towhich water can flow freely from one poreto another. Compare porosity.perpetual resource An essentially inexhaustibleresource on a human time scale.Solar energy is an example. Compare nonrenewableresource, renewable resource.persistence How long a pollutant stays inthe air, water, soil, or body. See also inertia.persistent pollutant See slowly degradablepollutant.pest Unwanted organism that directly orindirectly interferes with human activities.pesticide Any chemical designed to kill orinhibit the growth of an organism that peopleconsider undesirable. See fungicide, herbicide,insecticide.petrochemicals Chemicals obtained byrefining (distilling) crude oil. They are usedas raw materials in manufacturing mostindustrial chemicals, fertilizers, pesticides,plastics, synthetic fibers, paints, medicines,<strong>and</strong> many other products.petroleum See crude oil.pH Numeric value that indicates the relativeacidity or alkalinity of a substance on ascale of 0 to 14, with the neutral point at 7.Acid solutions have pH values lower than7, <strong>and</strong> basic or alkaline solutions have pHvalues greater than 7.phosphorus cycle Cyclic movement ofphosphorus in different chemical formsfrom the environment to organisms <strong>and</strong>then back to the environment.photochemical smog Complex mixture ofair pollutants produced in the lower atmosphereby the reaction of hydrocarbons <strong>and</strong>nitrogen oxides under the influence of sunlight.Especially harmful componentsinclude ozone, peroxyacyl nitrates (PANs),<strong>and</strong> various aldehydes. Compare industrialsmog.photosynthesis Complex process thattakes place in cells of green plants. Radiantenergy from the sun is used to combine carbondioxide (CO 2 ) <strong>and</strong> water (H 2 O) to produceoxygen (O 2 ) <strong>and</strong> carbohydrates (suchas glucose, C 6 H 12 O 6 ) <strong>and</strong> other nutrientmolecules. Compare aerobic respiration,chemosynthesis.photovoltaic cell (solar cell) Device thatconverts radiant (solar) energy directly intoelectrical energy.physical change Process that alters one ormore physical properties of an element or acompound without altering its chemicalcomposition. Examples are changing the size<strong>and</strong> shape of a sample of matter (crushingice <strong>and</strong> cutting aluminum foil) <strong>and</strong> changinga sample of matter from one physical state toanother (boiling <strong>and</strong> freezing water). Comparechemical change, nuclear change.physical resources See manufacturedresources.phytoplankton Small, drifting plants,mostly algae <strong>and</strong> bacteria, found in aquaticecosystems. Compare plankton, zooplankton.pioneer community First integrated set ofplants, animals, <strong>and</strong> decomposers found inan area undergoing primary ecological succession.See immature community, maturecommunity.pioneer species First hardy species, oftenmicrobes, mosses, <strong>and</strong> lichens, that begincolonizing a site as the first stage of ecologicalsuccession. See ecological succession, pioneercommunity.plaintiff The individual, group of individuals,corporation, or government agencybringing the charges in a lawsuit. Comparedefendant.planetary management worldviewBeliefs that (1) we are the planet’s mostimportant species; (2) we will not run out ofresources because of our ingenuity in developing<strong>and</strong> finding new ones; (3) the potentialfor economic growth is essentially limitless;<strong>and</strong> (4) our success depends on howwell we can underst<strong>and</strong>, control, <strong>and</strong> managethe earth’s life-support systems mostlyfor our own benefit. See spaceship-earthworldview. Compare environmental wisdomworldview, frontier worldview, stewardshipworldview.GLOSSARYG13
plankton Small plant organisms (phytoplankton)<strong>and</strong> animal organisms (zooplankton)that float in aquatic ecosystems.plantation agriculture Growing specializedcrops such as bananas, coffee, <strong>and</strong>cacao in tropical developing countries, primarilyfor sale to developed countries.plasma An ionized gas consisting of electricallyconductive ions <strong>and</strong> electrons. It isknown as a fourth state of matter.plates See tectonic plates. Various-sizedareas of the earth’s lithosphere that moveslowly around with the mantle’s flowingasthenosphere. Most earthquakes <strong>and</strong> volcanoesoccur around the boundaries ofthese plates. See lithosphere, plate tectonics.plate tectonics Theory of geophysicalprocesses that explains the movements oflithospheric plates <strong>and</strong> the processes thatoccur at their boundaries. See lithosphere,tectonic plates.point source Single identifiable sourcethat discharges pollutants into the environment.Examples are the smokestack of apower plant or an industrial plant, drainpipeof a meatpacking plant, chimney of ahouse, or exhaust pipe of an automobile.Compare nonpoint source.poison A chemical that adversely affectsthe health of a living human or animal bycausing injury, illness, or death.politics Process through which individuals<strong>and</strong> groups try to influence or controlgovernment policies <strong>and</strong> actions that affectthe local, state, national, <strong>and</strong> internationalcommunities.pollutant Aparticular chemical or form ofenergy that can adversely affect the health,survival, or activities of humans or otherliving organisms. See pollution.pollution An undesirable change in thephysical, chemical, or biological characteristicsof air, water, soil, or food thatcan adversely affect the health, survival,or activities of humans or other livingorganisms.pollution cleanup Device or process thatremoves or reduces the level of a pollutantafter it has been produced or has enteredthe environment. Examples are automobileemission control devices <strong>and</strong> sewage treatmentplants. Compare pollution prevention.pollution prevention Device or processthat prevents a potential pollutant fromforming or entering the environment orsharply reduces the amount entering theenvironment. Compare pollution cleanup.polychlorinated biphenyls (PCBs) Groupof 209 different toxic, oily, synthetic chlorinatedhydrocarbon compounds that can bebiologically amplified in food chains <strong>and</strong>webs.polyculture Complex form of intercroppingin which a large number of differentplants maturing at different times areplanted together. See also intercropping.Compare monoculture, polyvarietal cultivation.polyvarietal cultivation Planting a plot ofl<strong>and</strong> with several varieties of the same crop.Compare intercropping, monoculture,polyculture.population Group of individual organismsof the same species living in a particulararea.population change An increase ordecrease in the size of a population. It isequal to (Births Immigration) (Deaths Emigration).population density Number of organismsin a particular population found in a specifiedarea or volume.population dispersion General pattern inwhich the members of a population arearranged throughout its habitat.population distribution Variation of populationdensity over a particular geographicarea. For example, a country has a highpopulation density in its urban areas <strong>and</strong> amuch lower population density in ruralareas.population dynamics Major abiotic <strong>and</strong>biotic factors that tend to increase ordecrease the population size <strong>and</strong> age <strong>and</strong>sex composition of a species.population size Number of individualsmaking up a population’s gene pool.population viability analysis (PVA) Useof mathematical models to estimate a population’srisk of extinction. See minimumviable population.porosity Percentage of space in rockor soil occupied by voids, whether thevoids are isolated or connected. Comparepermeability.positive feedback loop Situation in whicha change in a certain direction providesinformation that causes a system to changefurther in the same direction. Compare negativefeedback loop.potential energy Energy stored in anobject because of its position or the positionof its parts. Compare kinetic energy.poverty Inability to meet basic needs forfood, clothing, <strong>and</strong> shelter.ppb See parts per billion.ppm See parts per million.ppt See parts per trillion.prairies See grassl<strong>and</strong>s.precautionary principle When there isscientific uncertainty about potentially seriousharm from chemicals or technologies,decision makers should act to prevent harmto humans <strong>and</strong> the environment. See pollutionprevention.precipitation Water in the form of rain,sleet, hail, <strong>and</strong> snow that falls from theatmosphere onto the l<strong>and</strong> <strong>and</strong> bodies ofwater.predation Situation in which an organismof one species (the predator) captures <strong>and</strong>feeds on parts or all of an organism ofanother species (the prey).predator Organism that captures <strong>and</strong>feeds on parts or all of an organism ofanother species (the prey).predator–prey relationship Interactionbetween two organisms of different speciesin which one organism, called the predator,captures <strong>and</strong> feeds on parts or all of anotherorganism, called the prey.preservationist Person concerned primarilywith setting aside or protecting undisturbednatural areas from harmful humanactivities. Compare conservation biologist,conservationist, ecologist, environmentalist,environmental scientist, restorationist.prey Organism that is captured <strong>and</strong> servesas a source of food for an organism ofanother species (the predator).primary consumer Organism that feedson all or part of plants (herbivore) or onother producers. Compare detritivore, omnivore,secondary consumer.primary pollutant Chemical that has beenadded directly to the air by natural eventsor human activities <strong>and</strong> occurs in a harmfulconcentration. Compare secondary pollutant.primary productivity See gross primaryproductivity, net primary productivity.primary sewage treatment Mechanicalsewage treatment in which large solids arefiltered out by screens <strong>and</strong> suspended solidssettle out as sludge in a sedimentation tank.Compare advanced sewage treatment, secondarysewage treatment.primary succession Ecological successionin a bare area that has never been occupiedby a community of organisms. See ecologicalsuccession. Compare secondary succession.probability A mathematical statementabout how likely it is that something willhappen.producer Organism that uses solarenergy (green plant) or chemical energy(some bacteria) to manufacture the organiccompounds it needs as nutrients fromsimple inorganic compounds obtainedfrom its environment. Compare consumer,decomposer.prokaryotic cell Cell that does not have adistinct nucleus. Other internal parts arealso not enclosed by membranes. Compareeukaryotic cell.proton (p) Positively charged particle inthe nuclei of all atoms. Each proton has arelative mass of 1 <strong>and</strong> a single positivecharge. Compare electron, neutron.pure free-market economic system Systemin which all economic decisions aremade in the market, where buyers <strong>and</strong> sellersof economic goods interact freely, withno government or other interference. Comparecapitalist market economic system.pyramid of energy flow Diagram representingthe flow of energy through eachtrophic level in a food chain or food web.With each energy transfer, only a small part(typically 10%) of the usable energy enteringone trophic level is transferred to theorganisms at the next trophic level.radiation Fast-moving particles (particulateradiation) or waves of energy (electromagneticradiation). See alpha particle, betaparticle, gamma rays.G14GLOSSARY
adioactive decay Change of a radioisotopeto a different isotope by the emissionof radioactivity.radioactive isotope See radioisotope.radioactive waste Waste products ofnuclear power plants, research, medicine,weapon production, or other processesinvolving nuclear reactions. See radioactivity.radioactivity Nuclear change in whichunstable nuclei of atoms spontaneouslyshoot out “chunks” of mass, energy, or bothat a fixed rate. The three principal types ofradioactivity are gamma rays <strong>and</strong> fastmovingalpha particles <strong>and</strong> beta particles.radioisotope Isotope of an atom thatspontaneously emits one or more types ofradioactivity (alpha particles, beta particles,gamma rays).rain shadow effect Low precipitation onthe far side (leeward side) of a mountainwhen prevailing winds flow up <strong>and</strong> over ahigh mountain or range of high mountains.This creates semiarid <strong>and</strong> arid conditions onthe leeward side of a high mountain range.range See distribution.rangel<strong>and</strong> L<strong>and</strong> that supplies forage orvegetation (grasses, grasslike plants, <strong>and</strong>shrubs) for grazing <strong>and</strong> browsing animals<strong>and</strong> is not intensively managed. Comparefeedlot, pasture.range of tolerance Range of chemical <strong>and</strong>physical conditions that must be maintainedfor populations of a particularspecies to stay alive <strong>and</strong> grow, develop, <strong>and</strong>function normally. See law of tolerance.rare species A species that has naturallysmall numbers of individuals (oftenbecause of limited geographic ranges or lowpopulation densities) or has been locallydepleted by human activities.realized niche Parts of the fundamentalniche of a species that are actually used bythat species. See ecological niche, fundamentalniche.recharge area Any area of l<strong>and</strong> allowingwater to pass through it <strong>and</strong> into an aquifer.See aquifer, natural recharge.reconciliation ecology The science ofinventing, establishing, <strong>and</strong> maintainingnew habitats to conserve species diversityin places where people live, work, or play.recycling Collecting <strong>and</strong> reprocessing aresource so that it can be made into newproducts. An example is collecting aluminumcans, melting them down, <strong>and</strong>using the aluminum to make new cans orother aluminum products. Compare reuse.reforestation Renewal of trees <strong>and</strong> othertypes of vegetation on l<strong>and</strong> where treeshave been removed; can be done naturallyby seeds from nearby trees or artificially byplanting seeds or seedlings.reliable runoff Surface runoff of waterthat generally can be counted on as a stablesource of water from year to year. See runoff.renewable resource Resource that can bereplenished rapidly (hours to severaldecades) through natural processes. Examplesare trees in forests, grasses in grassl<strong>and</strong>s,wild animals, fresh surface waterin lakes <strong>and</strong> streams, most groundwater,fresh air, <strong>and</strong> fertile soil. If such a resourceis used faster than it is replenished, it can bedepleted <strong>and</strong> converted into a nonrenewableresource. Compare nonrenewableresource <strong>and</strong> perpetual resource. See also environmentaldegradation.replacement-level fertility Number ofchildren a couple must have to replace them.The average for a country or the world usuallyis slightly higher than 2 children percouple (2.1 in the United States <strong>and</strong> 2.5 insome developing countries) because somechildren die before reaching their reproductiveyears. See also total fertility rate.reproduction Production of offspring byone or more parents.reproductive isolation Long-term geographicseparation of members of a particularsexually reproducing species.reproductive potential See biotic potential.reserves Resources that have been identified<strong>and</strong> from which a usable mineral canbe extracted profitably at present priceswith current mining technology. See identifiedresources, undiscovered resources.resilience Ability of a living system torestore itself to original condition afterbeing exposed to an outside disturbancethat is not too drastic. See constancy, inertia.resource Anything obtained from the living<strong>and</strong> nonliving environment to meethuman needs <strong>and</strong> wants. It can also beapplied to other species.resource partitioning Process of dividingup resources in an ecosystem so that specieswith similar needs (overlapping ecologicalniches) use the same scarce resources at differenttimes, in different ways, or in differentplaces. See ecological niche, fundamentalniche, realized niche.resource productivity See materialefficiency.respiration See aerobic respiration.response The amount of health damagecaused by exposure to a certain dose of aharmful substance or form of radiation. Seedose, dose-response curve, median lethal dose.restoration ecology Research <strong>and</strong> scientificstudy devoted to restoring, repairing,<strong>and</strong> reconstructing damaged ecosystems.restorationist Scientist or other persondevoted to the partial or complete restorationof natural areas that have beendegraded by human activities. Compareconservation biologist, conservationist, ecologist,environmental scientist, preservationist.reuse Using a product over <strong>and</strong> overagain in the same form. An example is collecting,washing, <strong>and</strong> refilling glass beveragebottles. Compare recycling.Richter scale A measurement used byscientists to determine the magnitude ofearthquakes.riparian zones Thin strips <strong>and</strong> patches ofvegetation that surround streams. They arevery important habitats <strong>and</strong> resources forwildlife.risk The probability that something undesirablewill result from deliberate oraccidental exposure to a hazard. See riskanalysis, risk assessment, risk–benefit analysis,risk management.risk analysis Identifying hazards, evaluatingthe nature <strong>and</strong> severity of risks (riskassessment), using this <strong>and</strong> other informationto determine options <strong>and</strong> make decisionsabout reducing or eliminating risks(risk management), <strong>and</strong> communicatinginformation about risks to decision makers<strong>and</strong> the public (risk communication).risk assessment Process of gathering data<strong>and</strong> making assumptions to estimate short<strong>and</strong>long-term harmful effects on humanhealth or the environment from exposure tohazards associated with the use of a particularproduct or technology. See risk–benefitanalysis.risk–benefit analysis Estimate of theshort- <strong>and</strong> long-term risks <strong>and</strong> benefits ofusing a particular product or technology.See risk assessment.risk communication Communicatinginformation about risks to decision makers<strong>and</strong> the public. See risk, risk analysis,risk–benefit analysis.risk management Using risk assessment<strong>and</strong> other information to determine options<strong>and</strong> make decisions about reducing or eliminatingrisks. See risk, risk analysis, risk–benefitanalysis, risk communication.rock Any material that makes up a large,natural, continuous part of the earth’s crust.See mineral.rock cycle Largest <strong>and</strong> slowest of theearth’s cycles, consisting of geologic, physical,<strong>and</strong> chemical processes that form <strong>and</strong>modify rocks <strong>and</strong> soil in the earth’s crustover millions of years.r-selected species Species that reproduceearly in their life span <strong>and</strong> produce largenumbers of usually small <strong>and</strong> short-livedoffspring in a short period. Compare K-selected species.r-strategists See r-selected species.rule of 70 Doubling time (in years) =70/(percentage growth rate). See doublingtime, exponential growth.ruminants Grazing animals with complexdigestive systems that enable them to convertgrass <strong>and</strong> other roughage into meat<strong>and</strong> milk.runoff Freshwater from precipitation <strong>and</strong>melting ice that flows on the earth’s surfaceinto nearby streams, lakes, wetl<strong>and</strong>s, <strong>and</strong>reservoirs. See reliable runoff, surface runoff,surface water. Compare groundwater.rural area Geographic area in the UnitedStates with a population of less than 2,500.The number of people used in this definitionmay vary in different countries. Compareurban area.salinity Amount of various salts dissolvedin a given volume of water.GLOSSARYG15
salinization Accumulation of salts in soilthat can eventually make the soil unable tosupport plant growth.saltwater intrusion Movement of saltwater into freshwater aquifers in coastal<strong>and</strong> inl<strong>and</strong> areas as groundwater is withdrawnfaster than it is recharged by precipitation.sanitary l<strong>and</strong>fill Waste disposal site onl<strong>and</strong> in which waste is spread in thin layers,compacted, <strong>and</strong> covered with a fresh layerof clay or plastic foam each day.scavenger Organism that feeds ondead organisms that were killed by otherorganisms or died naturally. Examplesare vultures, flies, <strong>and</strong> crows. Comparedetritivore.science Attempts to discover order innature <strong>and</strong> use that knowledge to makepredictions about what should happen innature. See frontier science, scientific data,scientific hypothesis, scientific law, scientificmethods, scientific model, scientific theory,sound science.scientific data Facts obtained by makingobservations <strong>and</strong> measurements. Comparescientific hypothesis, scientific law, scientificmethods, scientific model, scientific theory.scientific hypothesis An educated guessthat attempts to explain a scientific law orcertain scientific observations. Compare scientificdata, scientific law, scientific methods,scientific model, scientific theory.scientific law Description of what scientistsfind happening in nature repeatedly inthe same way, without known exception.See first law of thermodynamics, law of conservationof matter, second law of thermodynamics.Compare scientific data, scientific hypothesis,scientific methods, scientific model, scientifictheory.scientific methods The ways scientistsgather data <strong>and</strong> formulate <strong>and</strong> test scientifichypotheses, models, theories, <strong>and</strong> laws. Seescientific data, scientific hypothesis, scientificlaw, scientific model, scientific theory.scientific model A simulation of complexprocesses <strong>and</strong> systems. Many are mathematicalmodels that are run <strong>and</strong> testedusing computers.scientific theory A well-tested <strong>and</strong> widelyaccepted scientific hypothesis. Compare scientificdata, scientific hypothesis, scientific law,scientific methods, scientific model.secondary consumer Organism that feedsonly on primary consumers. Compare detritivore,omnivore, primary consumer.secondary pollutant Harmful chemicalformed in the atmosphere when a primaryair pollutant reacts with normal air componentsor other air pollutants. Compare primarypollutant.secondary sewage treatment Second stepin most waste treatment systems in whichaerobic bacteria decompose up to 90% ofdegradable, oxygen-dem<strong>and</strong>ing organicwastes in wastewater. This usually involvesbringing sewage <strong>and</strong> bacteria together intrickling filters or in the activated sludgeprocess. Compare advanced sewage treatment,primary sewage treatment.secondary succession Ecological successionin an area in which natural vegetationhas been removed or destroyed but the soilis not destroyed. See ecological succession.Compare primary succession.second-growth forest St<strong>and</strong>s of treesresulting from secondary ecological succession.Compare old-growth forest, tree farm.second law of energy See second law ofthermodynamics.second law of thermodynamics In anyconversion of heat energy to useful work,some of the initial energy input is alwaysdegraded to a lower-quality, more dispersed,less useful energy, usually lowtemperatureheat that flows into the environment;you cannot break even in termsof energy quality. See first law of thermodynamics.sedimentary rock Rock that forms fromthe accumulated products of erosion <strong>and</strong> insome cases from the compacted shells,skeletons, <strong>and</strong> other remains of dead organisms.Compare igneous rock, metamorphicrock. See rock cycle.seed-tree cutting Removal of nearly alltrees on a site in one cutting, with a fewseed-producing trees left uniformly distributedto regenerate the forest. Compare clearcutting,selective cutting, shelterwood cutting,strip cutting.selective cutting Cutting of intermediateaged,mature, or diseased trees in anuneven-aged forest st<strong>and</strong>, either singly or insmall groups. This encourages the growthof younger trees <strong>and</strong> maintains an unevenagedst<strong>and</strong>. Compare clear-cutting, seed-treecutting, shelterwood cutting, strip cutting.septic tank Underground tank for treatingwastewater from a home in rural <strong>and</strong> suburbanareas. Bacteria in the tank decomposeorganic wastes, <strong>and</strong> the sludge settles to thebottom of the tank. The effluent flows out ofthe tank into the ground through a field ofdrainpipes.sexual reproduction Reproduction inorganisms that produce offspring by combiningsex cells or gametes (such as ovum<strong>and</strong> sperm) from both parents. This producesoffspring that have combinations oftraits from their parents. Compare asexualreproduction.shale oil Slow-flowing, dark brown,heavy oil obtained when kerogen in oilshale is vaporized at high temperatures <strong>and</strong>then condensed. Shale oil can be refined toyield gasoline, heating oil, <strong>and</strong> other petroleumproducts. See kerogen, oil shale.shelterbeltSee windbreak.shelterwood cutting Removal of mature,marketable trees in an area in a series ofpartial cuttings to allow regeneration of anew st<strong>and</strong> under the partial shade of oldertrees, which are later removed. Typically,this is done by making two or three cutsover a decade. Compare clear-cutting, seedtreecutting, selective cutting, strip cutting.shifting cultivation Clearing a plot ofground in a forest, especially in tropicalareas, <strong>and</strong> planting crops on it for a fewyears (typically 2–5 years) until the soil isdepleted of nutrients or the plot has beeninvaded by a dense growth of vegetationfrom the surrounding forest. Then a newplot is cleared <strong>and</strong> the process is repeated.The ab<strong>and</strong>oned plot cannot successfullygrow crops for 10–30 years. See also slash<strong>and</strong>-burncultivation.slash-<strong>and</strong>-burn cultivation Cutting downtrees <strong>and</strong> other vegetation in a patch of forest,leaving the cut vegetation on theground to dry, <strong>and</strong> then burning it. Theashes that are left add nutrients to the nutrient-poorsoils found in most tropical forestareas. Crops are planted between treestumps. Plots must be ab<strong>and</strong>oned after afew years (typically 2–5 years) because ofloss of soil fertility or invasion of vegetationfrom the surrounding forest. See also shiftingcultivation.slowly degradable pollutant Materialthat is slowly broken down into simplerchemicals or reduced to acceptablelevels by natural physical, chemical, <strong>and</strong>biological processes. Compare biodegradablepollutant, degradable pollutant, nondegradablepollutant.sludge Gooey mixture of toxic chemicals,infectious agents, <strong>and</strong> settled solidsremoved from wastewater at a sewagetreatment plant.smart growth Form of urban planningwhich recognizes that urban growth willoccur but uses zoning laws <strong>and</strong> an array ofother tools to prevent sprawl, direct growthto certain areas, protect ecologically sensitive<strong>and</strong> important l<strong>and</strong>s <strong>and</strong> waterways,<strong>and</strong> develop urban areas that are more environmentallysustainable <strong>and</strong> more enjoyableplaces to live.smelting Process in which a desired metalis separated from the other elements in anore mineral.smog Originally a combination of smoke<strong>and</strong> fog but now used to describe other mixturesof pollutants in the atmosphere. Seeindustrial smog, photochemical smog.soil Complex mixture of inorganicminerals (clay, silt, pebbles, <strong>and</strong> s<strong>and</strong>),decaying organic matter, water, air, <strong>and</strong> livingorganisms.soil conservation Methods used toreduce soil erosion, prevent depletion ofsoil nutrients, <strong>and</strong> restore nutrients alreadylost by erosion, leaching, <strong>and</strong> excessive cropharvesting.soil erosion Movement of soil components,especially topsoil, from one place toanother, usually by wind, flowing water, orboth. This natural process can be greatlyaccelerated by human activities that removevegetation from soil.soil horizons Horizontal zones that makeup a particular mature soil. Each horizonhas a distinct texture <strong>and</strong> composition thatvary with different types of soils. See soilprofile.G16GLOSSARY
soil permeability Rate at which water <strong>and</strong>air move from upper to lower soil layers.Compare porosity.soil porosity See porosity.soil profile Cross-sectional view of thehorizons in a soil. See soil horizon.soil structure How the particles that makeup a soil are organized <strong>and</strong> clumpedtogether. See also soil permeability, soiltexture.soil texture Relative amounts of the differenttypes <strong>and</strong> sizes of mineral particles in asample of soil.solar capital Solar energy from the sunreaching the earth. Compare naturalresources.solar cell See photovoltaic cell.solar collector Device for collecting radiantenergy from the sun <strong>and</strong> converting itinto heat. See active solar heating system,passive solar heating system.solar energy Direct radiant energy fromthe sun <strong>and</strong> a number of indirect forms ofenergy produced by the direct input. Principalindirect forms of solar energy includewind, falling <strong>and</strong> flowing water(hydropower), <strong>and</strong> biomass (solar energyconverted into chemical energy stored inthe chemical bonds of organic compoundsin trees <strong>and</strong> other plants).solid waste Any unwanted or discardedmaterial that is not a liquid or a gas. Seemunicipal solid waste.sound science Scientific data, models,theories, <strong>and</strong> laws that are widely acceptedby scientists considered experts in thearea of study. These results of science arevery reliable. Compare frontier science, junkscience.spaceship-earth worldview View of theearth as a spaceship: a machine that we canunderst<strong>and</strong>, control, <strong>and</strong> change at will byusing advanced technology. See planetarymanagement worldview. Compare environmentalwisdom worldview, stewardship worldview.specialist species Species with a narrowecological niche. They may be able to live inonly one type of habitat, tolerate only a narrowrange of climatic <strong>and</strong> other environmentalconditions, or use only one type or afew types of food. Compare generalist species.speciation Formation of two species fromone species because of divergent naturalselection in response to changes in environmentalconditions; usually takes thous<strong>and</strong>sof years. Compare extinction.species Group of organisms that resembleone another in appearance, behavior, chemicalmakeup <strong>and</strong> processes, <strong>and</strong> geneticstructure. Organisms that reproduce sexuallyare classified as members of the samespecies only if they can actually or potentiallyinterbreed with one another <strong>and</strong> producefertile offspring.species diversity Number of differentspecies (species richness) <strong>and</strong> their relativeabundances (species evenness) in a givenarea or community. See biodiversity. Compareecological diversity, genetic diversity.species equilibrium model See theory ofisl<strong>and</strong> biography.species evenness Number of individualswithin a species in a community. See speciesdiversity, species richness.species richness Number of differentspecies in a community.spoils Unwanted rock <strong>and</strong> other wastematerials produced when a material isremoved from the earth’s surface or subsurfaceby mining, dredging, quarrying, <strong>and</strong>excavation.S-shaped curve Leveling off of an exponential,J-shaped curve when a rapidlygrowing population exceeds the carryingcapacity of its environment <strong>and</strong> ceases togrow.stability Ability of a living system towithst<strong>and</strong> or recover from externallyimposed changes or stresses. See constancy,inertia, resilience.statutory law Law developed <strong>and</strong> passedby legislative bodies such as federal <strong>and</strong>state governments. Compare common law.stewardship worldview (1) we are theplanet’s most important species but we havean ethical responsibility to care for the restof nature; (2) we will probably not run out ofresources but they should not be wasted;(3) we should encourage environmentallybeneficial forms of economic growth <strong>and</strong>discourage environmentally harmful formsof economic growth; <strong>and</strong> (4) our successdepends on how well we can underst<strong>and</strong>,control, <strong>and</strong> manage <strong>and</strong> care for the earth’slife-support systems for our benefit <strong>and</strong> forthe rest of nature. Compare environmentalwisdom worldview, planetary managementworldview, spaceship earth worldview.stratosphere Second layer of the atmosphere,extending about 17–48 kilometers(11–30 miles) above the earth’s surface.It contains small amounts of gaseousozone (O 3 ), which filters out about 95%of the incoming harmful ultraviolet (UV)radiation emitted by the sun. Comparetroposphere.stream Flowing body of surface water.Examples are creeks <strong>and</strong> rivers.strip cropping Planting regular crops <strong>and</strong>close-growing plants, such as hay or nitrogen-fixinglegumes, in alternating rows orb<strong>and</strong>s to help reduce depletion of soilnutrients.strip cutting A variation of clear-cuttingin which a strip of trees is clear-cut alongthe contour of the l<strong>and</strong>, with the corridornarrow enough to allow natural regenerationwithin a few years. After regeneration,another strip is cut above the first, <strong>and</strong> soon. Compare clear-cutting, seed-tree cutting,selective cutting, shelterwood cutting.strip mining Form of surface mining inwhich bulldozers, power shovels, or strippingwheels remove large chunks of theearth’s surface in strips. See area strip mining,contour strip mining, surface mining.Compare subsurface mining.subatomic particles Extremely small particles—electrons,protons, <strong>and</strong> neutrons—that make up the internal structure ofatoms.subduction zone Area in which oceaniclithosphere is carried downward (subducted)under the isl<strong>and</strong> arc or continent ata convergent plate boundary. A trench ordinarilyforms at the boundary between thetwo converging plates. See convergent plateboundary.subsidence Slow or rapid sinking of partof the earth’s crust that is not slope-related.subsistence farming Supplementing solarenergy with energy from human labor <strong>and</strong>draft animals to produce enough food tofeed oneself <strong>and</strong> family members; in goodyears enough food may be left over to sellor put aside for hard times. Compare industrializedagriculture.subsurface mining Extraction of a metalore or fuel resource such as coal from a deepunderground deposit. Compare surfacemining.succession See ecological succession, primarysuccession, secondary succession.succulent plants Plants, such as desertcacti, that survive in dry climates by havingno leaves, thus reducing the loss of scarcewater. They store water <strong>and</strong> use sunlight toproduce the food they need in the thick,fleshy tissue of their green stems <strong>and</strong>branches. Compare deciduous plants, evergreenplants.sulfur cycle Cyclic movement of sulfur indifferent chemical forms from the environmentto organisms <strong>and</strong> then back to theenvironment.superinsulated house House that isheavily insulated <strong>and</strong> extremely airtight.Typically, active or passive solar collectorsare used to heat water, <strong>and</strong> an air-to-airheat exchanger is used to prevent buildupof excessive moisture <strong>and</strong> indoor airpollutants.surface fire Forest fire that burns onlyundergrowth <strong>and</strong> leaf litter on the forestfloor. Compare crown fire, ground fire. Seecontrolled burning.surface mining Removing soil, subsoil,<strong>and</strong> other strata <strong>and</strong> then extracting amineral deposit found fairly close tothe earth’s surface. See area strip mining,contour strip mining, dredging, mountaintopremoval, open-pit mining. Compare subsurfacemining.surface runoff Water flowing off the l<strong>and</strong>into bodies of surface water. See reliablerunoff.surface water Precipitation that doesnot infiltrate the ground or return tothe atmosphere by evaporation or transpiration.See runoff. Comparegroundwater.survivorship curve Graph showing thenumber of survivors in different age groupsfor a particular species.sustainability Ability of a system to survivefor some specified (finite) time.GLOSSARYG17
sustainable agriculture Method of growingcrops <strong>and</strong> raising livestock based onorganic fertilizers, soil conservation, waterconservation, biological pest control, <strong>and</strong>minimal use of nonrenewable fossil-fuelenergy.sustainable development See environmentallysustainable economic development.sustainable living Taking no more potentiallyrenewable resources from the naturalworld than can be replenished naturally<strong>and</strong> not overloading the capacity of theenvironment to cleanse <strong>and</strong> renew itself bynatural processes.sustainable society A society that managesits economy <strong>and</strong> population sizewithout doing irreparable environmentalharm by overloading the planet’s ability toabsorb environmental insults, replenish itsresources, <strong>and</strong> sustain human <strong>and</strong> otherforms of life over a specified period, usuallyhundreds to thous<strong>and</strong>s of years. During thisperiod, it satisfies the needs of its peoplewithout depleting natural resources <strong>and</strong>thereby jeopardizing the prospects of current<strong>and</strong> future generations of humans <strong>and</strong>other species.sustainable yield (sustained yield) Highestrate at which a potentially renewableresource can be used without reducing itsavailable supply throughout the world or ina particular area. See also environmentaldegradation.symbiosis Any intimate relationship orassociation between members of two ormore species. See symbiotic relationship.symbiotic relationship Species interactionin which two kinds of organisms livetogether in an intimate association. Membersof the participating species may beharmed by, benefit from, or be unaffectedby the interaction. See commensalism, interspecificcompetition, mutualism, parasitism,predation.synergistic interaction Interaction of twoor more factors or processes so that thecombined effect is greater than the sum oftheir separate effects.synergy See synergistic interaction.synfuels Synthetic gaseous <strong>and</strong> liquidfuels produced from solid coal or sourcesother than natural gas or crude oil.synthetic natural gas (SNG) Gaseous fuelcontaining mostly methane produced fromsolid coal.system A set of components that function<strong>and</strong> interact in some regular <strong>and</strong> theoreticallypredictable manner.tailings Rock <strong>and</strong> other waste materialsremoved as impurities when waste mineralmaterial is separated from the metal in anore.tar s<strong>and</strong> See oil s<strong>and</strong>.tectonic plates Various-sized areas of theearth’s lithosphere that move slowlyaround with the mantle’s flowing asthenosphere.Most earthquakes <strong>and</strong> volcanoesoccur around the boundaries of these plates.See lithosphere, plate tectonics.temperature Measure of the average speedof motion of the atoms, ions, or molecules ina substance or combination of substances ata given moment. Compare heat.temperature inversion Layer of dense,cool air trapped under a layer of less dense,warm air. This prevents upward-flowing aircurrents from developing. In a prolongedinversion, air pollution in the trapped layermay build up to harmful levels. See radiationtemperature inversion, subsidence temperatureinversion.teratogen Chemical, ionizing agent, orvirus that causes birth defects. Compare carcinogen,mutagen.terracing Planting crops on a long, steepslope that has been converted into a seriesof broad, nearly level terraces with shortvertical drops from one to another that runalong the contour of the l<strong>and</strong> to retain water<strong>and</strong> reduce soil erosion.terrestrial Pertaining to l<strong>and</strong>. Compareaquatic.territoriality Process in which organismspatrol or mark an area around their home,nesting, or major feeding site <strong>and</strong> defend itagainst members of their own species.tertiary (higher-level) consumers Animalsthat feed on animal-eating animals.They feed at high trophic levels in foodchains <strong>and</strong> webs. Examples are hawks,lions, bass, <strong>and</strong> sharks. Compare detritivore,primary consumer, secondary consumer.tertiary sewage treatment See advancedsewage treatment.theory of evolution Widely acceptedscientific idea that all life forms developedfrom earlier life forms. Although thistheory conflicts with the creation stories ofmany religions, it is the way biologistsexplain how life has changed over the past3.6–3.8 billion years <strong>and</strong> why it is so diversetoday.theory of isl<strong>and</strong> biogeography Thenumber of species found on an isl<strong>and</strong> isdetermined by a balance between twofactors: the immigration rate (of speciesnew to the isl<strong>and</strong>) from other inhabitedareas <strong>and</strong> the extinction rate (of speciesestablished on the isl<strong>and</strong>). The model predictsthat at some point the rates of immigration<strong>and</strong> extinction will reach an equilibriumpoint that determines the isl<strong>and</strong>’saverage number of different species (speciesdiversity).thermal inversion See temperatureinversion.thermocline Zone of gradual temperaturedecrease between warm surface water <strong>and</strong>colder deep water in a lake, reservoir, orocean.threatened species Awild species that isstill abundant in its natural range but islikely to become endangered because of adecline in numbers. Compare endangeredspecies.threshold effect The harmful or fataleffect of a small change in environmentalconditions that exceeds the limit of toleranceof an organism or population of aspecies. See law of tolerance.throughput Rate of flow of matter, energy,or information through a system. Compareinput, output.throwaway society See high-throughputeconomy.time delay Time lag between the input ofa stimulus into a system <strong>and</strong> the response tothe stimulus.tolerance limits Minimum <strong>and</strong> maximumlimits for physical conditions (such as temperature)<strong>and</strong> concentrations of chemicalsubstances beyond which no members of aparticular species can survive. See law of tolerance.total fertility rate (TFR) Estimate of theaverage number of children who will beborn alive to a woman during her lifetime ifshe passes through all her childbearingyears (ages 15–44) conforming to age-specificfertility rates of a given year. In simplerterms, it is an estimate of the average numberof children a woman will have duringher childbearing years.toxic chemical See poison.See carcinogen,hazardous chemical, mutagen, teratogen.toxicity Measure of how harmful a substanceis.toxicology Study of the adverse effects ofchemicals on health.toxic waste Form of hazardous waste thatcauses death or serious injury (such asburns, respiratory diseases, cancers, orgenetic mutations). See hazardous waste.toxin See poison.traditional intensive agriculture Producingenough food for a farm family’s survival<strong>and</strong> perhaps a surplus that can besold. This type of agriculture uses higherinputs of labor, fertilizer, <strong>and</strong> water thantraditional subsistence agriculture. See traditionalsubsistence agriculture. Compareindustrialized agriculture.traditional subsistence agriculture Productionof enough crops or livestock for afarm family’s survival <strong>and</strong>, in good years, asurplus to sell or put aside for hard times.Compare industrialized agriculture, traditionalintensive agriculture.tragedy of the commons Depletion ordegradation of a potentially renewableresource to which people have free <strong>and</strong>unmanaged access. An example is thedepletion of commercially desirable fishspecies in the open ocean beyond areas controlledby coastal countries. See commonpropertyresource.transform fault Area where the earth’slithospheric plates move in opposite butparallel directions along a fracture (fault) inthe lithosphere. Compare convergent plateboundary, divergent plate boundary.transgenic organisms See genetically modifiedorganisms (GMOs).G18GLOSSARY
transmissible disease A disease that iscaused by living organisms (such as bacteria,viruses, <strong>and</strong> parasitic worms) <strong>and</strong> canspread from one person to another by air,water, food, or body fluids (or in some casesby insects or other organisms). Comparenontransmissible disease.transpiration Process in which water isabsorbed by the root systems of plants,moves up through the plants, passesthrough pores (stomata) in their leaves orother parts, <strong>and</strong> evaporates into the atmosphereas water vapor.tree farm See tree plantation.tree plantation Site planted with oneor only a few tree species in an evenagedst<strong>and</strong>. When the st<strong>and</strong> matures it isusually harvested by clear-cutting <strong>and</strong>then replanted. These farms normally areused to grow rapidly growing tree speciesfor fuelwood, timber, or pulpwood. Seeeven-aged management. Compare old-growthforest, second-growth forest, uneven-agedmanagement.trophic level All organisms that are thesame number of energy transfers away fromthe original source of energy (for example,sunlight) that enters an ecosystem. Forexample, all producers belong to the firsttrophic level, <strong>and</strong> all herbivores belong tothe second trophic level in a food chain or afood web.troposphere Innermost layer of the atmosphere.It contains about 75% of the massof earth’s air <strong>and</strong> extends about 17 kilometers(11 miles) above sea level. Comparestratosphere.true cost See full cost.ultraplankton Photosynthetic bacteria nomore than 2 micrometers wide.undergrazing Reduction of the net primaryproductivity of grassl<strong>and</strong> vegetation<strong>and</strong> grass cover from absence of grazing forlong periods (at least 5 years). Compareovergrazing.undernutrition Consuming insufficientfood to meet one’s minimum daily energyneeds for a long enough time to causeharmful effects. Compare malnutrition,overnutrition.undiscovered resources Potential suppliesof a particular mineral resource,believed to exist because of geologic knowledge<strong>and</strong> theory, although specific locations,quality, <strong>and</strong> amounts are unknown.Compare identified resources, reserves.uneven-aged management Method of forestmanagement in which trees of differentspecies in a given st<strong>and</strong> are maintained atmany ages <strong>and</strong> sizes to permit continuousnatural regeneration. Compare even-agedmanagement.upwelling Movement of nutrient-rich bottomwater to the ocean’s surface. This canoccur far from shore but usually occursalong certain steep coastal areas where thesurface layer of ocean water is pushed awayfrom shore <strong>and</strong> replaced by cold, nutrientrichbottom water.urban area Geographic area with a populationof 2,500 or more. The number of peopleused in this definition may vary, withsome countries setting the minimum numberof people at 10,000–50,000.urban growth Rate of growth of an urbanpopulation. Compare degree of urbanization.urbanization See degree of urbanization.urban sprawl Growth of low-densitydevelopment on the edges of cities <strong>and</strong>towns. See smart growth.utilitarian value See instrumental value.vertebrates Animals that have backbones.Compare invertebrates.volcano Vent or fissure in the earth’s surfacethrough which magma, liquid lava, <strong>and</strong>gases are released into the environment.warm front The boundary between anadvancing warm air mass <strong>and</strong> the coolerone it is replacing. Because warm air is lessdense than cool air, an advancing warmfront rises over a mass of cool air. Comparecold front.water cycle See hydrologic cycle.waterlogging Saturation of soil with irrigationwater or excessive precipitation sothat the water table rises close to the surface.water pollution Any physical or chemicalchange in surface water or groundwaterthat can harm living organisms or makewater unfit for certain uses.watershed L<strong>and</strong> area that delivers water,sediment, <strong>and</strong> dissolved substances viasmall streams to a major stream (river).water table Upper surface of the zone ofsaturation, in which all available pores inthe soil <strong>and</strong> rock in the earth’s crust arefilled with water.watt Unit of power, or rate at which electricalwork is done. See kilowatt.weather Short-term changes in the temperature,barometric pressure, humidity,precipitation, sunshine, cloud cover, winddirection <strong>and</strong> speed, <strong>and</strong> other conditions inthe troposphere at a given place <strong>and</strong> time.Compare climate.weathering Physical <strong>and</strong> chemicalprocesses in which solid rock exposed atearth’s surface is changed to separate solidparticles <strong>and</strong> dissolved material, which canthen be moved to another place as sediment.See erosion.wetl<strong>and</strong> L<strong>and</strong> that is covered all orpart of the time with salt water or freshwater,excluding streams, lakes, <strong>and</strong> theopen ocean. See coastal wetl<strong>and</strong>, inl<strong>and</strong>wetl<strong>and</strong>.wilderness Area where the earth <strong>and</strong> itscommunity of life have not been seriouslydisturbed by humans <strong>and</strong> where humansare only temporary visitors.wildlife management Manipulation ofpopulations of wild species (especiallygame species) <strong>and</strong> their habitats for humanbenefit, the welfare of other species, <strong>and</strong> thepreservation of threatened <strong>and</strong> endangeredwildlife species.wildlife resources Wildlife species thathave actual or potential economic value topeople.wild species Species found in the naturalenvironment. Compare domesticatedspecies.windbreak Row of trees or hedgesplanted to partially block wind flow <strong>and</strong>reduce soil erosion on cultivated l<strong>and</strong>.wind farm Cluster of small to mediumsizedwind turbines in a windy area to capturewind energy <strong>and</strong> convert it into electricalenergy.worldview How people think the worldworks <strong>and</strong> what they think their rolein the world should be. See environmentalwisdom worldview, planetary managementworldview, spaceship-earth worldview, stewardshipworldview.zero population growth (ZPG) State inwhich the birth rate (plus immigration)equals the death rate (plus emigration) sothat the population of a geographic area isno longer increasing.zone of aeration Zone in soil that is notsaturated with water <strong>and</strong> that lies above thewater table. See water table, zone of saturation.zone of saturation Area where all availablepores in soil <strong>and</strong> rock in the earth’scrust are filled by water. See water table, zoneof aeration.zoning Regulating how various parcels ofl<strong>and</strong> can be used.zooplankton Animal plankton. Smallfloating herbivores that feed on plantplankton (phytoplankton). Comparephytoplankton.GLOSSARYG19