Skin cancer campaign evaluation research: technical report (PDF ...
Skin cancer campaign evaluation research: technical report (PDF ...
Skin cancer campaign evaluation research: technical report (PDF ...

Create successful ePaper yourself
Turn your PDF publications into a flip-book with our unique Google optimized e-Paper software.
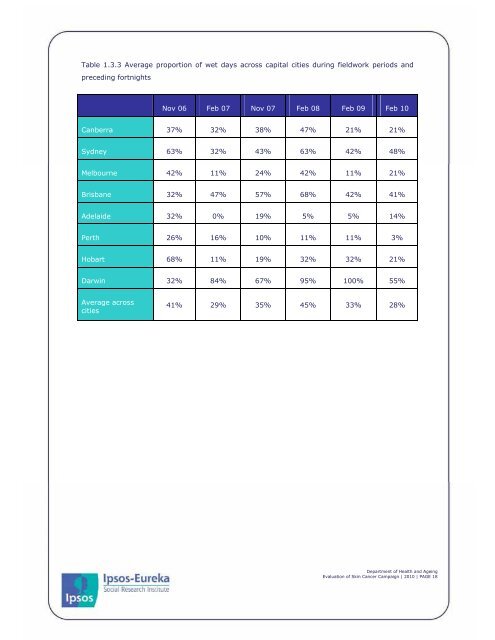
Table 1.3.3 Average proportion of wet days across capital cities during fieldwork periods andpreceding fortnightsNov 06 Feb 07 Nov 07 Feb 08 Feb 09 Feb 10Canberra 37% 32% 38% 47% 21% 21%Sydney 63% 32% 43% 63% 42% 48%Melbourne 42% 11% 24% 42% 11% 21%Brisbane 32% 47% 57% 68% 42% 41%Adelaide 32% 0% 19% 5% 5% 14%Perth 26% 16% 10% 11% 11% 3%Hobart 68% 11% 19% 32% 32% 21%Darwin 32% 84% 67% 95% 100% 55%Average acrosscities41% 29% 35% 45% 33% 28%Department of Health and AgeingEvaluation of <strong>Skin</strong> Cancer Campaign | 2010 | PAGE 18