Skin cancer campaign evaluation research: technical report (PDF ...
Skin cancer campaign evaluation research: technical report (PDF ...
Skin cancer campaign evaluation research: technical report (PDF ...

Create successful ePaper yourself
Turn your PDF publications into a flip-book with our unique Google optimized e-Paper software.
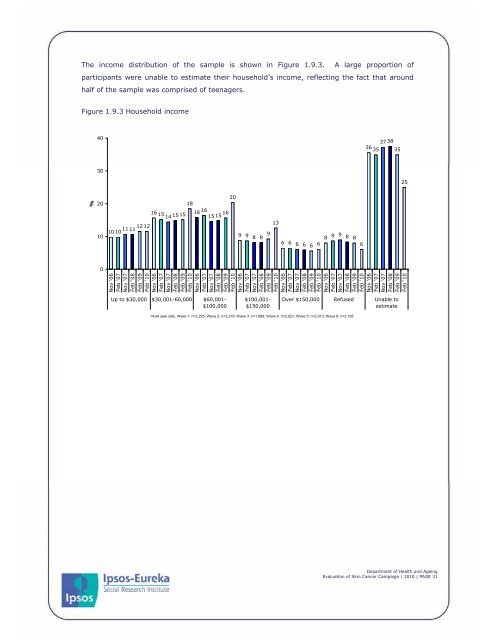
The income distribution of the sample is shown in Figure 1.9.3. A large proportion ofparticipants were unable to estimate their household’s income, reflecting the fact that aroundhalf of the sample was comprised of teenagers.Figure 1.9.3 Household income4037 3836 35 353025%2010201816 15 14 15 1516 16 15 15 1610 10 11 11 12 12 139 9 9 8 8 8 9 9 8 86 6 6 6 6 660Nov '06Feb '07Nov '07Feb '08Feb '09Feb '10Nov '06Feb '07Nov '07Feb '08Feb '09Feb '10Nov '06Feb '07Nov '07Feb '08Feb '09Feb '10Nov '06Feb '07Nov '07Feb '08Feb '09Feb '10Nov '06Feb '07Nov '07Feb '08Feb '09Feb '10Nov '06Feb '07Nov '07Feb '08Feb '09Feb '10Nov '06Feb '07Nov '07Feb '08Feb '09Feb '10Up to $30,000 $30,001-60,000 $60,001-$100,000$100,001-$150,000Over $150,000 Refused Unable toestimate14-24 year olds, Wave 1: n=2,225; Wave 2: n=2,219; Wave 3: n=1,999; Wave 4: n=2,021; Wave 5: n=2,013; Wave 6: n=2,185Department of Health and AgeingEvaluation of <strong>Skin</strong> Cancer Campaign | 2010 | PAGE 31